Spark Networks — B. Riley FBR Investor Conference 2018
35 slides from Spark Networks's conference presentation, May 22, 2018
Slide 1: B. Riley FBR Investor Conference May 24, 2018
B. Riley FBR Investor Conference May 24, 2018
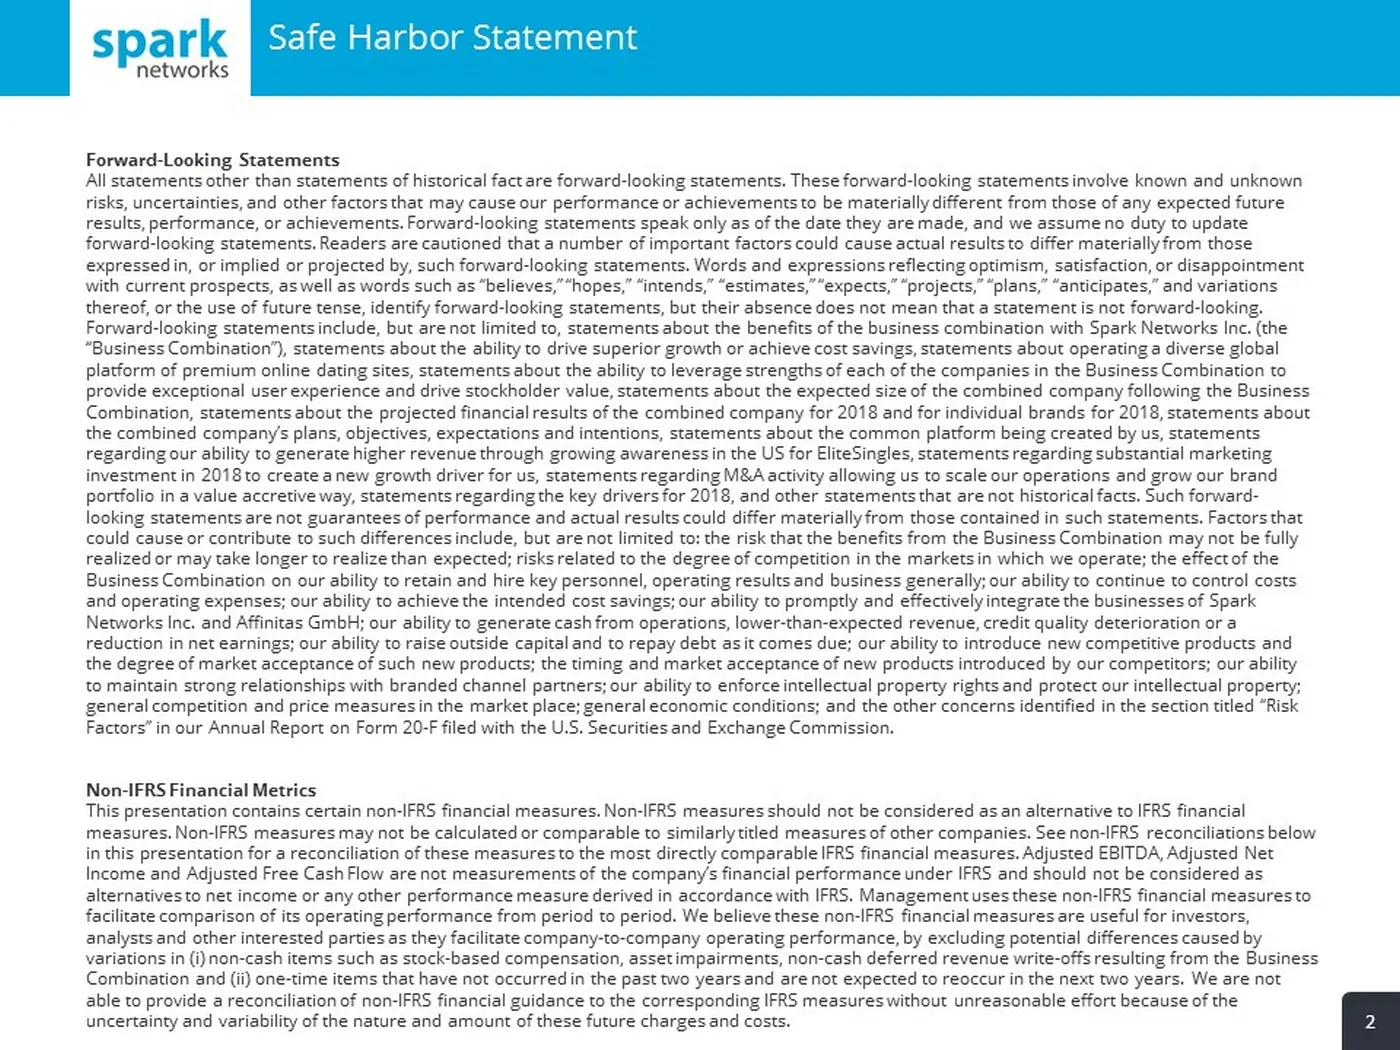
Slide 2: Safe Harbor Statement
Safe Harbor Statement 2 Forward - Looking Statements All statements other than statements of historical fact are forward - looking statements. These forward - looking statements involve known and unknown risks, uncertainties, and other factors that may cause our performance or achievements to be mat
Slide 3: Introduction
21.05.2018 3 Team, Presentation title Introduction
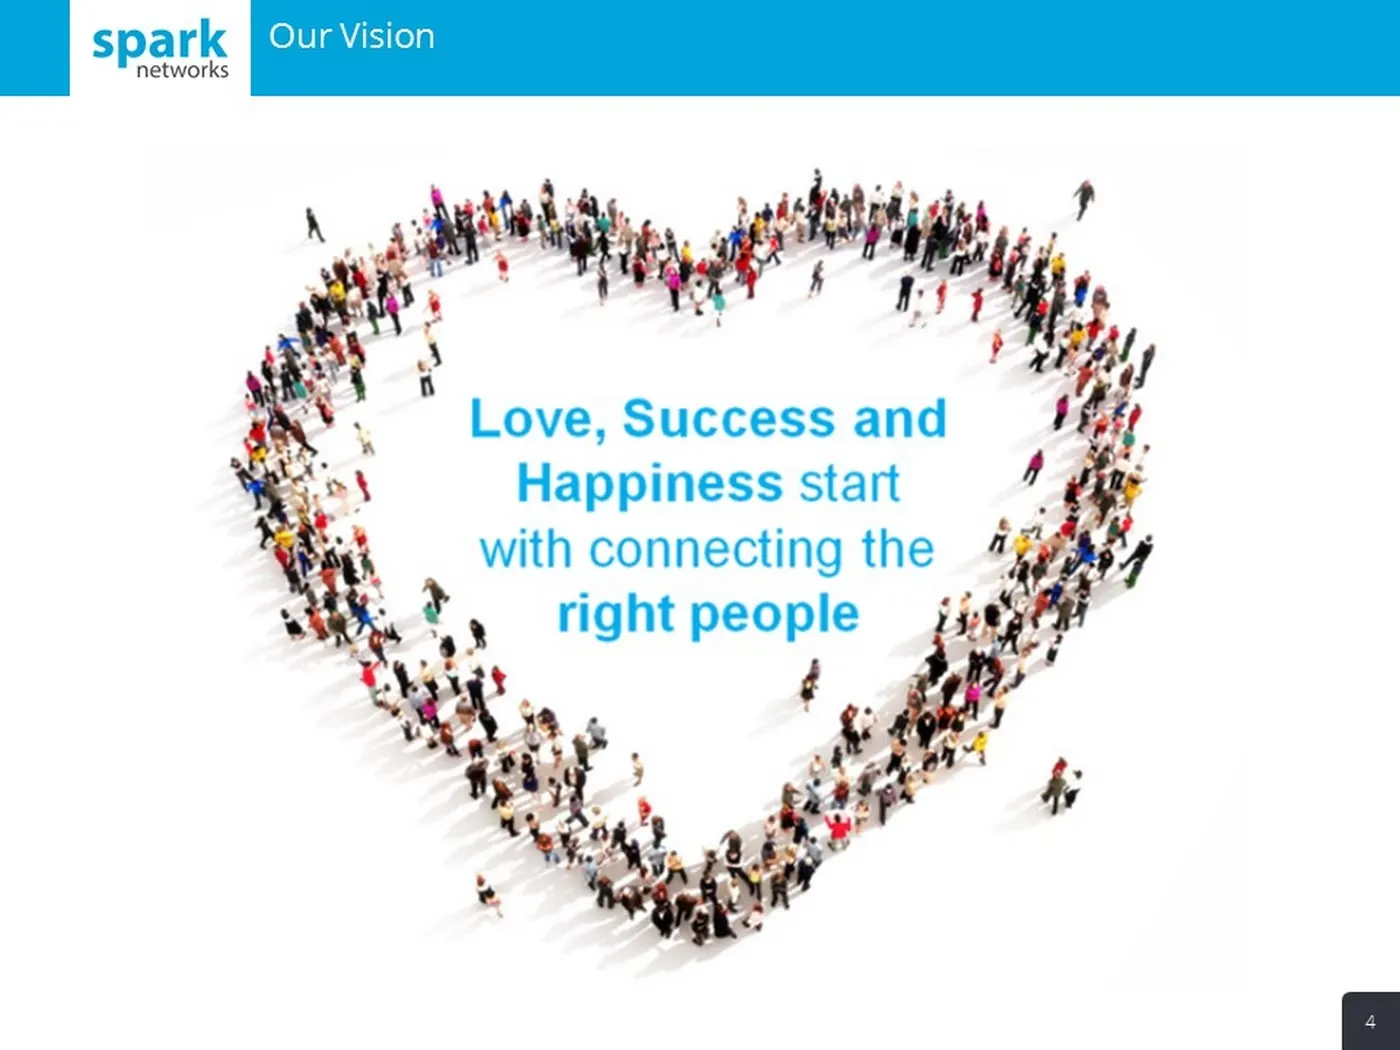
Slide 4: Love, Success and Happiness start with connecting the right people
networks Love, Success and Happiness start with connecting the i. t+. right people a} \ Bs ‘ Py
Slide 5: Spark Networks SE Overview
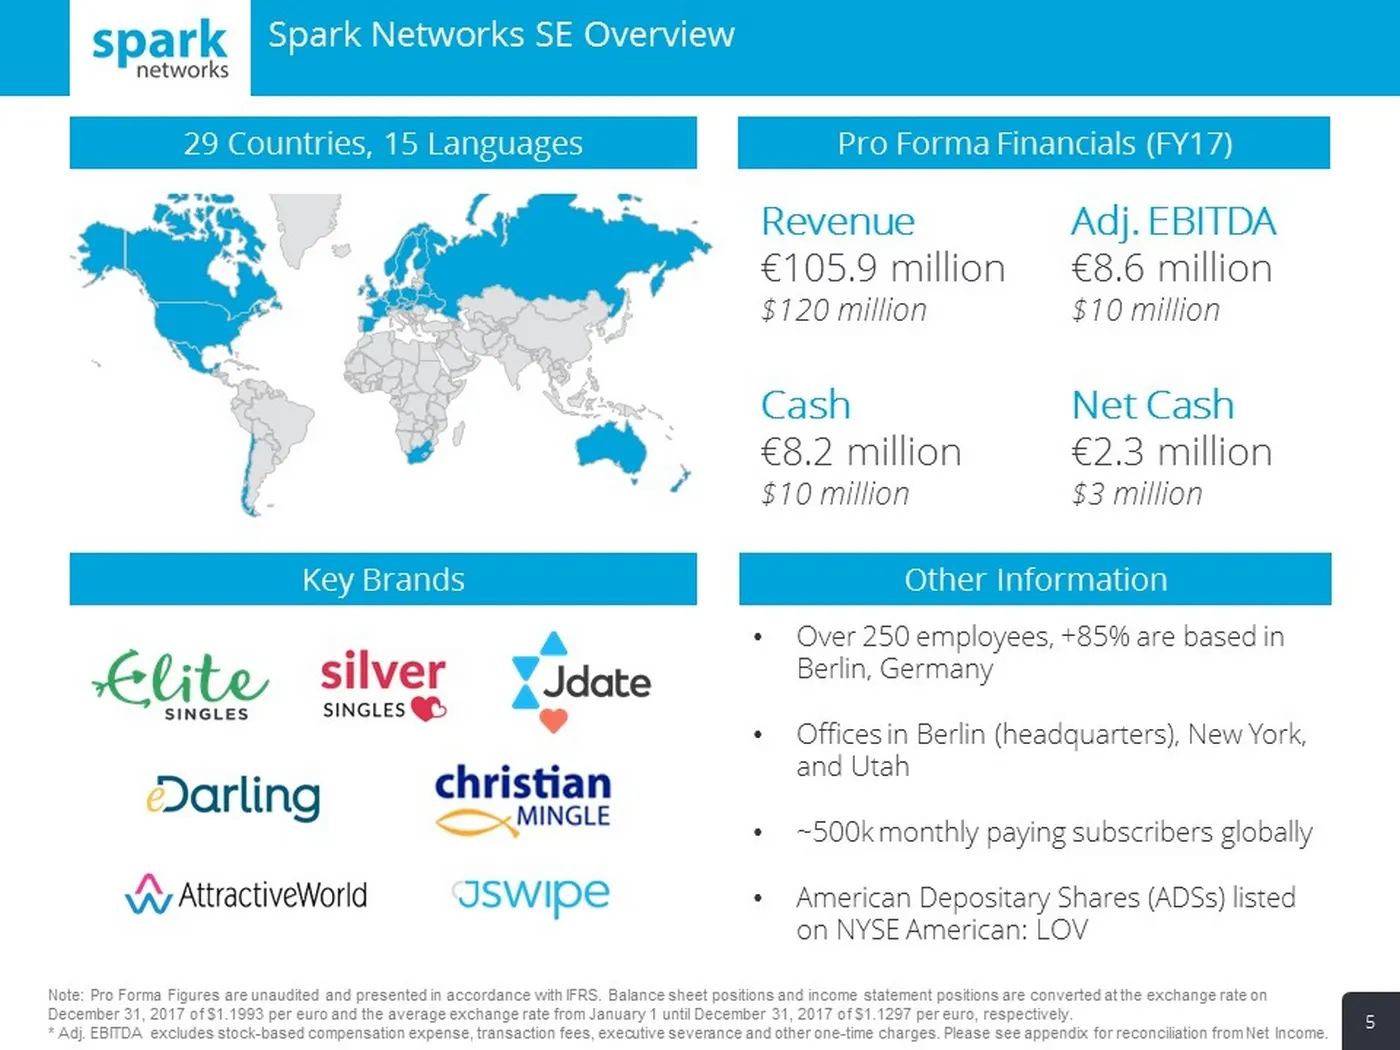
Spark Networks SE Overview Key Brands Pro Forma Financials (FY17) Other Information • Over 250 employees, +85% are based in Berlin, Germany • Offices in Berlin (headquarters), New York, and Utah • ~ 500k monthly paying subscribers globally • American Depositary Shares (ADSs) listed on NYSE American:
Slide 6: Company History: from eDarling to Spark Networks SE
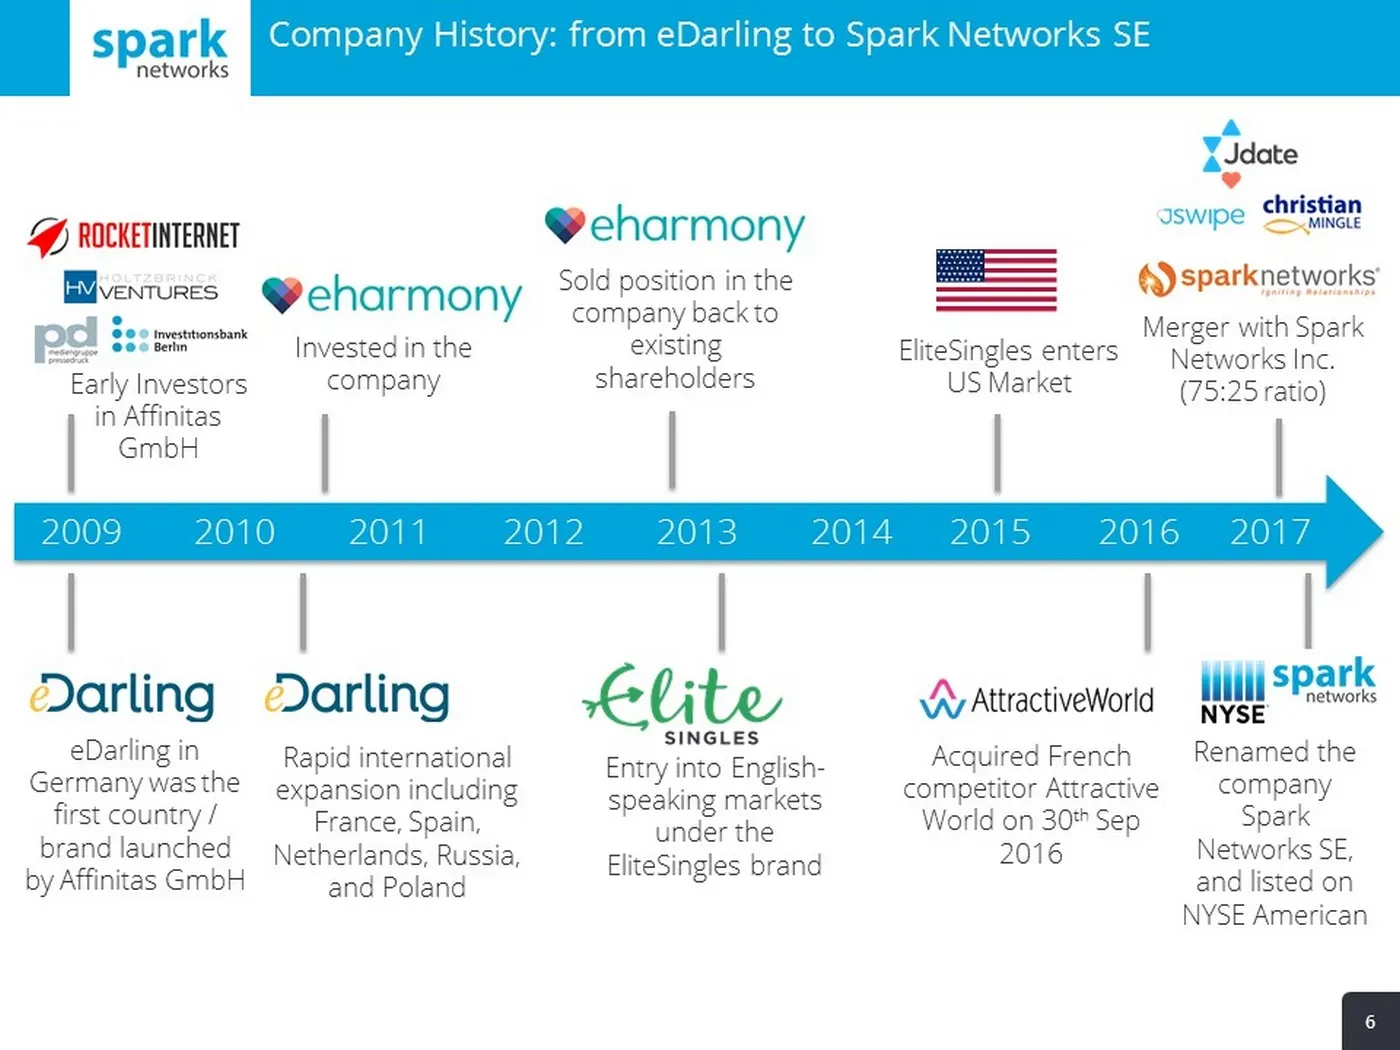
Company History: from eDarling to Spark Networks SE 6 2009 2010 2011 2012 2013 2014 2015 2016 eDarling in Germany was the first country / brand launched by Affinitas GmbH Invested in the company Entry into English - speaking markets under the EliteSingles brand EliteSingles enters US Market Acquired
Slide 7: Historical Financial Performance
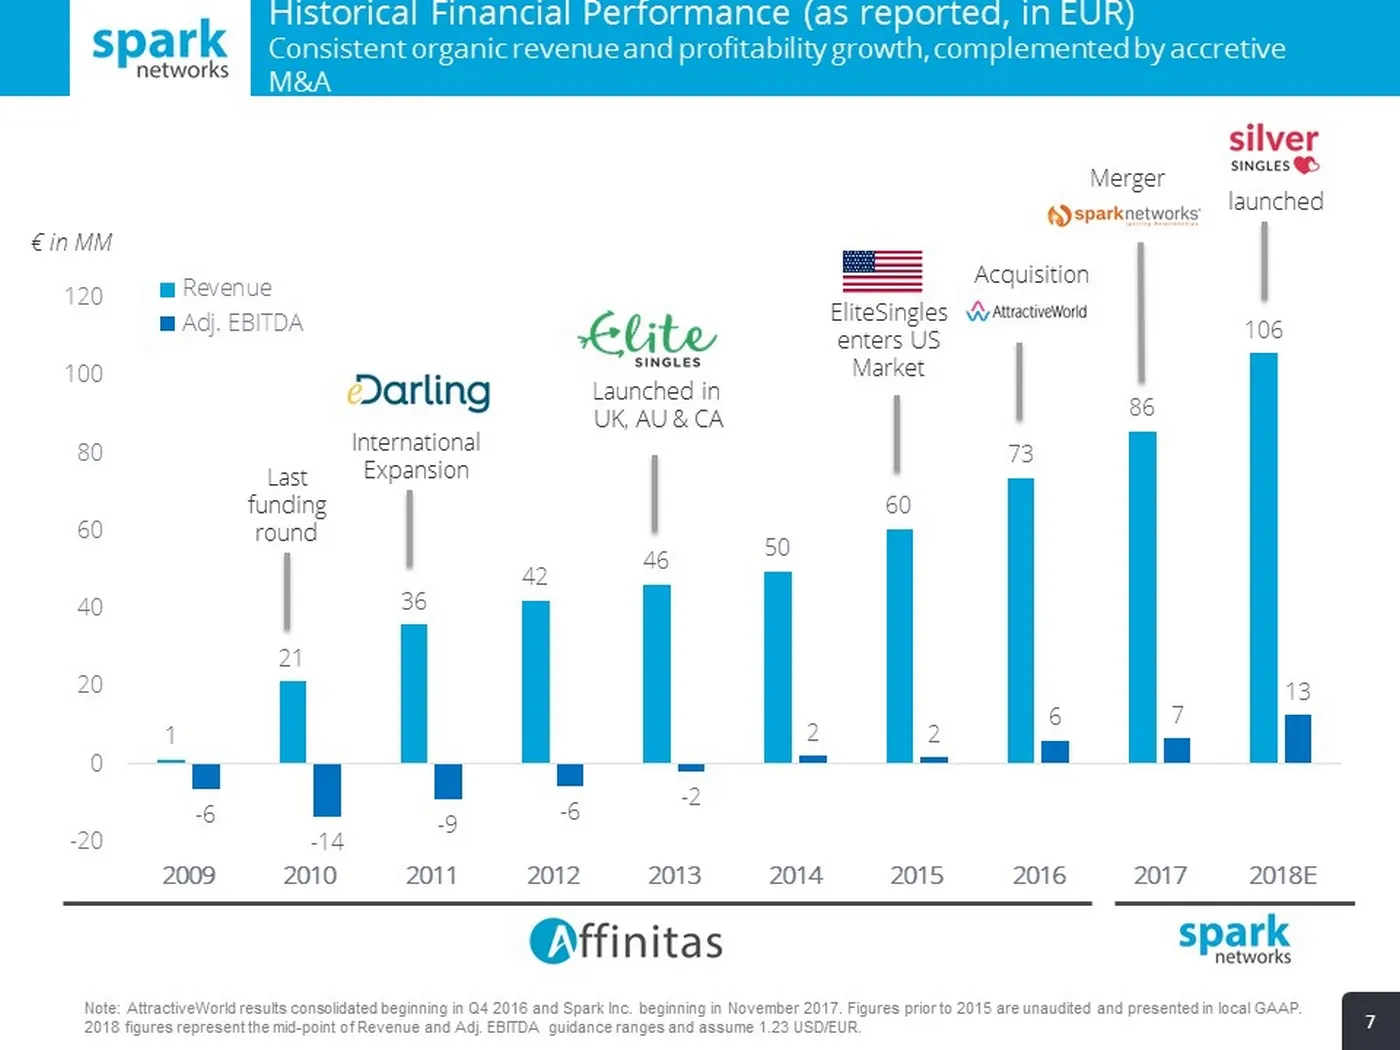
1 21 36 42 46 50 60 73 86 106 - 6 - 14 - 9 - 6 - 2 2 2 6 7 13 -20 0 20 40 60 80 100 120 2009 2010 2011 2012 2013 2014 2015 2016 2017 2018E Revenue Adj. EBITDA 7 EliteSingles enters US Market Merger Acquisition Launched in UK, AU & CA International Expansion € in MM Last funding round Historical Fina
Slide 8: Key Takeaways
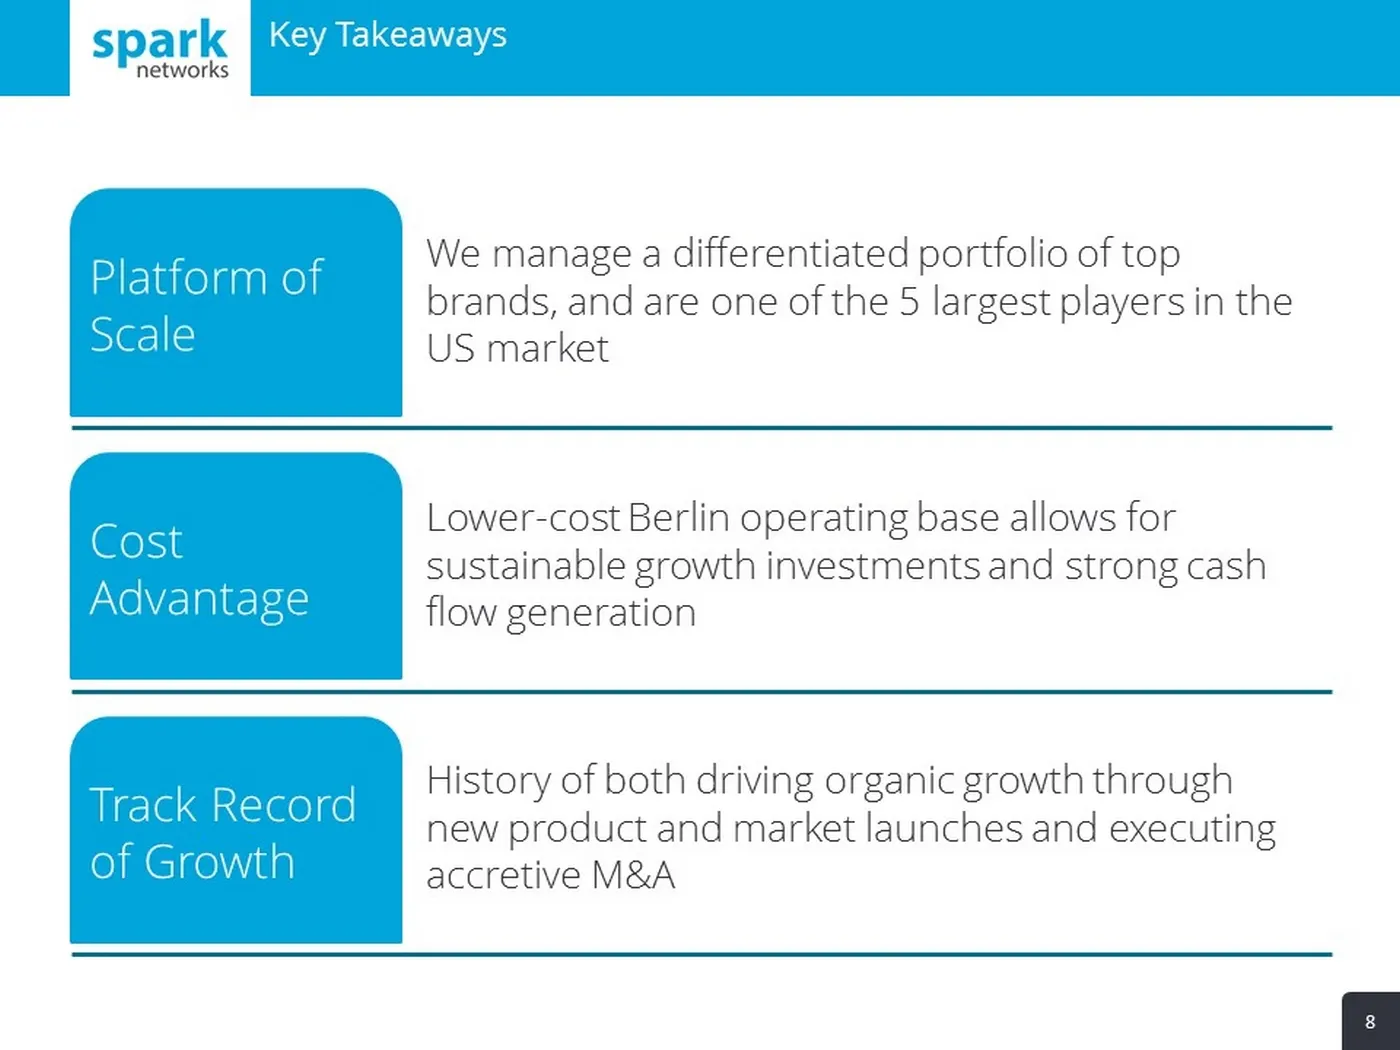
8 We manage a differentiated portfolio of top brands, and are one of the 5 largest players in the US market Platform of Scale Lower - cost Berlin operating base allows for sustainable growth investments and strong cash flow generation Cost Advantage History of both driving organic growth through new
Slide 9: The Spark Platform
21.05.2018 9 Team, Presentation title The Spark Platform
Slide 10: Unique portfolio of strong brands in Premium & Serious Dating
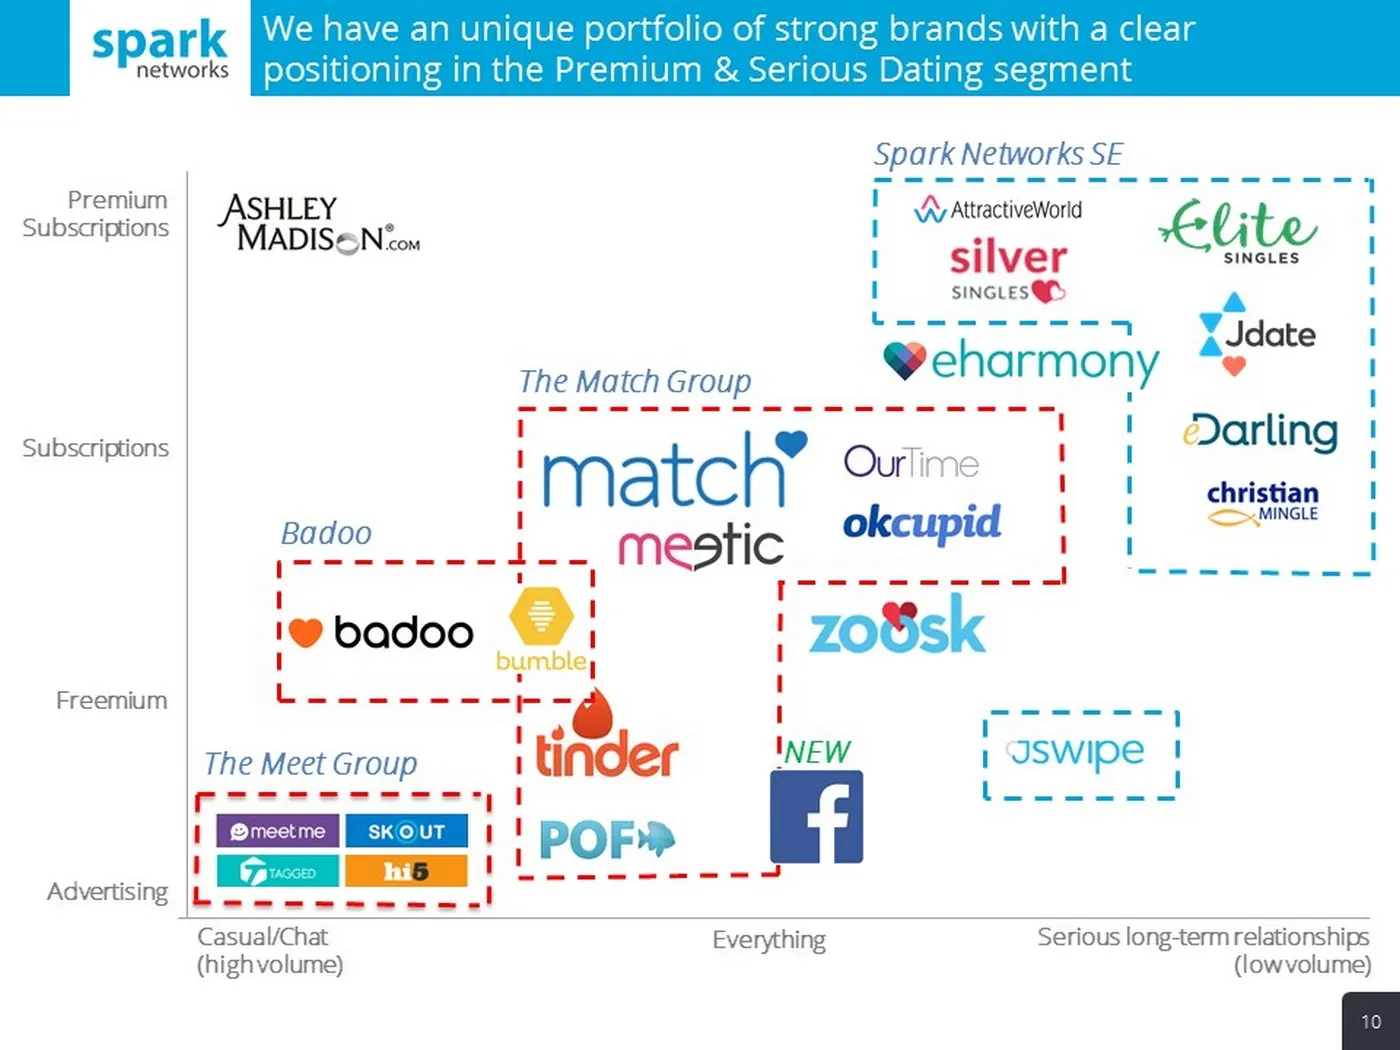
We have an unique portfolio of strong brands with a clear positioning in the Premium & Serious Dating segment The Match Group Spark Networks SE Premium Subscriptions Freemium Casual/Chat (high volume) Serious long - term relationships (low volume) Advertising The Meet Group 10 Badoo Everything Subsc
Slide 11: Our Portfolio of Brands
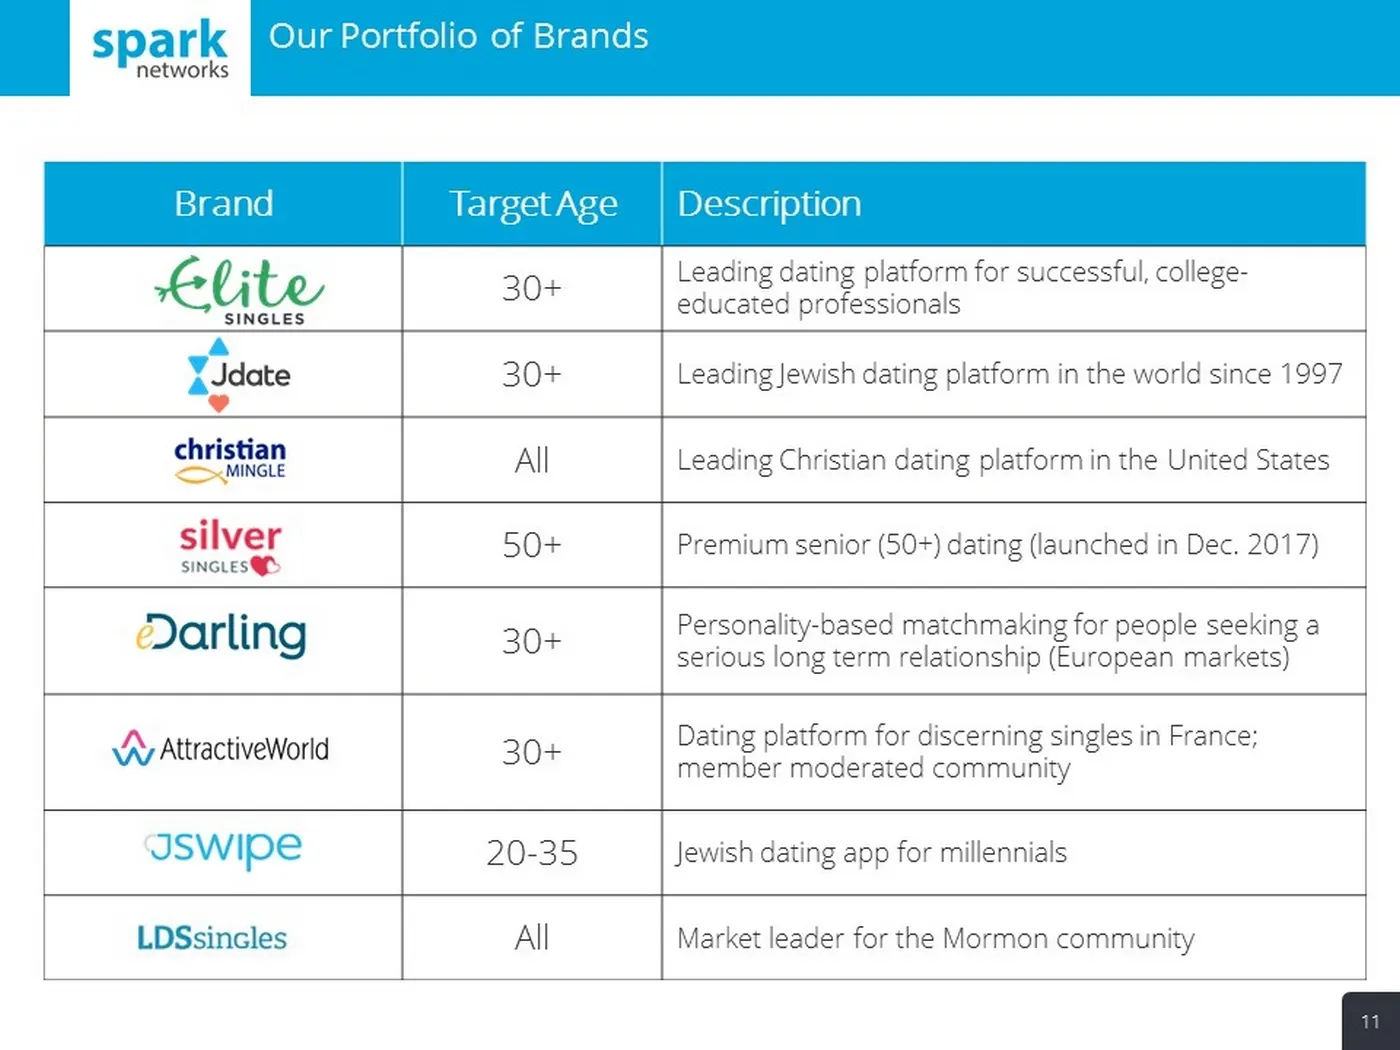
Brand Target Age Description 30+ Leading dating platform for successful, college - educated professionals 30+ Leading Jewish dating platform in the world since 1997 All Leading Christian dating platform in the United States 50+ Premium senior (50+) dating ( launched in Dec. 2017) 30+ Personality - b
Slide 12: Our Products
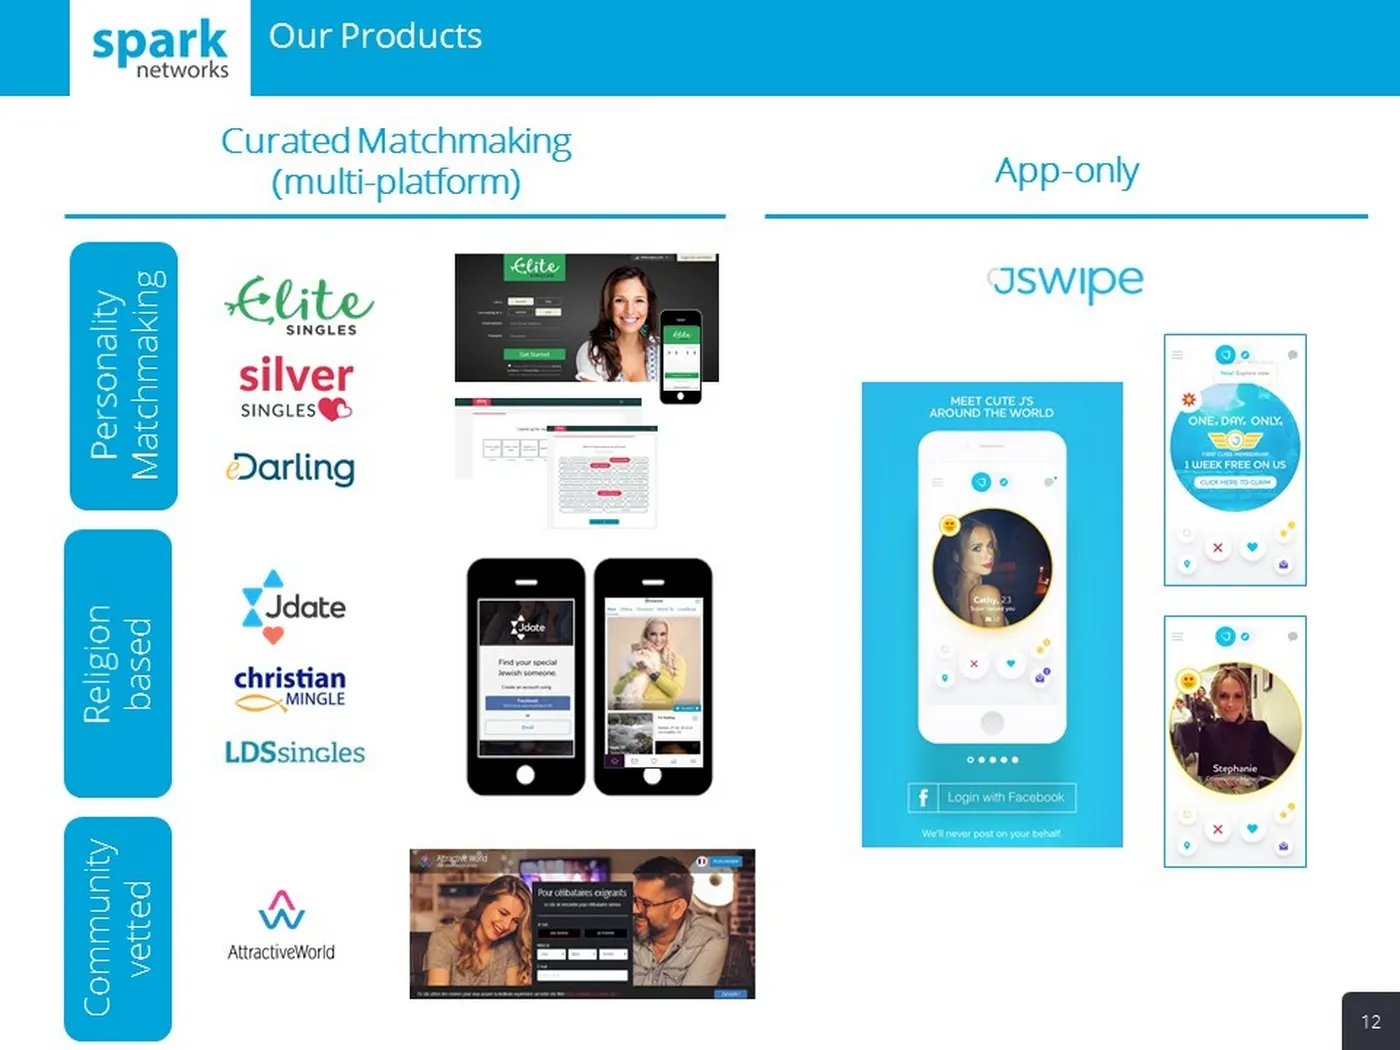
Our Products 12 Curated Matchmaking (multi - platform) App - only Personality Matchmaking Religion based Community vetted
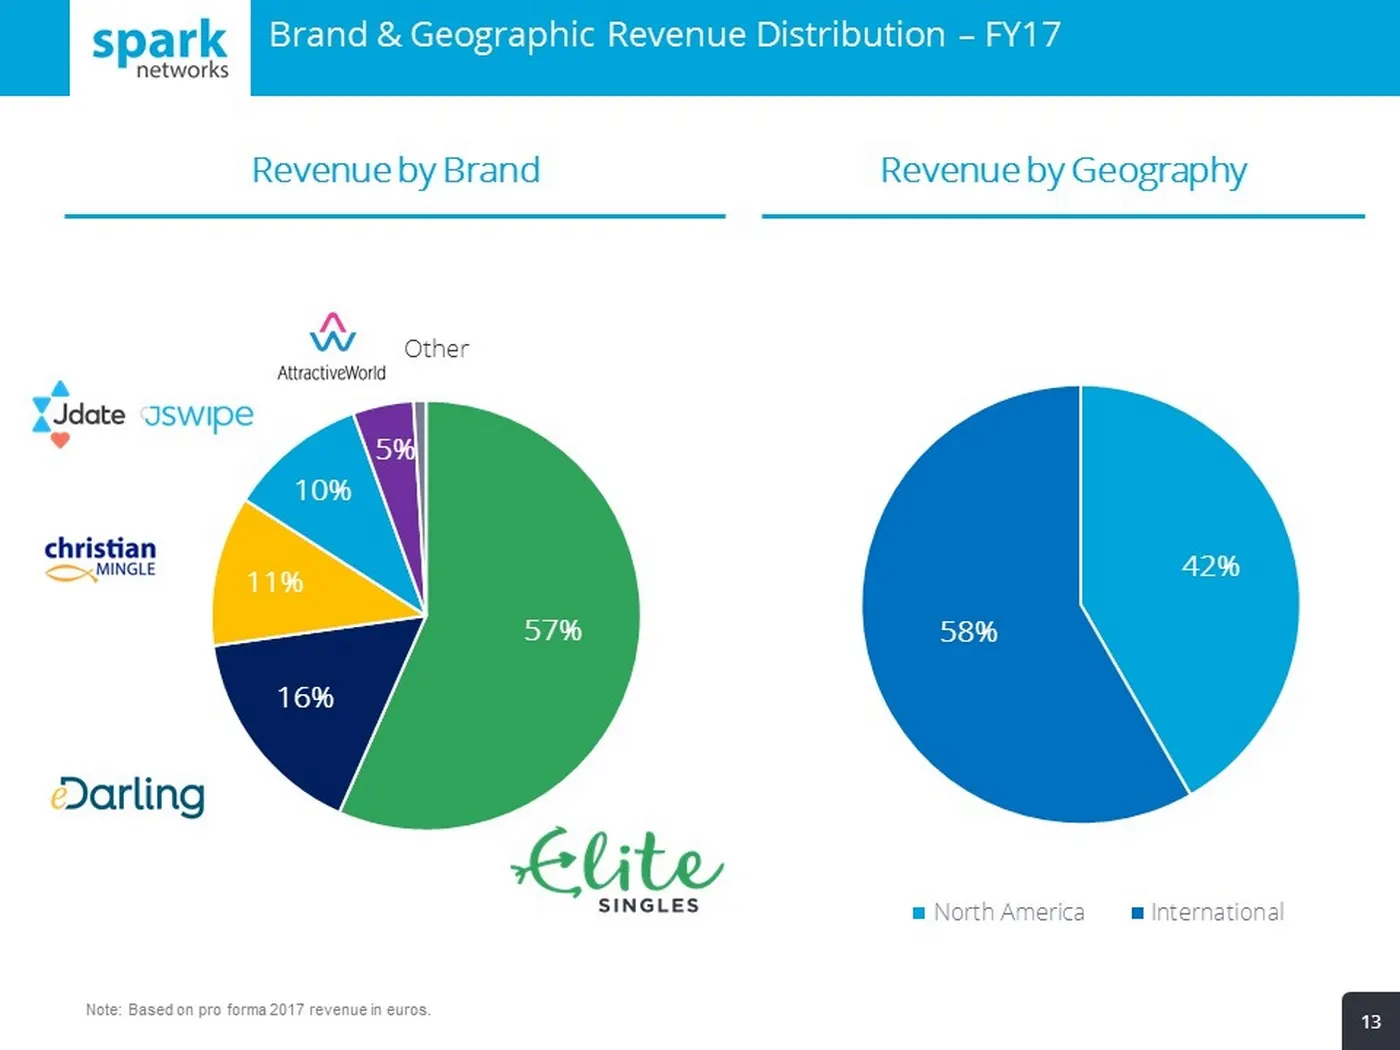
Slide 13: Brand & Geographic Revenue Distribution – FY17
57% 16% 11% 10% 5% 13 Other Revenue by Brand Revenue by Geography Note: Based on pro forma 2017 revenue in euros . Brand & Geographic Revenue Distribution – FY17 42% 58% North America International
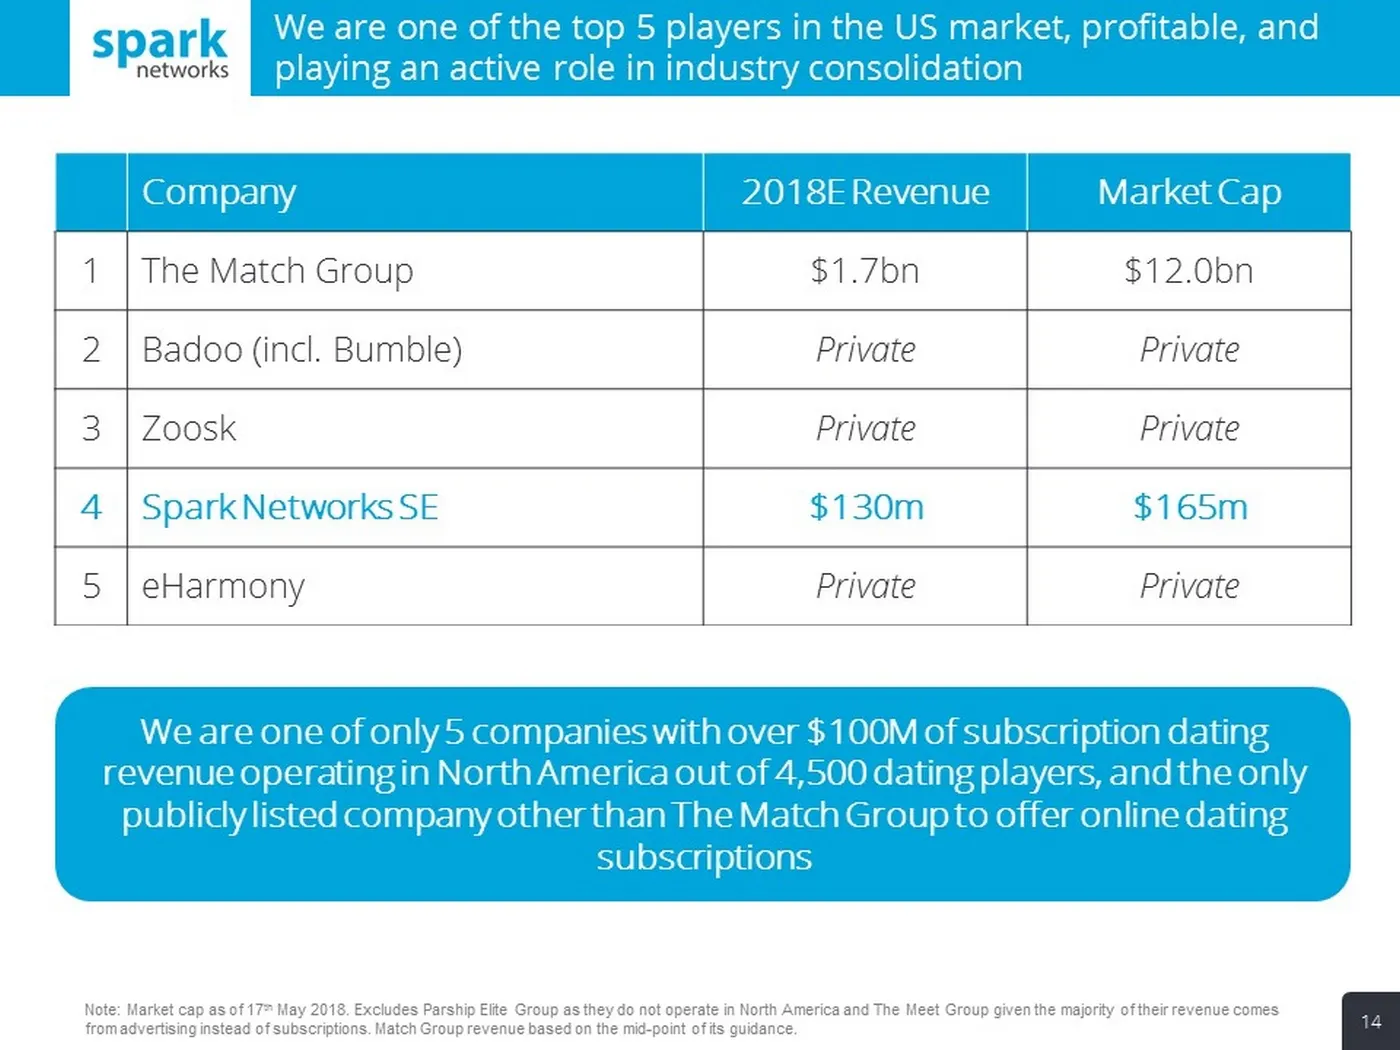
Slide 14: One of the top players in the US market
We are one of the top 5 players in the US market, profitable, and playing an active role in industry consolidation We are one of only 5 companies with over $100M of subscription dating revenue operating in North America out of 4,500 dating players, and the only publicly listed company other than The
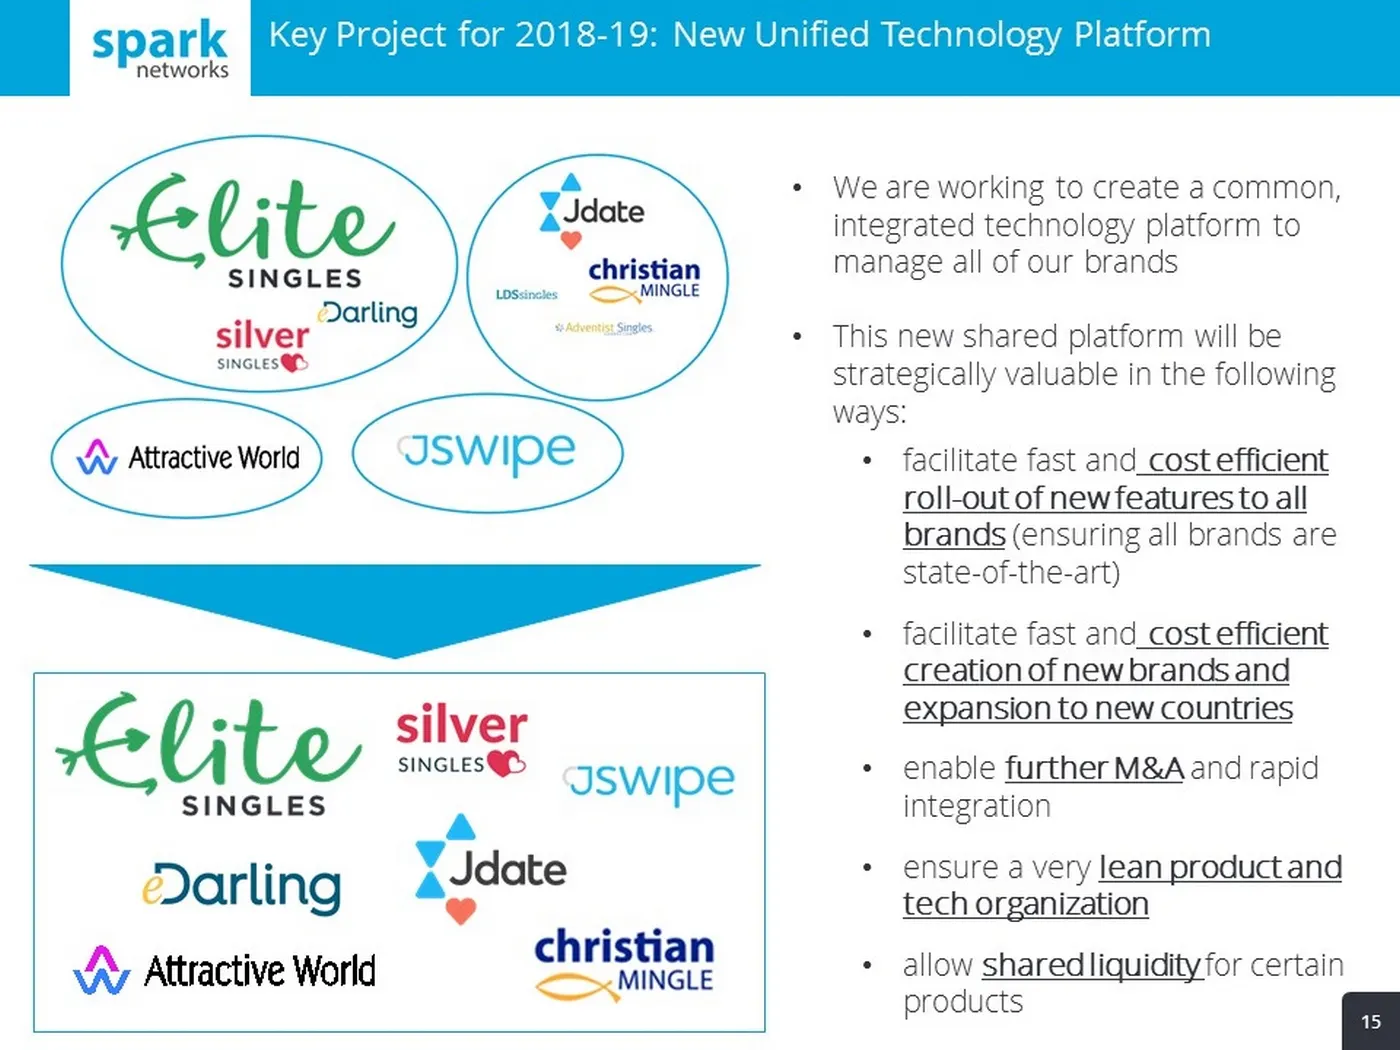
Slide 15: Key Project for 2018-19: New Unified Technology Platform
15 • We are working to create a common, integrated technology platform to manage all of our brands • This new shared platform will be strategically valuable in the following ways: • facilitate fast and cost efficient roll - out of new features to all brands (ensuring all brands are state - of - the
Slide 16: Operating Costs
21.05.2018 16 Team, Presentation title Operating Costs
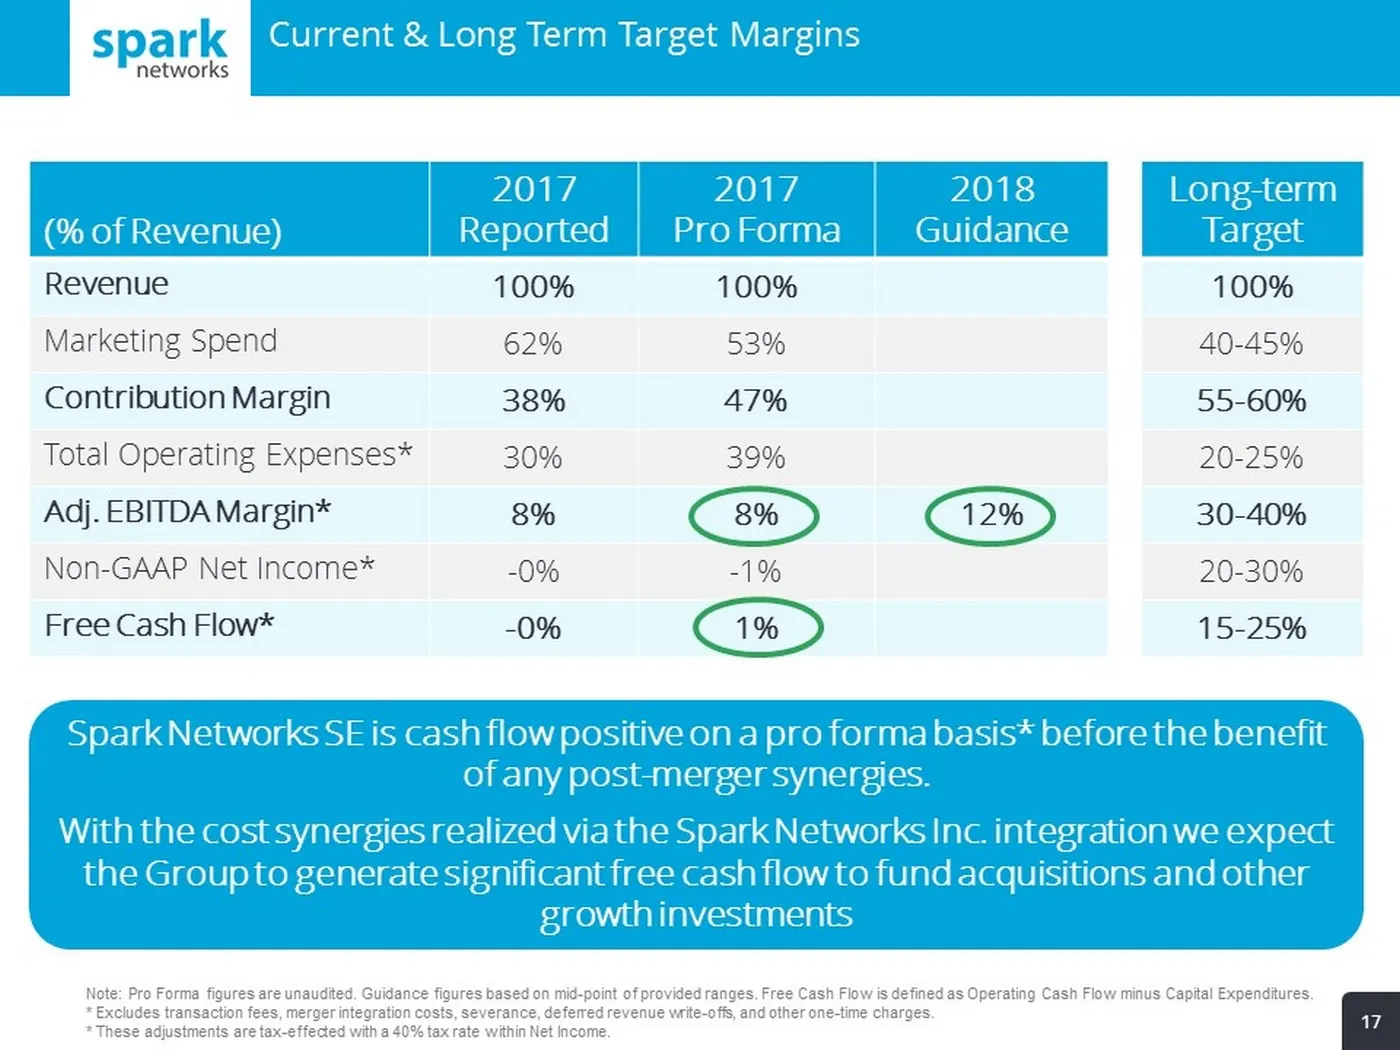
Slide 17: Cost structure, guidance and long-term targets
17 Note: Pro Forma figures are unaudited. Guidance figures based on mid - point of provided ranges. Free Cash Flow is defined as Operating Cash Flow minus Capita l Expenditures. * Excludes transaction fees, merger integration costs, severance, deferred revenue write - offs, and other one - time char
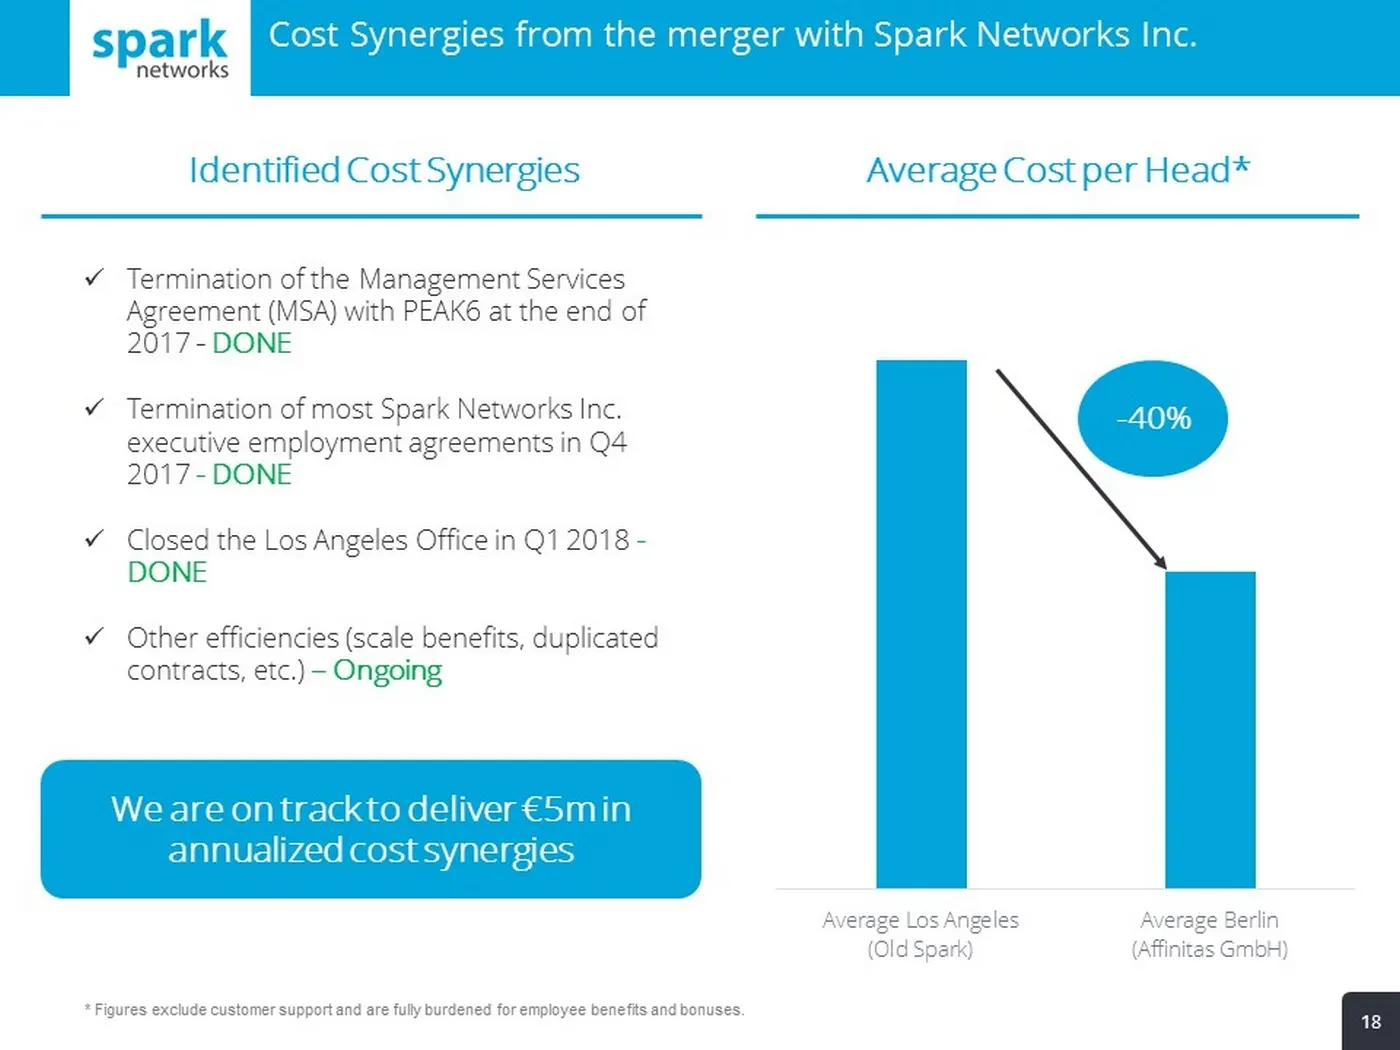
Slide 18: Identified Cost Synergies
18 Identified Cost Synergies Average Cost per Head* Average Los Angeles (Old Spark) Average Berlin (Affinitas GmbH) - 40% * Figures exclude customer s upport and are fully burdened for employee benefits and bonuses. We are on track to deliver €5m in annualized cost synergies Cost Synergies from the
Slide 19: Growth Drivers
21.05.2018 19 Team, Presentation title Growth Drivers
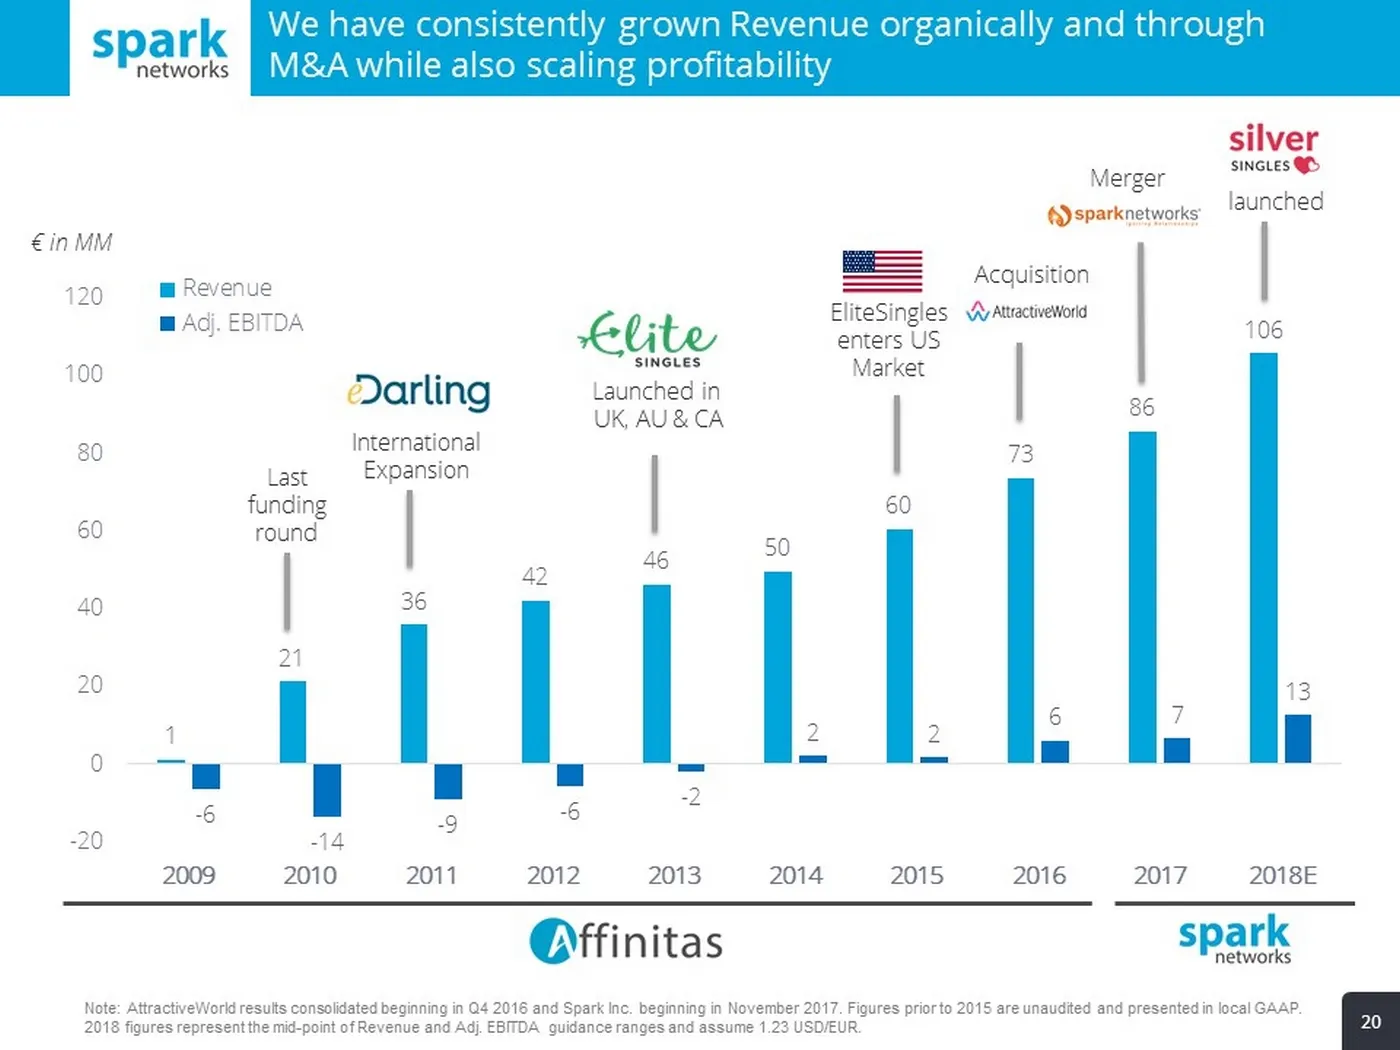
Slide 20: Consistent revenue growth organically and through M&A
20 We have consistently grown Revenue organically and through M&A while also scaling profitability 1 21 36 42 46 50 60 73 86 106 - 6 - 14 - 9 - 6 - 2 2 2 6 7 13 -20 0 20 40 60 80 100 120 2009 2010 2011 2012 2013 2014 2015 2016 2017 2018E Revenue Adj. EBITDA EliteSingles enters US Market Merger Acqui
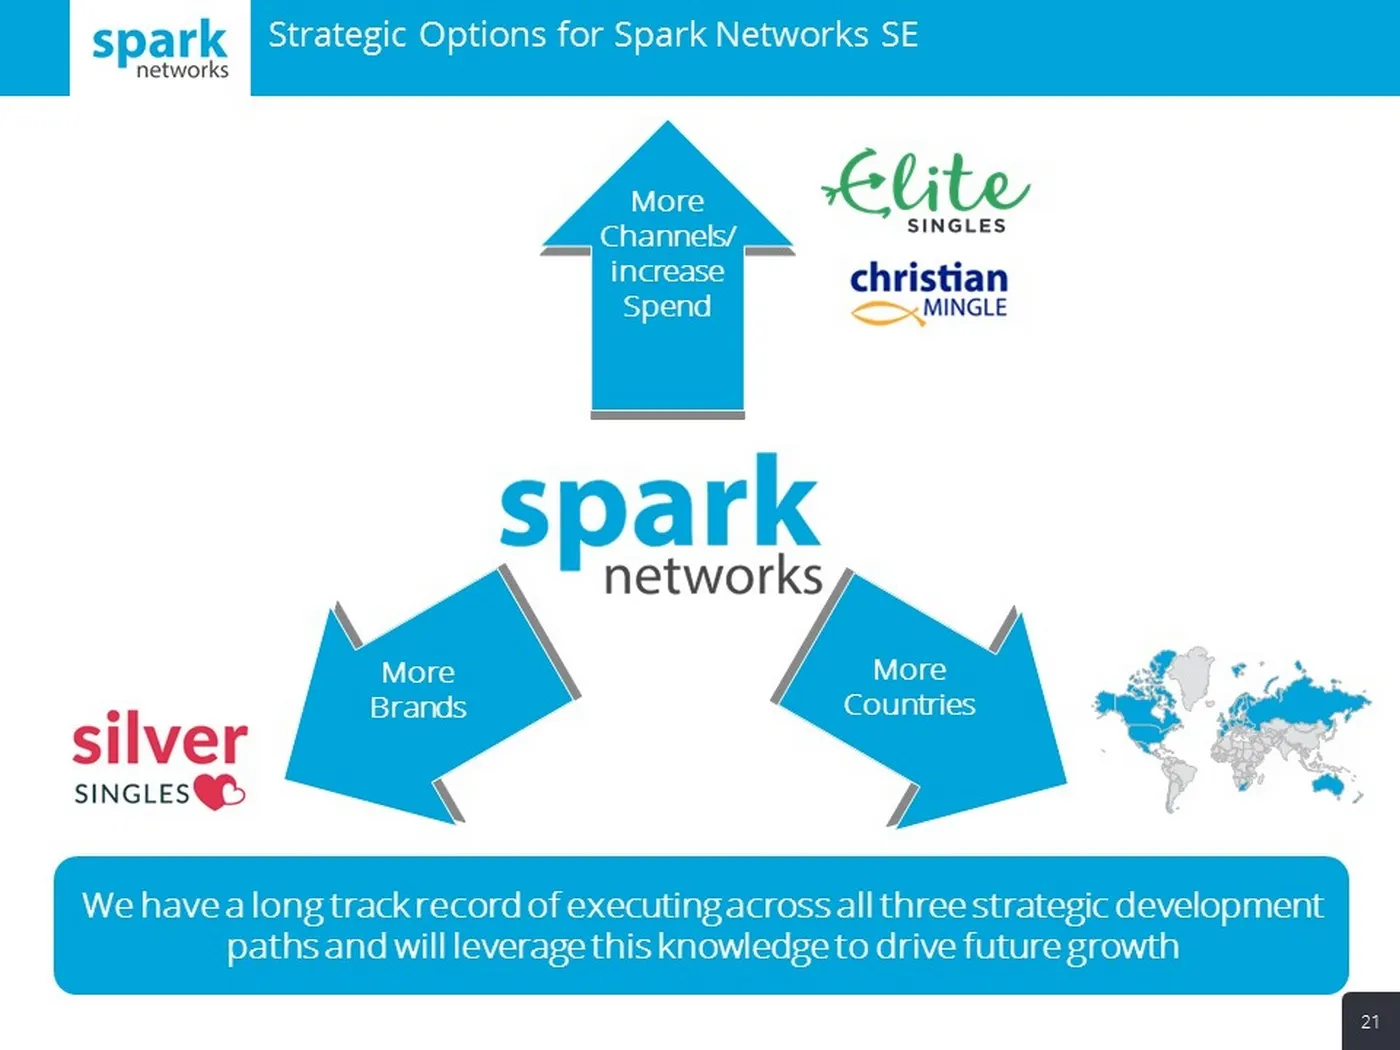
Slide 21: Strategic Options for Spark Networks SE
Strategic Options for Spark Networks SE 21 We have a long track record of executing across all three strategic development paths and will leverage this knowledge to drive future growth More Channels/ increase Spend More Countries More Brands
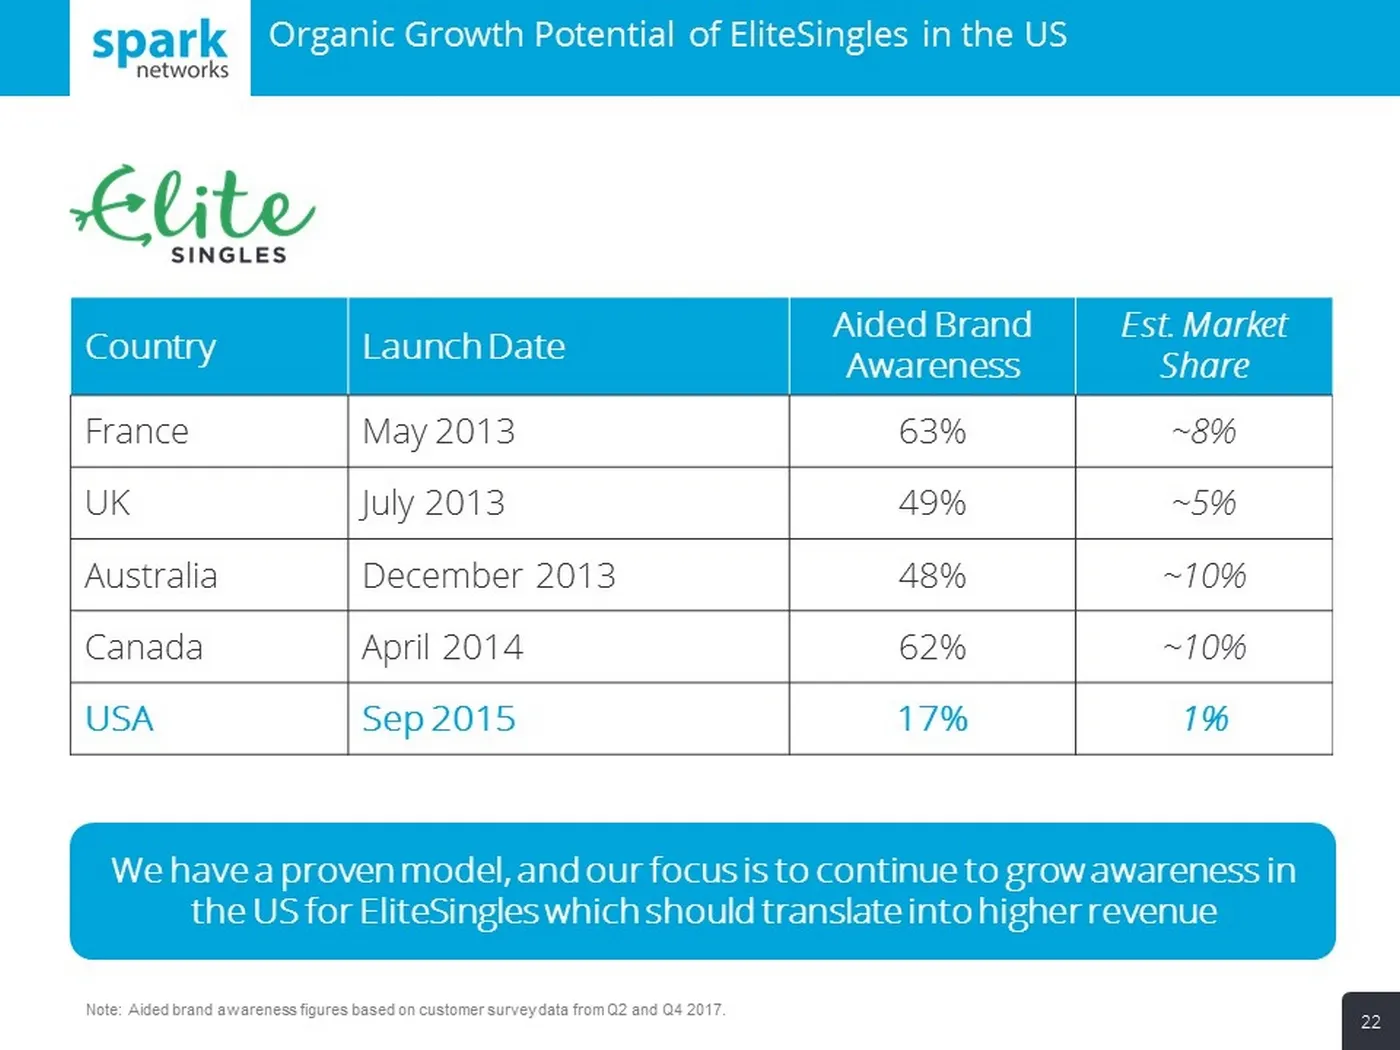
Slide 22: Organic Growth Potential of EliteSingles in the US
Organic Growth Potential of EliteSingles in the US 22 Country Launch Date Aided Brand Awareness Est. Market Share France May 2013 63% ~8% UK July 2013 49% ~5% Australia December 2013 48% ~10% Canada April 2014 62% ~10% USA Sep 2015 17% 1% Note: Aided brand awareness figures based on customer survey
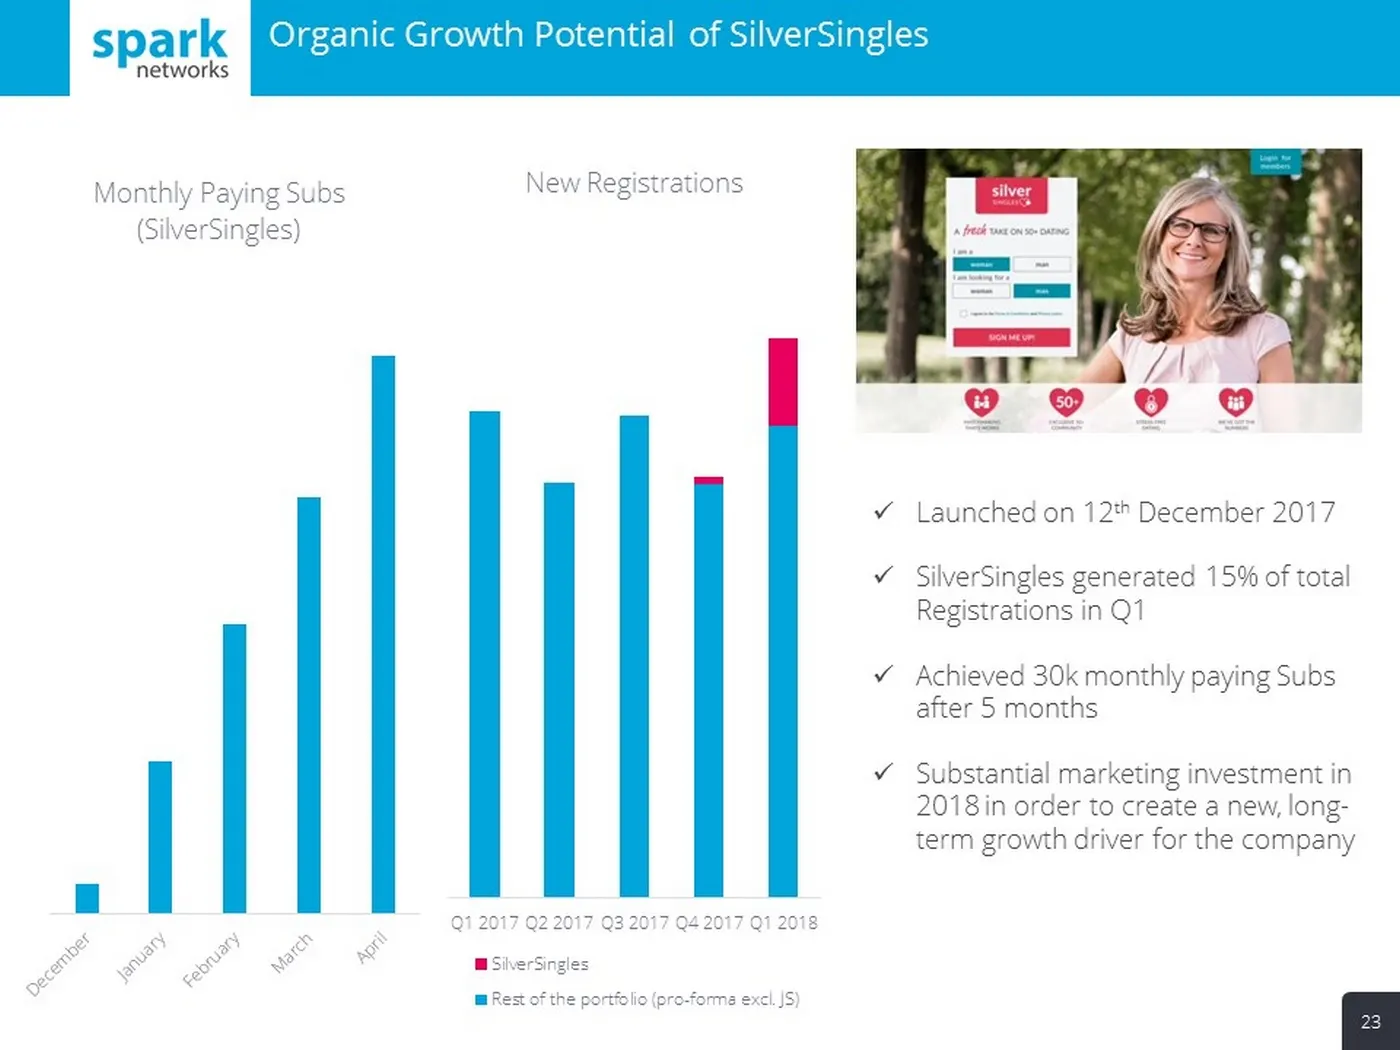
Slide 23: Organic Growth Potential of SilverSingles
Organic Growth Potential of SilverSingles 23 x Launched on 12 th December 2017 x SilverSingles generated 15% of total Registrations in Q1 x Achieved 30k monthly paying Subs after 5 months x Substantial marketing investment in 2018 in order to create a new, long - term growth driver for the company Q
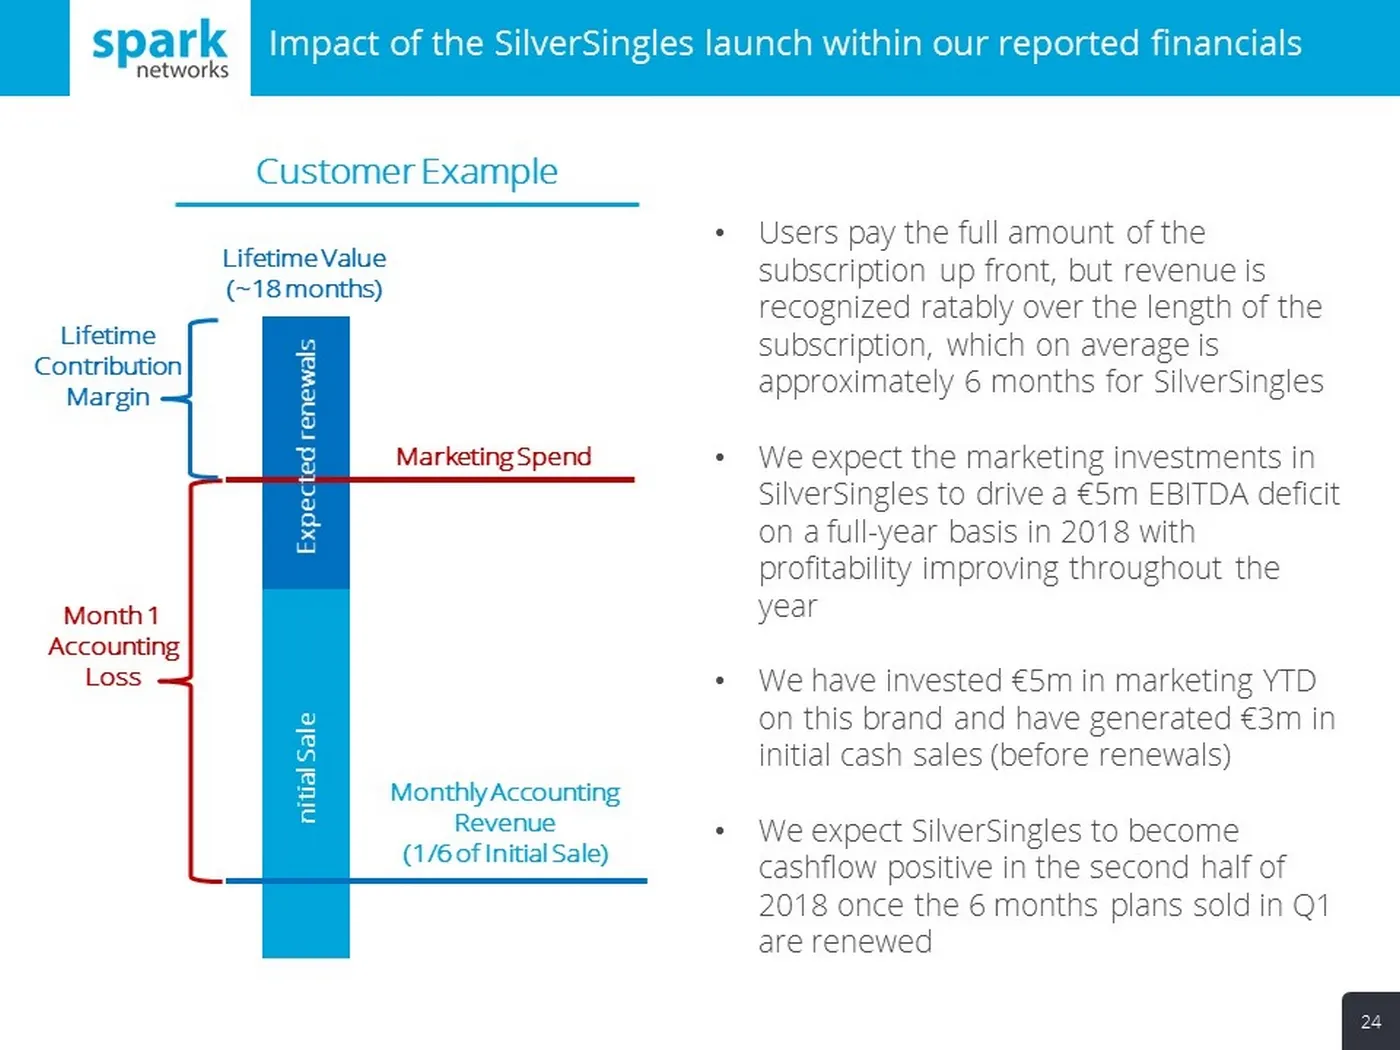
Slide 24: Impact of the SilverSingles launch within reported financials
Impact of the SilverSingles launch within our reported financials 24 Initial Sale Marketing Spend Monthly Accounting Revenue (1/6 of Initial Sale) • Users pay the full amount of the subscription up front, but revenue is recognized ratably over the length of the subscription, which on average is appr
Slide 25: Stabilization of the former Spark Networks, Inc. Brands
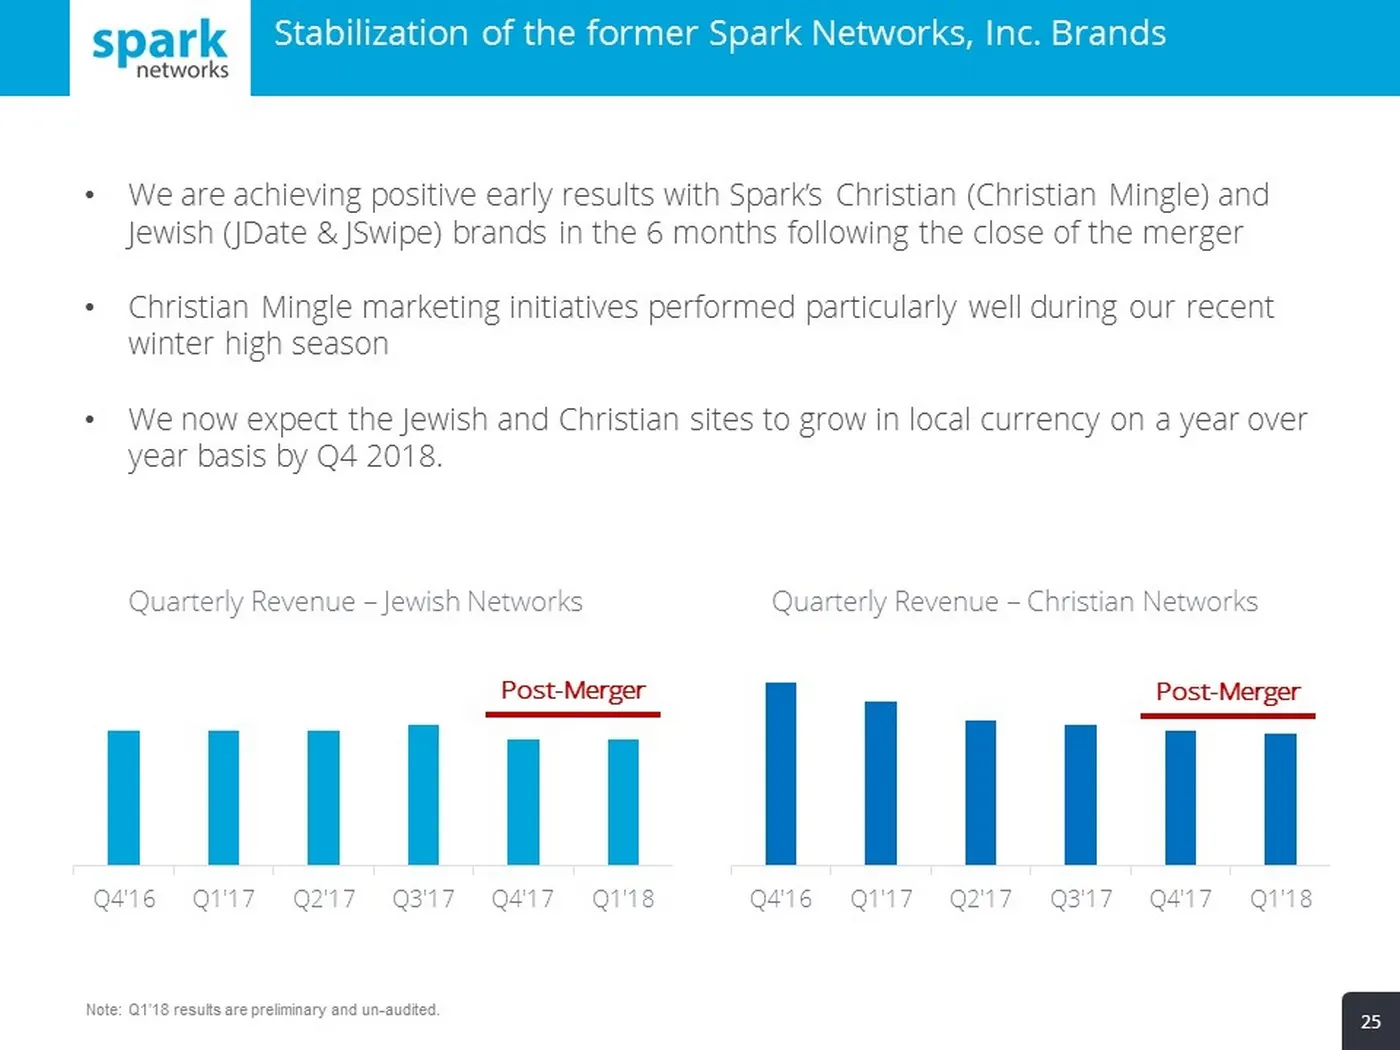
Stabilization of the former Spark Networks, Inc. Brands 25 • We are achieving positive early results with Spark’s Christian (Christian Mingle) and Jewish (JDate & JSwipe) brands in the 6 months following the close of the merger • Christian Mingle marketing initiatives performed particularly well dur
Slide 26: M&A activity to scale operations and grow brand portfolio
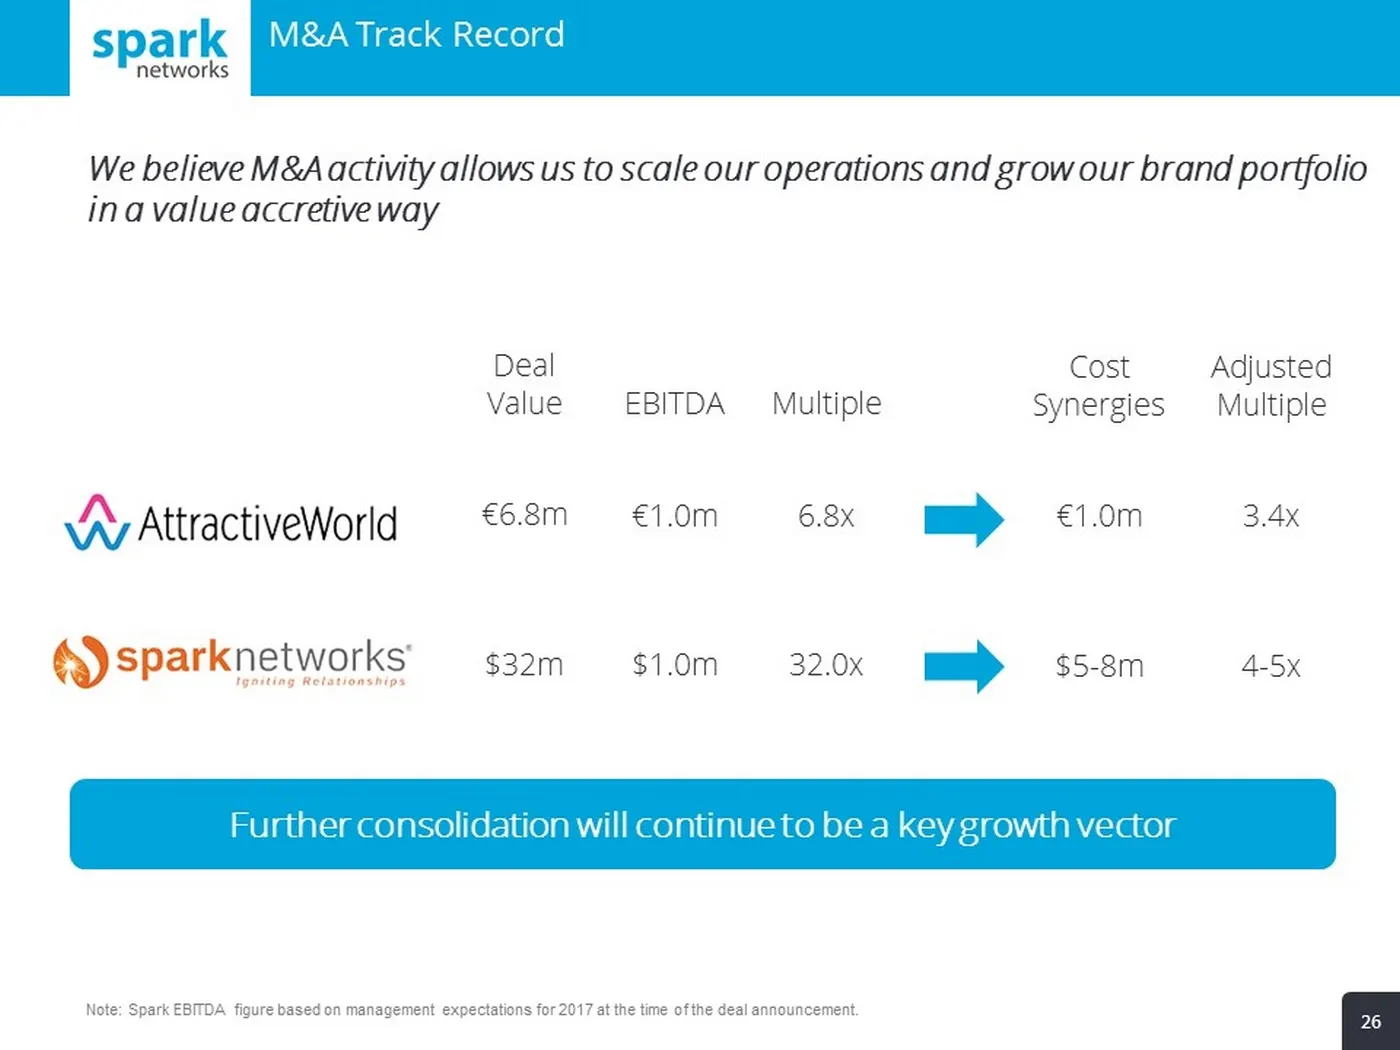
26 We believe M&A activity allows us to scale our operations and grow our brand portfolio in a value accretive way Deal Value €6.8m $32m EBITDA €1.0m $1.0m Multiple 6.8x 32.0x Cost Synergies €1.0m $5 - 8m Adjusted Multiple 3.4x 4 - 5x Further consolidation will continue to be a key growth vector M&A
Slide 27: New Credit Facility Details
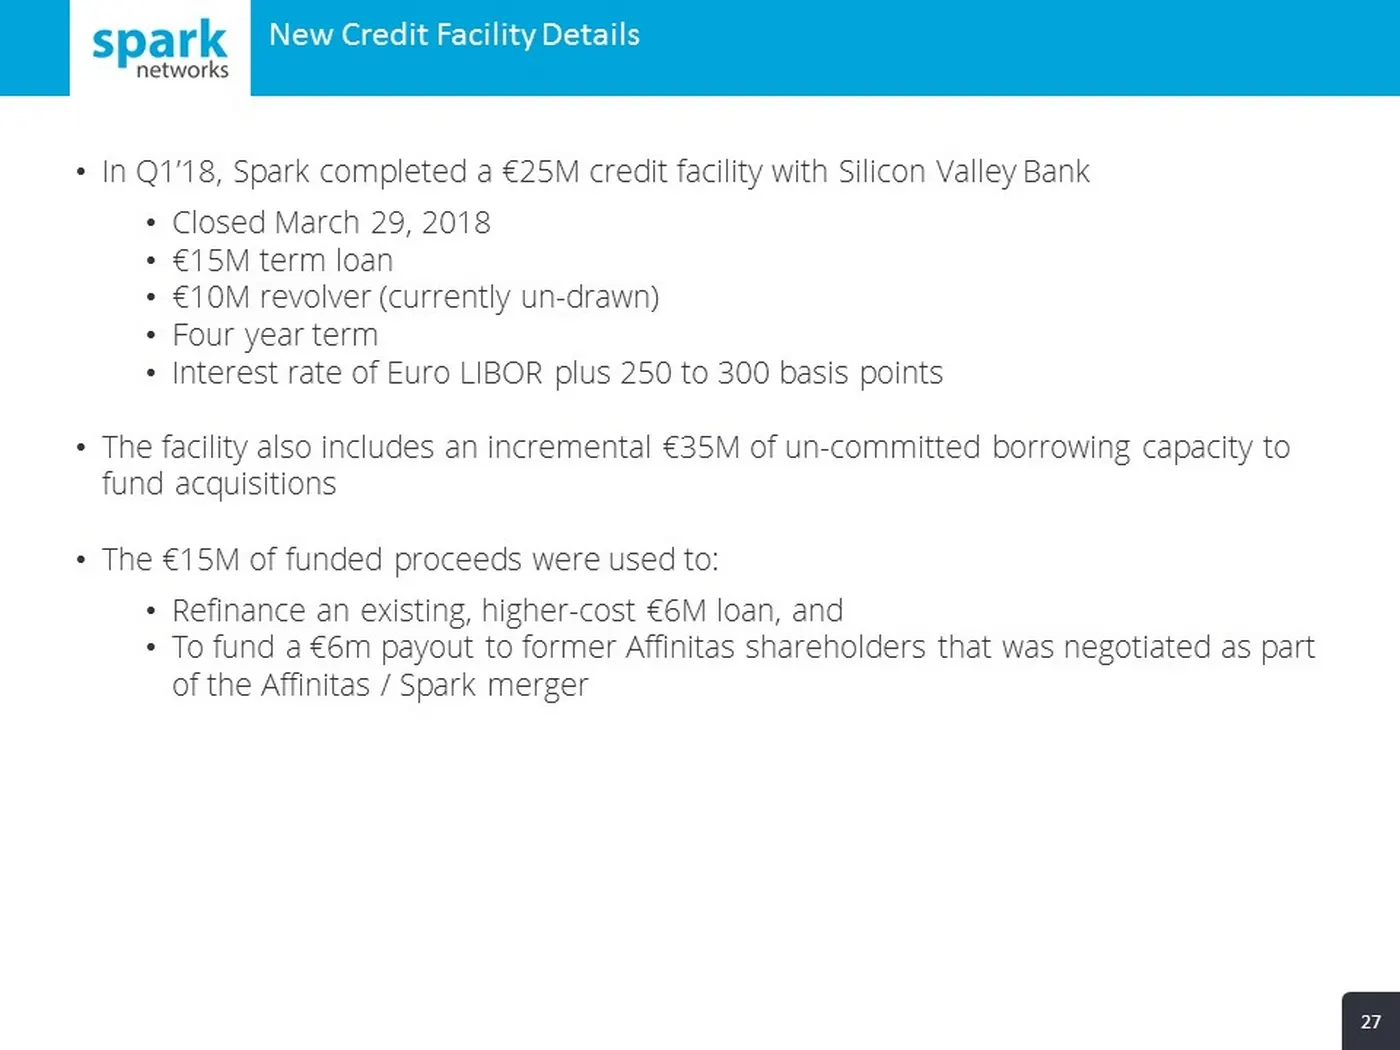
27 • In Q1’18, Spark completed a €25M credit facility with Silicon Valley Bank • Closed March 29, 2018 • € 15M term loan • € 10M revolver (currently un - drawn) • Four year term • Interest rate of Euro LIBOR plus 250 to 300 basis points • The facility also includes an incremental €35M of un - commit
Slide 28: Updated 2018 Financial Outlook
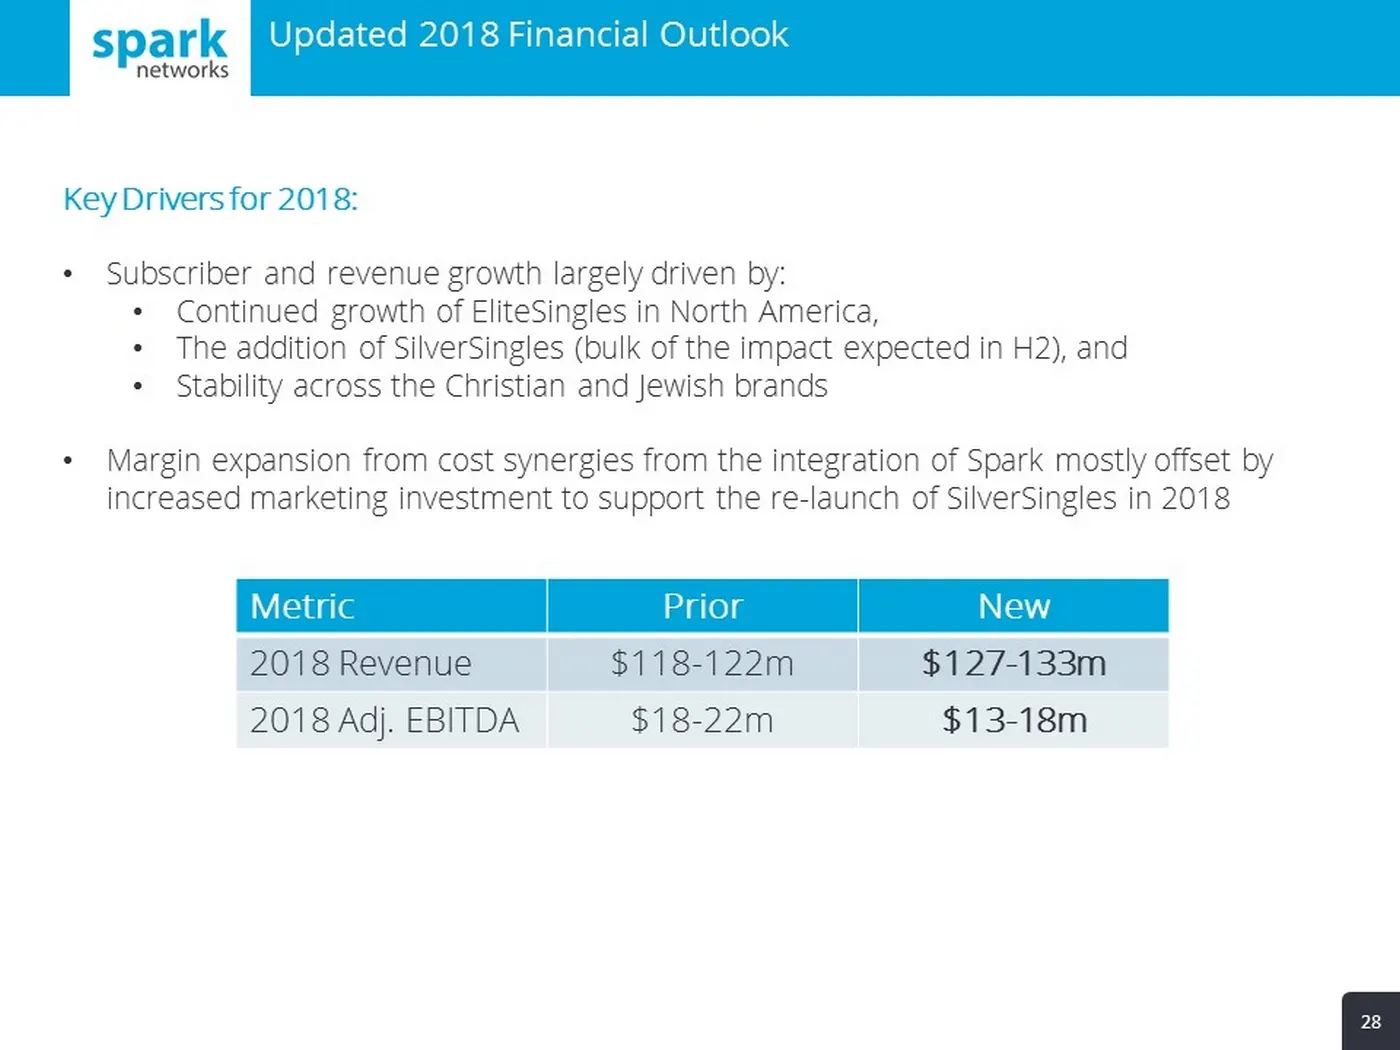
28 Metric Prior New 2018 Revenue $118 - 122m $127 - 133m 2018 Adj. EBITDA $18 - 22m $13 - 18m Key Drivers for 2018: • Subscriber and revenue growth largely driven by: • Continued growth of EliteSingles in North America, • The addition of SilverSingles (bulk of the impact expected in H2), and • Stabi

Slide 29: Conclusion
21.05.2018 29 Team, Presentation title Conclusion
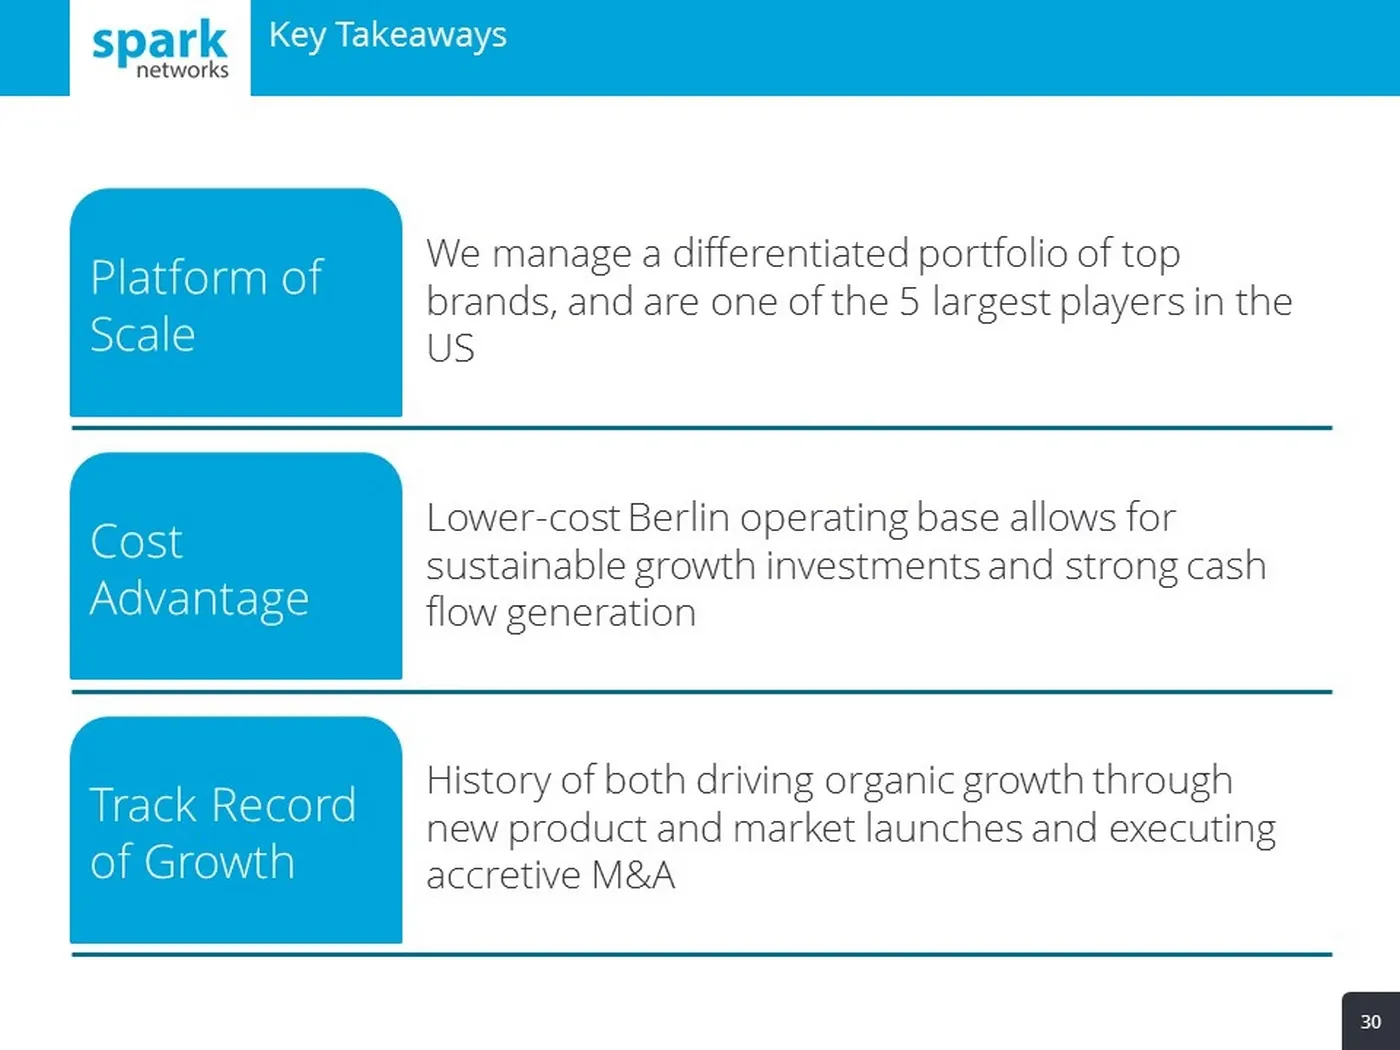
Slide 30: Key Takeaways
30 We manage a differentiated portfolio of top brands, and are one of the 5 largest players in the US Platform of Scale Lower - cost Berlin operating base allows for sustainable growth investments and strong cash flow generation Cost Advantage History of both driving organic growth through new produ
Slide 31: Appendix
21.05.2018 31 Team, Presentation title Appendix
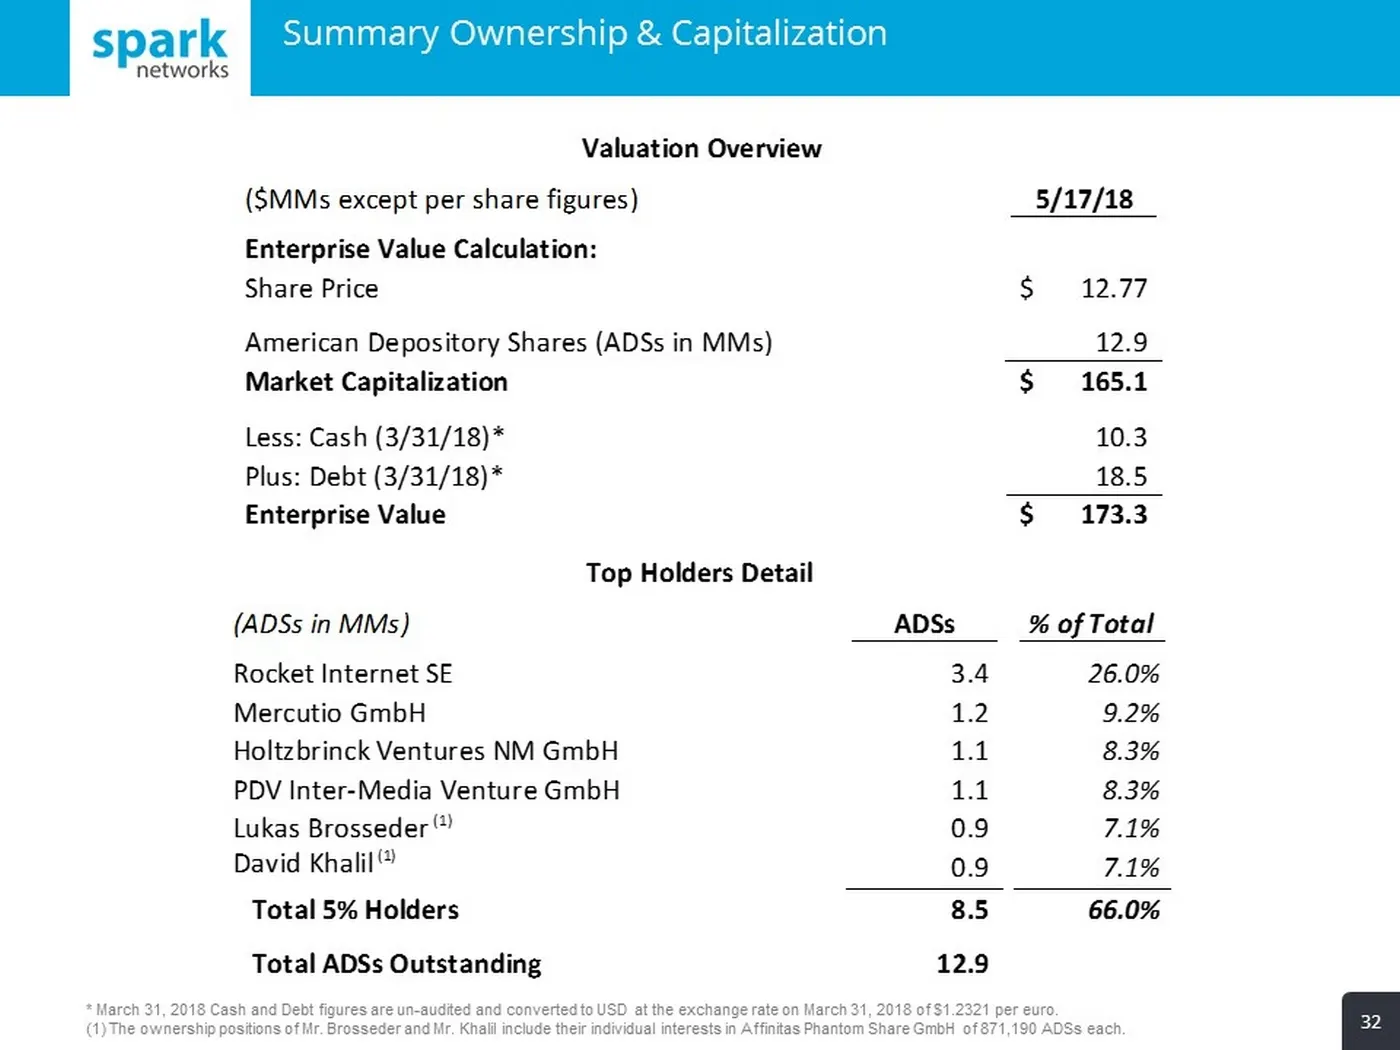
Slide 32: Summary Ownership & Capitalization
Top Holders Detail (ADSs in MMs) ADSs % of Total Rocket Internet SE 3.4 26.0% Mercutio GmbH 1.2 9.2% Holtzbrinck Ventures NM GmbH 1.1 8.3% PDV Inter-Media Venture GmbH 1.1 8.3% Lukas Brosseder (1) 0.9 7.1% David Khalil (1) 0.9 7.1% Total 5% Holders 8.5 66.0% Total ADSs Outstanding 12.9 Summary Owner
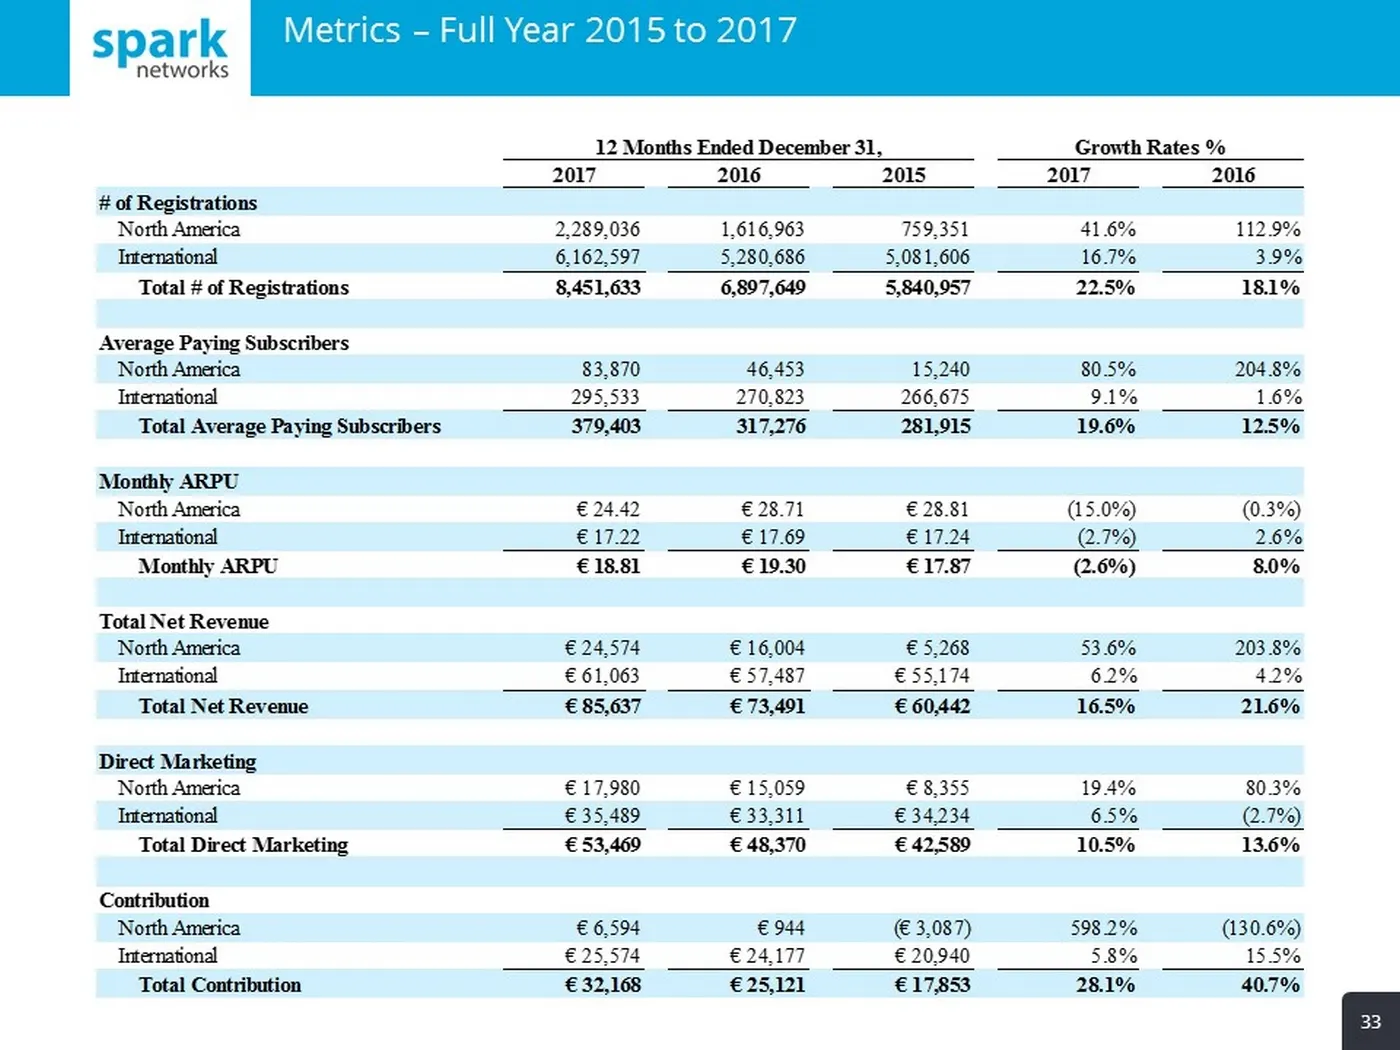
Slide 33: Metrics – Full Year 2015 to 2017
Metrics – Full Year 2015 to 2017 33 12 Months Ended December 31, Growth Rates % 2017 2016 2015 2017 2016 # of Registrations North America 2,289,036 1,616,963 759,351 41.6% 112.9% International 6,162,597 5,280,686 5,081,606 16.7% 3.9% Total # of Registrations 8,451,633 6,897,649 5,840,957 22.5% 18.1%
Slide 34: Metrics – Half-Year Results
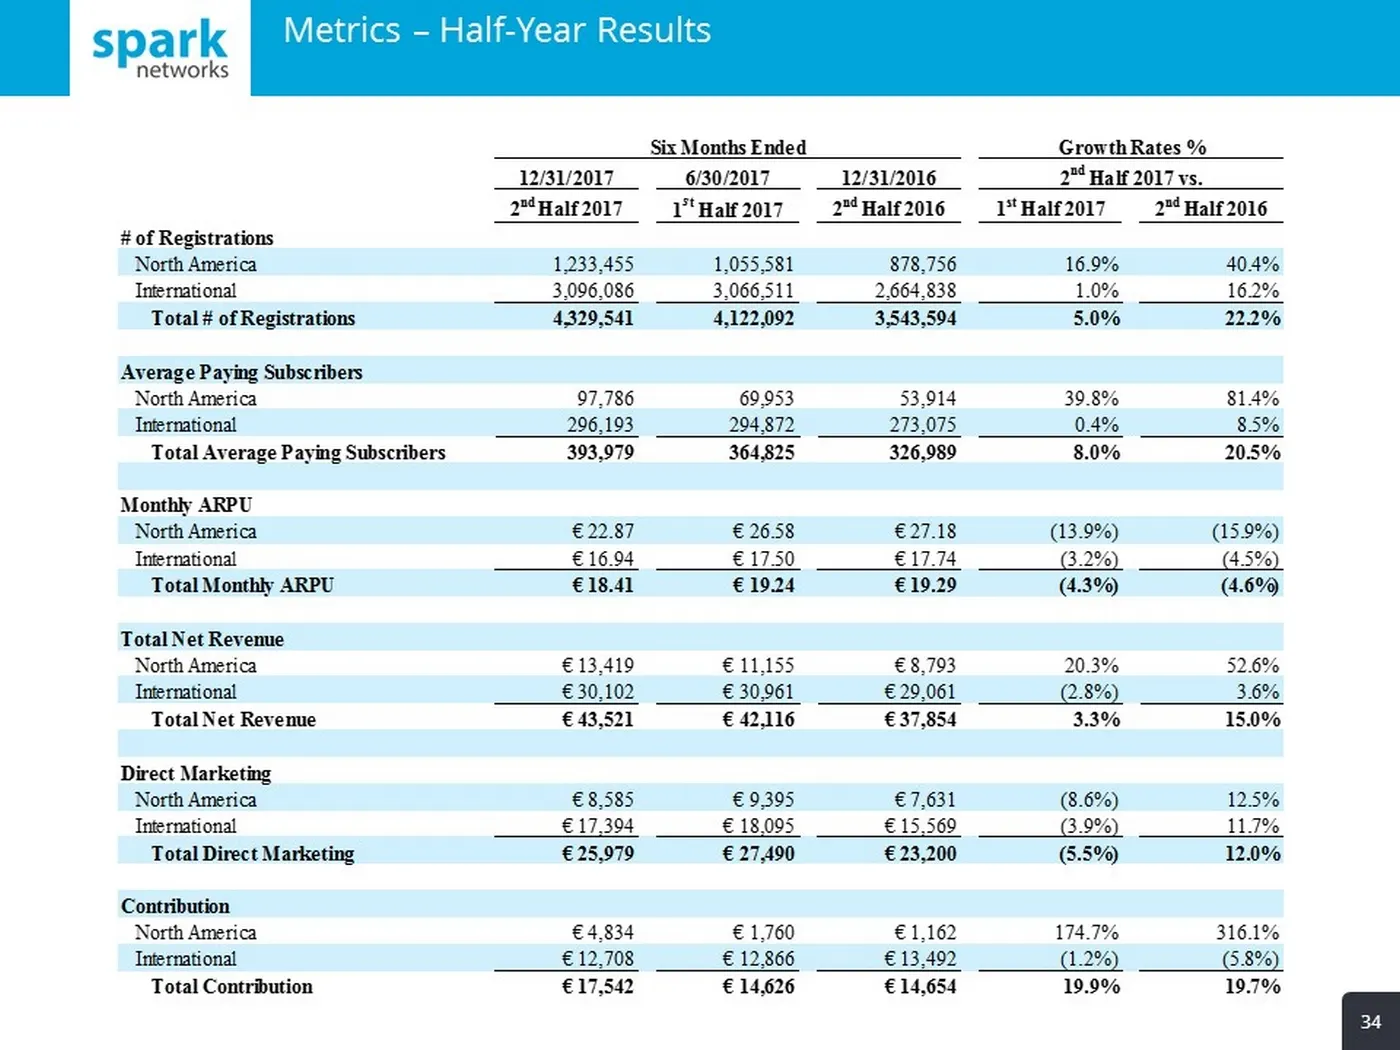
Metrics – Half - Year Results 34 Six Months Ended Growth Rates % 12/31/2017 6/30/2017 12/31/2016 2 nd Half 2017 vs. 2 nd Half 2017 1 st Half 2017 2 nd Half 2016 1 st Half 2017 2 nd Half 2016 # of Registrations North America 1,233,455 1,055,581 878,756 16.9% 40.4% International 3,096,086 3,066,511 2,
Slide 35: Consolidated Statements of Comprehensive Loss/Income
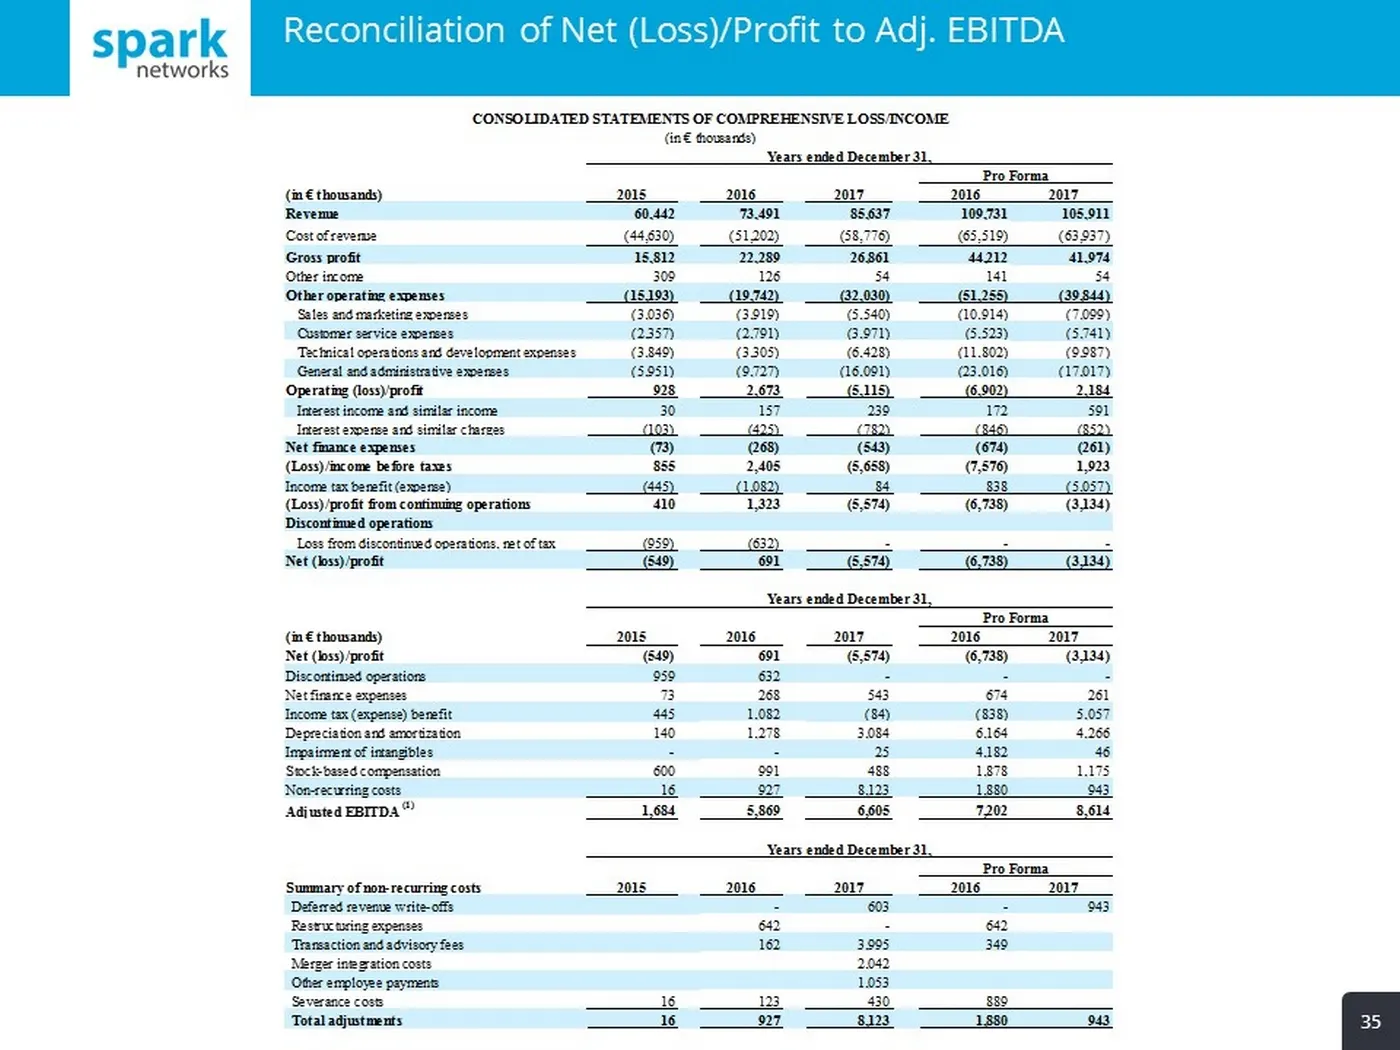
35 CONSOLIDATED STATEMENTS OF COMPREHENSIVE LOSS/INCOME (in € thousands) Pro Forma (in € thousands) 2015 2016 2017 2016 2017 Revenue 60,442 73,491 85,637 109,731 105,911 Cost of revenue (44,630) (51,202) (58,776) (65,519) (63,937) Gross profit 15,812 22,289 26,861 44,212 41,974 Other income 309 126
Source: SEC EDGAR · 6-K filed May 22, 2018
More decks from Spark Networks SE
 Investor Presentation (May 2022)25 slides · May 11, 2022
 Investor Presentation (June 2020)29 slides · Jun 30, 2020
 Merger or Acquisition (May 2019)19 slides · May 21, 2019
 Merger or Acquisition (March 2019)14 slides · Mar 22, 2019
 Investor Presentation (September 2018)35 slides · Sep 4, 2018
 Investor Day (December 2017)39 slides · Dec 7, 2017