ITT Inc. · NYSE:ITT
ITT — ITT Industries — Electrical Products Group 2006 Annual Spring Conference
23 slides from ITT's conference presentation, May 22, 2006
Slide 1: Electrical Products Group 2006 Annual Spring Conference
Electrical Products Group 2006 Annual Spring Conference Steve Loranger Chairman, President & CEO May 22, 2006
Slide 2: Forward Looking Statements
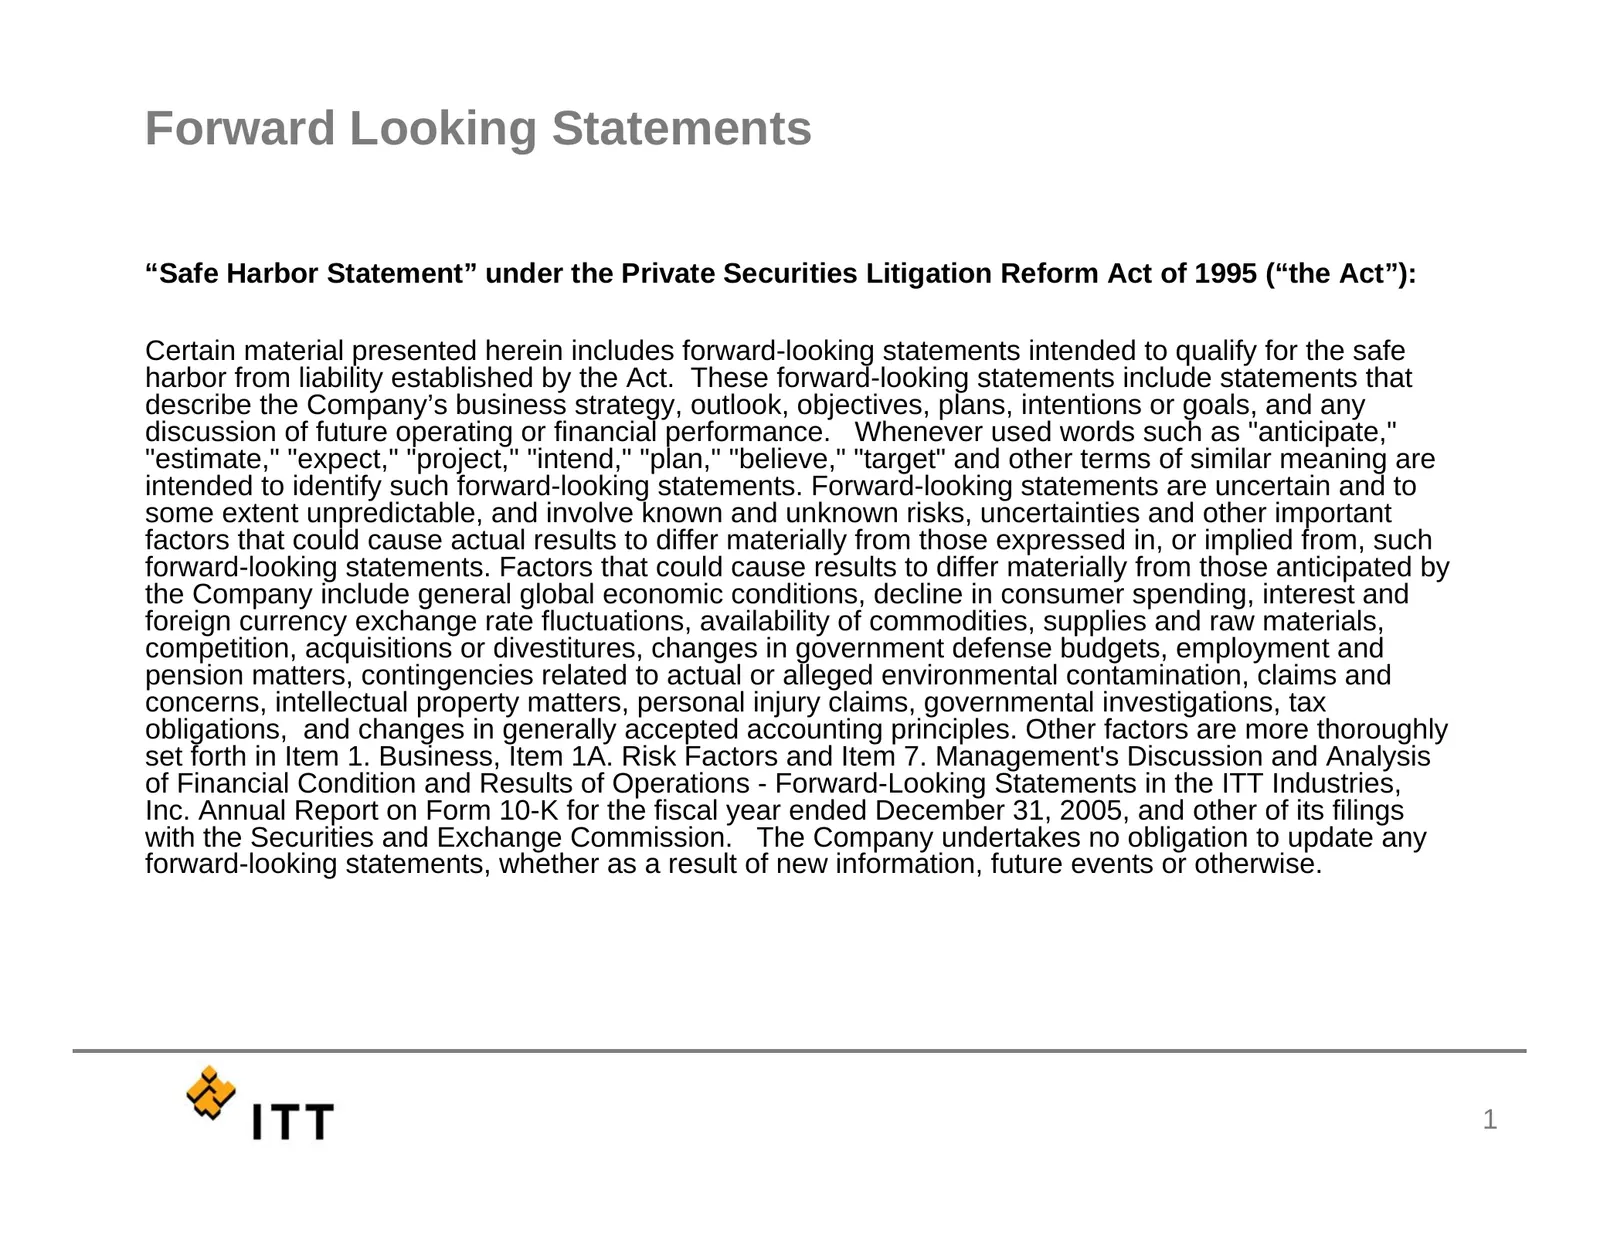
Forward Looking Statements “Safe Harbor Statement” under the Private Securities Litigation Reform Act of 1995 (“the Act”): Certain material presented herein includes forward-looking statements intended to qualify for the safe harbor from liability established by the Act. These forward-looking statem
Slide 3: Financial Results
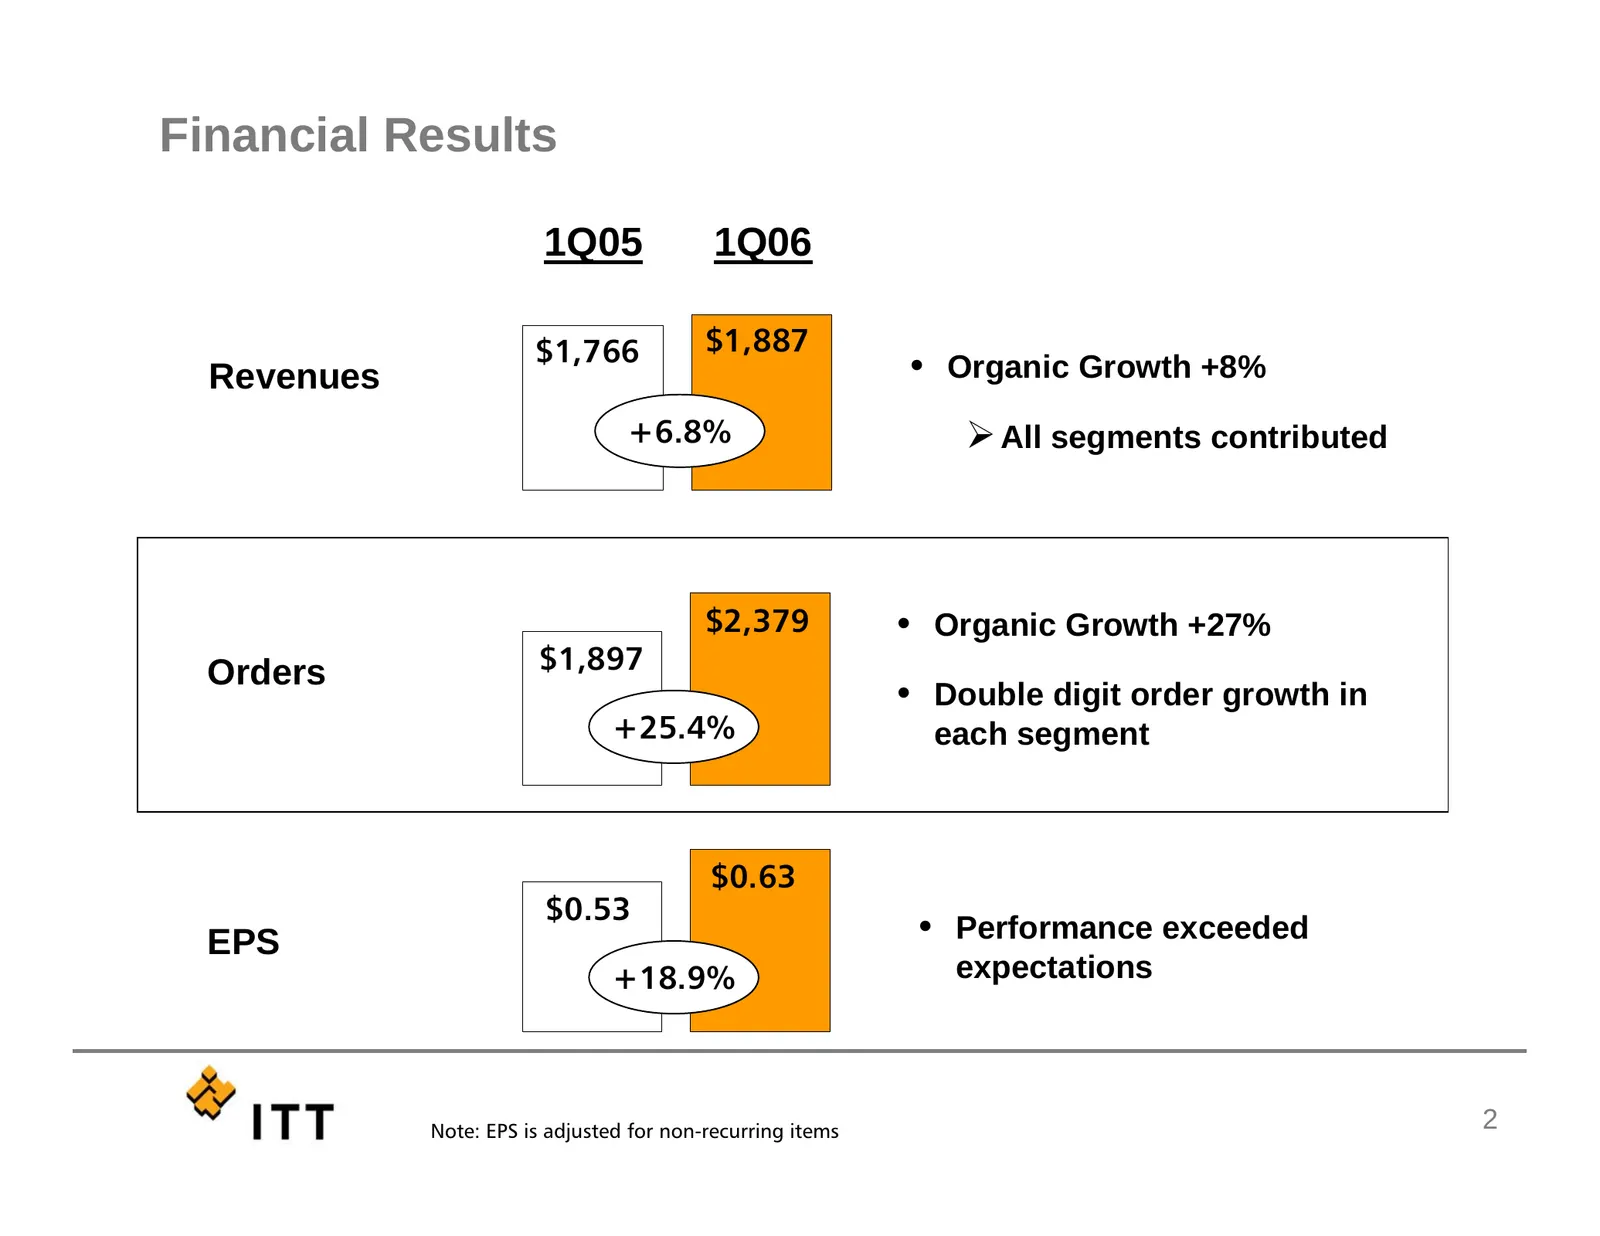
Financial Results 1Q05 1Q06 $1,766 $1,887 Revenues • Organic Growth +8% +6.8% ¾ All segments contributed $2,379 • Organic Growth +27% Orders $1,897 • Double digit order growth in +25.4% each segment $0.63 $0.53 EPS • Performance exceeded +18.9% expectations Note: EPS is adjusted for non-recurring it
Slide 4: ITT Industries - Today
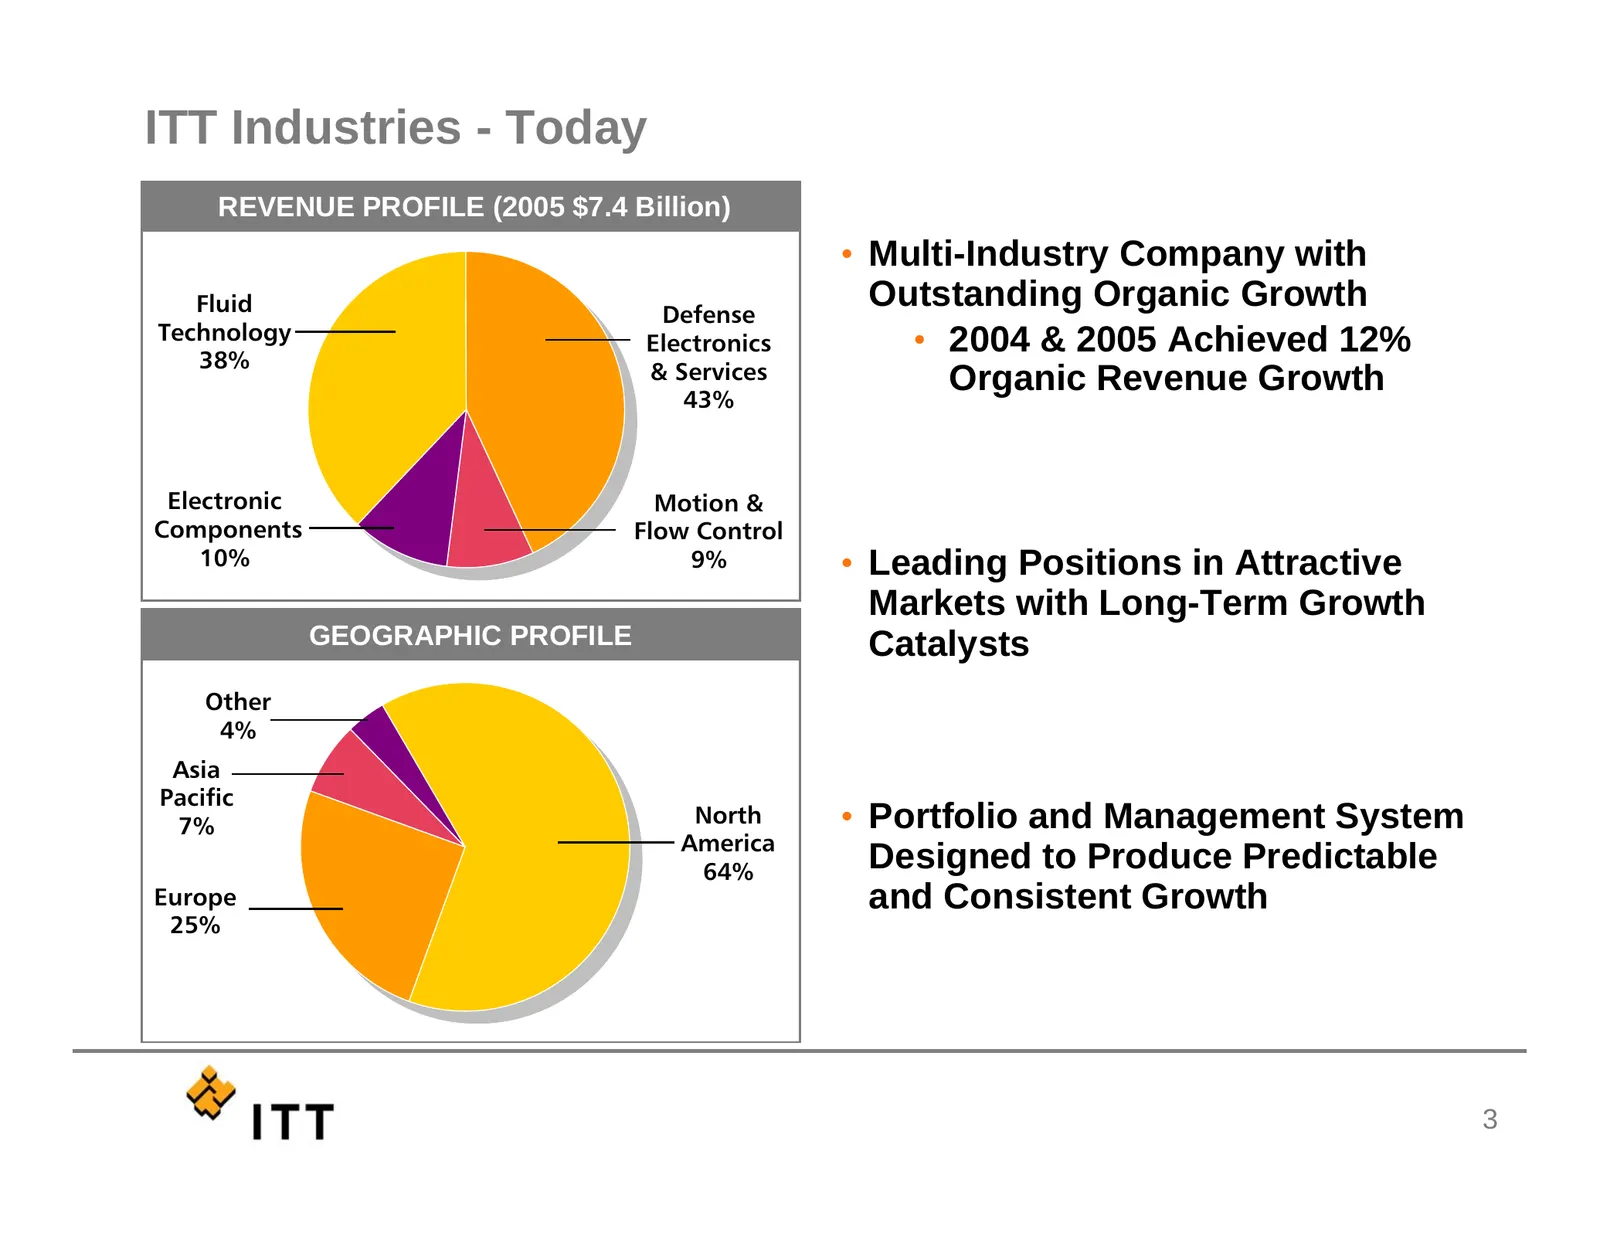
ITT Industries - Today REVENUE PROFILE (2005 $7.4 Billion) • Multi-Industry Company with Fluid Defense Outstanding Organic Growth Technology Electronics • 2004 & 2005 Achieved 12% 38% & Services Organic Revenue Growth 43% Electronic Motion & Components Flow Control 10% 9% • Leading Positions in Attr
Slide 5: ITT Growth Platforms
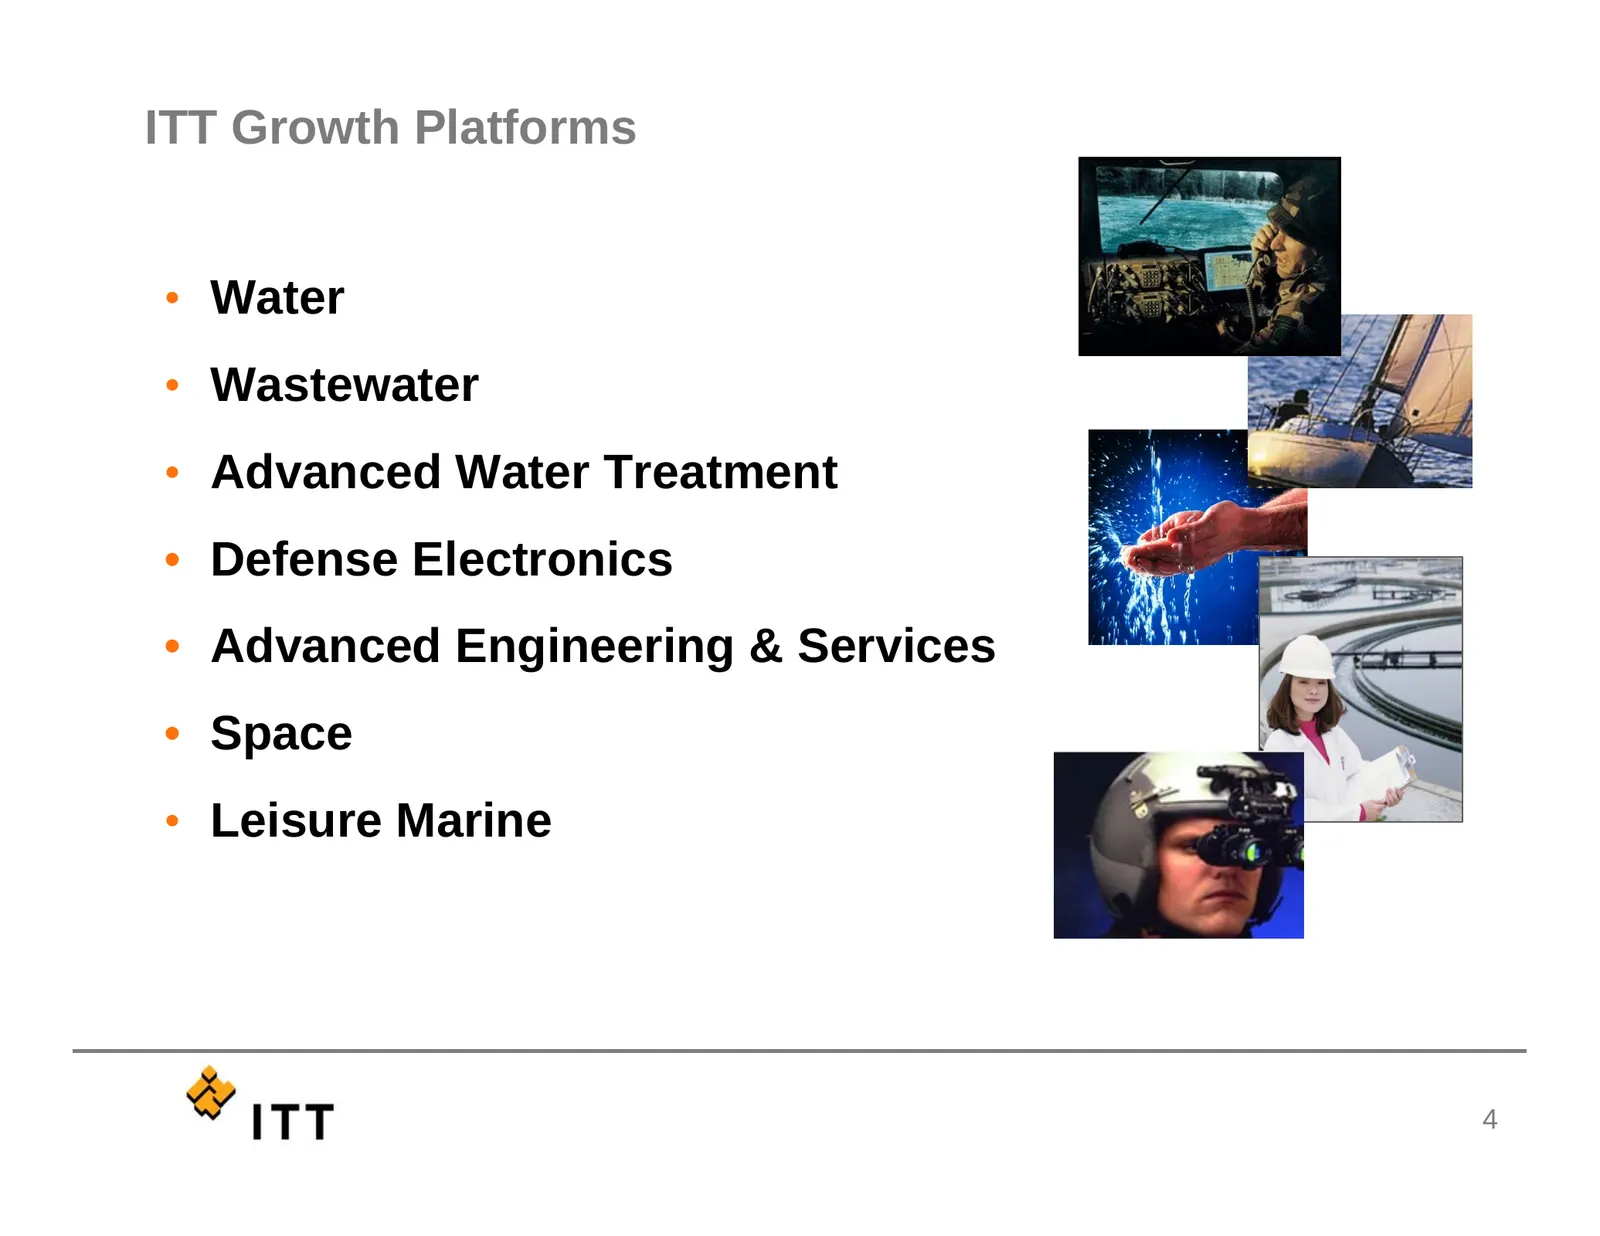
ITT Growth Platforms • Water • Wastewater • Advanced Water Treatment • Defense Electronics • Advanced Engineering & Services • Space • Leisure Marine 4
Slide 6: Consistent Financial Performance
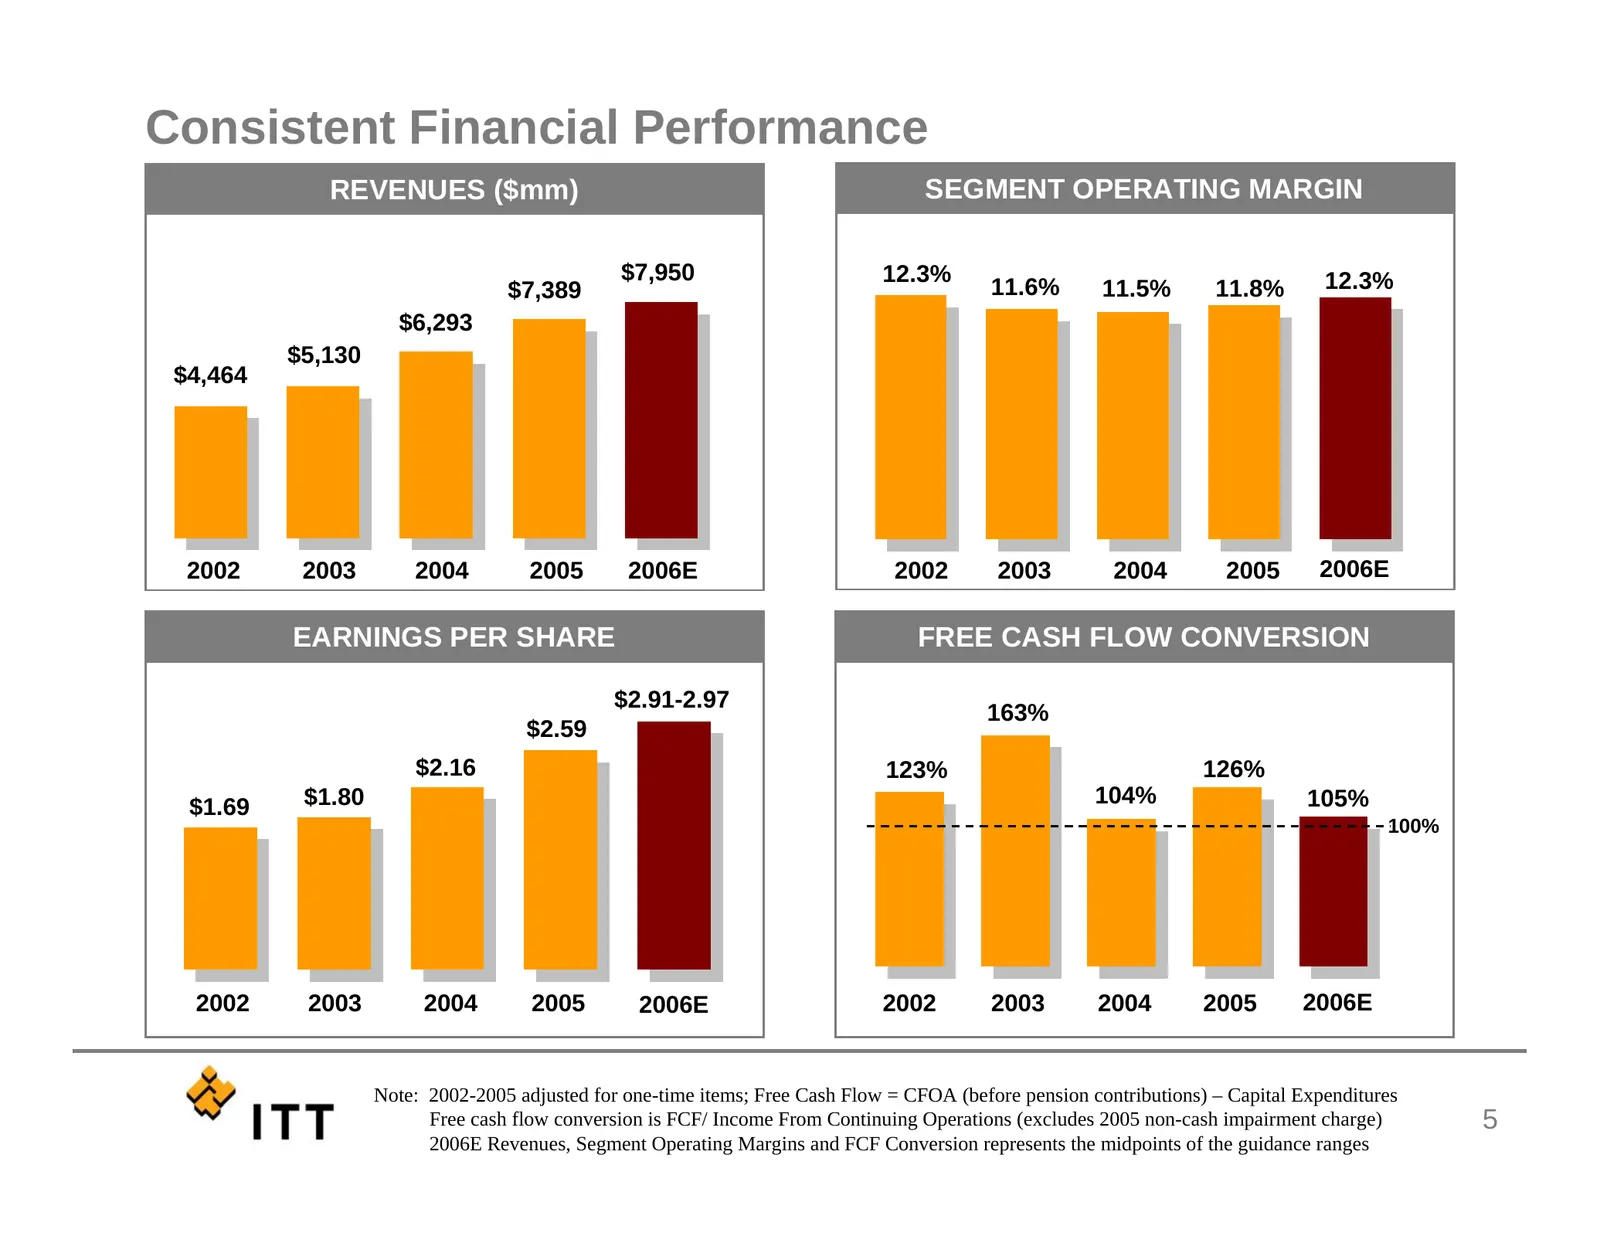
Consistent Financial Performance REVENUES ($mm) SEGMENT OPERATING MARGIN $7,950 12.3% 12.3% $7,389 11.6% 11.5% 11.8% $6,293 $5,130 $4,464 2002 2003 2004 2005 2006E 2002 2003 2004 2005 2006E EARNINGS PER SHARE FREE CASH FLOW CONVERSION $2.91-2.97 163% $2.59 $2.16 123% 126% $1.69 $1.80 104% 105% 100%
Slide 7: Fluid Technology
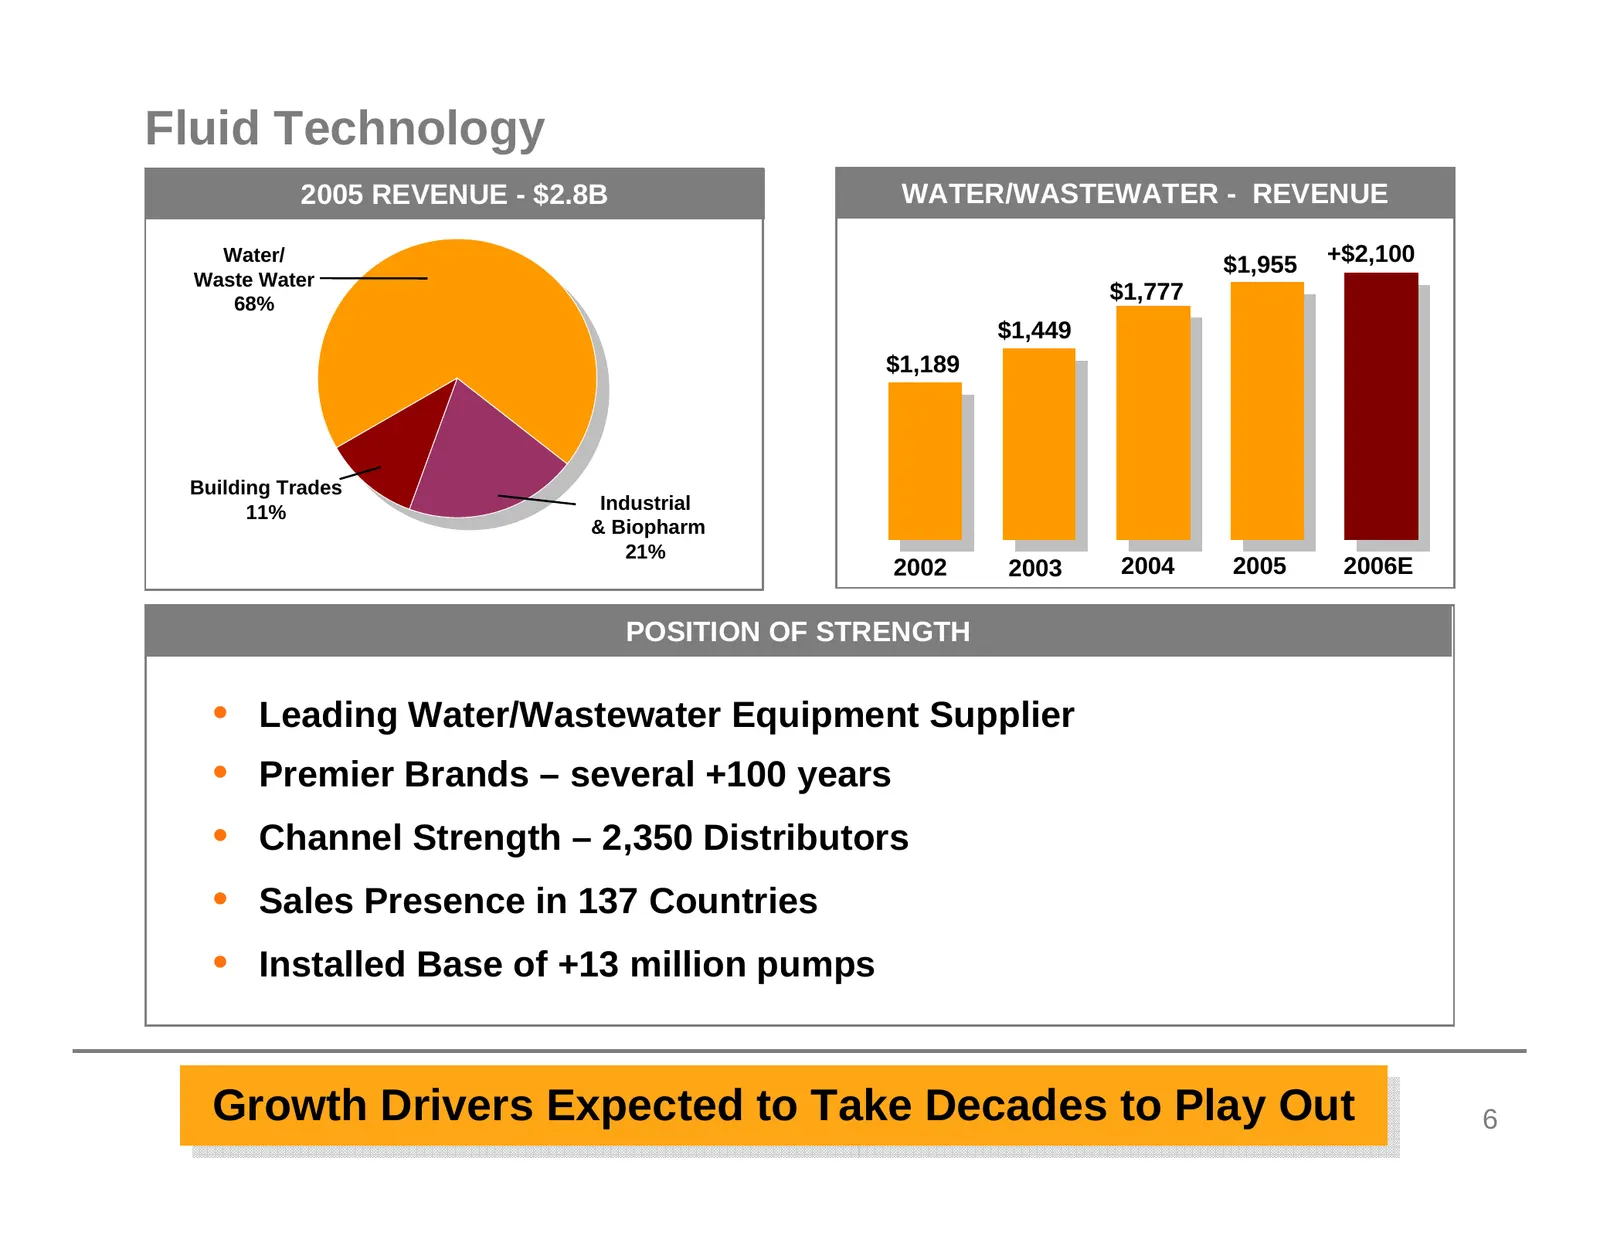
Fluid Technology 2005 REVENUE - $2.8B WATER/WASTEWATER - REVENUE Water/ $1,955 +$2,100 Waste Water 68% $1,777 $1,449 $1,189 Building Trades 11% Industrial & Biopharm 21% 2002 2003 2004 2005 2006E POSITION OF STRENGTH • Leading Water/Wastewater Equipment Supplier • Premier Brands – several +100 years
Slide 8: Fluid Technology 2006 Outlook Highlights
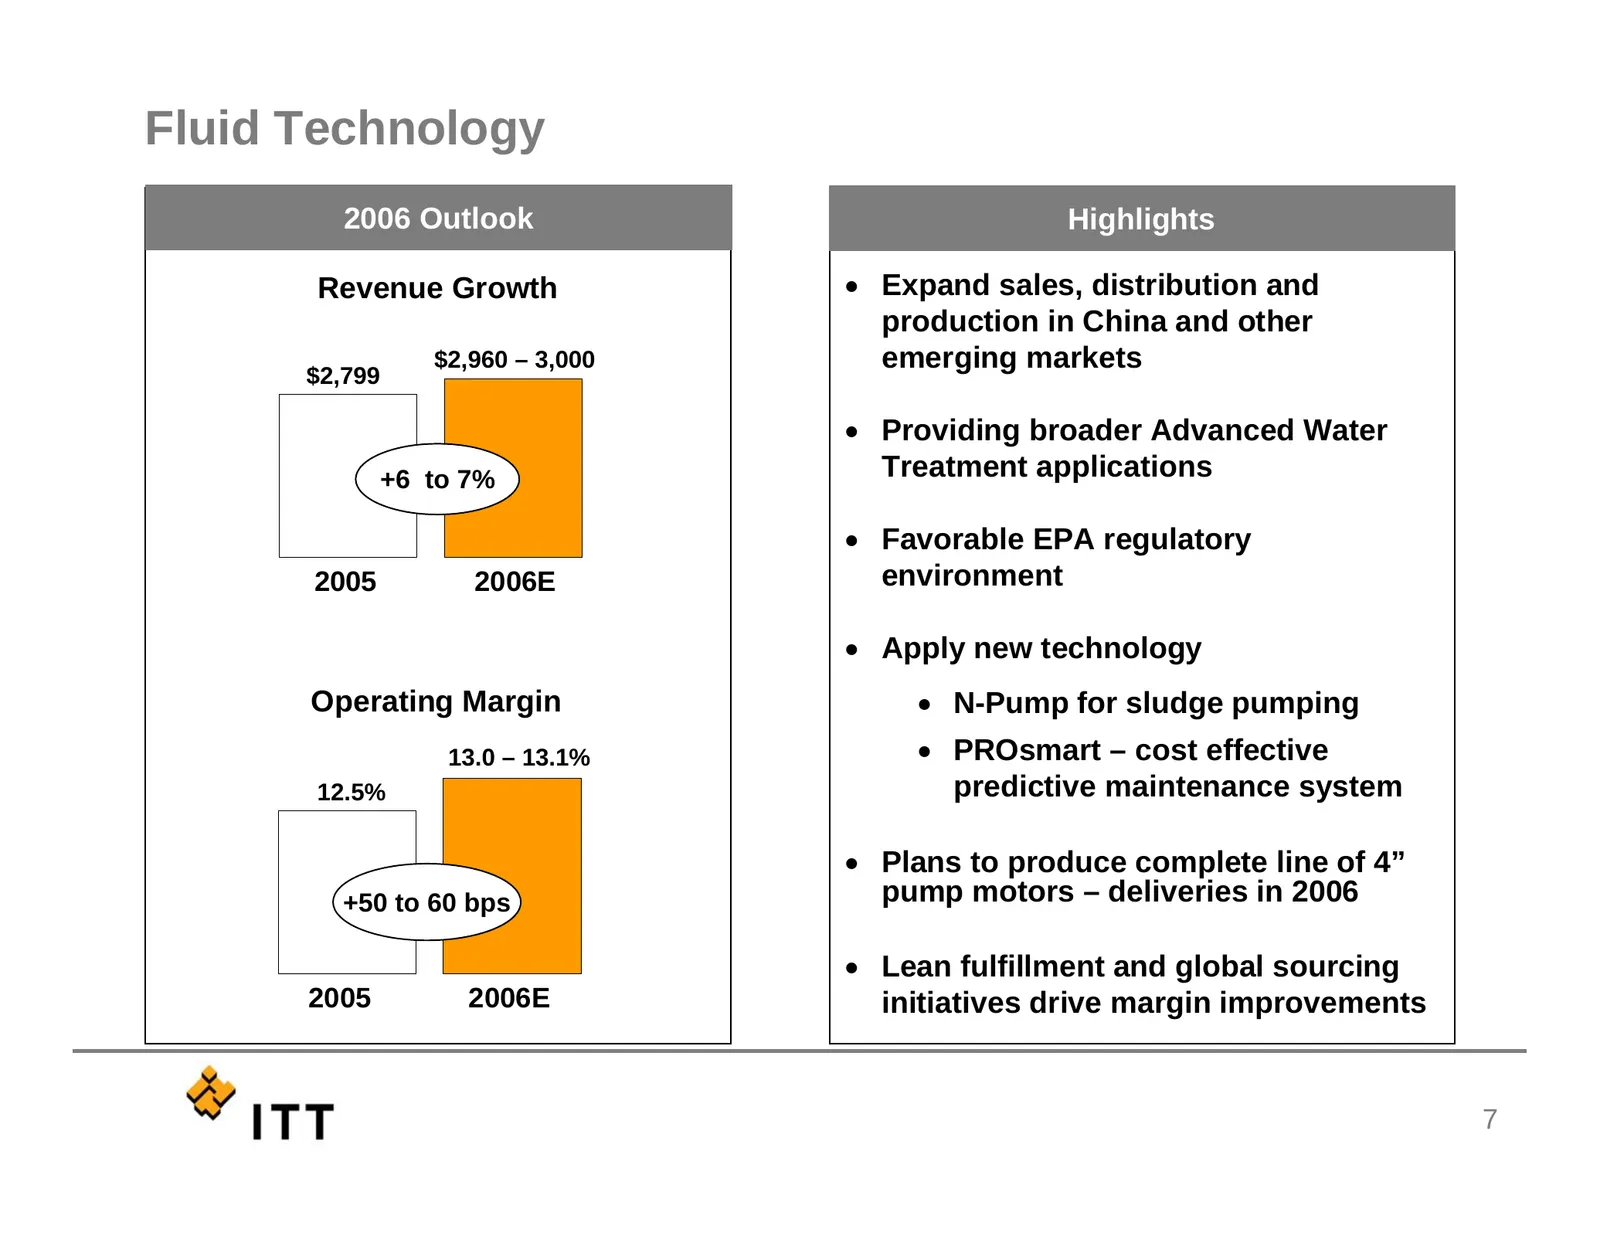
Fluid Technology 2006 Outlook Highlights Revenue Growth • Expand sales, distribution and production in China and other $2,960 – 3,000 emerging markets $2,799 • Providing broader Advanced Water +6 to 7% Treatment applications • Favorable EPA regulatory 2005 2006E environment • Apply new technology Op
Slide 9: Attractiveness of Water
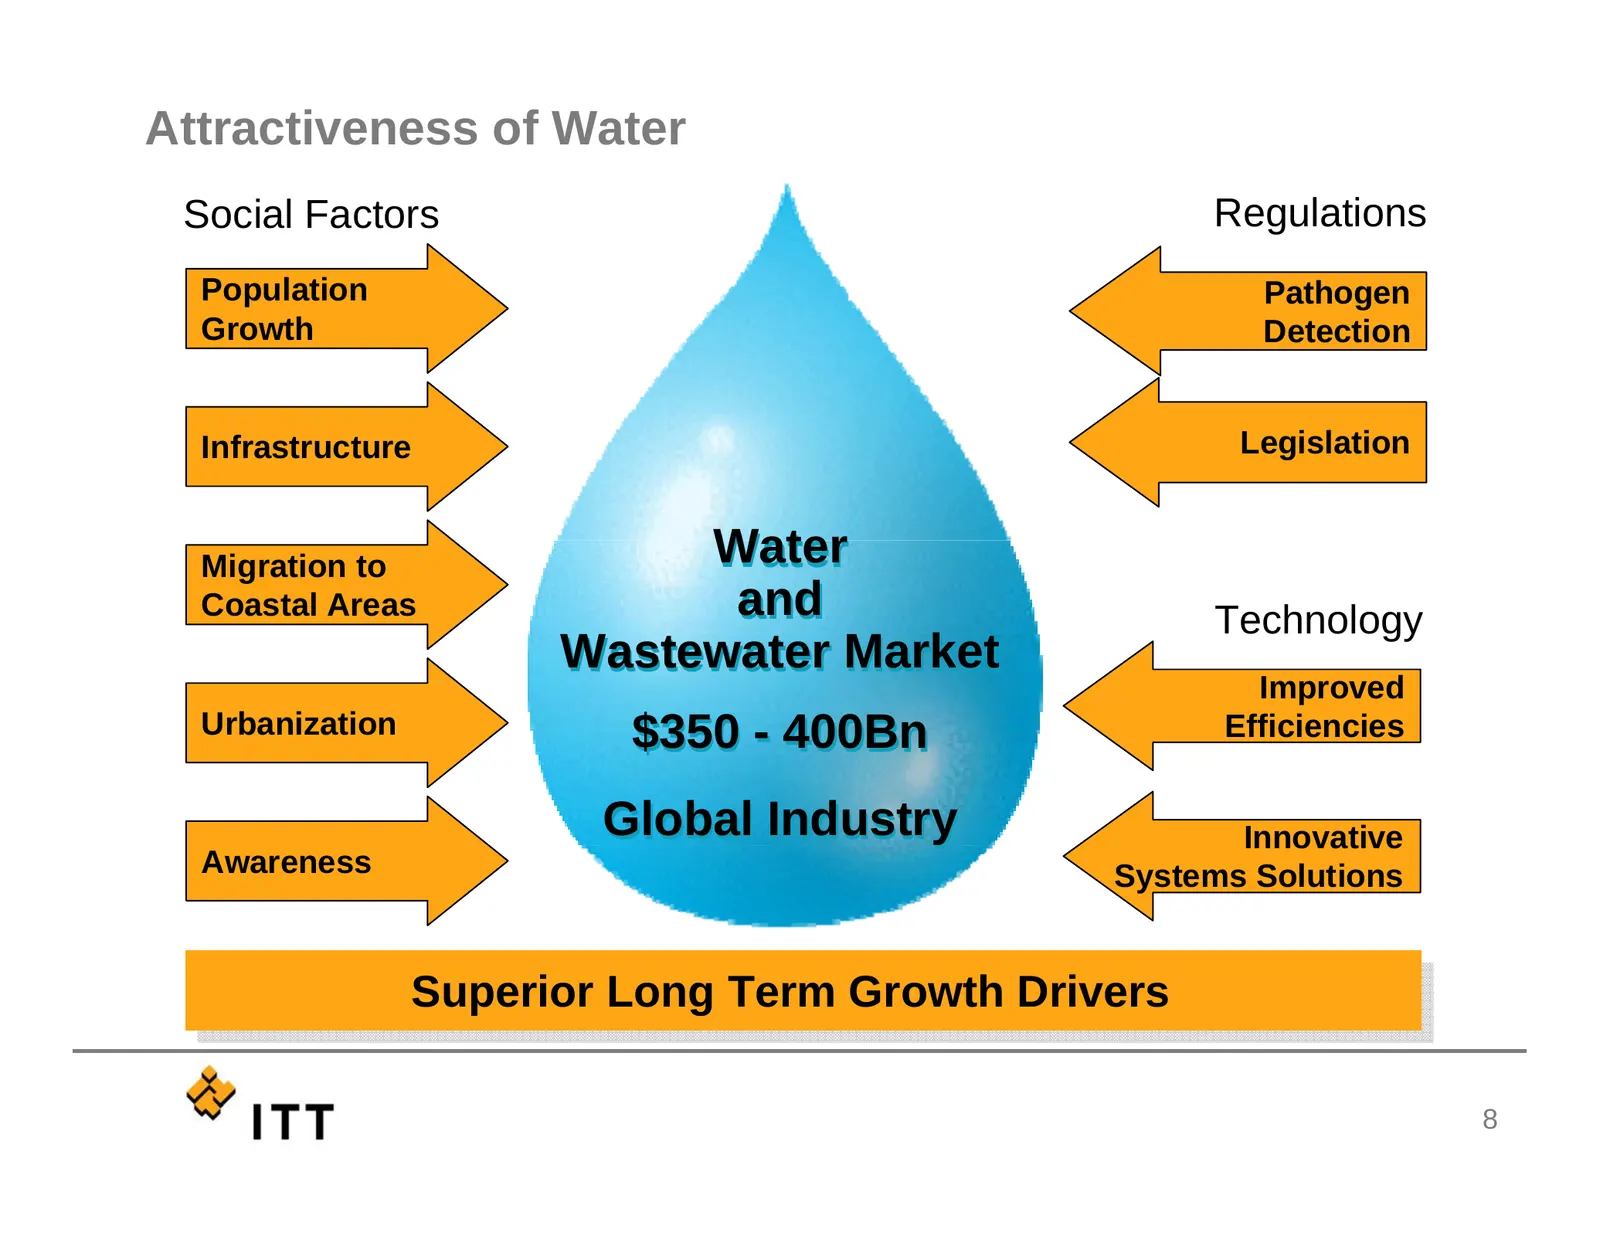
Attractiveness of Water Social Factors Regulations Population Pathogen Growth Detection Infrastructure Legislation Migration to Water Coastal Areas and Technology Wastewater Market Improved Urbanization $350 - 400Bn Efficiencies Global Industry Innovative Awareness Systems Solutions Superior Superio
Slide 10: Global Water Vision
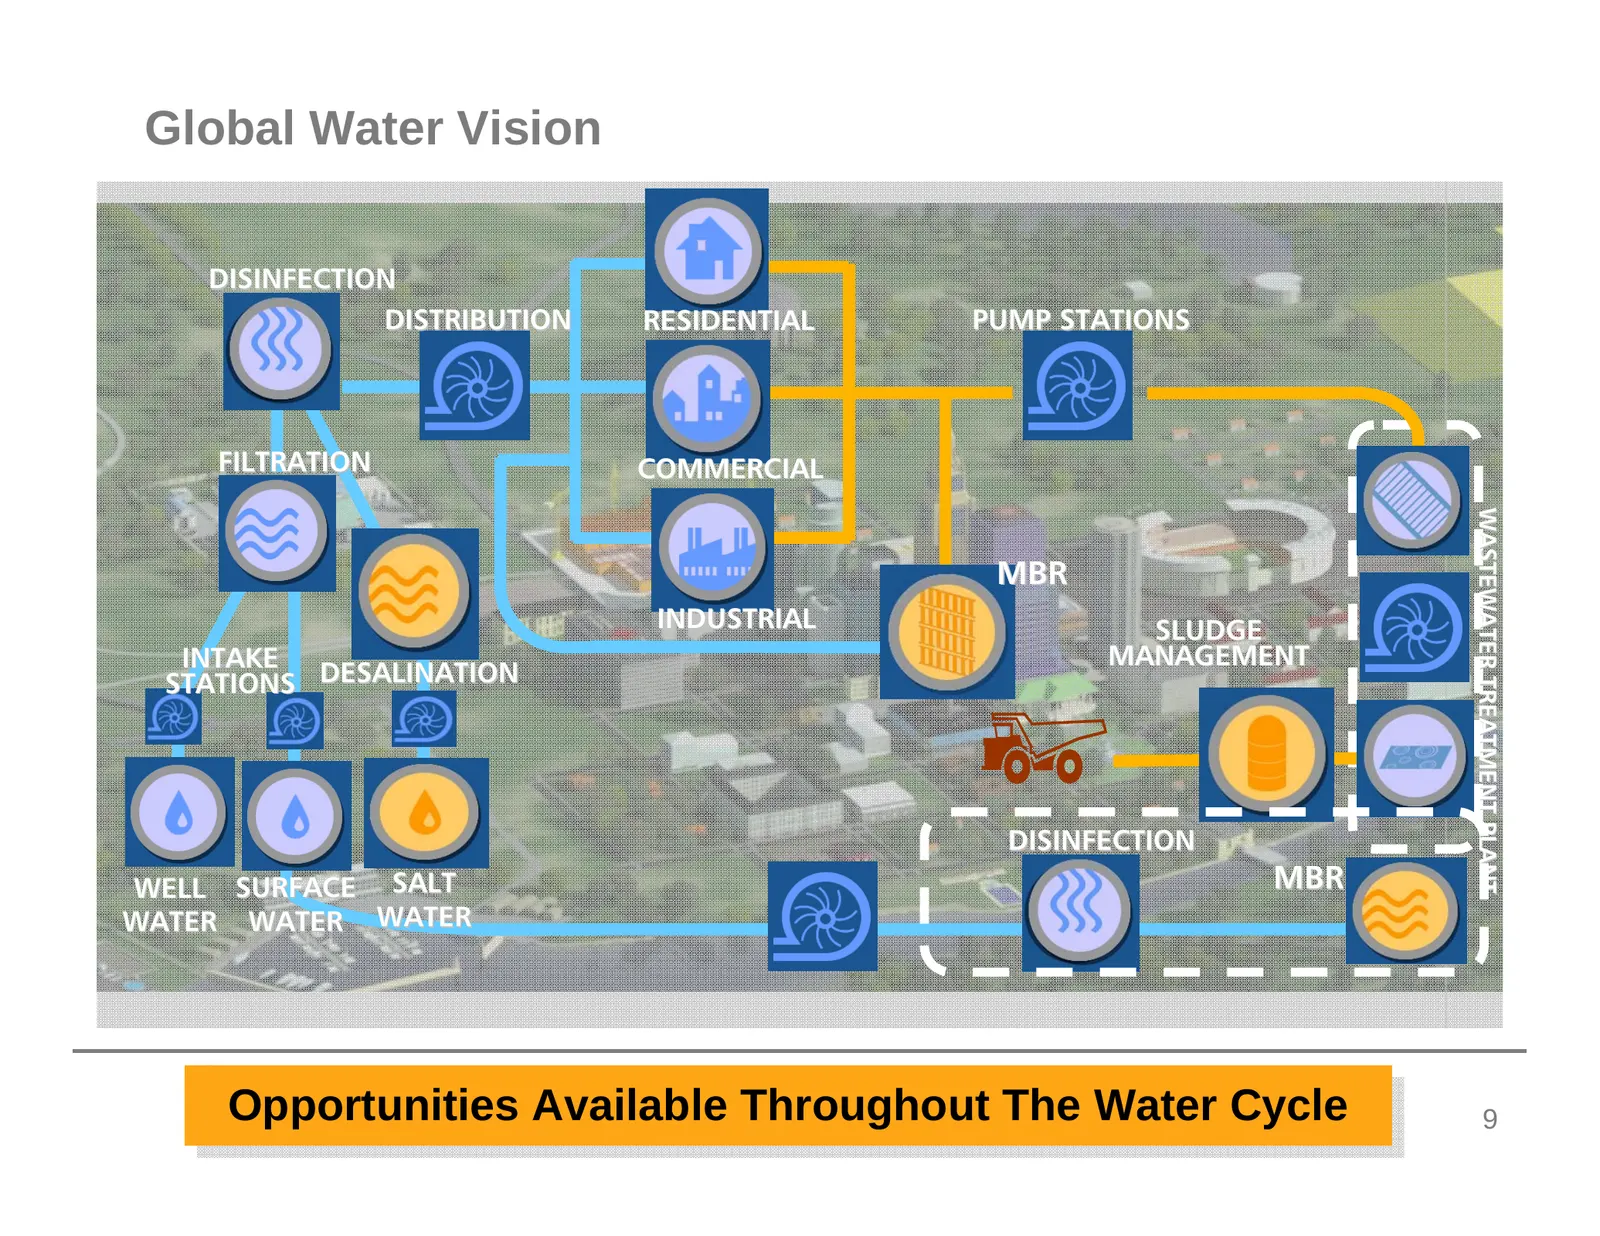
Global Water Vision DISINFECTION DISTRIBUTION RESIDENTIAL PUMP STATIONS FILTRATION COMMERCIAL WASTEWATER TREATMENT PLANT MBR INDUSTRIAL SLUDGE INTAKE MANAGEMENT STATIONS DESALINATION DISINFECTION WELL SURFACE SALT MBR WATER WATER WATER Opportunities OpportunitiesAvailable AvailableThroughout Through
Slide 11: Fluid Technology Growth Strategy
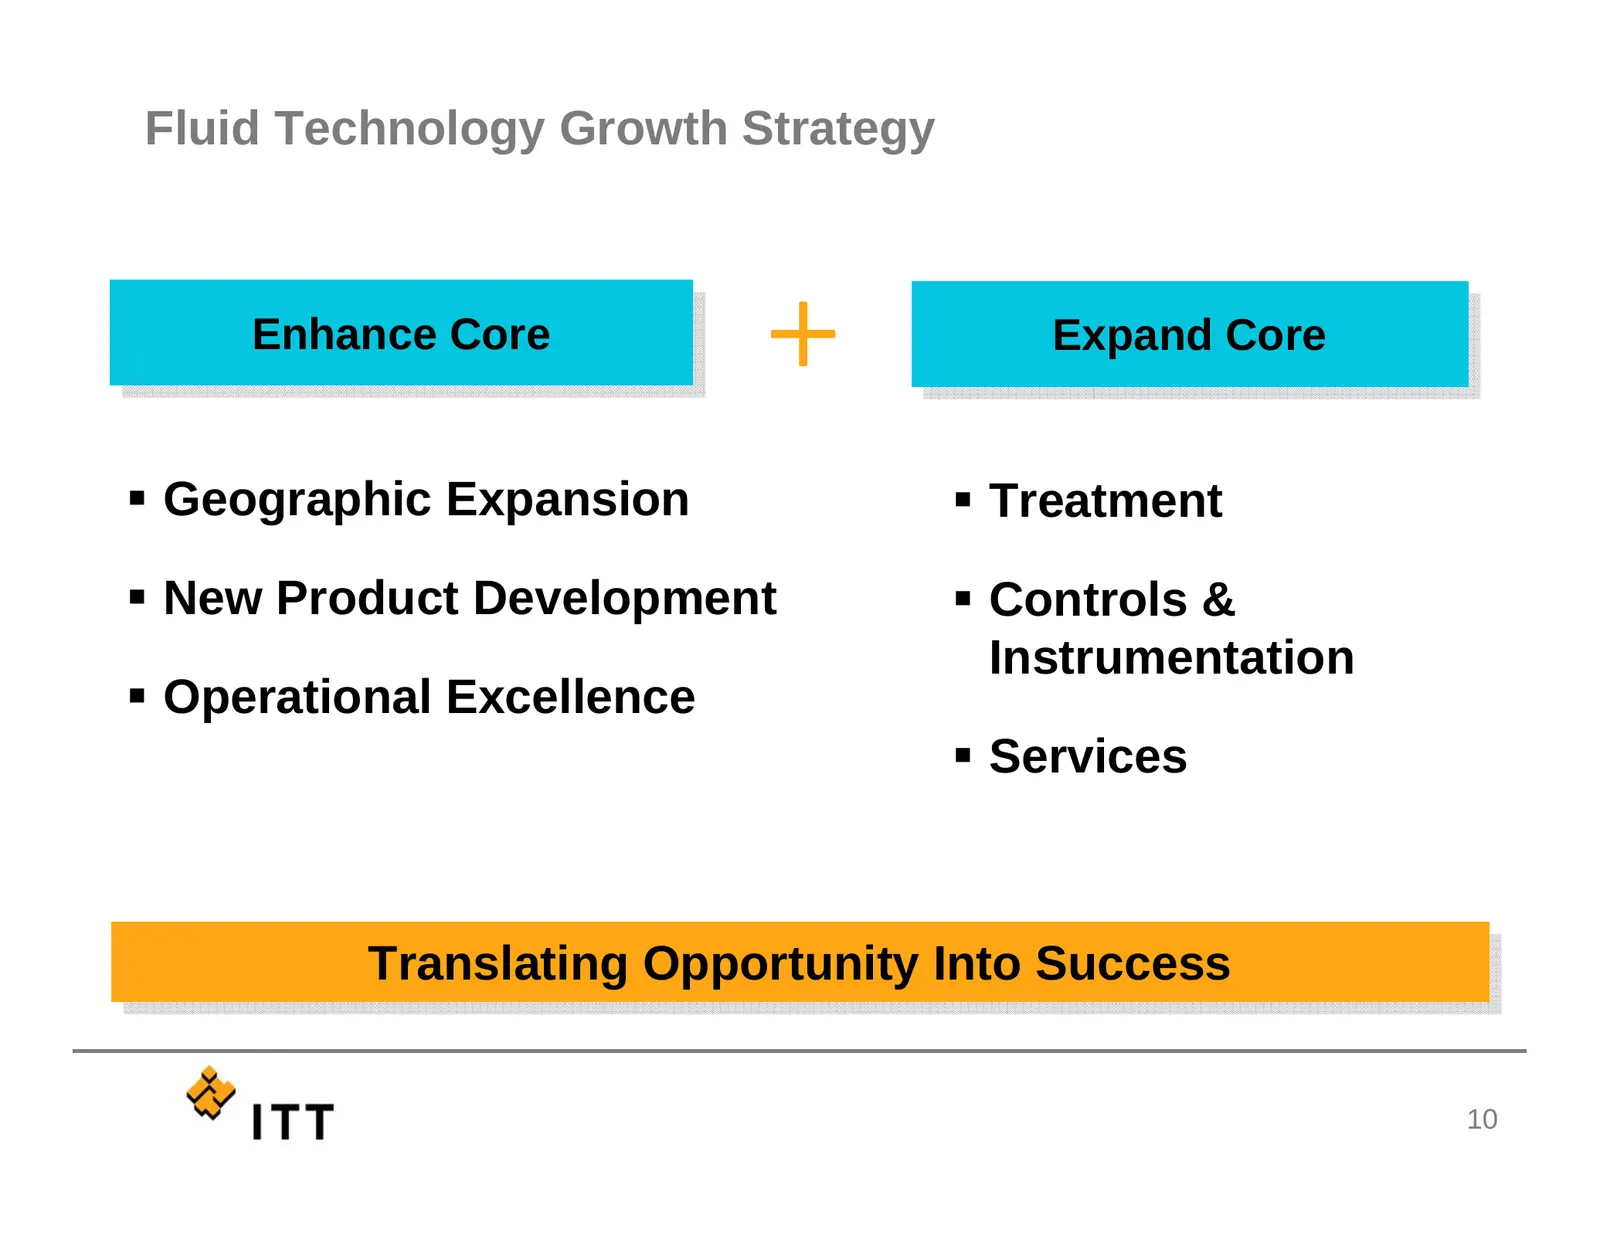
Fluid Technology Growth Strategy Enhance EnhanceCore Core + Expand ExpandCore Core Geographic Expansion Treatment New Product Development Controls & Instrumentation Operational Excellence Services Translating TranslatingOpportunity OpportunityInto IntoSuccess Success 10
Slide 12: Expanding The Core
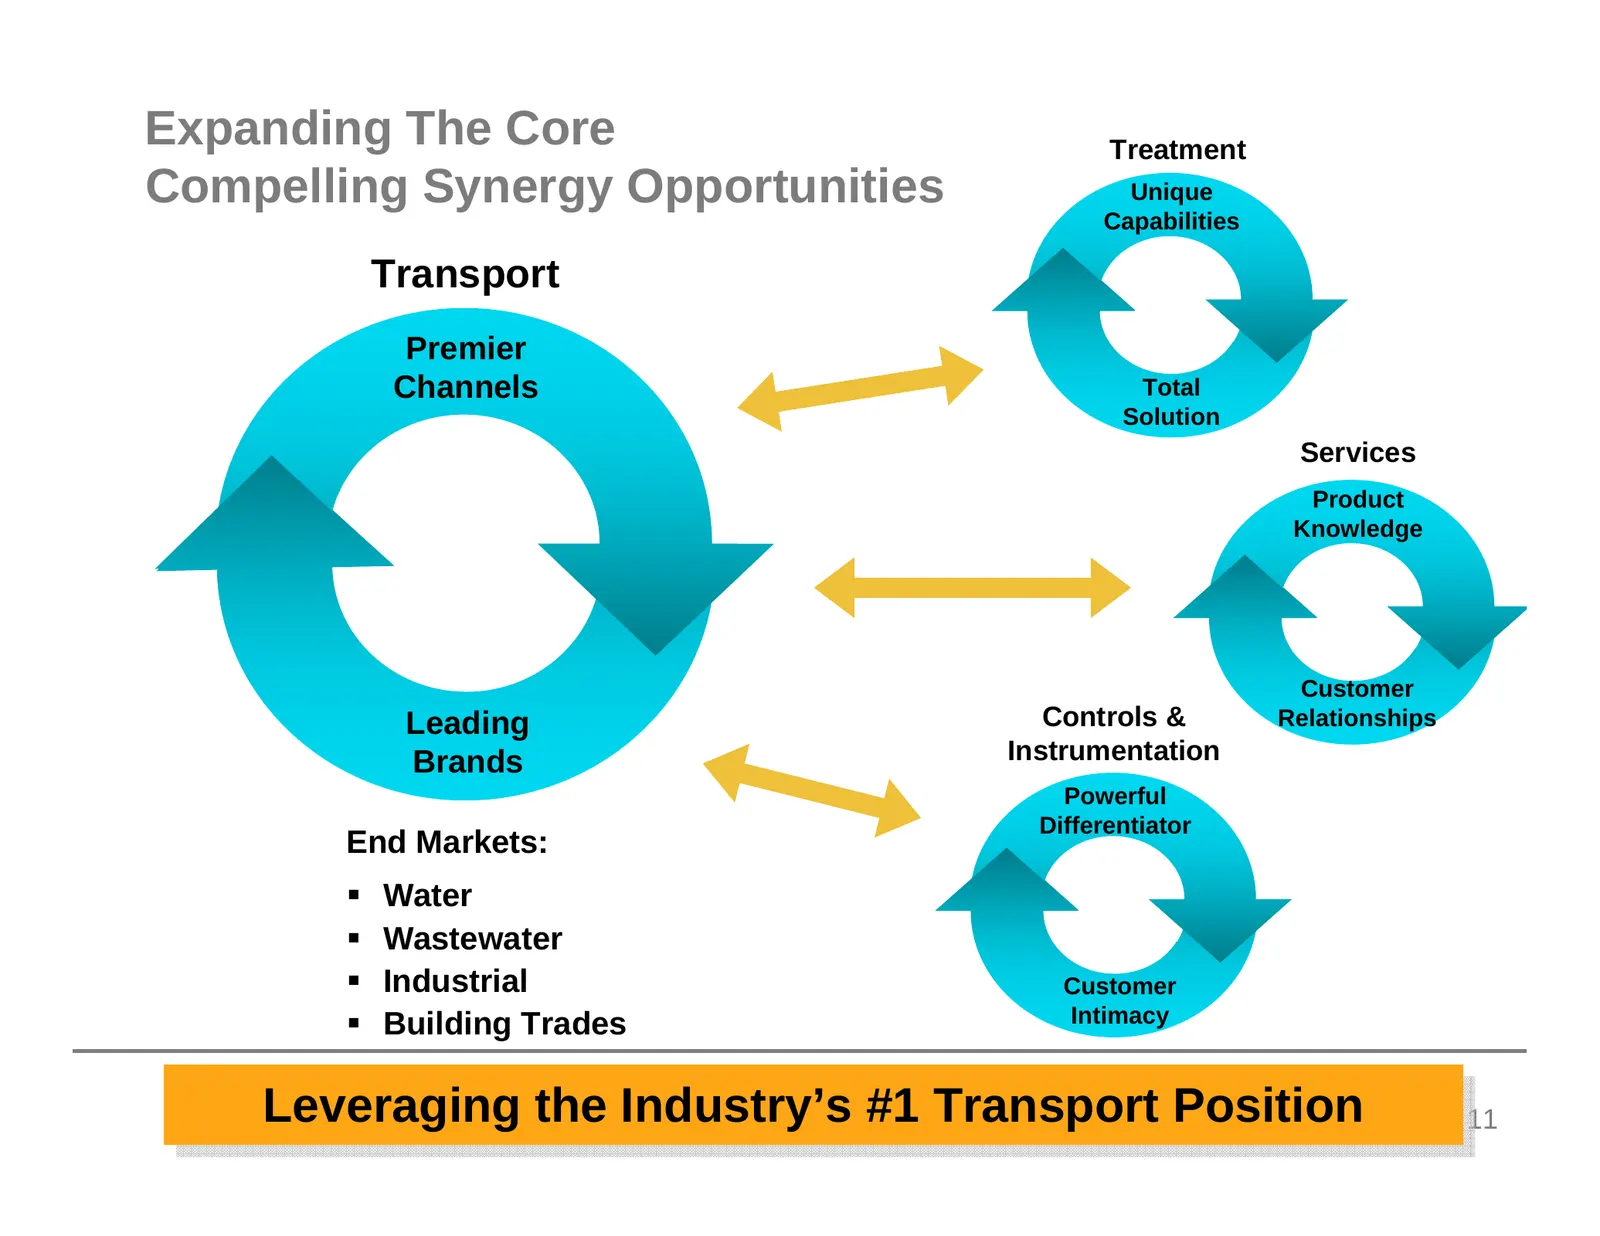
Expanding The Core Treatment Compelling Synergy Opportunities Unique Capabilities Transport Premier Channels Total Solution Services Product Knowledge Customer Leading Controls & Relationships Brands Instrumentation Powerful Differentiator End Markets: Water Wastewater Industrial Customer Bu
Slide 13: Leveraging Our Transport Position
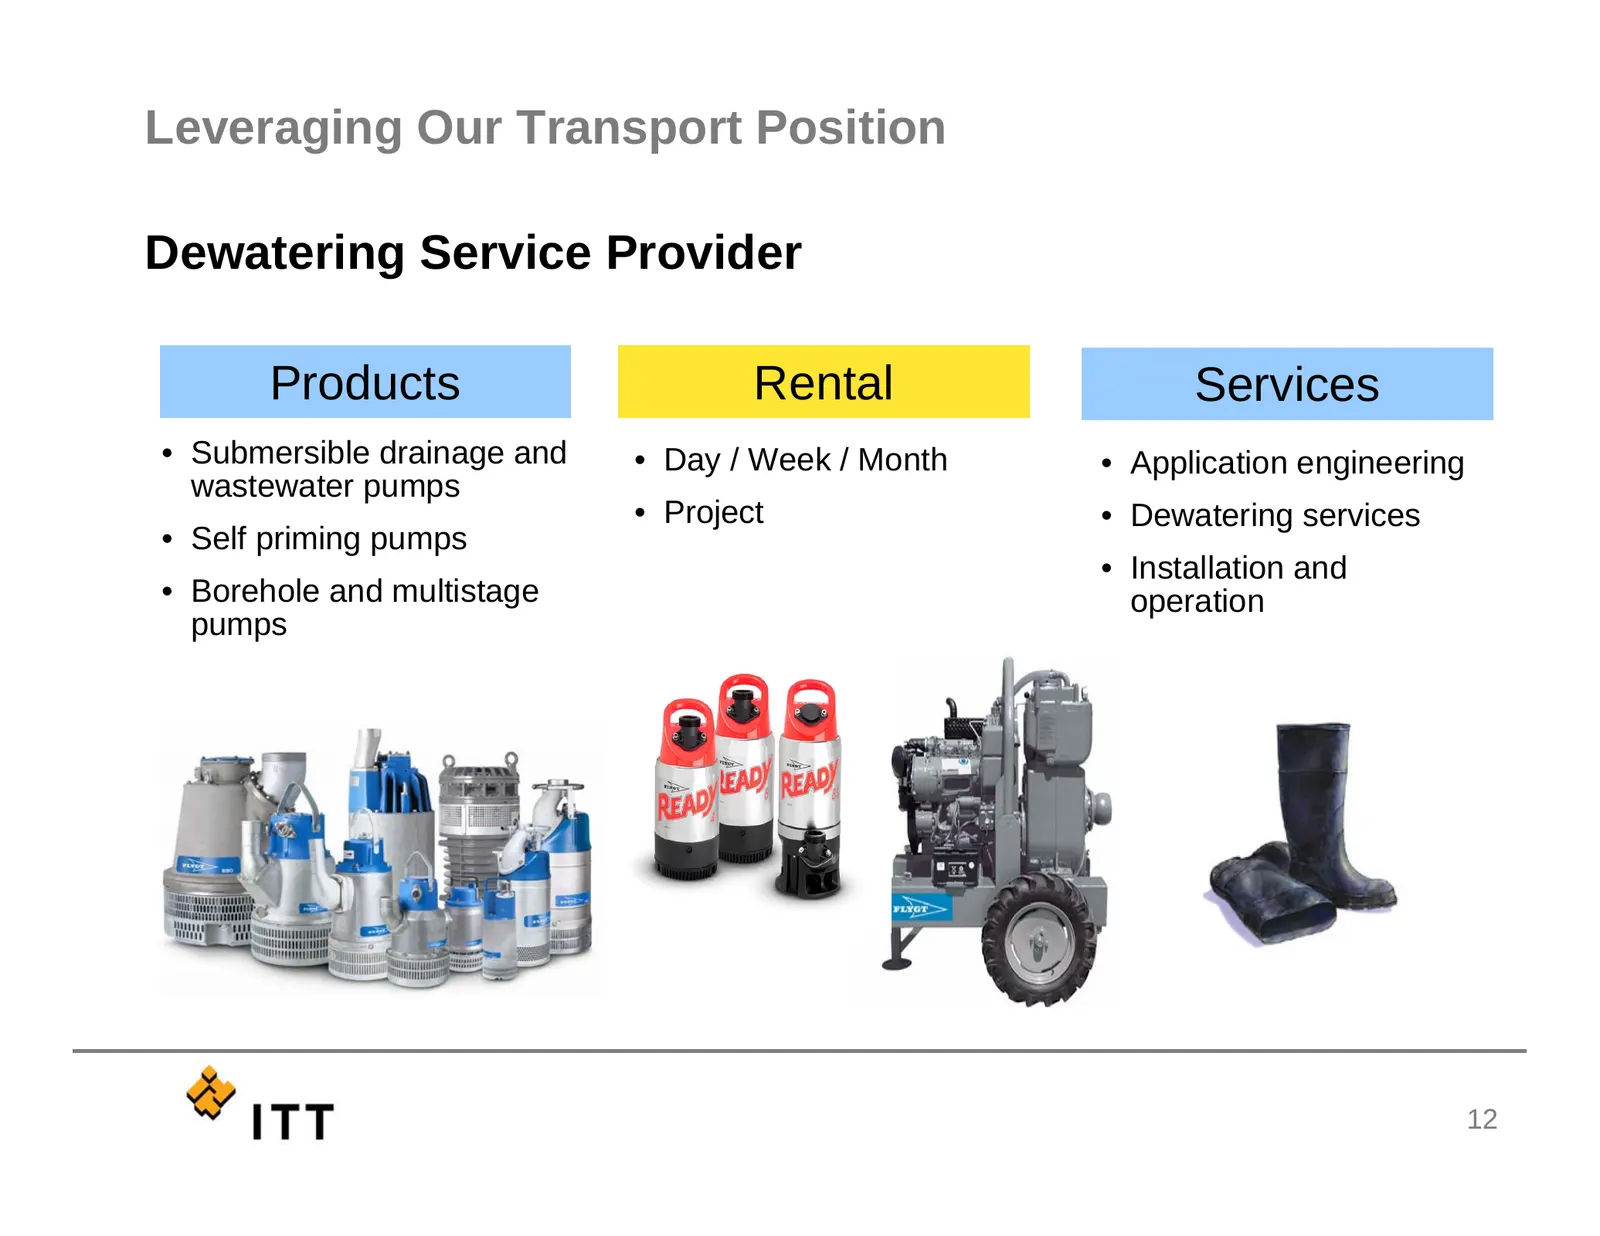
Leveraging Our Transport Position Dewatering Service Provider Products Rental Services • Submersible drainage and • Day / Week / Month • Application engineering wastewater pumps • Project • Dewatering services • Self priming pumps • Installation and • Borehole and multistage operation pumps 12
Slide 14: Industry Leading Water/Wastewater Capabilities
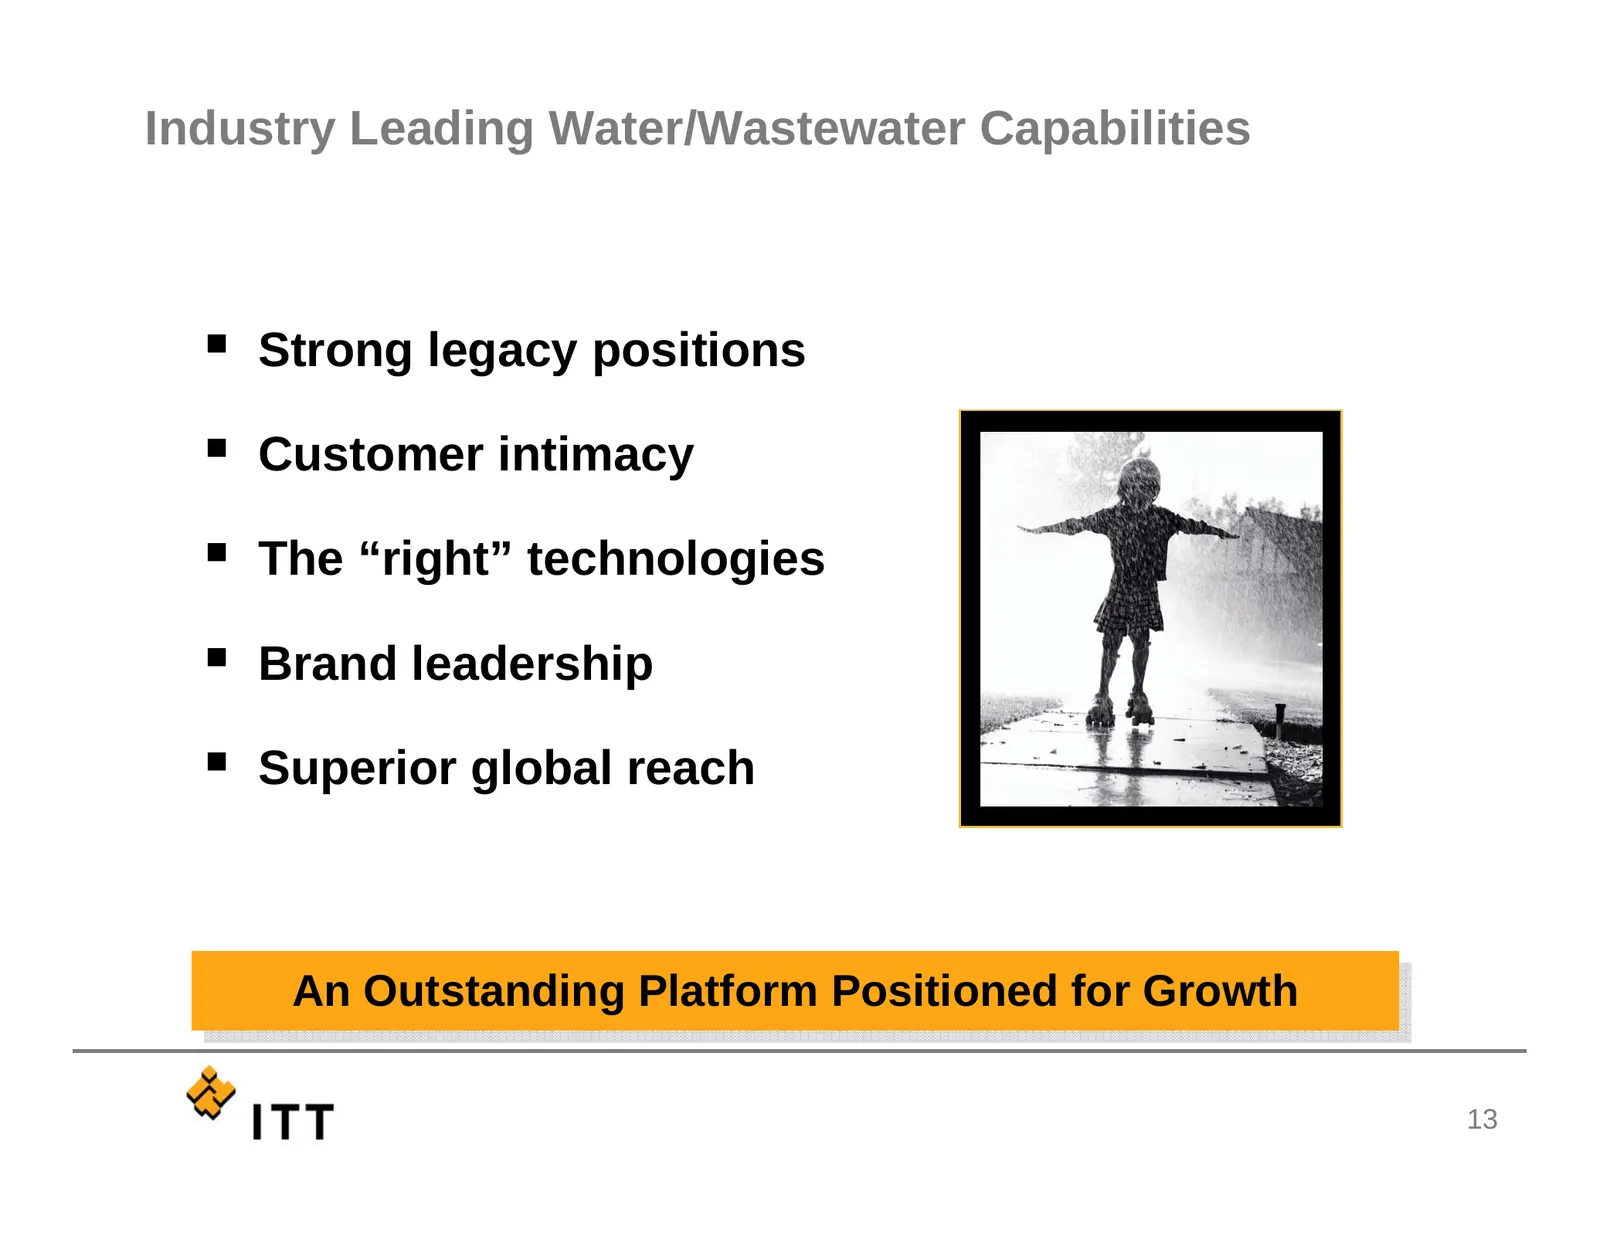
Industry Leading Water/Wastewater Capabilities Strong legacy positions Customer intimacy The “right” technologies Brand leadership Superior global reach An AnOutstanding OutstandingPlatform PlatformPositioned Positionedfor forGrowth Growth 13
Slide 15: Defense
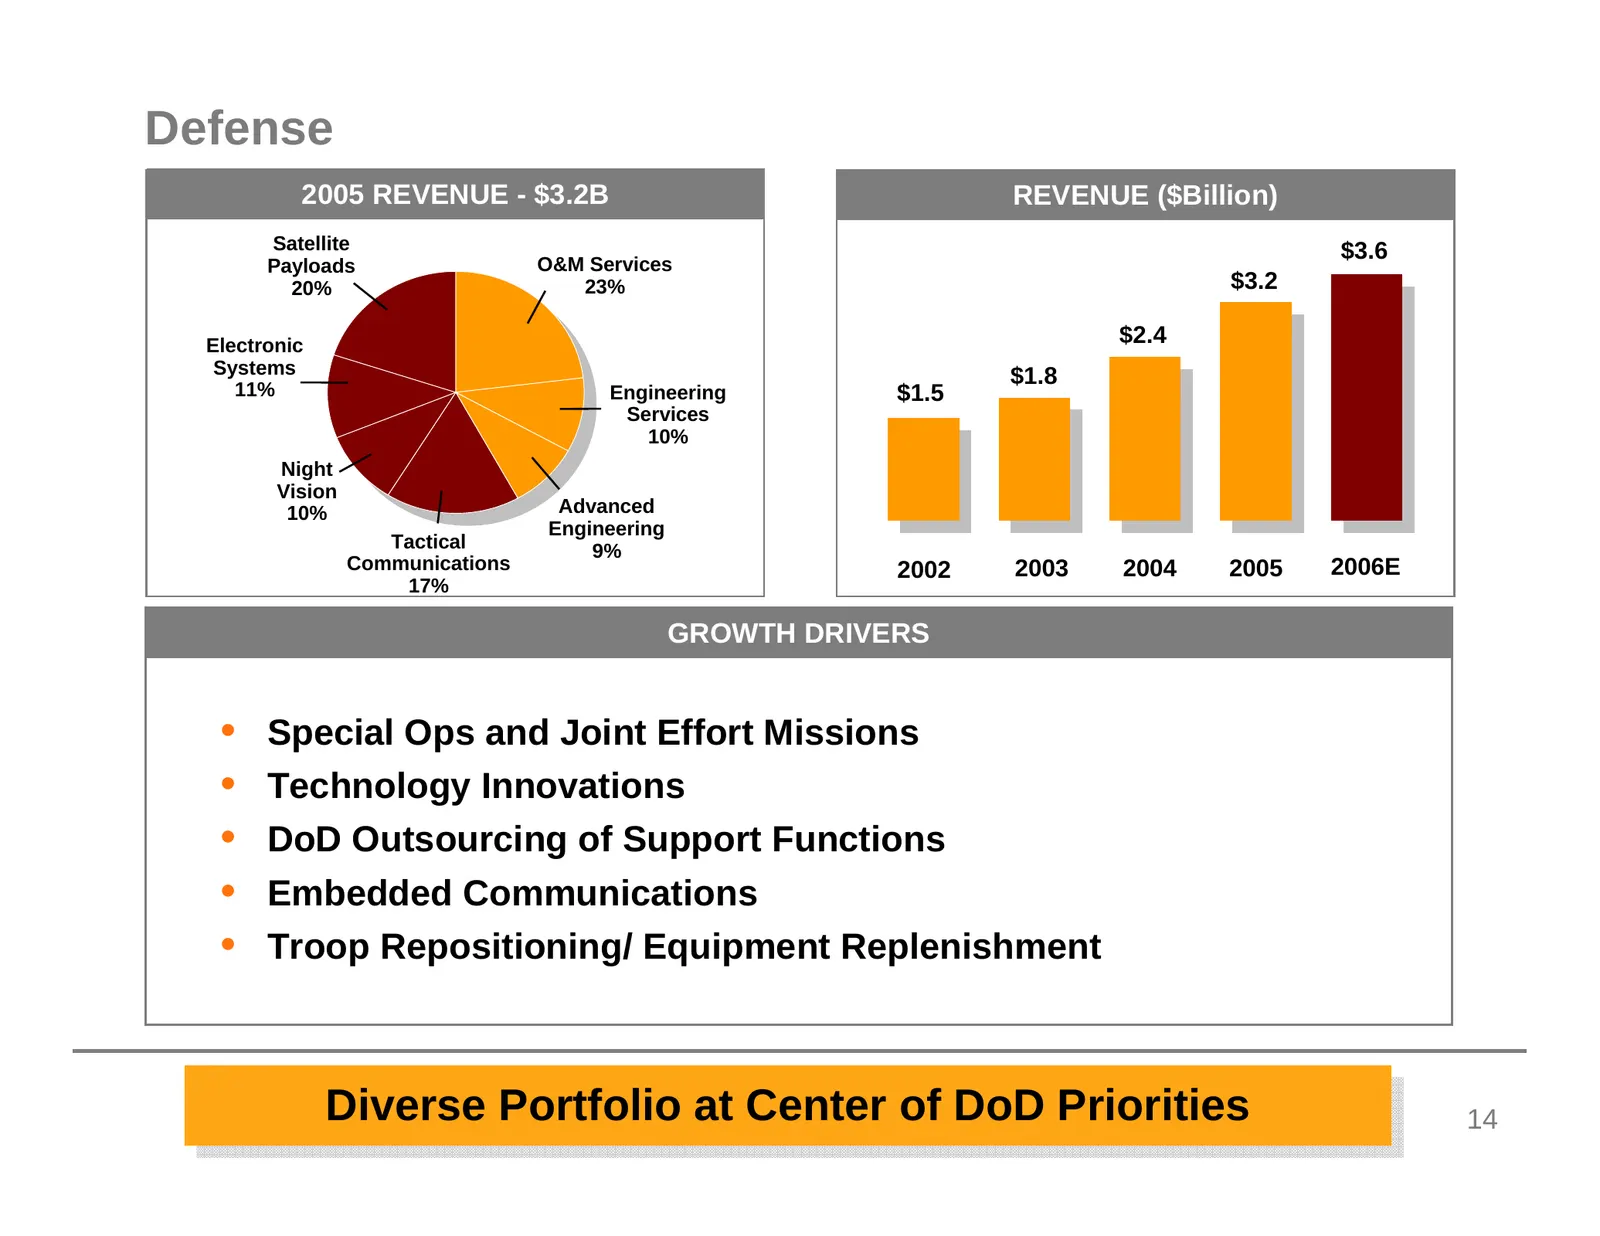
Defense 2005 REVENUE - $3.2B REVENUE ($Billion) Satellite $3.6 Payloads O&M Services 20% 23% $3.2 Electronic $2.4 Systems $1.8 11% Engineering $1.5 Services 10% Night Vision 10% Advanced Engineering Tactical 9% Communications 2002 2003 2004 2005 2006E 17% GROWTH DRIVERS • Special Ops and Joint Effor
Slide 16: Defense Electronics & Services 2006 Outlook Highlights
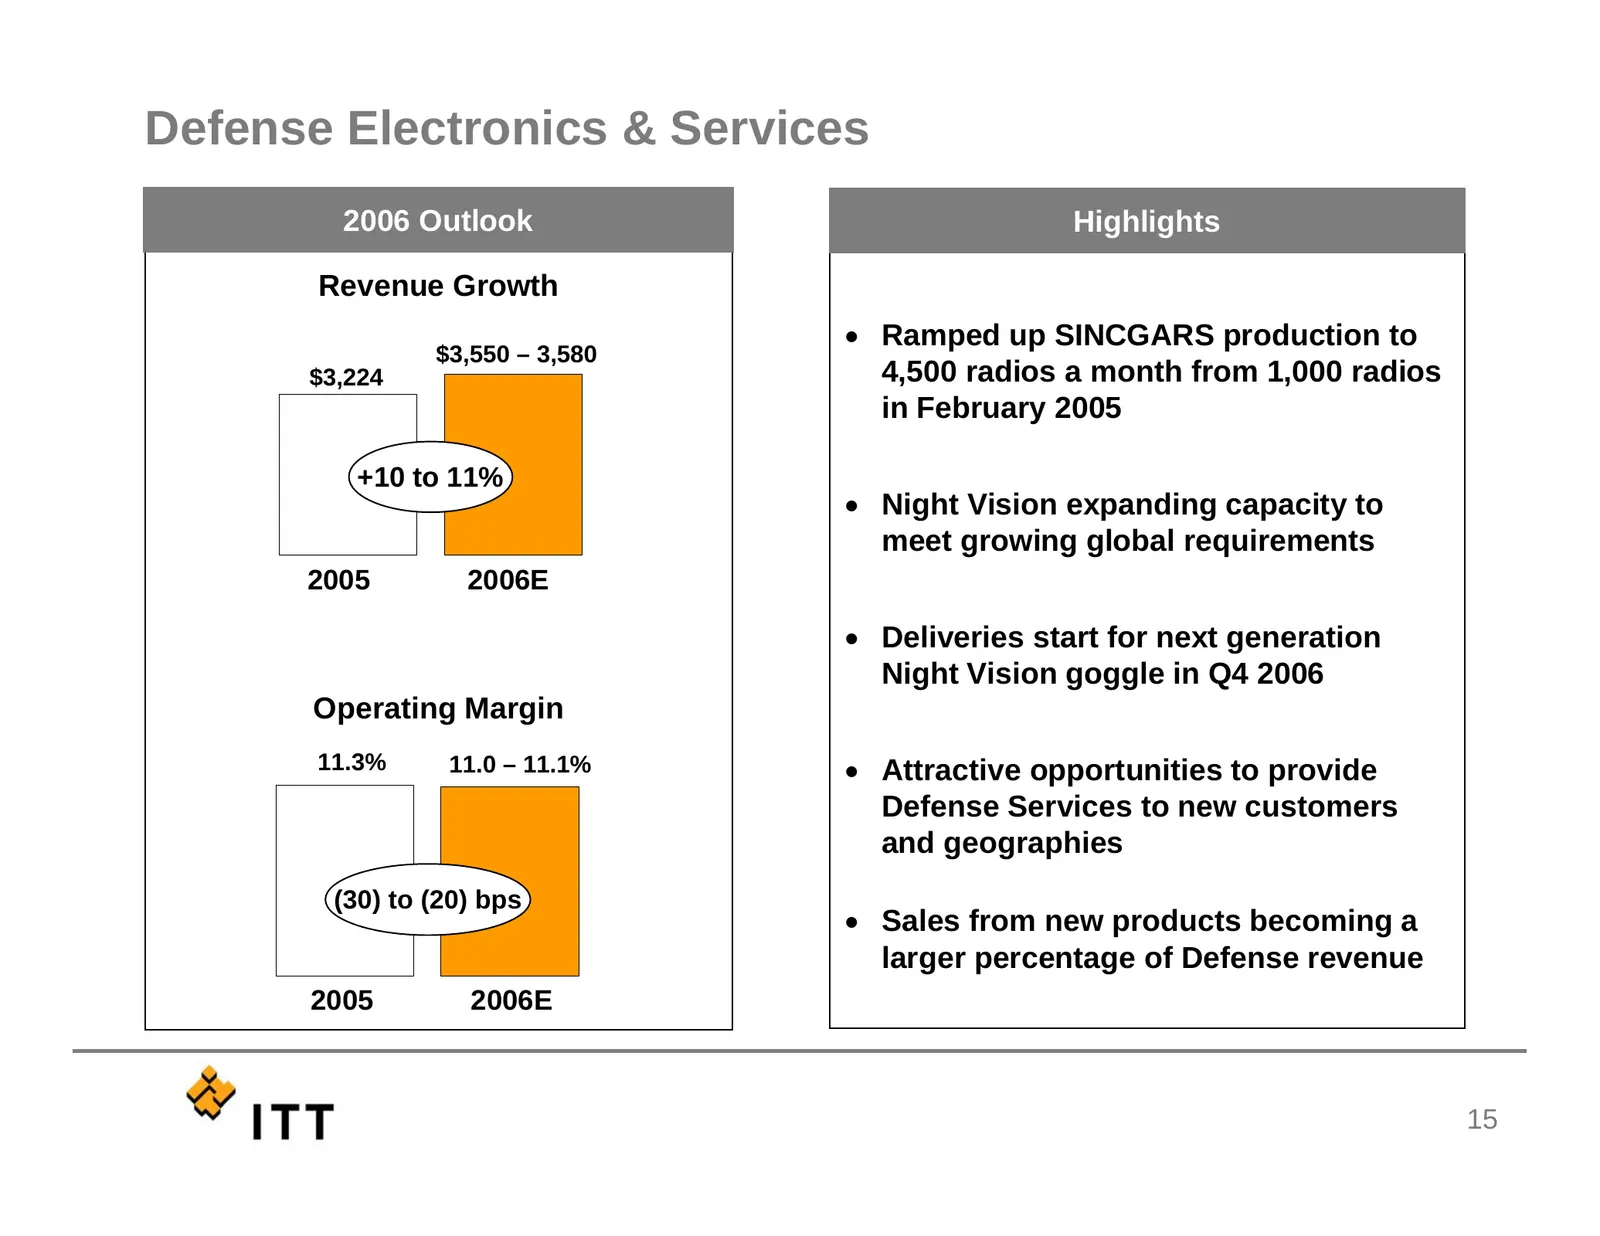
Defense Electronics & Services 2006 Outlook Highlights Revenue Growth • Ramped up SINCGARS production to $3,550 – 3,580 $3,224 4,500 radios a month from 1,000 radios in February 2005 +10 to 11% • Night Vision expanding capacity to meet growing global requirements 2005 2006E • Deliveries start for ne
Slide 17: Our Business Areas
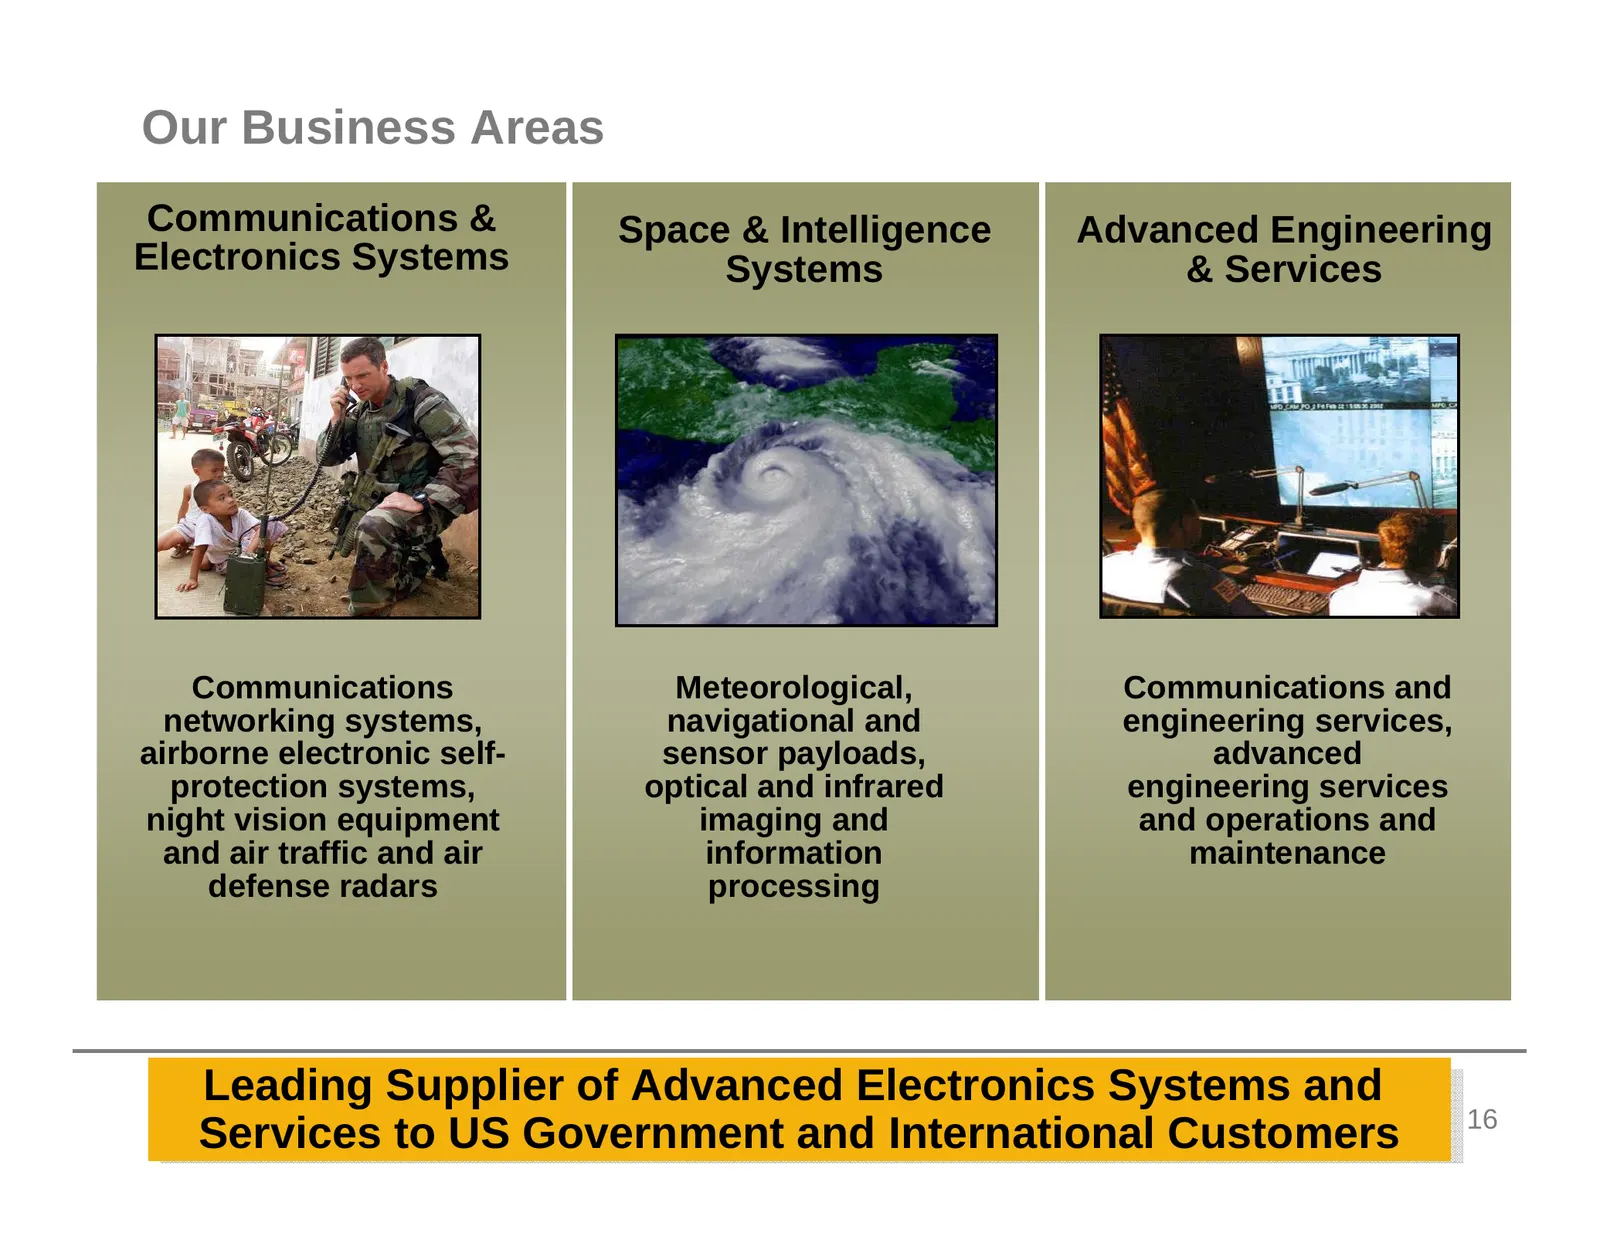
Our Business Areas Communications & Space & Intelligence Advanced Engineering Electronics Systems Systems & Services Communications Meteorological, Communications and networking systems, navigational and engineering services, airborne electronic self- sensor payloads, advanced protection systems, op
Slide 18: Significant Market Expansion Opportunities
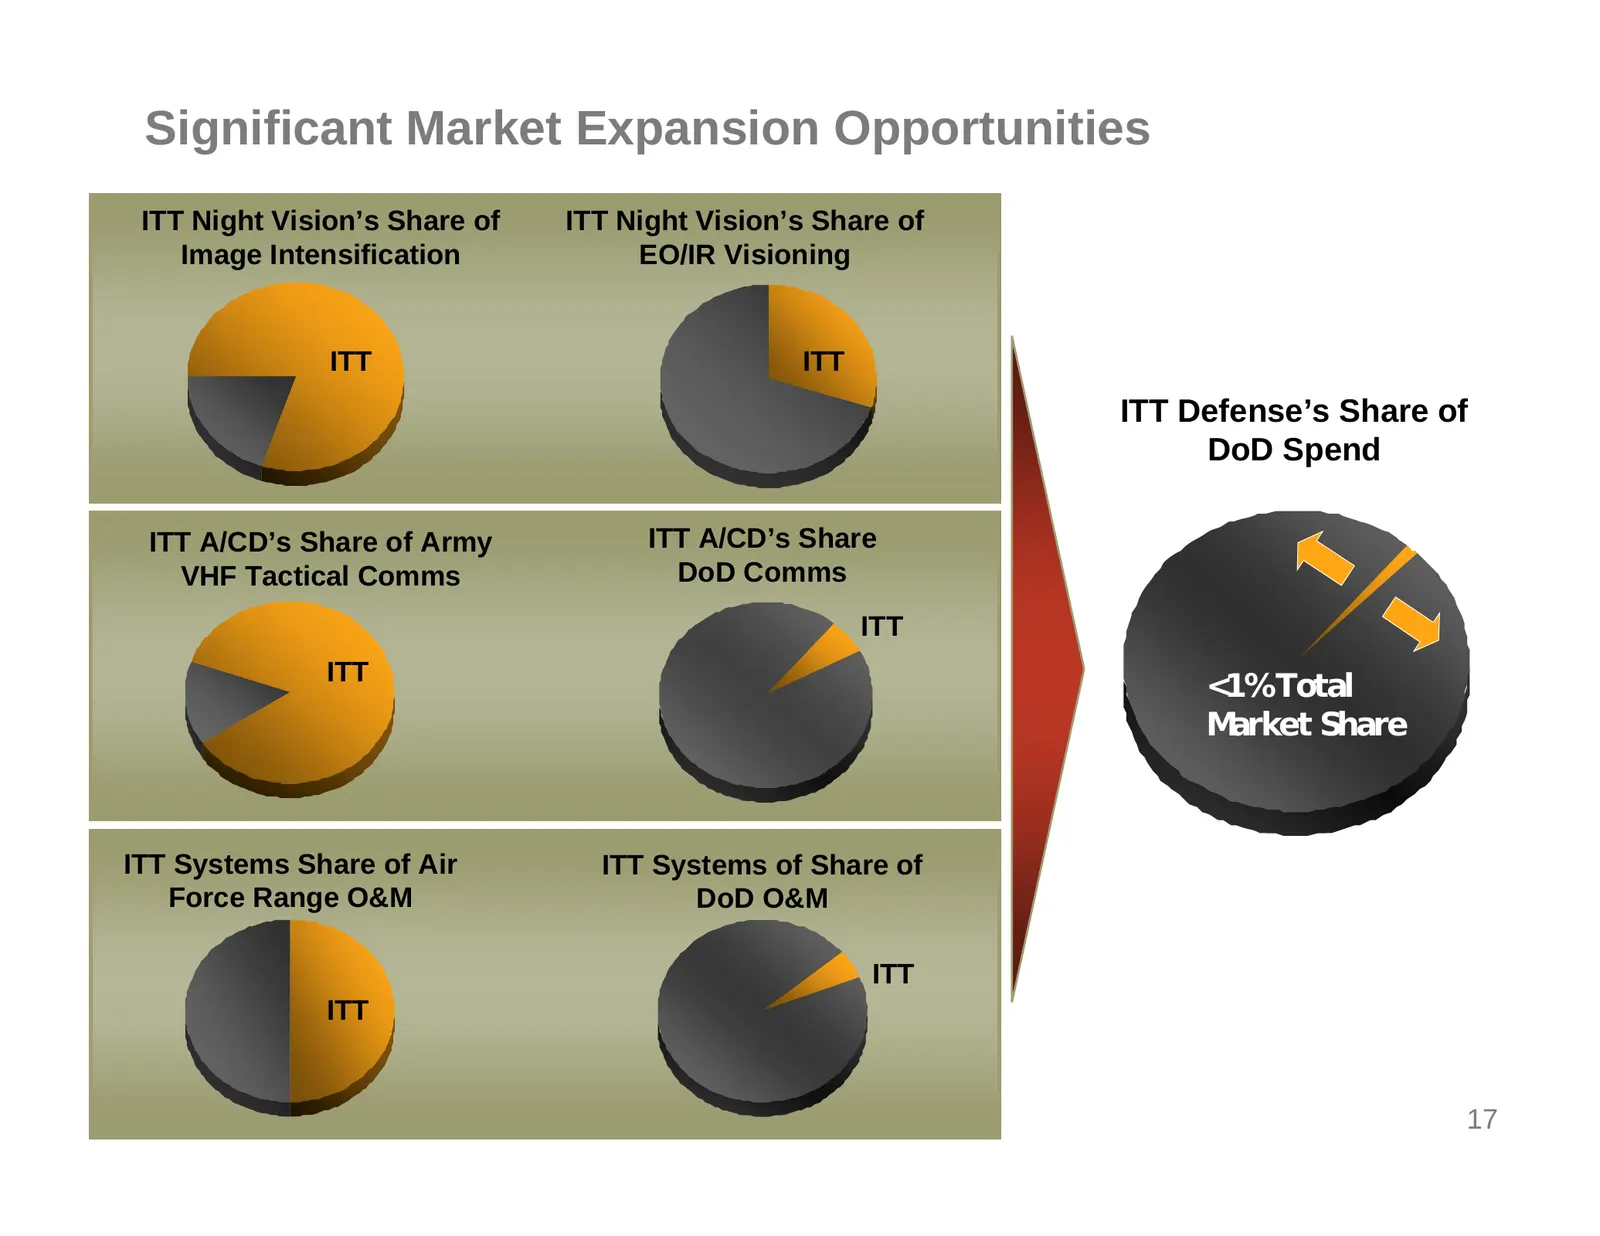
Significant Market Expansion Opportunities ITT Night Vision’s Share of ITT Night Vision’s Share of Image Intensification EO/IR Visioning ITT ITT ITT Defense’s Share of DoD Spend ITT A/CD’s Share of Army ITT A/CD’s Share ITT VHF Tactical Comms DoD Comms ITT ITT <1% Total Market Share ITT Systems Shar
Slide 19: Defense Electronics Growth Strategy
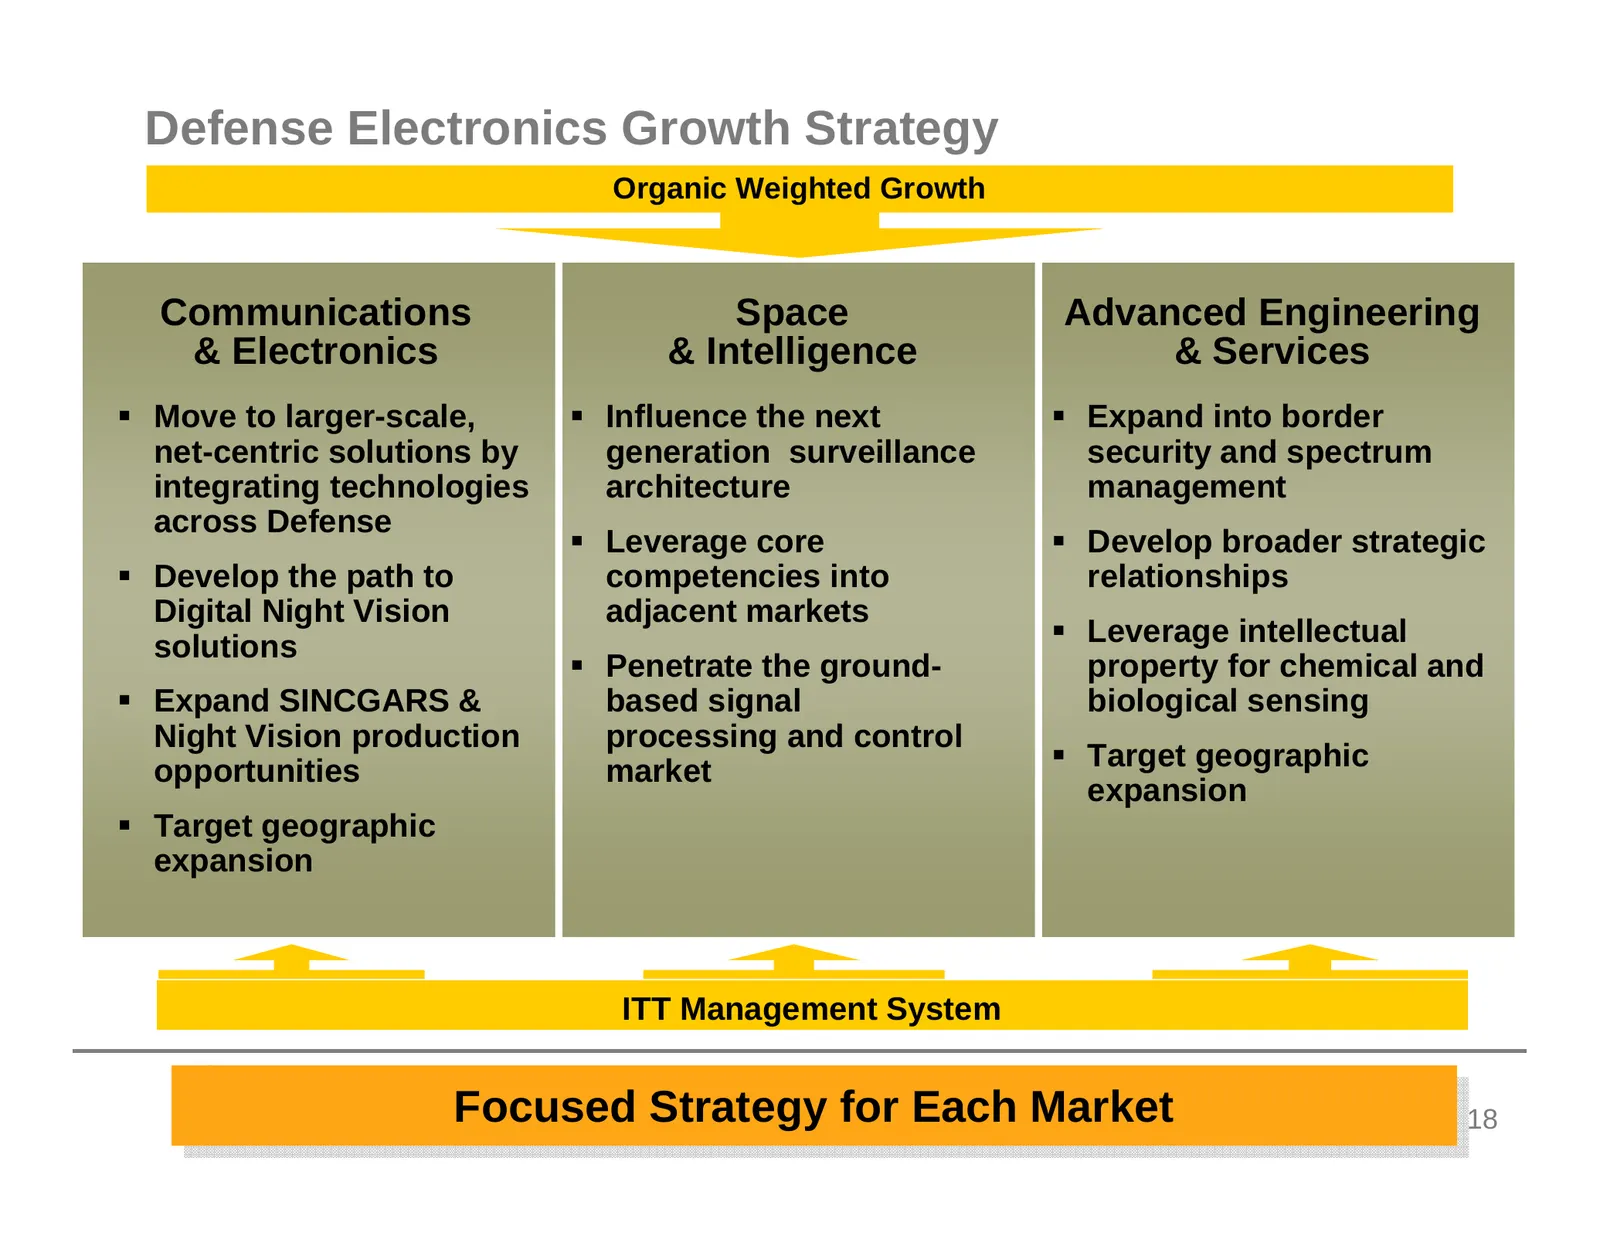
Defense Electronics Growth Strategy Organic Weighted Growth Communications Space Advanced Engineering & Electronics & Intelligence & Services Move to larger-scale, Influence the next Expand into border net-centric solutions by generation surveillance security and spectrum integrating technolog
Slide 20: Operational Excellence
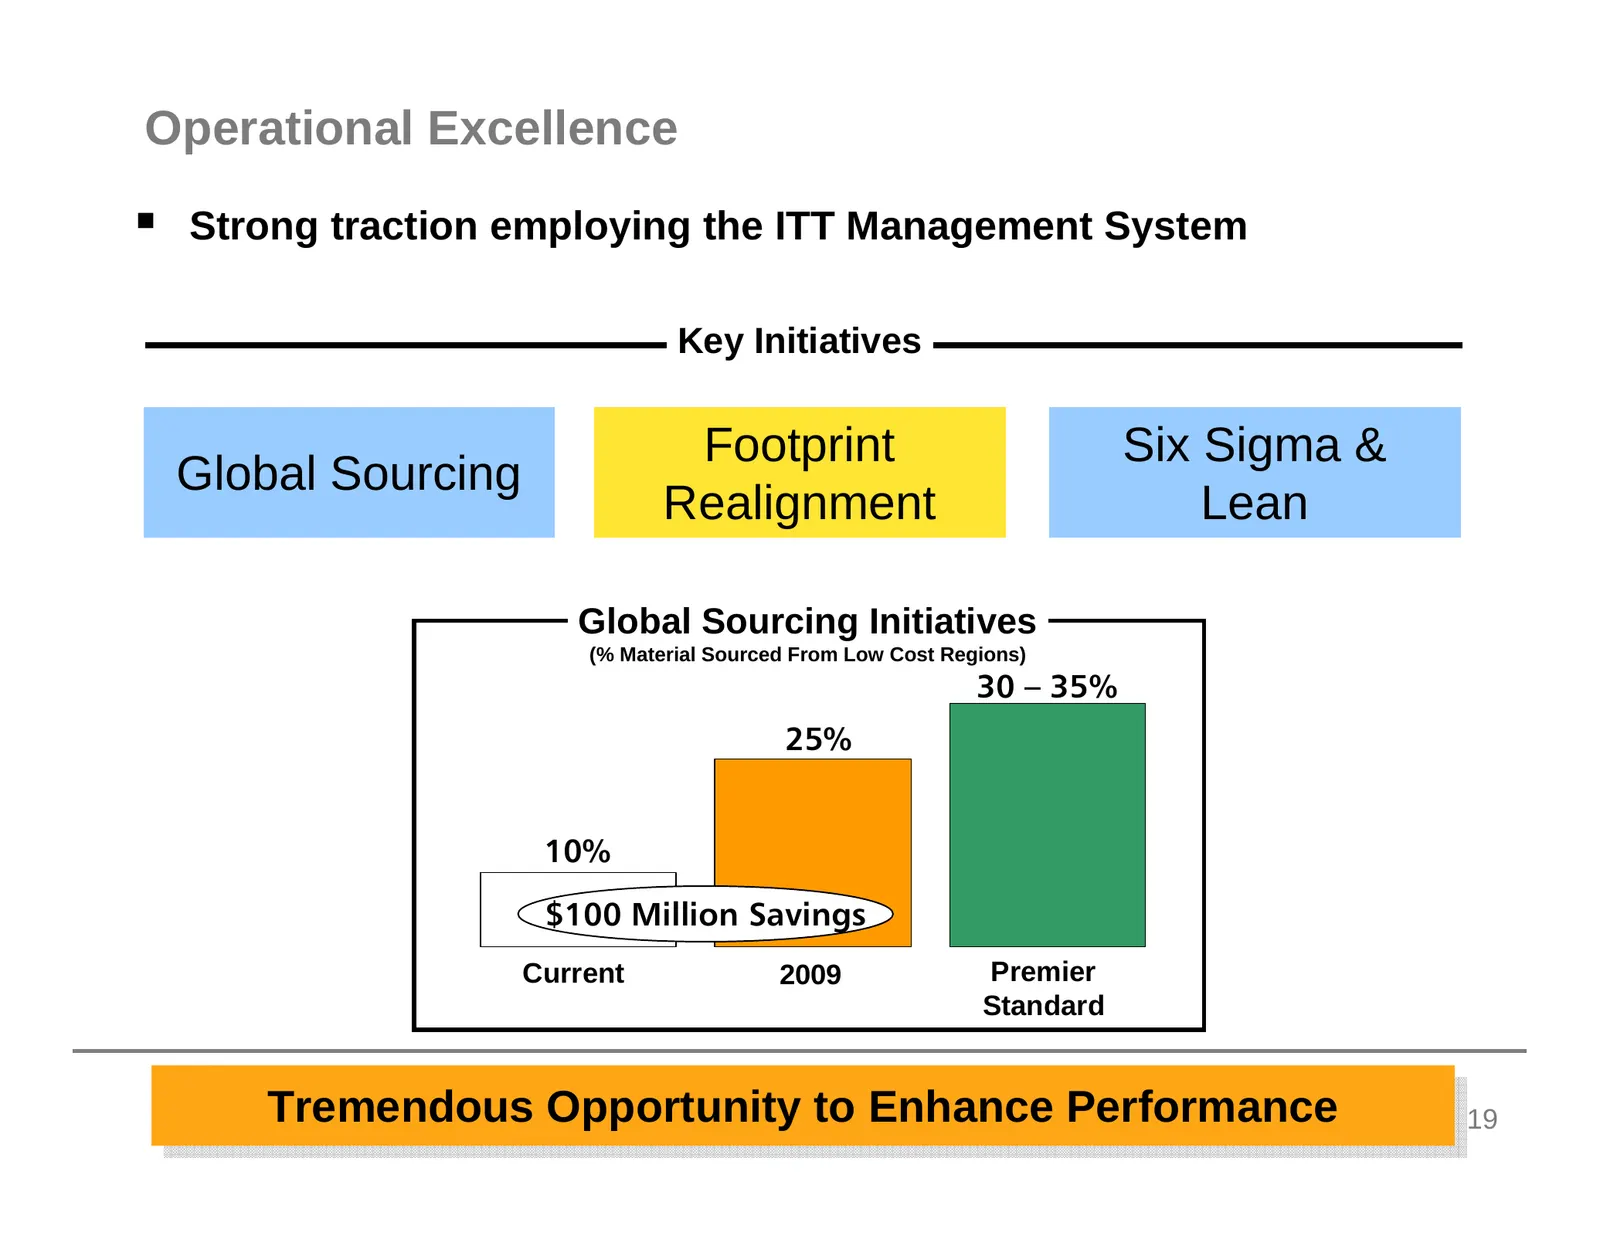
Operational Excellence Strong traction employing the ITT Management System Key Initiatives Footprint Six Sigma & Global Sourcing Realignment Lean Global Sourcing Initiatives (% Material Sourced From Low Cost Regions) 30 – 35% 25% 10% $100 Million Savings Current 2009 Premier Standard Tremendous Tr
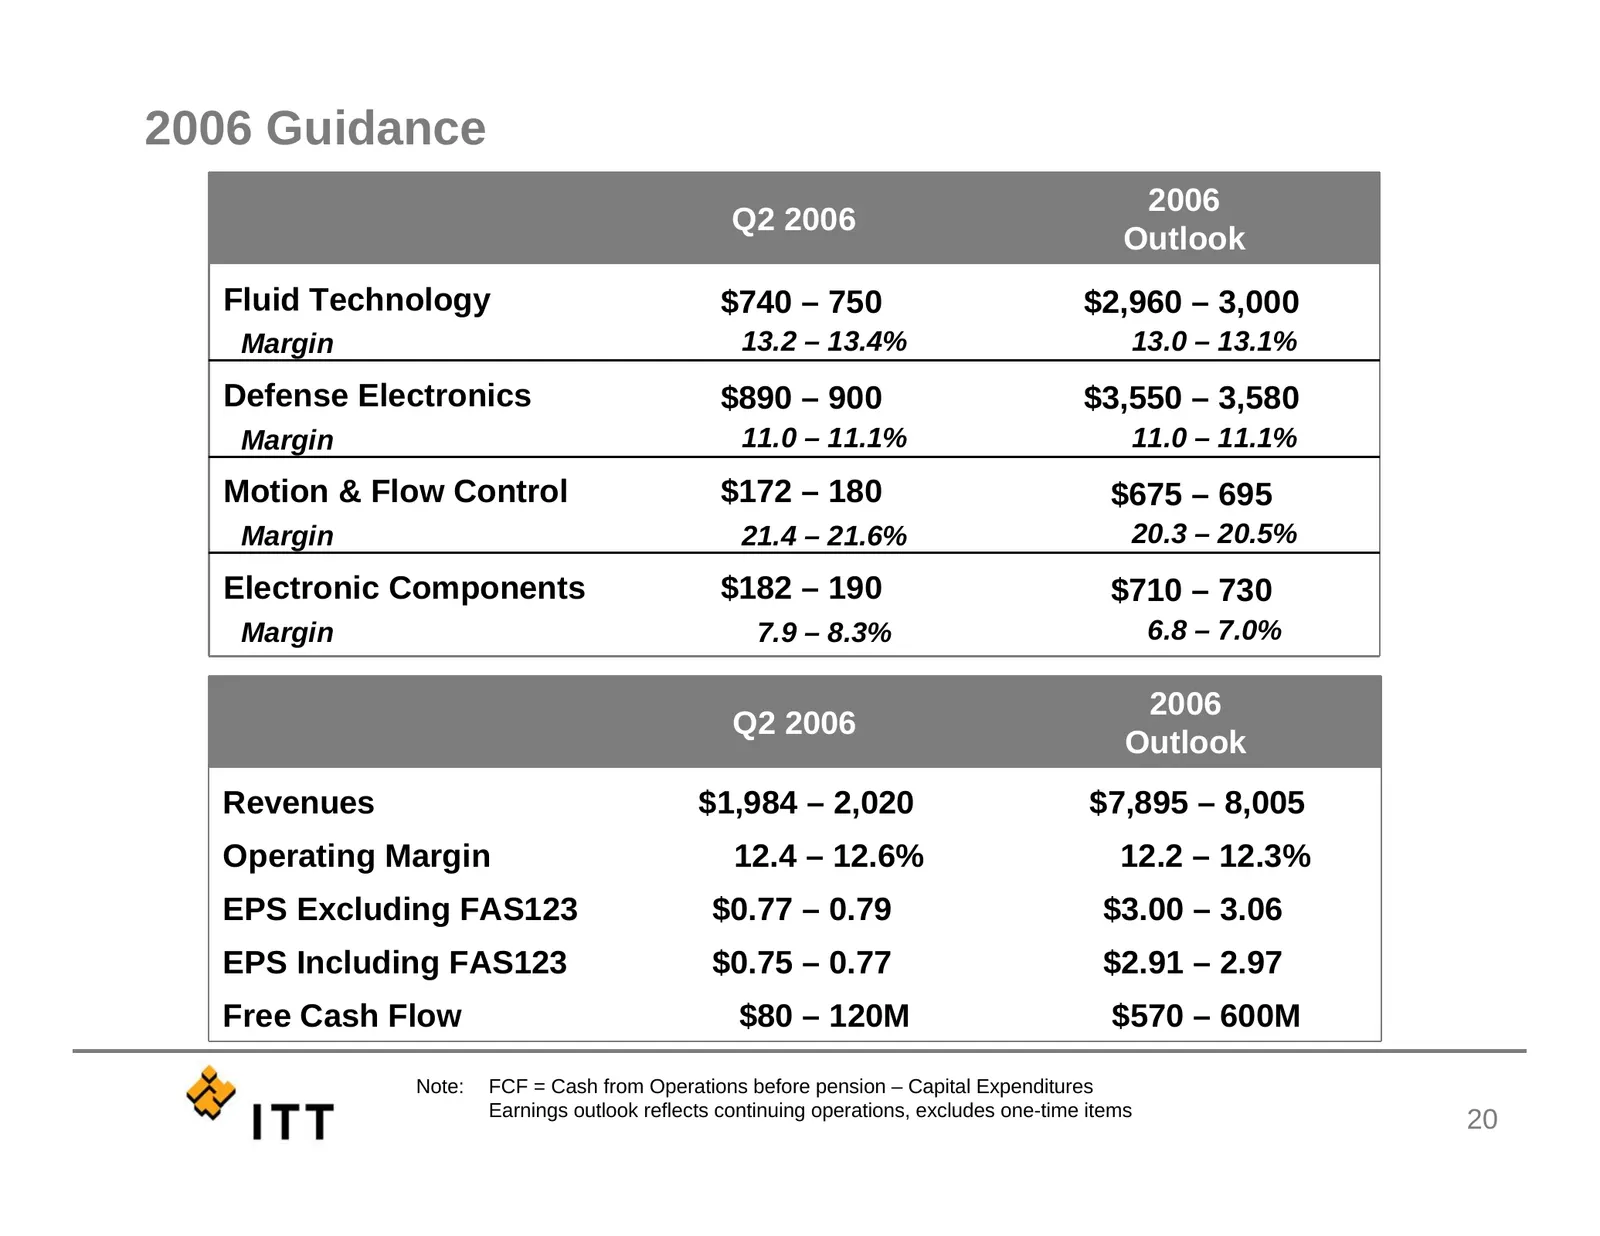
Slide 21: 2006 Guidance
2006 Guidance 2006 Q2 2006 Outlook Fluid Technology $740 – 750 $2,960 – 3,000 Margin 13.2 – 13.4% 13.0 – 13.1% Defense Electronics $890 – 900 $3,550 – 3,580 Margin 11.0 – 11.1% 11.0 – 11.1% Motion & Flow Control $172 – 180 $675 – 695 Margin 21.4 – 21.6% 20.3 – 20.5% Electronic Components $182 – 190
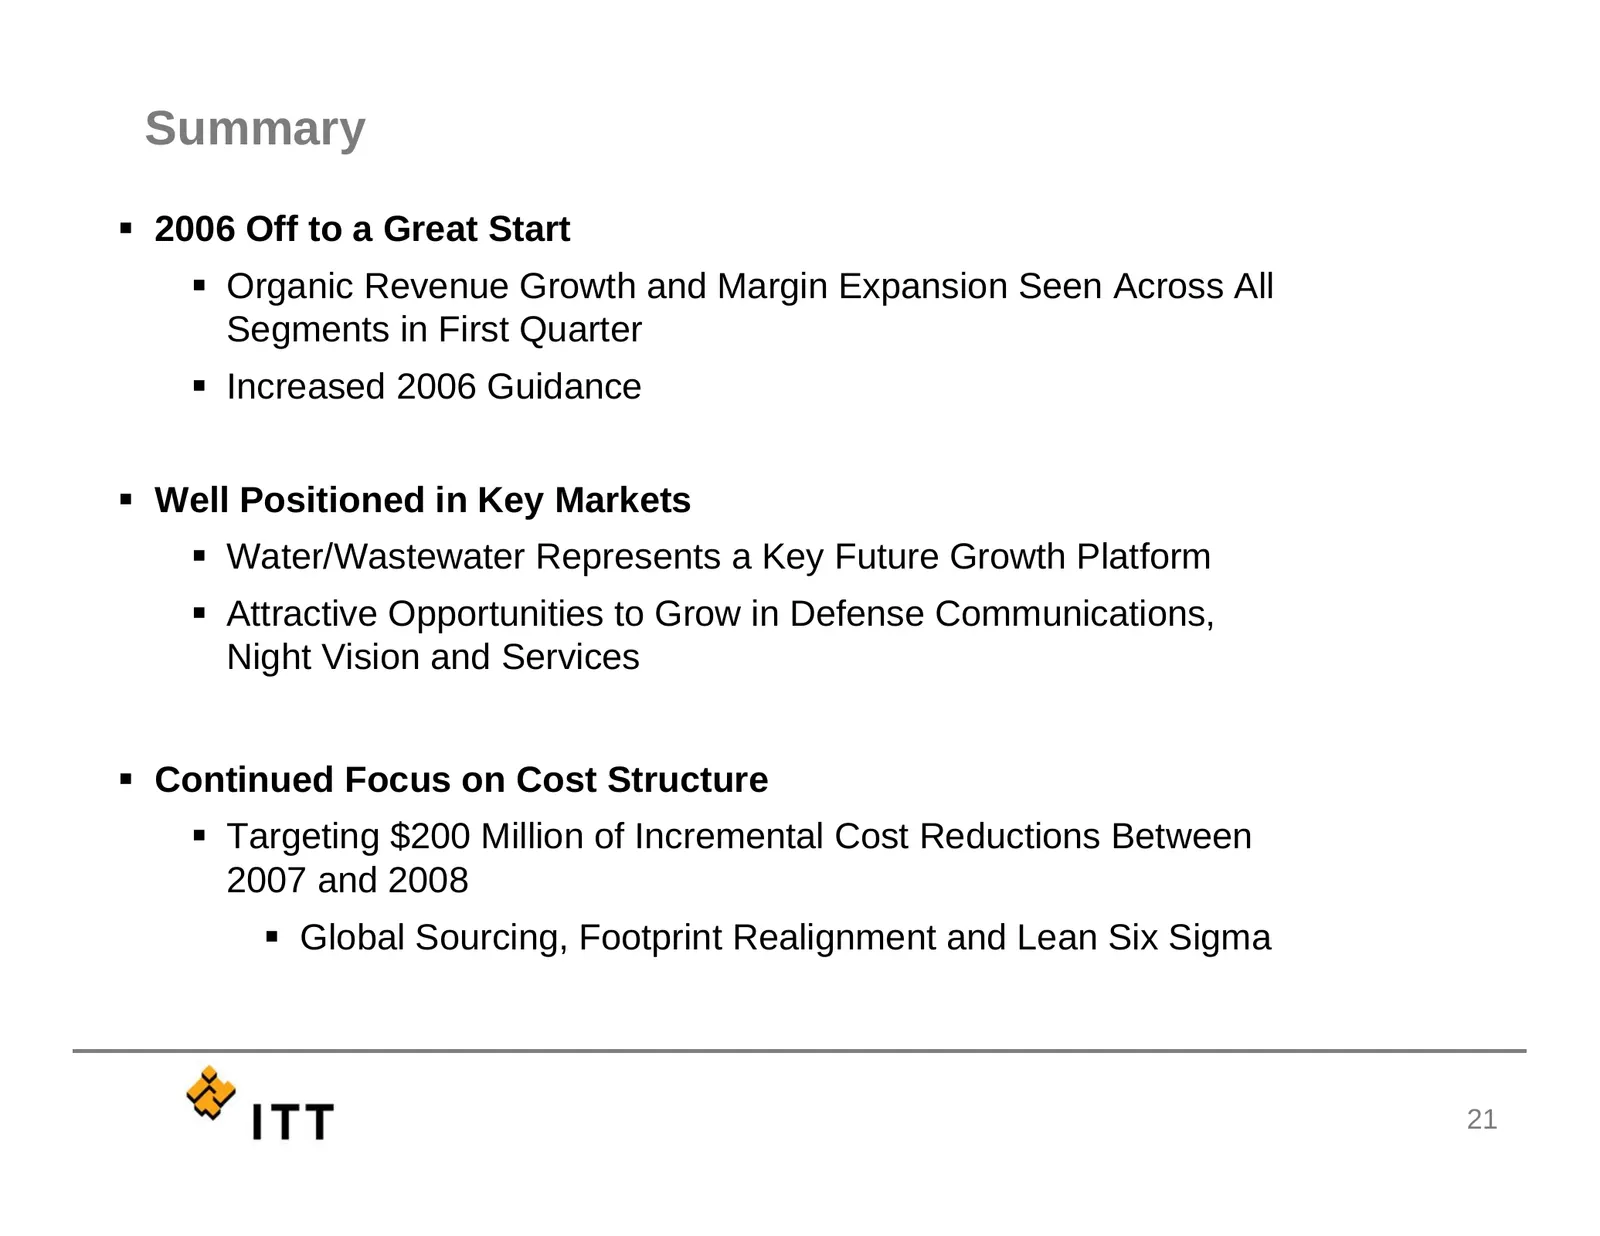
Slide 22: Summary
Summary 2006 Off to a Great Start Organic Revenue Growth and Margin Expansion Seen Across All Segments in First Quarter Increased 2006 Guidance Well Positioned in Key Markets Water/Wastewater Represents a Key Future Growth Platform Attractive Opportunities to Grow in Defense Communicatio

Slide 23
Source: Internet Archive copy of itt.com
More decks from ITT Inc.
 D.A. Davidson 25th Annual Diversified Industrials & Services Conference (September 2026)13 slides · Sep 24, 2026
 Q2 2026 Earnings Presentation19 slides · Aug 6, 2026
 Q1 2026 Earnings Presentation22 slides · May 6, 2026
 Q4 2025 Earnings Presentation21 slides · Feb 5, 2026
 Merger or Acquisition (December 2025)20 slides · Dec 5, 2025
 Q3 2025 Earnings Presentation15 slides · Oct 29, 2025