Timken Company (the) · NYSE:TKR
Timken Company (the) — The Timken Company — Morgan Stanley Investor Conference 2014
40 slides from Timken Company (the)'s conference presentation, Sep 15, 2014

Slide 1: Morgan Stanley Investor Conference
Morgan Stanley Investor Conference Laguna Beach, Calif. • September 15, 2014
Slide 2: Forward-Looking Statements
FORWARD-LOOKING STATEMENTS Certain statements in this presentation (including statements regarding the company's forecasts, beliefs, estimates and expectations) that are not historical in nature are "forward-looking" statements within the meaning of the Private Securities Litigation Reform Act of 19
Slide 3: Company Overview and Direction
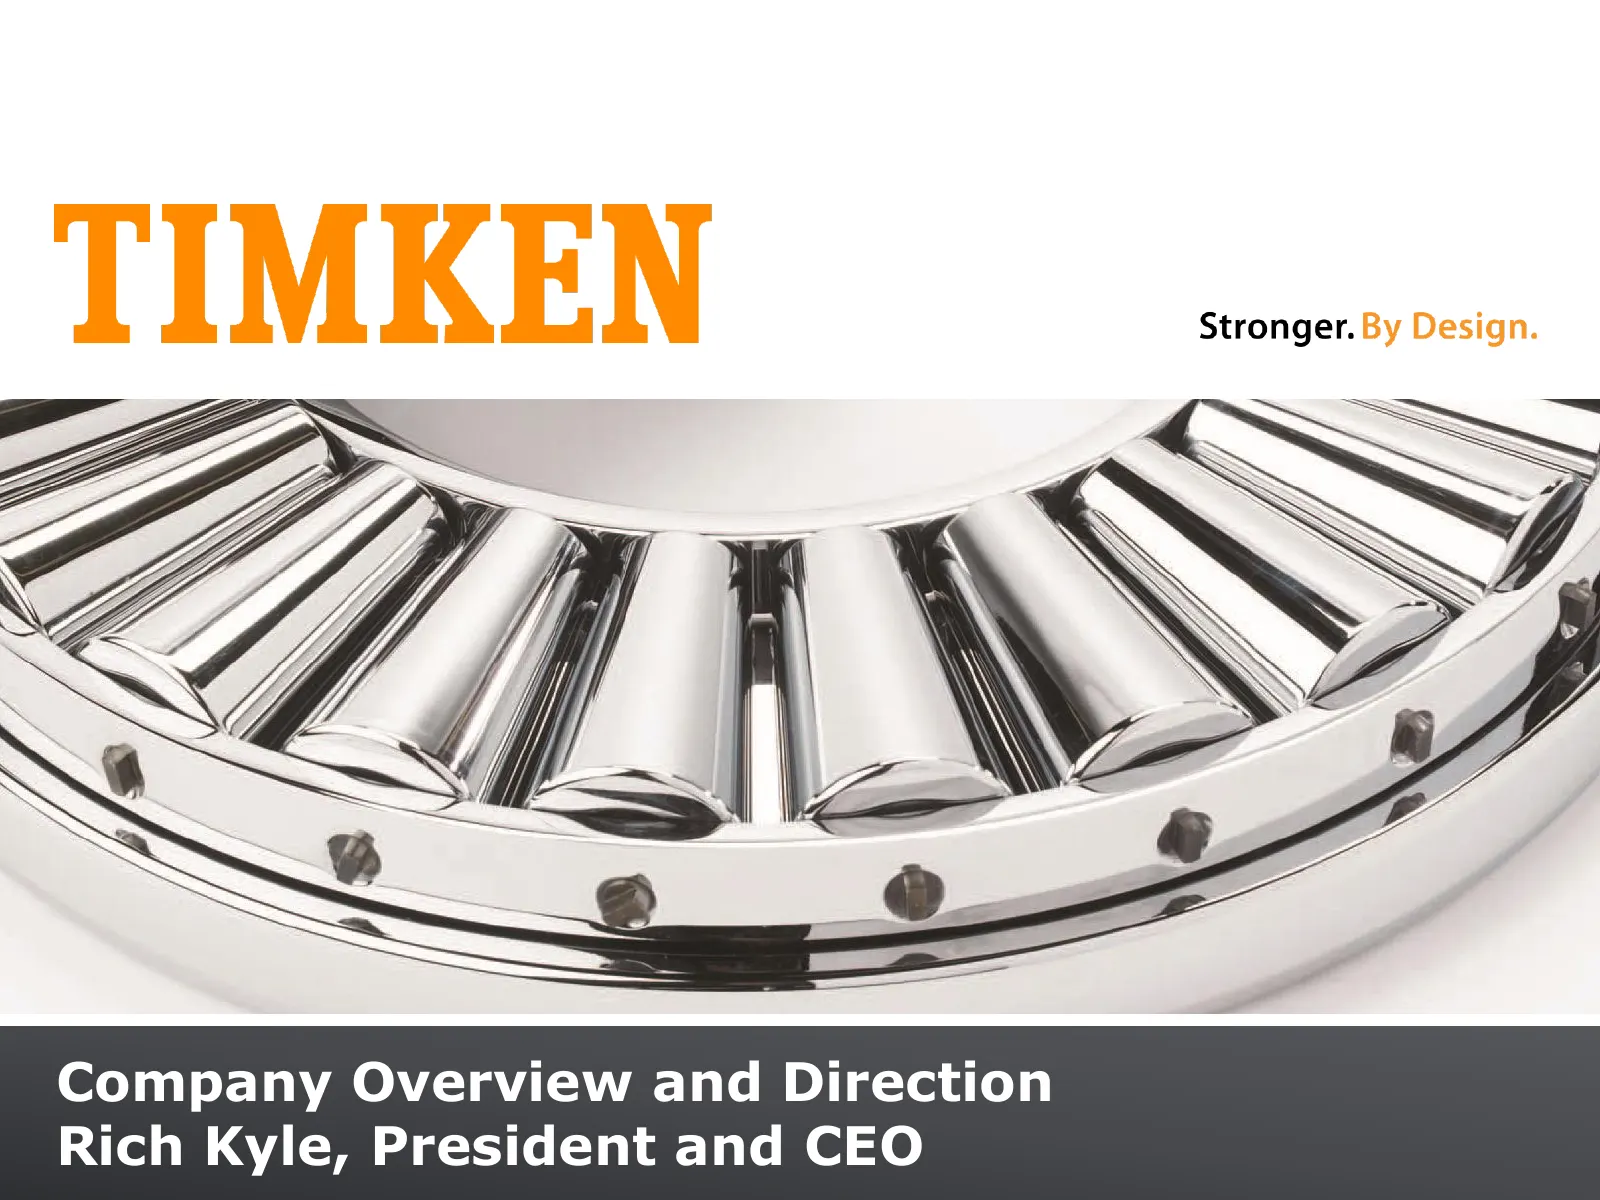
Company Overview and Direction Rich Kyle, President and CEO
Slide 4: Timken at a Glance
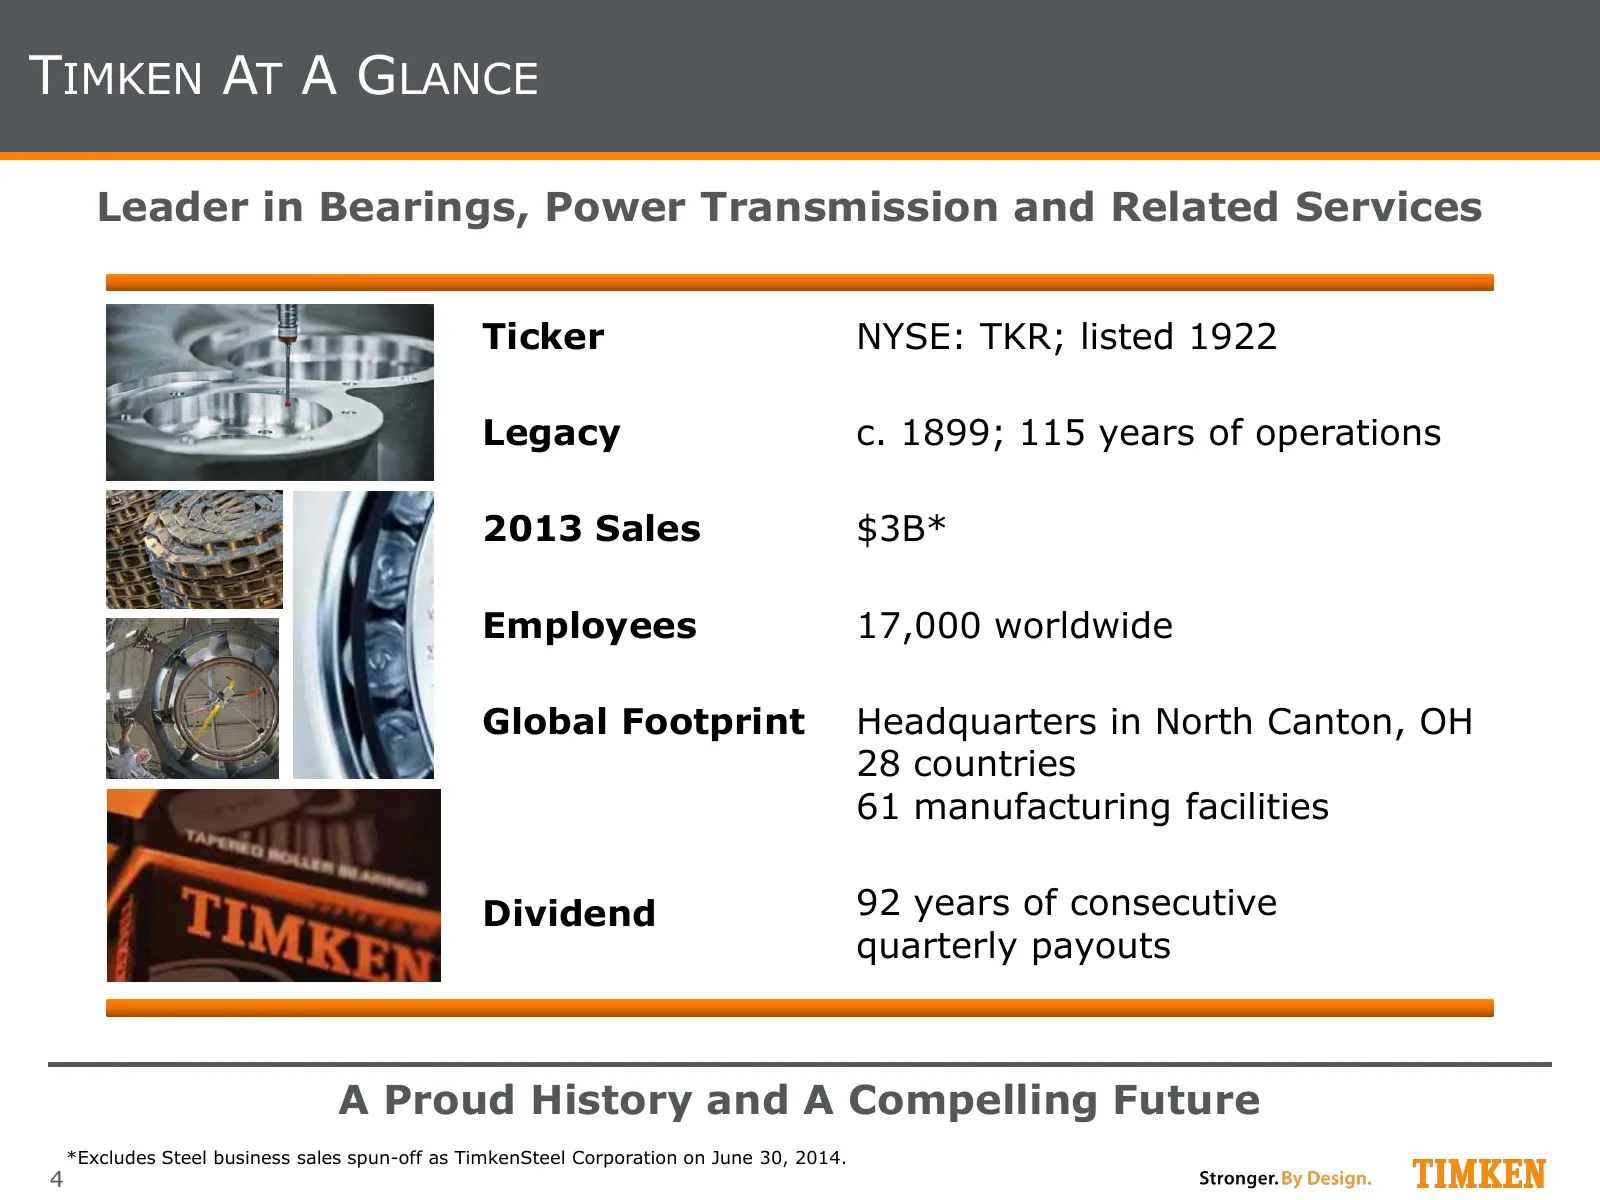
TIMKEN AT A GLANCE Leader in Bearings, Power Transmission and Related Services Ticker NYSE: TKR; listed 1922 Legacy c. 1899; 115 years of operations 2013 Sales $3B* Employees 17,000 worldwide Global Footprint Headquarters in North Canton, OH 28 countries 61 manufacturing facilities Dividend 92 years
Slide 5: What You'll Hear Today
WHAT YOU'LL HEAR TODAY • Exciting time for Timken ‒ Accountable, results-oriented management team ‒ Differentiated business model ‒ Clear strategy to achieve long-term targets • Multiple growth opportunities ‒ Innovation, product expansion ‒ Aftermarket and services ‒ Emerging markets ‒ Disciplined
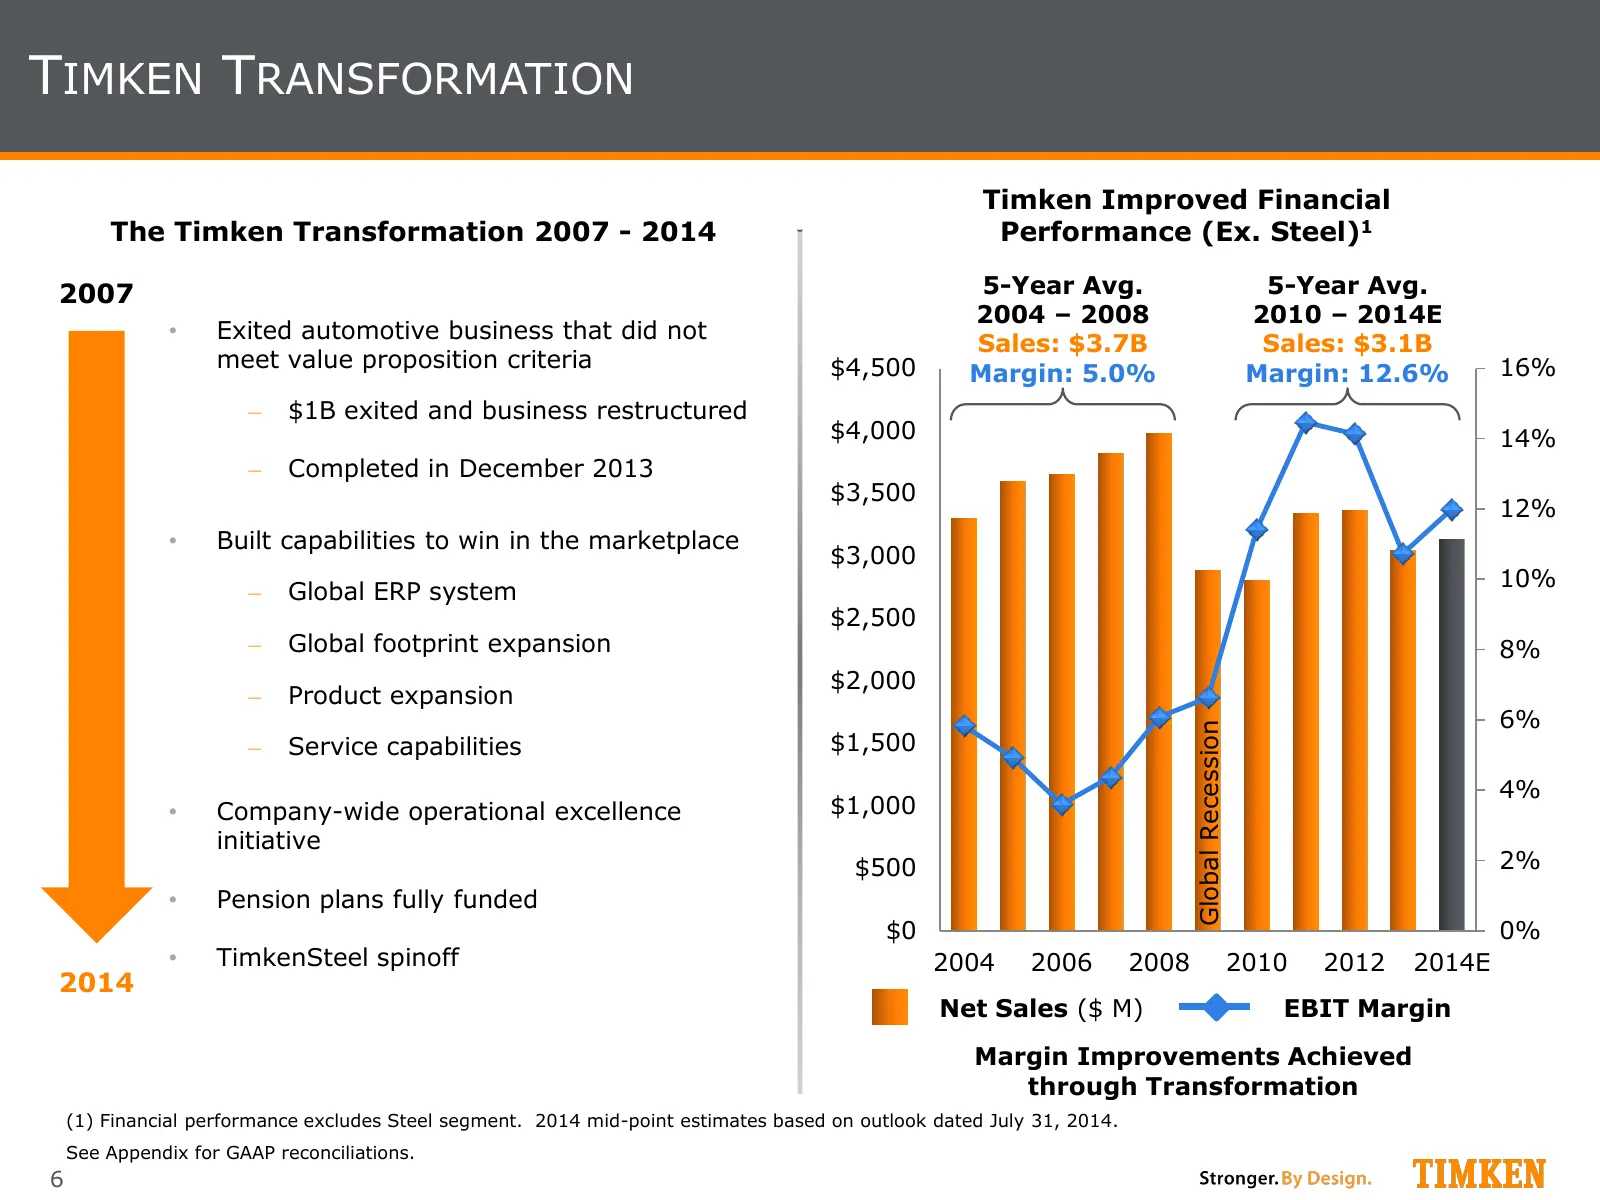
Slide 6: Timken Transformation
TIMKEN TRANSFORMATION Timken Improved Financial The Timken Transformation 2007 - 2014 Performance (Ex. Steel)1 2007 5-Year Avg. 5-Year Avg. 2004 – 2008 2010 – 2014E • Exited automotive business that did not Sales: $3.7B Sales: $3.1B meet value proposition criteria $4,500 16% Margin: 5.0% Margin: 12.
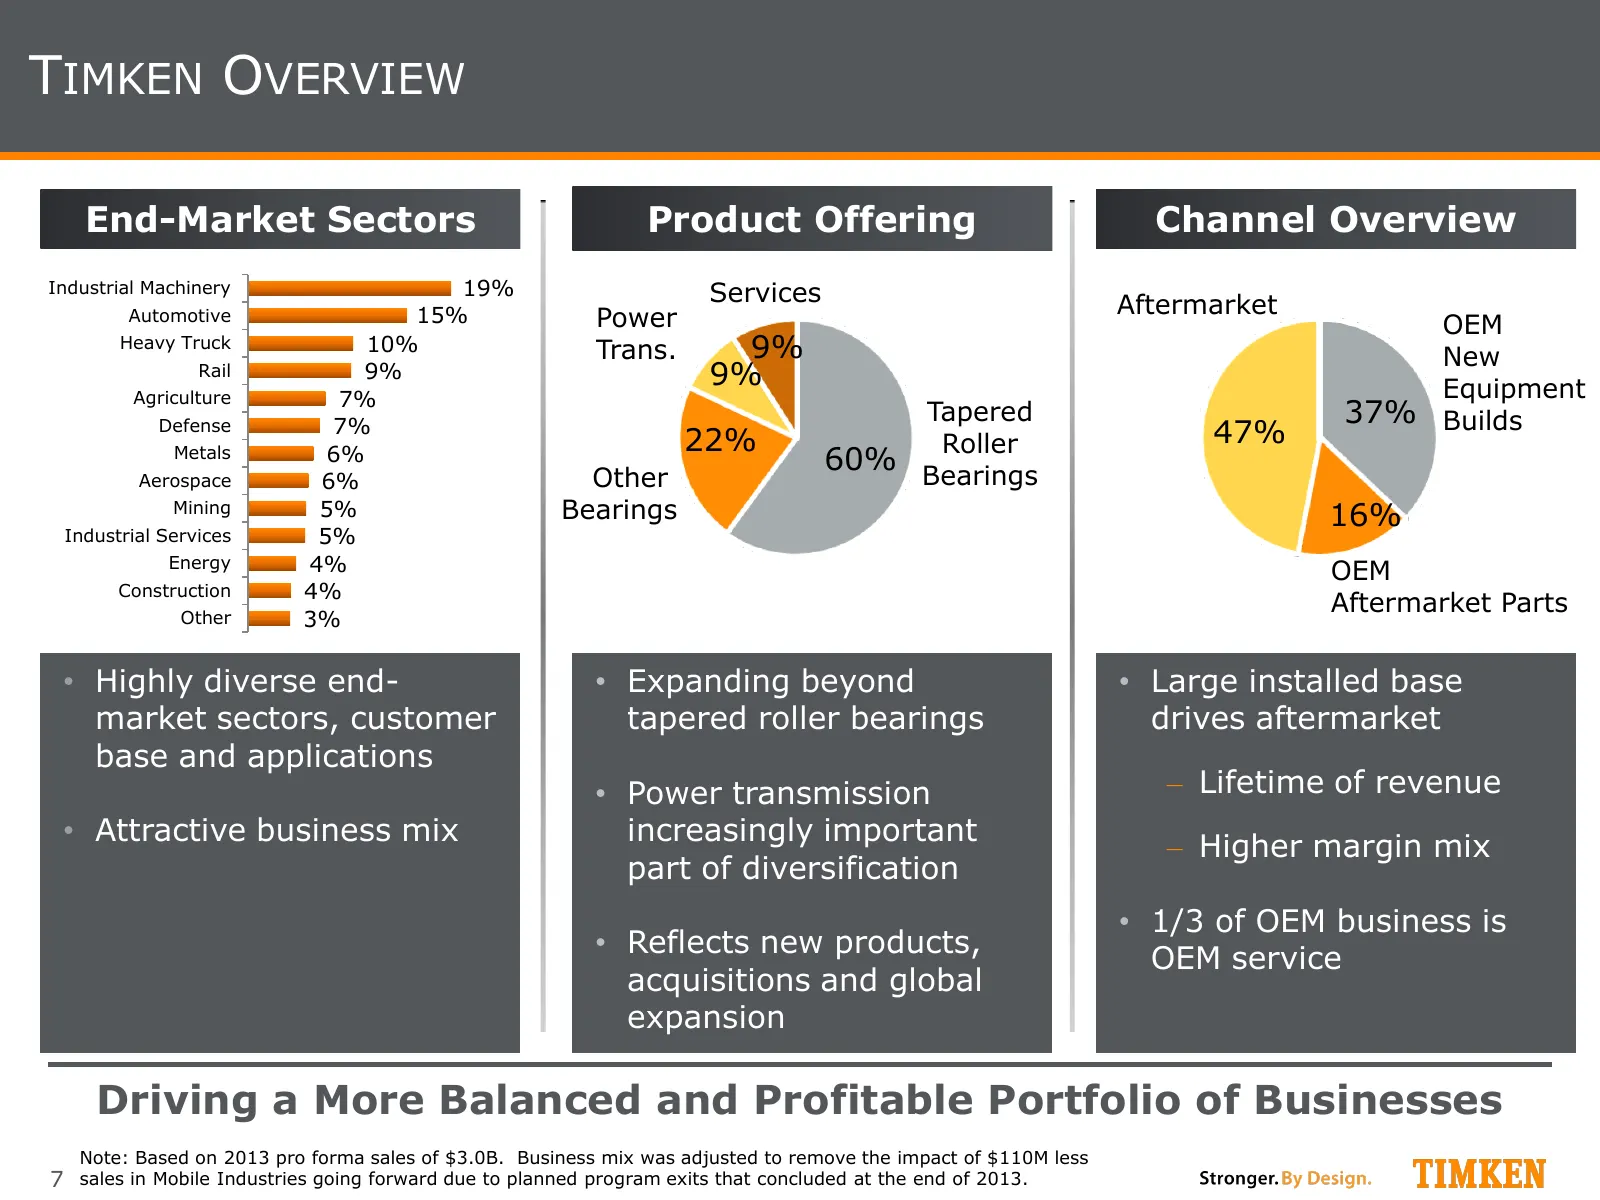
Slide 7: Timken Overview
TIMKEN OVERVIEW End-Market Sectors Product Offering Channel Overview Industrial Machinery 19% Services Aftermarket Automotive 15% Power OEM Heavy Truck 10% Trans. 9% New Rail 9% 9% Equipment Agriculture 7% Tapered 37% Builds Defense 7% 22% Roller 47% Metals 6% 60% Bearings Aerospace 6% Other Mining
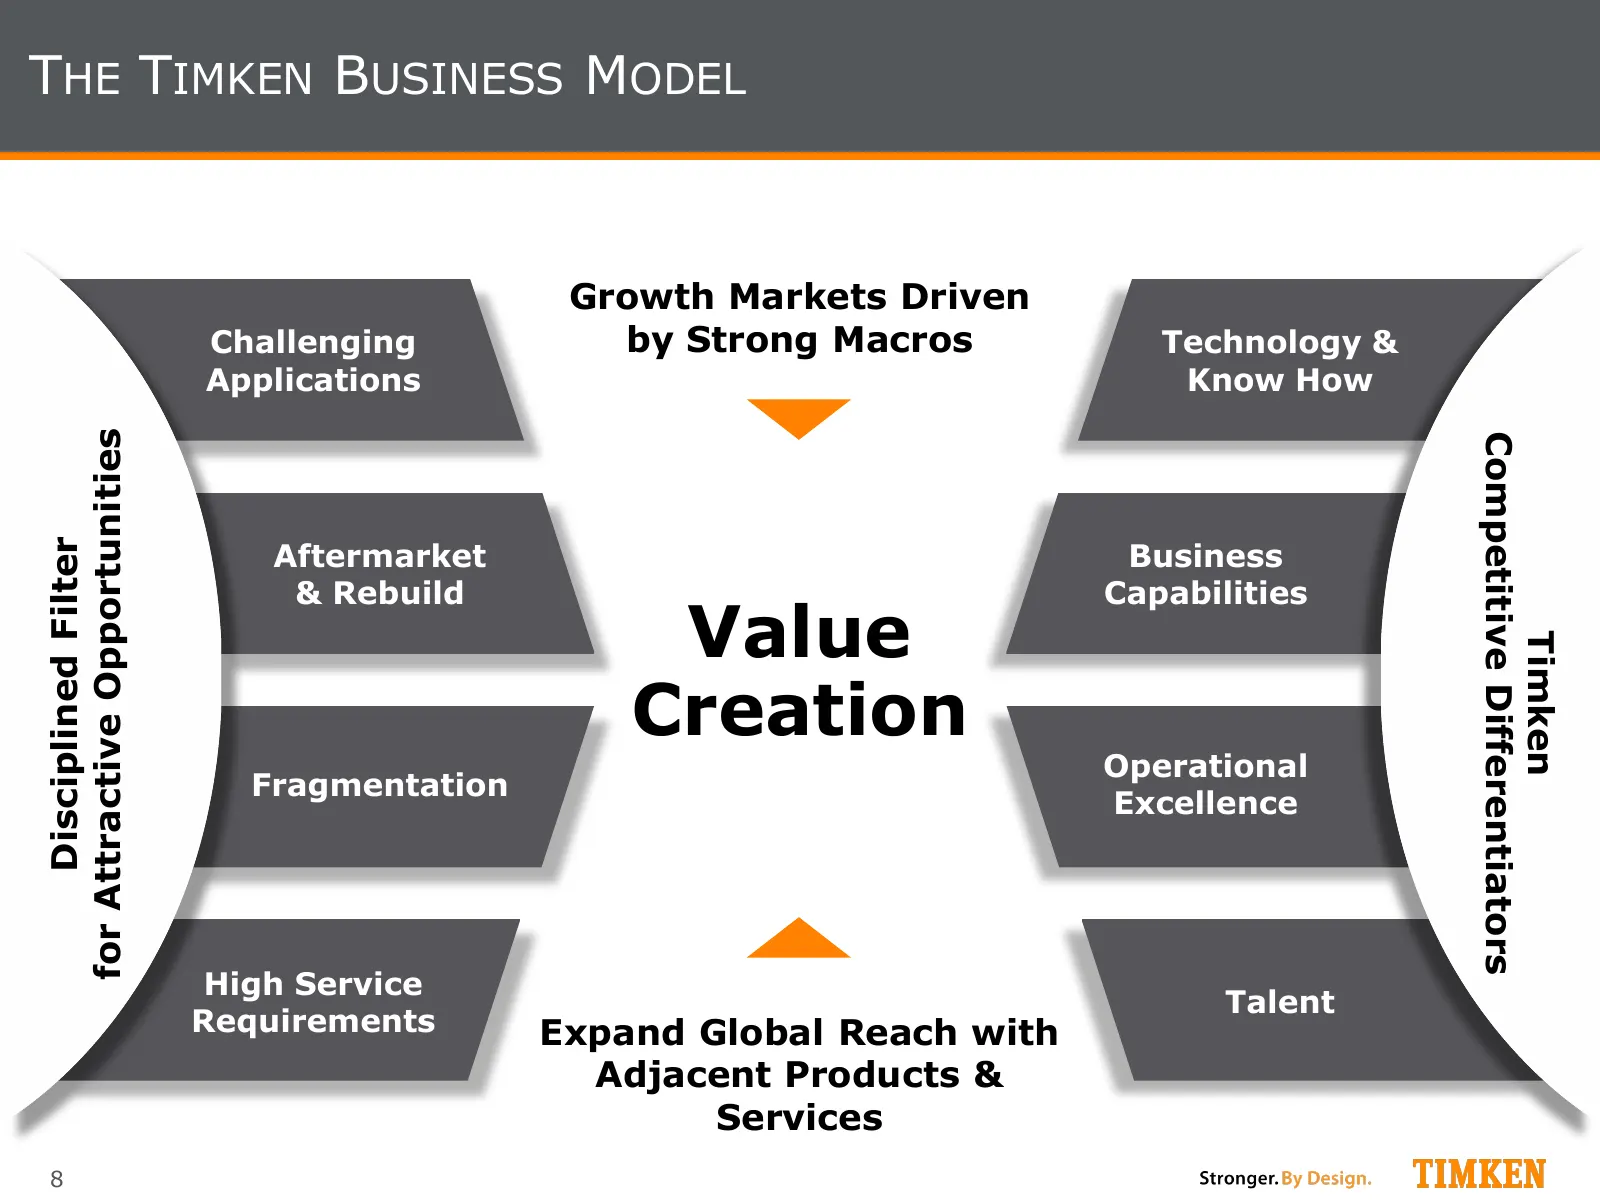
Slide 8: The Timken Business Model
THE TIMKEN BUSINESS MODEL Growth Markets Driven Challenging by Strong Macros Technology & Applications Know How for Attractive Opportunities Competitive Differentiators Aftermarket Business Disciplined Filter & Rebuild Capabilities Value Timken Creation Operational Fragmentation Excellence High Serv
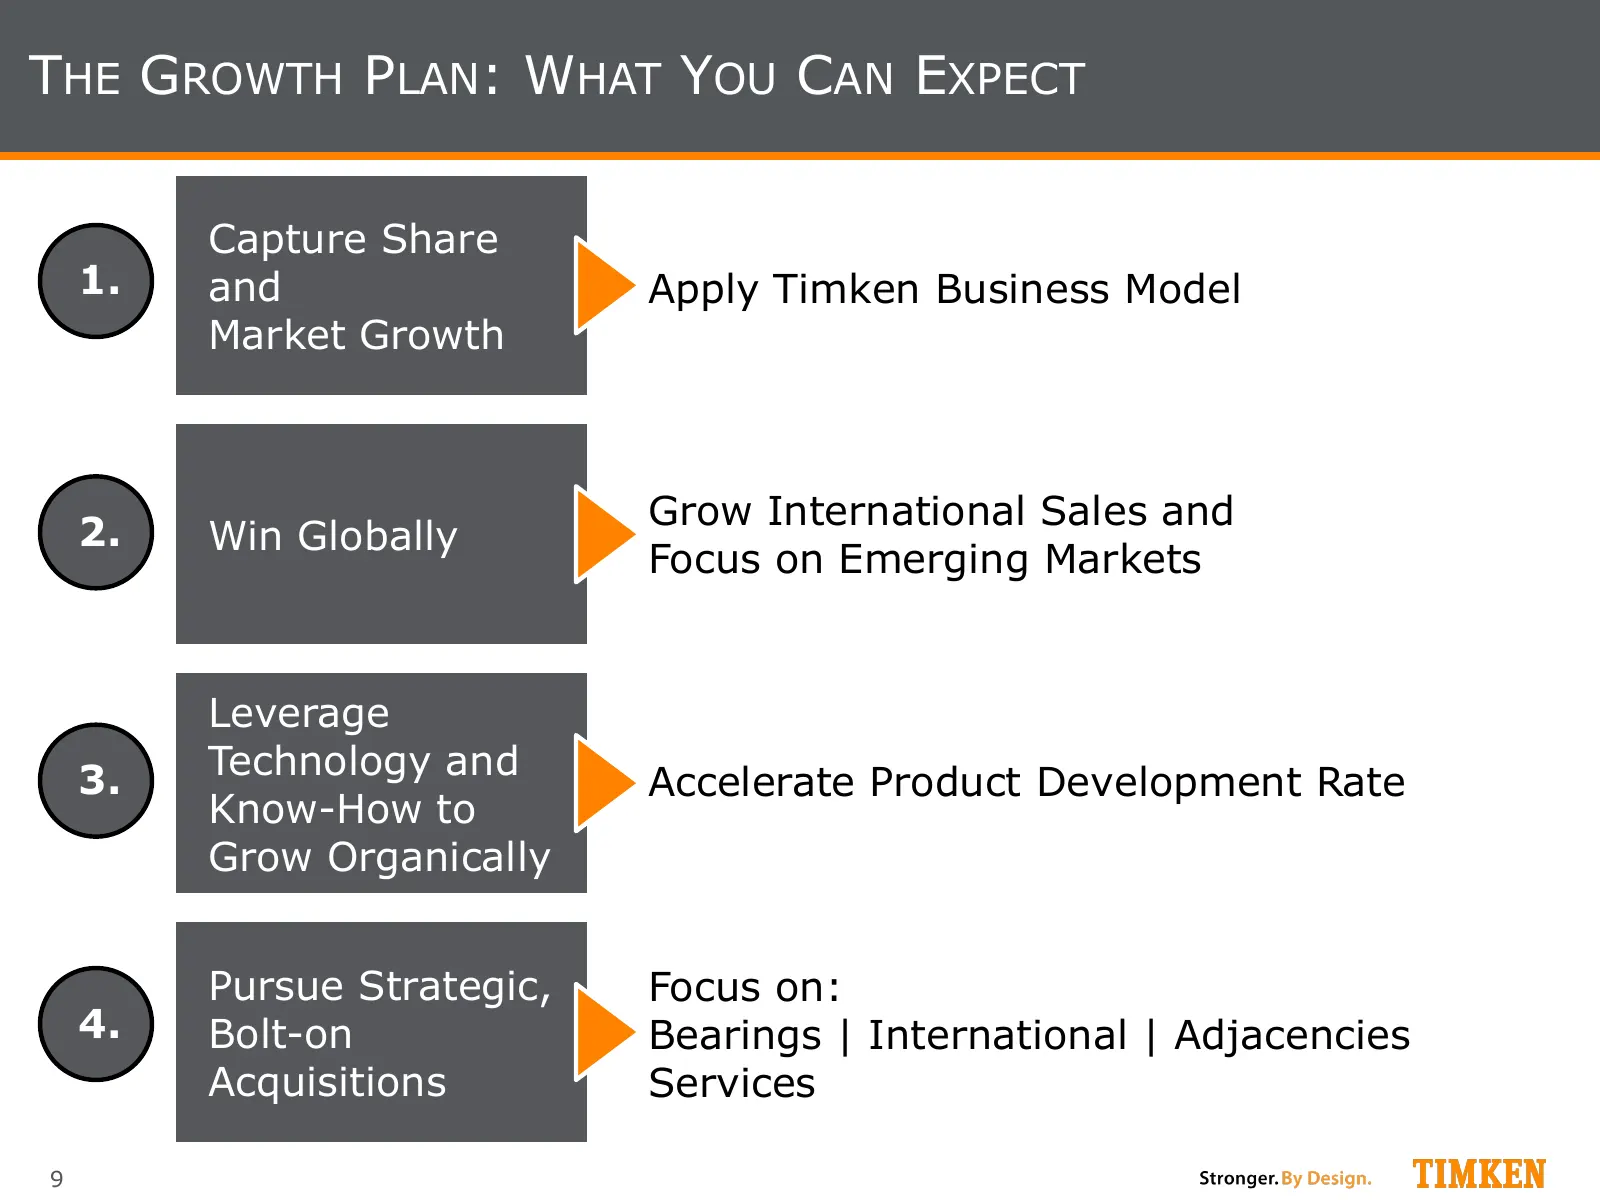
Slide 9: The Growth Plan: What You Can Expect
THE GROWTH PLAN: WHAT YOU CAN EXPECT Capture Share 1. and Apply Timken Business Model Market Growth Grow International Sales and 2. Win Globally Focus on Emerging Markets Leverage 3. Technology and Accelerate Product Development Rate Know-How to Grow Organically Pursue Strategic, Focus on: 4. Bolt-o
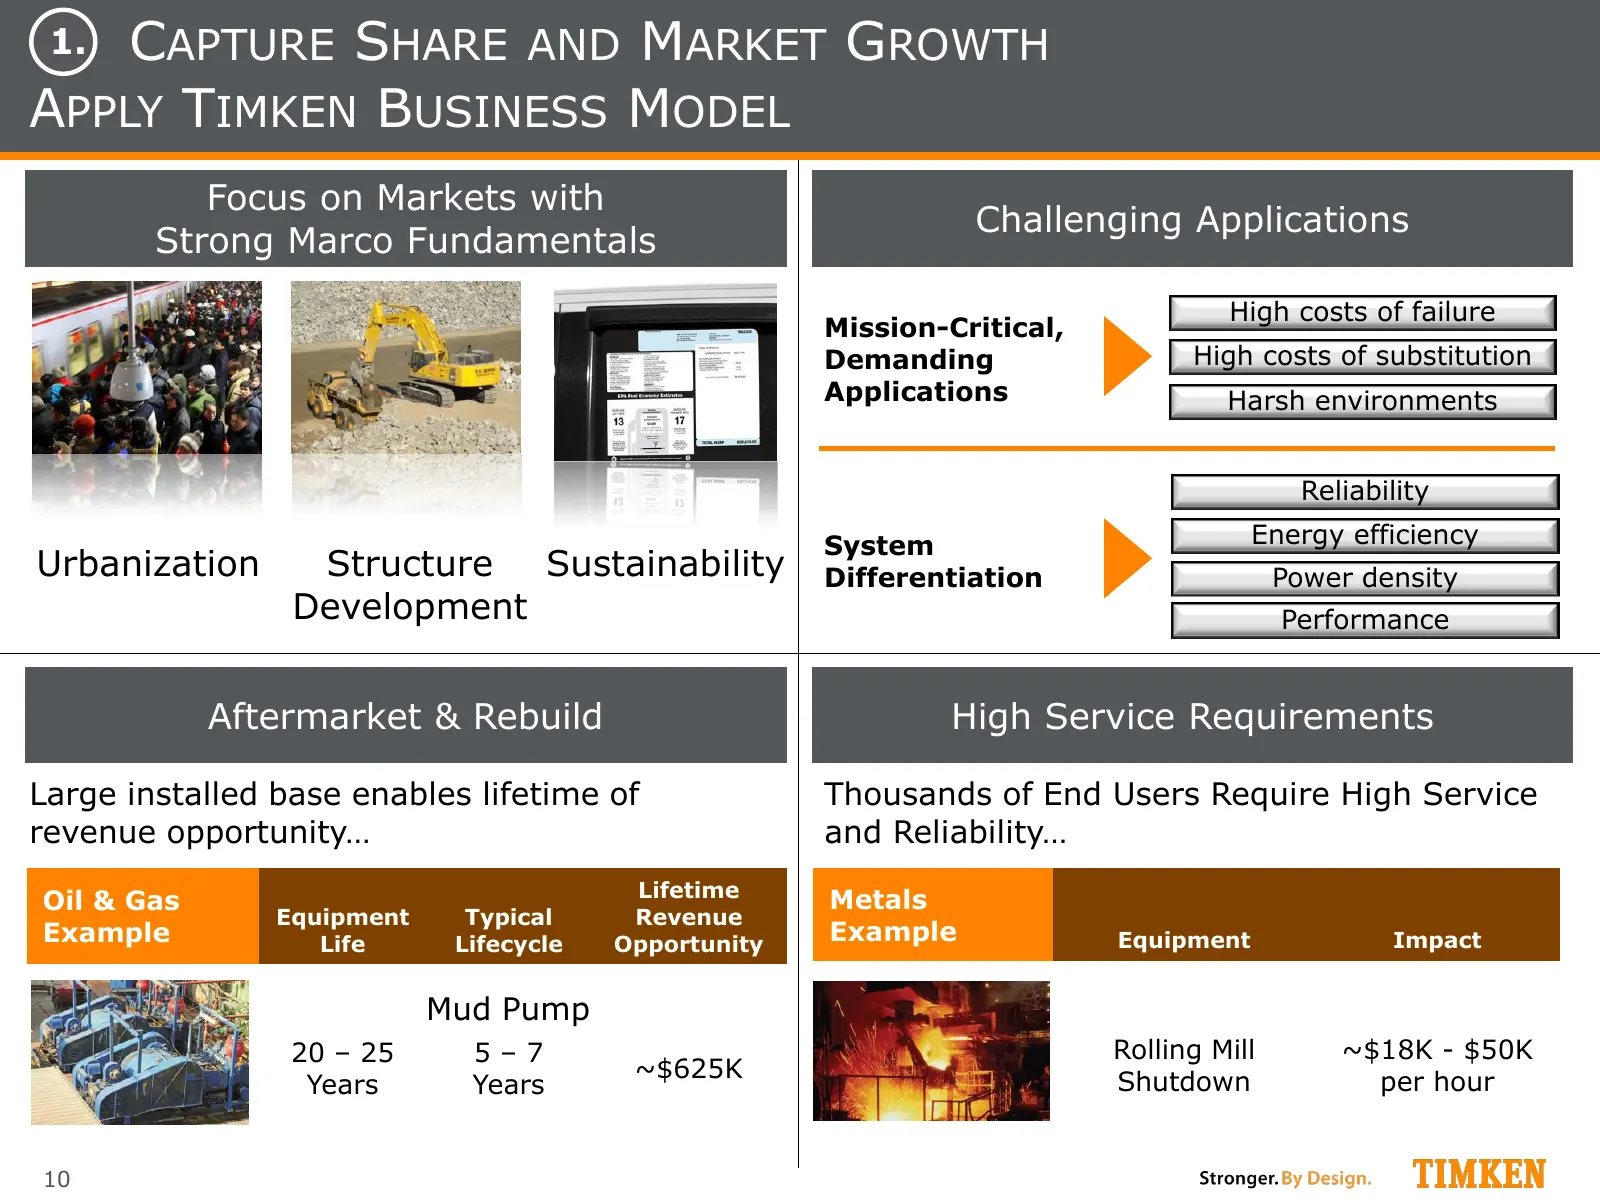
Slide 10: Capture Share and Market Growth: Apply Timken Business Model
1. CAPTURE SHARE AND MARKET GROWTH APPLY TIMKEN BUSINESS MODEL Focus on Markets with Challenging Applications Strong Marco Fundamentals High costs of failure Mission-Critical, Demanding High costs of substitution Applications Harsh environments Reliability System Energy efficiency Urbanization Struc
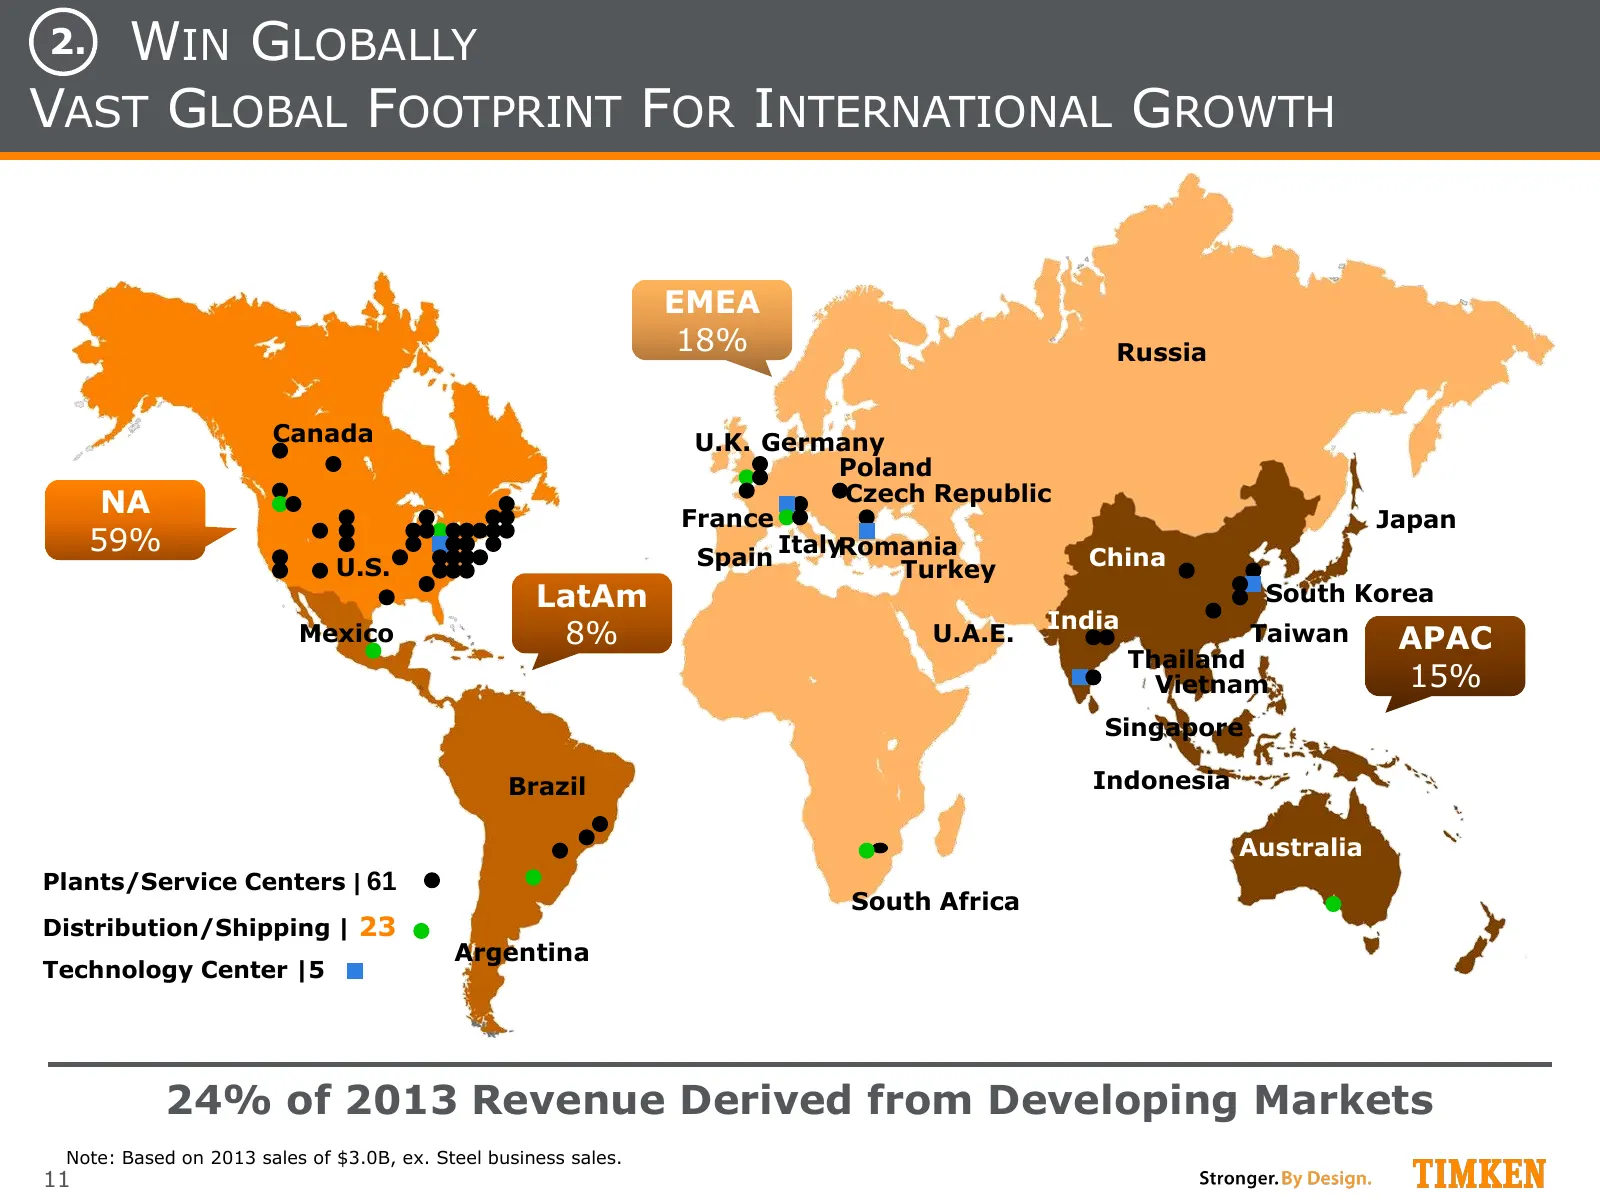
Slide 11: Win Globally: Vast Global Footprint for International Growth
2. WIN GLOBALLY VAST GLOBAL FOOTPRINT FOR INTERNATIONAL GROWTH EMEA 18% Russia Canada U.K. Germany Poland NA Czech Republic France Japan 59% Spain ItalyRomania China U.S. Turkey LatAm South Korea India Mexico 8% U.A.E. Taiwan APAC Thailand Vietnam 15% Singapore Brazil Indonesia Australia Plants/Serv
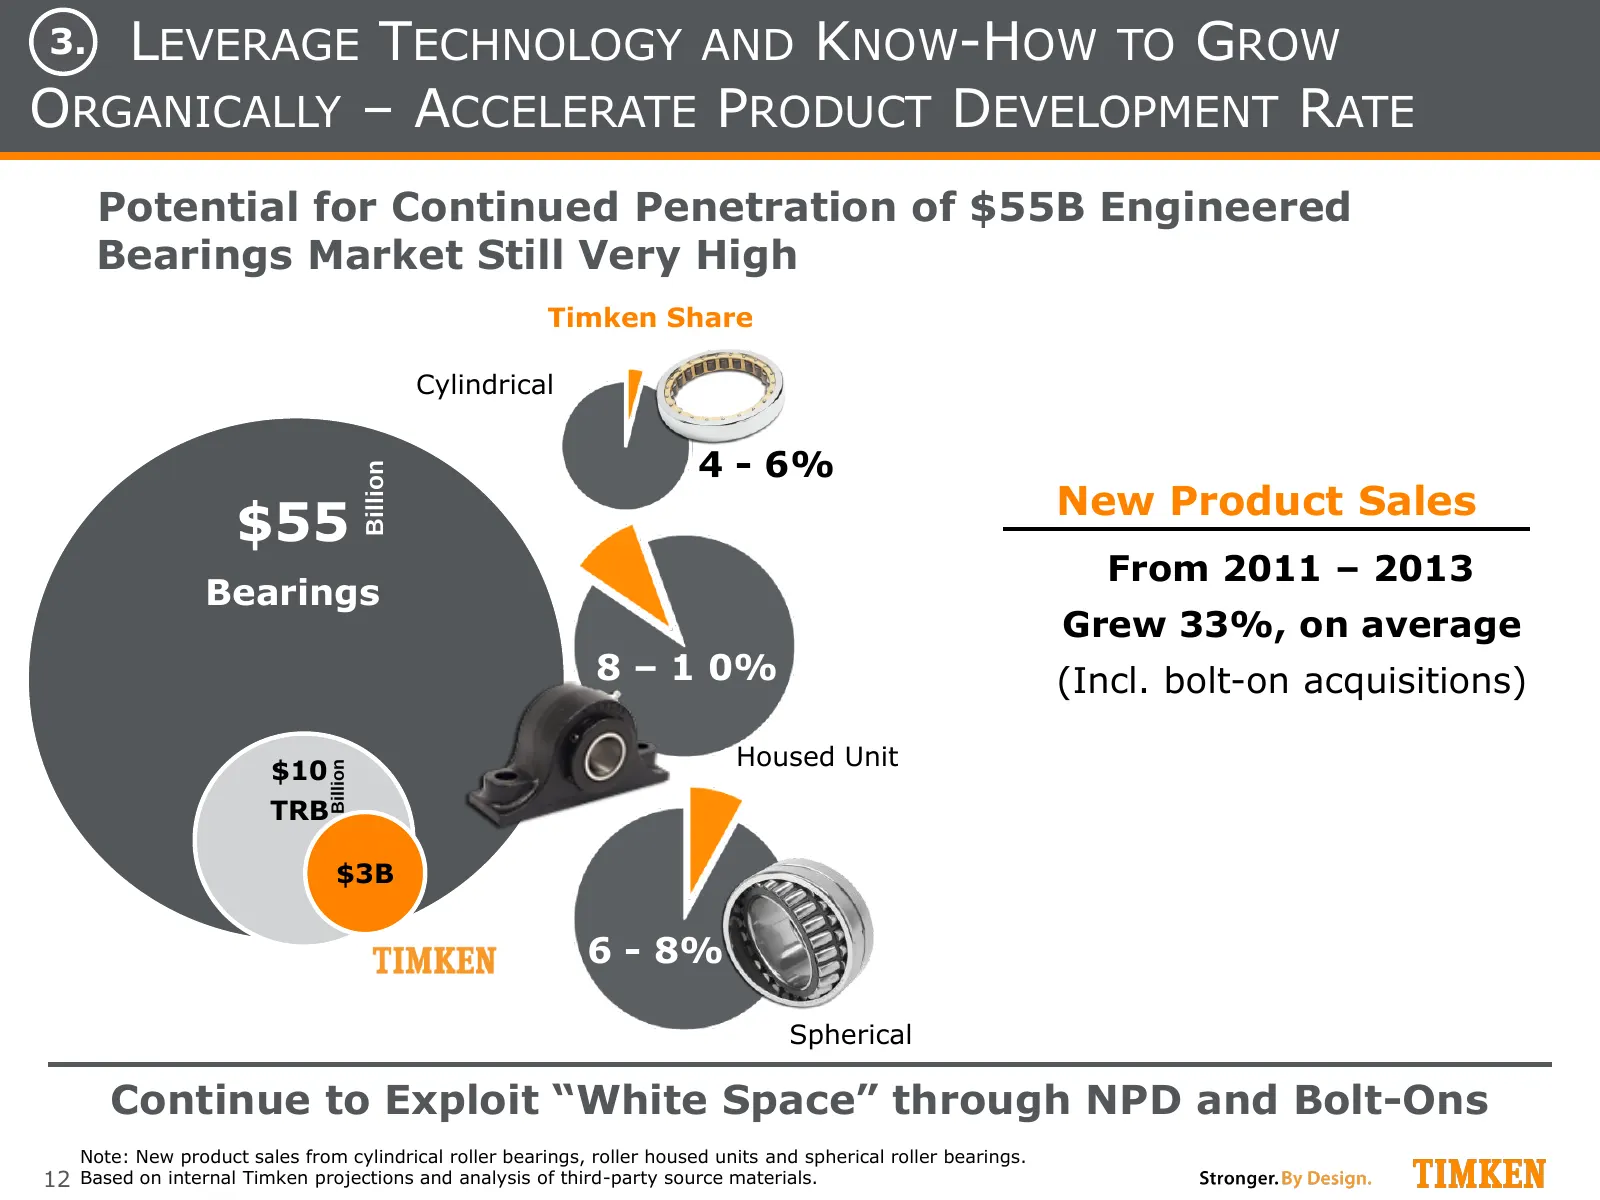
Slide 12: Leverage Technology and Know-How to Grow Organically
3. LEVERAGE TECHNOLOGY AND KNOW-HOW TO GROW ORGANICALLY – ACCELERATE PRODUCT DEVELOPMENT RATE Potential for Continued Penetration of $55B Engineered Bearings Market Still Very High Timken Share Cylindrical 4 - 6% Billion Billion New Product Sales $55 $55 From 2011 – 2013 Bearings Bearings Grew 33%,
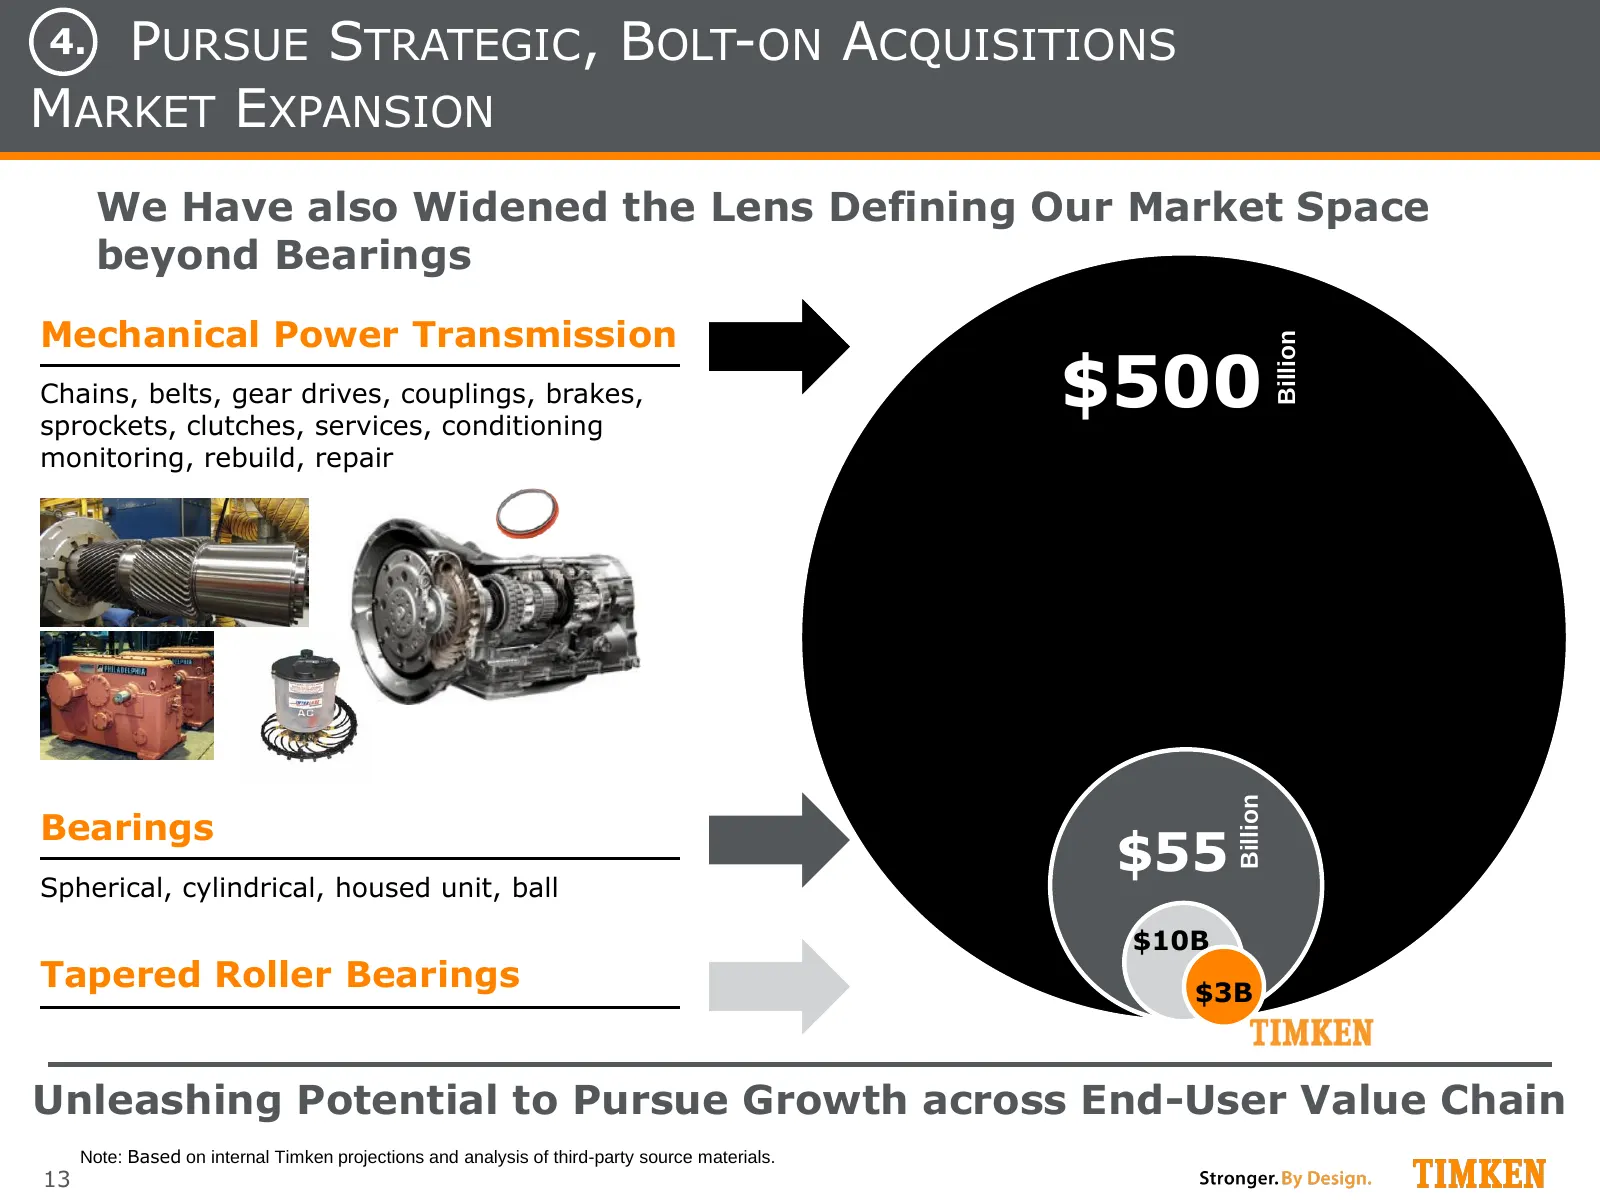
Slide 13: Pursue Strategic, Bolt-On Acquisitions: Market Expansion
4. PURSUE STRATEGIC, BOLT-ON ACQUISITIONS MARKET EXPANSION We Have also Widened the Lens Defining Our Market Space beyond Bearings Mechanical Power Transmission Billion Chains, belts, gear drives, couplings, brakes, sprockets, clutches, services, conditioning $500 monitoring, rebuild, repair Billion
Slide 14: Investment Summary
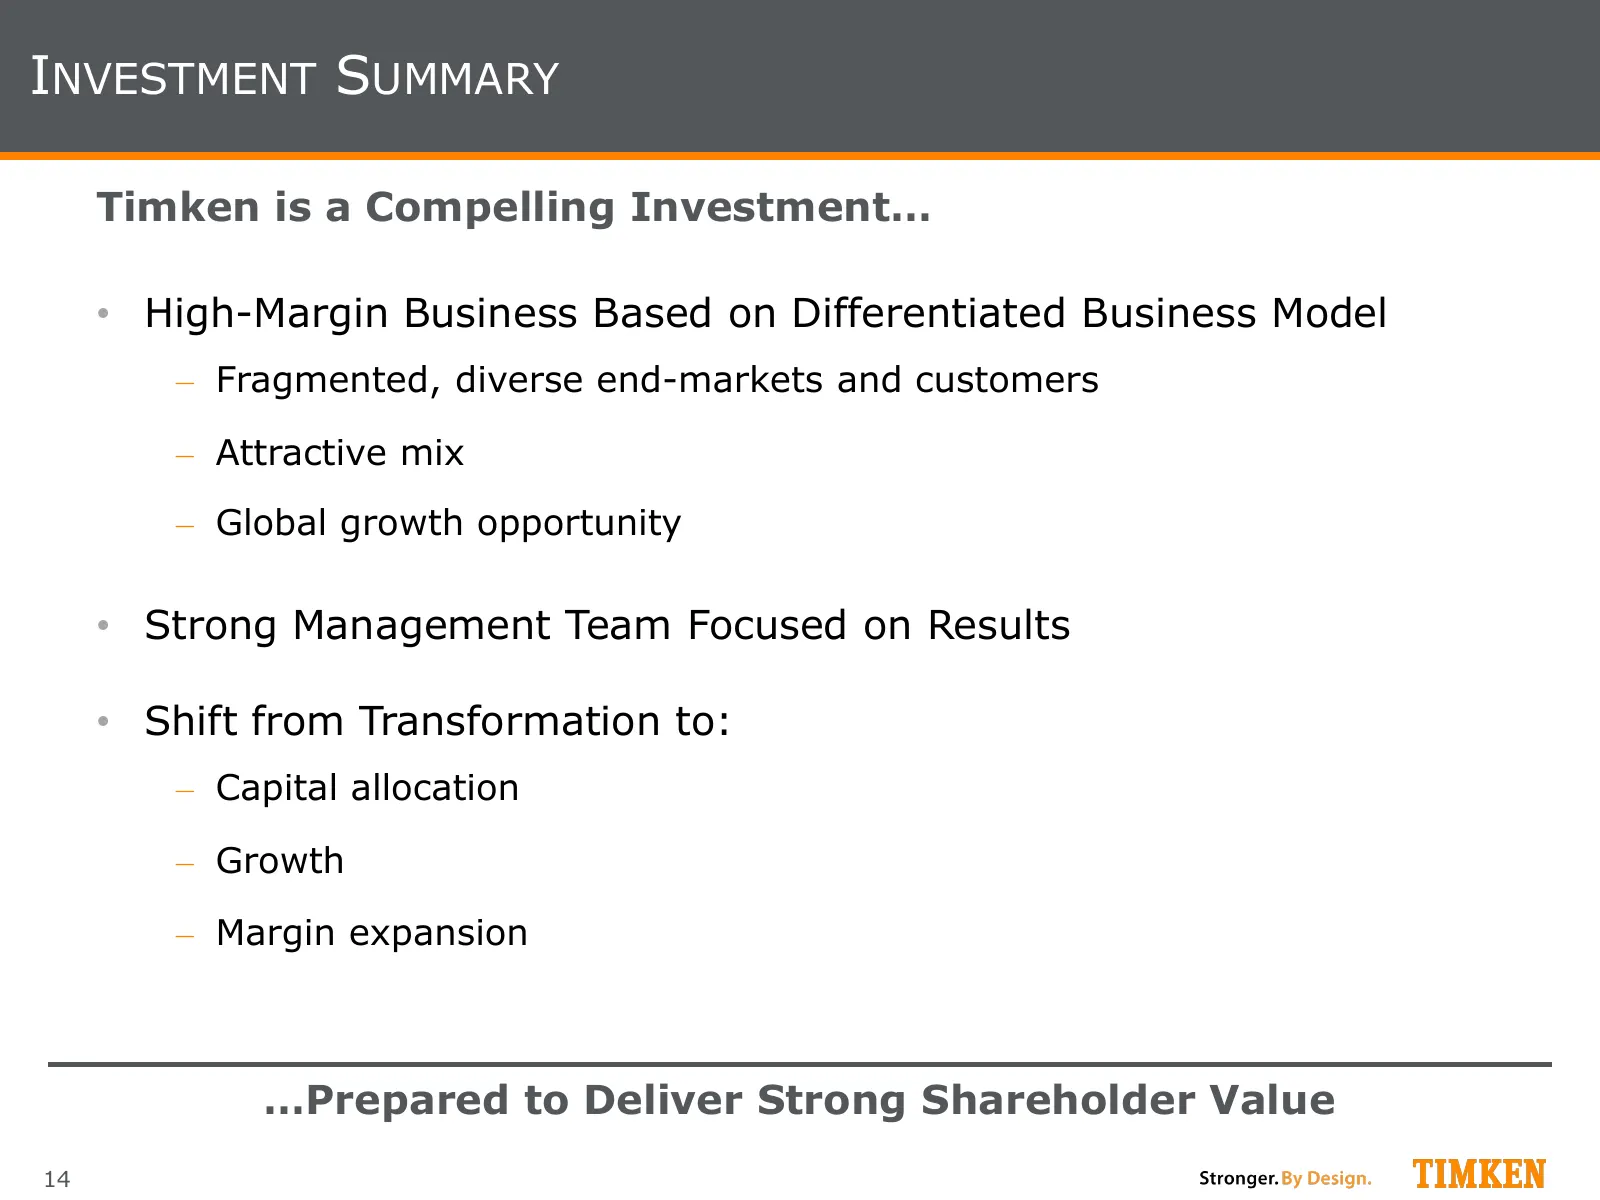
INVESTMENT SUMMARY Timken is a Compelling Investment… • High-Margin Business Based on Differentiated Business Model ‒ Fragmented, diverse end-markets and customers ‒ Attractive mix ‒ Global growth opportunity • Strong Management Team Focused on Results • Shift from Transformation to: ‒ Capital alloc

Slide 15: Financial Review
Financial Review Phil Fracassa, CFO
Slide 16: Pro Forma Revenue and EPS
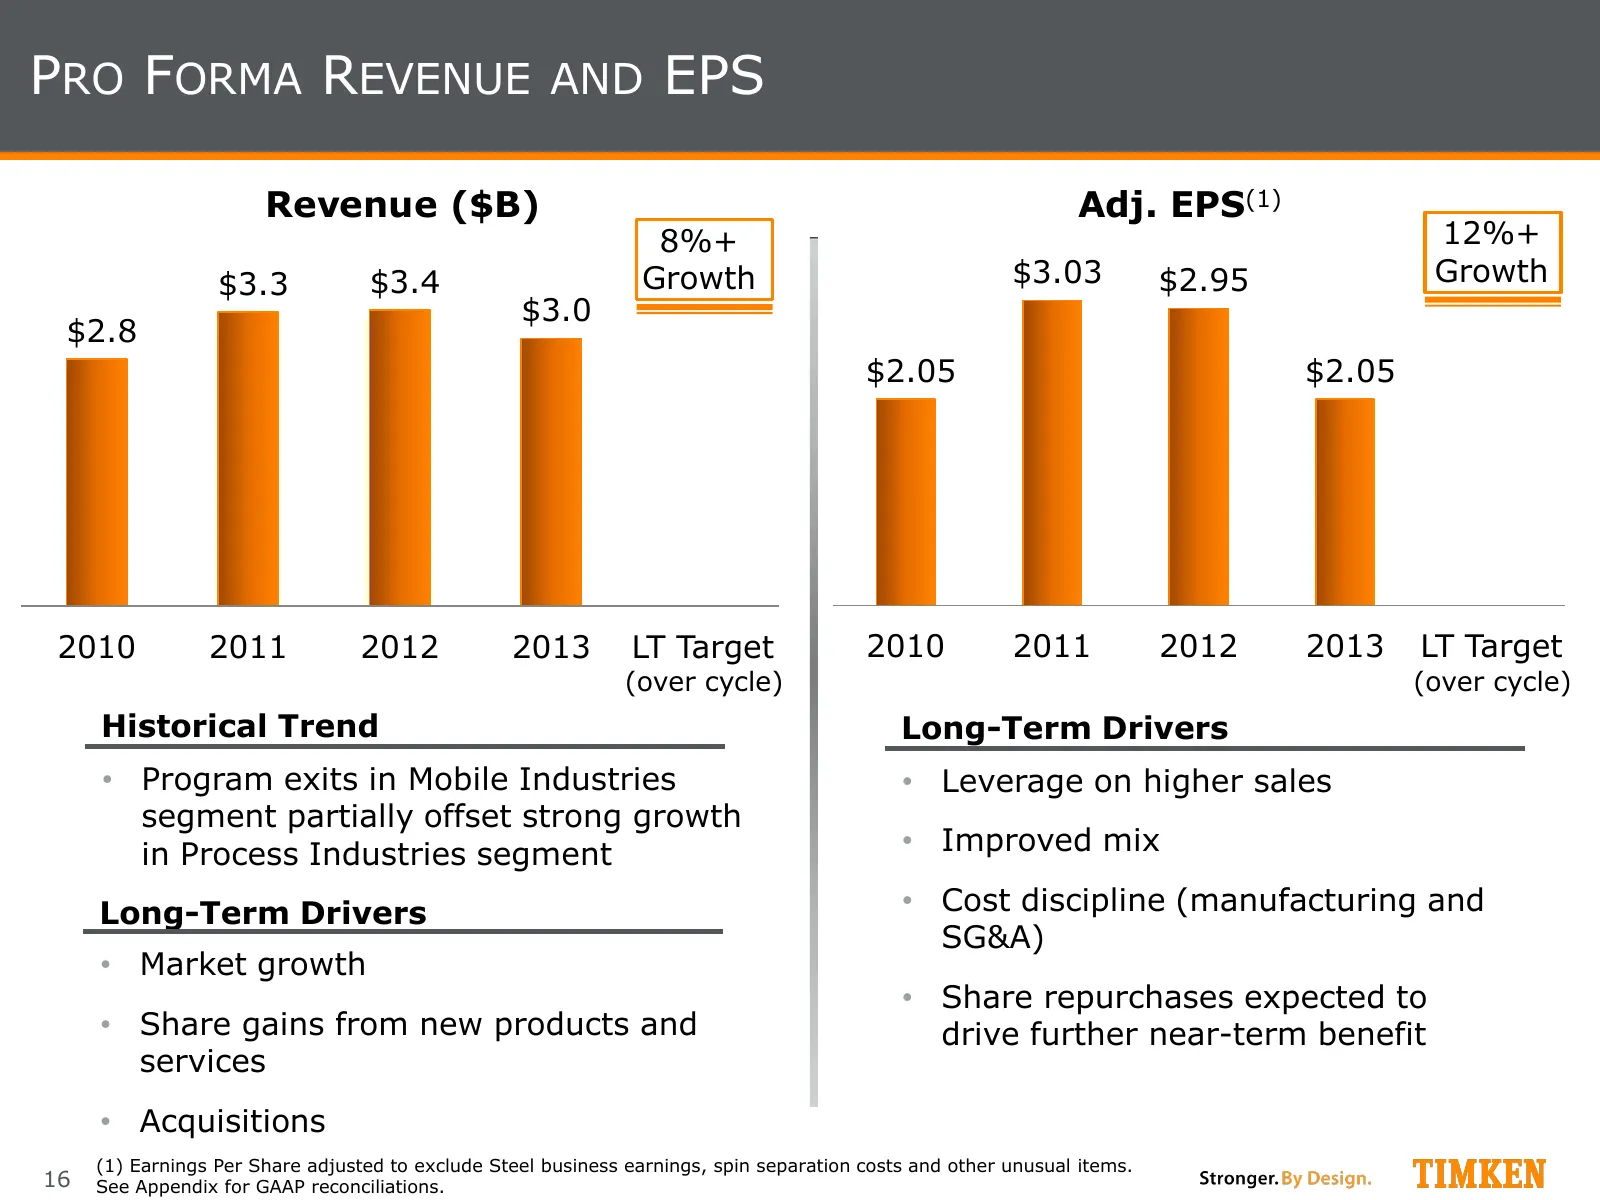
PRO FORMA REVENUE AND EPS Revenue ($B) Adj. EPS(1) 8%+ 12%+ $3.3 $3.4 Growth $3.03 $2.95 Growth $3.0 $2.8 $2.05 $2.05 2010 2011 2012 2013 LT Target 2010 2011 2012 2013 LT Target (over cycle) (over cycle) Historical Trend Long-Term Drivers • Program exits in Mobile Industries • Leverage on higher sal
Slide 17: Pro Forma EBIT Margin and Free Cash Flow Conversion
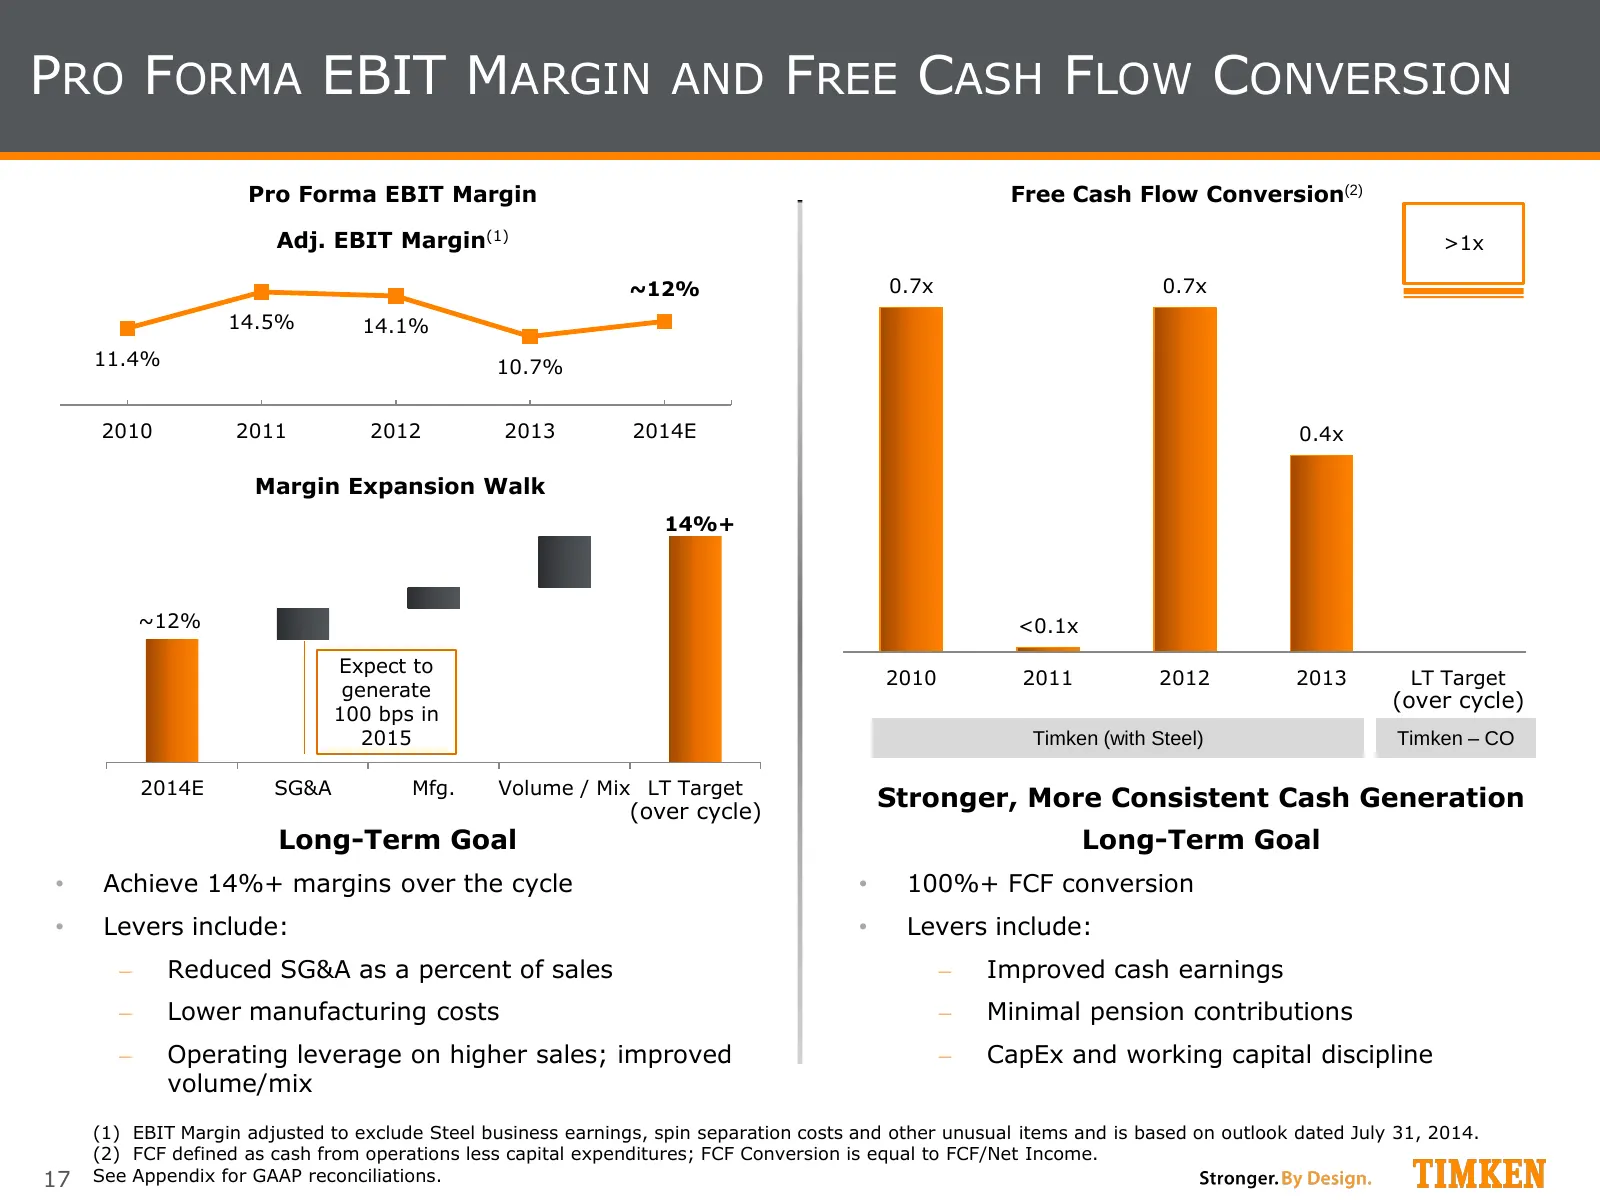
PRO FORMA EBIT MARGIN AND FREE CASH FLOW CONVERSION Pro Forma EBIT Margin Free Cash Flow Conversion(2) Adj. EBIT Margin(1) >1x ~12% 0.7x 0.7x 14.5% 14.1% 11.4% 10.7% 2010 2011 2012 2013 2014E 0.4x Margin Expansion Walk 14%+ ~12% <0.1x Expect to 2010 2011 2012 2013 LT Target generate (over cycle) 100
Slide 18: Balance Sheet and Leverage
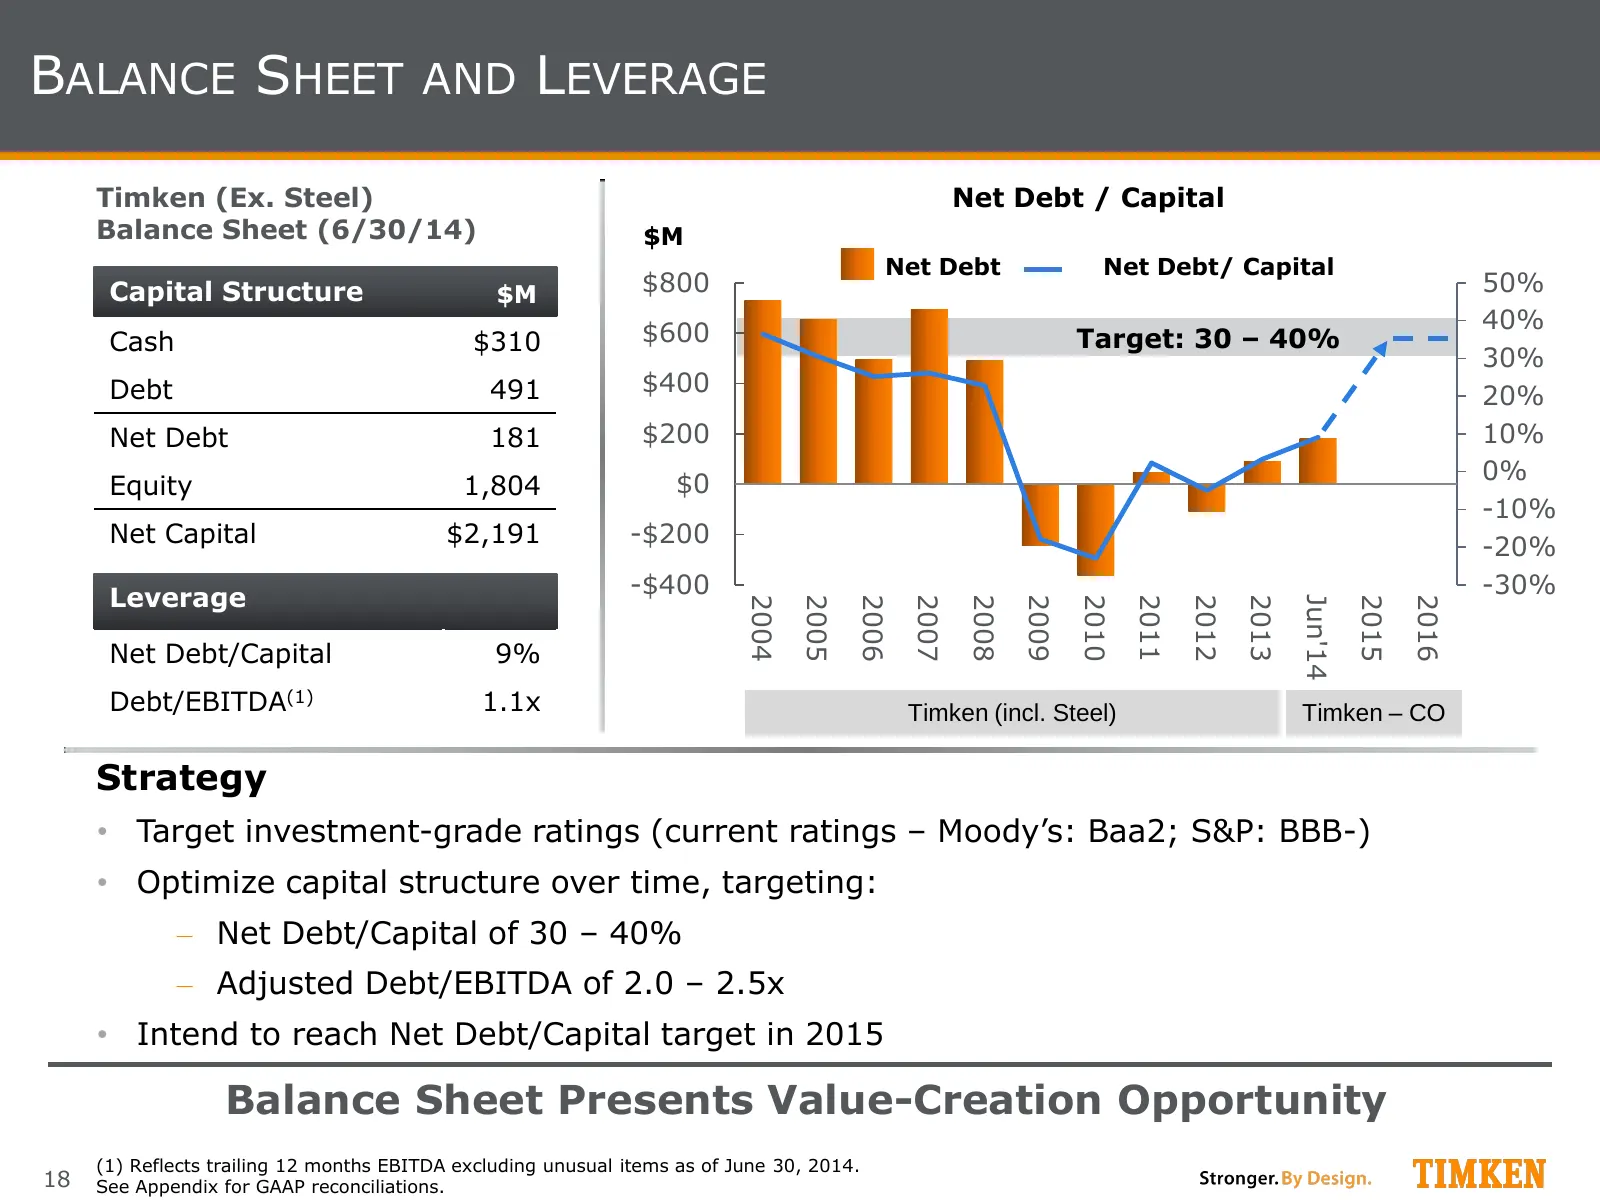
BALANCE SHEET AND LEVERAGE Timken (Ex. Steel) Net Debt / Capital Balance Sheet (6/30/14) $M Net Debt Net Debt/ Capital Capital Structure $M $800 50% $600 40% Cash $310 Target: 30 – 40% 30% Debt 491 $400 20% Net Debt 181 $200 10% $0 0% Equity 1,804 -10% Net Capital $2,191 -$200 -20% -$400 -30% Levera
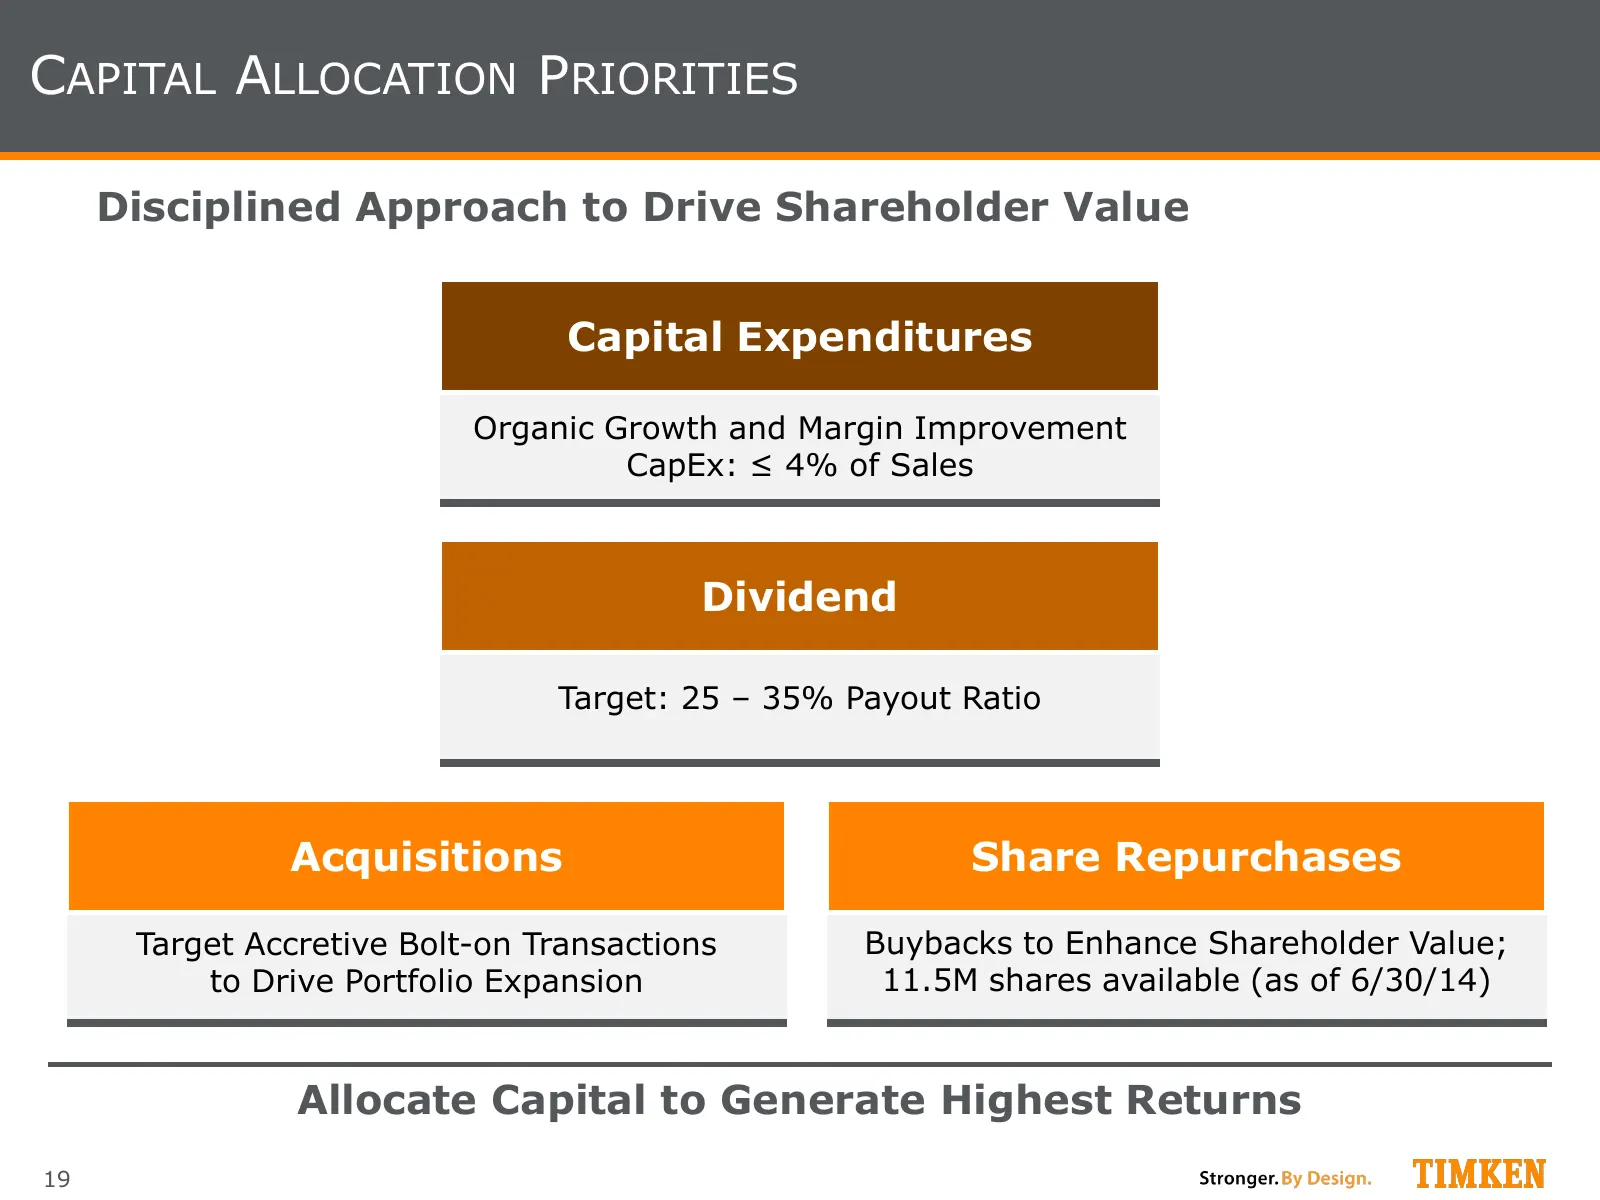
Slide 19: Capital Allocation Priorities
CAPITAL ALLOCATION PRIORITIES Disciplined Approach to Drive Shareholder Value Capital Expenditures Organic Growth and Margin Improvement CapEx: ≤ 4% of Sales Dividend Target: 25 – 35% Payout Ratio Acquisitions Share Repurchases Target Accretive Bolt-on Transactions Buybacks to Enhance Shareholder Va
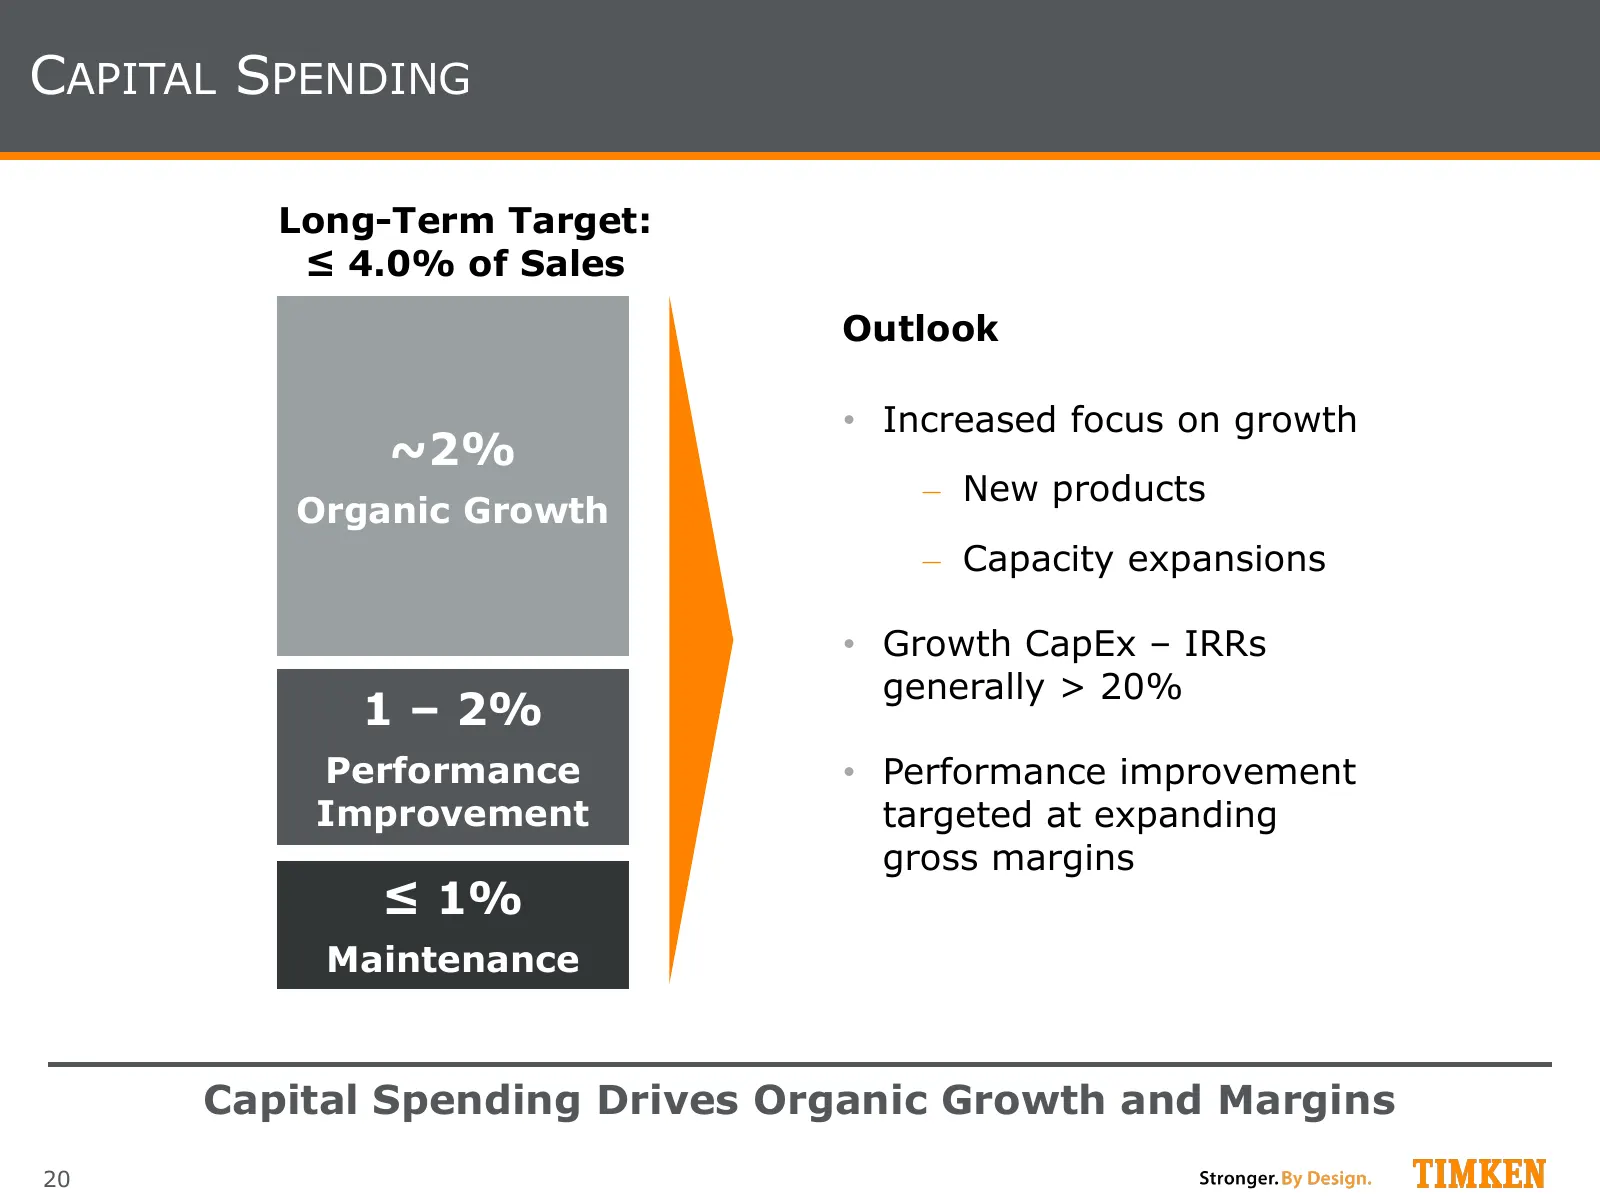
Slide 20: Capital Spending
CAPITAL SPENDING Long-Term Target: ≤ 4.0% of Sales Outlook • Increased focus on growth ~2% ‒ New products Organic Growth ‒ Capacity expansions • Growth CapEx – IRRs generally > 20% 1 – 2% Performance • Performance improvement Improvement targeted at expanding gross margins ≤ 1% Maintenance Capital S
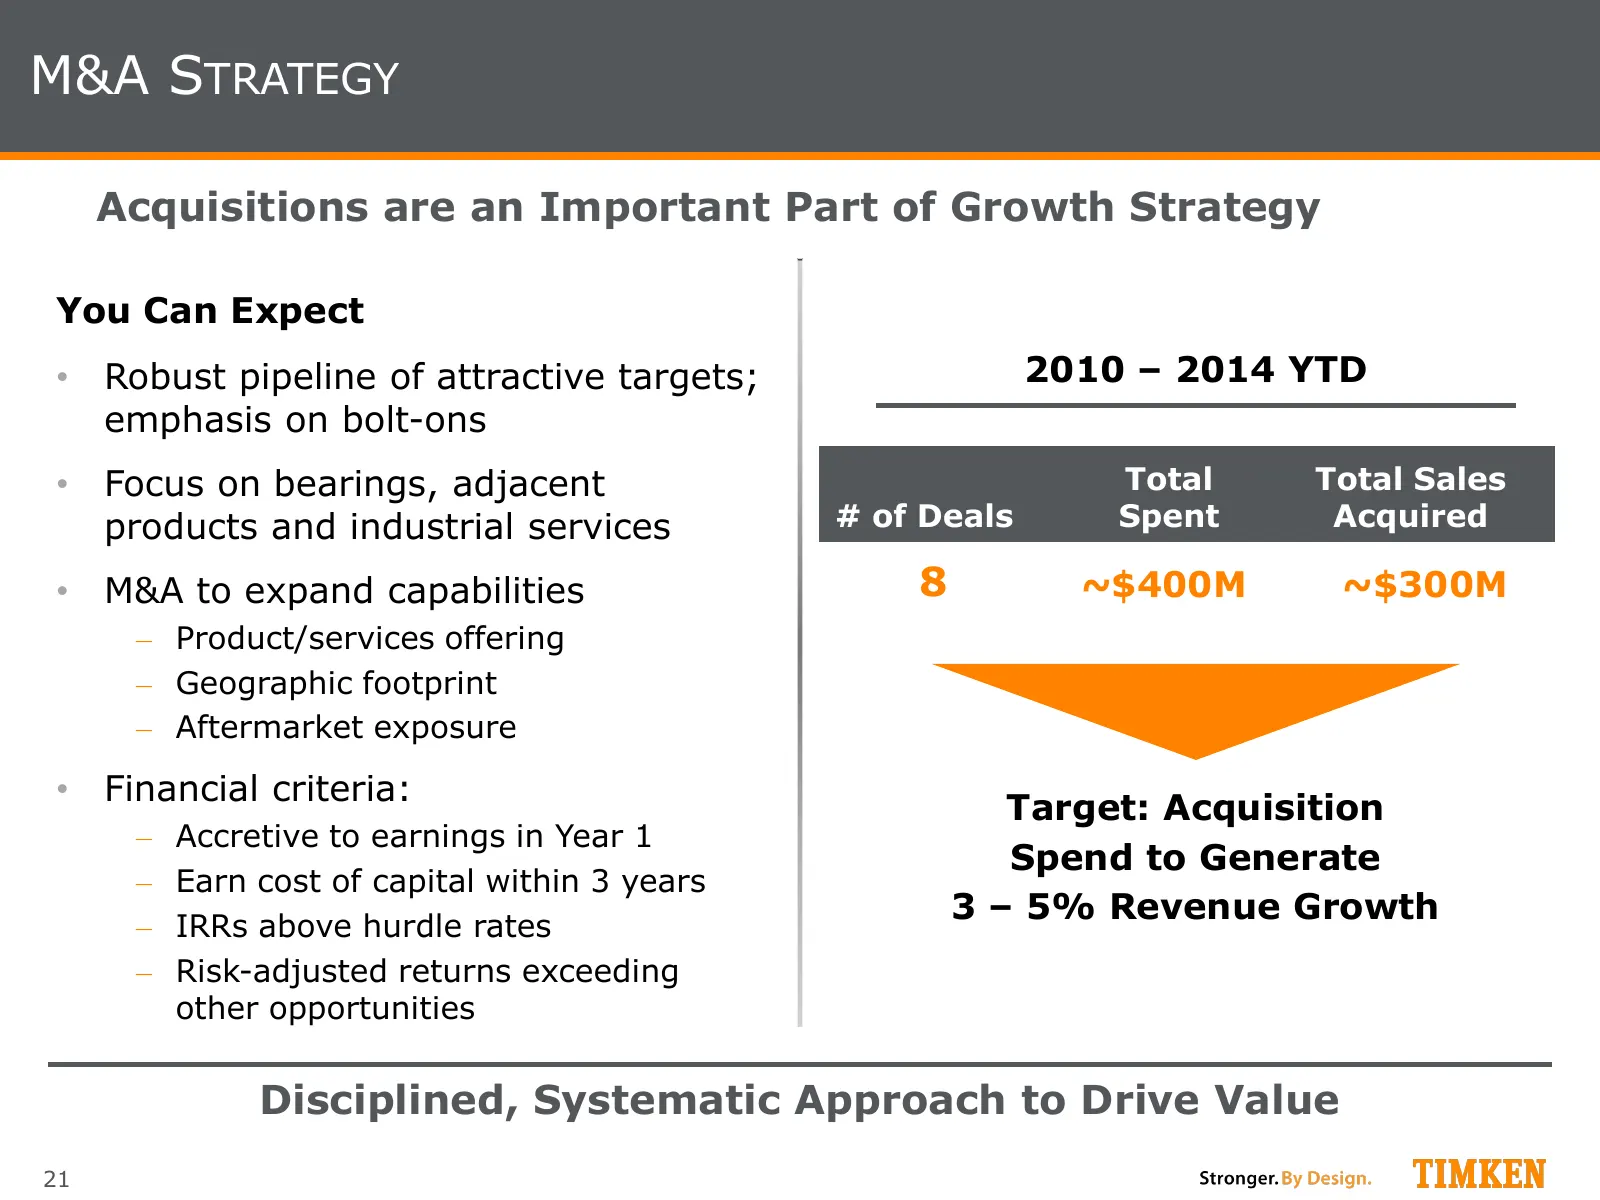
Slide 21: M&A Strategy
M&A STRATEGY Acquisitions are an Important Part of Growth Strategy You Can Expect • Robust pipeline of attractive targets; 2010 – 2014 YTD emphasis on bolt-ons • Focus on bearings, adjacent Total Total Sales products and industrial services # of Deals Spent Acquired • M&A to expand capabilities 8 ~$
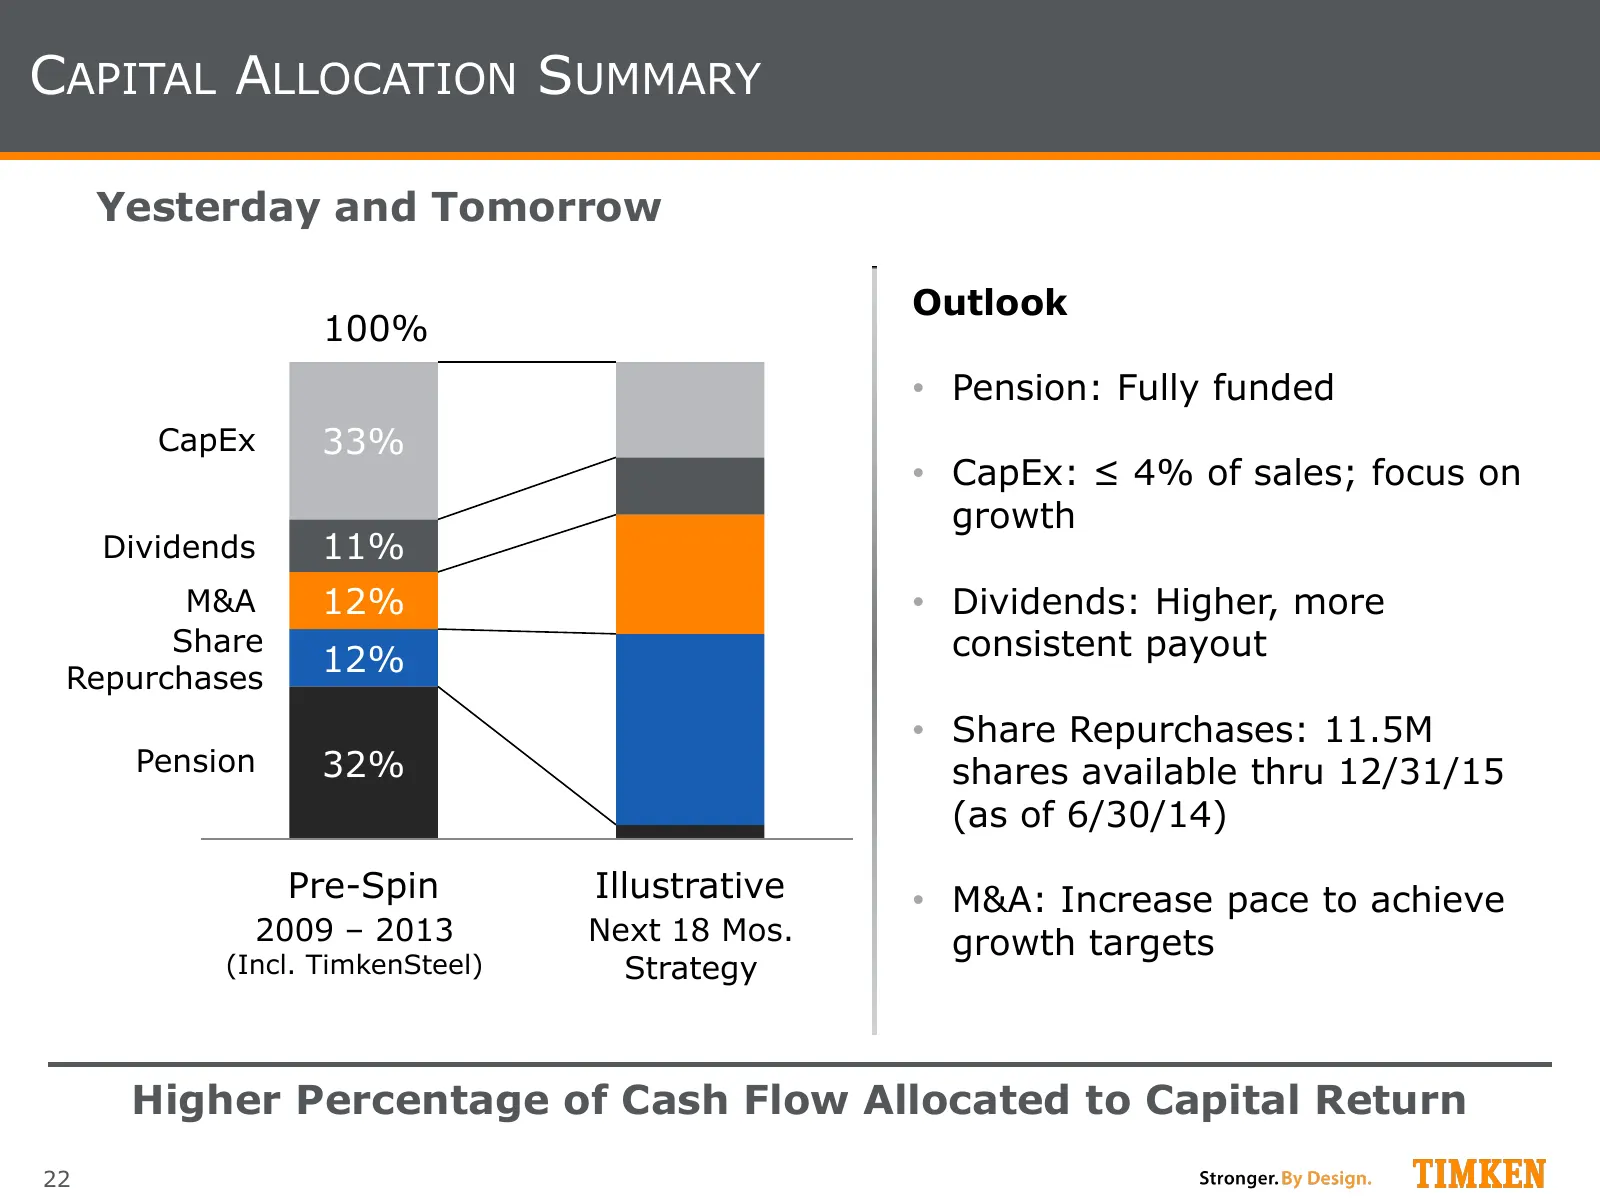
Slide 22: Capital Allocation Summary
CAPITAL ALLOCATION SUMMARY Yesterday and Tomorrow Outlook 100% • Pension: Fully funded CapEx 33% • CapEx: ≤ 4% of sales; focus on growth Dividends 11% M&A 12% • Dividends: Higher, more Share consistent payout Repurchases 12% • Share Repurchases: 11.5M Pension 32% shares available thru 12/31/15 (as o
Slide 23: Long-Term Financial Objectives
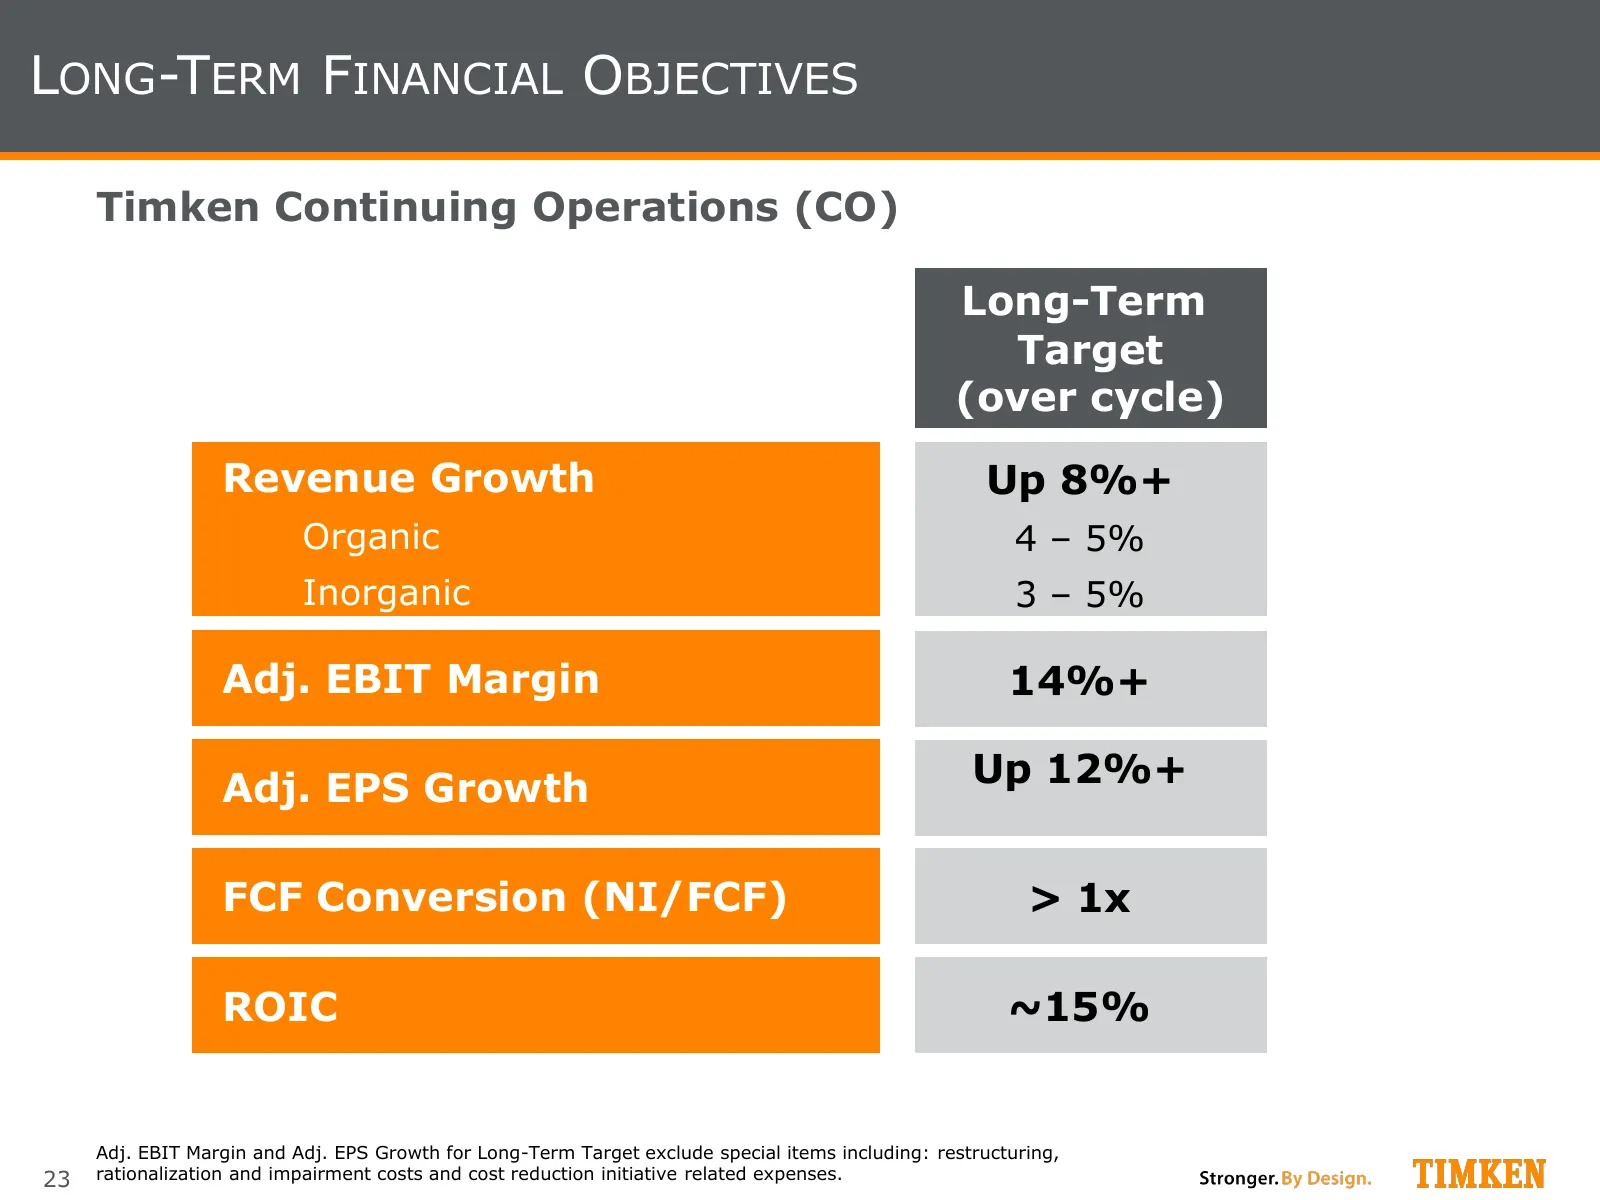
LONG-TERM FINANCIAL OBJECTIVES Timken Continuing Operations (CO) Long-Term Target (over cycle) Revenue Growth Up 8%+ Organic 4 – 5% Inorganic 3 – 5% Adj. EBIT Margin 14%+ Adj. EPS Growth Up 12%+ FCF Conversion (NI/FCF) > 1x ROIC ~15% Adj. EBIT Margin and Adj. EPS Growth for Long-Term Target exclude
Slide 24: Key Take-Aways
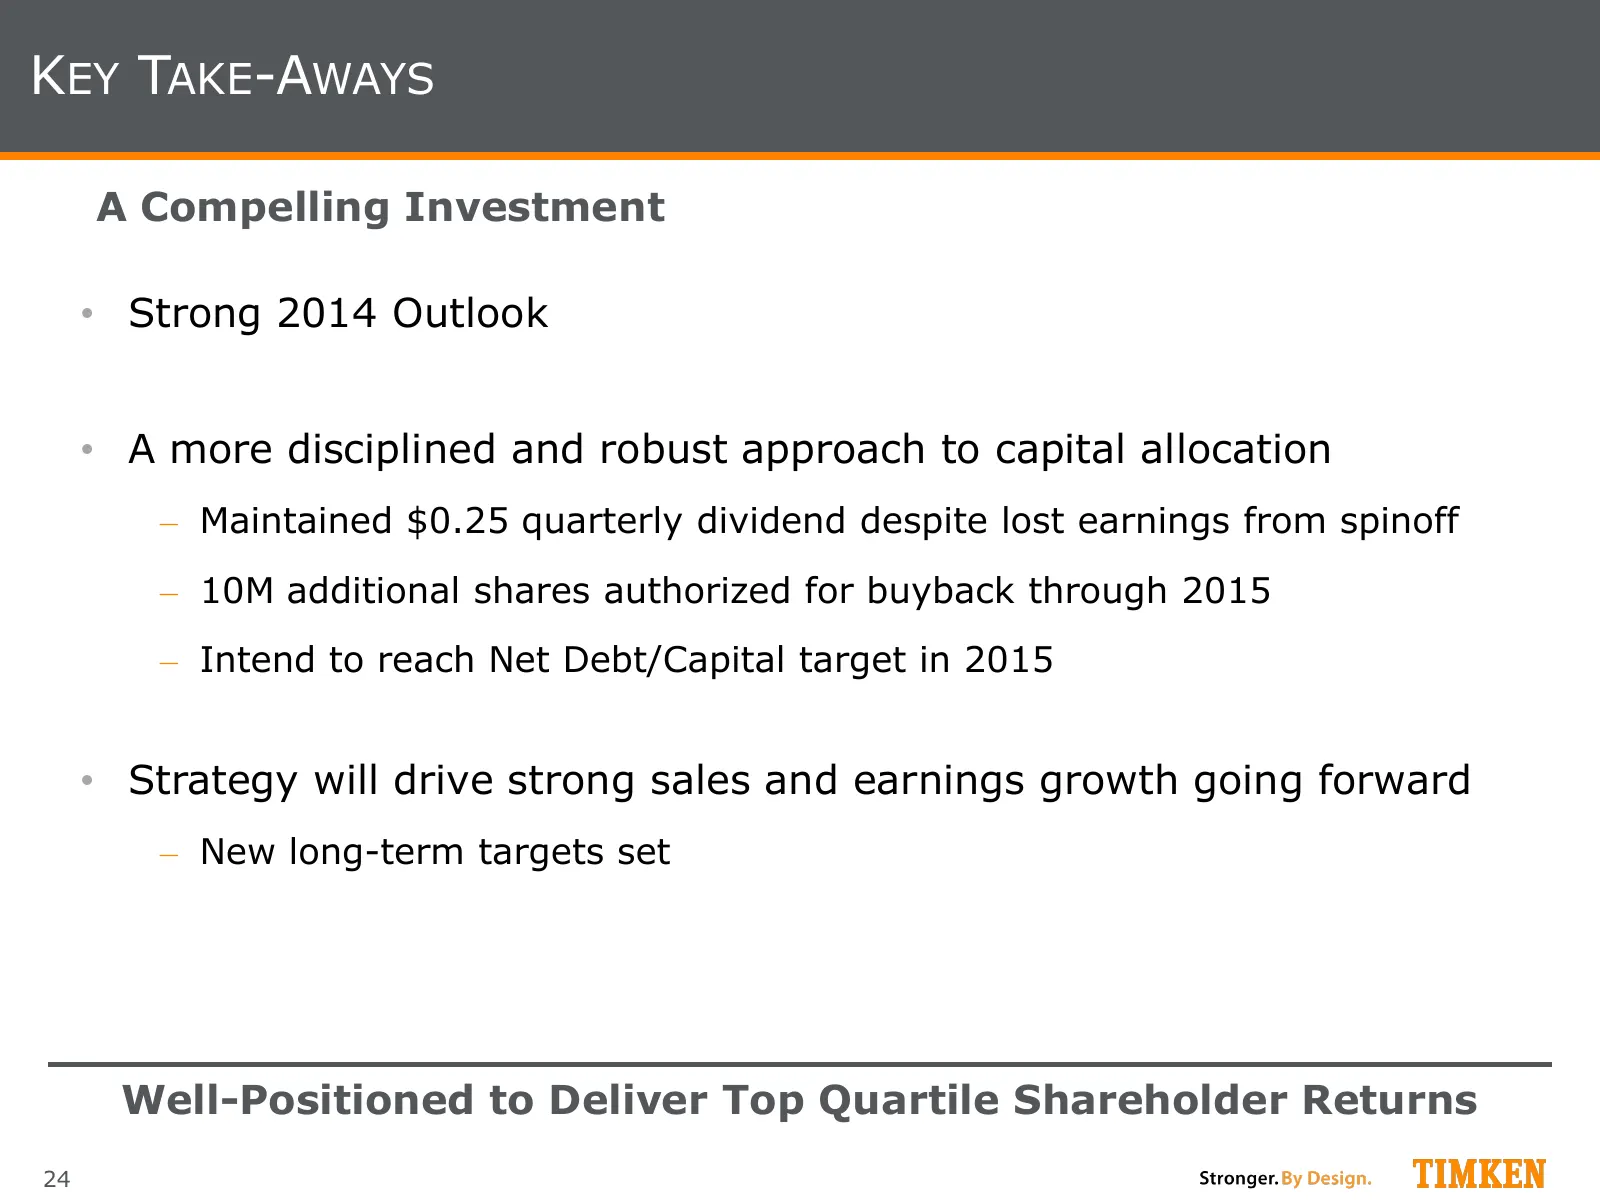
KEY TAKE-AWAYS A Compelling Investment • Strong 2014 Outlook • A more disciplined and robust approach to capital allocation ‒ Maintained $0.25 quarterly dividend despite lost earnings from spinoff ‒ 10M additional shares authorized for buyback through 2015 ‒ Intend to reach Net Debt/Capital target i

Slide 25: Morgan Stanley Investor Conference
Morgan Stanley Investor Conference Laguna Beach, Calif. • September 15, 2014
Slide 26: Appendix
Stronger. By Design. Appendix
Slide 27: Large, Highly Fragmented Addressable Market
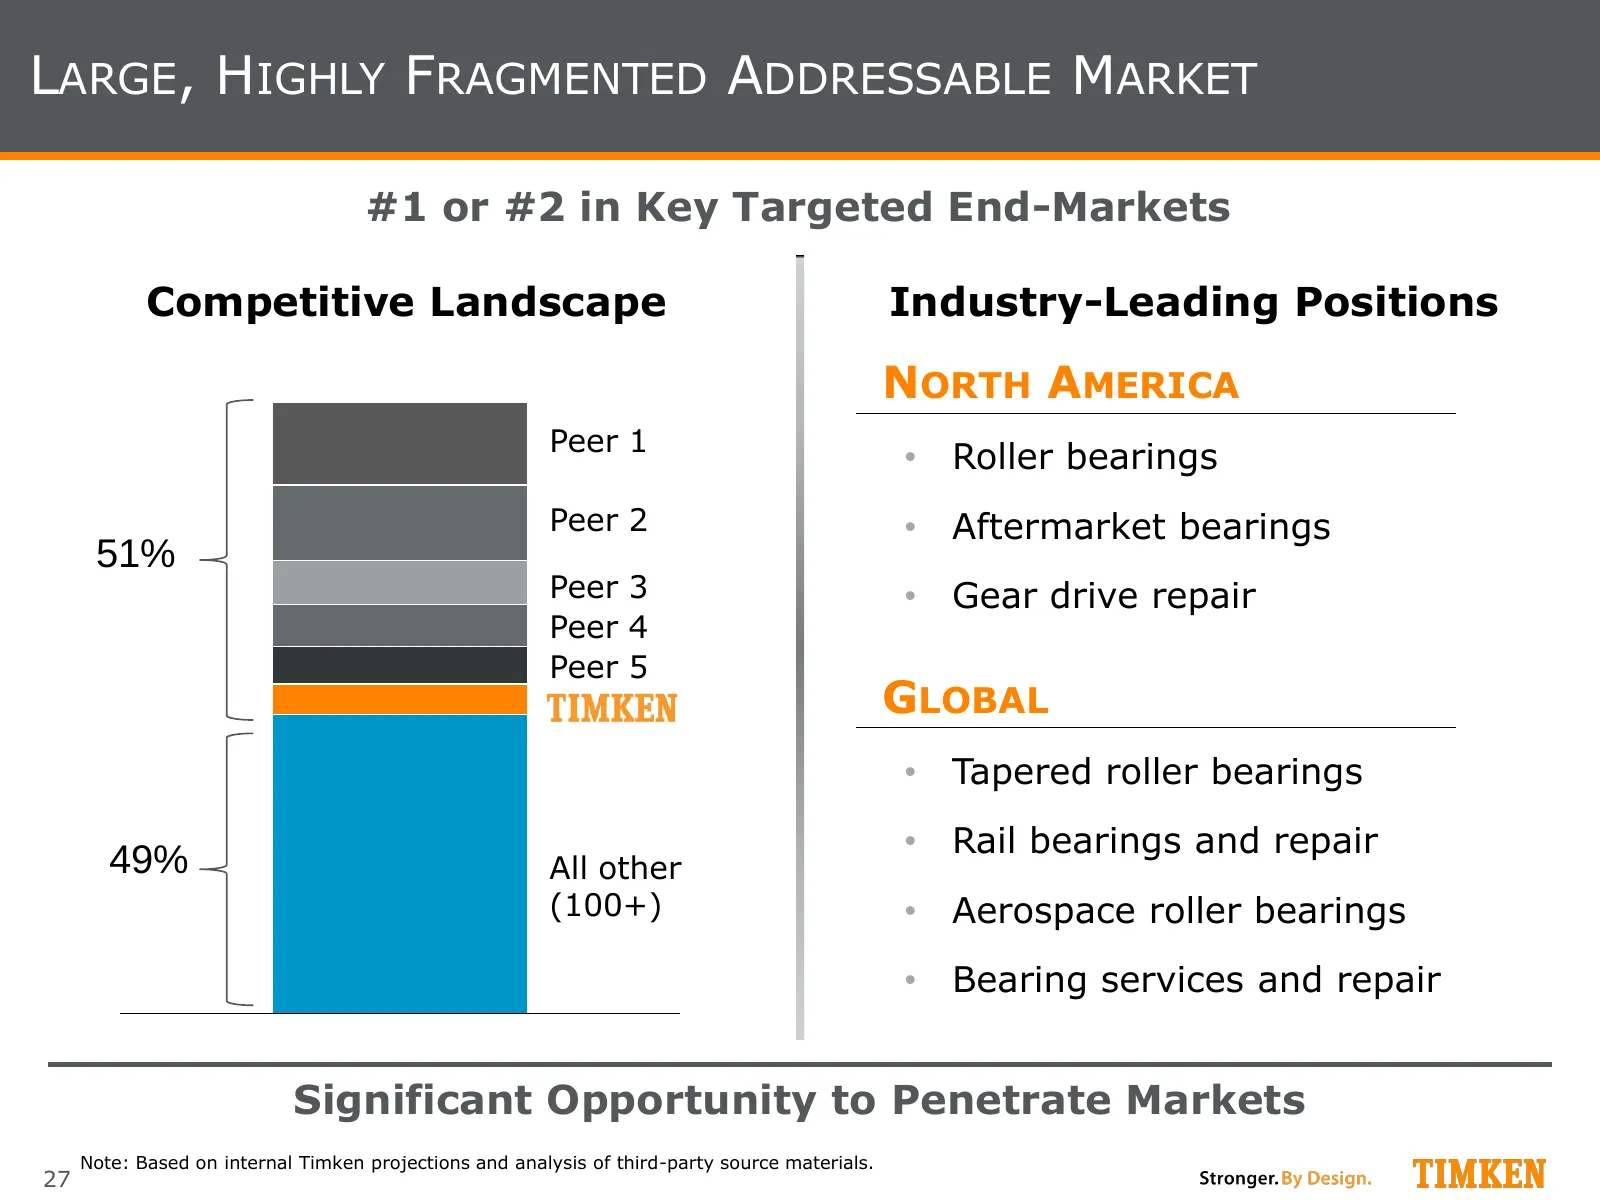
LARGE, HIGHLY FRAGMENTED ADDRESSABLE MARKET #1 or #2 in Key Targeted End-Markets Competitive Landscape Industry-Leading Positions NORTH AMERICA Peer 1 • Roller bearings Peer 2 • Aftermarket bearings 51% Peer 3 • Gear drive repair Peer 4 Peer 5 GLOBAL • Tapered roller bearings • Rail bearings and rep
Slide 28: Mobile Industries Overview
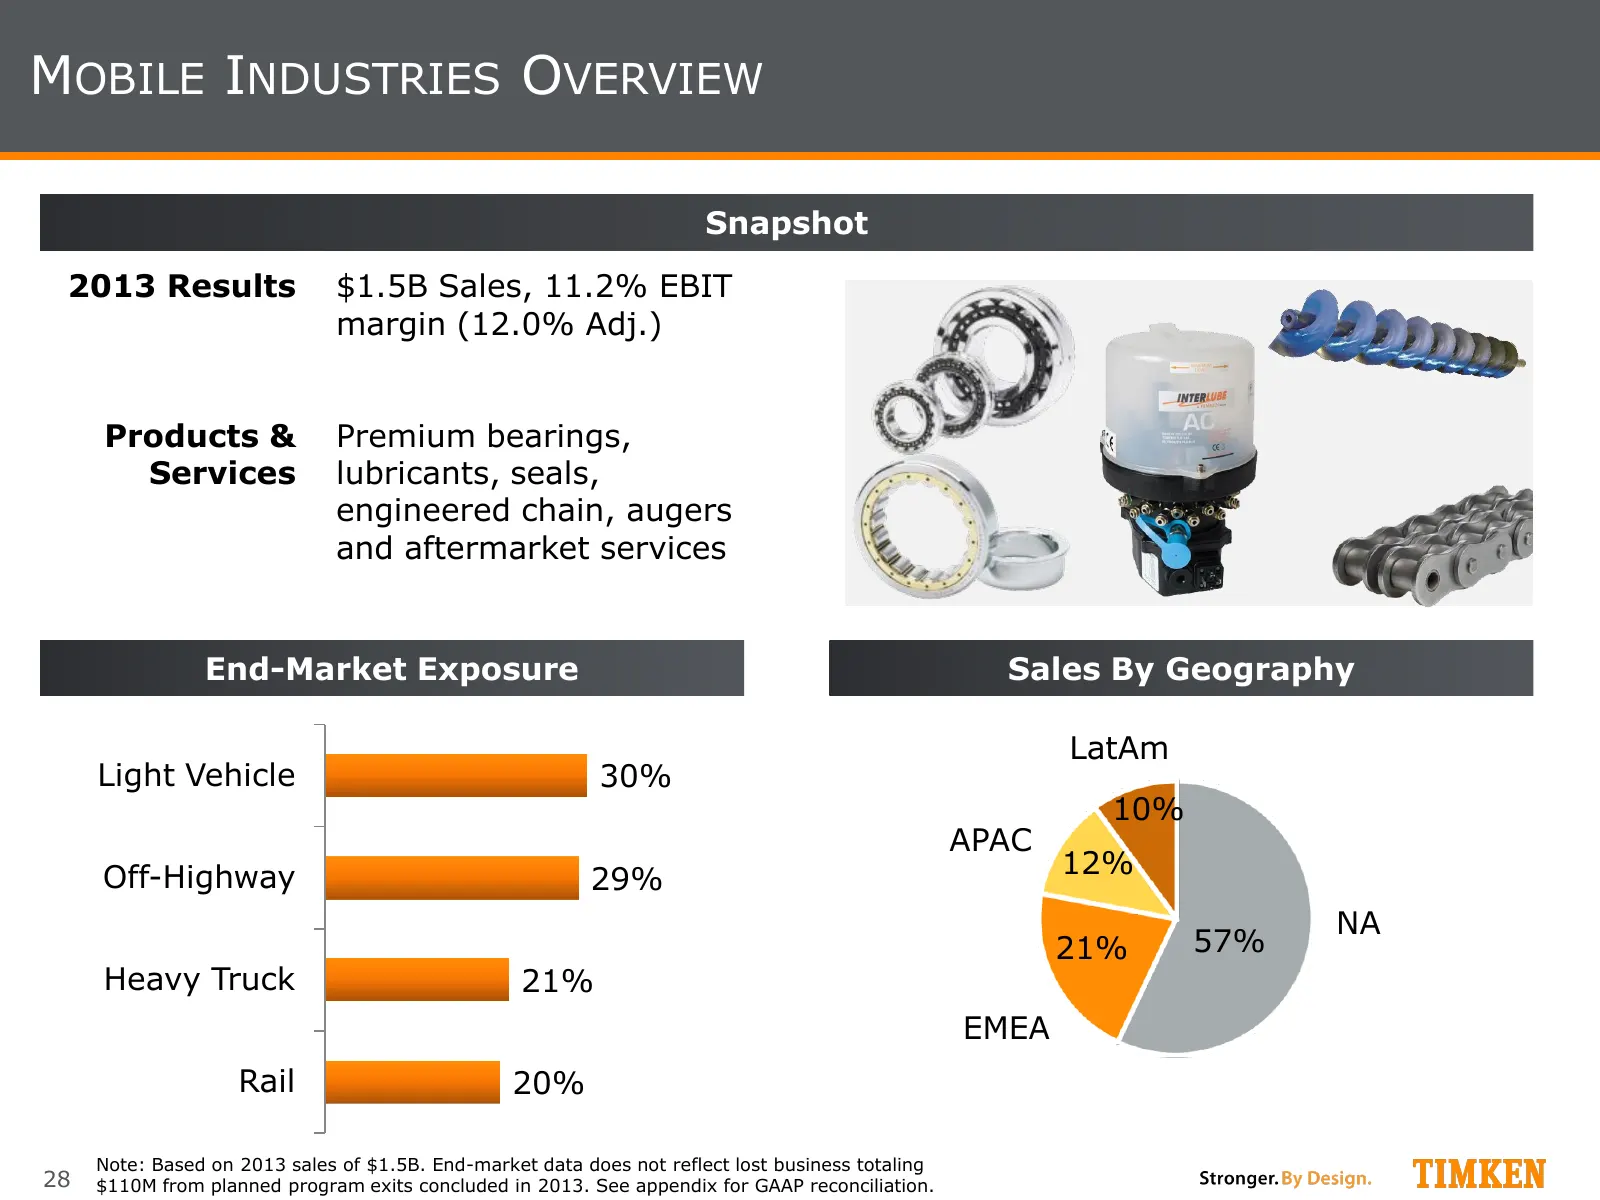
MOBILE INDUSTRIES OVERVIEW Snapshot 2013 Results $1.5B Sales, 11.2% EBIT margin (12.0% Adj.) Products & Premium bearings, Services lubricants, seals, engineered chain, augers and aftermarket services End-Market Exposure Sales By Geography LatAm Light Vehicle 30% 10% APAC Off-Highway 29% 12% NA 21% 5
Slide 29: Mobile Industries Portfolio Context: 2008-2013
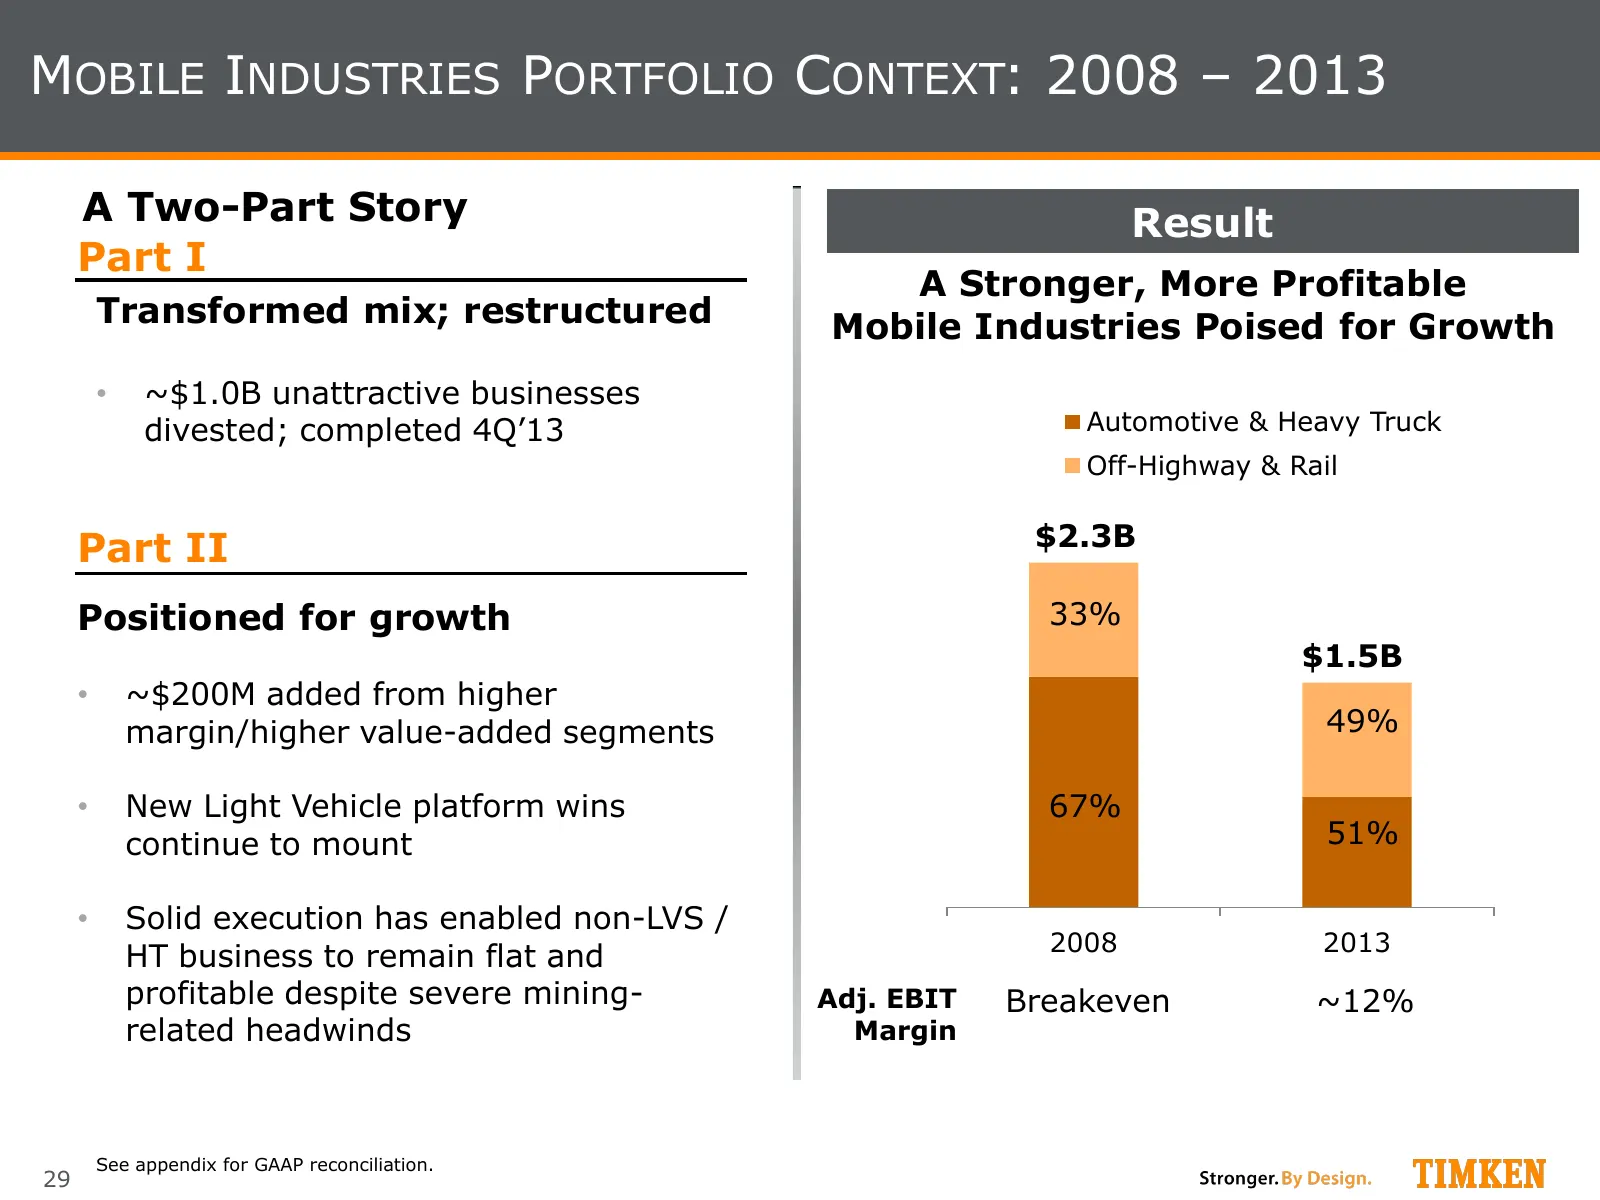
MOBILE INDUSTRIES PORTFOLIO CONTEXT: 2008 – 2013 A Two-Part Story Result Part I A Stronger, More Profitable Transformed mix; restructured Mobile Industries Poised for Growth • ~$1.0B unattractive businesses divested; completed 4Q’13 Automotive & Heavy Truck Off-Highway & Rail Part II $2.3B Positione
Slide 30: Process Industries Overview
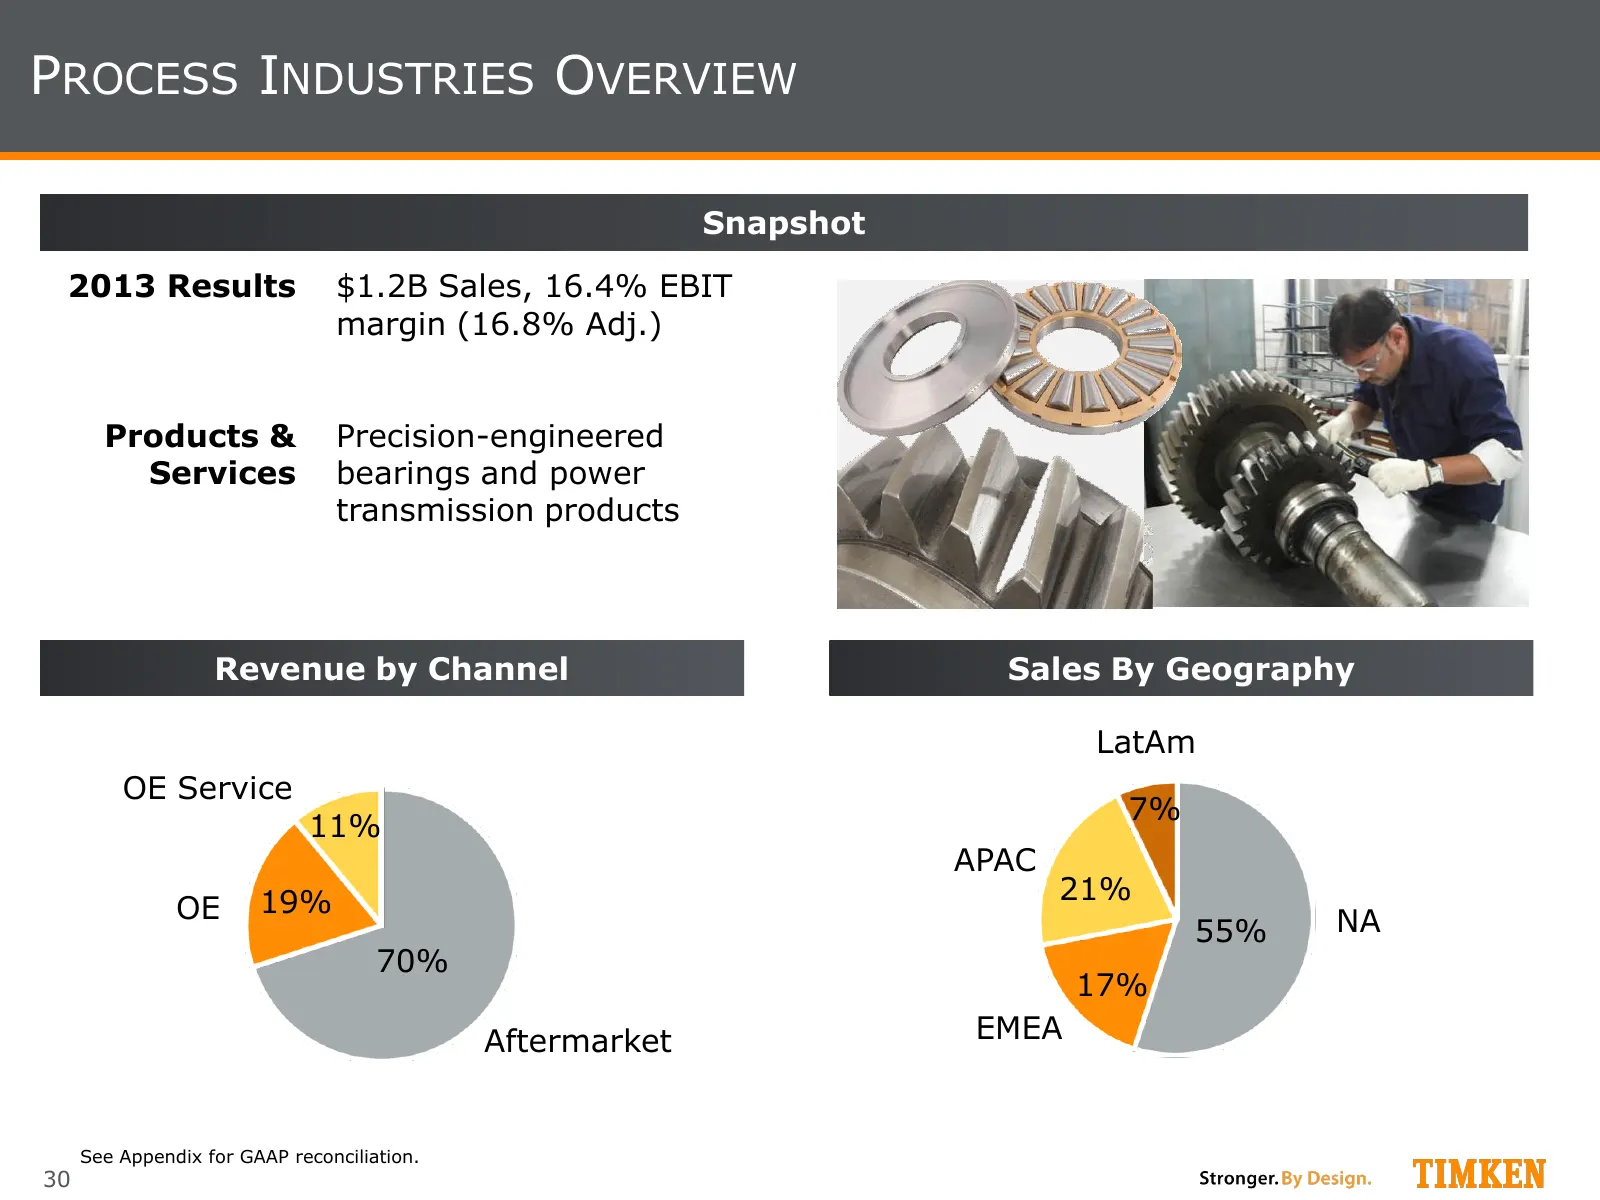
PROCESS INDUSTRIES OVERVIEW Snapshot 2013 Results $1.2B Sales, 16.4% EBIT margin (16.8% Adj.) Products & Precision-engineered Services bearings and power transmission products Revenue by Channel Sales By Geography LatAm OE Service 7% 11% APAC 19% 21% OE NA 55% 70% 17% Aftermarket EMEA See Appendix f
Slide 31: Process Industries Strategy - A Look Forward
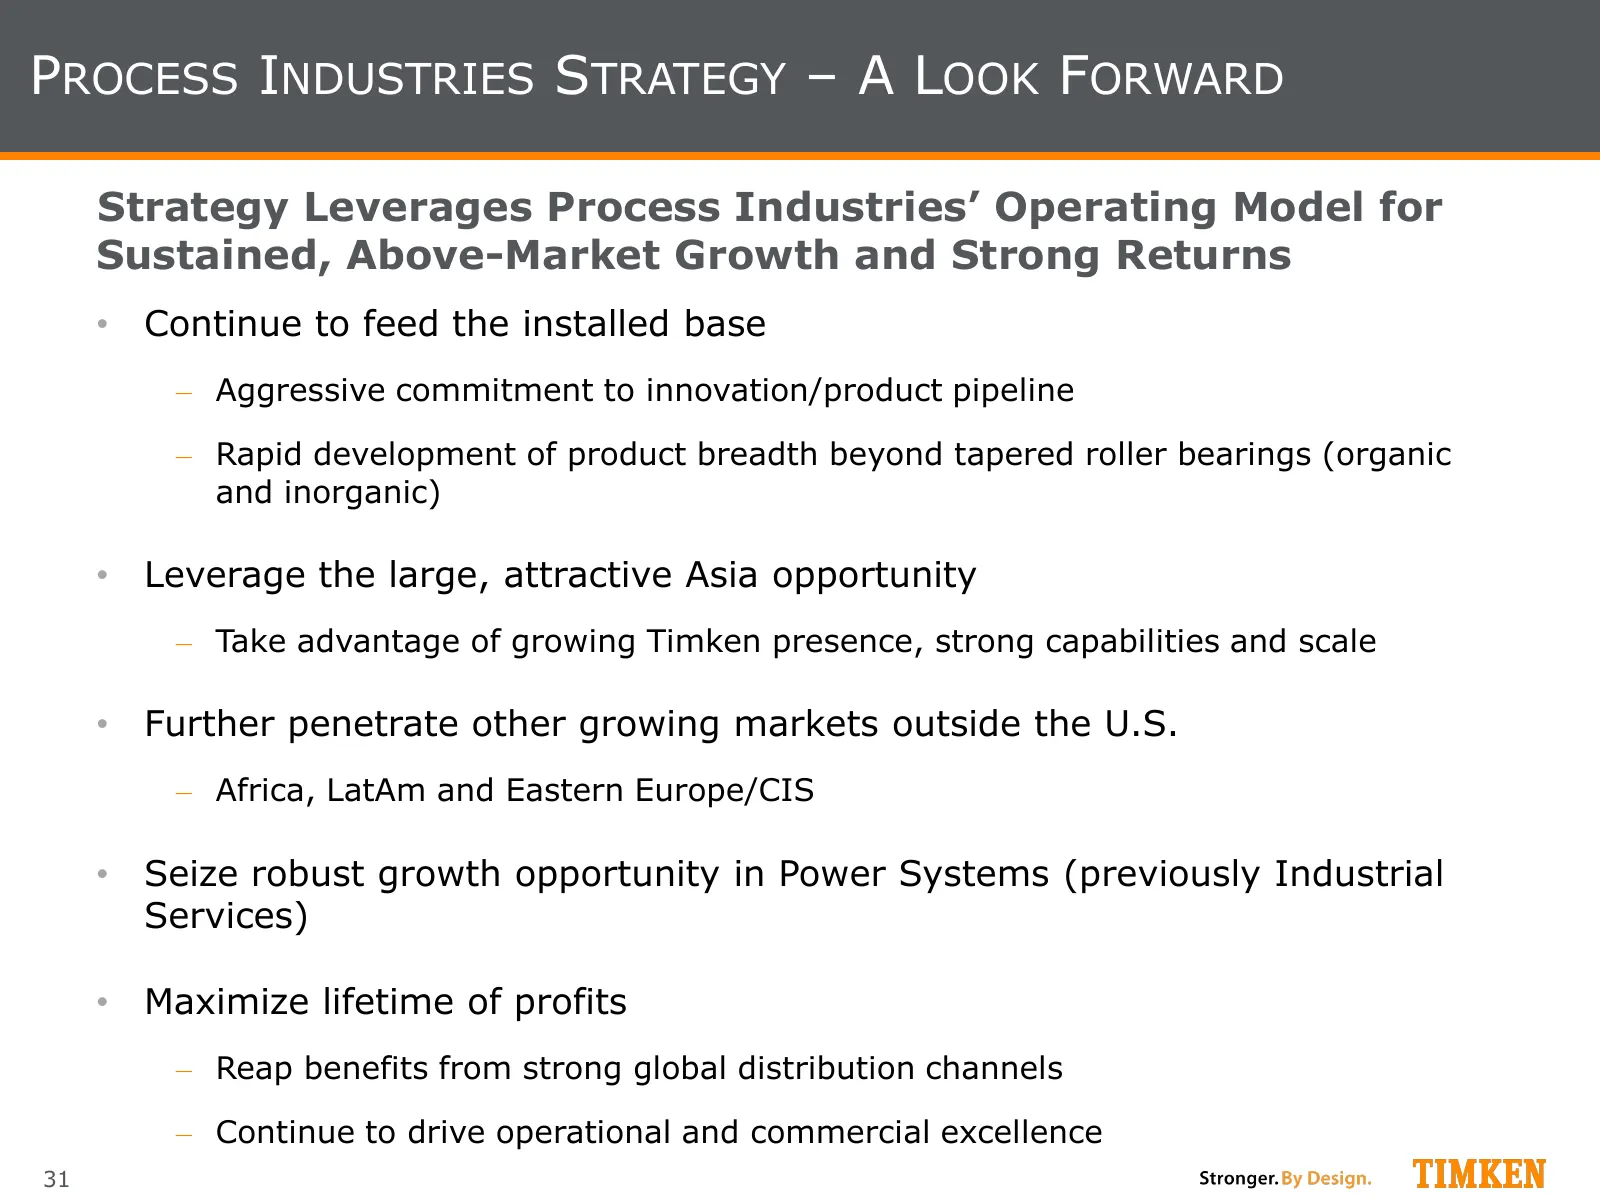
PROCESS INDUSTRIES STRATEGY – A LOOK FORWARD Strategy Leverages Process Industries’ Operating Model for Sustained, Above-Market Growth and Strong Returns • Continue to feed the installed base ‒ Aggressive commitment to innovation/product pipeline ‒ Rapid development of product breadth beyond tapered
Slide 32: Aerospace Overview
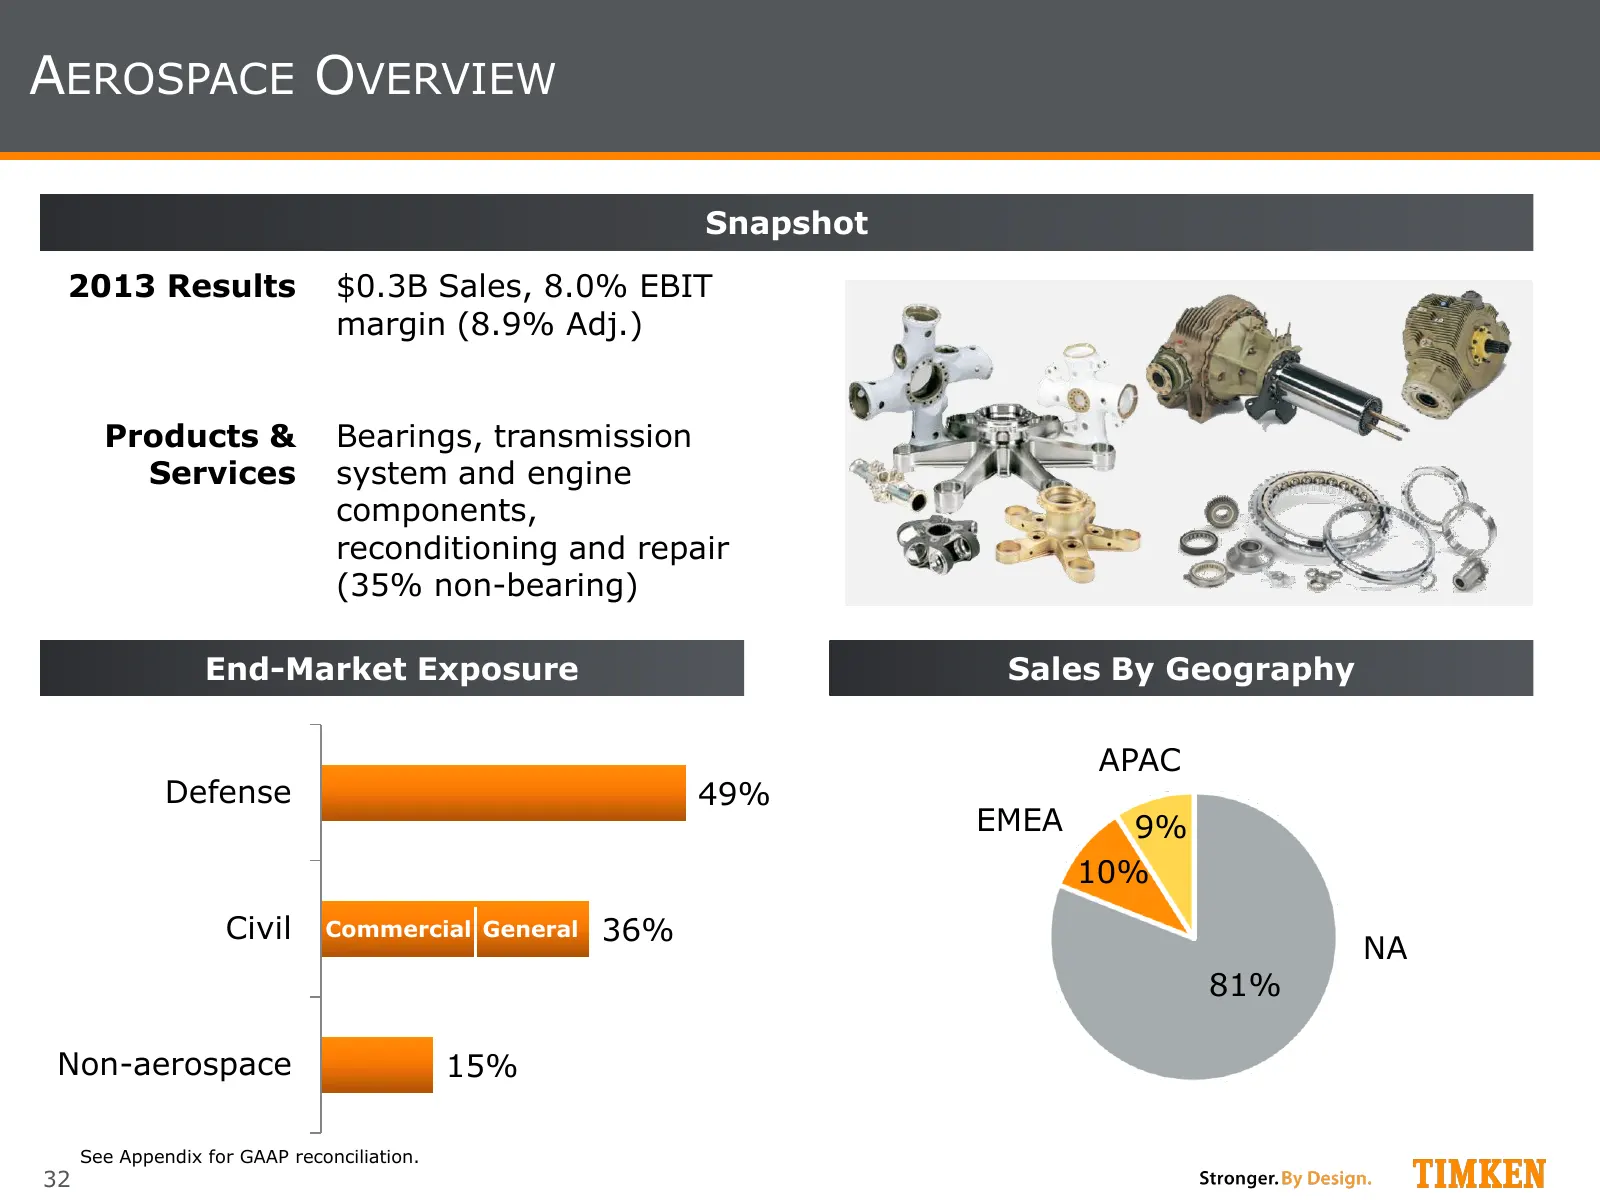
AEROSPACE OVERVIEW Snapshot 2013 Results $0.3B Sales, 8.0% EBIT margin (8.9% Adj.) Products & Bearings, transmission Services system and engine components, reconditioning and repair (35% non-bearing) End-Market Exposure Sales By Geography APAC Defense 49% EMEA 9% 10% Civil Commercial General 36% NA
Slide 33: Aerospace Restructuring & Reorganization
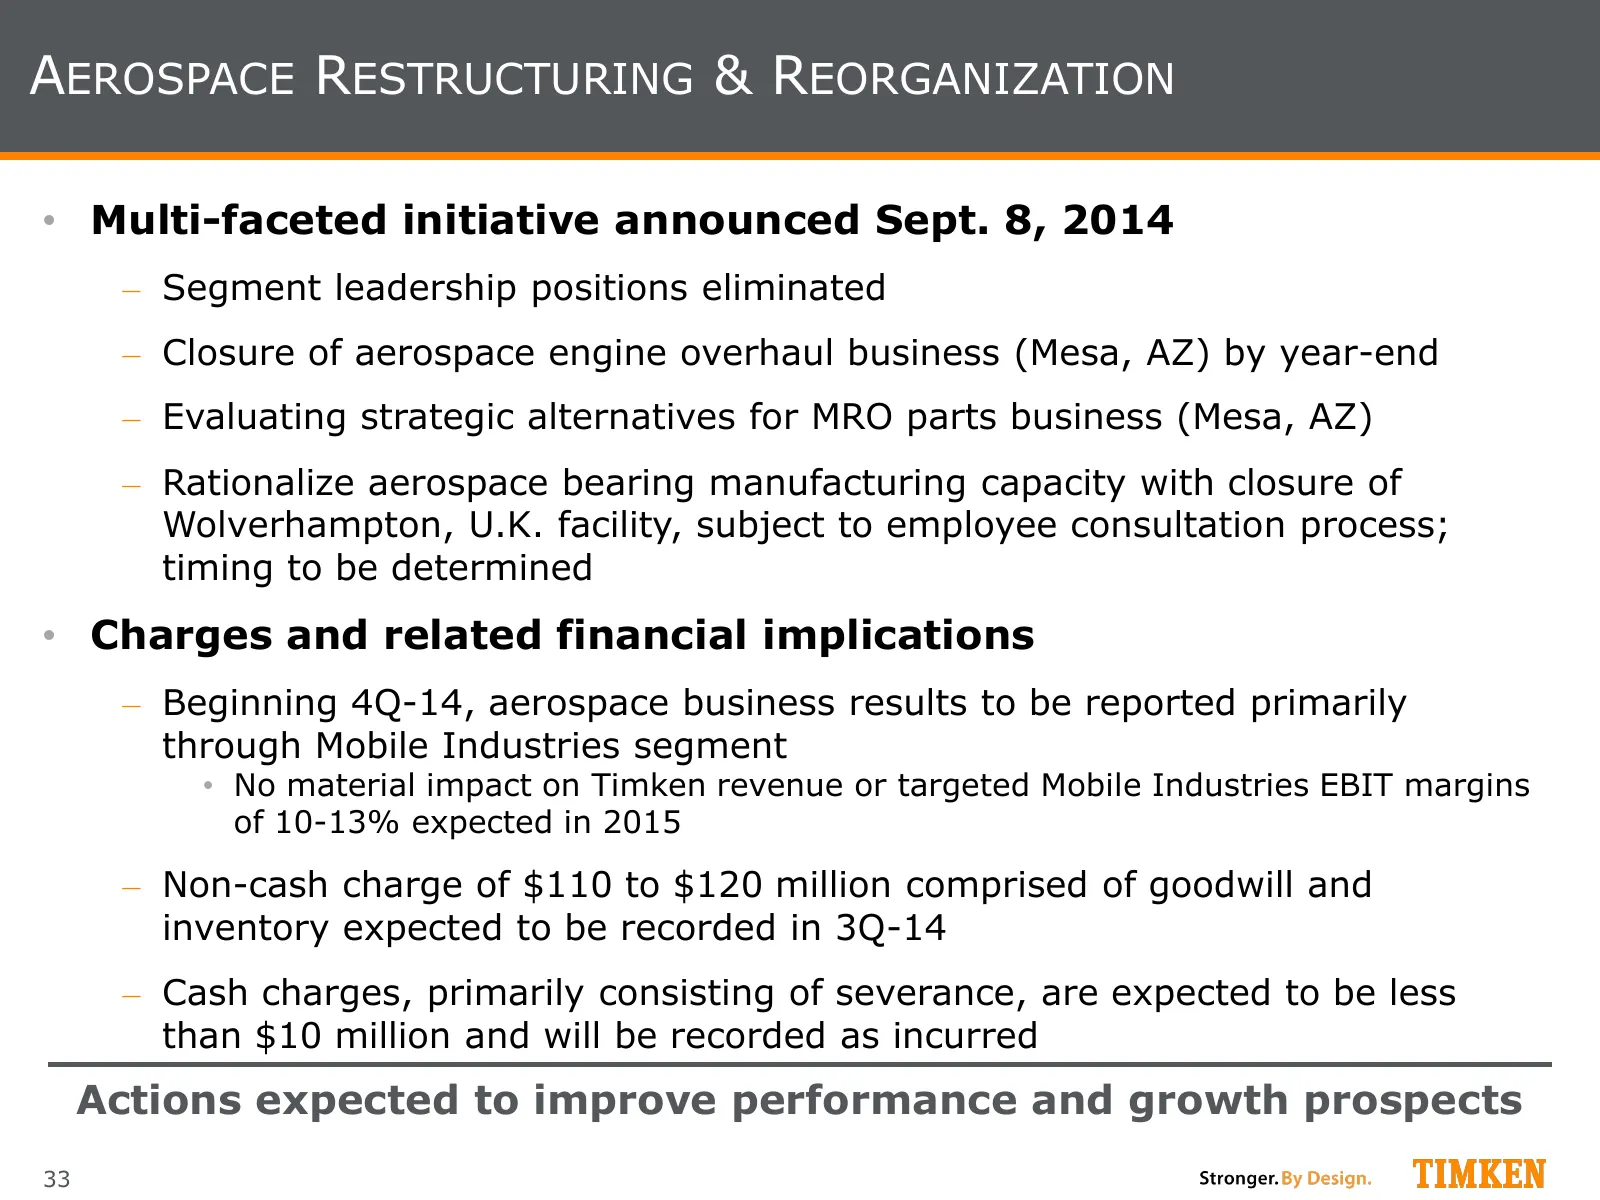
AEROSPACE RESTRUCTURING & REORGANIZATION • Multi-faceted initiative announced Sept. 8, 2014 ‒ Segment leadership positions eliminated ‒ Closure of aerospace engine overhaul business (Mesa, AZ) by year-end ‒ Evaluating strategic alternatives for MRO parts business (Mesa, AZ) ‒ Rationalize aerospace b
Slide 34: GAAP Reconciliation: 2004-2013
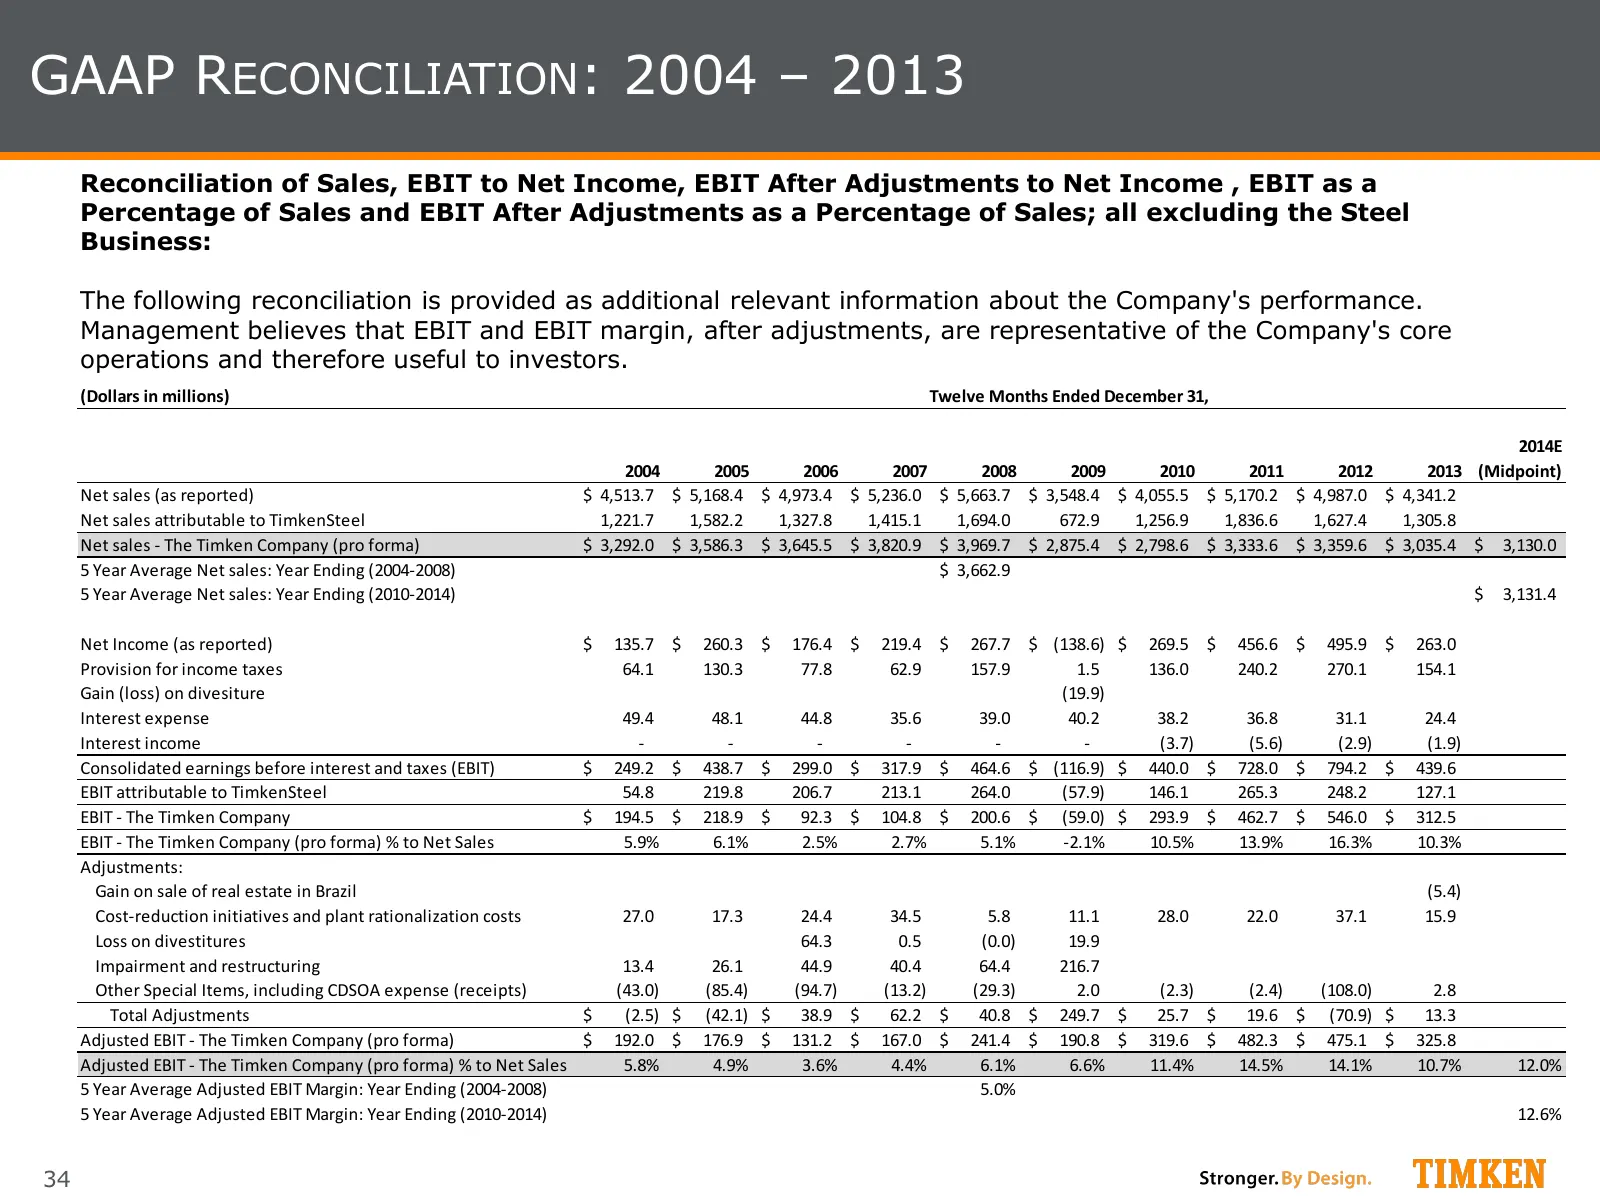
GAAP RECONCILIATION: 2004 – 2013 Reconciliation of Sales, EBIT to Net Income, EBIT After Adjustments to Net Income , EBIT as a Percentage of Sales and EBIT After Adjustments as a Percentage of Sales; all excluding the Steel Business: The following reconciliation is provided as additional relevant in
Slide 35: GAAP Reconciliation: Debt / EBITDA
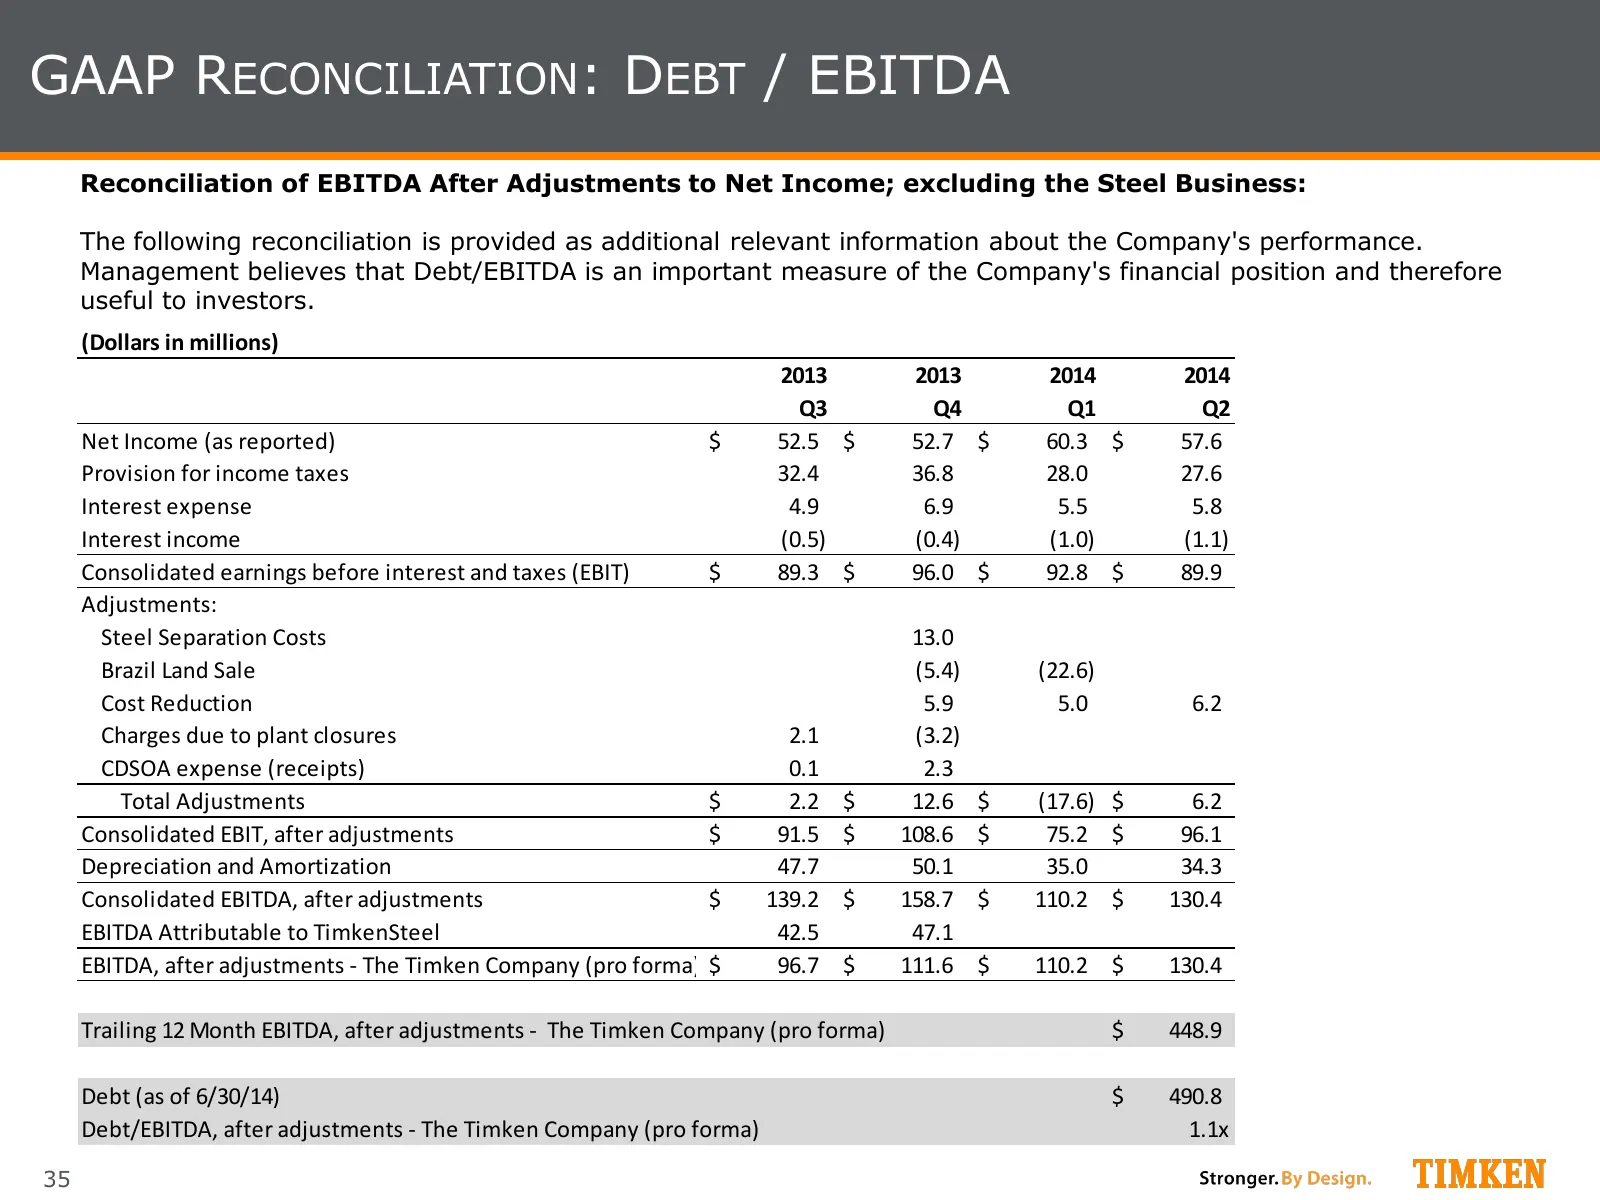
GAAP RECONCILIATION: DEBT / EBITDA Reconciliation of EBITDA After Adjustments to Net Income; excluding the Steel Business: The following reconciliation is provided as additional relevant information about the Company's performance. Management believes that Debt/EBITDA is an important measure of the
Slide 36: GAAP Reconciliation: Net Debt / Capital
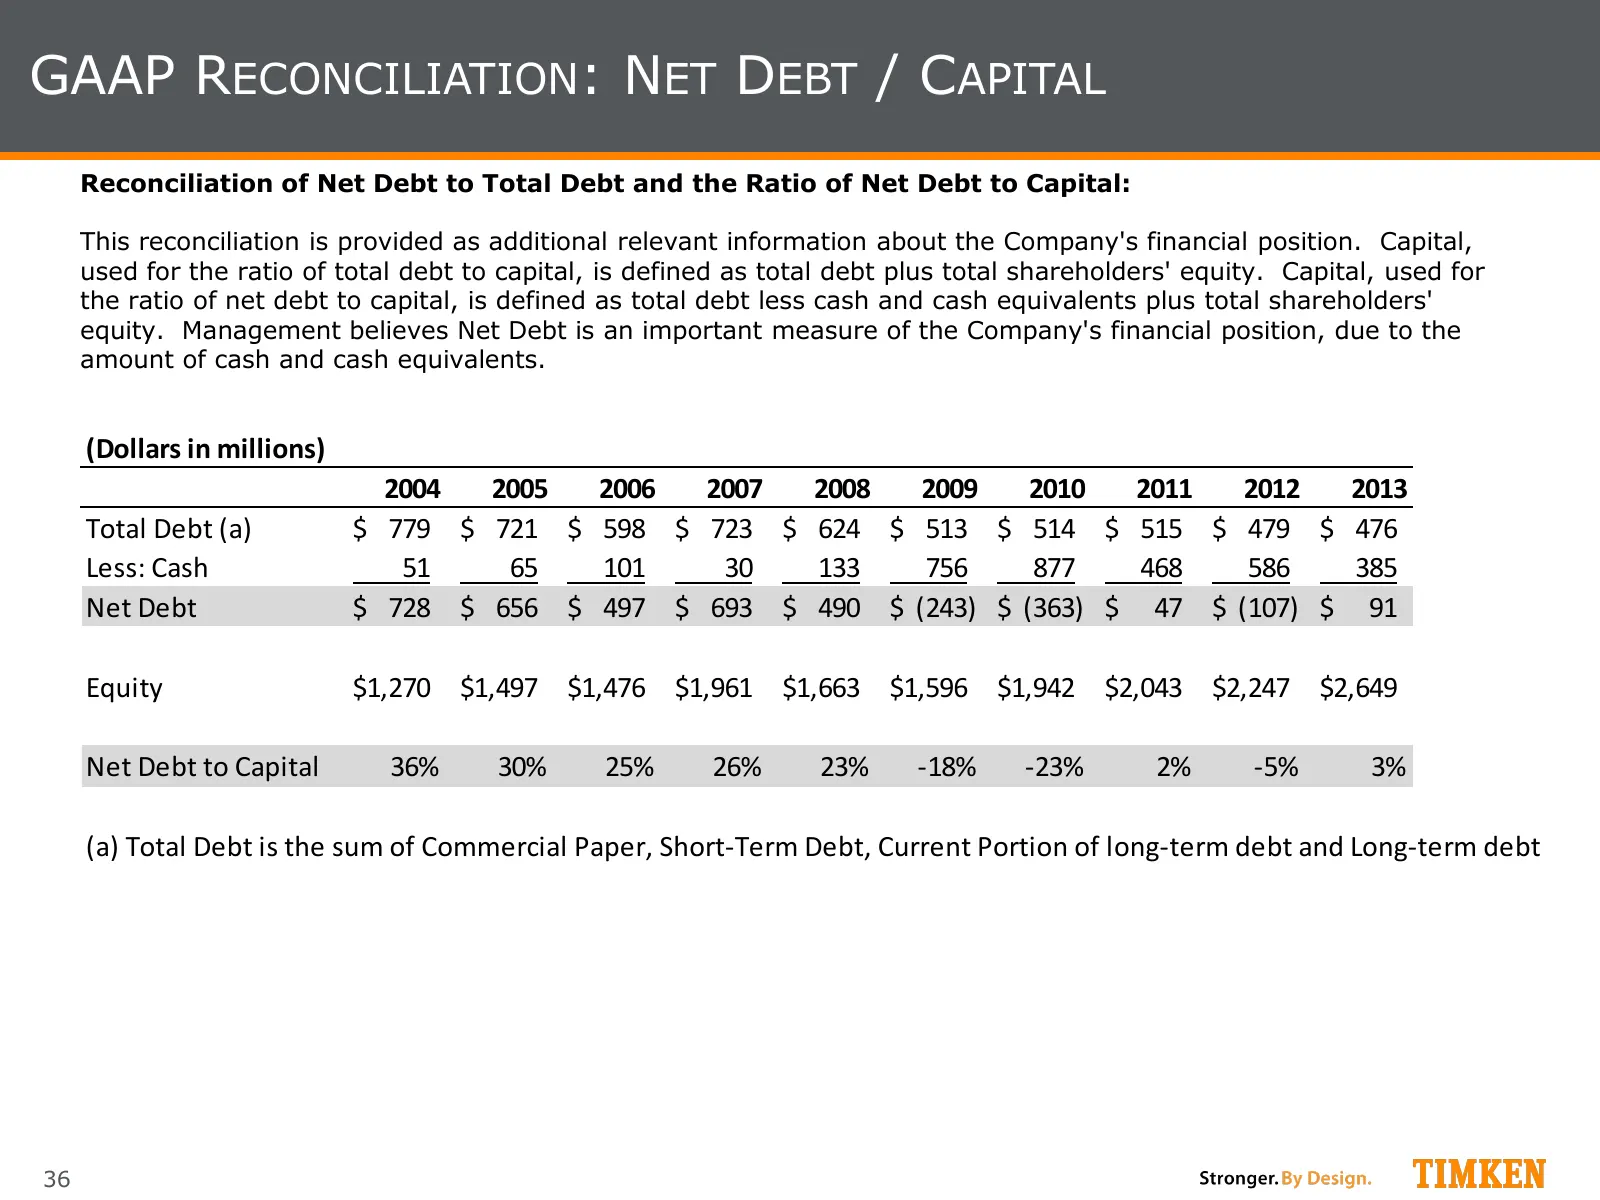
GAAP RECONCILIATION: NET DEBT / CAPITAL Reconciliation of Net Debt to Total Debt and the Ratio of Net Debt to Capital: This reconciliation is provided as additional relevant information about the Company's financial position. Capital, used for the ratio of total debt to capital, is defined as total
Slide 37: GAAP Reconciliation: Net Debt / Capital (2Q-2014)
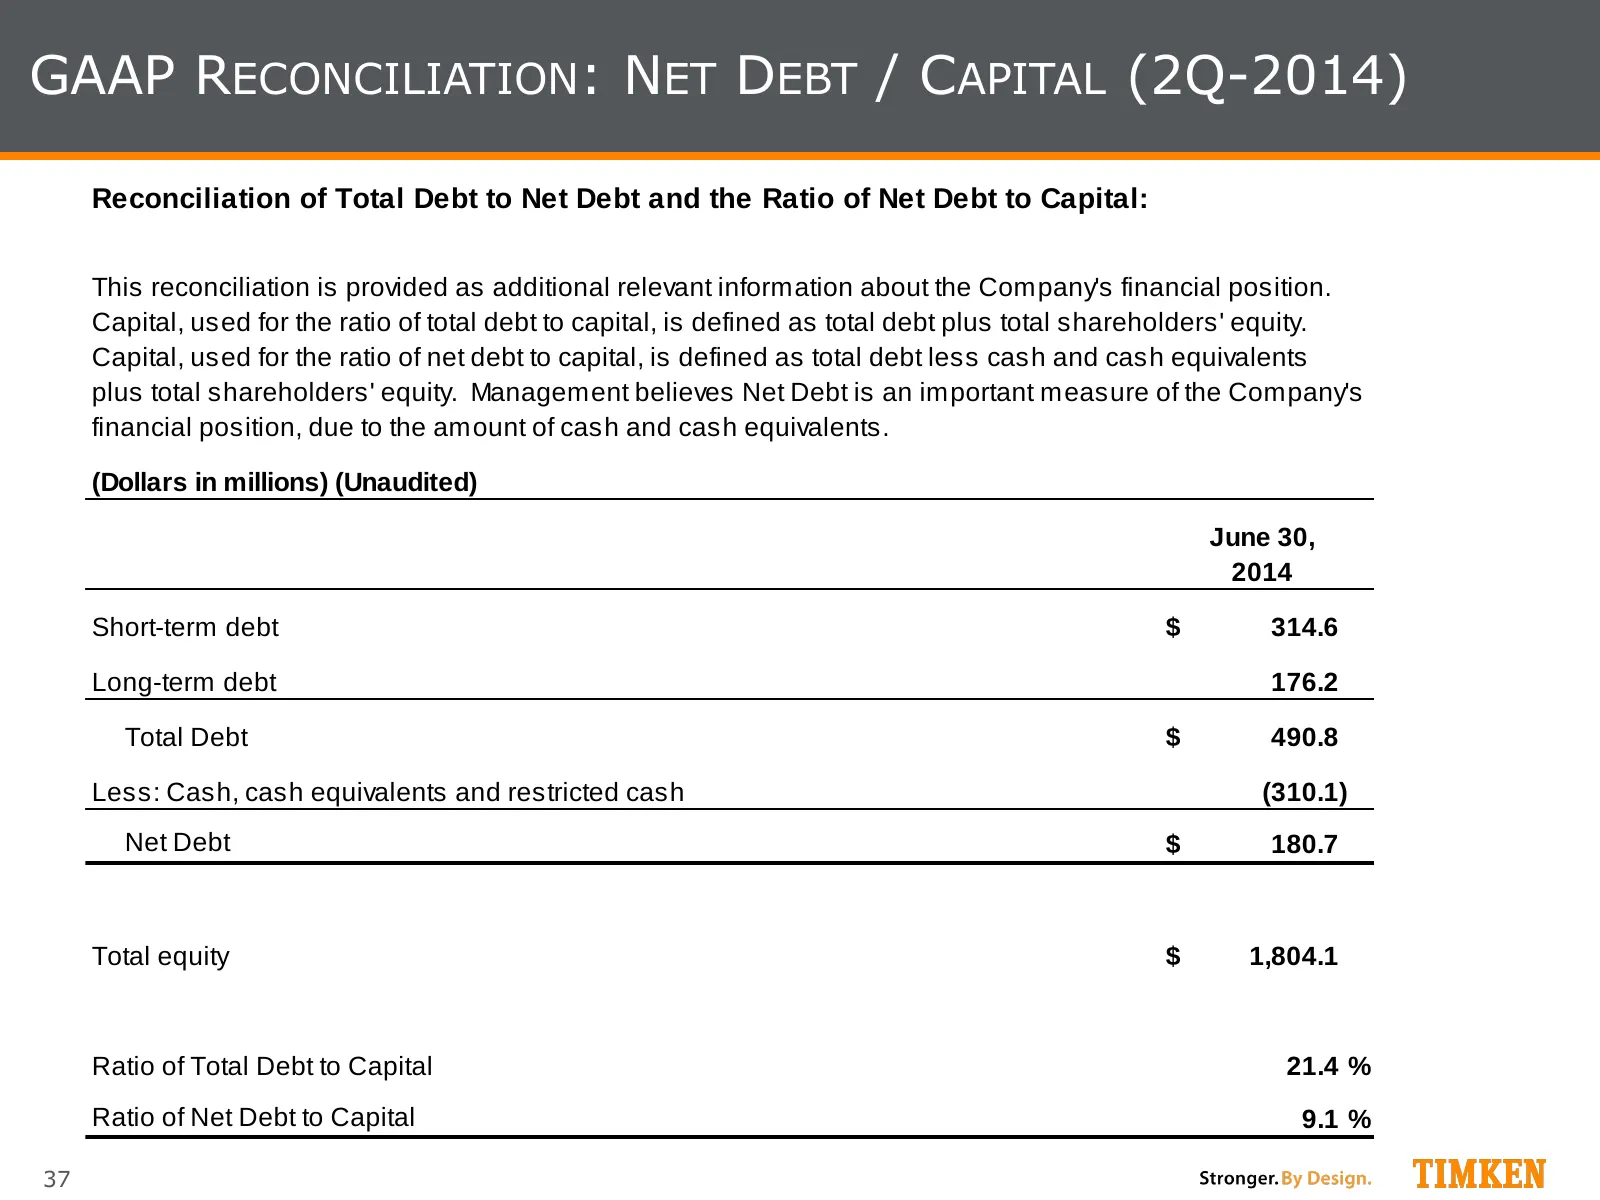
GAAP RECONCILIATION: NET DEBT / CAPITAL (2Q-2014) Reconciliation of Total Debt to Net Debt and the Ratio of Net Debt to Capital: This reconciliation is provided as additional relevant information about the Company's financial position. Capital, used for the ratio of total debt to capital, is defined
Slide 38: GAAP Reconciliation: Pro Forma EPS
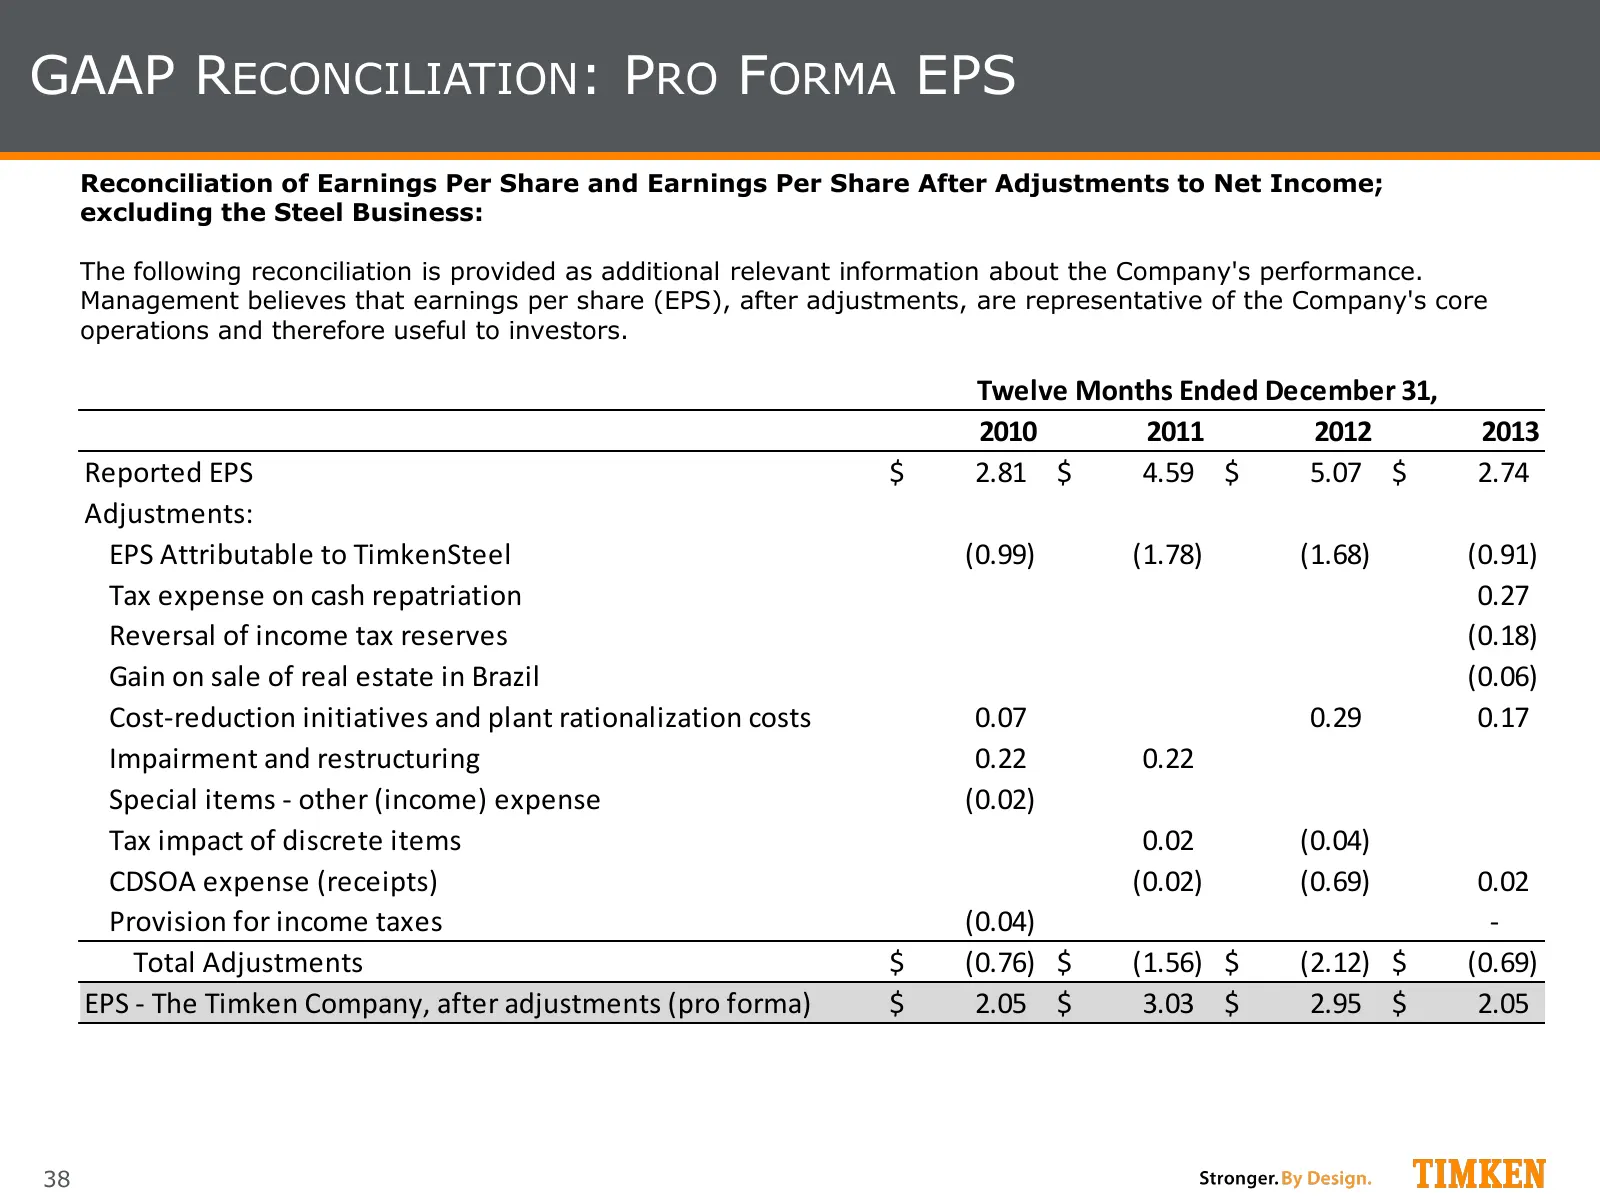
GAAP RECONCILIATION: PRO FORMA EPS Reconciliation of Earnings Per Share and Earnings Per Share After Adjustments to Net Income; excluding the Steel Business: The following reconciliation is provided as additional relevant information about the Company's performance. Management believes that earnings
Slide 39: GAAP Reconciliation: Free Cash Flow
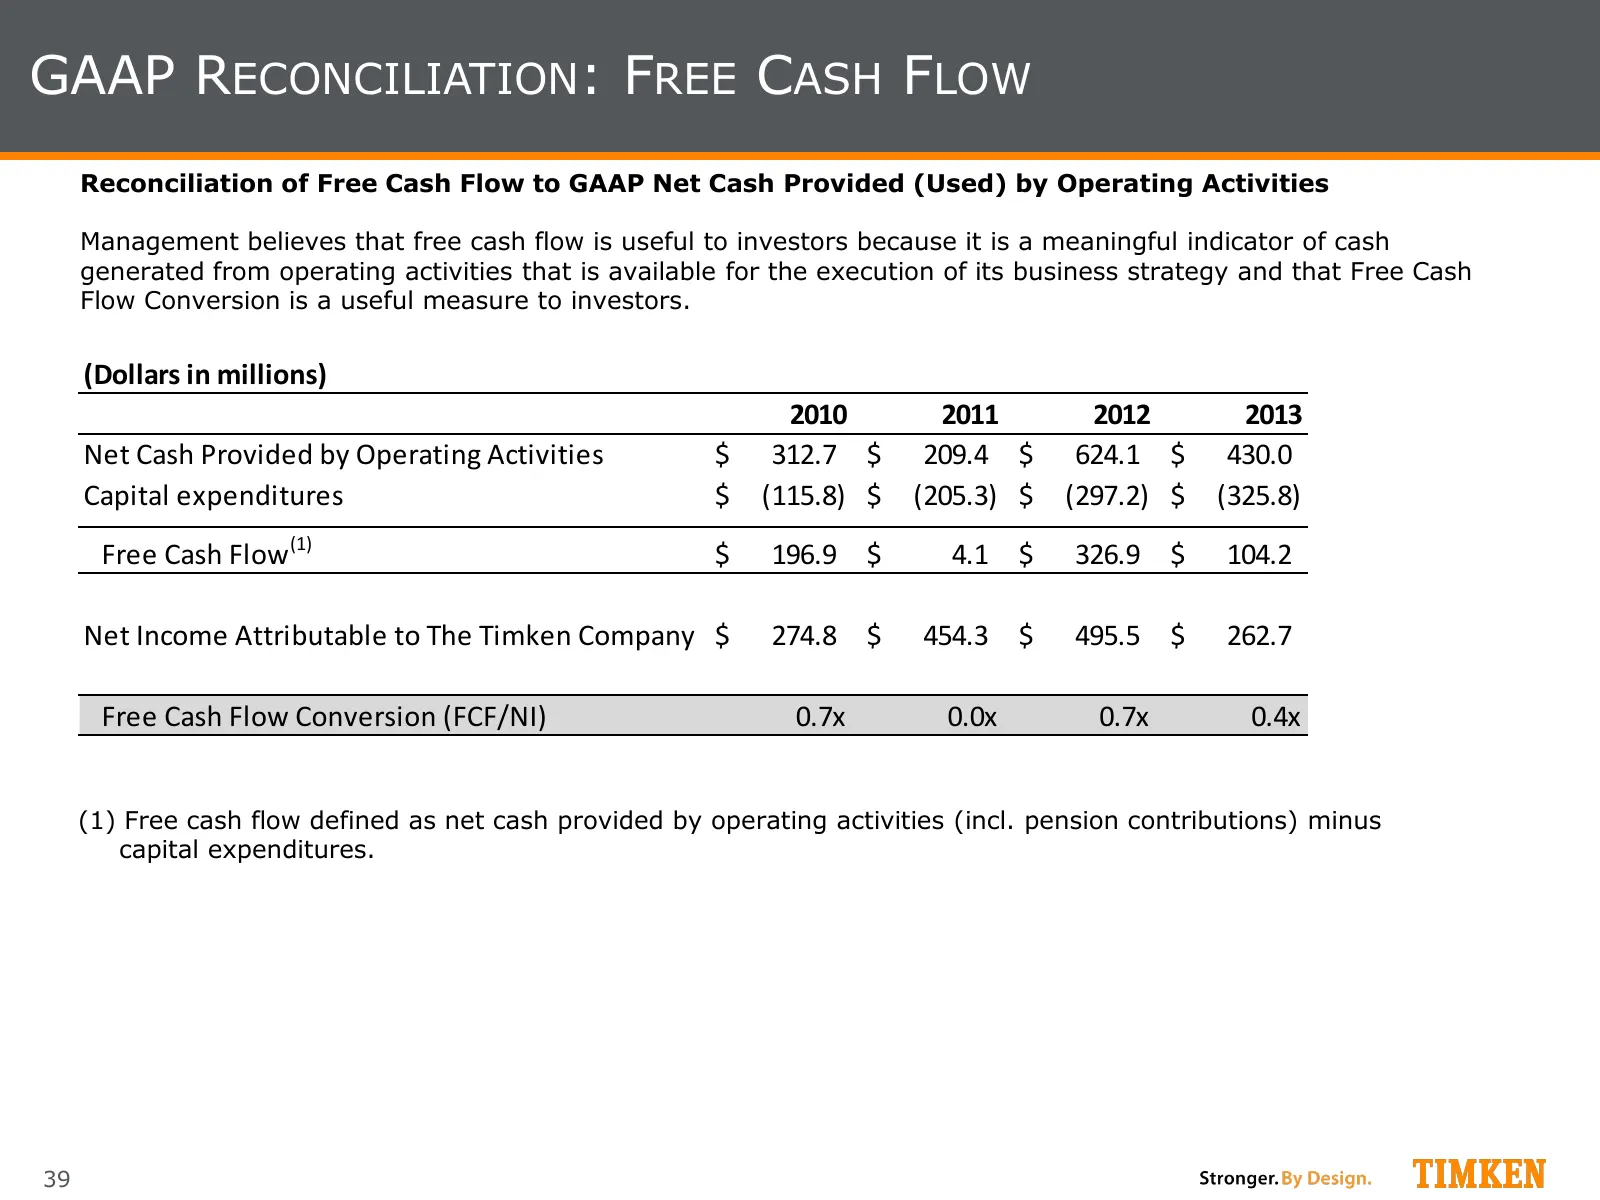
GAAP RECONCILIATION: FREE CASH FLOW Reconciliation of Free Cash Flow to GAAP Net Cash Provided (Used) by Operating Activities Management believes that free cash flow is useful to investors because it is a meaningful indicator of cash generated from operating activities that is available for the exec
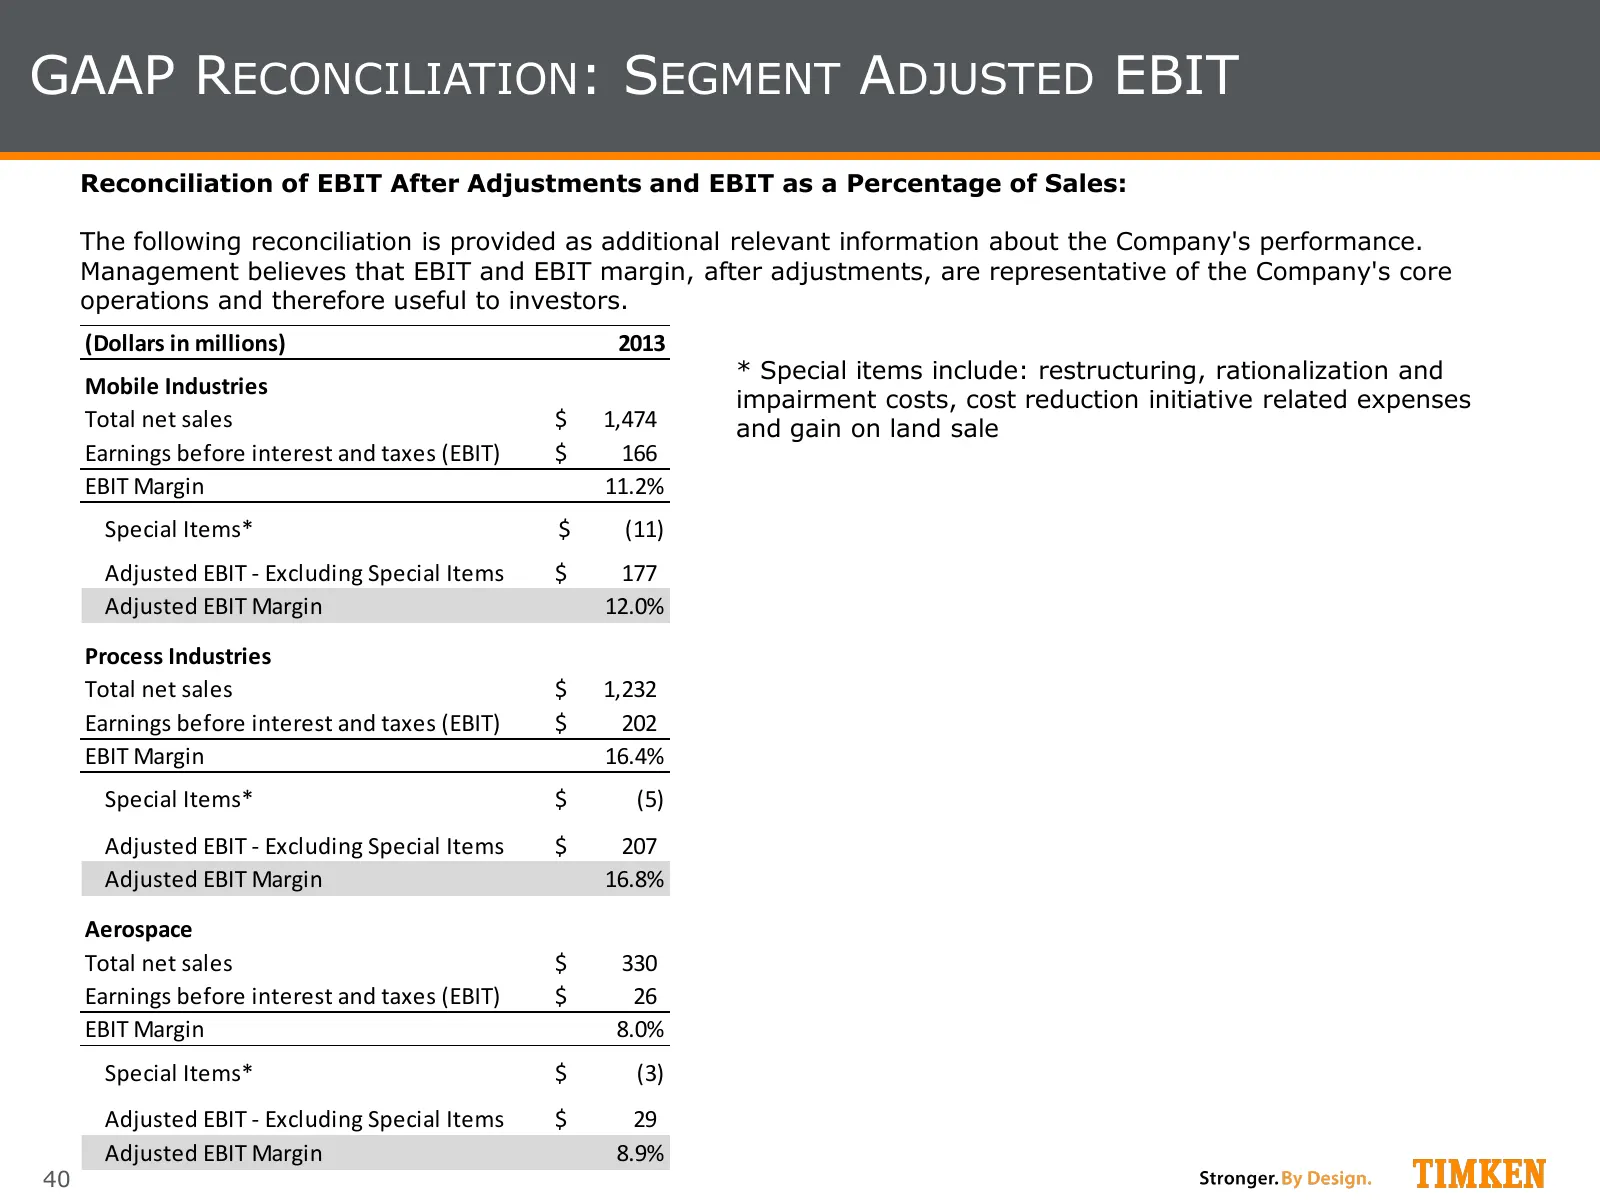
Slide 40: GAAP Reconciliation: Segment Adjusted EBIT
GAAP RECONCILIATION: SEGMENT ADJUSTED EBIT Reconciliation of EBIT After Adjustments and EBIT as a Percentage of Sales: The following reconciliation is provided as additional relevant information about the Company's performance. Management believes that EBIT and EBIT margin, after adjustments, are re
Source: Internet Archive copy of timken.com
More decks from Timken Company (the)
 The Timken Company — Baird Global Industrial Conference 202641 slides · Nov 10, 2026
 The Timken Company — Q3 2026 Earnings Presentation28 slides · Nov 4, 2026
 The Timken Company — Morgan Stanley Laguna Conference 202639 slides · Sep 16, 2026
 The Timken Company — Q2 2026 Earnings Presentation27 slides · Aug 4, 2026
 The Timken Company — Investor Presentation (August 2026)39 slides · August 2026
 The Timken Company — Investor Presentation (June 2026)38 slides · June 2026