Grenergy Renovables S.A · BME:GRE
Grenergy Renovables — Investor Presentation (May 2020)
33 slides from Grenergy Renovables's investor presentation, May 2020
Slide 1: Investor Presentation May 2020
INVESTOR PRESENTATION MAY 2020
Slide 2: Disclaimer
DISCLAIMER By attending this presentation and/or by accepting this presentation you will be taken to have represented, warranted and undertaken that you have read and agree to comply with the contents of this disclaimer. The information contained in this presentation (“Presentation”) has been prepar
Slide 3: Grenergy in a Nutshell
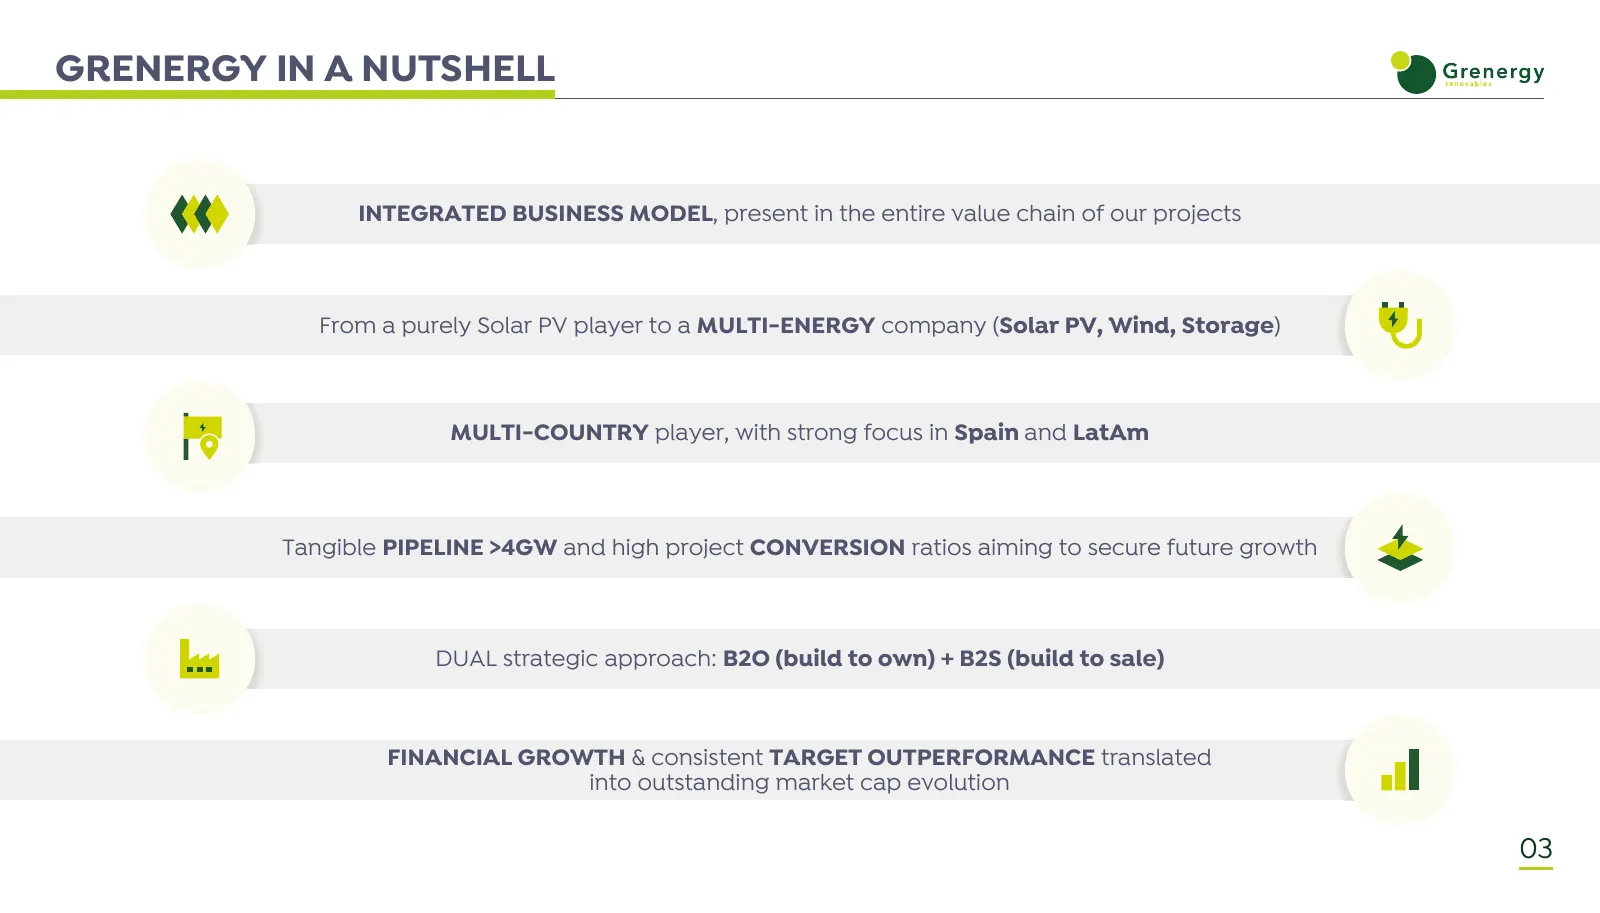
GRENERGY IN A NUTSHELL INTEGRATED BUSINESS MODEL, present in the entire value chain of our projects From a purely Solar PV player to a MULTI-ENERGY company (Solar PV, Wind, Storage) MULTI-COUNTRY player, with strong focus in Spain and LatAm Tangible PIPELINE >4GW and high project CONVERSION ratios a
Slide 4: Key Figures
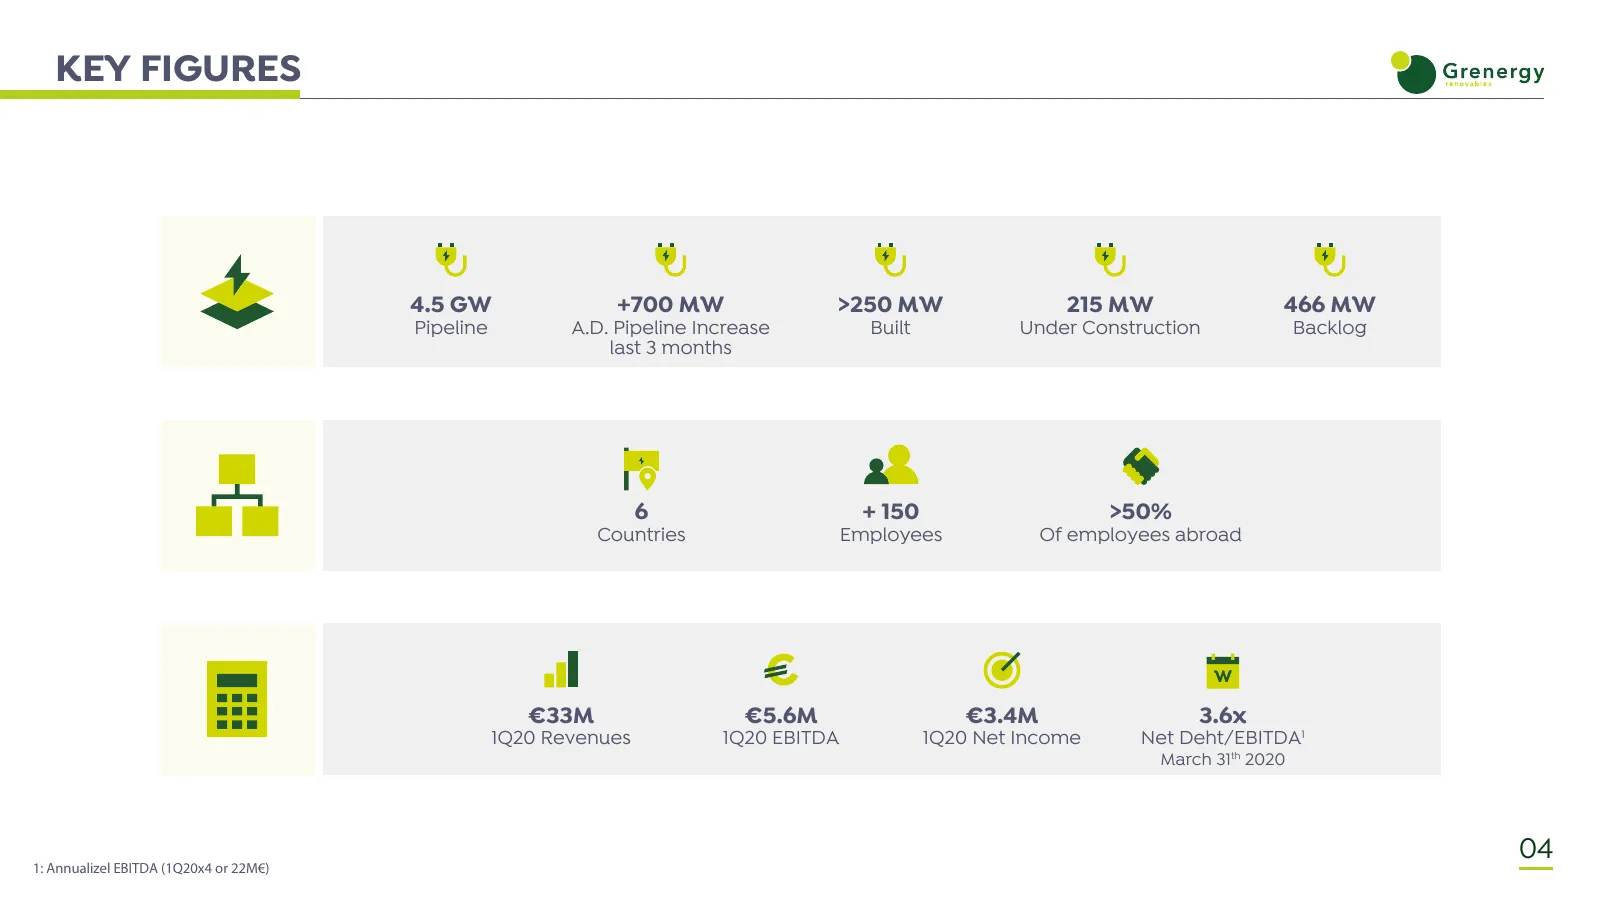
KEY FIGURES 4.5 GW +700 MW >250 MW 215 MW 466 MW Pipeline A.D. Pipeline Increase Built Under Construction Backlog last 3 months 6 + 150 >50% Countries Employees Of employees abroad €33M €5.6M €3.4M 3.6x 1Q20 Revenues 1Q20 EBITDA 1Q20 Net Income Net Deht/EBITDA1 March 31th 2020 04 1: Annualizel EBITD
Slide 5: Key Highlights
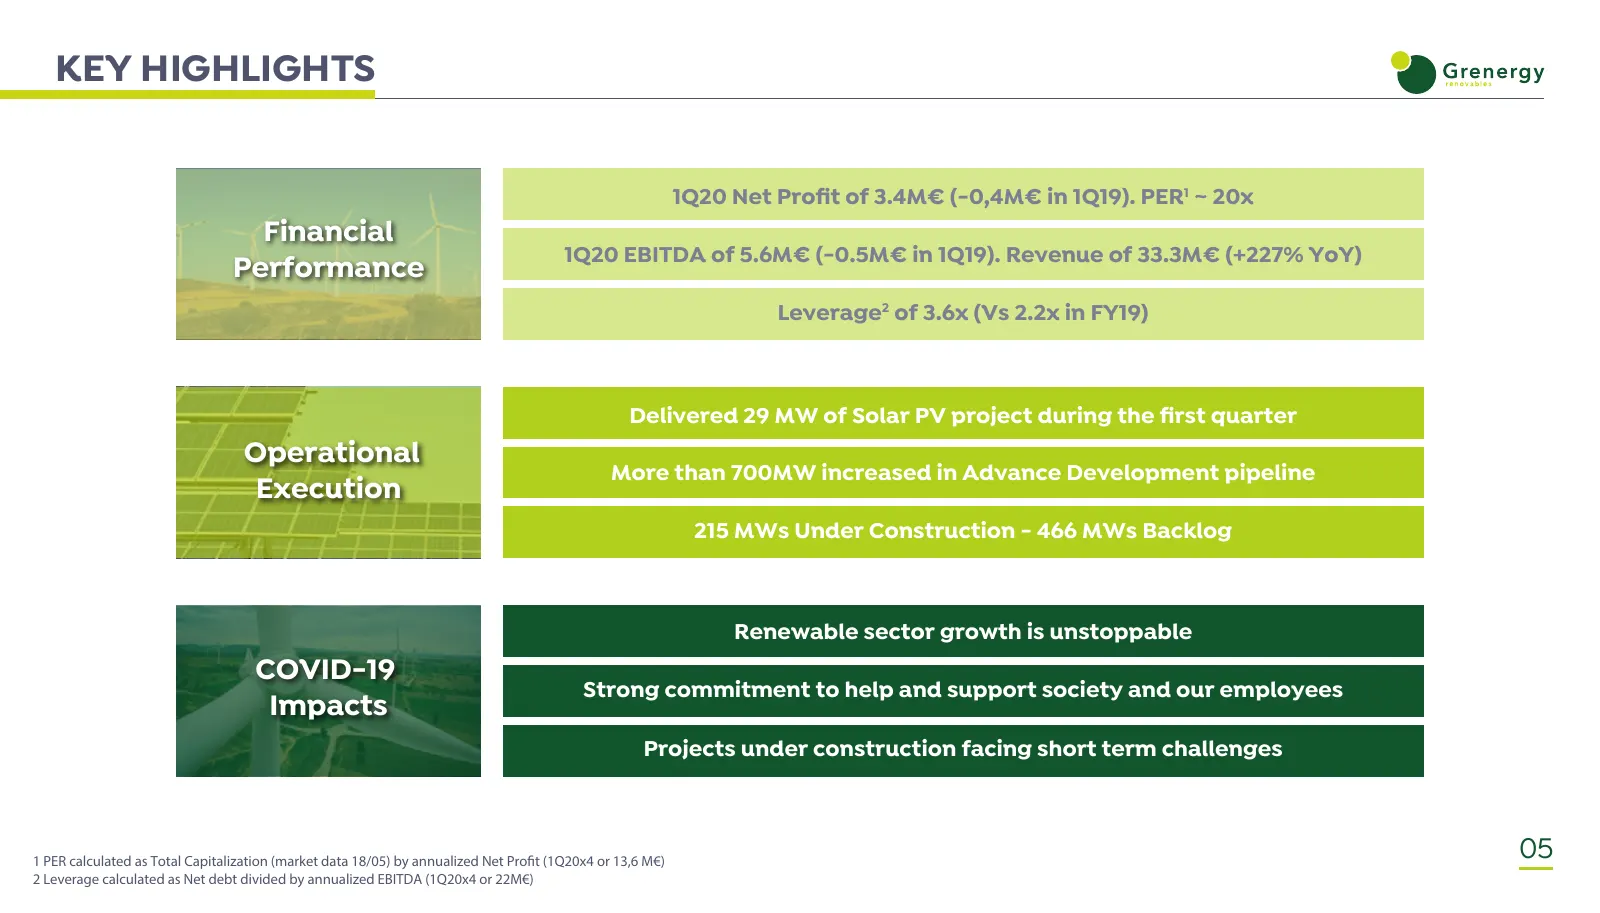
KEY HIGHLIGHTS 1Q20 Net Profit of 3.4M€ (-0,4M€ in 1Q19). PER1 ~ 20x Financial 1Q20 EBITDA of 5.6M€ (-0.5M€ in 1Q19). Revenue of 33.3M€ (+227% YoY) Performance Leverage2 of 3.6x (Vs 2.2x in FY19) Delivered 29 MW of Solar PV project during the first quarter Operational More than 700MW increased in Adva
Slide 6: Index
INDEX 1 COVID-19 IMPACTS 2 FINANCIAL RESULTS 3 PIPELINE & OPERATIONS 06
Slide 7: COVID-19 Impacts
T | COVID-19 IMPACTS
Slide 8: COVID-19 Impacts in Our Sector
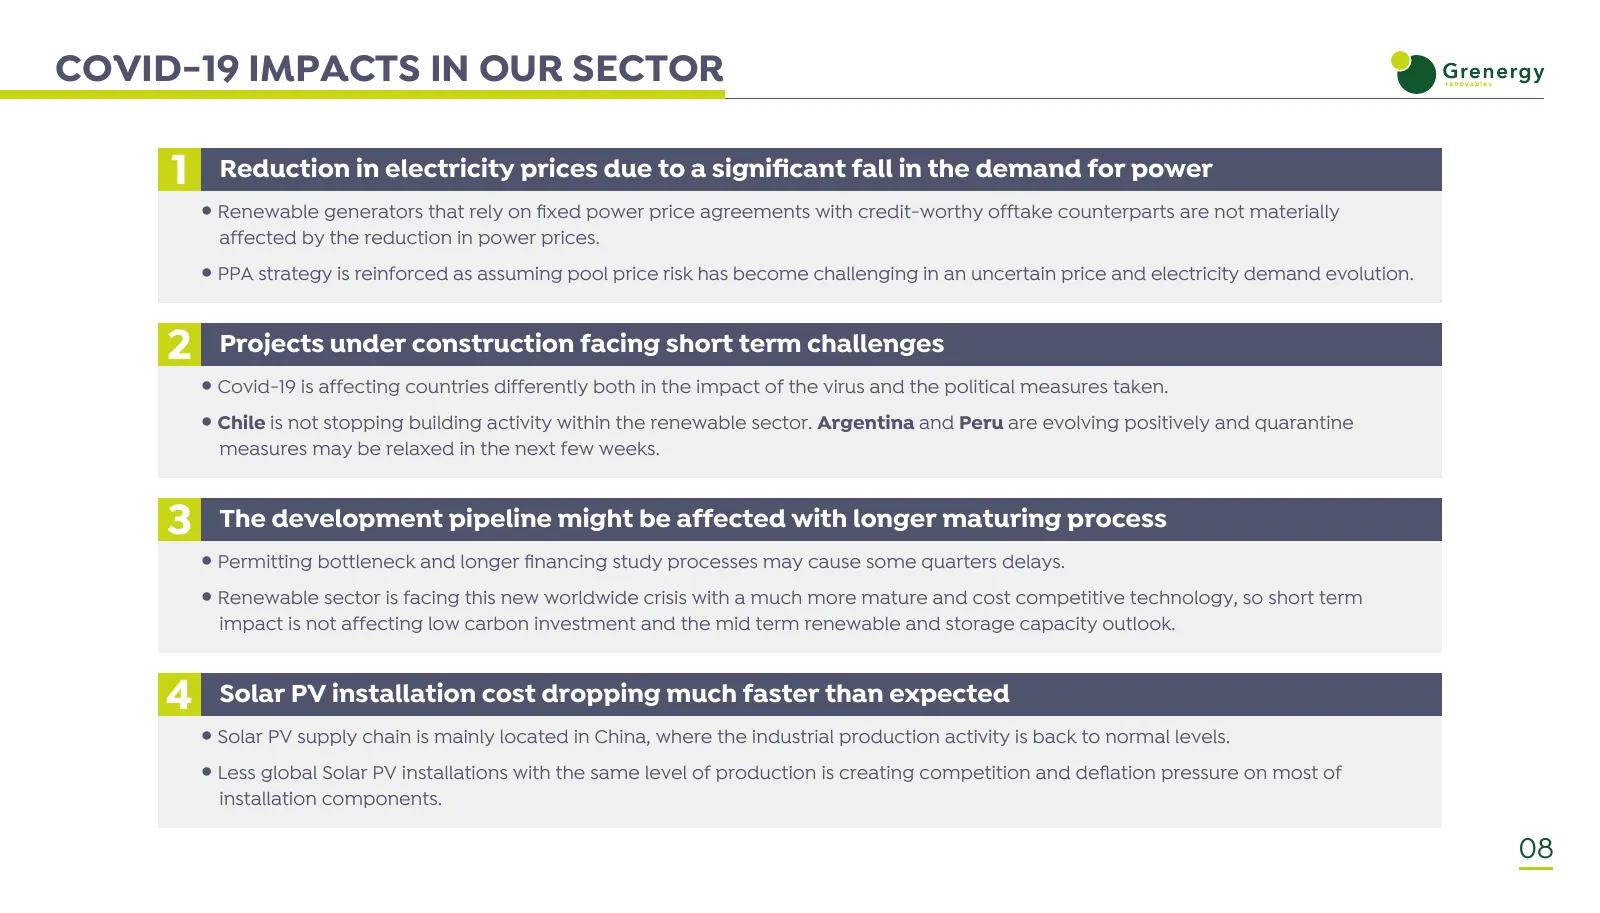
COVID-19 IMPACTS IN OUR SECTOR 1 Reduction in electricity prices due to a significant fall in the demand for power ● Renewable generators that rely on fixed power price agreements with credit-worthy offtake counterparts are not materially affected by the reduction in power prices. ● PPA strategy is re
Slide 9: COVID-19 Crisis Management
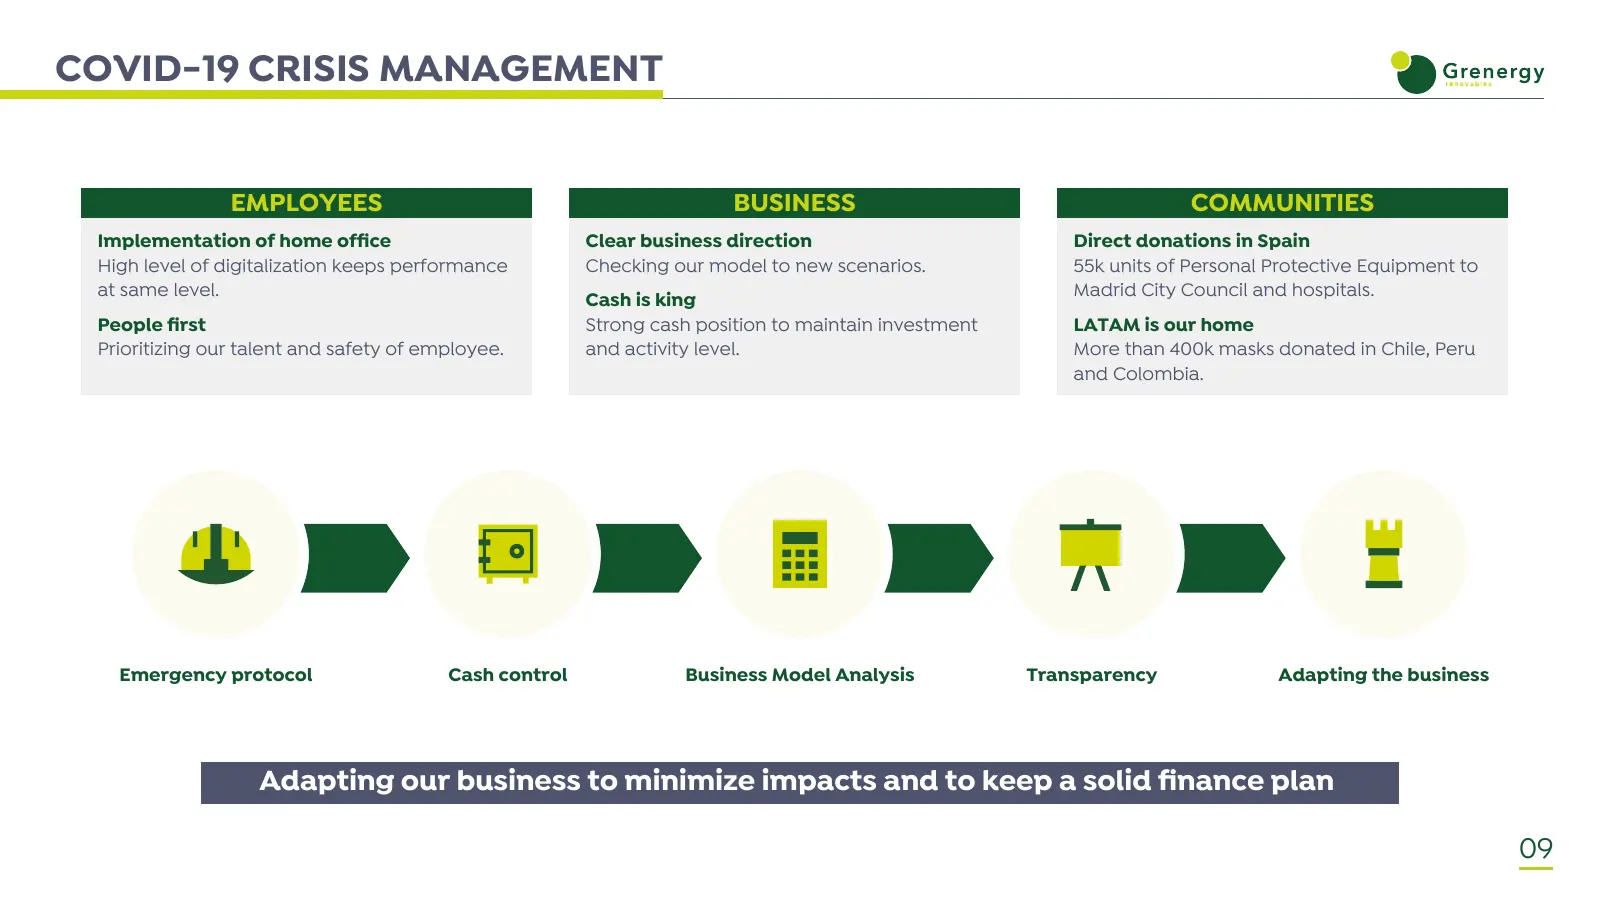
COVID-19 CRISIS MANAGEMENT EMPLOYEES BUSINESS COMMUNITIES Implementation of home office Clear business direction Direct donations in Spain High level of digitalization keeps performance Checking our model to new scenarios. 55k units of Personal Protective Equipment to at same level. Madrid City Counc
Slide 10: Grenergy's Initiatives
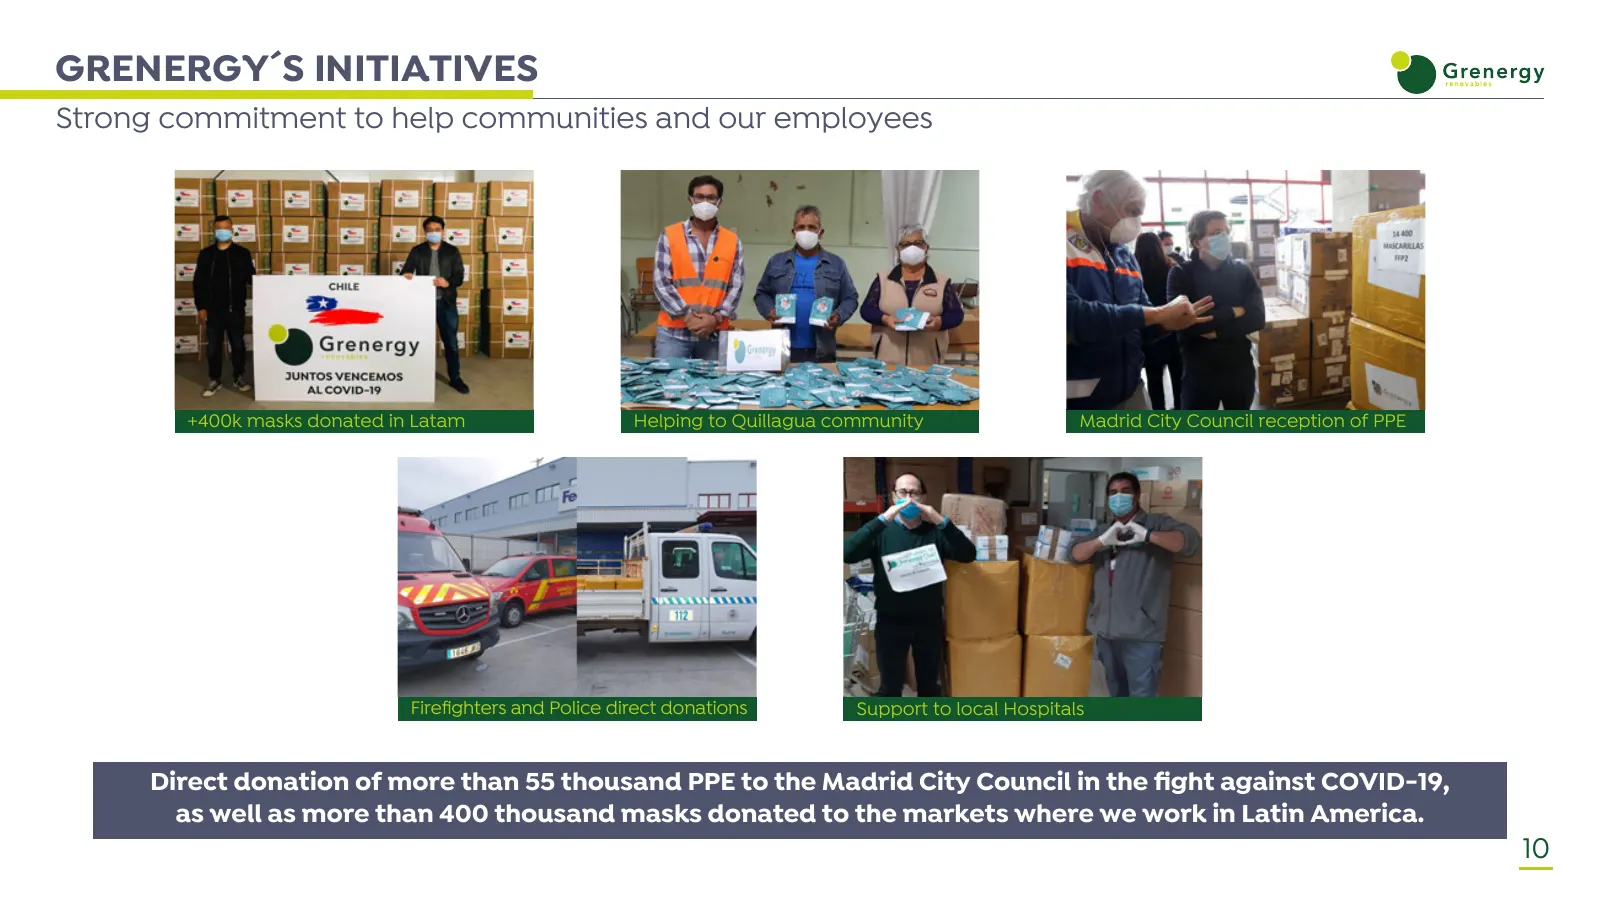
GRENERGY´S INITIATIVES Strong commitment to help communities and our employees +400k masks donated in Latam Helping to Quillagua community Madrid City Council reception of PPE Firefighters and Police direct donations Support to local Hospitals Direct donation of more than 55 thousand PPE to the Madri
Slide 11: COVID-19 Potential Impacts in Our Operations
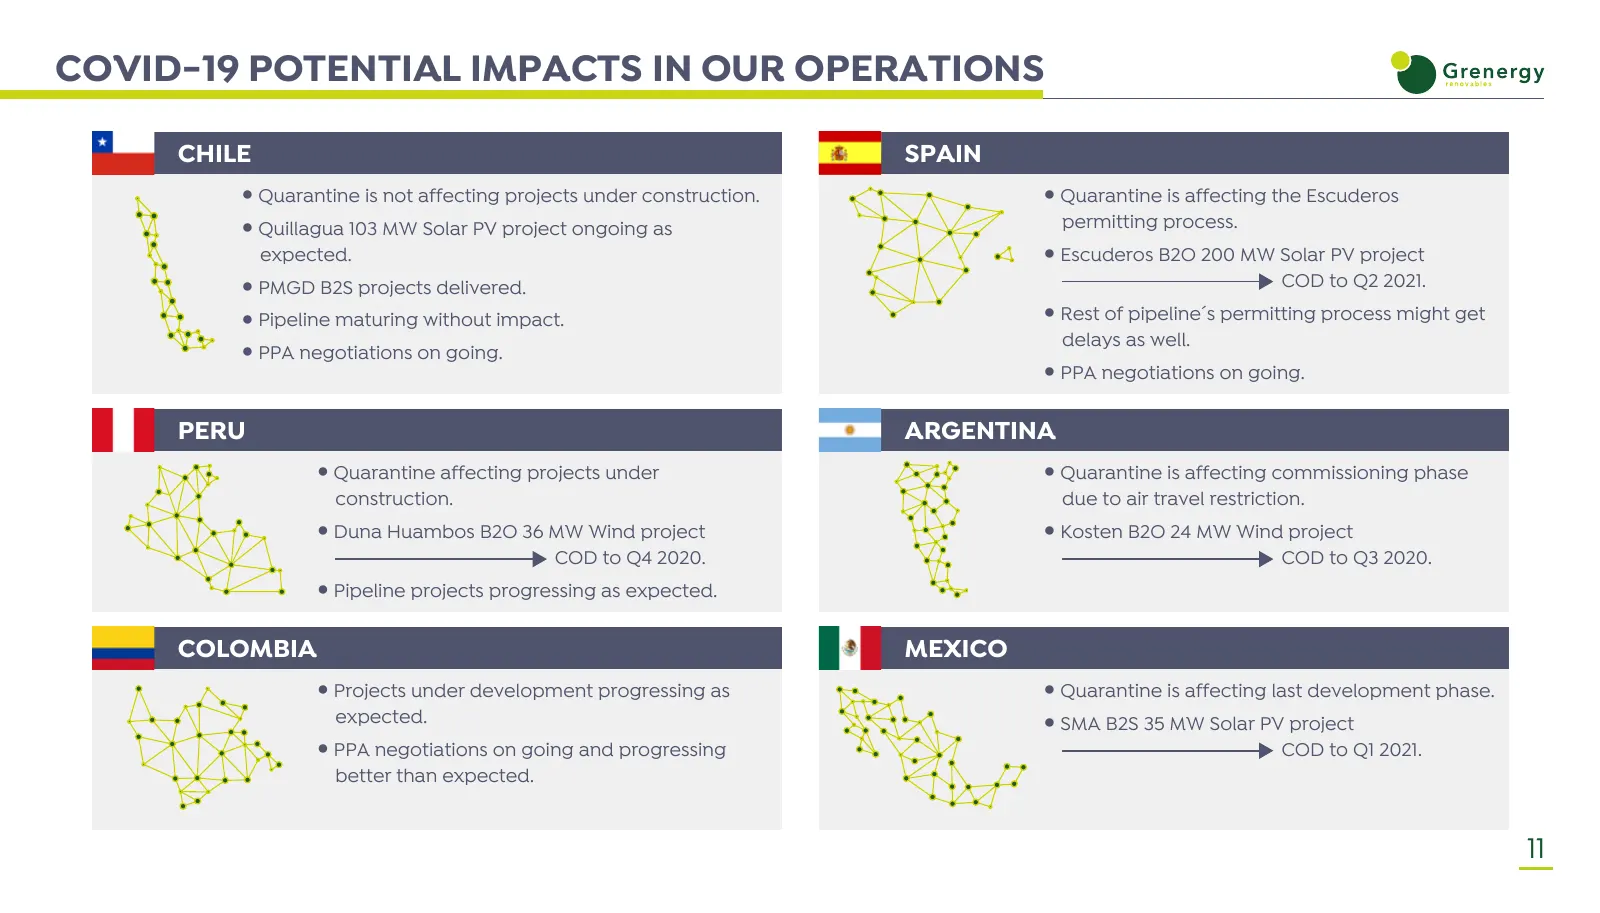
COVID-19 POTENTIAL IMPACTS IN OUR OPERATIONS CHILE SPAIN ● Quarantine is not affecting projects under construction. ● Quarantine is affecting the Escuderos ● Quillagua 103 MW Solar PV project ongoing as permitting process. expected. ● Escuderos B2O 200 MW Solar PV project ● PMGD B2S projects deliver
Slide 12: Results
— (LL AAR er ae 7 Tis ) RESULTS
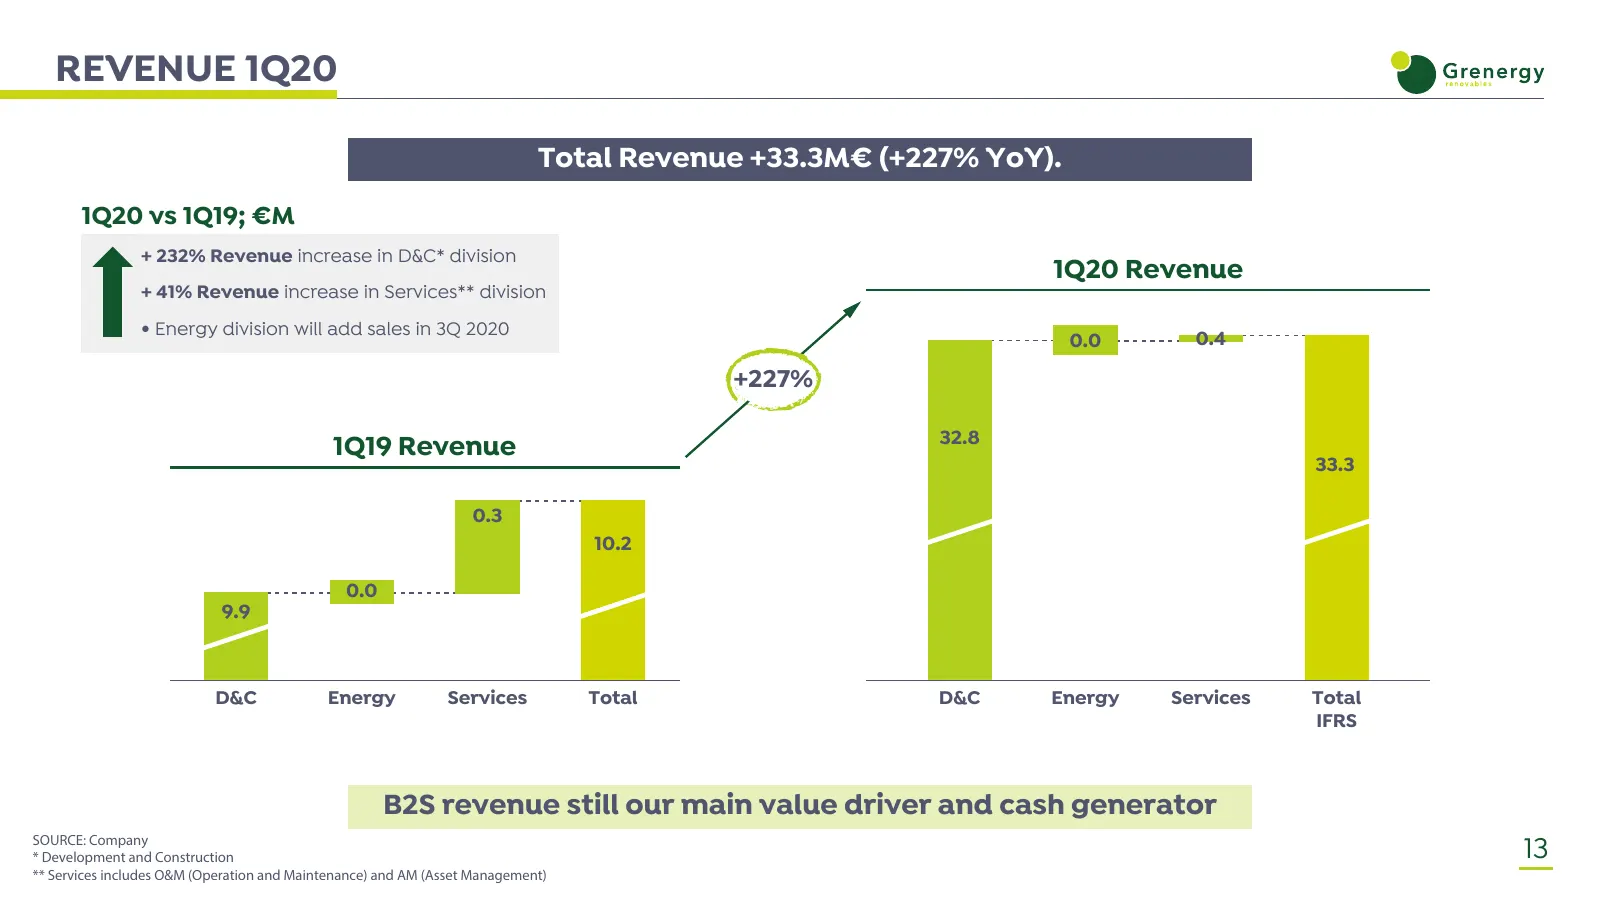
Slide 13: Revenue 1Q20
REVENUE 1Q20 Total Revenue +33.3M€ (+227% YoY). 1Q20 vs 1Q19; €M + 232% Revenue increase in D&C* division 1Q20 Revenue + 41% Revenue increase in Services** division ● Energy division will add sales in 3Q 2020 0.0 0.4 +227% 32.8 1Q19 Revenue 33.3 0.3 10.2 0.0 9.9 D&C Energy Services Total D&C Energy
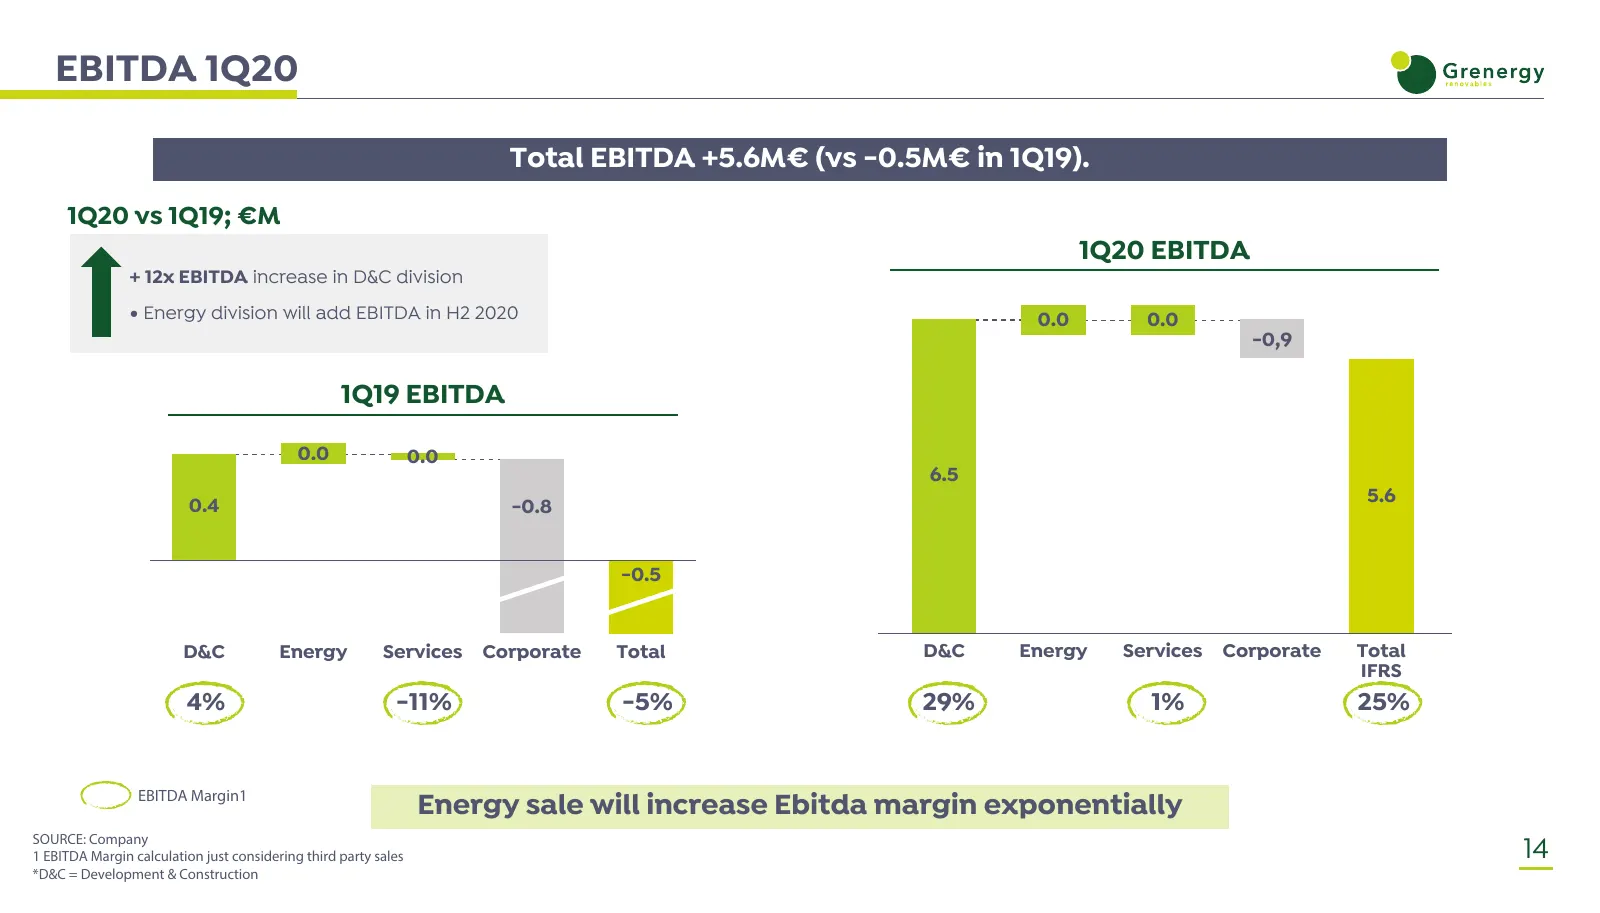
Slide 14: EBITDA 1Q20
EBITDA 1Q20 Total EBITDA +5.6M€ (vs -0.5M€ in 1Q19). 1Q20 vs 1Q19; €M 1Q20 EBITDA + 12x EBITDA increase in D&C division ● Energy division will add EBITDA in H2 2020 0.0 0.0 -0,9 1Q19 EBITDA 0.0 0.0 6.5 0.4 5.6 -0.8 -0.5 D&C Energy Services Corporate Total D&C Energy Services Corporate Total IFRS 4%
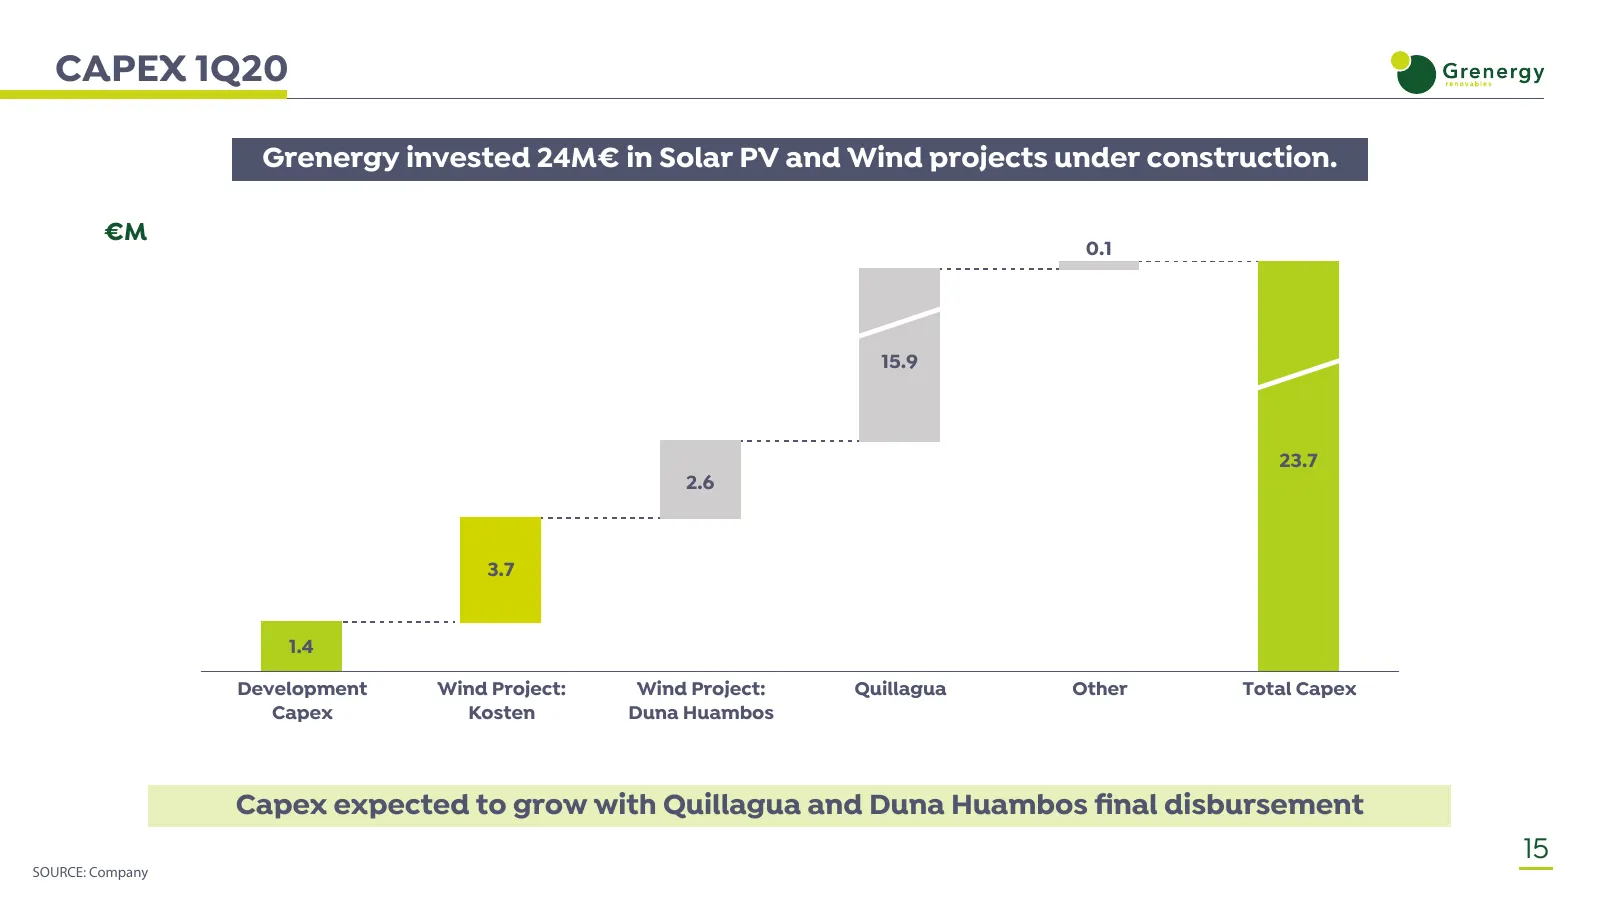
Slide 15: Capex 1Q20
CAPEX 1Q20 Grenergy invested 24M€ in Solar PV and Wind projects under construction. €M 0.1 15.9 23.7 2.6 3.7 1.4 Development Wind Project: Wind Project: Quillagua Other Total Capex Capex Kosten Duna Huambos Capex expected to grow with Quillagua and Duna Huambos final disbursement 15 SOURCE: Company
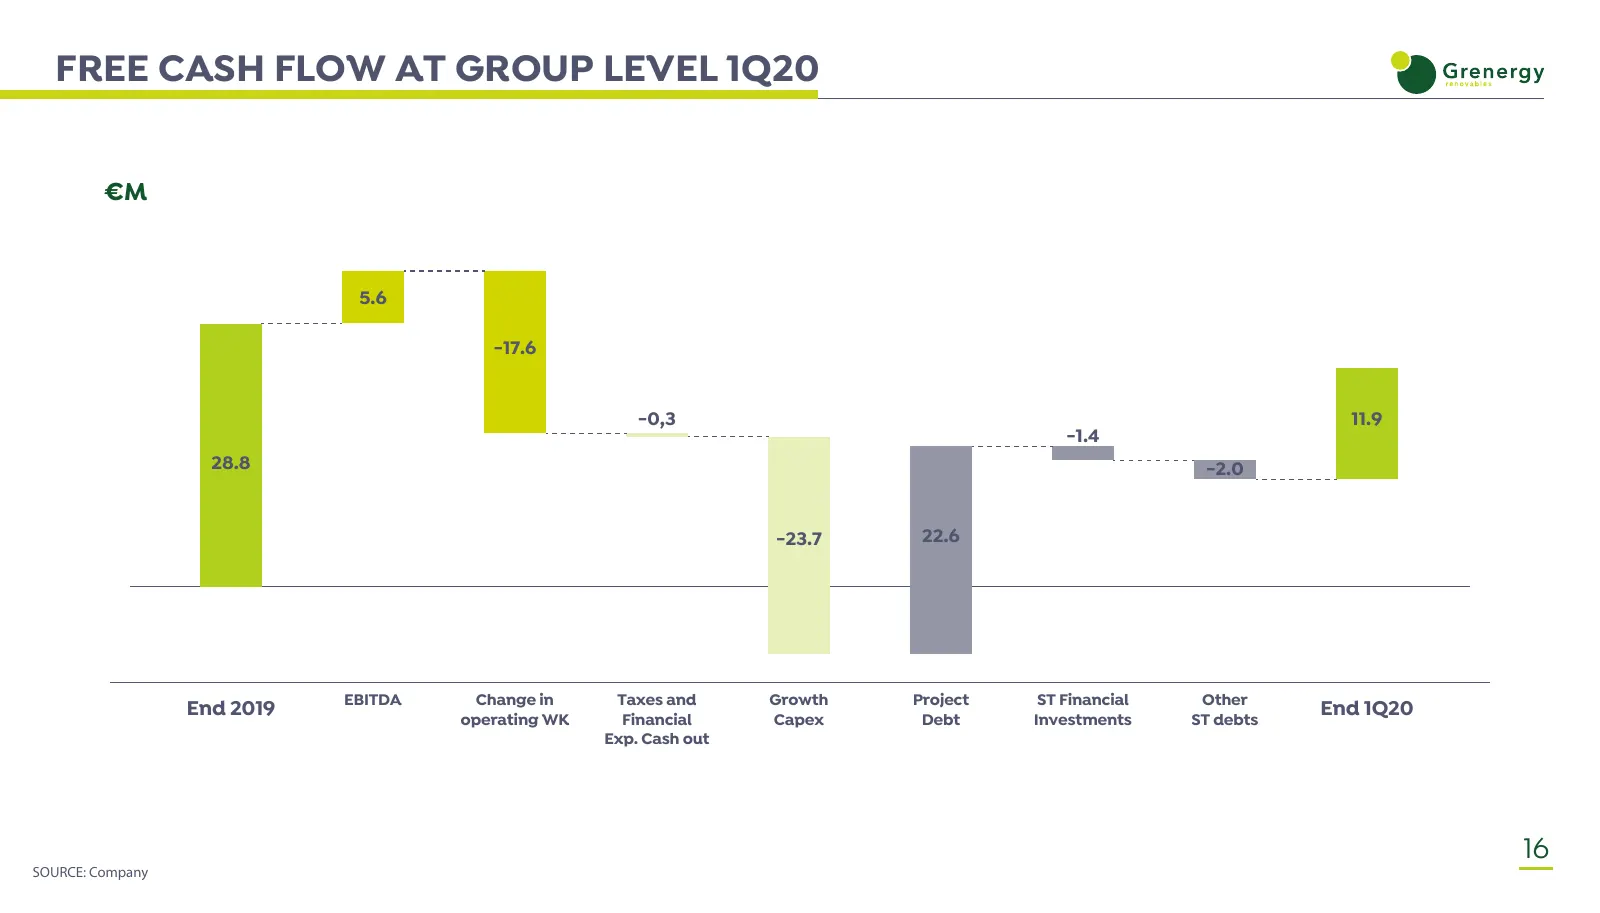
Slide 16: Free Cash Flow at Group Level 1Q20
FREE CASH FLOW AT GROUP LEVEL 1Q20 €M 5.6 -17.6 -0,3 11.9 -1.4 28.8 -2.0 -23.7 22.6 EBITDA Change in Taxes and Growth Project ST Financial Other End 2019 operating WK Financial Capex Debt Investments ST debts End 1Q20 Exp. Cash out 16 SOURCE: Company
Slide 17: Change in Net Debt and Leverage
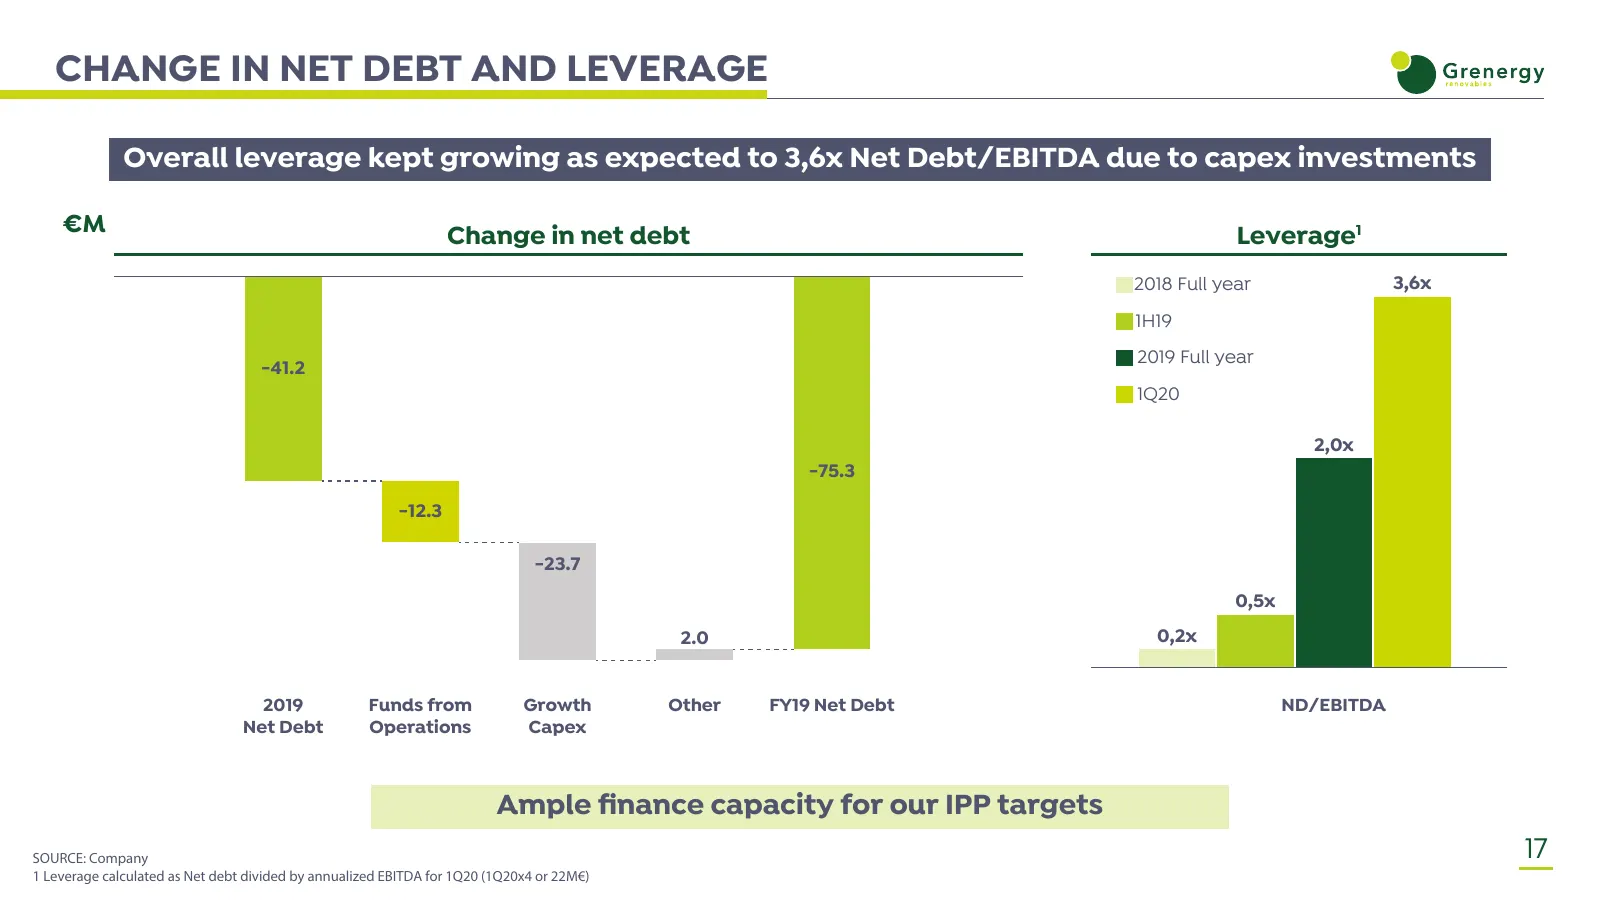
CHANGE IN NET DEBT AND LEVERAGE Overall leverage kept growing as expected to 3,6x Net Debt/EBITDA due to capex investments €M Change in net debt Leverage1 2018 Full year 3,6x 1H19 2019 Full year -41.2 1Q20 2,0x -75.3 -12.3 -23.7 0,5x 2.0 0,2x 2019 Funds from Growth Other FY19 Net Debt ND/EBITDA Net
Slide 18: Pipeline & Operations
Quillagua project construction-Status April 2020 2 PIPELINE & OPERATIONS
Slide 19: Pipeline Update
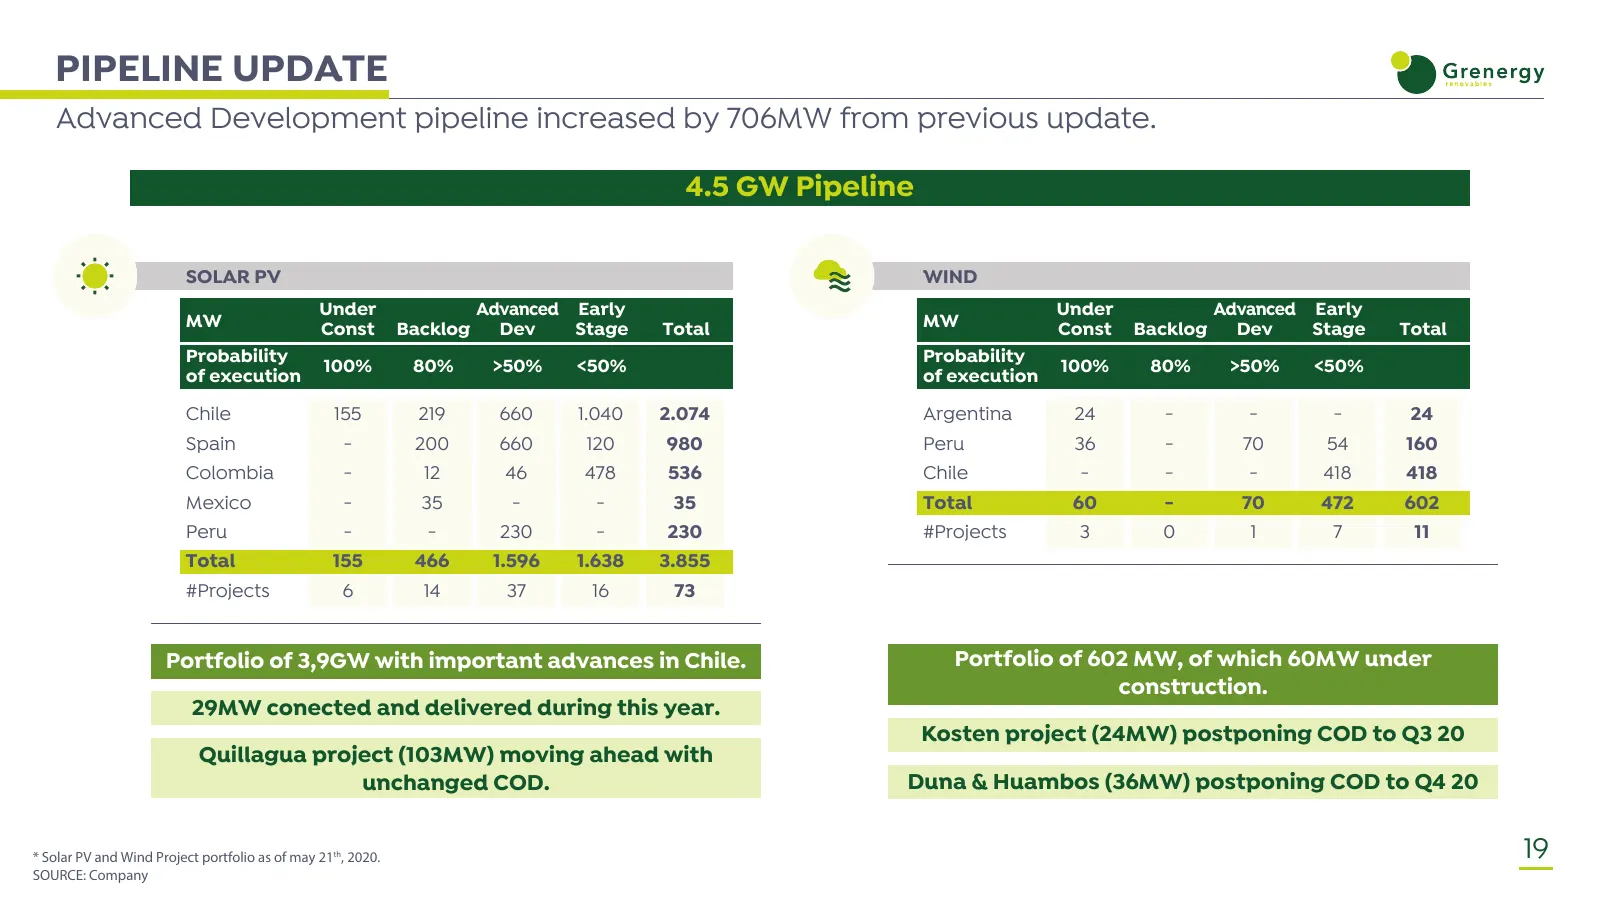
PIPELINE UPDATE Advanced Development pipeline increased by 706MW from previous update. 4.5 GW Pipeline SOLAR PV WIND Under Advanced Early Under Advanced Early MW Const Backlog Dev Stage Total MW Const Backlog Dev Stage Total Probability Probability 100% 80% >50% <50% 100% 80% >50% <50% of execution
Slide 20: Pipeline Update: Project Portfolio
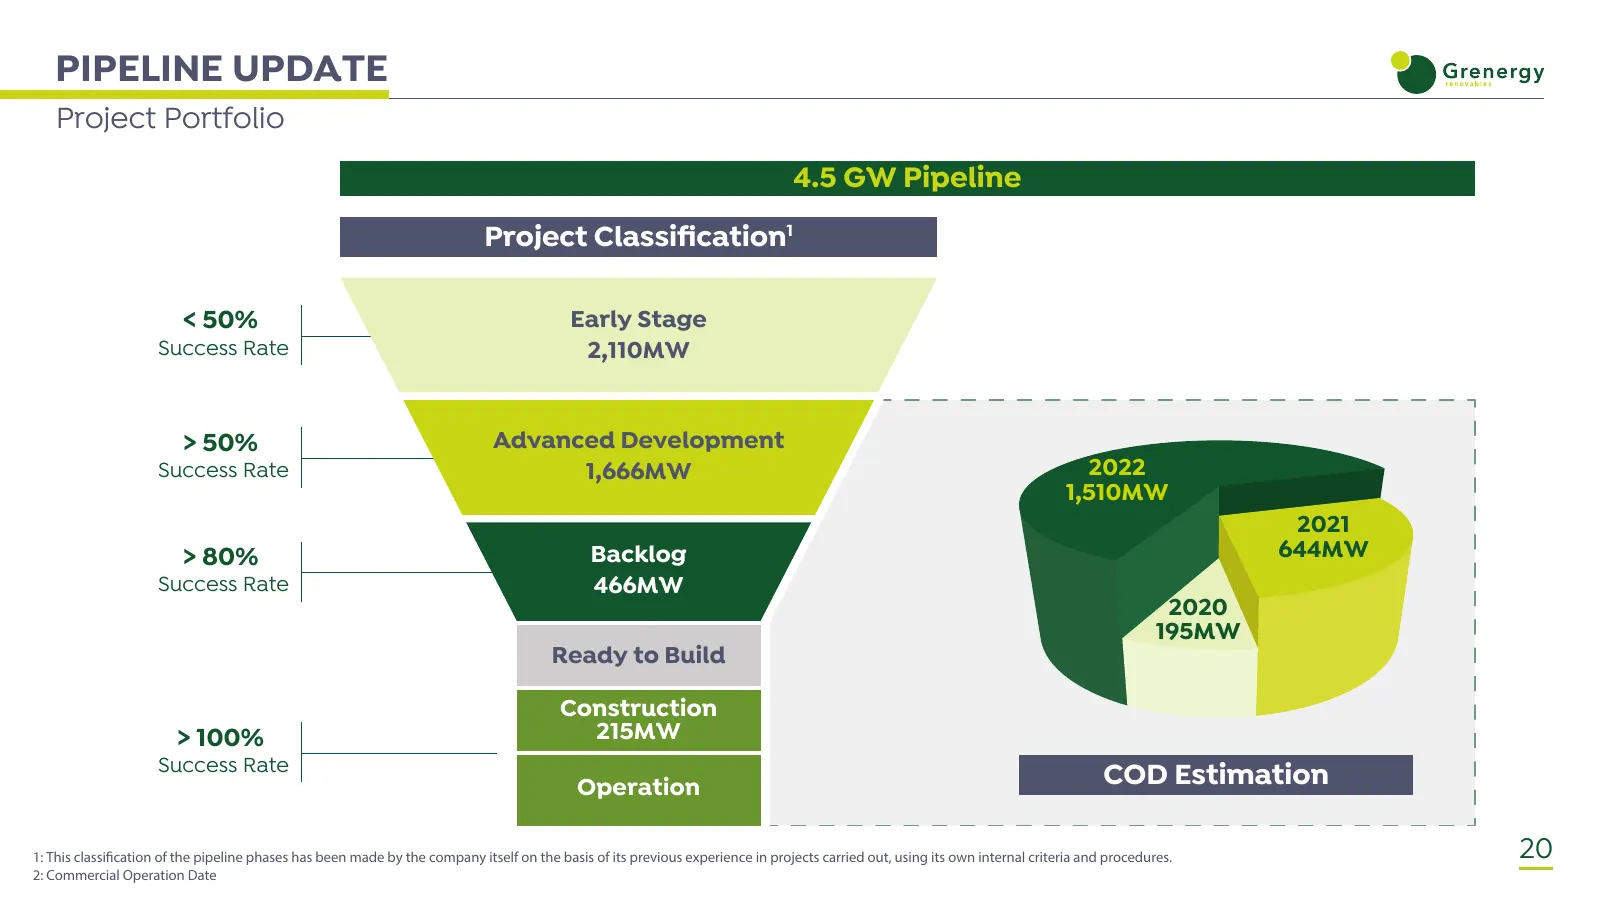
PIPELINE UPDATE Project Portfolio 4.5 GW Pipeline Project Classification1 < 50% Early Stage Success Rate 2,110MW > 50% Advanced Development Success Rate 1,666MW 2022 1,510MW 2021 > 80% Backlog 644MW Success Rate 466MW 2020 195MW Ready to Build Construction > 100% 215MW Success Rate Operation COD Esti
Slide 21: Projects Under Construction & Backlog
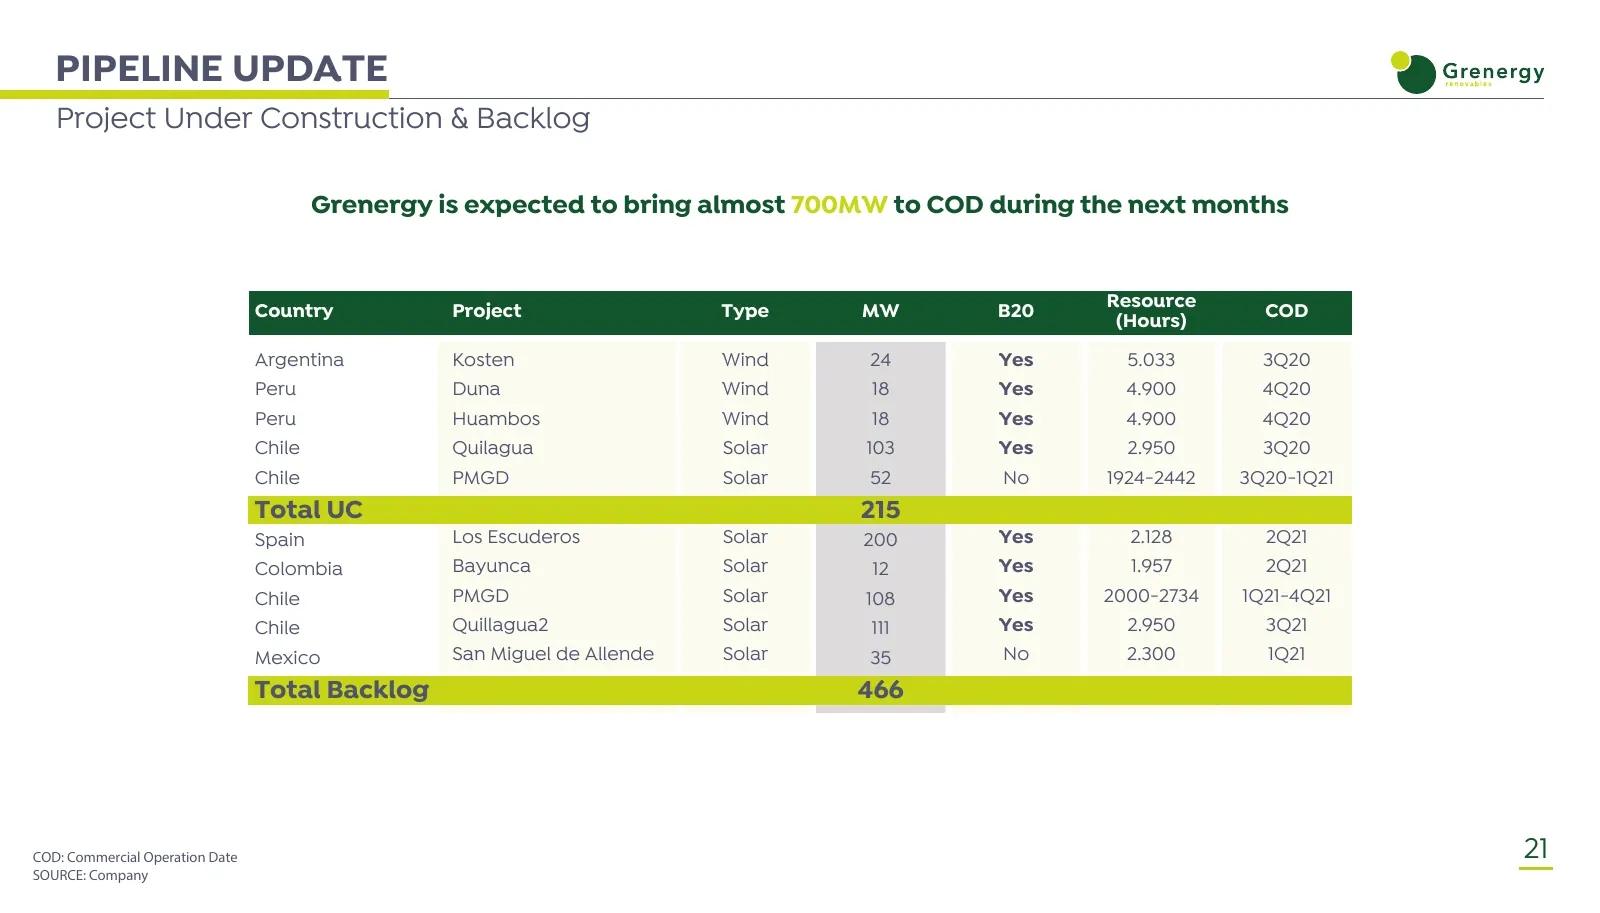
PIPELINE UPDATE Project Under Construction & Backlog Grenergy is expected to bring almost 700MW to COD during the next months Resource Country Project Type MW B20 COD (Hours) Argentina Kosten Wind 24 Yes 5.033 3Q20 Peru Duna Wind 18 Yes 4.900 4Q20 Peru Huambos Wind 18 Yes 4.900 4Q20 Chile Quilagua S
Slide 22: Projects in Advanced Development
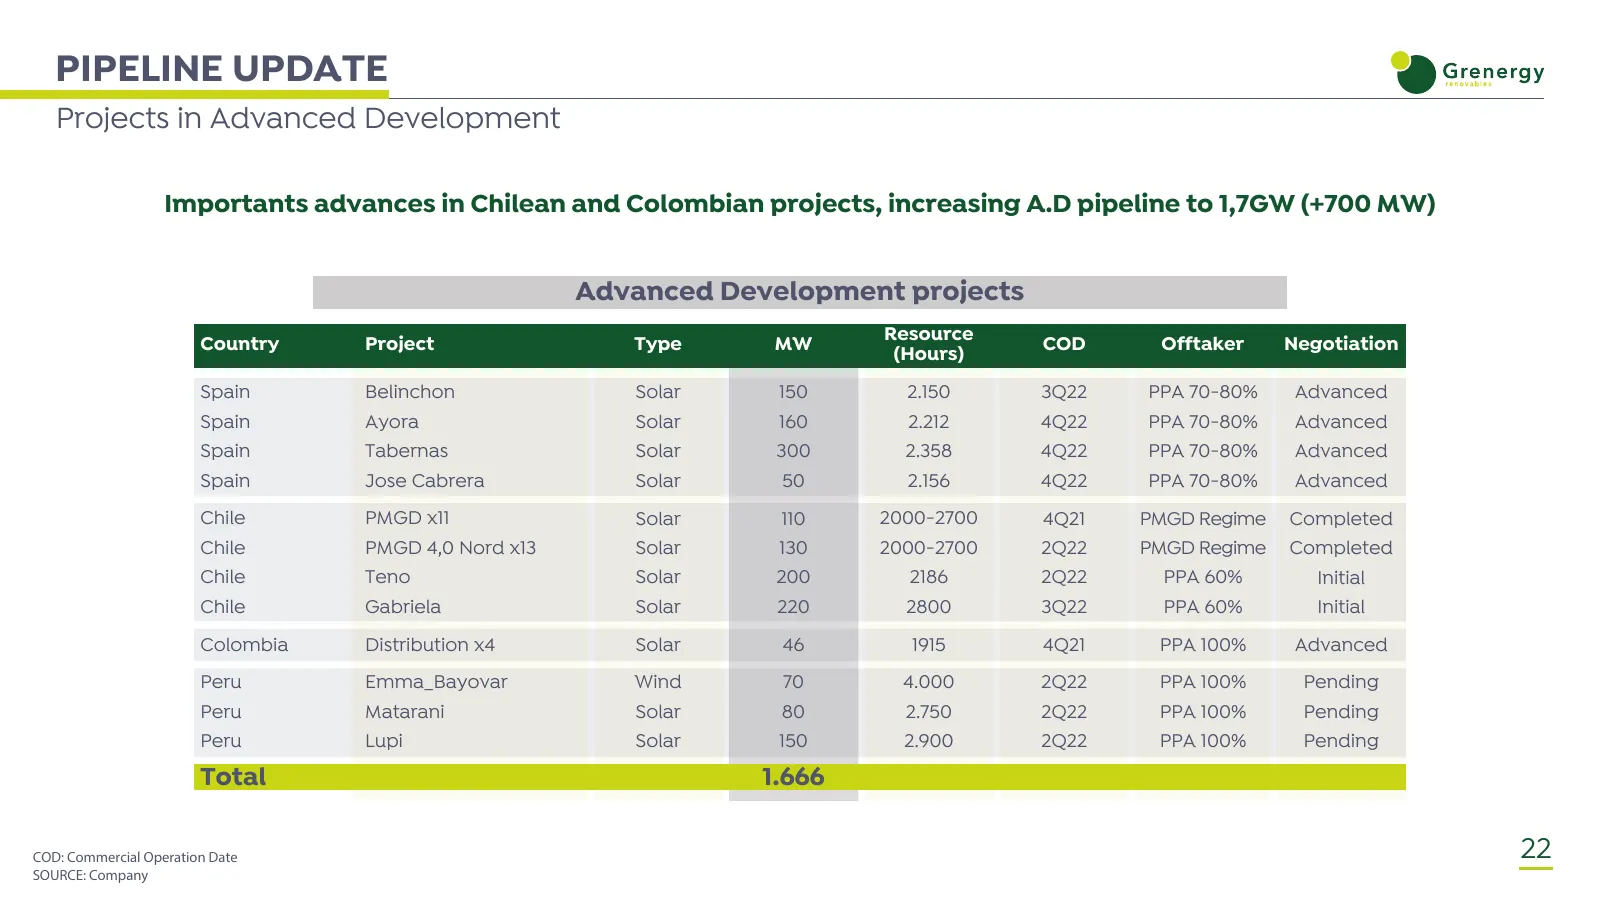
PIPELINE UPDATE Projects in Advanced Development Importants advances in Chilean and Colombian projects, increasing A.D pipeline to 1,7GW (+700 MW) Advanced Development projects Resource Country Project Type MW COD Offtaker Negotiation (Hours) Spain Belinchon Solar 150 2.150 3Q22 PPA 70-80% Advanced
Slide 23: Built to Own: B2O
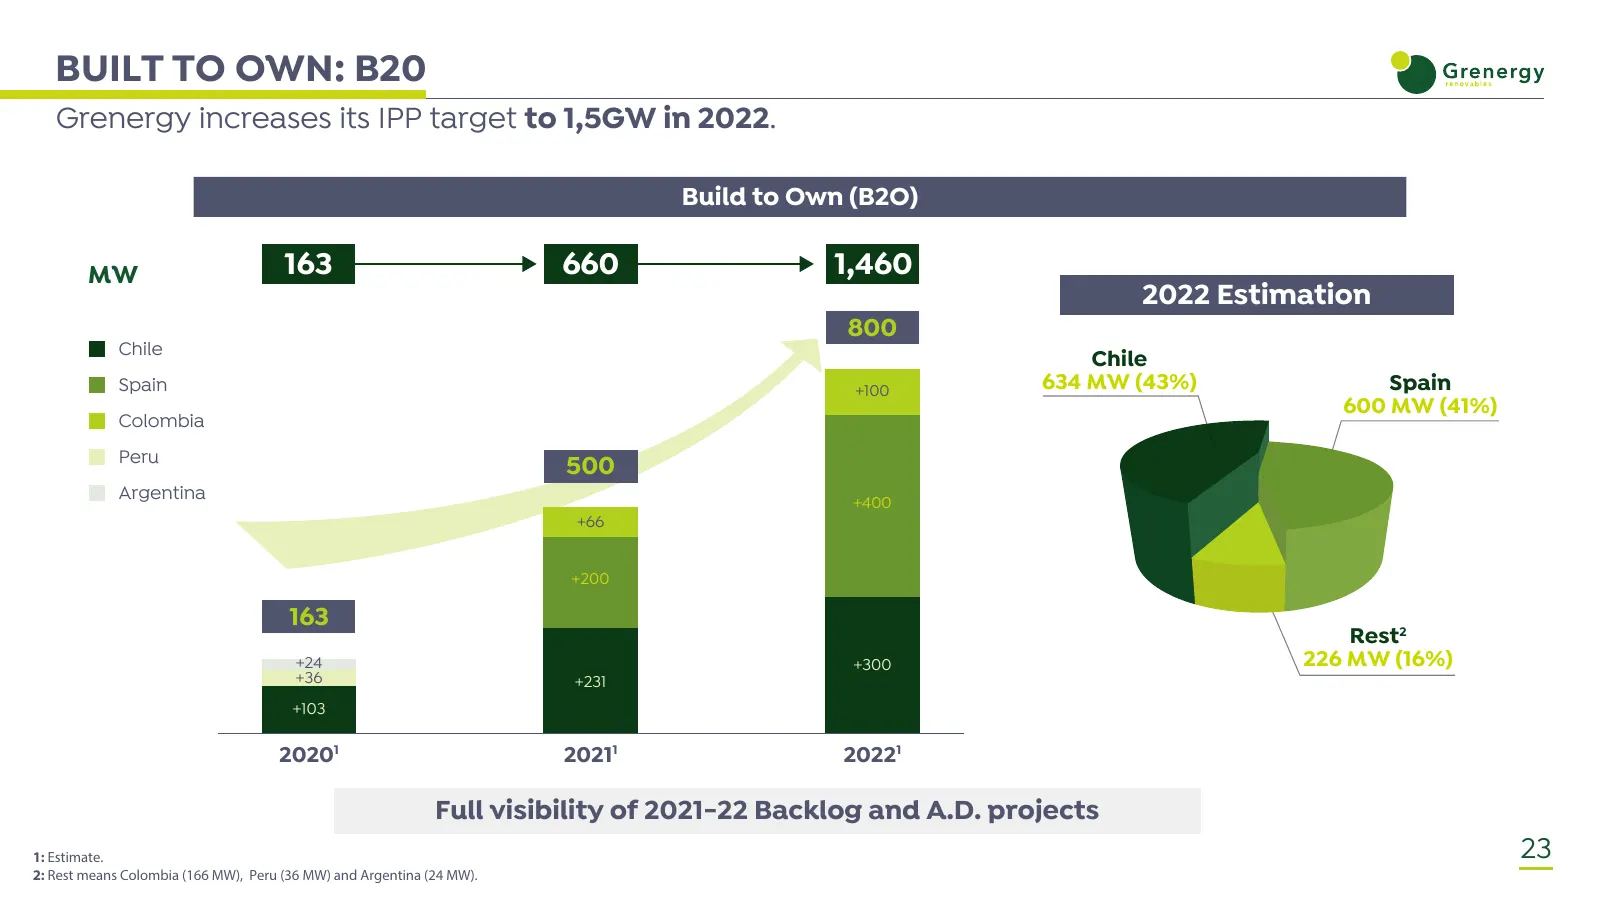
BUILT TO OWN: B20 Grenergy increases its IPP target to 1,5GW in 2022. Build to Own (B2O) MW 163 660 1,460 2022 Estimation 800 Chile Chile Spain +100 634 MW (43%) Spain 600 MW (41%) Colombia Peru 500 Argentina +400 +66 +200 163 Rest2 +24 +300 226 MW (16%) +36 +231 +103 20201 20211 20221 Full visibili
Slide 24: Focus PMGD: A Success Story
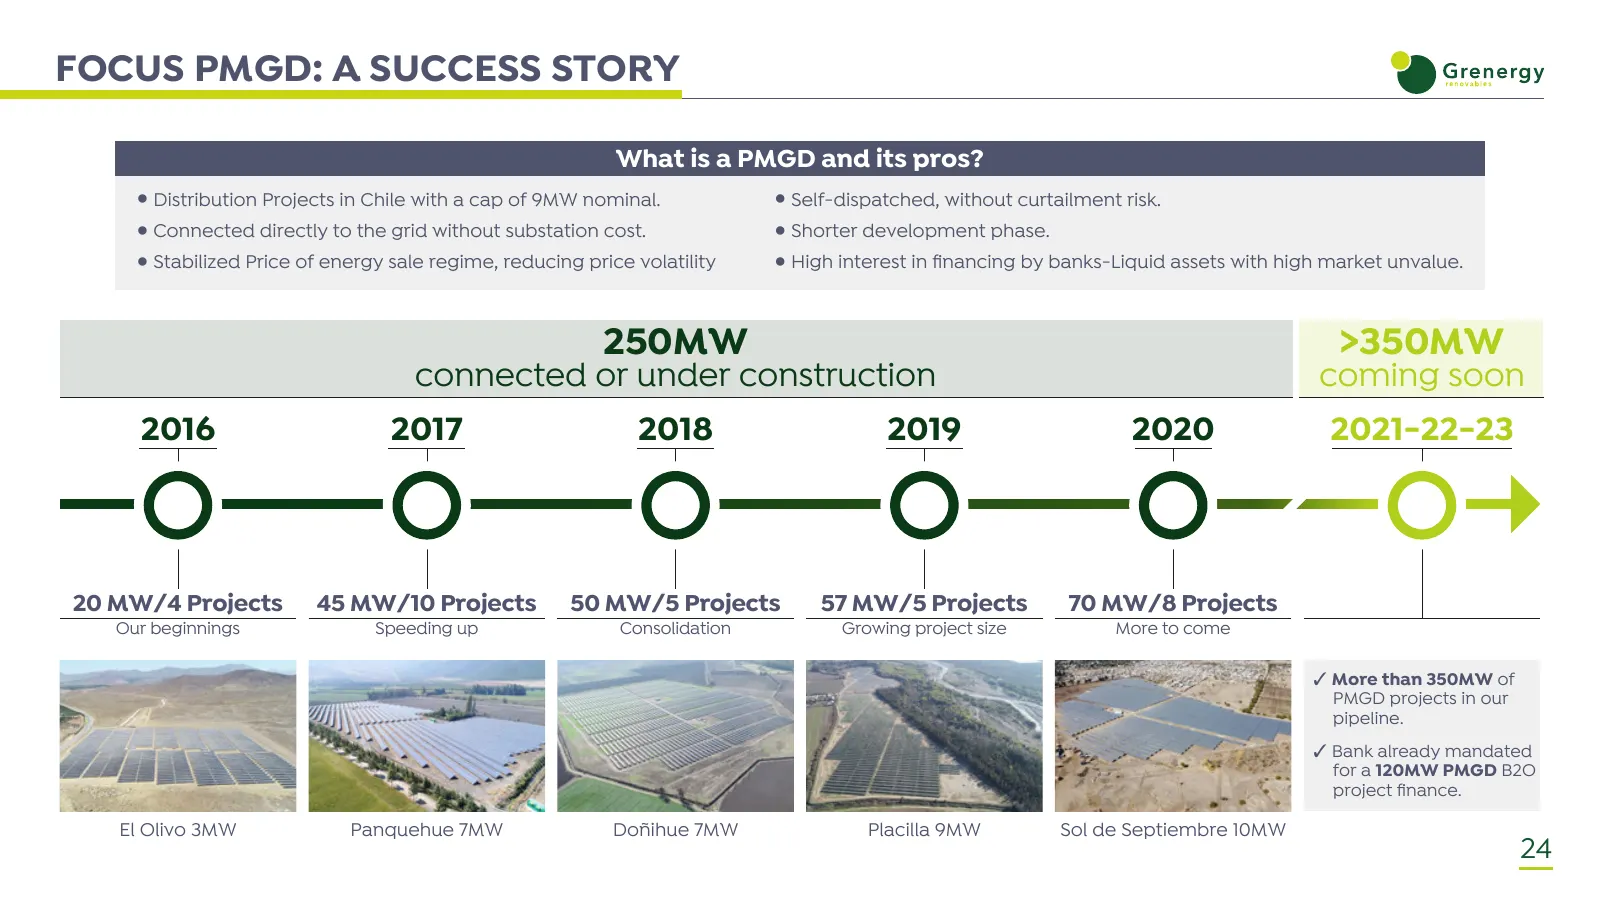
FOCUS PMGD: A SUCCESS STORY What is a PMGD and its pros? ● Distribution Projects in Chile with a cap of 9MW nominal. ● Self-dispatched, without curtailment risk. ● Connected directly to the grid without substation cost. ● Shorter development phase. ● Stabilized Price of energy sale regime, reducing
Slide 25: Appendixes
APPENDIXES
Slide 26: Platform with Relevant Growth Potential
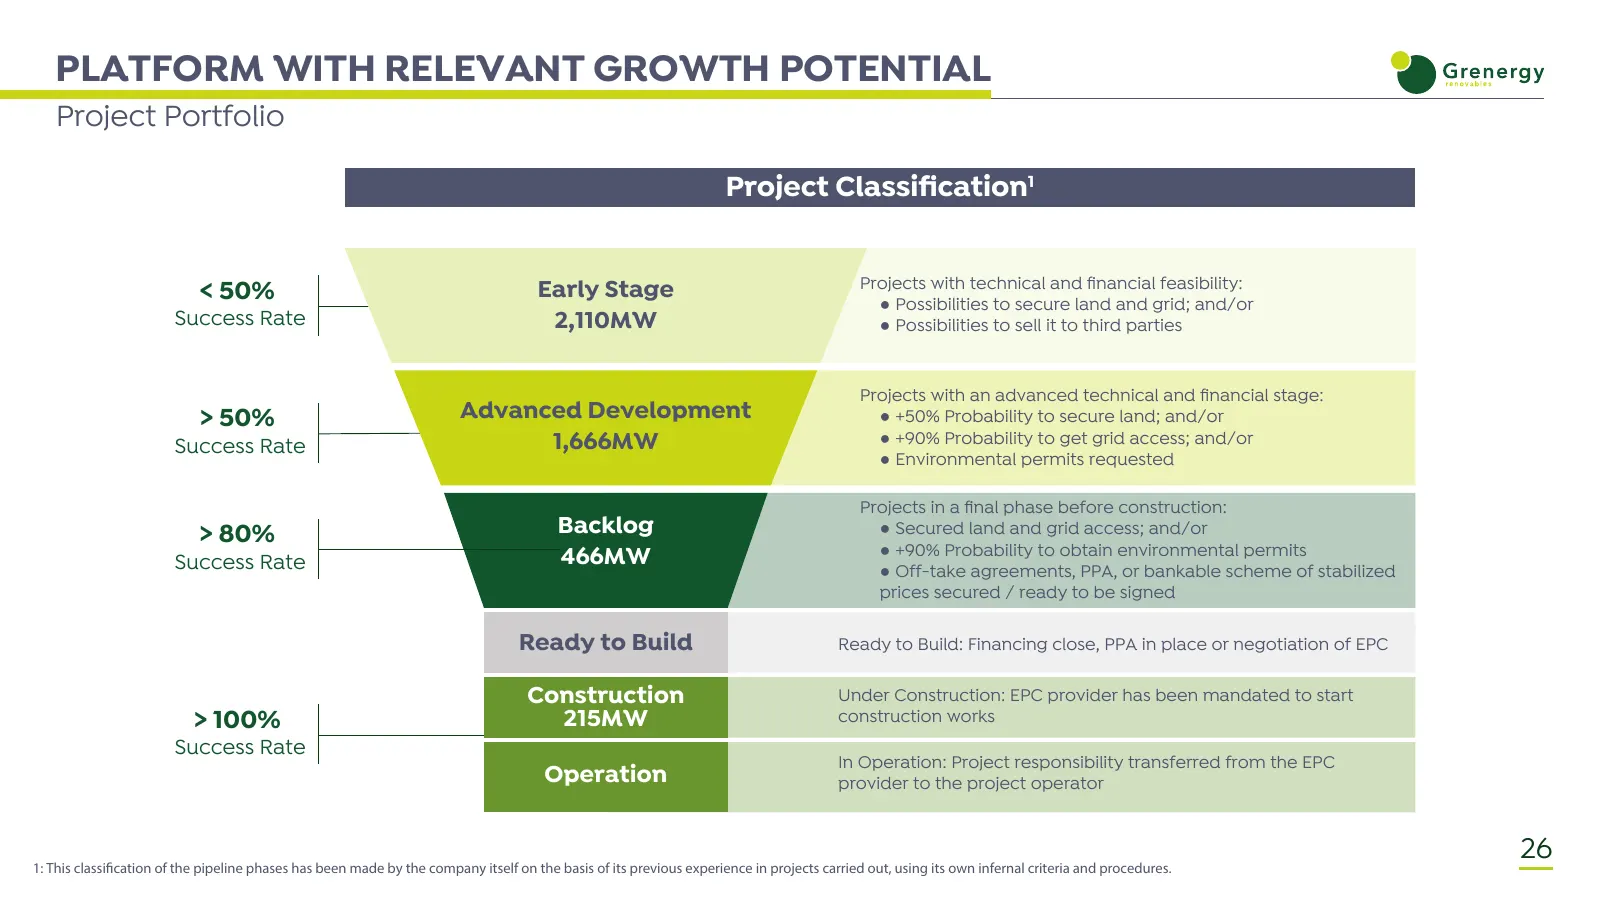
PLATFORM WITH RELEVANT GROWTH POTENTIAL Project Portfolio Project Classification1 Early Stage Projects with technical and financial feasibility: < 50% ● Possibilities to secure land and grid; and/or Success Rate 2,110MW ● Possibilities to sell it to third parties Projects with an advanced technical an
Slide 27: Project Overview: Under Construction
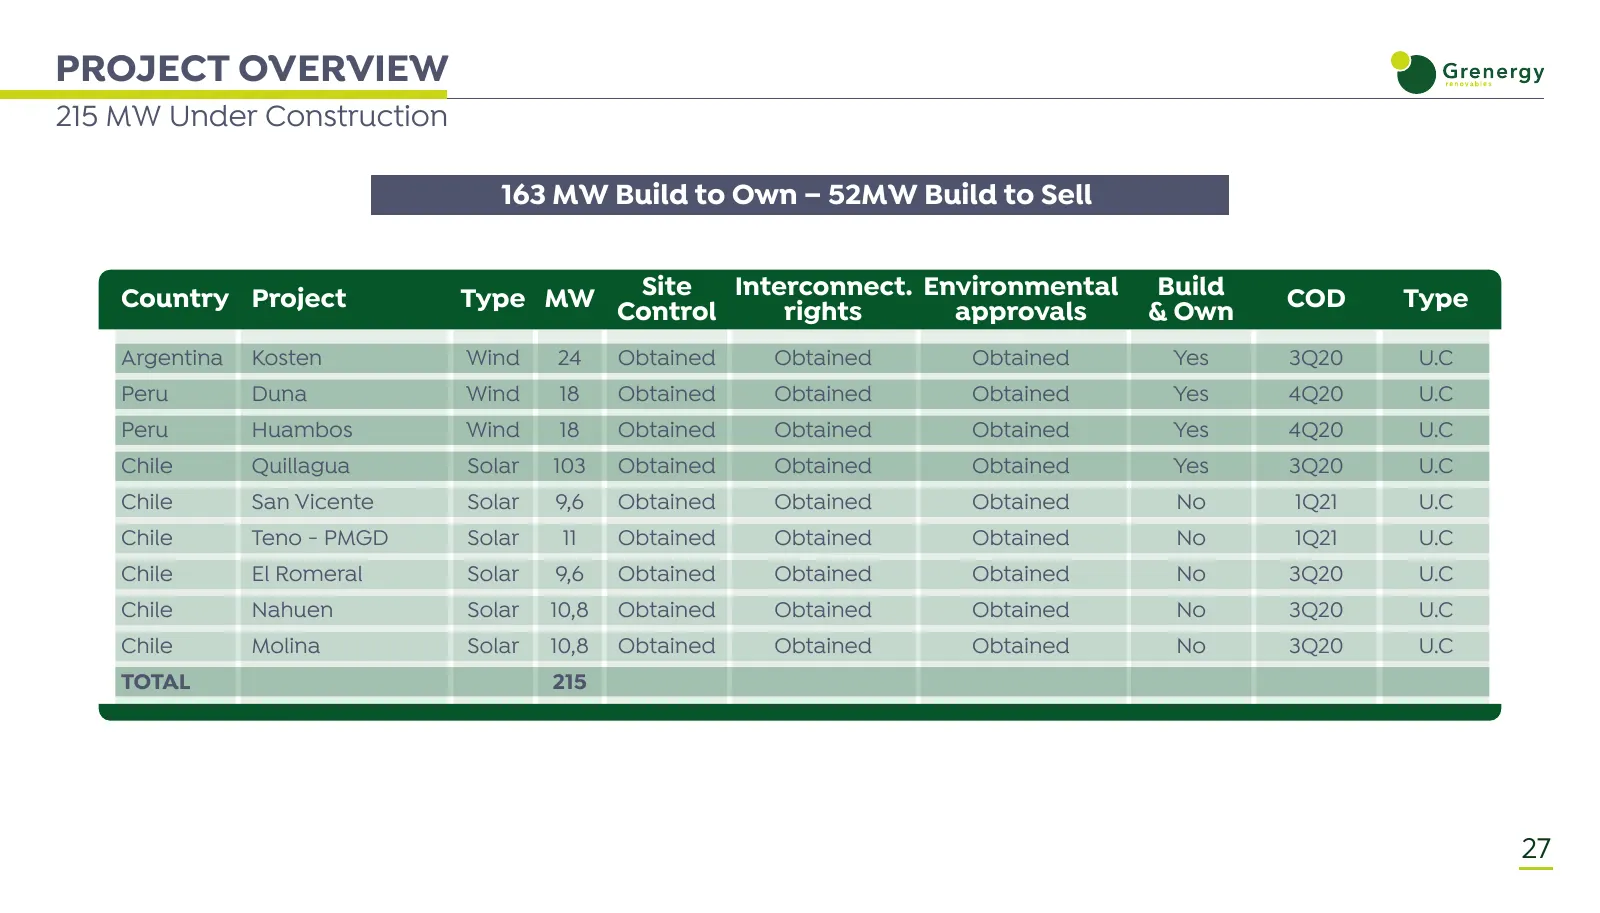
PROJECT OVERVIEW 215 MW Under Construction 163 MW Build to Own – 52MW Build to Sell Country Project Site Type MW Control Interconnect. Environmental Build COD Type rights approvals & Own Argentina Kosten Wind 24 Obtained Obtained Obtained Yes 3Q20 U.C Peru Duna Wind 18 Obtained Obtained Obtained Yes
Slide 28: Project Overview: Backlog
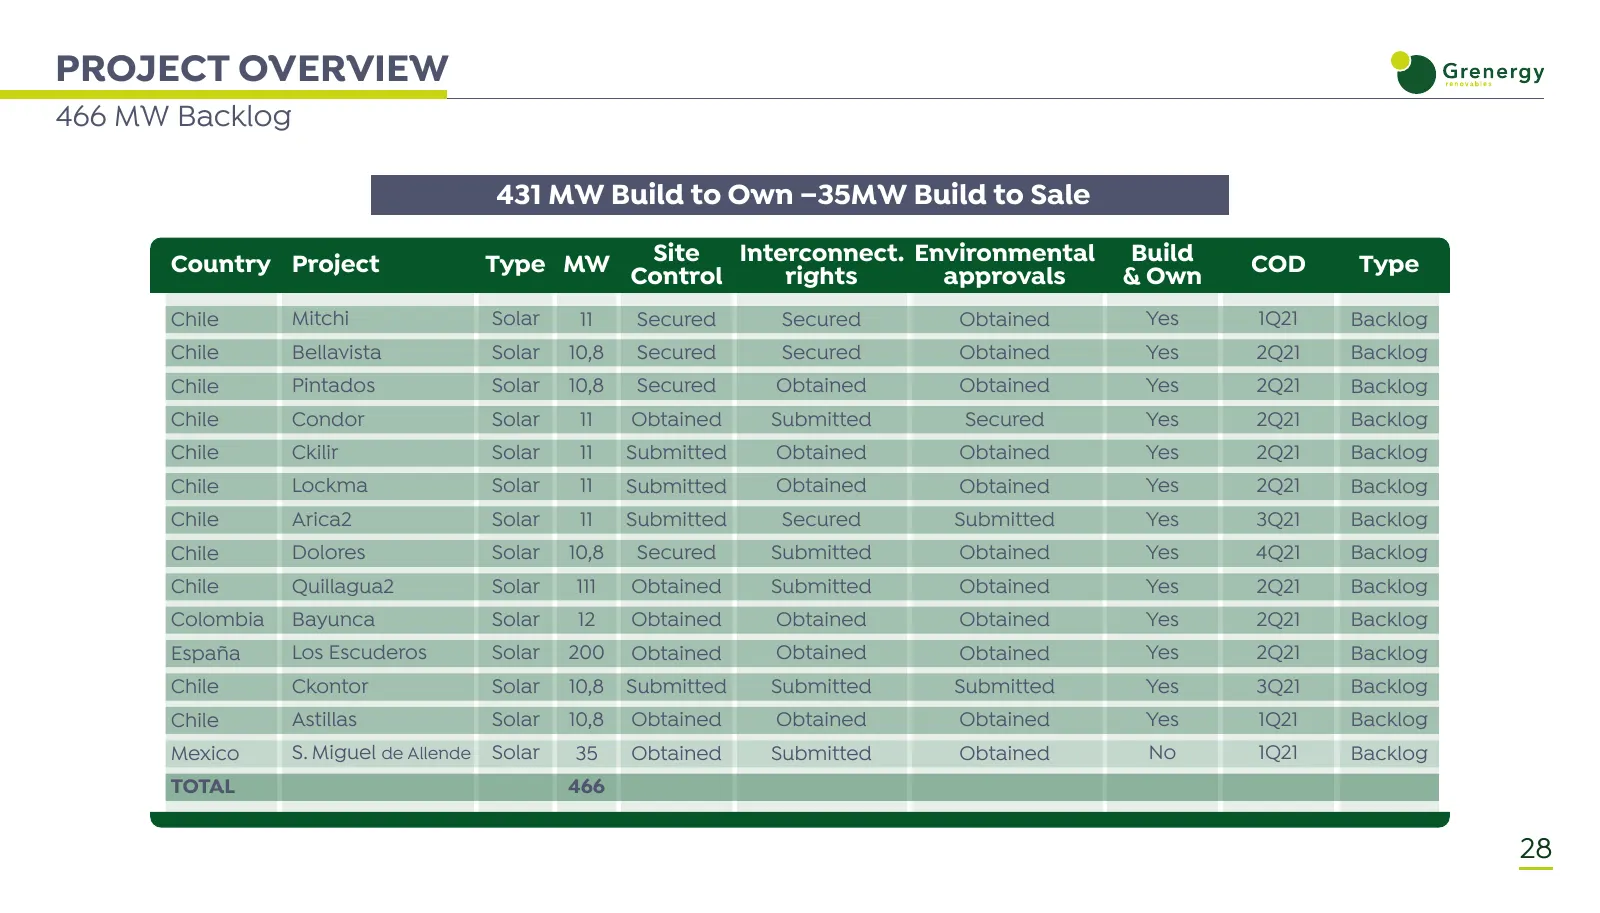
PROJECT OVERVIEW 466 MW Backlog 431 MW Build to Own –35MW Build to Sale Country Project Site Type MW Control Interconnect. Environmental Build COD Type rights approvals & Own Chile Mitchi Solar 11 Secured Secured Obtained Yes 1Q21 Backlog Chile Bellavista Solar 10,8 Secured Secured Obtained Yes 2Q21
Slide 29: Project Overview: Advanced Development
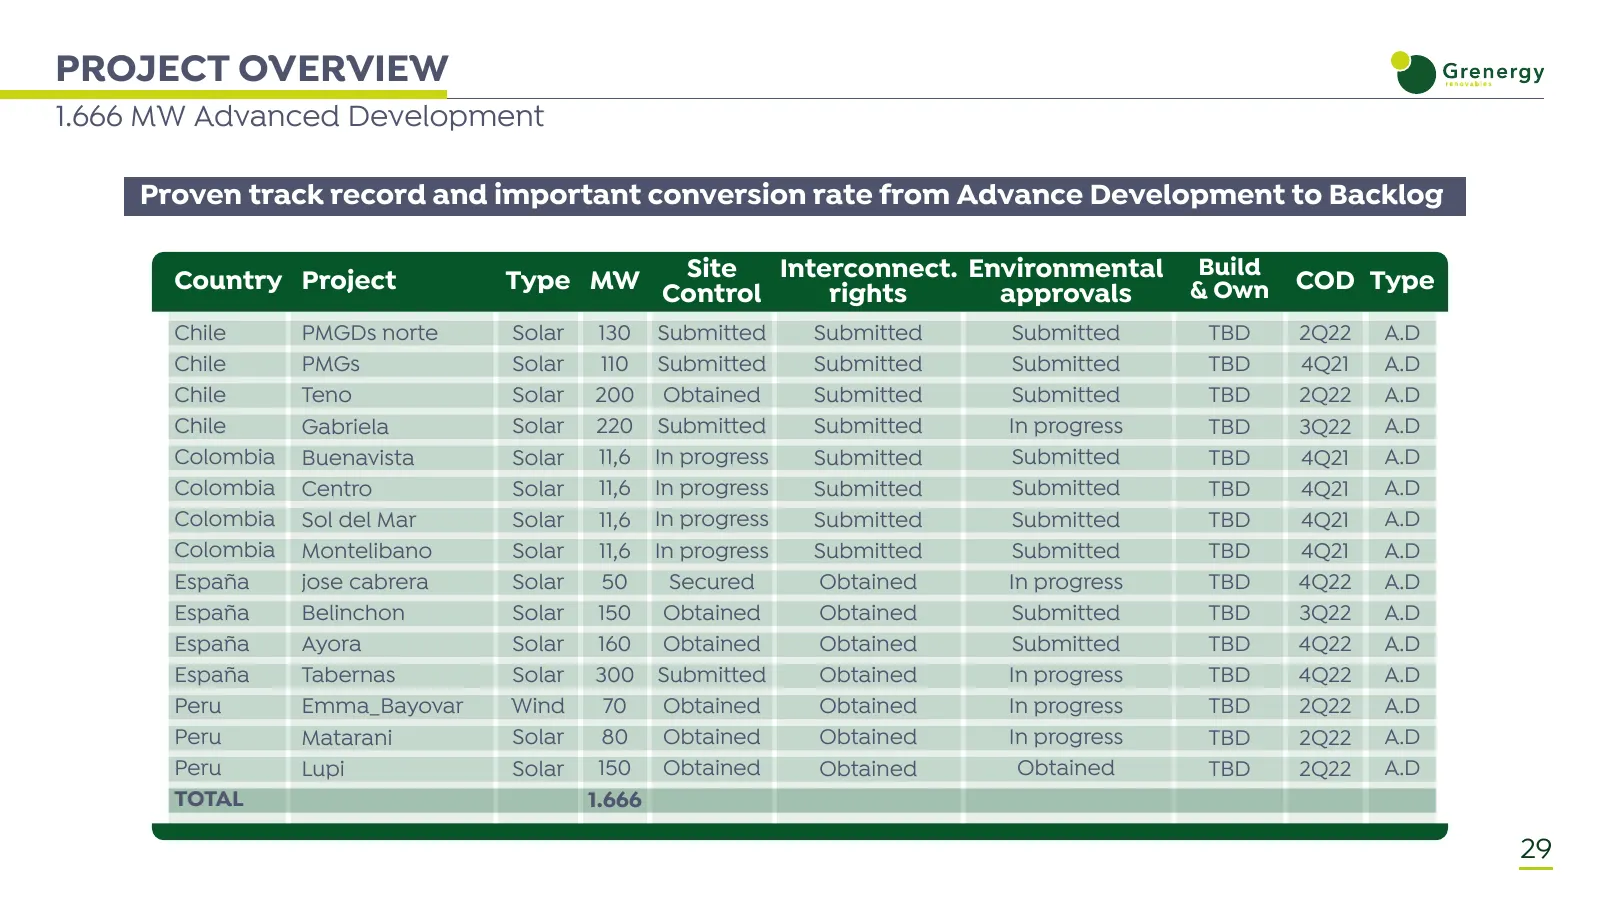
PROJECT OVERVIEW 1.666 MW Advanced Development Proven track record and important conversion rate from Advance Development to Backlog Country Project Site Type MW Control Interconnect. Environmental Build COD Type rights approvals & Own Chile PMGDs norte Solar 130 Submitted Submitted Submitted TBD 2Q
Slide 30: 1Q20 Results: Profit and Losses
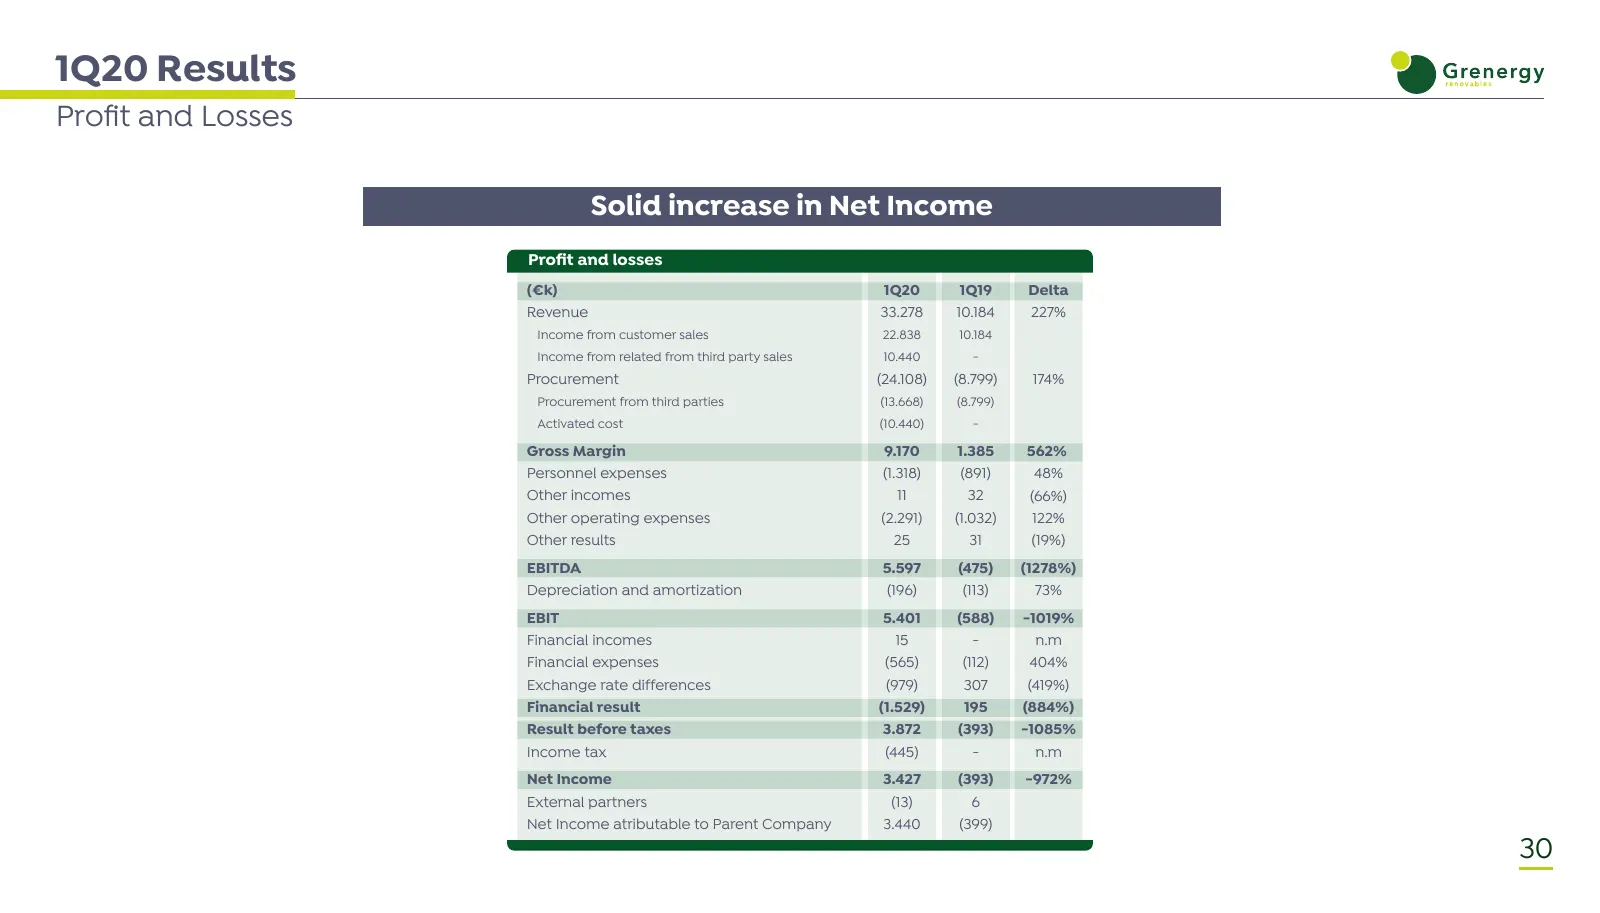
1Q20 Results Profit and Losses Solid increase in Net Income Profit and losses (€k) 1Q20 1Q19 Delta Revenue 33.278 10.184 227% Income from customer sales 22.838 10.184 Income from related from third party sales 10.440 - Procurement (24.108) (8.799) 174% Procurement from third parties (13.668) (8.799) A
Slide 31: 1Q20 Results: Balance Sheet
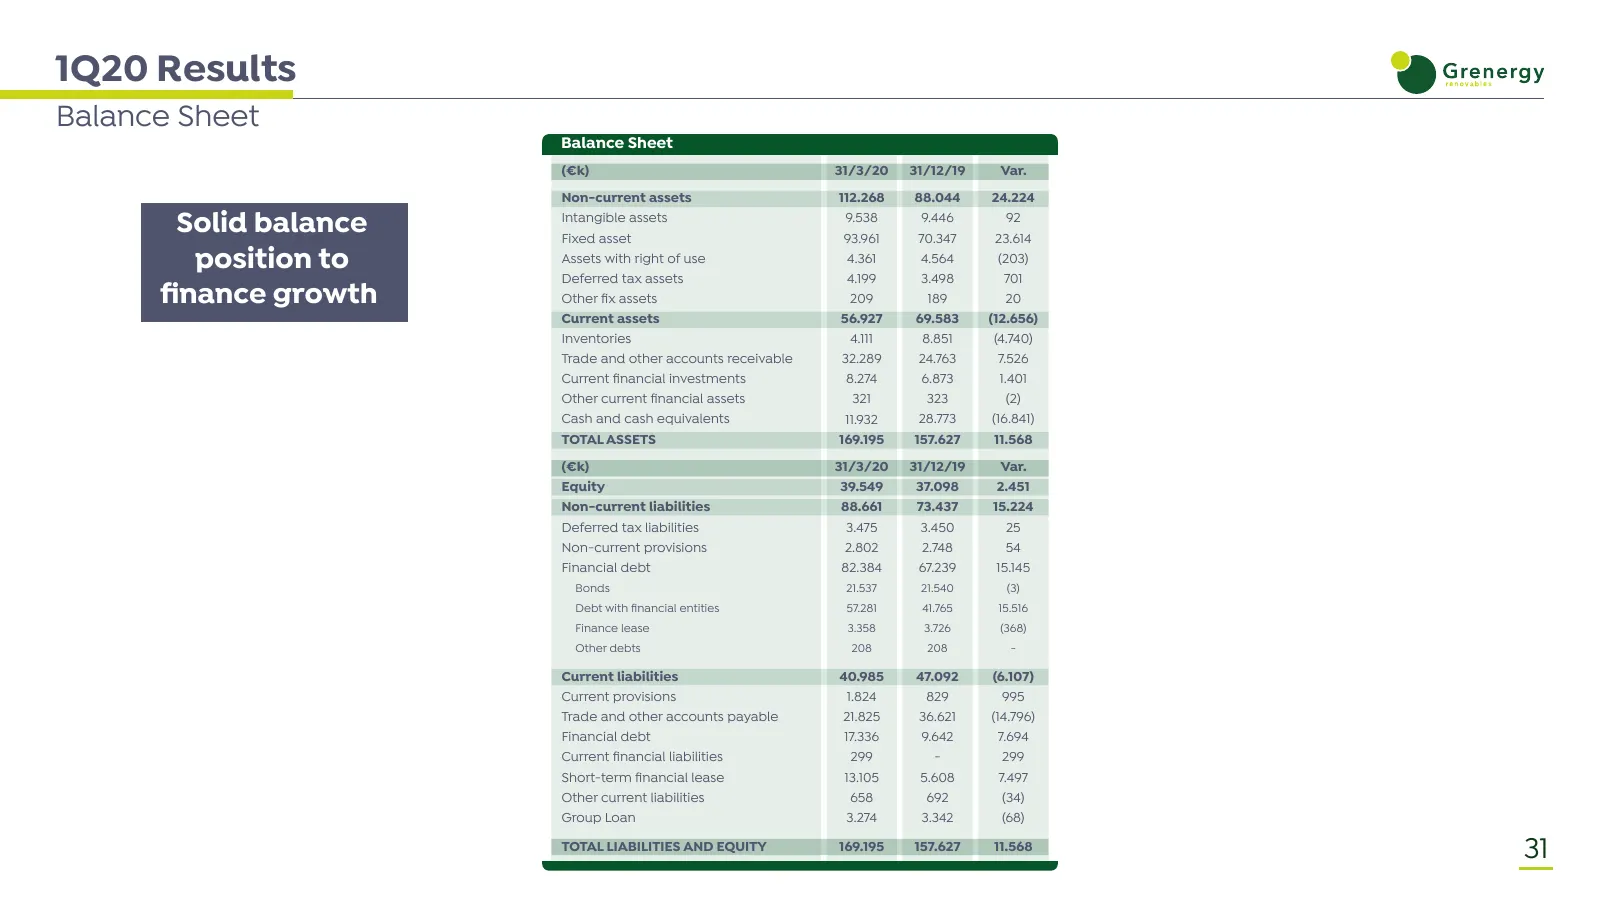
1Q20 Results Balance Sheet Balance Sheet (€k) 31/3/20 31/12/19 Var. Non-current assets 112.268 88.044 24.224 Solid balance Intangible assets Fixed asset 9.538 93.961 9.446 70.347 92 23.614 position to Assets with right of use 4.361 4.564 (203) Deferred tax assets 4.199 3.498 701 finance growth Other
Slide 32: 1Q20 Results: Net Debt
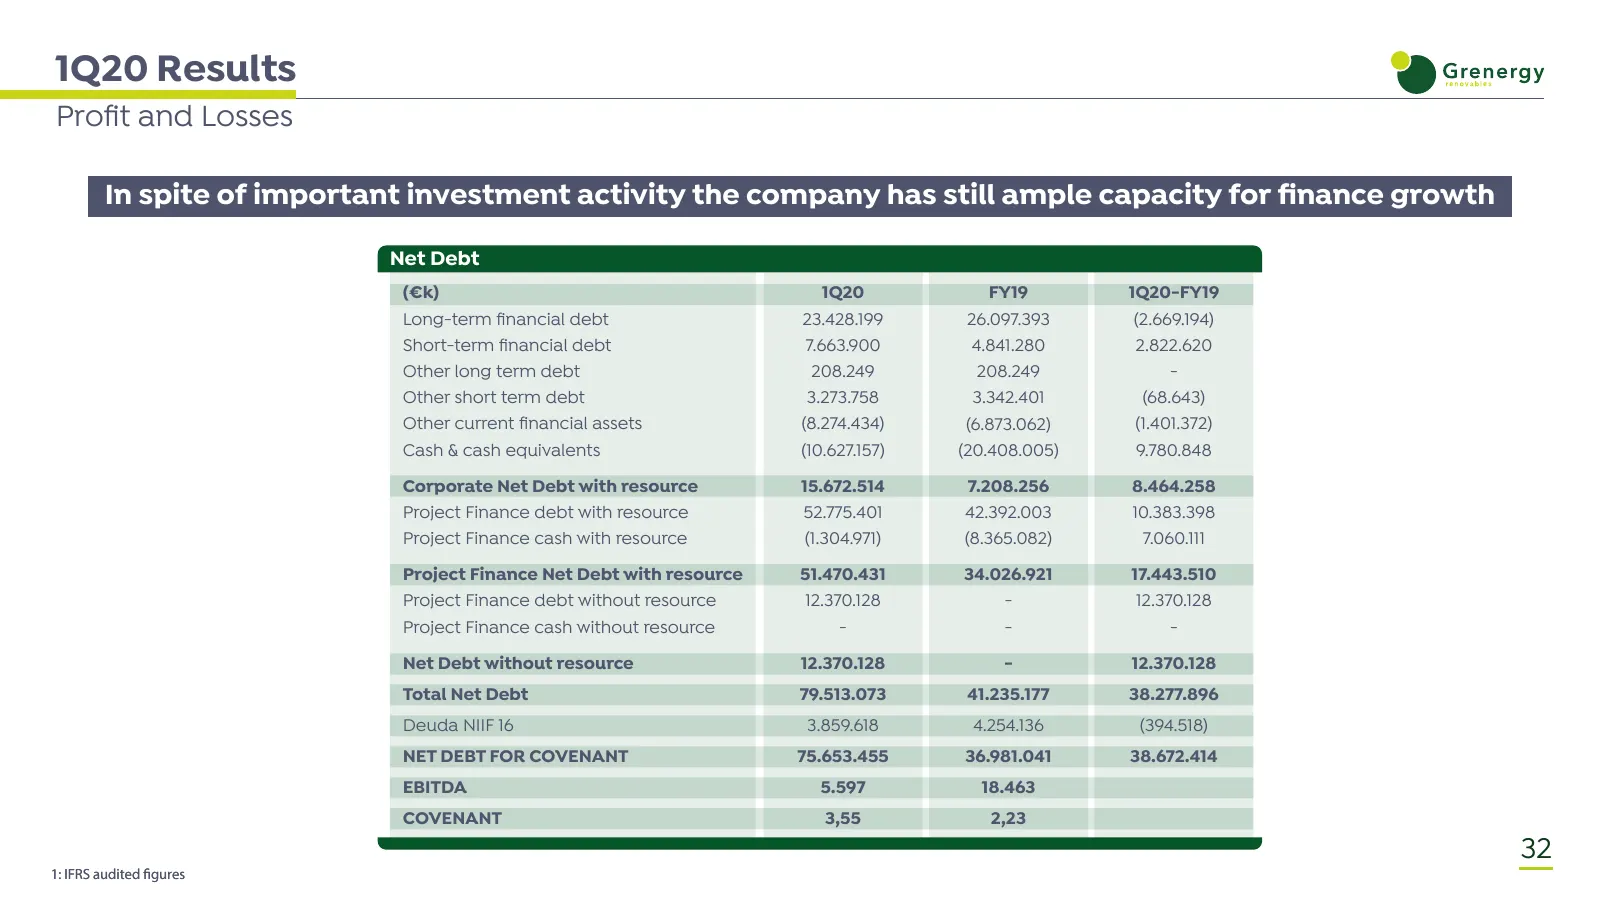
1Q20 Results Profit and Losses In spite of important investment activity the company has still ample capacity for finance growth Net Debt (€k) 1Q20 FY19 1Q20-FY19 Long-term financial debt 23.428.199 26.097.393 (2.669.194) Short-term financial debt 7.663.900 4.841.280 2.822.620 Other long term debt 208.2
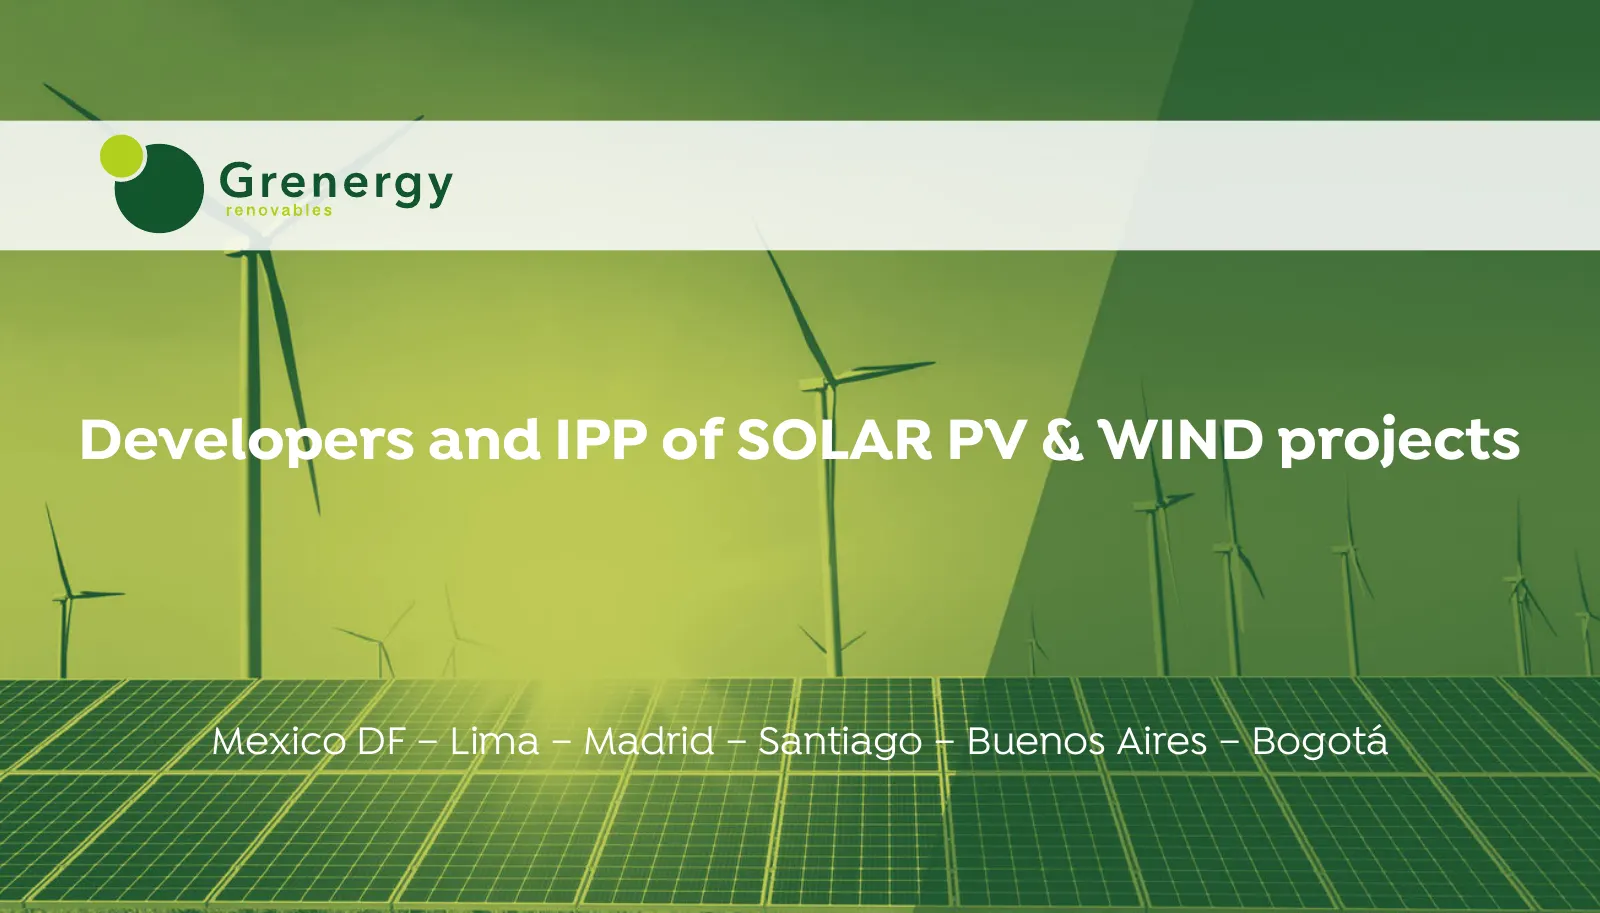
Slide 33: Developers and IPP of Solar PV & Wind Projects
Developers and IPP of SOLAR PV & WIND projects Mexico DF – Lima – Madrid – Santiago – Buenos Aires – Bogotá
Source: Internet Archive copy of grenergy.eu
More decks from Grenergy Renovables S.A
 H1 2026 Earnings Presentation38 slides · Sep 16, 2026
 Investor Presentation (September 2026)55 slides · September 2026
 Investor Presentation (July 2026)46 slides · July 2026
 Q1 2026 Earnings Presentation50 slides · May 27, 2026
 9M 2025 Earnings Presentation36 slides · Nov 27, 2025
 Investor Day (May 2025)50 slides · May 28, 2025