Lorillard — Morgan Stanley Global Consumer & Retail Conference 2008
31 slides from Lorillard's conference presentation, Nov 18, 2008
Slide 1: Morgan Stanley Global Consumer & Retail Conference November, 2008
Morgan Stanley Global Consumer & Retail Conference November, 2008
Slide 2: Presenters
Presenters Martin L. Orlowsky Chairman, President and Chief Executive Officer David H. Taylor Executive Vice President, Finance and Planning, Chief Financial Officer
Slide 3: Agenda
Agenda Introduction Industry Operating Environment Business Overview Financial Performance
Slide 4: Safe Harbor Disclaimer
Safe Harbor Disclaimer You are cautioned that certain statements made in this presentation are "forward-looking" statements within the meaning of the Private Securities Litigation Reform Act of 1995. Forward-looking statements include, without limitation, any statement that may project, indicate or
Slide 5: Regulation G Compliance
Regulation G Compliance You are also reminded that during this presentation, certain non-GAAP financial measures, such as EBIT, EBITDA and Operating Profit per unit may be discussed. These measures should not be considered an alternative to net income, or any other measure of financial performance o
Slide 6: Introduction to Lorillard
Introduction to Lorillard Martin L. Orlowsky Chairman, President and Chief Executive Officer
Slide 7: Lorillard Overview
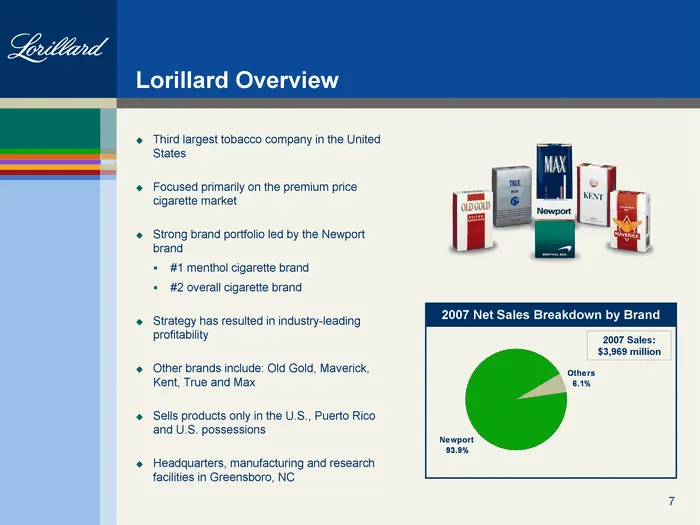
Lorillard Overview Third largest tobacco company in the United States Focused primarily on the premium price cigarette market Strong brand portfolio led by the Newport brand #1 menthol cigarette brand #2 overall cigarette brand Strategy has resulted in industry-leading profitability Other brands inc
Slide 8: Investment Highlights
Investment Highlights Leader in the best performing segments of the cigarette market Significant Newport brand equity Continuous increases in share of market Strategy has resulted in industry-leading relative profitability Strong management with a focus on execution has produced a record of strong f
Slide 9: Industry Operating Environment
Industry Operating Environment
Slide 10: Trends in the U.S. Cigarette Market
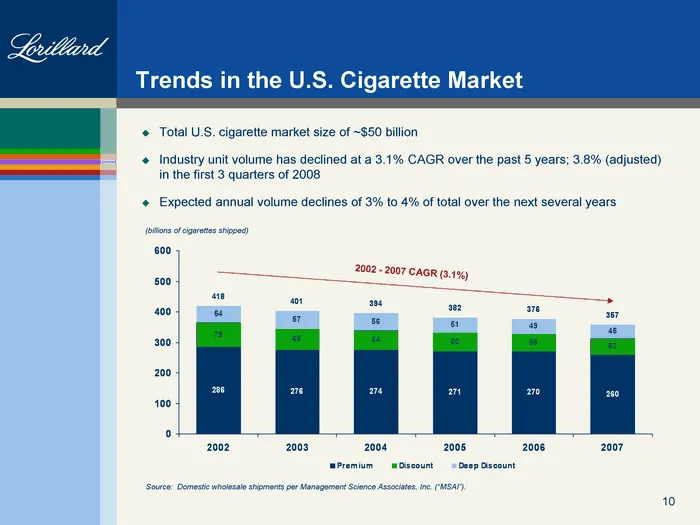
Trends in the U.S. Cigarette Market Total U.S. cigarette market size of ~$50 billion Industry unit volume has declined at a 3.1% CAGR over the past 5 years; 3.8% (adjusted) in the first 3 quarters of 2008 Expected annual volume declines of 3% to 4% of total over the next several years 2002 2003 2004
Slide 11: Segment Share Percentage
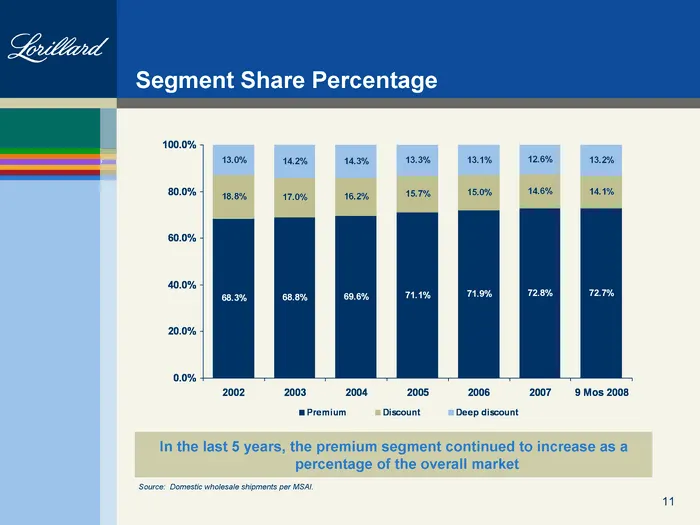
Segment Share Percentage 2002 2003 2004 2005 2006 2007 9 Mos 2008 Premium 0.6827 0.688 0.696 0.711 0.719 0.72800000013148 0.7267 Discount 0.1878 0.17 0.162 0.157 0.15 0.146 0.1413 Deep discount 0.1295 0.142 0.143 0.133 0.131 0.126 0.132 In the last 5 years, the premium segment continued to increase
Slide 12: Menthol / Non-Menthol Segmentation
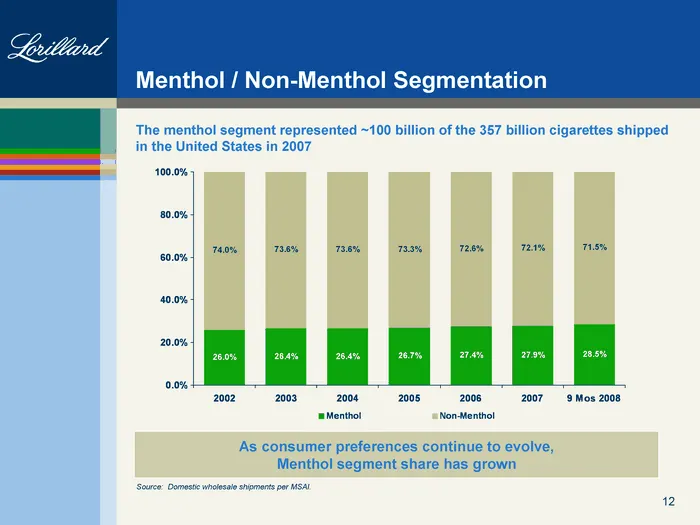
Menthol / Non-Menthol Segmentation As consumer preferences continue to evolve, Menthol segment share has grown 2002 2003 2004 2005 2006 2007 9 Mos 2008 Menthol 0.26 0.264 0.264 0.267 0.274 0.279 0.2849 Non-Menthol 0.74 0.736 0.736 0.733 0.726 0.721 0.7151 The menthol segment represented ~100 billion
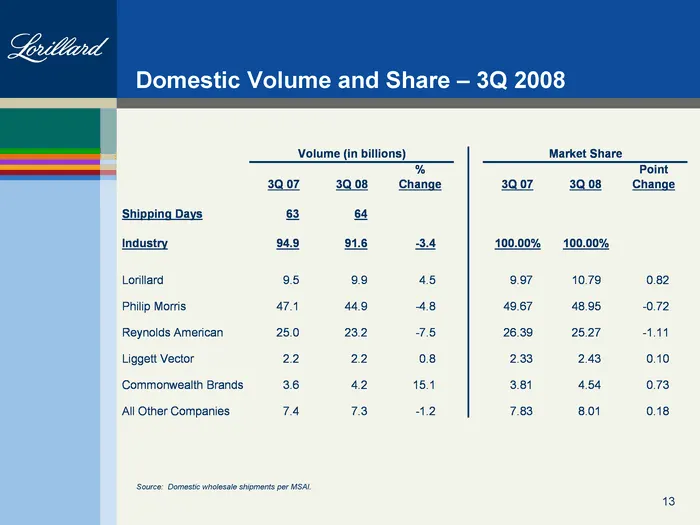
Slide 13: Domestic Volume and Share - 3Q 2008
Domestic Volume and Share - 3Q 2008 Source: Domestic wholesale shipments per MSAI.
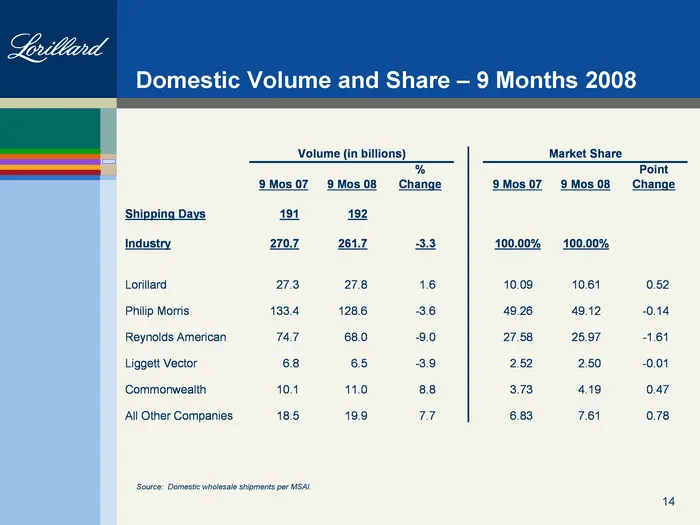
Slide 14: Domestic Volume and Share - 9 Months 2008
Domestic Volume and Share - 9 Months 2008 Source: Domestic wholesale shipments per MSAI.
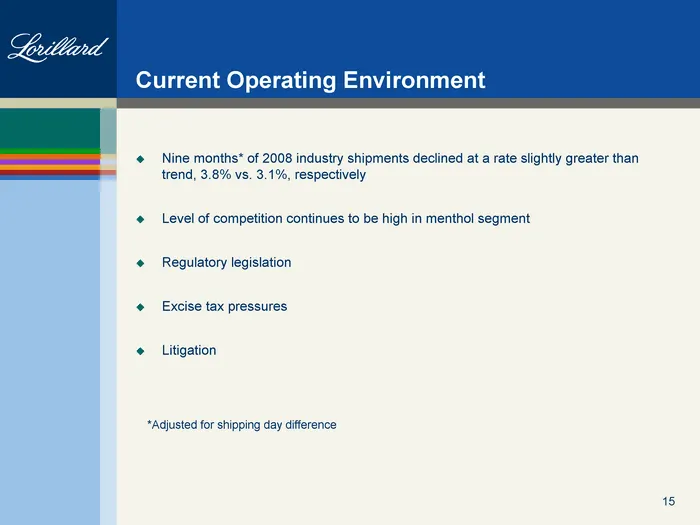
Slide 15: Current Operating Environment
Current Operating Environment Nine months* of 2008 industry shipments declined at a rate slightly greater than trend, 3.8% vs. 3.1%, respectively Level of competition continues to be high in menthol segment Regulatory legislation Excise tax pressures Litigation *Adjusted for shipping day difference
Slide 16: Business Overview
Cotlbwul Business Overview
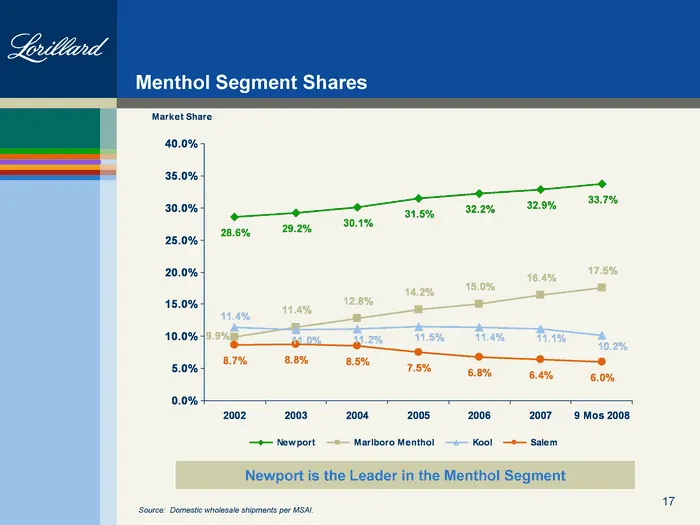
Slide 17: Menthol Segment Shares
Menthol Segment Shares 2002 2003 2004 2005 2006 2007 9 Mos 2008 Newport 0.286 0.292 0.301 0.315 0.322 0.329 0.337 Marlboro Menthol 0.099 0.114 0.128 0.142 0.15 0.164 0.175 Kool 0.114 0.11 0.112 0.115 0.114 0.111 0.102 Salem 0.087 0.088 0.085 0.075 0.068 0.064 0.06 Source: Domestic wholesale shipment
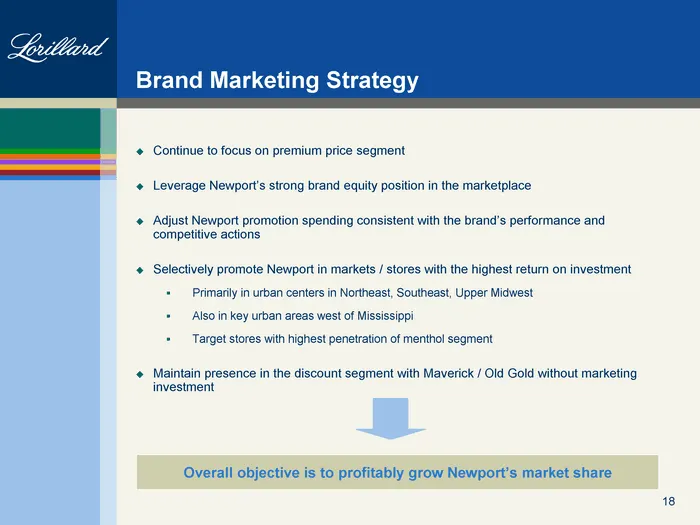
Slide 18: Brand Marketing Strategy
Brand Marketing Strategy Continue to focus on premium price segment Leverage Newport's strong brand equity position in the marketplace Adjust Newport promotion spending consistent with the brand's performance and competitive actions Selectively promote Newport in markets / stores with the highest re
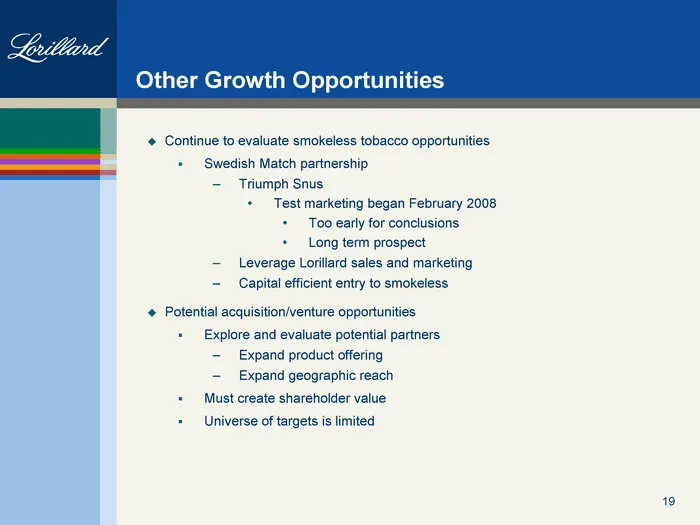
Slide 19: Other Growth Opportunities
Other Growth Opportunities Continue to evaluate smokeless tobacco opportunities Swedish Match partnership Triumph Snus Test marketing began February 2008 Too early for conclusions Long term prospect Leverage Lorillard sales and marketing Capital efficient entry to smokeless Potential acquisition/ven
Slide 20: Financial Performance and Outlook
Financial Performance and Outlook David H. Taylor Executive Vice President, Finance and Planning, Chief Financial Officer
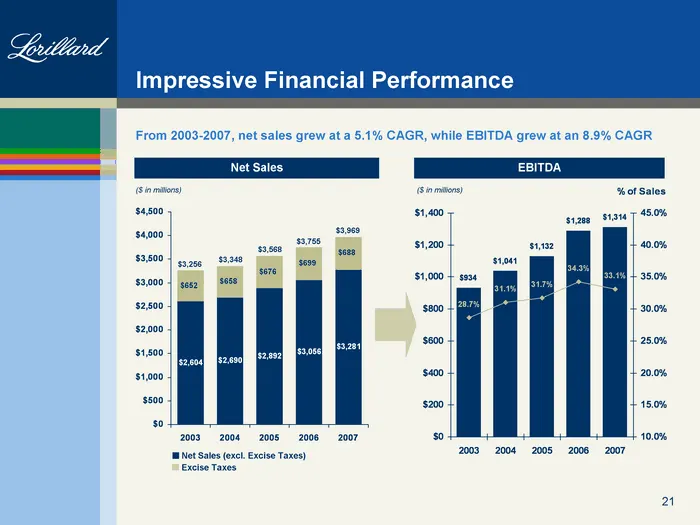
Slide 21: Impressive Financial Performance
2003 2004 2005 2006 2007 EBITDA 934.1 1040.7 1132.1 1288.2 1314 % of Sales 0.287 0.311 0.317 0.343 0.331 Impressive Financial Performance Net Sales EBITDA ($ in millions) ($ in millions) 2003 2004 2005 2006 2007 Net Sales (excl. Excise Taxes) 2604 2690 2892 3056 3281 Excise Taxes 652 658 676 699 688
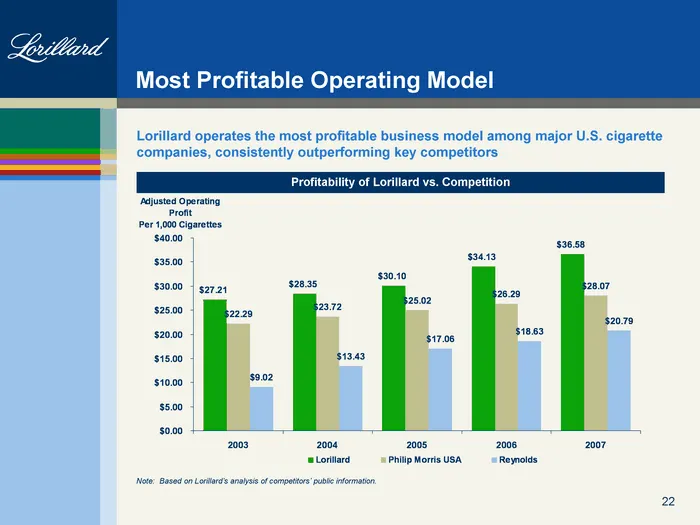
Slide 22: Most Profitable Operating Model
Most Profitable Operating Model 2003 2004 2005 2006 2007 Lorillard 27.21 28.35 30.1 34.13 36.58 Philip Morris USA 22.29 23.72 25.02 26.29 28.07 Reynolds 9.02 13.43 17.06 18.63 20.79 Profitability of Lorillard vs. Competition Lorillard operates the most profitable business model among major U.S. ciga
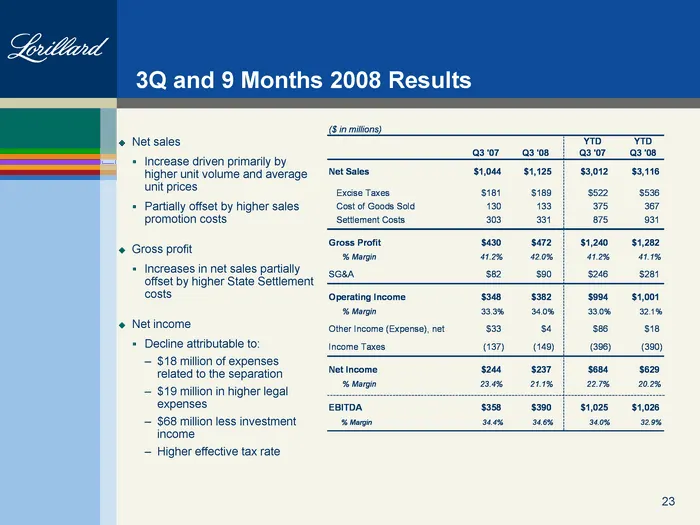
Slide 23: 3Q and 9 Months 2008 Results
3Q and 9 Months 2008 Results Net sales Increase driven primarily by higher unit volume and average unit prices Partially offset by higher sales promotion costs Gross profit Increases in net sales partially offset by higher State Settlement costs Net income Decline attributable to: $18 million of exp
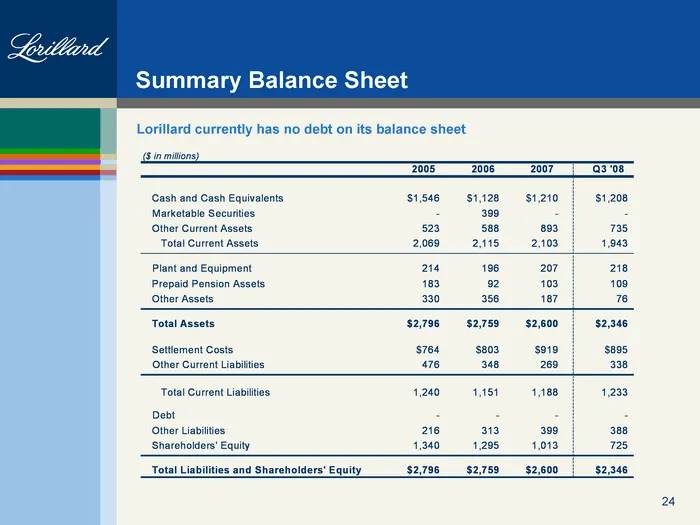
Slide 24: Summary Balance Sheet
Summary Balance Sheet Lorillard currently has no debt on its balance sheet
Slide 25: Capital Structure
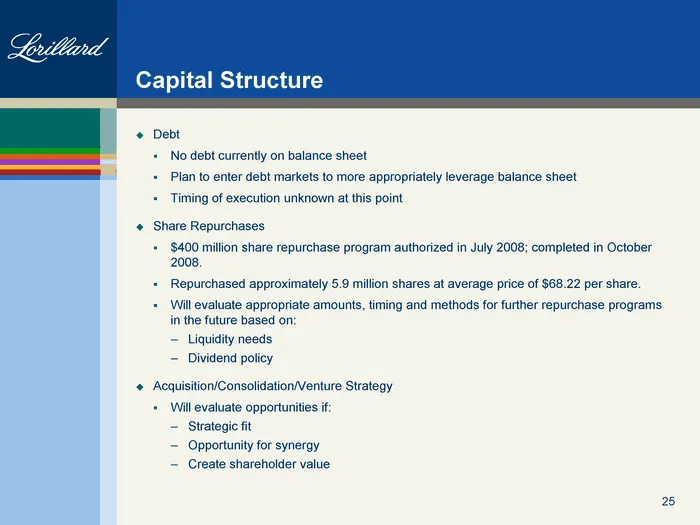
Capital Structure Debt No debt currently on balance sheet Plan to enter debt markets to more appropriately leverage balance sheet Timing of execution unknown at this point Share Repurchases $400 million share repurchase program authorized in July 2008; completed in October 2008. Repurchased approxim
Slide 26: Dividends
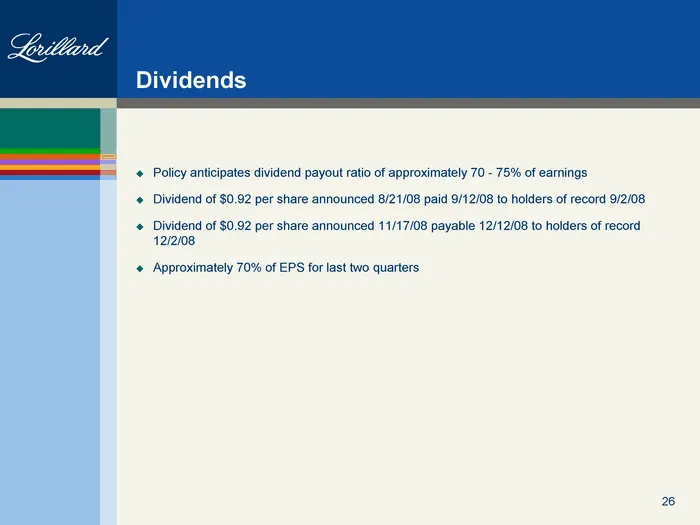
Dividends Policy anticipates dividend payout ratio of approximately 70 - 75% of earnings Dividend of $0.92 per share announced 8/21/08 paid 9/12/08 to holders of record 9/2/08 Dividend of $0.92 per share announced 11/17/08 payable 12/12/08 to holders of record 12/2/08 Approximately 70% of EPS for la
Slide 27: Outlook
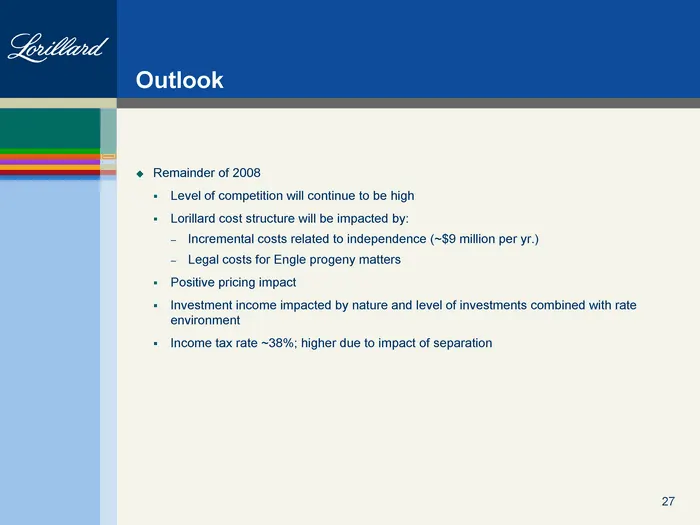
Outlook Remainder of 2008 Level of competition will continue to be high Lorillard cost structure will be impacted by: Incremental costs related to independence (~$9 million per yr.) Legal costs for Engle progeny matters Positive pricing impact Investment income impacted by nature and level of invest
Slide 28: Outlook and Objectives
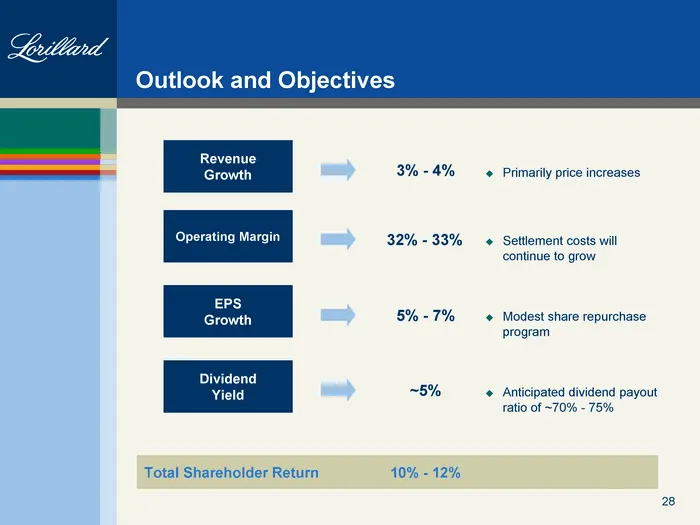
Outlook and Objectives Revenue Growth EPS Growth Dividend Yield 3% - 4% 5% - 7% ~5% Total Shareholder Return 10% - 12% Modest share repurchase program Anticipated dividend payout ratio of ~70% - 75% Operating Margin 32% - 33% Primarily price increases Settlement costs will continue to grow
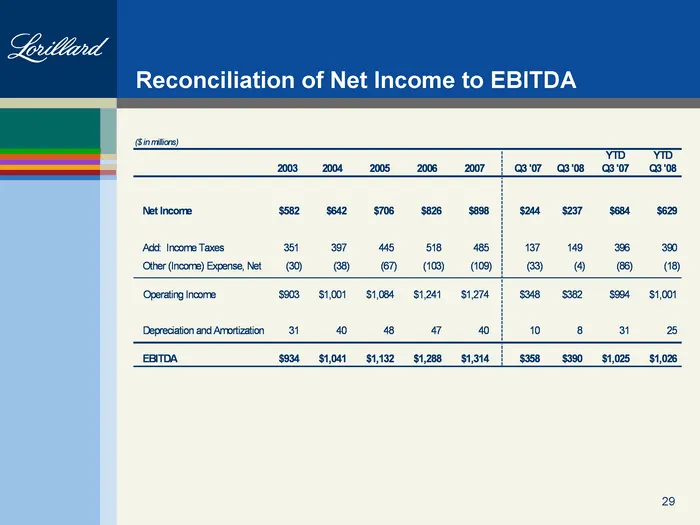
Slide 29: Reconciliation of Net Income to EBITDA
Reconciliation of Net Income to EBITDA
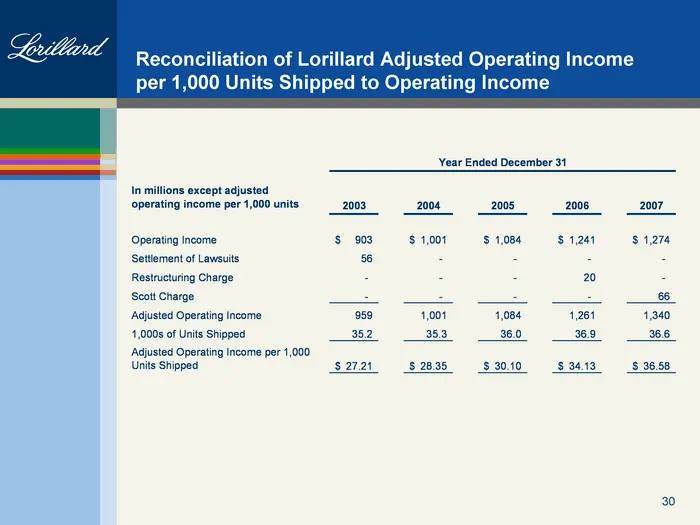
Slide 30: Reconciliation of Adjusted Operating Income per 1,000 Units Shipped
Reconciliation of Lorillard Adjusted Operating Income per 1,000 Units Shipped to Operating Income
Slide 31: Questions
Coilbwul Questions
Source: SEC EDGAR · 8-K filed Nov 18, 2008
More decks from Lorillard Inc
 Merger or Acquisition (February 2015)62 slides · Feb 18, 2015
 Merger or Acquisition (November 2014)40 slides · Nov 17, 2014
 Merger or Acquisition (September 2014)25 slides · Sep 4, 2014
 Merger or Acquisition (July 2014)13 slides · Jul 15, 2014
 Merger or Acquisition (July 2014)42 slides · Jul 15, 2014
 Merger or Acquisition (July 2014)30 slides · Jul 15, 2014