Verallia SAS · EURONEXT:VRLA
Verallia SAS — Verallia — Q1 2024 Earnings Presentation
25 slides from Verallia SAS's earnings presentation, Apr 25, 2024

Slide 1: Q1 2024 results
Q1 2024 results 25 April 2024
Slide 2: Summary
Summary 01 Introduction 02 Key 03 Q1 2024 04 FY 2024 highlights financial results guidance Q1 2024 RESULTS 25.04.24 2

Slide 3: Introduction
INTRODUCTION Patrice LUCAS CEO Q1 2024 RESULTS 25.04.24 3
Slide 4: A global leader in glass packaging
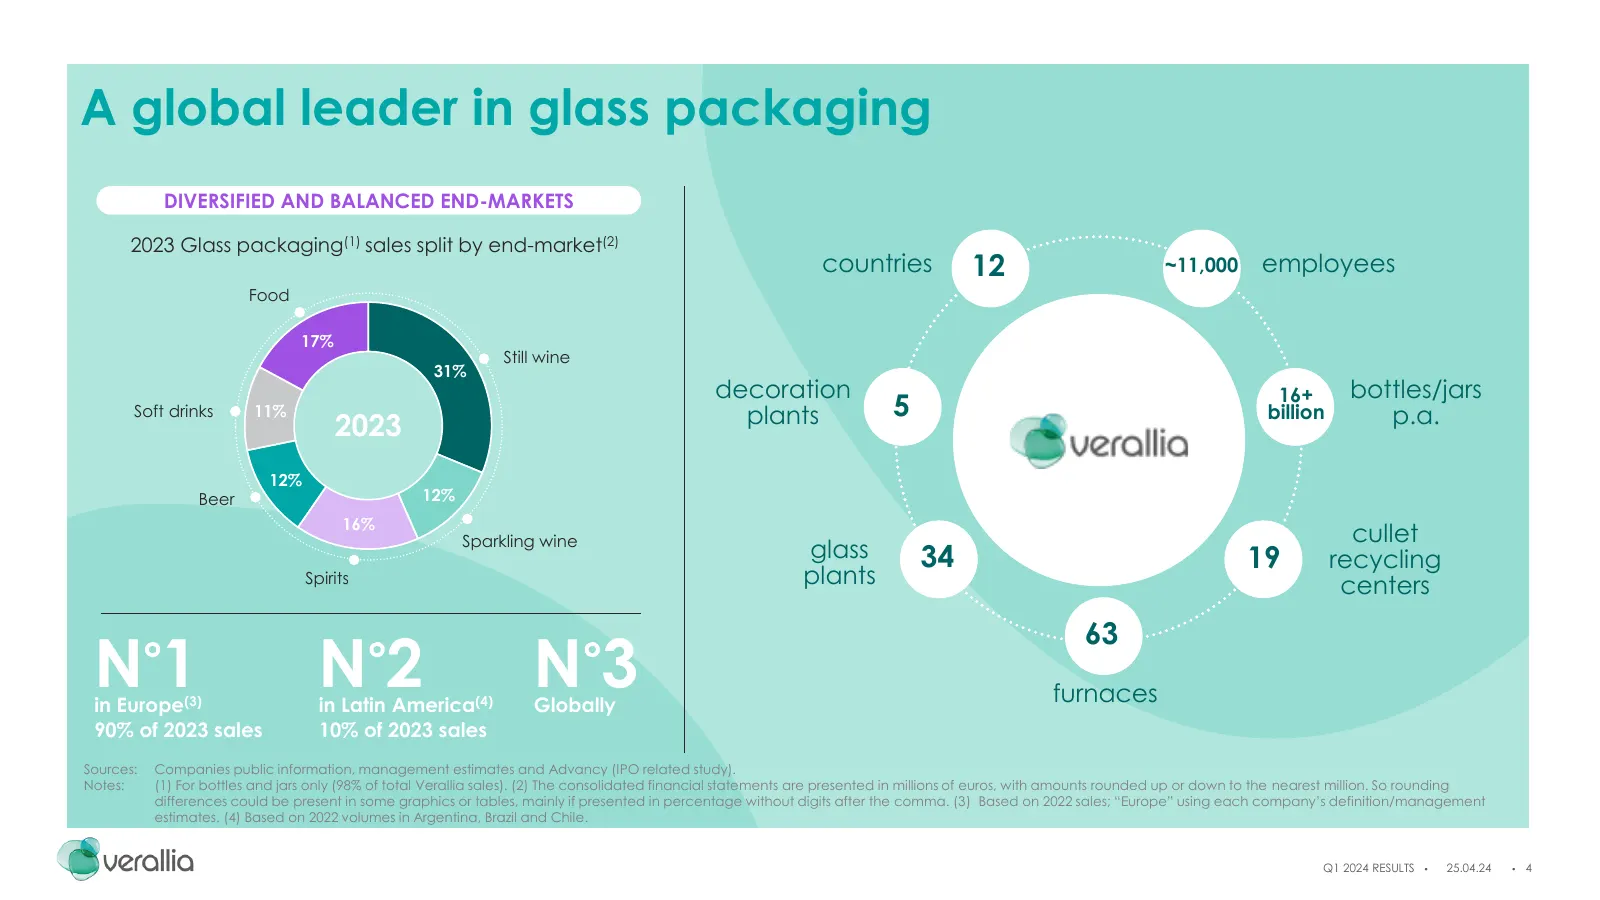
A global leader in glass packaging DIVERSIFIED AND BALANCED END-MARKETS 2023 Glass packaging(1) sales split by end-market(2) countries 12 ~11,000 employees Food 17% Still wine 31% decoration 16+ bottles/jars Soft drinks 11% plants 5 billion p.a. 2023 12% Beer 12% 16% Sparkling wine cullet glass 34 1

Slide 5: Key highlights
KEY HIGHLIGHTS Patrice LUCAS CEO Q1 2024 RESULTS 25.04.24 5
Slide 6: Verallia has entered into an agreement to acquire Vidrala's glass business in Italy
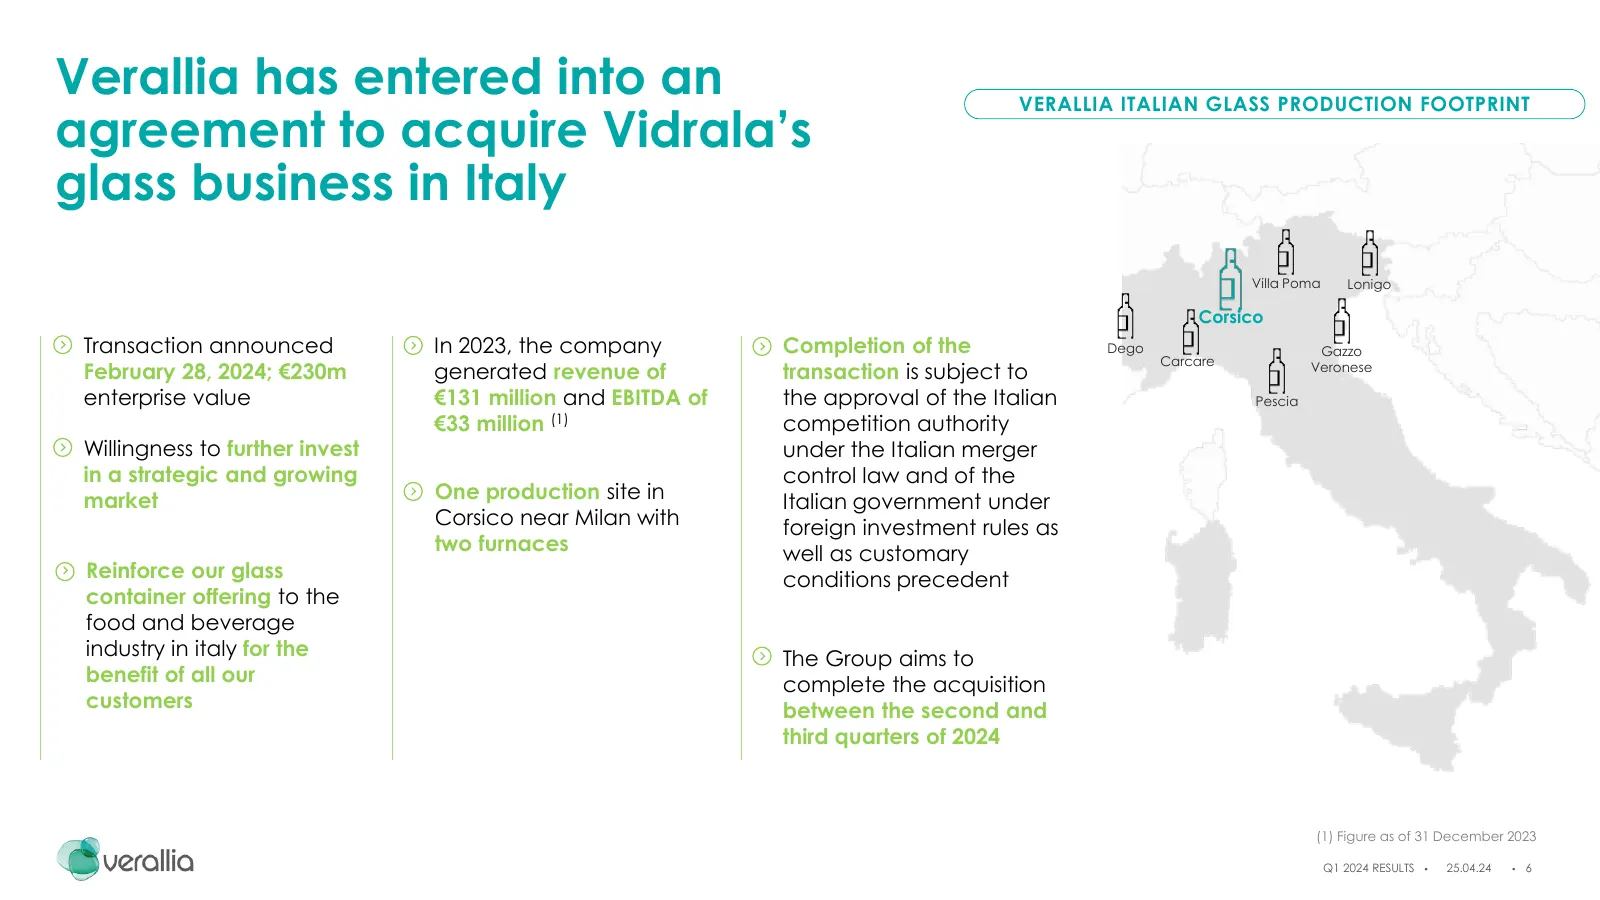
Verallia has entered into an VERALLIA ITALIAN GLASS PRODUCTION FOOTPRINT agreement to acquire Vidrala’s glass business in Italy Villa Poma Lonigo Corsico Transaction announced In 2023, the company Completion of the Dego Gazzo Carcare February 28, 2024; €230m generated revenue of transaction is subje
Slide 7: Start of the first 100% electrical furnace, in Cognac, France
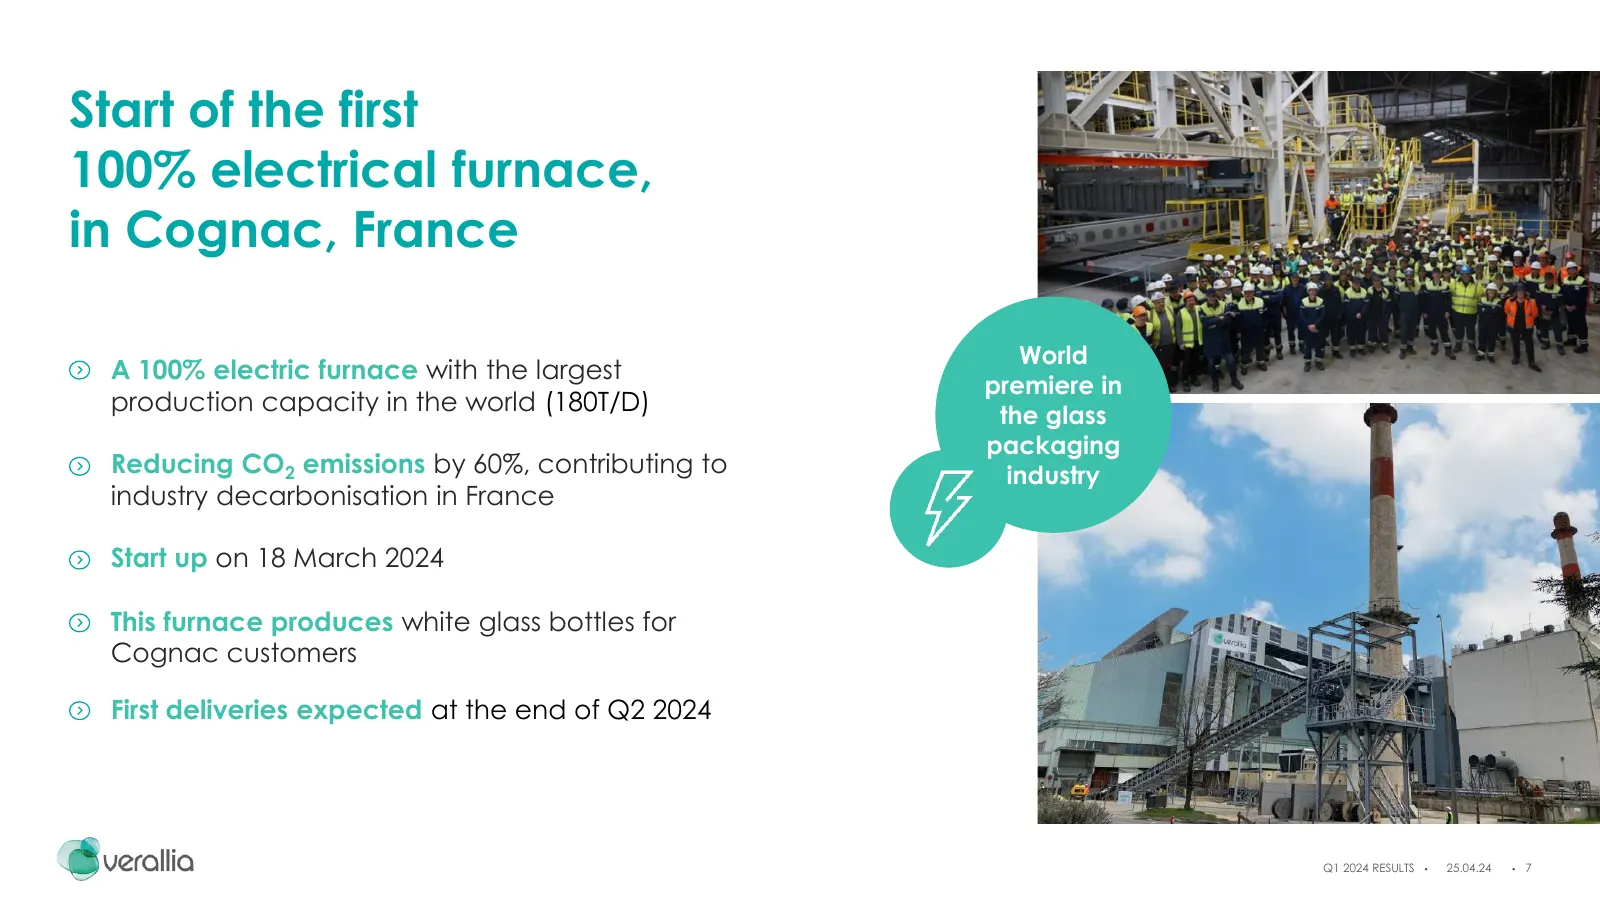
Start of the first 100% electrical furnace, in Cognac, France World A 100% electric furnace with the largest premiere in production capacity in the world (180T/D) the glass packaging Reducing CO2 emissions by 60%, contributing to industry industry decarbonisation in France Start up on 18 March 2024
Slide 8: Group CSR performance once again recognized and rewarded
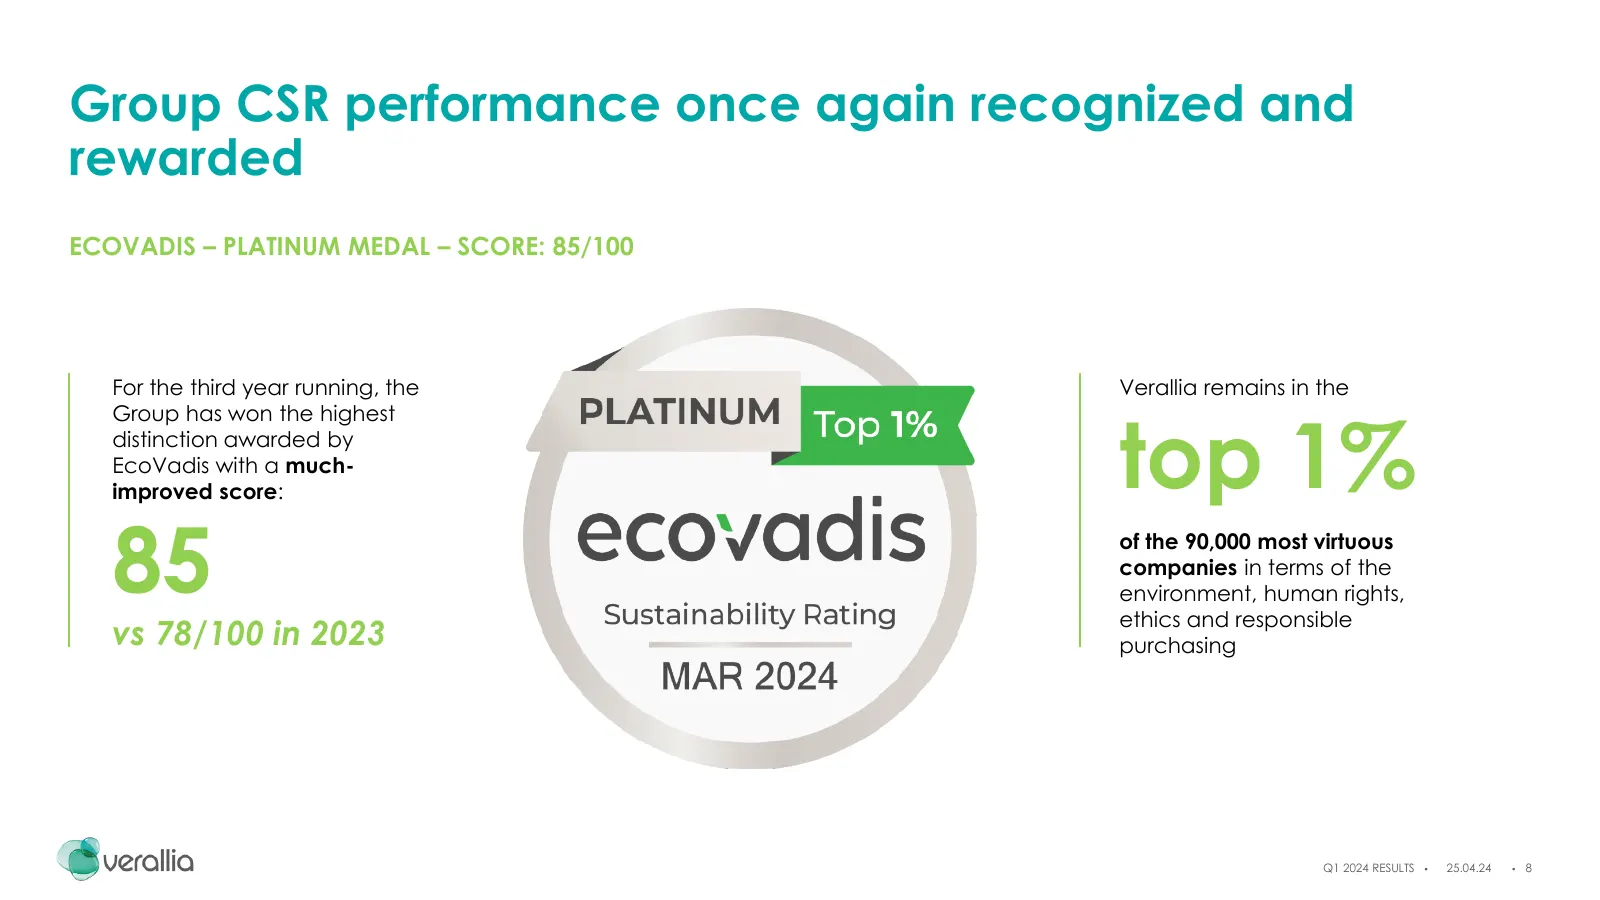
Group CSR performance once again recognized and rewarded ECOVADIS – PLATINUM MEDAL – SCORE: 85/100 For the third year running, the Verallia remains in the top 1% Group has won the highest distinction awarded by EcoVadis with a much- improved score: 85 of the 90,000 most virtuous companies in terms o
Slide 9: Bordelaise Air 300g moves forward
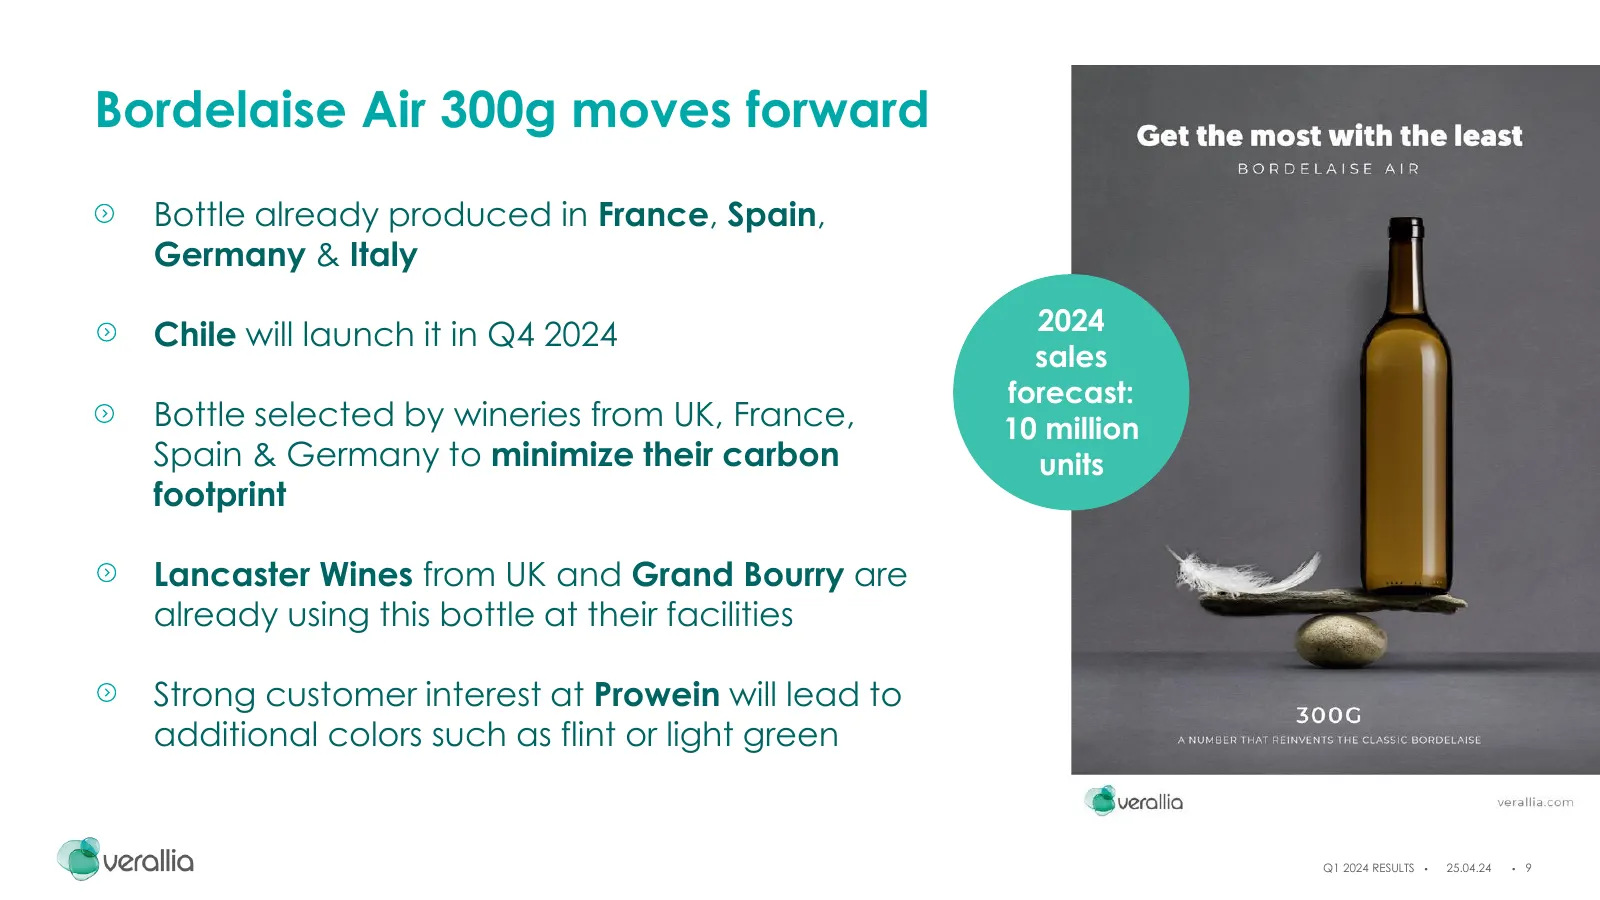
Bordelaise Air 300g moves forward Bottle already produced in France, Spain, Germany & Italy Chile will launch it in Q4 2024 2024 sales forecast: Bottle selected by wineries from UK, France, 10 million Spain & Germany to minimize their carbon units footprint Lancaster Wines from UK and Grand Bourry a
Slide 10: Activity down vs Q1 2023 as expected, gradual recovery in line with outlook
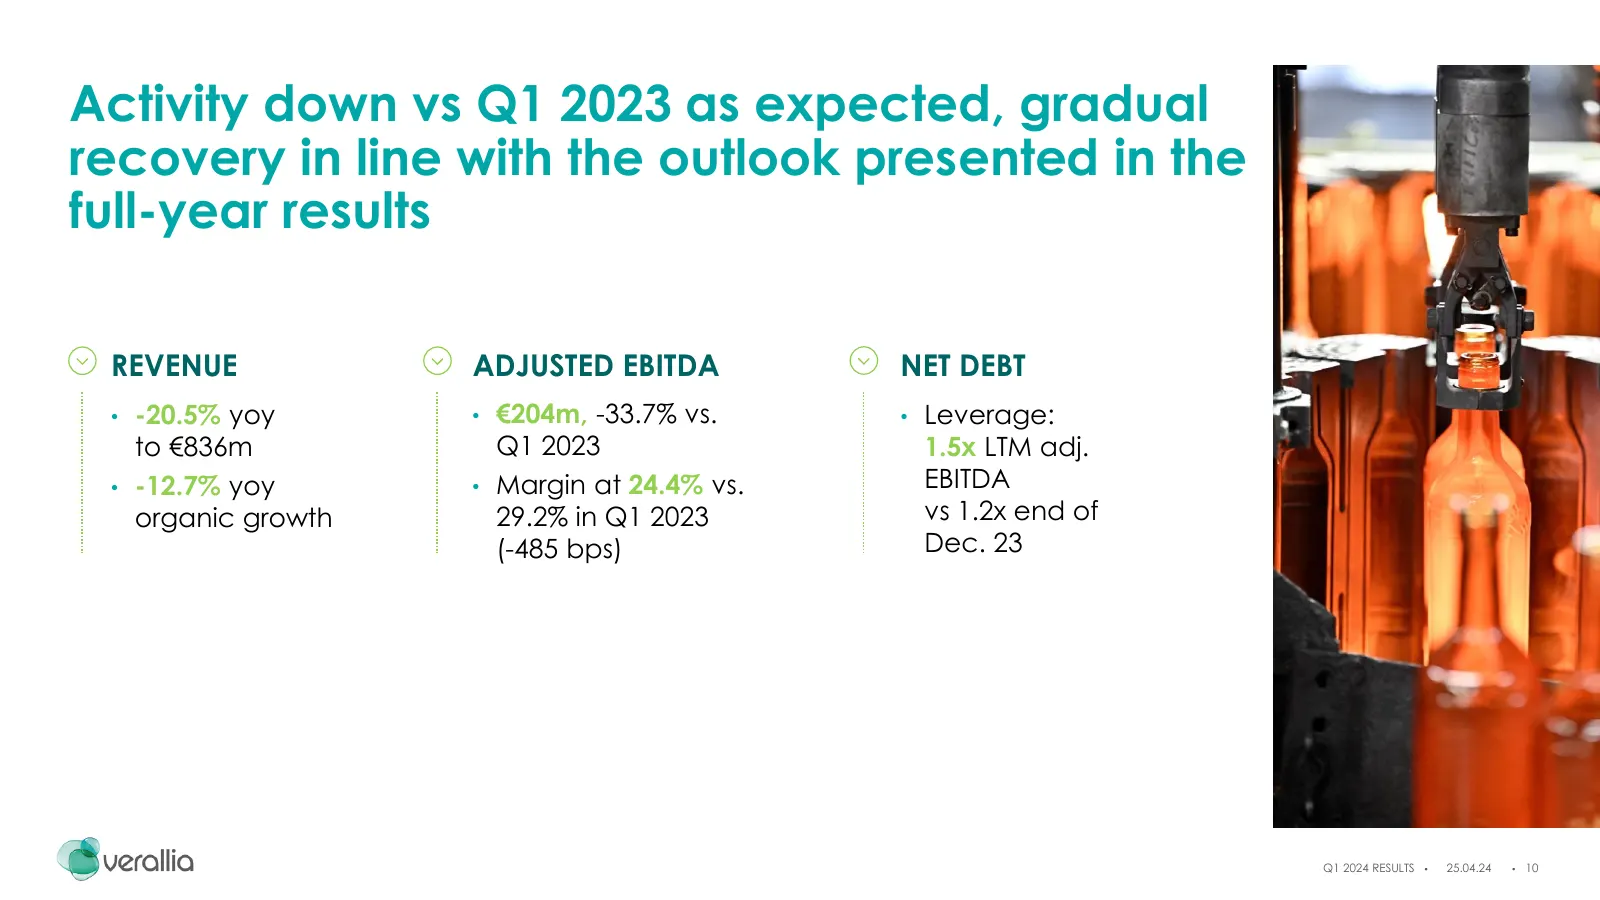
Activity down vs Q1 2023 as expected, gradual recovery in line with the outlook presented in the full-year results REVENUE ADJUSTED EBITDA NET DEBT • -20.5% yoy • €204m, -33.7% vs. • Leverage: to €836m Q1 2023 1.5x LTM adj. • -12.7% yoy • Margin at 24.4% vs. EBITDA organic growth 29.2% in Q1 2023 vs
Slide 11: Q1 2024 Financial Results
Q1 2024 FINANCIAL RESULTS Nathalie DELBREUVE CFO Q1 2024 RESULTS 25.04.24 11
Slide 12: Q1 2024 Consolidated Revenue Variance Analysis
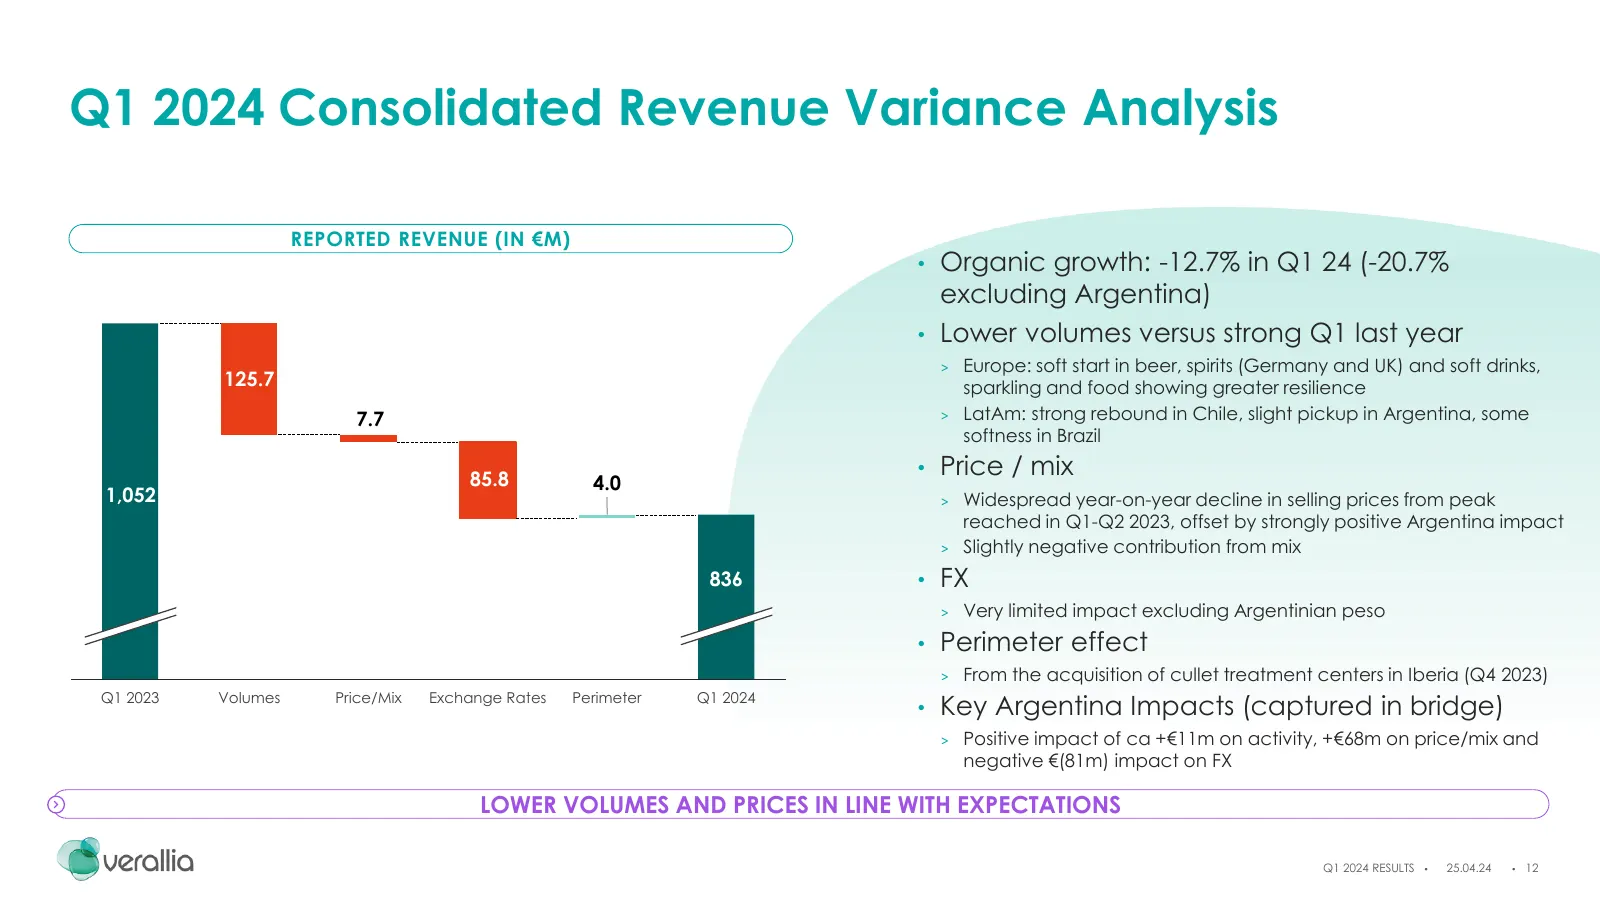
Q1 2024 Consolidated Revenue Variance Analysis REPORTED REVENUE (IN €M) • Organic growth: -12.7% in Q1 24 (-20.7% excluding Argentina) • Lower volumes versus strong Q1 last year > Europe: soft start in beer, spirits (Germany and UK) and soft drinks, 125.7 sparkling and food showing greater resilienc
Slide 13: Q1 2024 Consolidated Adjusted EBITDA Variance Analysis
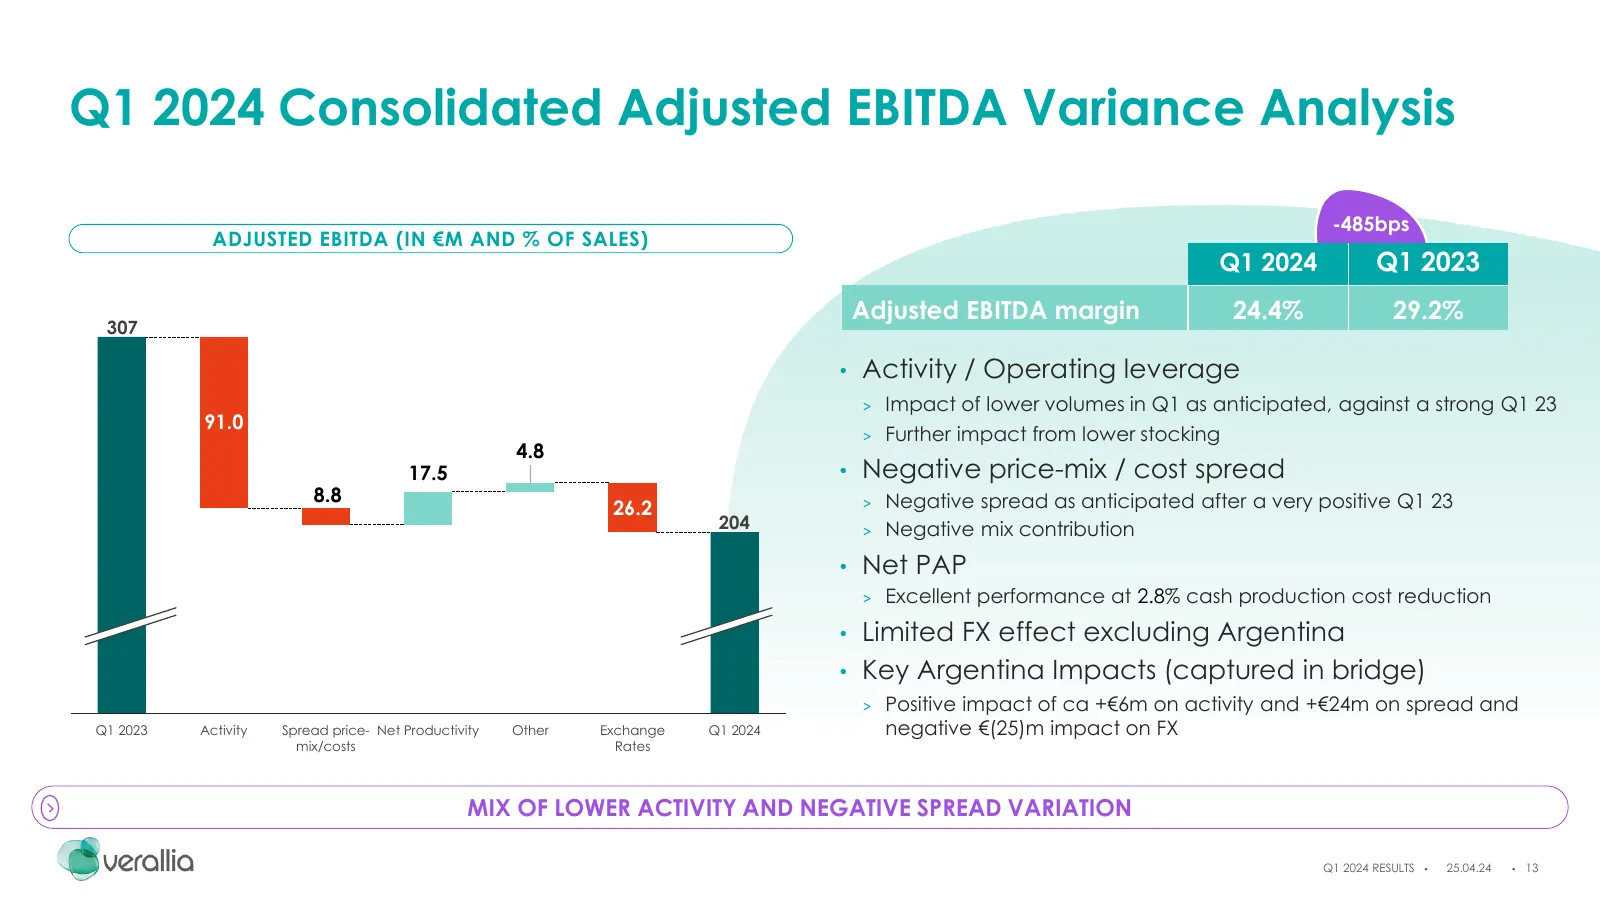
Q1 2024 Consolidated Adjusted EBITDA Variance Analysis -485bps ADJUSTED EBITDA (IN €M AND % OF SALES) Q1 2024 Q1 2023 Adjusted EBITDA margin 24.4% 29.2% 307 • Activity / Operating leverage > Impact of lower volumes in Q1 as anticipated, against a strong Q1 23 91.0 > Further impact from lower stockin
Slide 14: 31 March 2024 Group Net Debt Evolution and Leverage
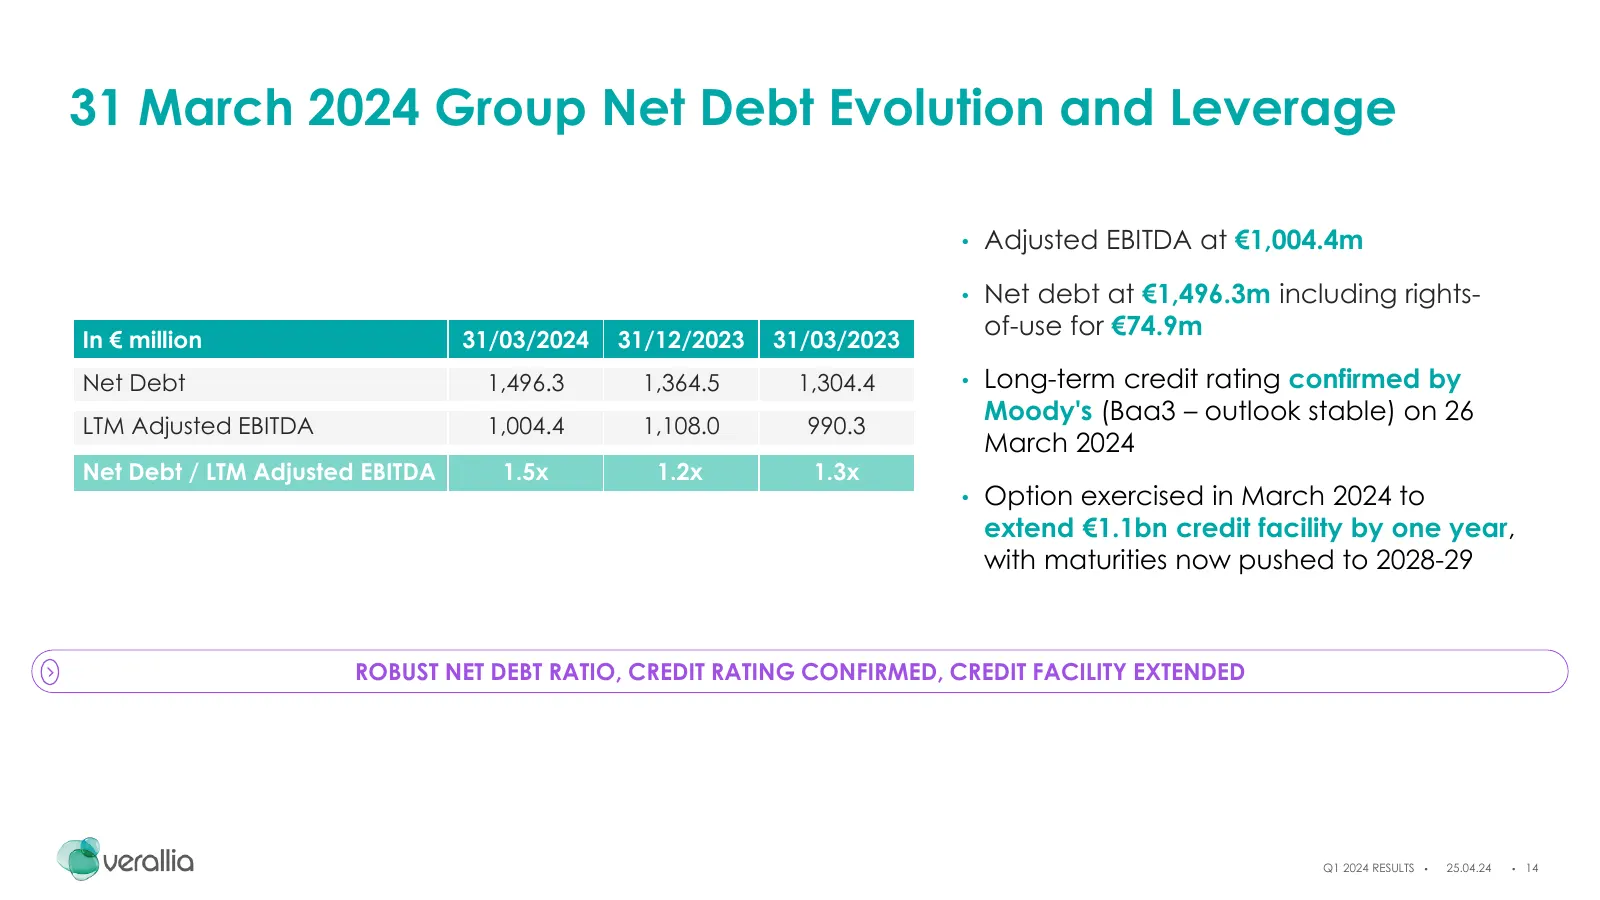
31 March 2024 Group Net Debt Evolution and Leverage • Adjusted EBITDA at €1,004.4m • Net debt at €1,496.3m including rights- In € million 31/03/2024 31/12/2023 31/03/2023 of-use for €74.9m Net Debt 1,496.3 1,364.5 1,304.4 • Long-term credit rating confirmed by Moody's (Baa3 – outlook stable) on 26 L
Slide 15: 31 March 2024 Financial Structure and Liquidity
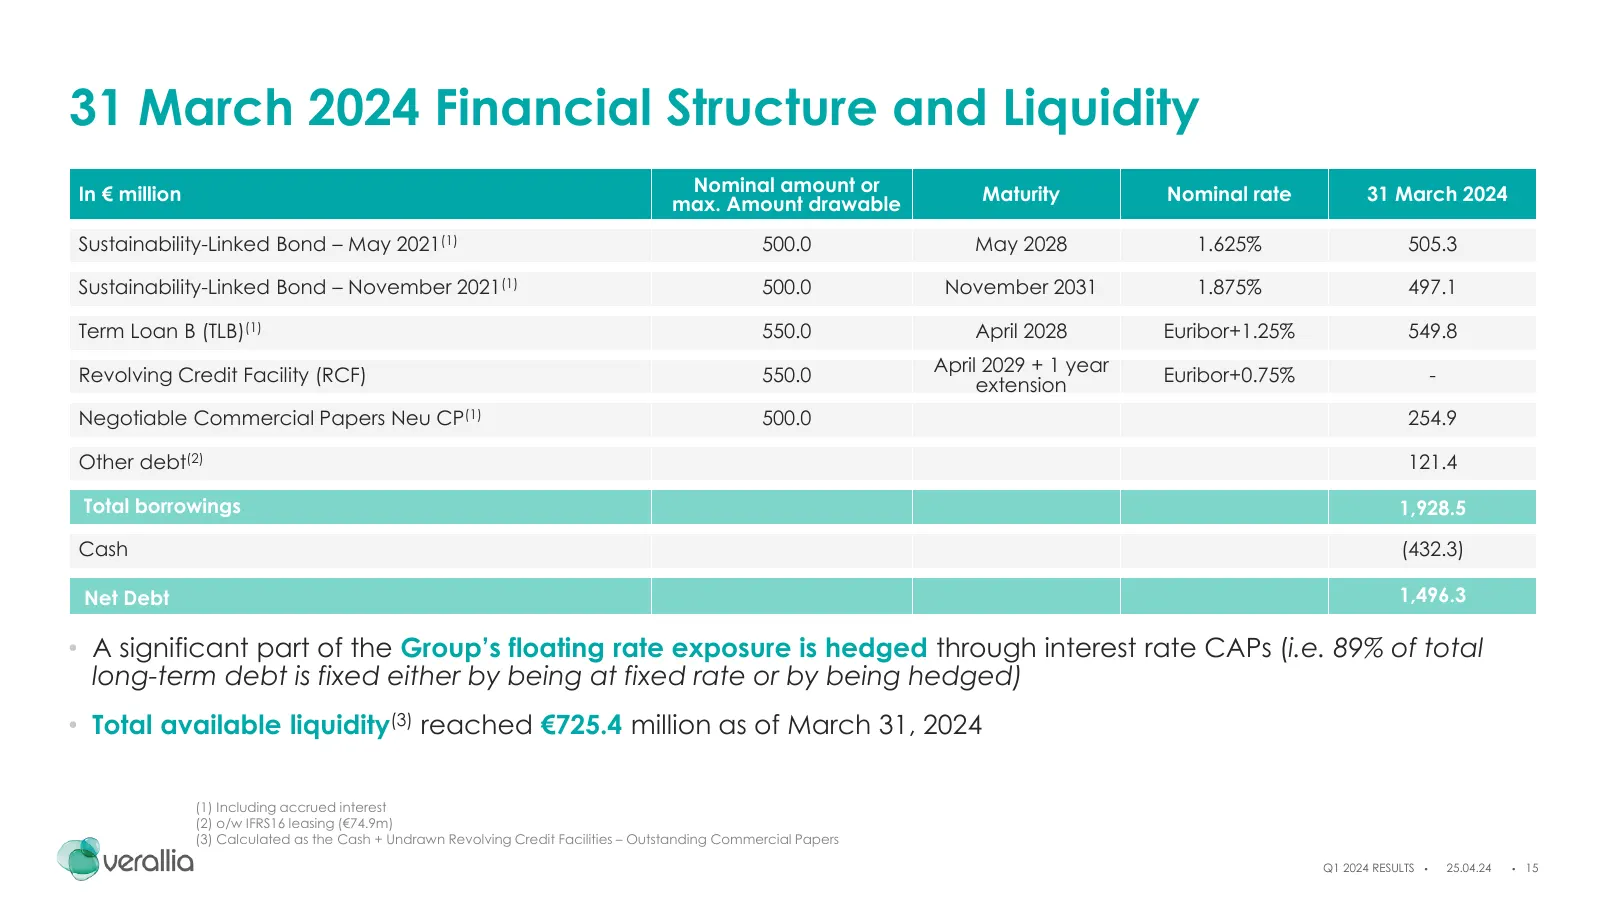
31 March 2024 Financial Structure and Liquidity In € million Nominal amount or Maturity Nominal rate 31 March 2024 max. Amount drawable Sustainability-Linked Bond – May 2021(1) 500.0 May 2028 1.625% 505.3 Sustainability-Linked Bond – November 2021(1) 500.0 November 2031 1.875% 497.1 Term Loan B (TLB

Slide 16: 2024 Guidance
2024 GUIDANCE Patrice LUCAS CEO Q1 2024 RESULTS 25.04.24 16
Slide 17: 2024 Guidance confirmed
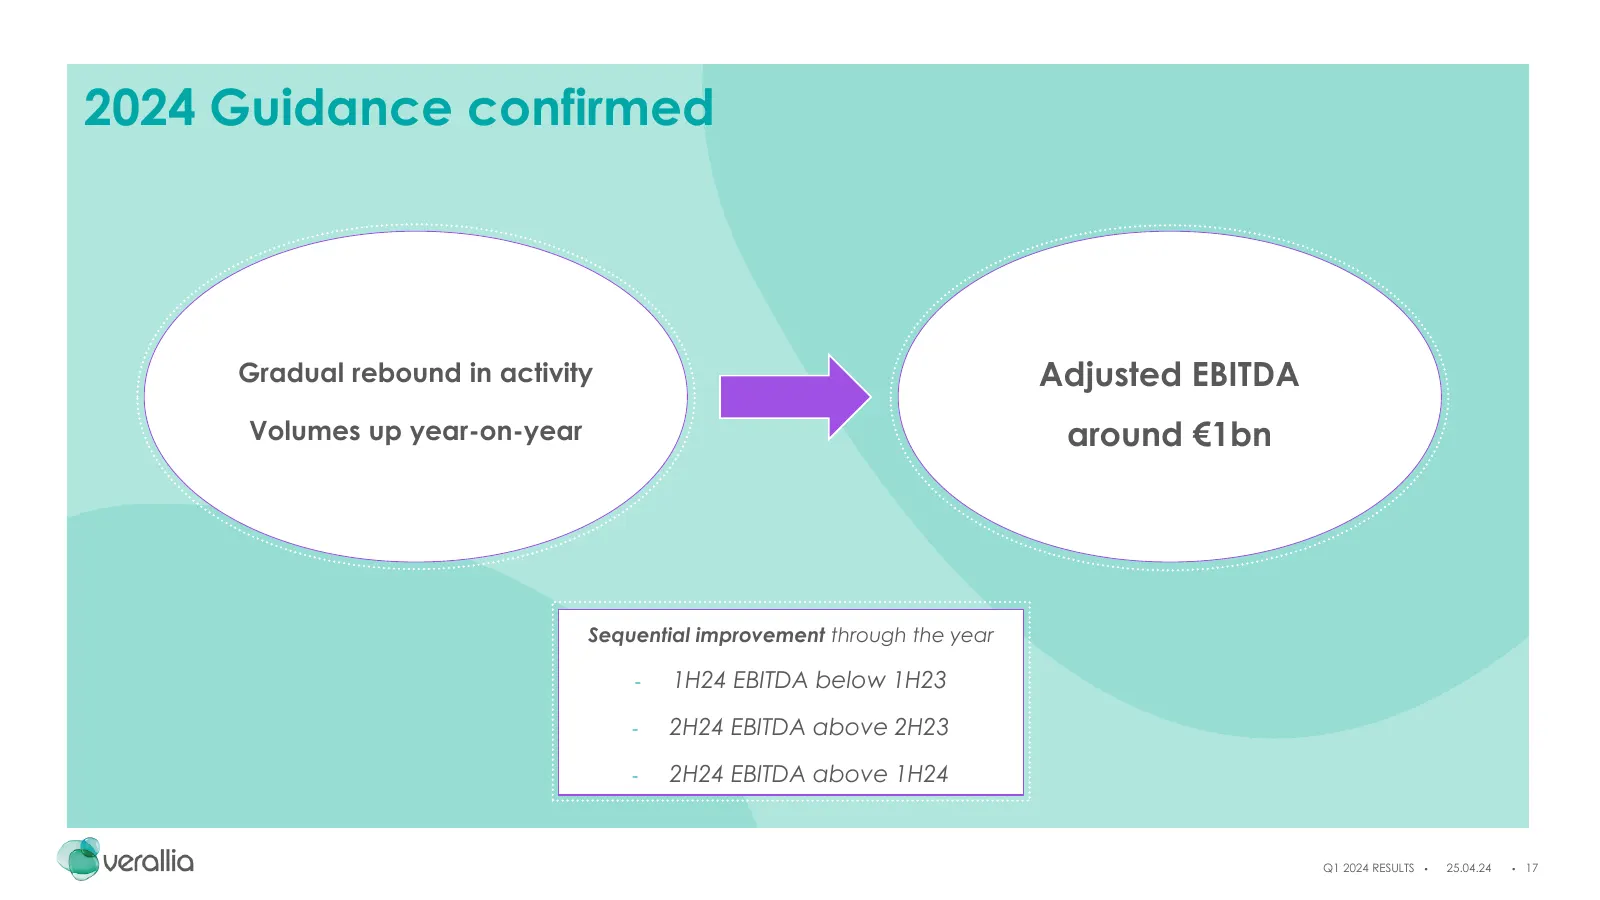
2024 Guidance confirmed Gradual rebound in activity Adjusted EBITDA Volumes up year-on-year around €1bn Sequential improvement through the year - 1H24 EBITDA below 1H23 - 2H24 EBITDA above 2H23 - 2H24 EBITDA above 1H24 Q1 2024 RESULTS 25.04.24 17
Slide 18: Q&A
Q&A Q1 2024 RESULTS 25.04.24 18

Slide 19: Appendices
APPENDICES Q1 2024 RESULTS 25.04.24 19
Slide 20: Circularity is core to our model
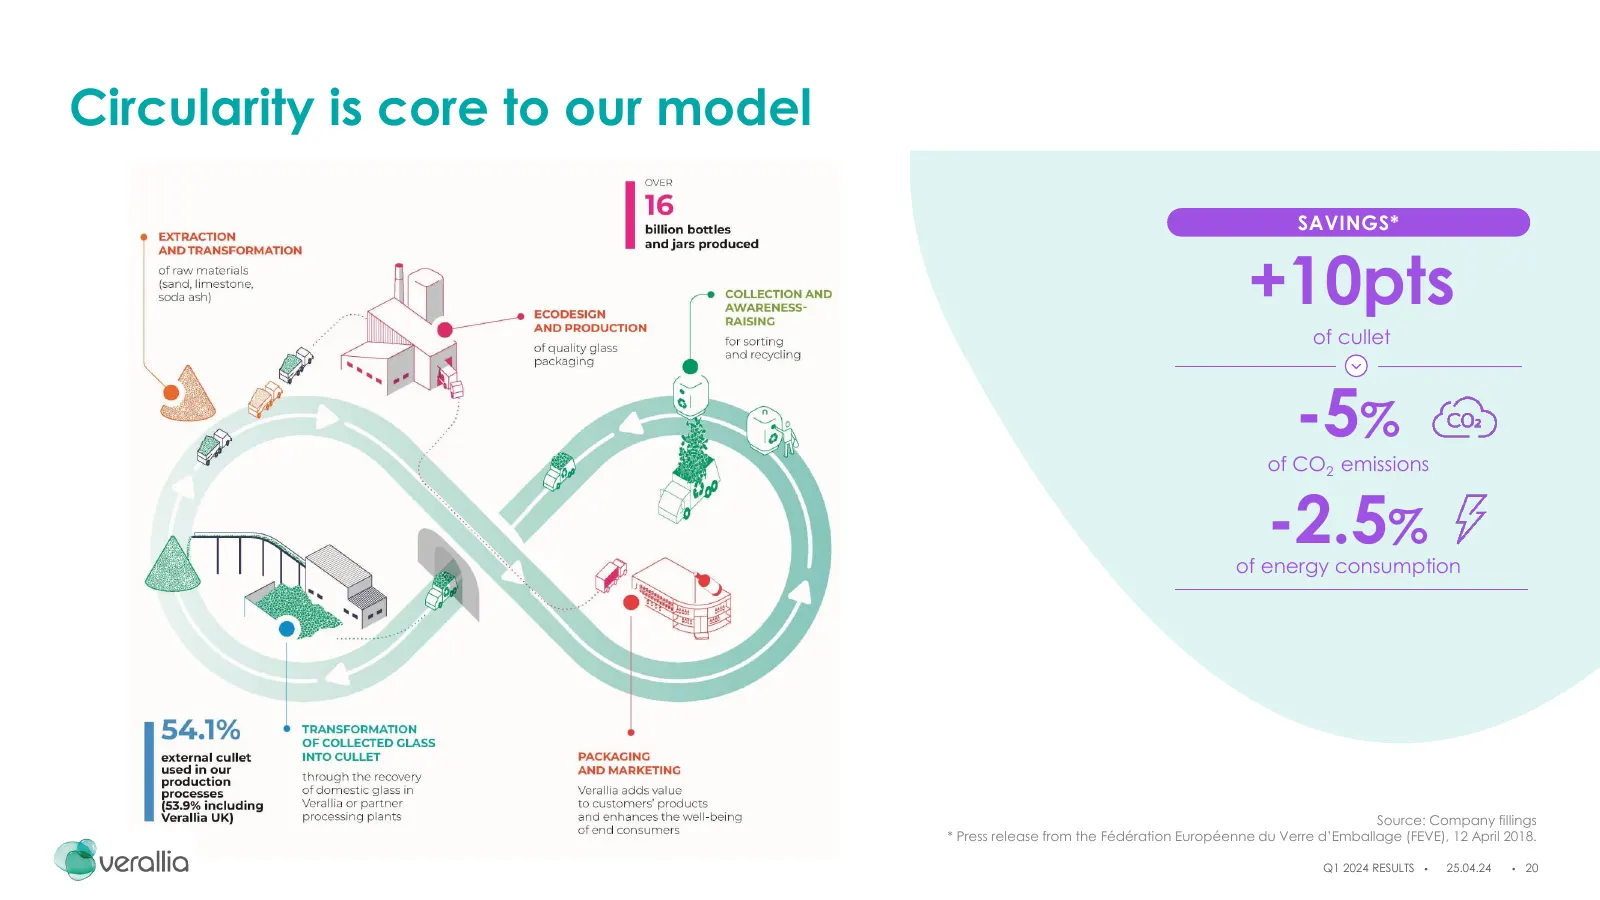
Circularity is core to our model SAVINGS* +10pts of cullet -5% of CO2 emissions -2.5% of energy consumption Source: Company fillings * Press release from the Fédération Européenne du Verre d’Emballage (FEVE), 12 April 2018. Q1 2024 RESULTS 25.04.24 20
Slide 21: Disciplined and dynamic risk hedging policy
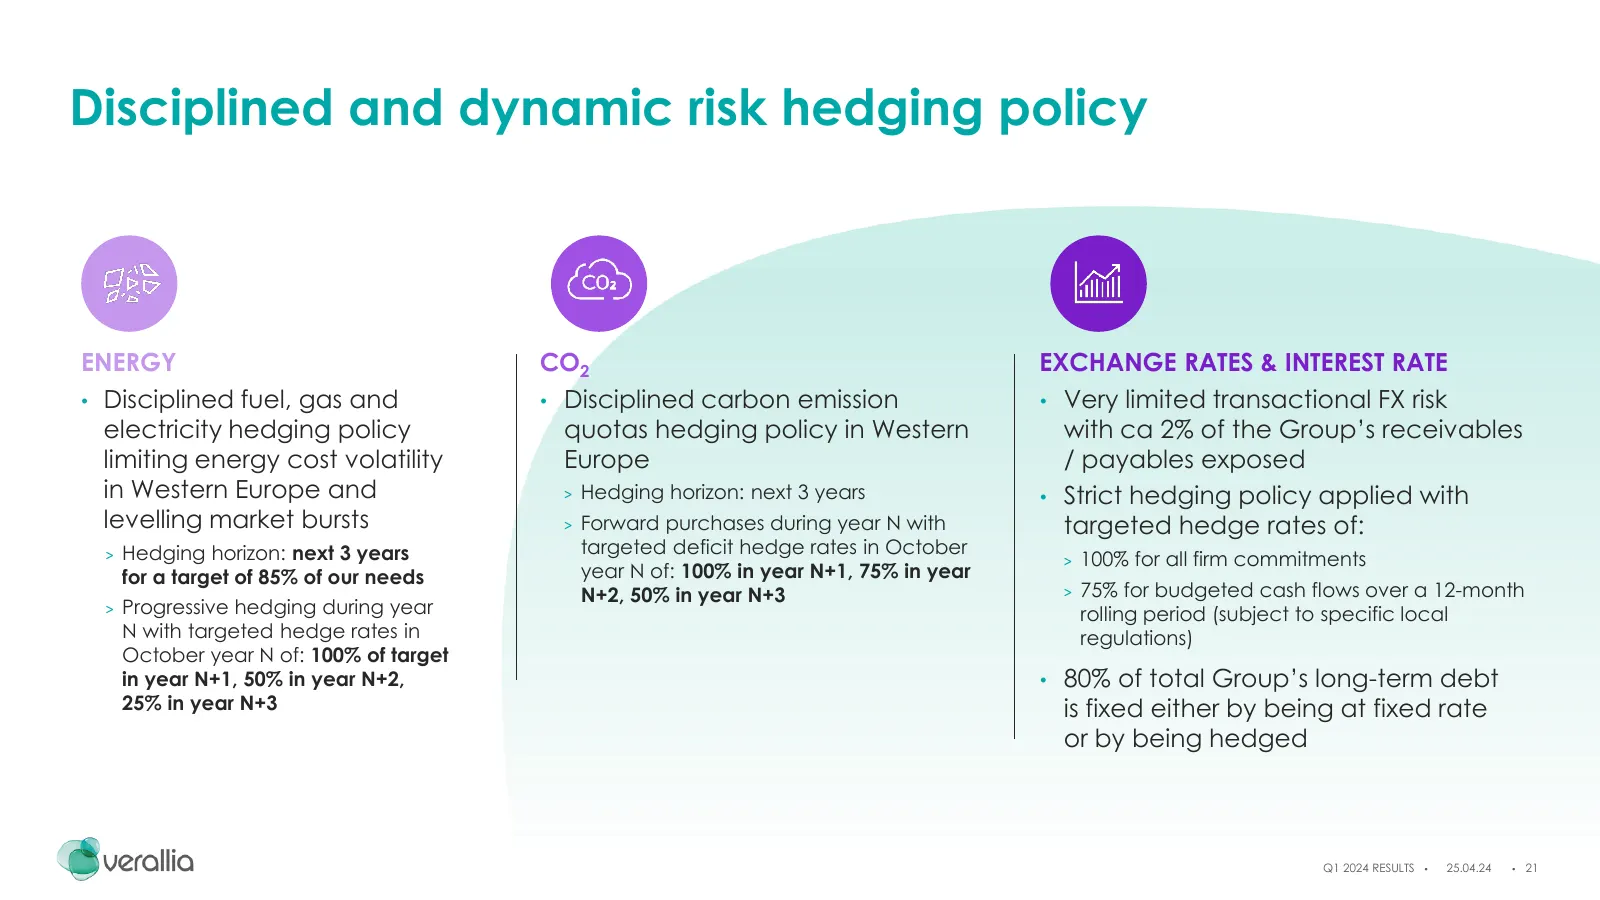
Disciplined and dynamic risk hedging policy ENERGY CO2 EXCHANGE RATES & INTEREST RATE • Disciplined fuel, gas and • Disciplined carbon emission • Very limited transactional FX risk electricity hedging policy quotas hedging policy in Western with ca 2% of the Group’s receivables limiting energy cost
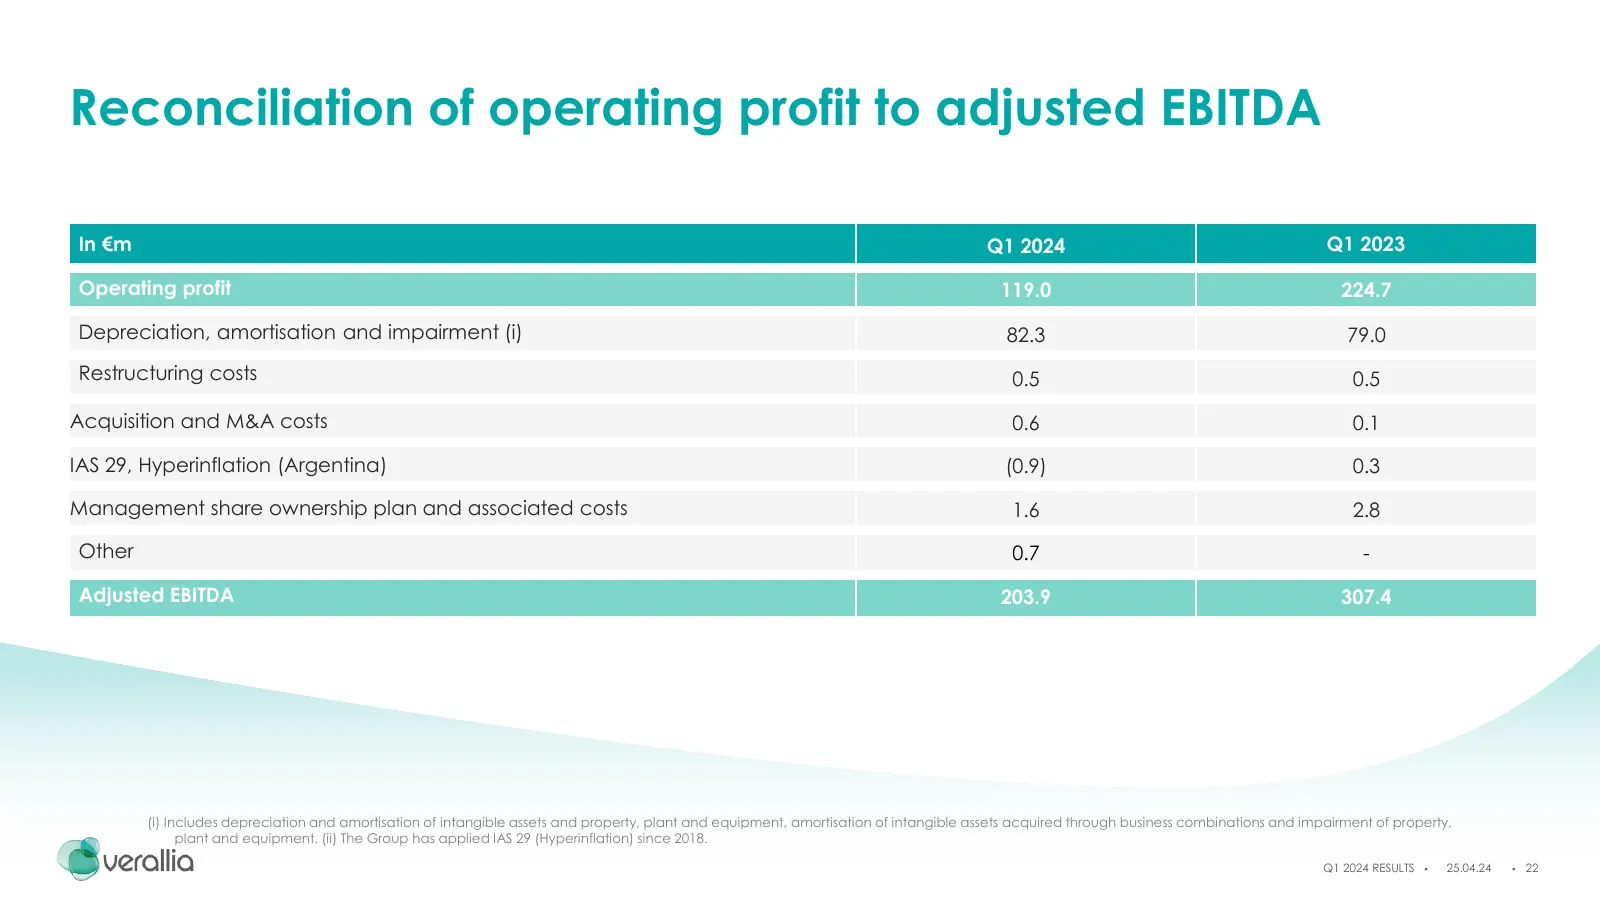
Slide 22: Reconciliation of operating profit to adjusted EBITDA
Reconciliation of operating profit to adjusted EBITDA In €m Q1 2024 Q1 2023 Operating profit 119.0 224.7 Depreciation, amortisation and impairment (i) 82.3 79.0 Restructuring costs 0.5 0.5 Acquisition and M&A costs 0.6 0.1 IAS 29, Hyperinflation (Argentina) (0.9) 0.3 Management share ownership plan
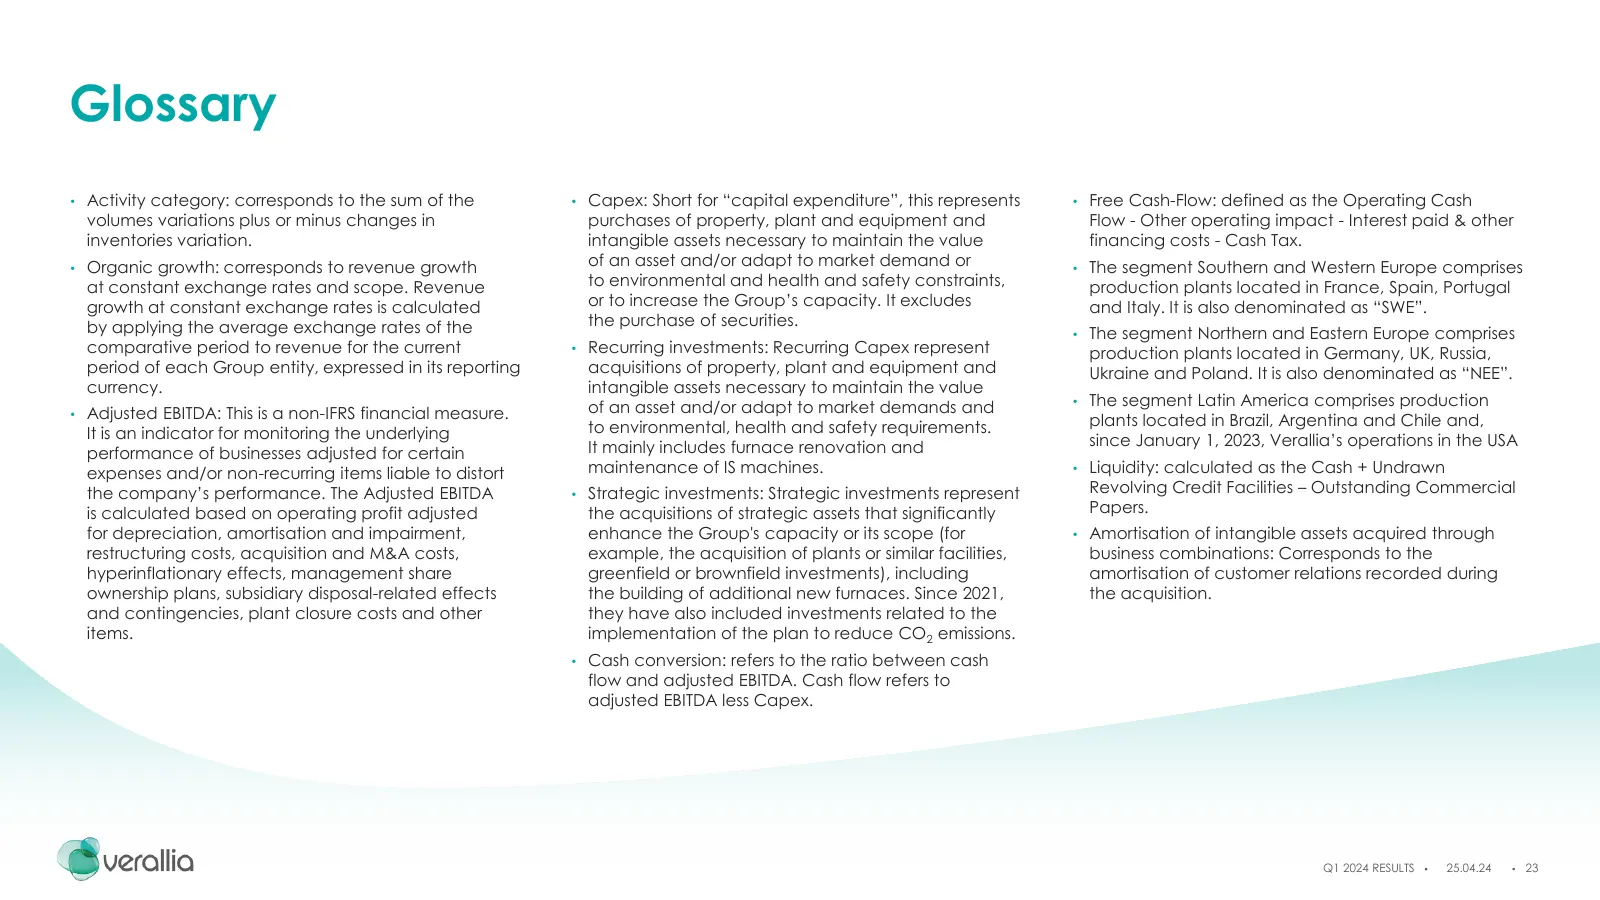
Slide 23: Glossary
Glossary • Activity category: corresponds to the sum of the • Capex: Short for “capital expenditure”, this represents • Free Cash-Flow: defined as the Operating Cash volumes variations plus or minus changes in purchases of property, plant and equipment and Flow - Other operating impact - Interest pa
Slide 24: Disclaimer
Disclaimer Certain information included in this presentation are not historical facts but are forward-looking statements. These forward-looking statements are based on current beliefs, expectations and assumptions, including, without limitation, assumptions regarding Verallia's present and future bu

Slide 25: Thank you
Thank you
Source: Internet Archive copy of verallia.com
More decks from Verallia SAS
 Verallia — Investor Day (November 2026)66 slides · Nov 18, 2026
 Verallia — Q3 2026 Earnings Presentation21 slides · Oct 28, 2026
 Q1 2026 Earnings Presentation19 slides · Apr 23, 2026
 FY 2025 Earnings Presentation33 slides · Feb 25, 2026
 Q3 2025 Earnings Presentation26 slides · Oct 23, 2025
 H1 2025 Earnings Presentation35 slides · Jul 30, 2025