Atlas Financial — Q1 2017 Earnings Presentation
25 slides from Atlas Financial's earnings presentation, May 9, 2017

Slide 1: 2017 First Quarter Conference Call
2017 First Quarter Conference Call May 9, 2017 Nasdaq: AFH
Slide 2: Forward-Looking Statements
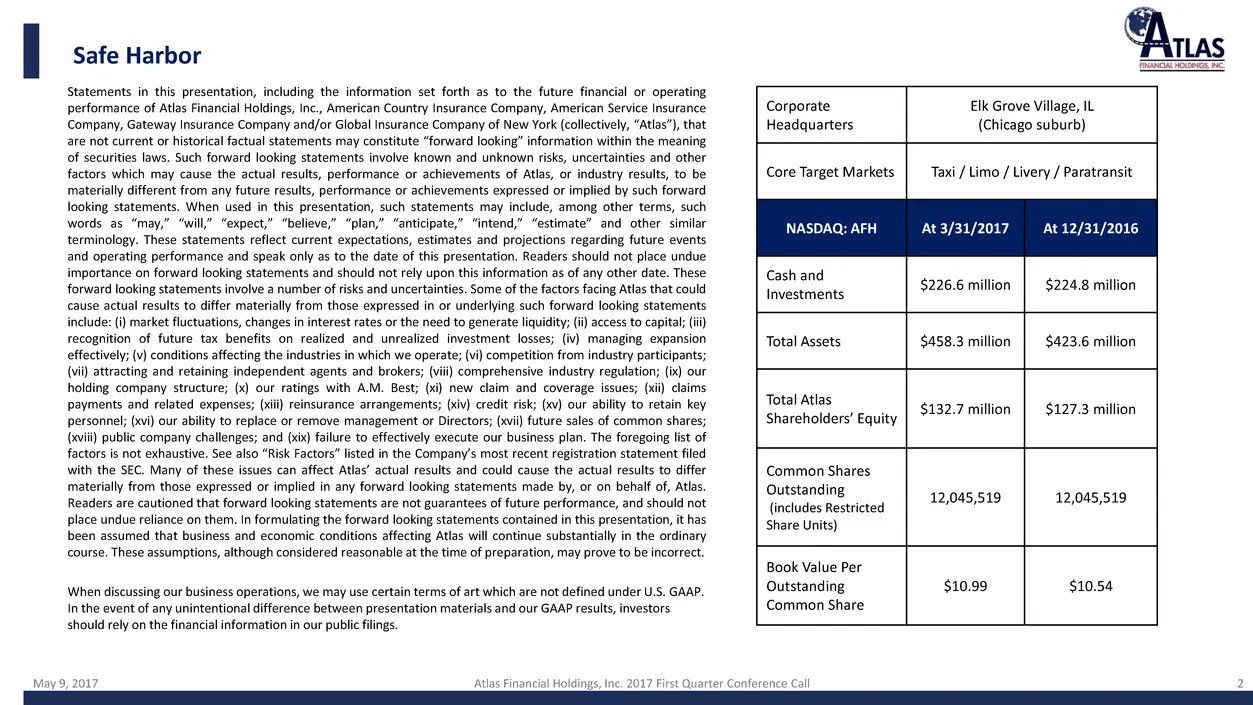
May 9, 2017 Atlas Financial Holdings, Inc. 2017 First Quarter Conference Call 2 Statements in this presentation, including the information set forth as to the future financial or operating performance of Atlas Financial Holdings, Inc., American Country Insurance Company, American Service Insurance C
Slide 3: 2017 Q1 Financial and Underwriting Results
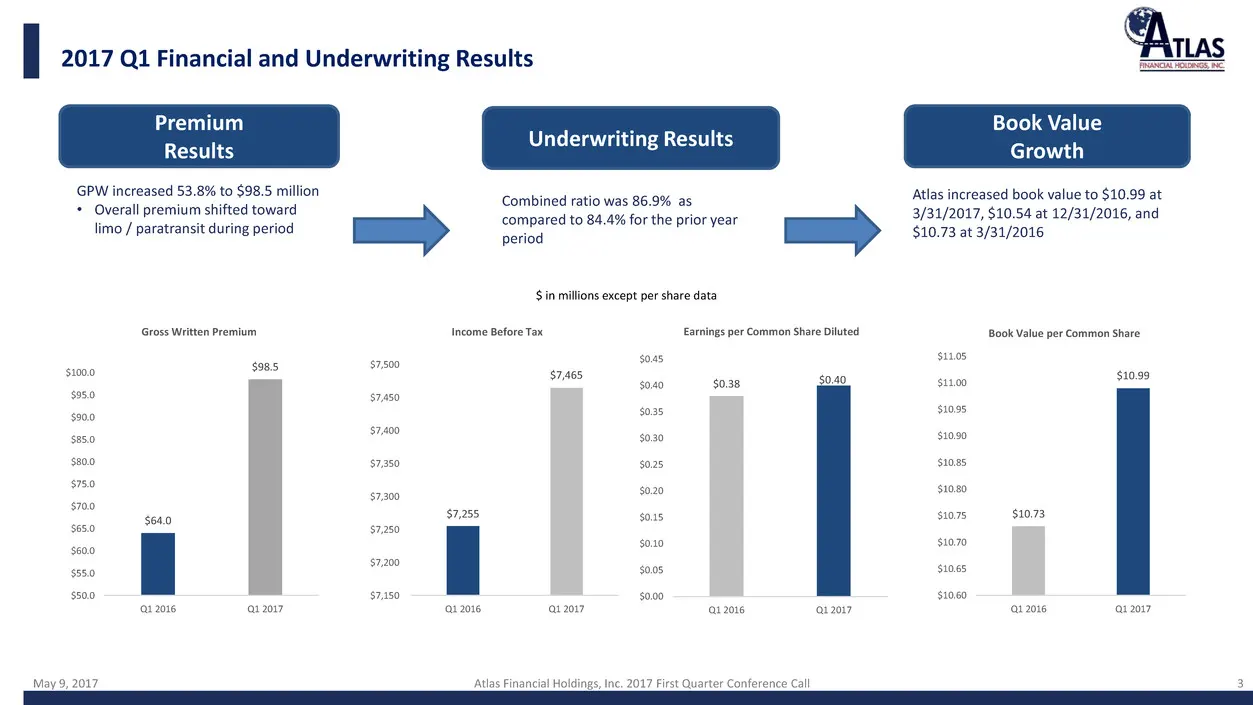
May 9, 2017 Atlas Financial Holdings, Inc. 2017 First Quarter Conference Call 3 3 2017 Q1 Financial and Underwriting Results $64.0 $98.5 $50.0 $55.0 $60.0 $65.0 $70.0 $75.0 $80.0 $85.0 $90.0 $95.0 $100.0 Q1 2016 Q1 2017 Gross Written Premium $7,255 $7,465 $7,150 $7,200 $7,250 $7,300 $7,350 $7,400 $7
Slide 4: Geographic Diversification
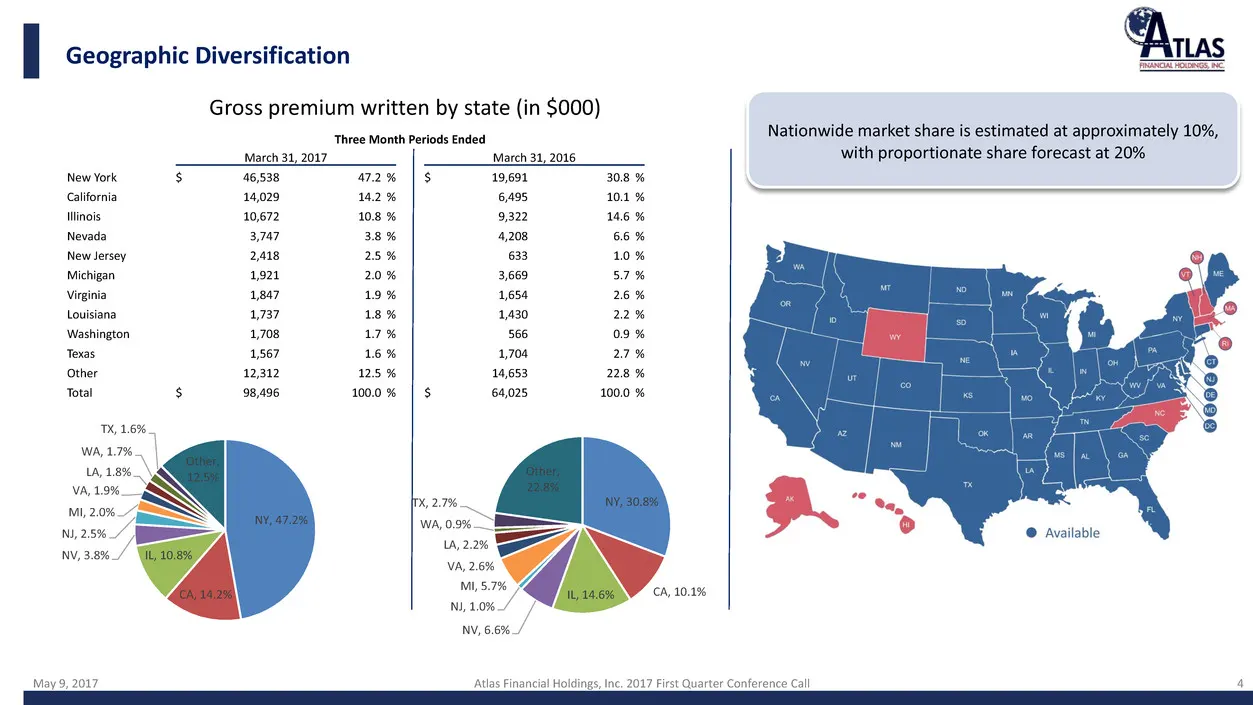
May 9, 2017 Atlas Financial Holdings, Inc. 2017 First Quarter Conference Call 4 Geographic Diversification 4 4 NY, 47.2% CA, 14.2% IL, 10.8% NV, 3.8% NJ, 2.5% MI, 2.0% VA, 1.9% LA, 1.8% WA, 1.7% TX, 1.6% Other, 12.5% NY, 30.8% CA, 10.1% IL, 14.6% NV, 6.6% NJ, 1.0% MI, 5.7% VA, 2.6% LA, 2.2% WA, 0.9%
Slide 5: Business Mix Analysis
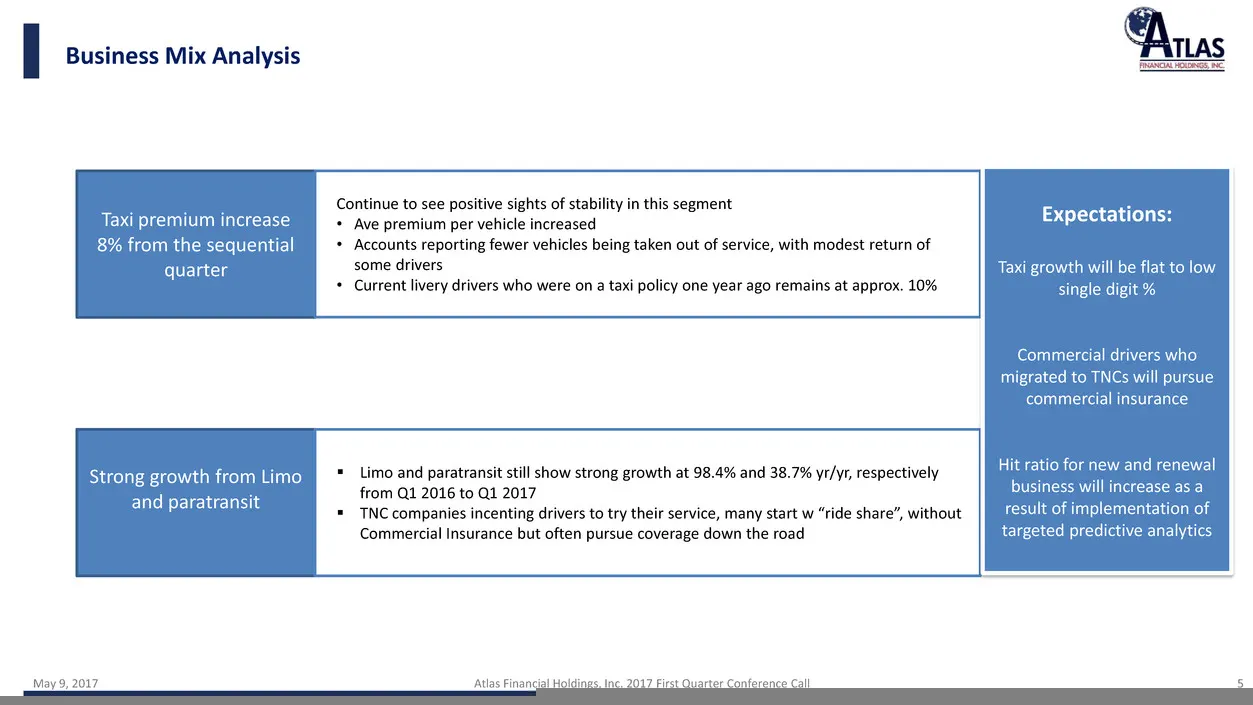
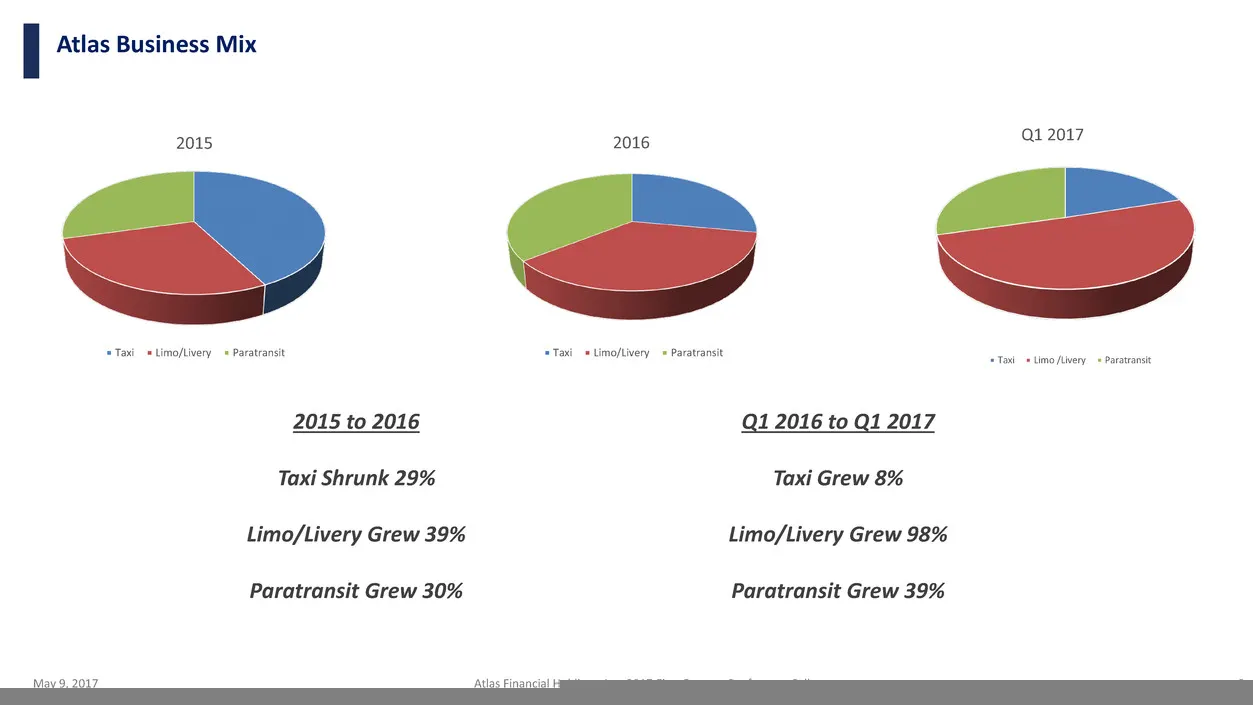
May 9, 2017 Atlas Financial Holdings, Inc. 2017 First Quarter Conference Call 5 Business Mix Analysis Taxi premium increase 8% from the sequential quarter Continue to see positive sights of stability in this segment • Ave premium per vehicle increased • Accounts reporting fewer vehicles being taken
Slide 6: Atlas Business Mix
May 9, 2017 Atlas Financial Holdings, Inc. 2017 First Quarter Conference Call 6 2015 Taxi Limo/Livery Paratransit 2016 Taxi Limo/Livery Paratransit 2015 to 2016 Taxi Shrunk 29% Limo/Livery Grew 39% Paratransit Grew 30% Atlas Business Mix Q1 2016 to Q1 2017 Taxi Grew 8% Limo/Livery Grew 98% Paratrans
Slide 7: Commercial Auto Insurance Competitive Landscape
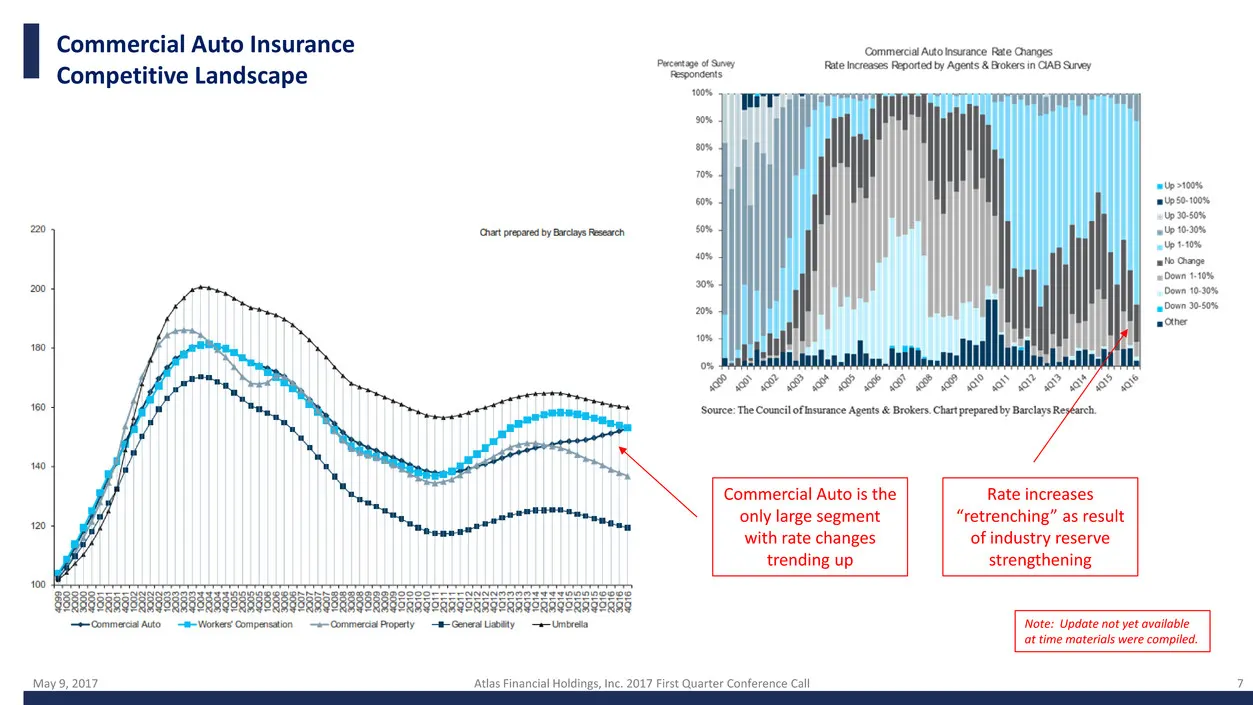
May 9, 2017 Atlas Financial Holdings, Inc. 2017 First Quarter Conference Call 7 Commercial Auto Insurance Competitive Landscape Rate increases “retrenching” as result of industry reserve strengthening Commercial Auto is the only large segment with rate changes trending up Note: Update not yet availa
Slide 8: Written Premium: In-force
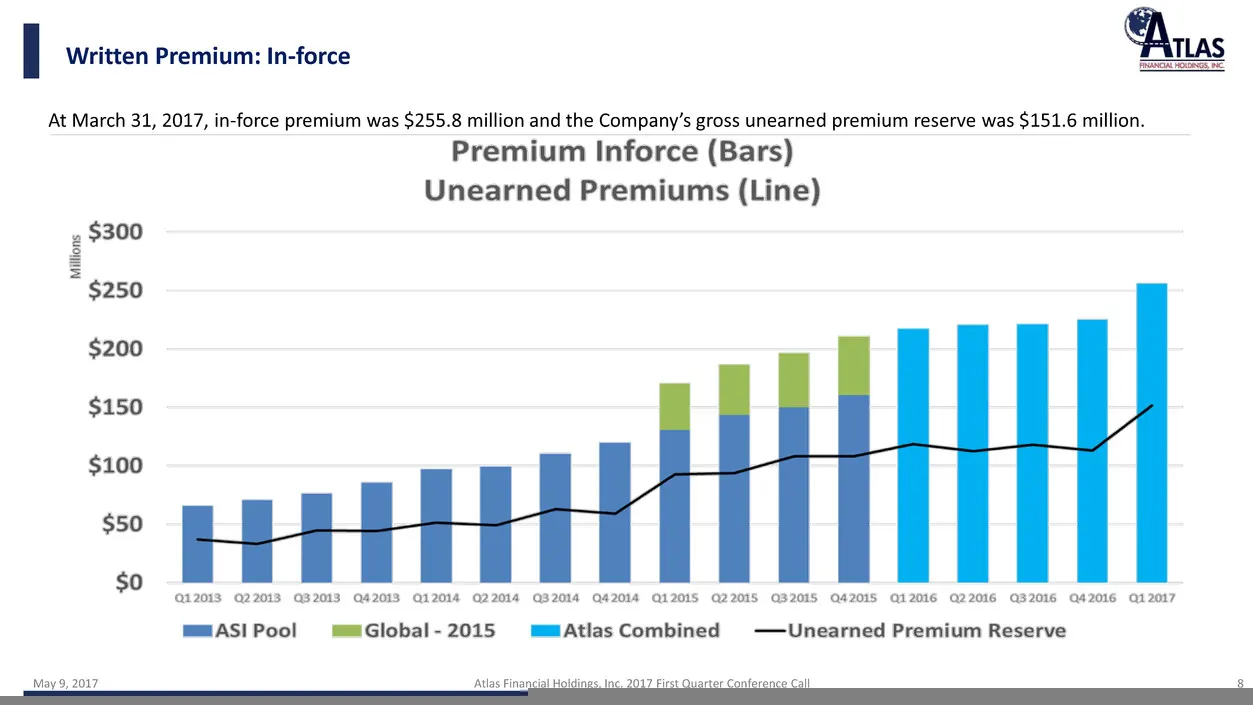
May 9, 2017 Atlas Financial Holdings, Inc. 2017 First Quarter Conference Call 8 Written Premium: In-force 8 At March 31, 2017, in-force premium was $255.8 million and the Company’s gross unearned premium reserve was $151.6 million.
Slide 9: Michigan
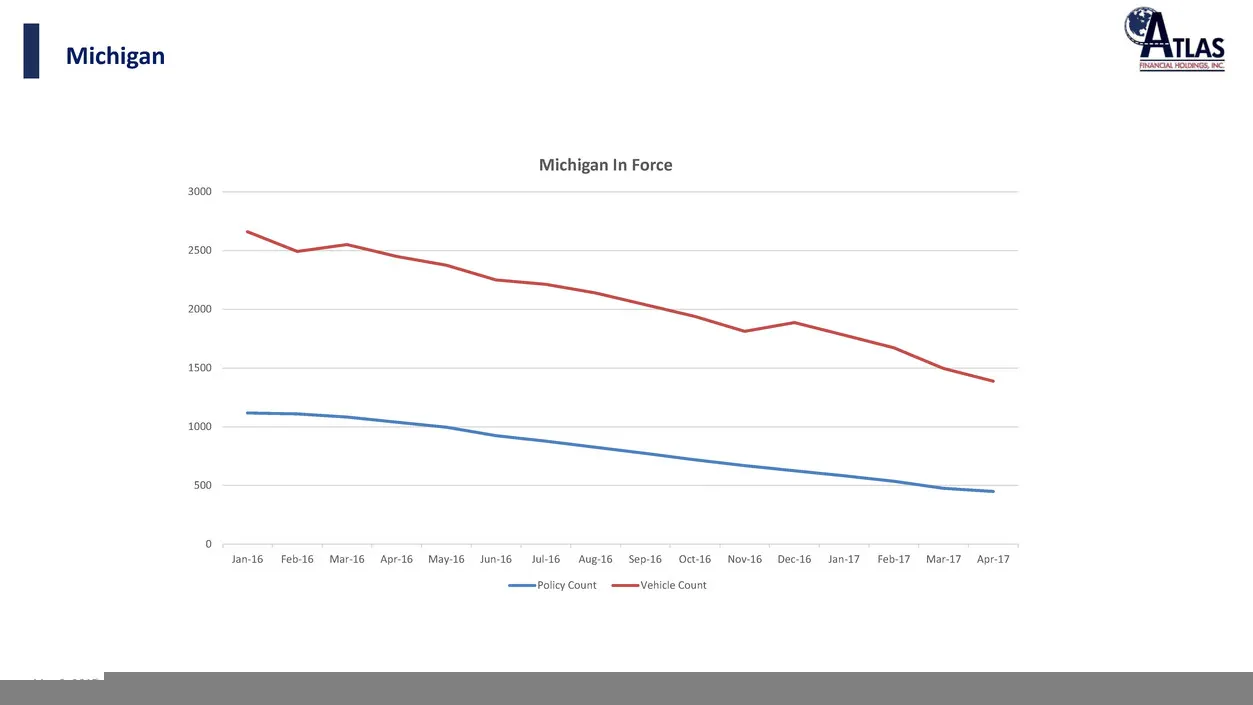
May 9, 2017 Atlas Financial Holdings, Inc. 2017 First Quarter Conference Call 9 Michigan 9 0 500 1000 1500 2000 2500 3000 Jan-16 Feb-16 Mar-16 Apr-16 May-16 Jun-16 Jul-16 Aug-16 Sep-16 Oct-16 Nov-16 Dec-16 Jan-17 Feb-17 Mar-17 Apr-17 Michigan In Force Policy Count Vehicle Count
Slide 10: Atlas 2017 Initiatives
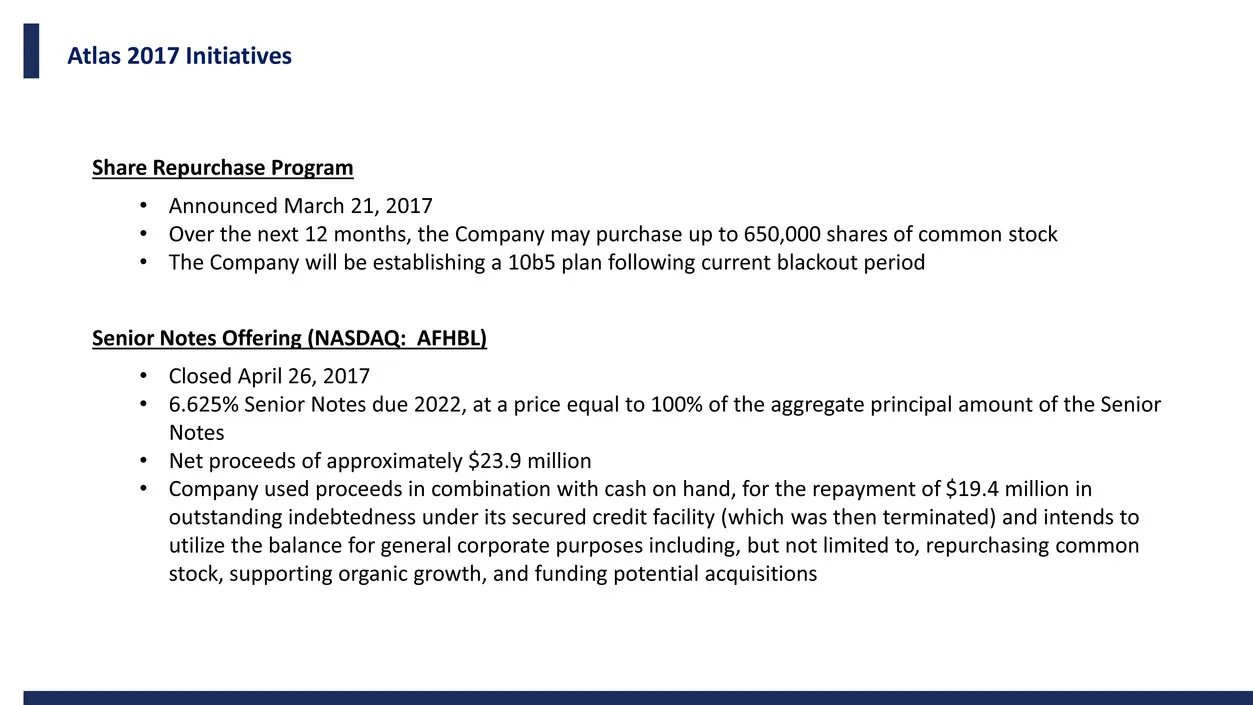
Atlas 2017 Initiatives Share Repurchase Program • Announced March 21, 2017 • Over the next 12 months, the Company may purchase up to 650,000 shares of common stock • The Company will be establishing a 10b5 plan following current blackout period Senior Notes Offering (NASDAQ: AFHBL) • Closed April 26

Slide 11: Financial Highlights
Financial Highlights TLAS FINANCIAL HOLDINGS, INC.
Slide 12: Operating Leverage
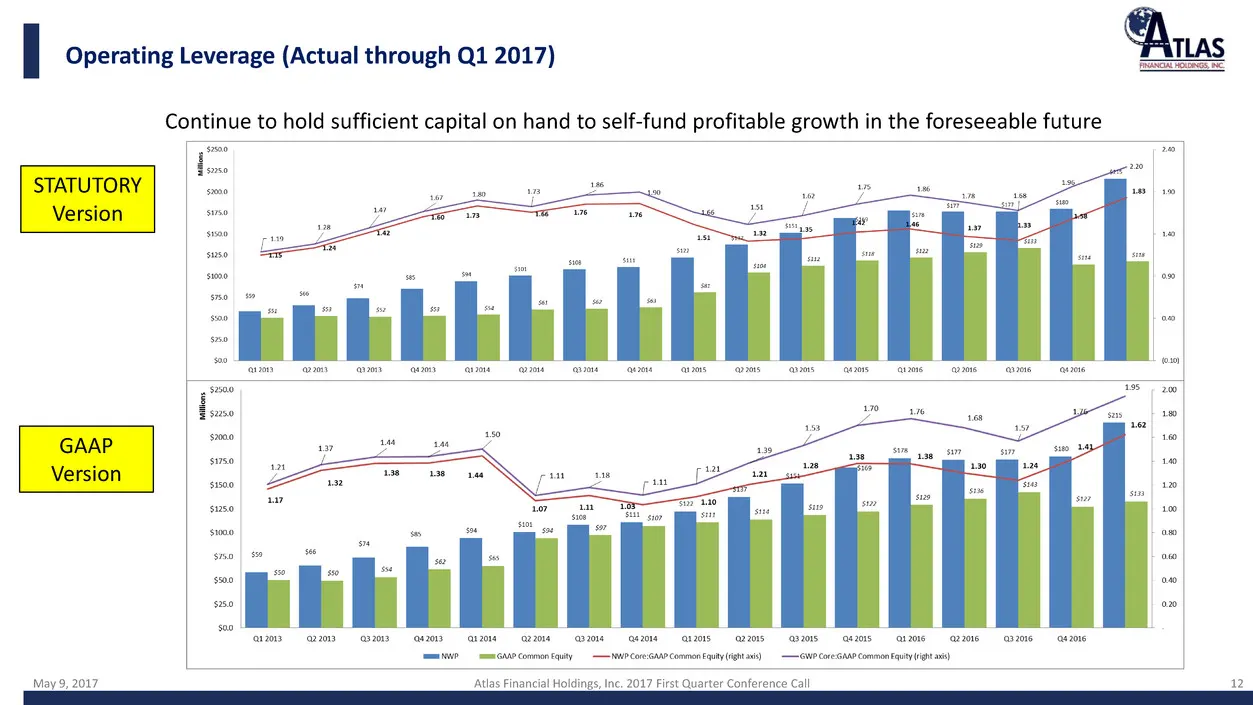
May 9, 2017 Atlas Financial Holdings, Inc. 2017 First Quarter Conference Call 12 Operating Leverage (Actual through Q1 2017) STATUTORY Version GAAP Version Continue to hold sufficient capital on hand to self-fund profitable growth in the foreseeable future
Slide 13: Combined Ratio Analysis
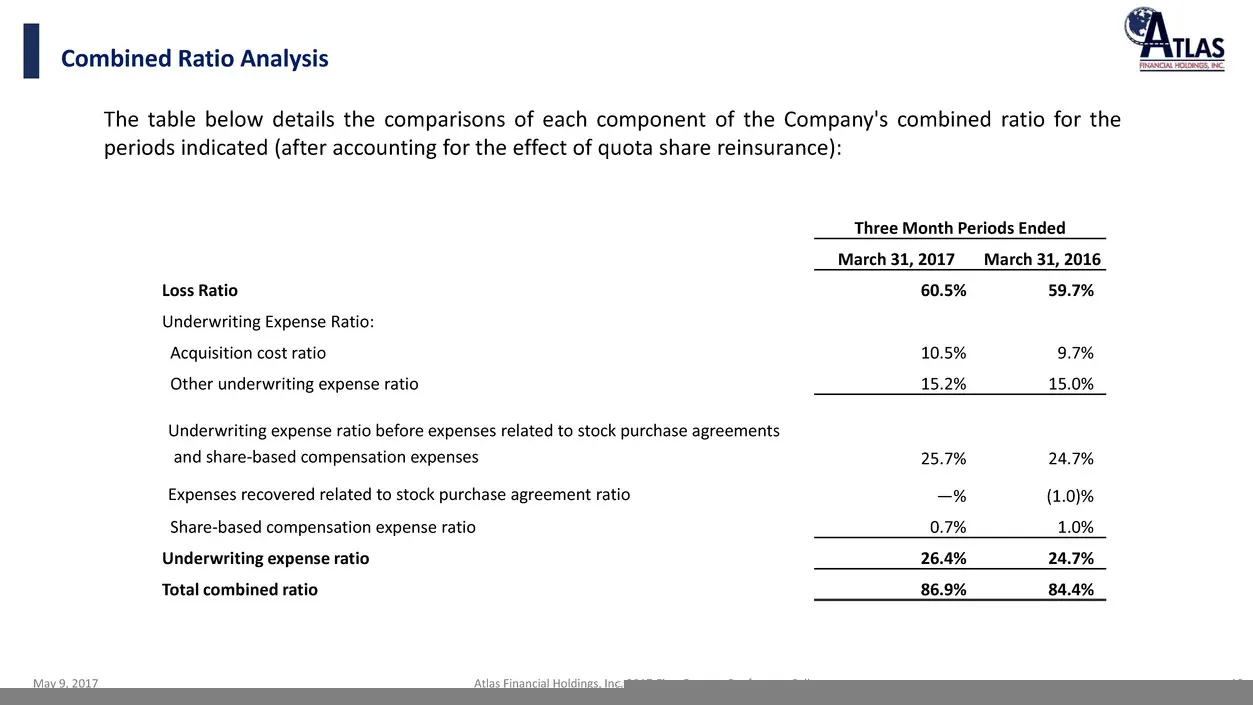
May 9, 2017 Atlas Financial Holdings, Inc. 2017 First Quarter Conference Call 13 Combined Ratio Analysis The table below details the comparisons of each component of the Company's combined ratio for the periods indicated (after accounting for the effect of quota share reinsurance): Three Month Perio
Slide 14: Consistent Quarterly Year/Year Margin Improvement Since 2013 U.S. IPO
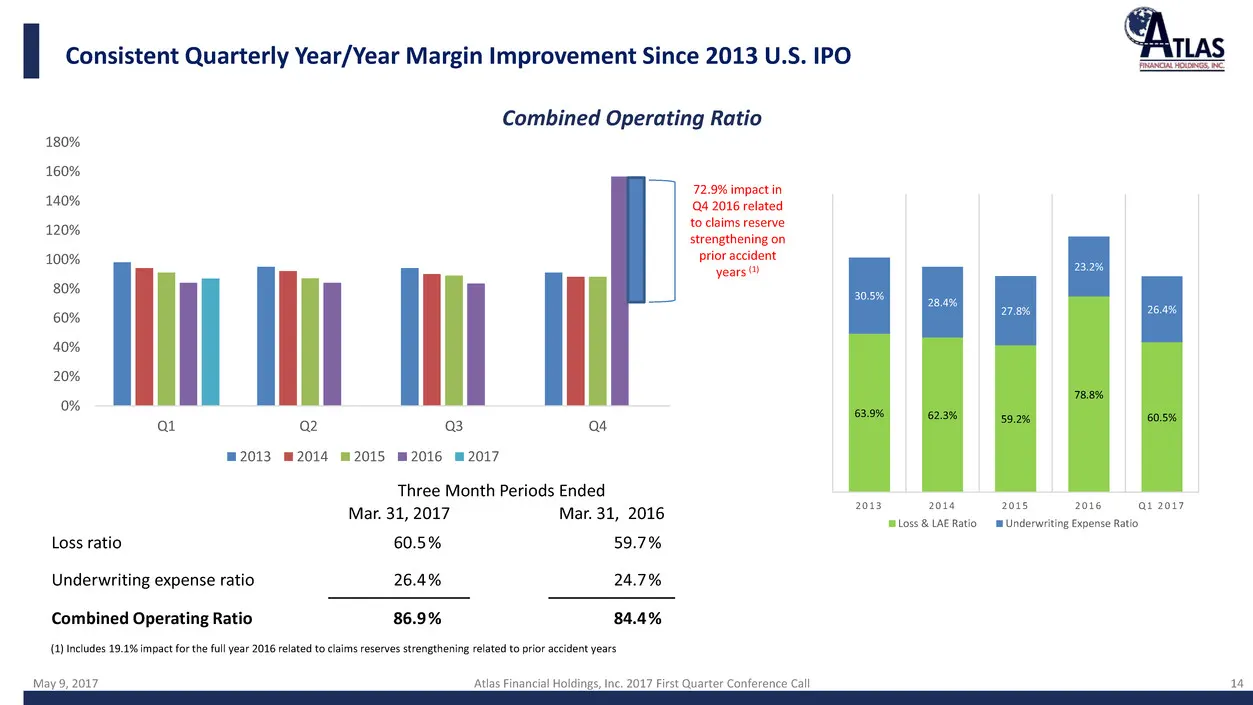
May 9, 2017 Atlas Financial Holdings, Inc. 2017 First Quarter Conference Call 14 Consistent Quarterly Year/Year Margin Improvement Since 2013 U.S. IPO 14 Combined Operating Ratio 63.9% 62.3% 59.2% 78.8% 60.5% 30.5% 28.4% 27.8% 23.2% 26.4% 2 0 1 3 2 0 1 4 2 0 1 5 2 0 1 6 Q 1 2 0 1 7 Loss & LAE Ratio
Slide 15: Strong Balance Sheet with Availability of Capital to Support Growth
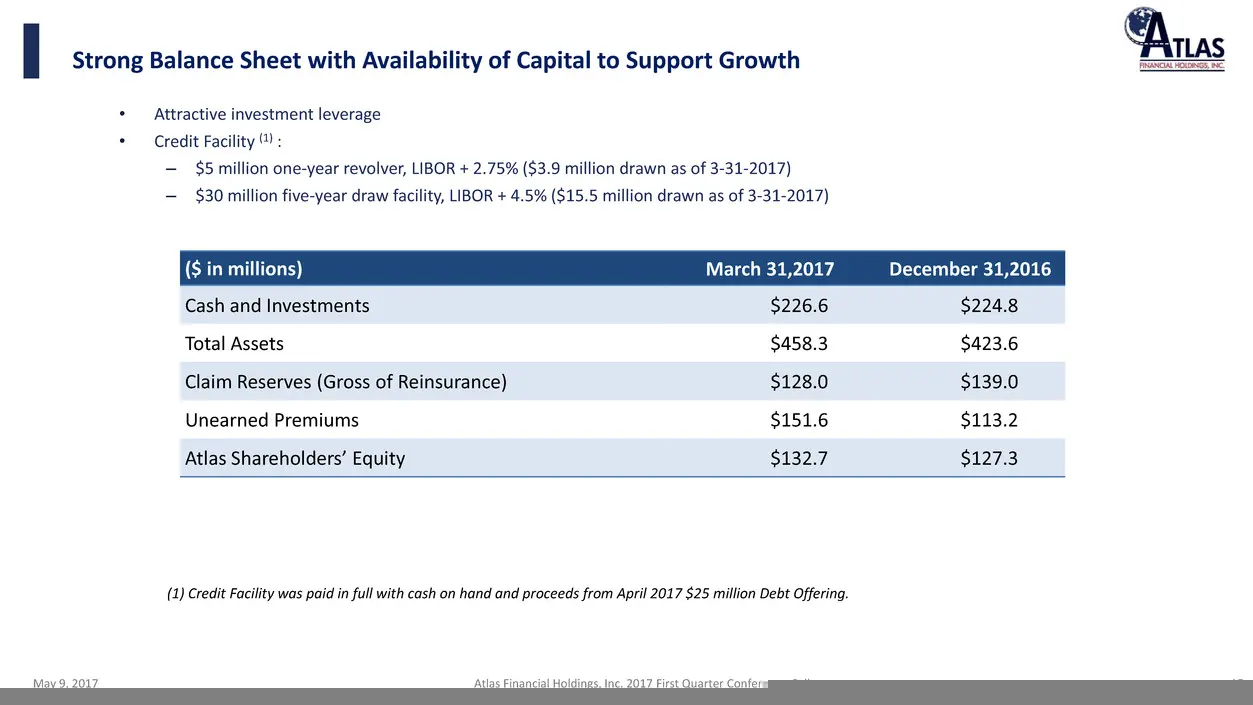
May 9, 2017 Atlas Financial Holdings, Inc. 2017 First Quarter Conference Call 15 • Attractive investment leverage • Credit Facility (1) : – $5 million one-year revolver, LIBOR + 2.75% ($3.9 million drawn as of 3-31-2017) – $30 million five-year draw facility, LIBOR + 4.5% ($15.5 million drawn as of
Slide 16: Investment Portfolio
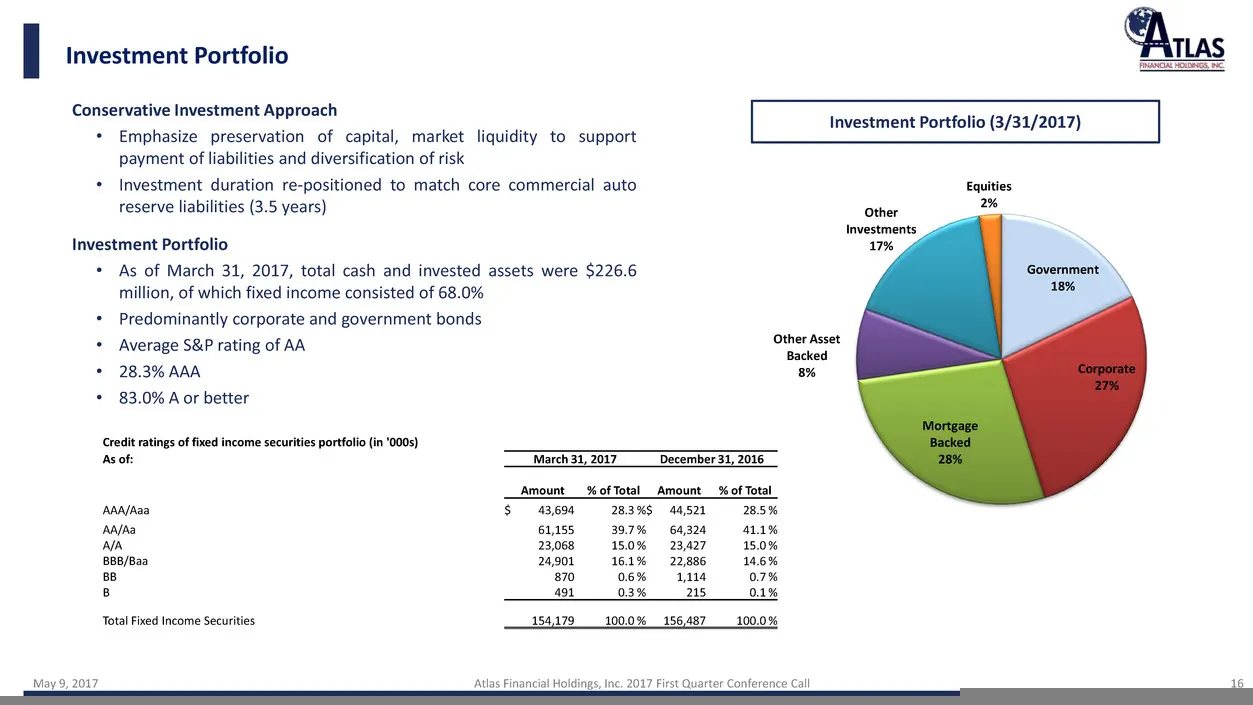
May 9, 2017 Atlas Financial Holdings, Inc. 2017 First Quarter Conference Call 16 Investment Portfolio Conservative Investment Approach • Emphasize preservation of capital, market liquidity to support payment of liabilities and diversification of risk • Investment duration re-positioned to match core
Slide 17: 2017 First Quarter Financial and Operating Information
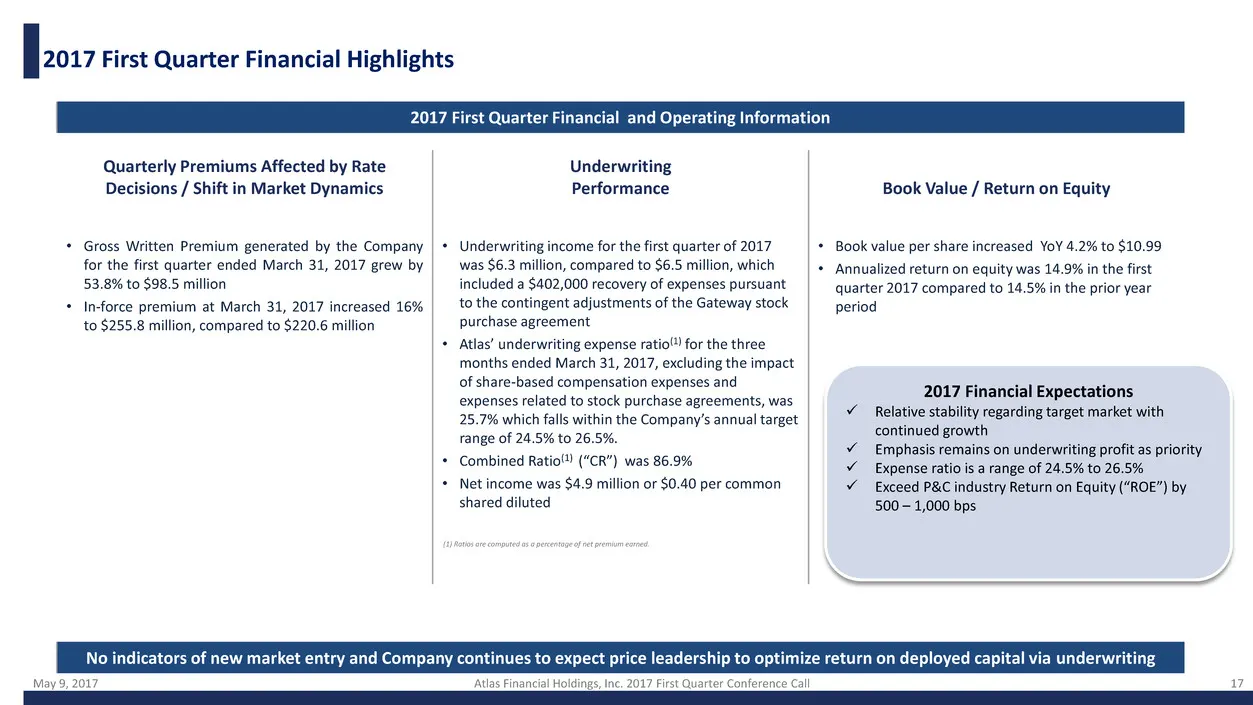
May 9, 2017 Atlas Financial Holdings, Inc. 2017 First Quarter Conference Call 17 2017 First Quarter Financial and Operating Information Quarterly Premiums Affected by Rate Decisions / Shift in Market Dynamics Underwriting Performance Book Value / Return on Equity • Gross Written Premium generated by
Slide 18: Detailed Impact of Changes to Book Value per Common Share
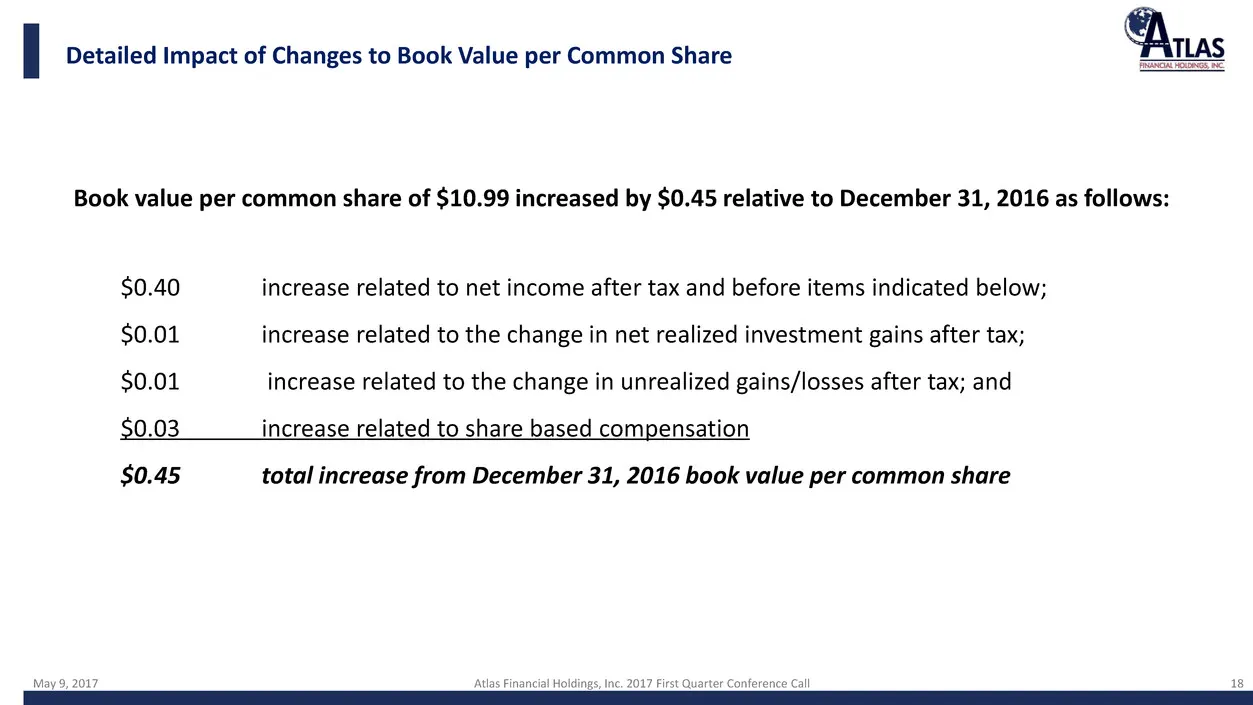
May 9, 2017 Atlas Financial Holdings, Inc. 2017 First Quarter Conference Call 18 18 Detailed Impact of Changes to Book Value per Common Share Book value per common share of $10.99 increased by $0.45 relative to December 31, 2016 as follows: $0.40 increase related to net income after tax and before i

Slide 19: Concluding Remarks
Concluding Remarks FINANCIAL HOLDINGS, INC.
Slide 20: Written Premium: Rate Activity
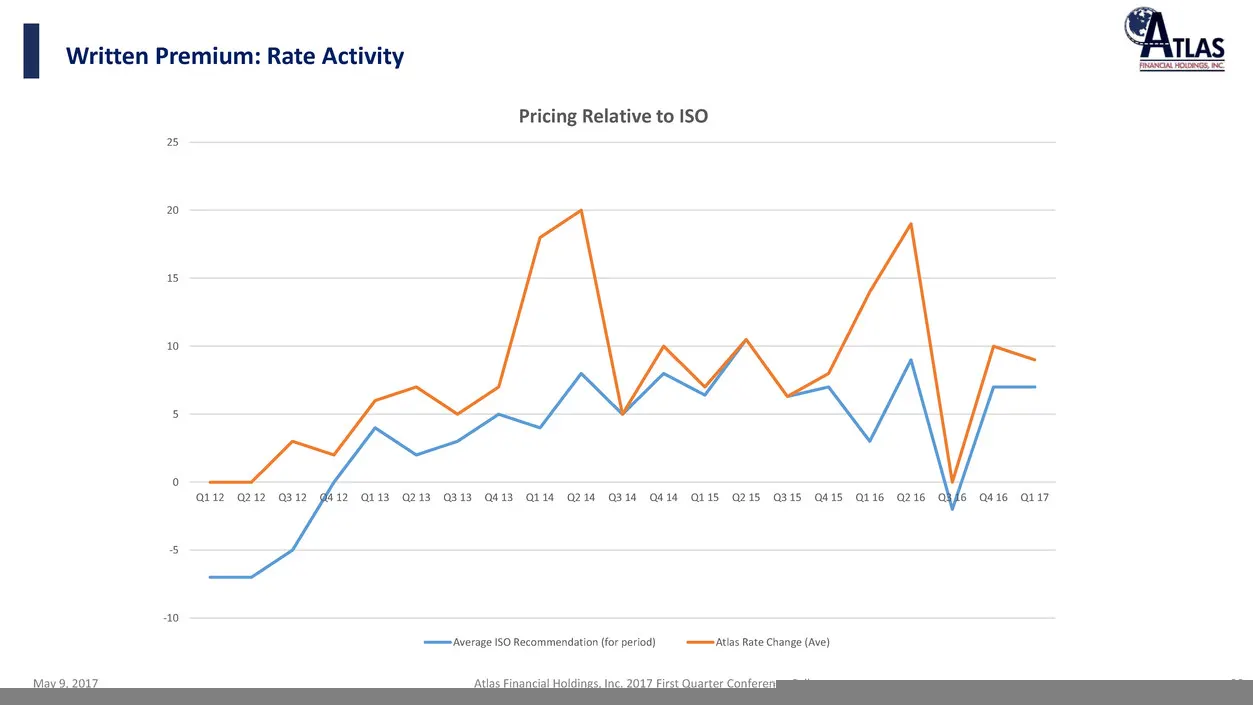
May 9, 2017 Atlas Financial Holdings, Inc. 2017 First Quarter Conference Call 20 Written Premium: Rate Activity 20 Pricing Relative to ISO -10 -5 0 5 10 15 20 25 Q1 12 Q2 12 Q3 12 Q4 12 Q1 13 Q2 13 Q3 13 Q4 13 Q1 14 Q2 14 Q3 14 Q4 14 Q1 15 Q2 15 Q3 15 Q4 15 Q1 16 Q2 16 Q3 16 Q4 16 Q1 17 Average ISO
Slide 21: Operating Activities: Underwriting
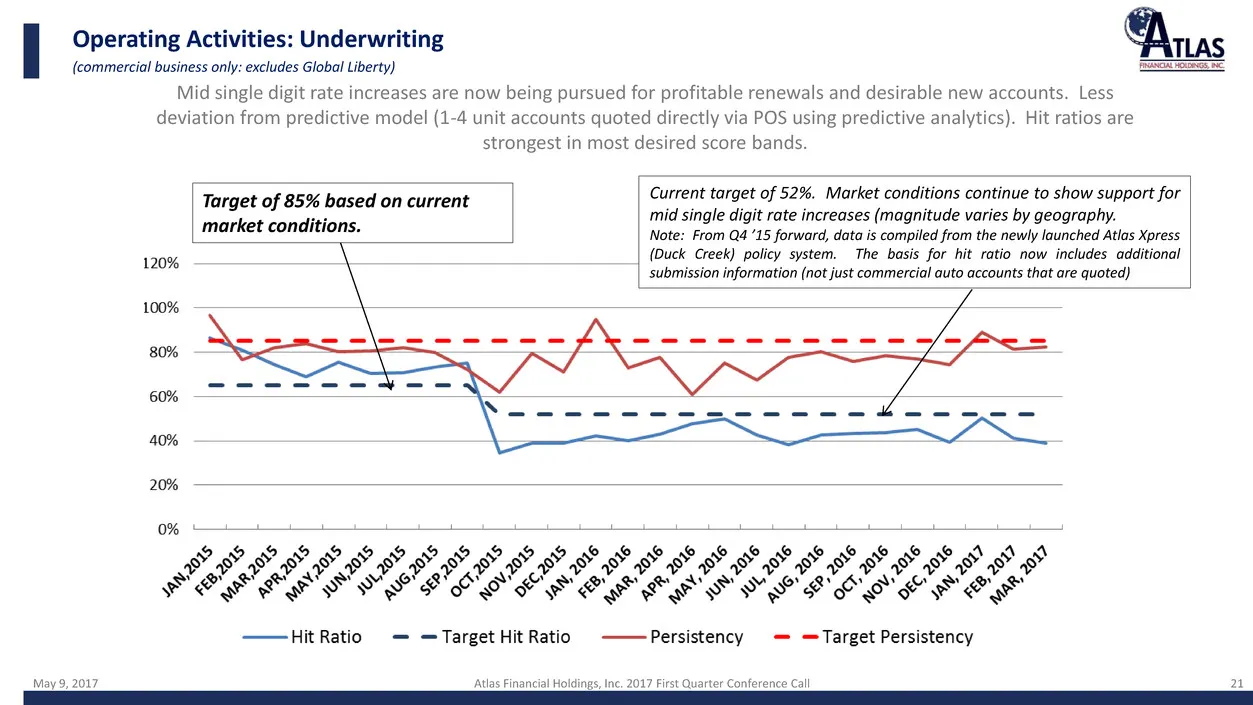
May 9, 2017 Atlas Financial Holdings, Inc. 2017 First Quarter Conference Call 21 Operating Activities: Underwriting (commercial business only: excludes Global Liberty) 21 Mid single digit rate increases are now being pursued for profitable renewals and desirable new accounts. Less deviation from pre
Slide 22: Incremental Benefit of Predictive Analytics Pricing & Underwriting
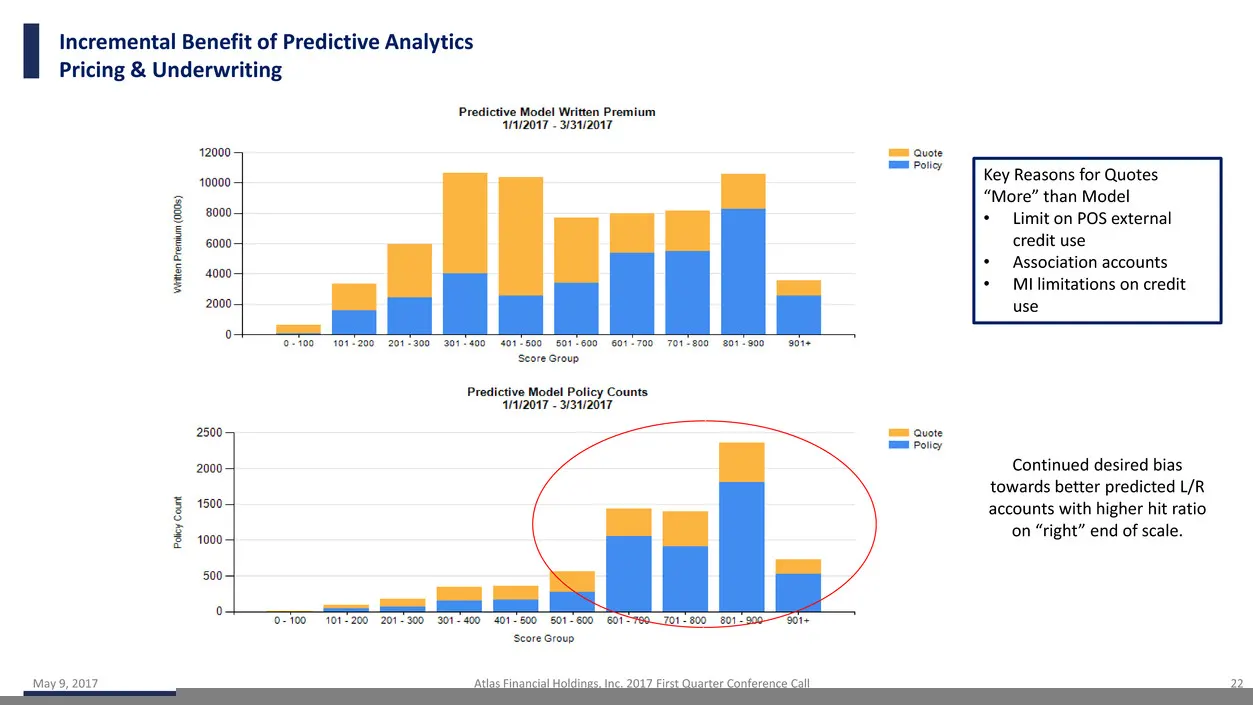
May 9, 2017 Atlas Financial Holdings, Inc. 2017 First Quarter Conference Call 22 Incremental Benefit of Predictive Analytics Pricing & Underwriting Key Reasons for Quotes “More” than Model • Limit on POS external credit use • Association accounts • MI limitations on credit use Continued desired bias
Slide 23: Operating Activities: Underwriting
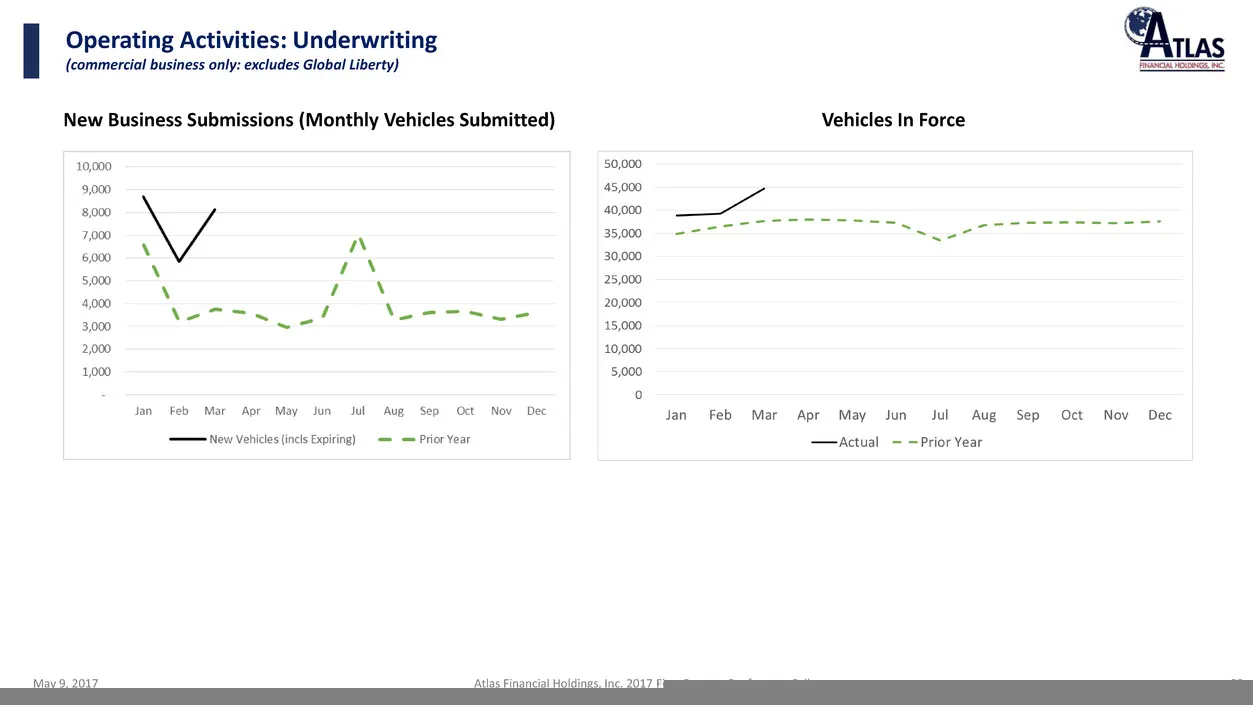
May 9, 2017 Atlas Financial Holdings, Inc. 2017 First Quarter Conference Call 23 Operating Activities: Underwriting (commercial business only: excludes Global Liberty) New Business Submissions (Monthly Vehicles Submitted) Vehicles In Force
Slide 24: For Additional Information
May 9, 2017 Atlas Financial Holdings, Inc. 2017 First Quarter Conference Call 24 Nasdaq: AFH For Additional Information At the Company: Scott Wollney Chief Executive Officer swollney@atlas-fin.com 847-700-8600 Investor Relations: The Equity Group Inc. Adam Prior Senior Vice President APrior@equityny
Slide 25: Reconciliation of Non-U.S. GAAP Financial Measurements
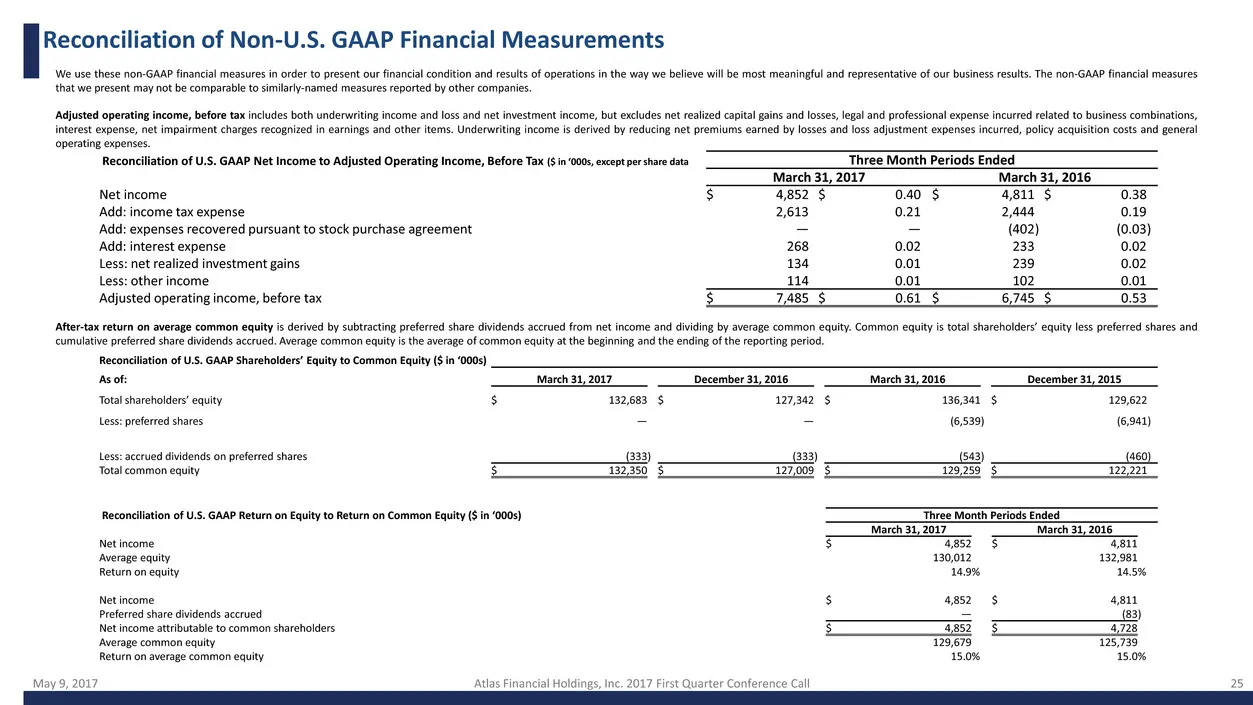
May 9, 2017 Atlas Financial Holdings, Inc. 2017 First Quarter Conference Call 25 Reconciliation of Non-U.S. GAAP Financial Measurements Reconciliation of U.S. GAAP Net Income to Adjusted Operating Income, Before Tax ($ in ‘000s, except per share data Three Month Periods Ended March 31, 2017 March 31
Source: SEC EDGAR · 8-K filed May 9, 2017
More decks from Atlas Financial Holdings Inc
 Investor Presentation (November 2022)20 slides · Nov 14, 2022
 Investor Presentation (August 2022)21 slides · Aug 12, 2022
 Investor Presentation (May 2022)20 slides · May 23, 2022
 Investor Presentation (April 2022)18 slides · Apr 4, 2022
 Investor Presentation (November 2021)28 slides · Nov 8, 2021
 Q2 2021 Earnings Presentation26 slides · Aug 10, 2021