Aspen Insurance Holdings Ltd · NYSE:AHL/PE
Aspen Insurance — Q1 2016 Earnings Presentation
18 slides from Aspen Insurance's earnings presentation, Apr 21, 2016
Slide 1: Investor Presentation First Quarter 2016
Aspen Insurance Holdings Limited INVESTOR PRESENTATION FIRST QUARTER 2016 Exhibit 99.3
Slide 2: Safe Harbor and Non-GAAP Financial Measures
AHL: NYSE 2 This slide presentation is for information purposes only. It should be read in conjunction with our financial supplement posted on our website on the Investor Relations page and with other documents filed or to be filed shortly by Aspen Insurance Holdings Limited (the “Company” or “Aspen
Slide 3: Aspen Overview
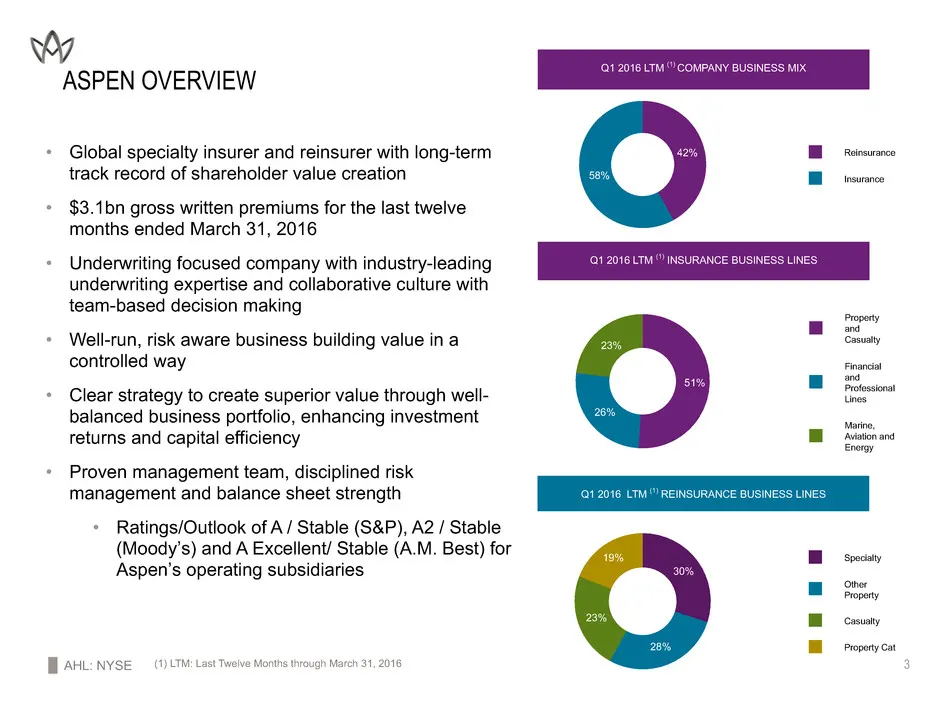
AHL: NYSE 3 Specialty Other Property Casualty Property Cat 30% 28% 23% 19% Property and Casualty Financial and Professional Lines Marine, Aviation and Energy 51% 26% 23% Reinsurance Insurance 42% 58% ASPEN OVERVIEW • Global specialty insurer and reinsurer with long-term track record of shareholder v
Slide 4: Steadily Diversified the Business Mix
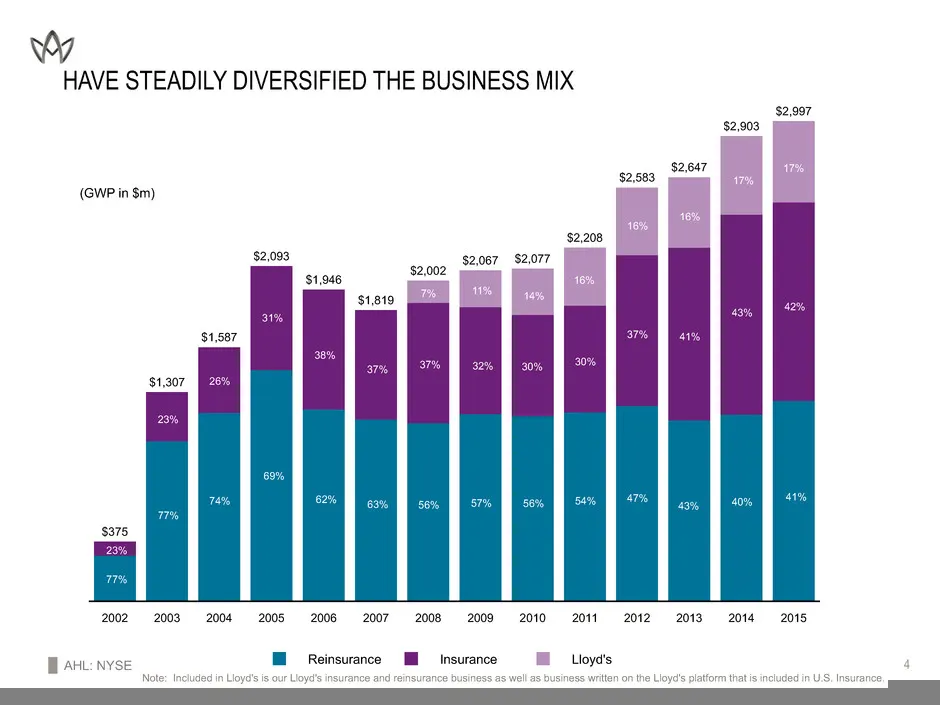
AHL: NYSE 4Reinsurance Insurance Lloyd's 2002 2003 2004 2005 2006 2007 2008 2009 2010 2011 2012 2013 2014 2015 $375 $1,307 $1,587 $2,093 $1,946 $1,819 $2,002 $2,067 $2,077 $2,208 $2,583 $2,647 $2,903 $2,997 HAVE STEADILY DIVERSIFIED THE BUSINESS MIX (GWP in $m) Note: Included in Lloyd's is our Lloyd
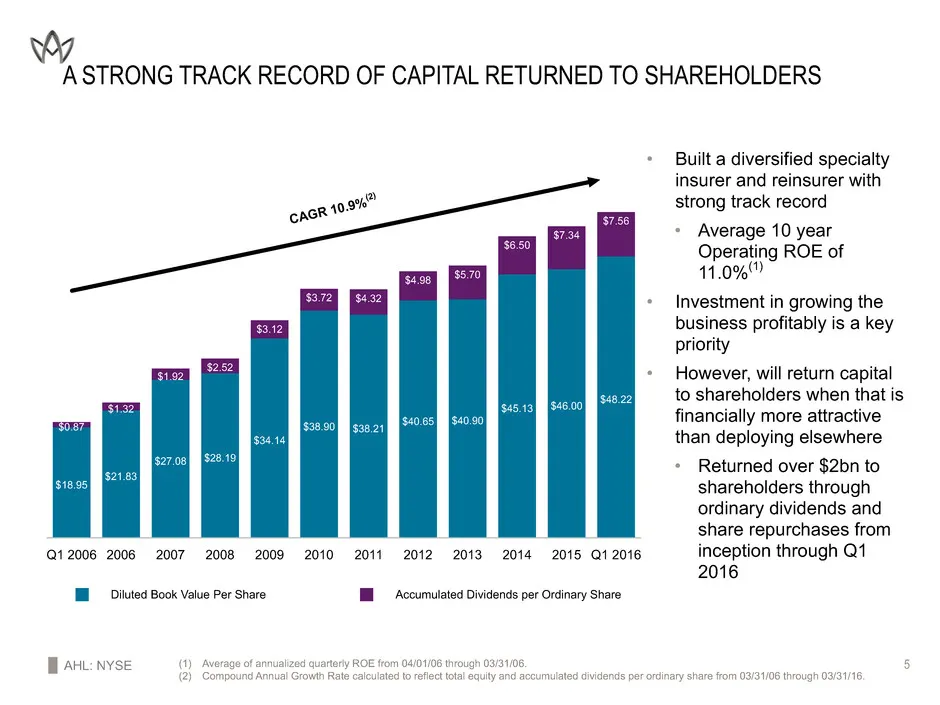
Slide 5: A Strong Track Record of Capital Returned to Shareholders
AHL: NYSE 5 Diluted Book Value Per Share Accumulated Dividends per Ordinary Share Q1 2006 2006 2007 2008 2009 2010 2011 2012 2013 2014 2015 Q1 2016 $18.95 $21.83 $27.08 $28.19 $34.14 $38.90 $38.21 $40.65 $40.90 $45.13 $46.00 $48.22 $0.87 $1.32 $1.92 $2.52 $3.12 $3.72 $4.32 $4.98 $5.70 $6.50 $7.34 $7
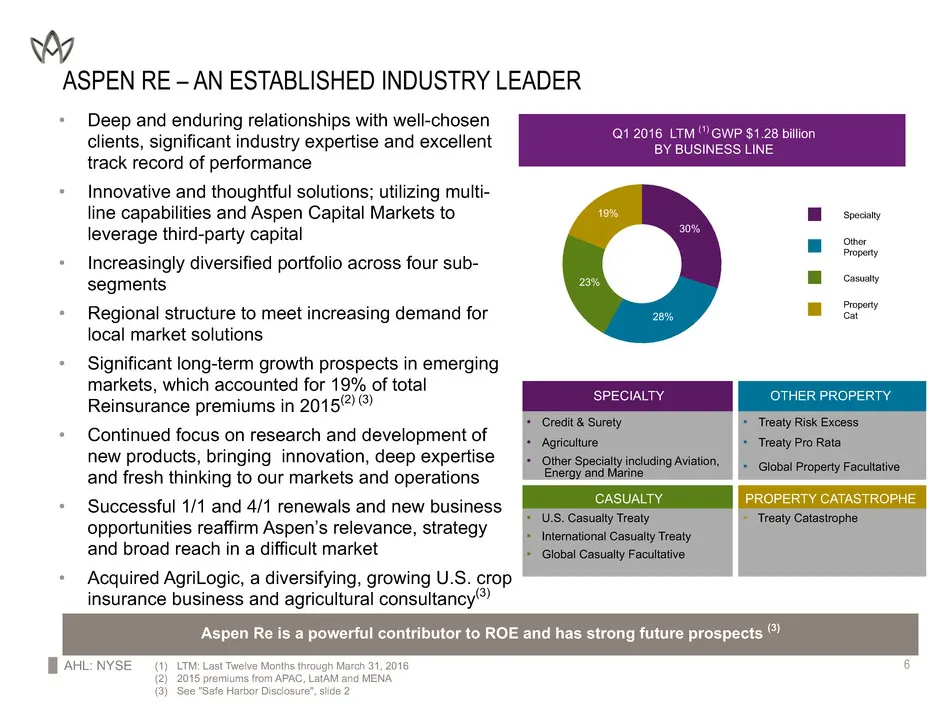
Slide 6: Aspen Re – An Established Industry Leader
AHL: NYSE 6 ASPEN RE – AN ESTABLISHED INDUSTRY LEADER (1) LTM: Last Twelve Months through March 31, 2016 (2) 2015 premiums from APAC, LatAM and MENA (3) See "Safe Harbor Disclosure", slide 2 Q1 2016 LTM (1) GWP $1.28 billion BY BUSINESS LINE • Deep and enduring relationships with well-chosen clients
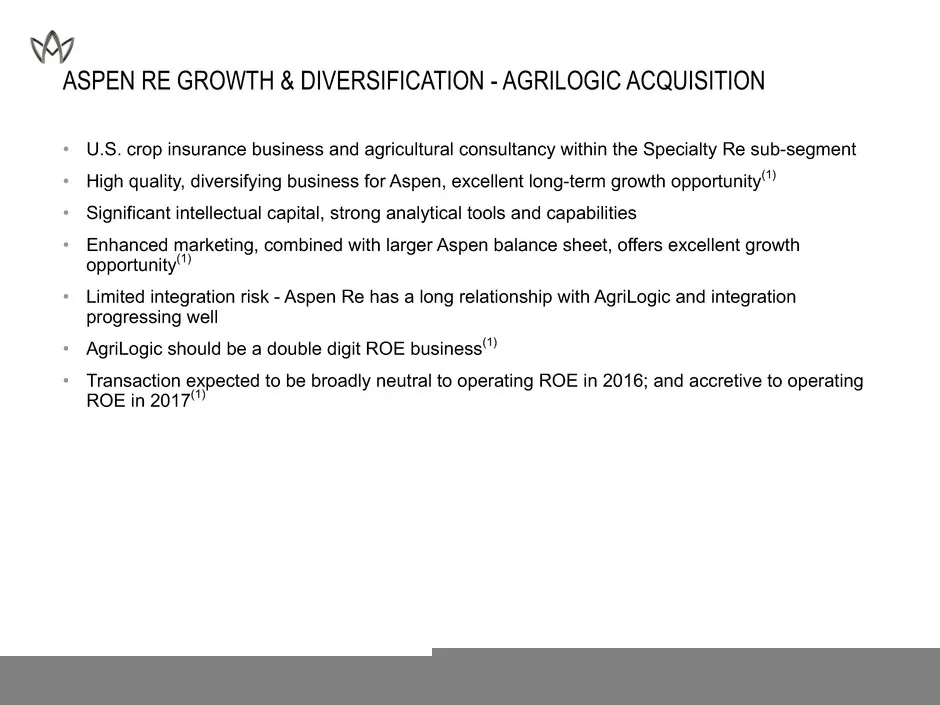
Slide 7: Aspen Re Growth & Diversification - AgriLogic Acquisition
AHL: NYSE 7 ASPEN RE GROWTH & DIVERSIFICATION - AGRILOGIC ACQUISITION • U.S. crop insurance business and agricultural consultancy within the Specialty Re sub-segment • High quality, diversifying business for Aspen, excellent long-term growth opportunity(1) • Significant intellectual capital, strong
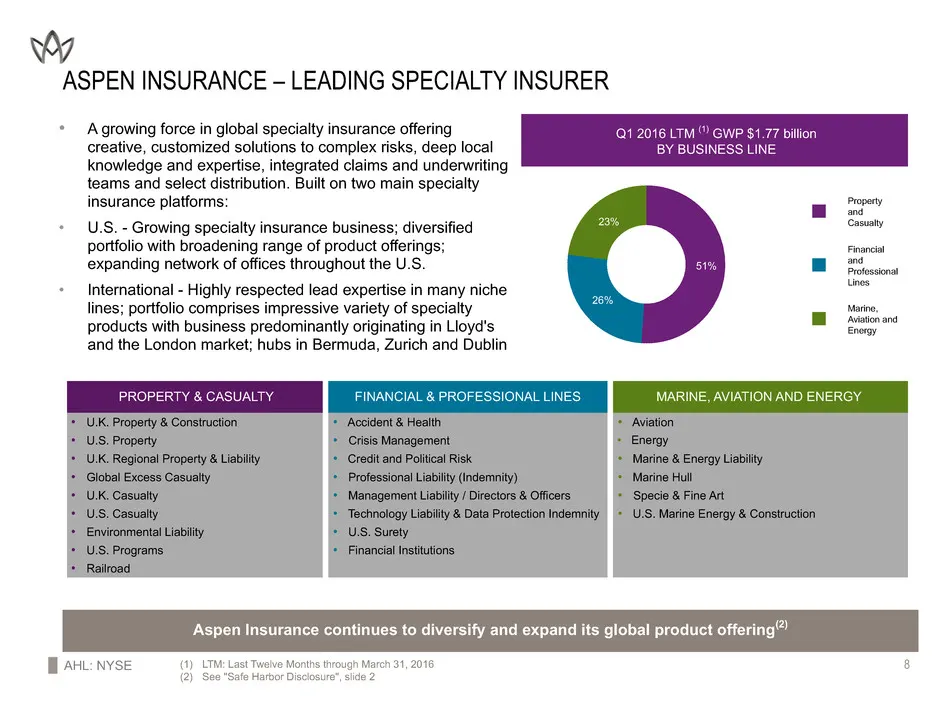
Slide 8: Aspen Insurance – Leading Specialty Insurer
AHL: NYSE 8 Property and Casualty Financial and Professional Lines Marine, Aviation and Energy 51% 26% 23% ASPEN INSURANCE – LEADING SPECIALTY INSURER PROPERTY & CASUALTY FINANCIAL & PROFESSIONAL LINES MARINE, AVIATION AND ENERGY • U.K. Property & Construction • Accident & Health • Aviation • U.S. P
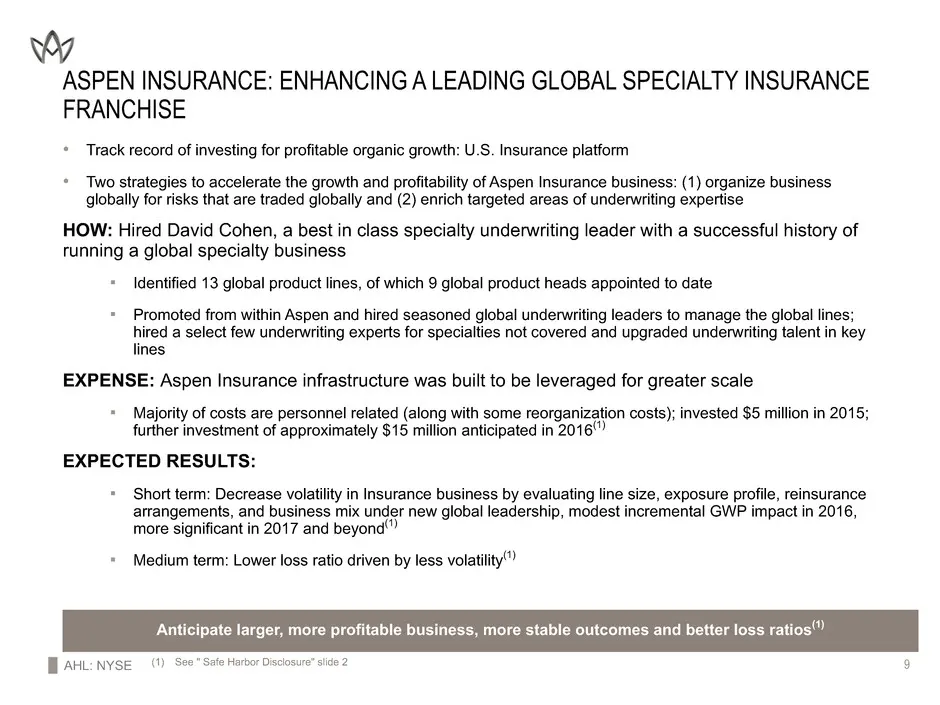
Slide 9: Aspen Insurance: Enhancing a Leading Global Specialty Insurance Franchise
AHL: NYSE 9 ASPEN INSURANCE: ENHANCING A LEADING GLOBAL SPECIALTY INSURANCE FRANCHISE • Track record of investing for profitable organic growth: U.S. Insurance platform • Two strategies to accelerate the growth and profitability of Aspen Insurance business: (1) organize business globally for risks t
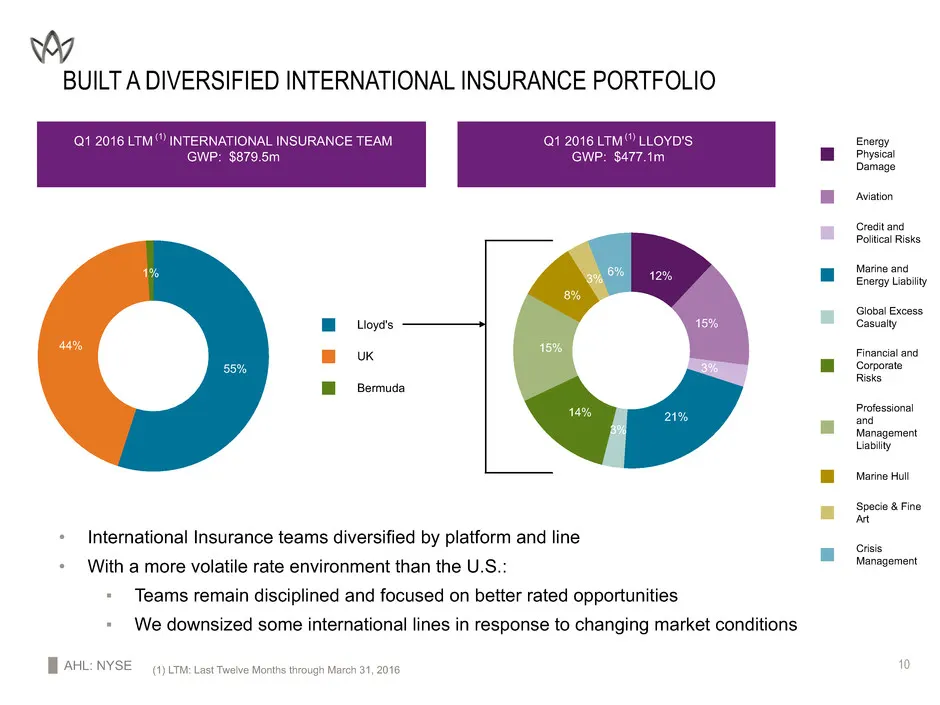
Slide 10: Built a Diversified International Insurance Portfolio
AHL: NYSE 10 BUILT A DIVERSIFIED INTERNATIONAL INSURANCE PORTFOLIO Lloyd's UK Bermuda 55% 44% 1% Energy Physical Damage Aviation Credit and Political Risks Marine and Energy Liability Global Excess Casualty Financial and Corporate Risks Professional and Management Liability Marine Hull Specie & Fine
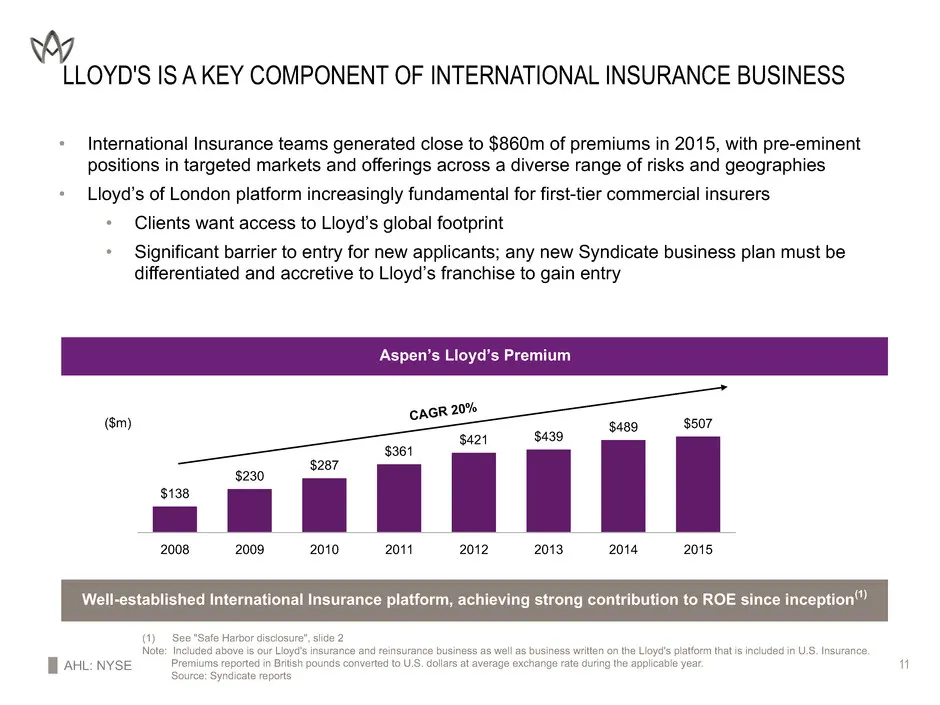
Slide 11: Lloyd's Is a Key Component of International Insurance Business
AHL: NYSE 11 2008 2009 2010 2011 2012 2013 2014 2015 $138 $230 $287 $361 $421 $439 $489 $507 LLOYD'S IS A KEY COMPONENT OF INTERNATIONAL INSURANCE BUSINESS CAGR 20% (1) See "Safe Harbor disclosure", slide 2 Note: Included above is our Lloyd's insurance and reinsurance business as well as business wr
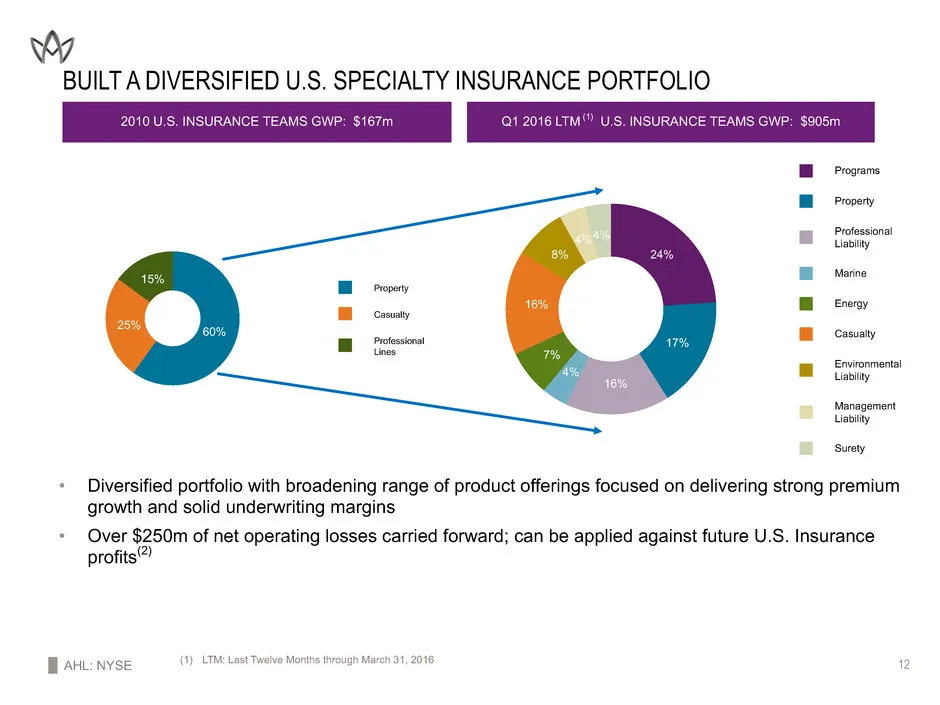
Slide 12: Built a Diversified U.S. Specialty Insurance Portfolio
AHL: NYSE 12 Property Casualty Professional Lines 60%25% 15% Programs Property Professional Liability Marine Energy Casualty Environmental Liability Management Liability Surety 24% 17% 16% 4% 7% 16% 8% 4%4% BUILT A DIVERSIFIED U.S. SPECIALTY INSURANCE PORTFOLIO 2010 U.S. INSURANCE TEAMS GWP: $167m Q
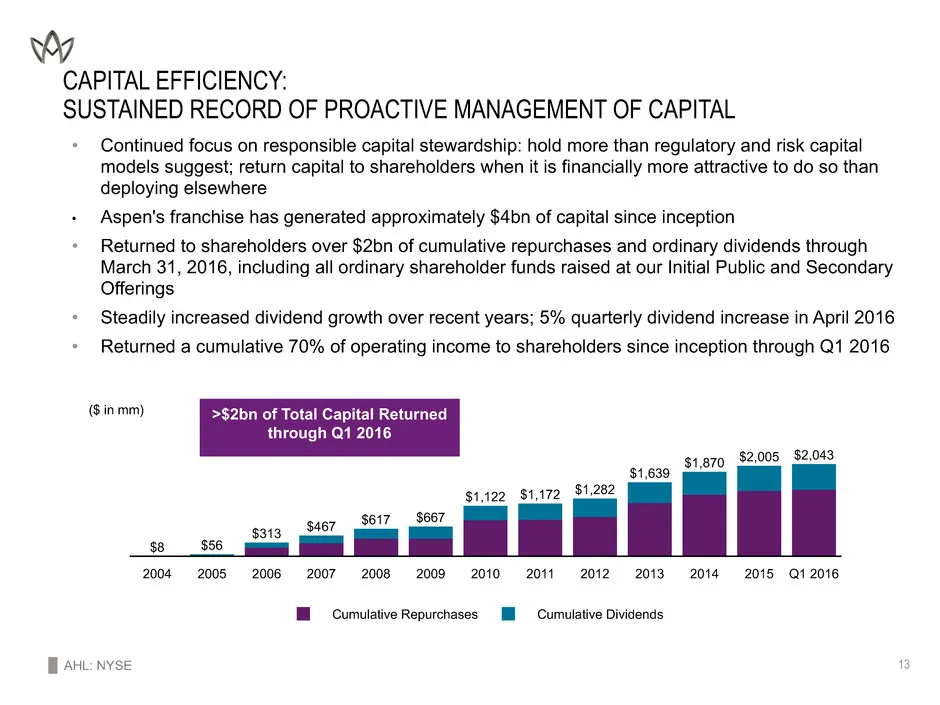
Slide 13: Capital Efficiency: Sustained Record of Proactive Management of Capital
AHL: NYSE 13 CAPITAL EFFICIENCY: SUSTAINED RECORD OF PROACTIVE MANAGEMENT OF CAPITAL • Continued focus on responsible capital stewardship: hold more than regulatory and risk capital models suggest; return capital to shareholders when it is financially more attractive to do so than deploying elsewher
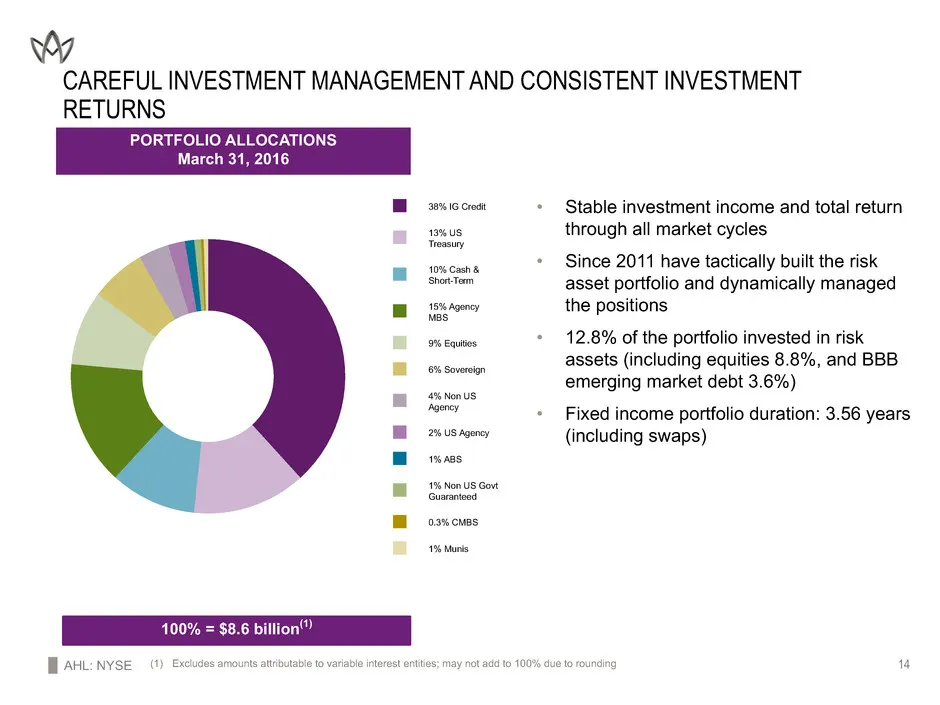
Slide 14: Careful Investment Management and Consistent Investment Returns
AHL: NYSE 14 CAREFUL INVESTMENT MANAGEMENT AND CONSISTENT INVESTMENT RETURNS 38% IG Credit 13% US Treasury 10% Cash & Short-Term 15% Agency MBS 9% Equities 6% Sovereign 4% Non US Agency 2% US Agency 1% ABS 1% Non US Govt Guaranteed 0.3% CMBS 1% Munis PORTFOLIO ALLOCATIONS March 31, 2016 100% = $8.6
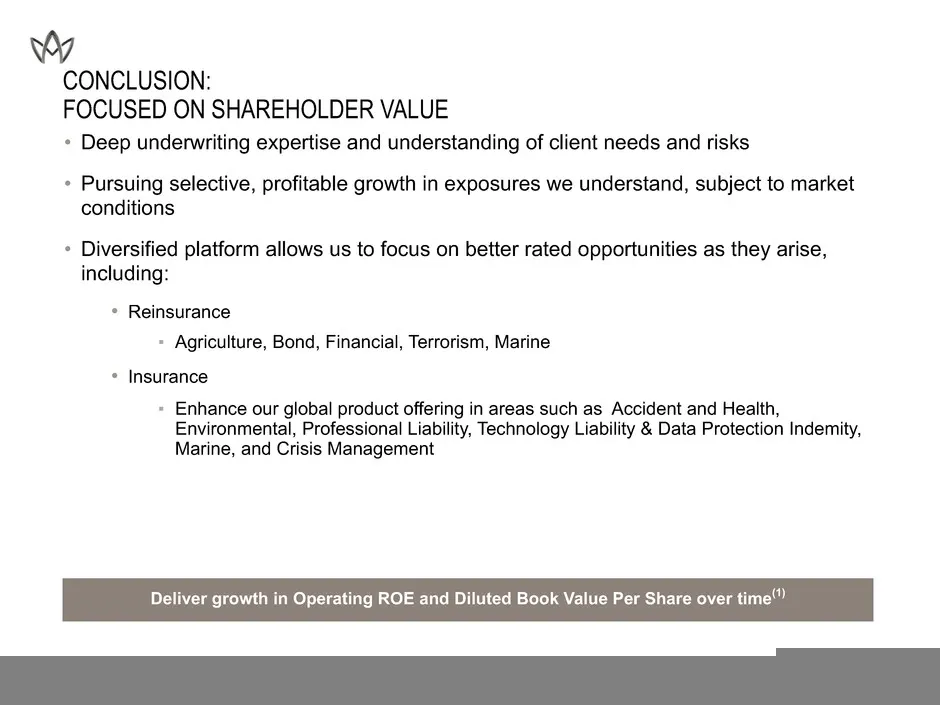
Slide 15: Conclusion: Focused on Shareholder Value
AHL: NYSE 15 CONCLUSION: FOCUSED ON SHAREHOLDER VALUE • Deep underwriting expertise and understanding of client needs and risks • Pursuing selective, profitable growth in exposures we understand, subject to market conditions • Diversified platform allows us to focus on better rated opportunities as
Slide 16: Appendix
APPENDIX
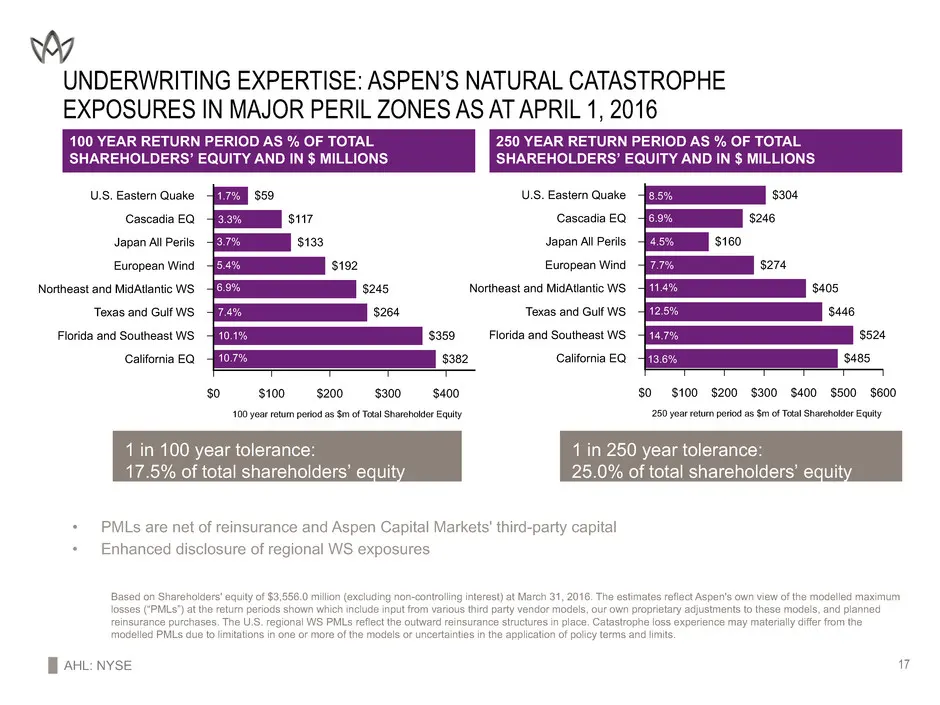
Slide 17: Underwriting Expertise: Natural Catastrophe Exposures in Major Peril Zones
AHL: NYSE 17 UNDERWRITING EXPERTISE: ASPEN’S NATURAL CATASTROPHE EXPOSURES IN MAJOR PERIL ZONES AS AT APRIL 1, 2016 100 YEAR RETURN PERIOD AS % OF TOTAL SHAREHOLDERS’ EQUITY AND IN $ MILLIONS 1 in 100 year tolerance: 17.5% of total shareholders’ equity 1 in 250 year tolerance: 25.0% of total shareho
Slide 18: Aspen Insurance Holdings Limited First Quarter 2016
Aspen Insurance Holdings Limited INVESTOR PRESENTATION FIRST QUARTER 2016
Source: SEC EDGAR · 8-K filed Apr 21, 2016
More decks from Aspen Insurance Holdings Ltd
 Q1 2018 Earnings Presentation13 slides · May 2, 2018
 Q3 2017 Earnings Presentation20 slides · Nov 15, 2017
 Q2 2017 Earnings Presentation20 slides · Jul 26, 2017
 Q1 2017 Earnings Presentation20 slides · Apr 26, 2017
 Q4 2016 Earnings Presentation16 slides · Feb 14, 2017
 Q3 2016 Earnings Presentation16 slides · Oct 26, 2016