Mead Johnson Nutrition — Deutsche Bank Conference 2015
26 slides from Mead Johnson Nutrition's conference presentation, Jun 8, 2015

Slide 1: Deutsche Bank Conference June 9, 2015
Deutsche Bank Conference June 9, 2015 Kasper Jakobsen President & CEO
Slide 2: Safe Harbor Statement
Safe Harbor Statement Forward-Looking Statements Certain statements in this presentation are forward-looking as defined in the Private Securities Litigation Reform Act of 1995. These forward-looking statements may be identified by the fact they use words such as “should,” “expect,” “anticipate,” “es
Slide 3: Our Mission and Core Beliefs
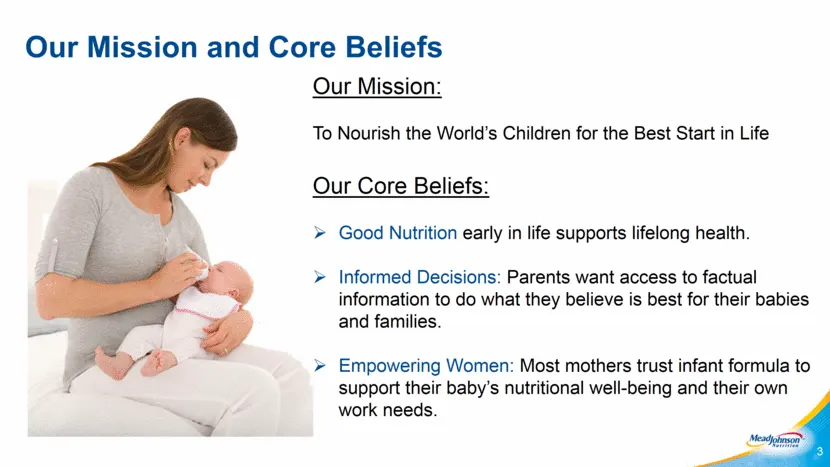
Our Mission and Core Beliefs 3 Our Mission: To Nourish the World’s Children for the Best Start in Life Our Core Beliefs: Good Nutrition early in life supports lifelong health. Informed Decisions: Parents want access to factual information to do what they believe is best for their babies and families
Slide 4: Our Commitment to Shareholders
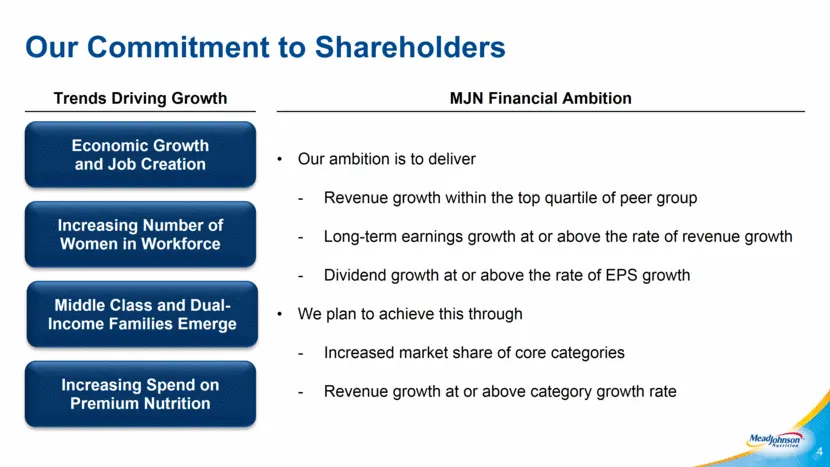
Our Commitment to Shareholders Economic Growth and Job Creation Increasing Number of Women in Workforce Middle Class and Dual-Income Families Emerge Increasing Spend on Premium Nutrition MJN Financial Ambition Trends Driving Growth Our ambition is to deliver Revenue growth within the top quartile of
Slide 5: Strategy for Growth
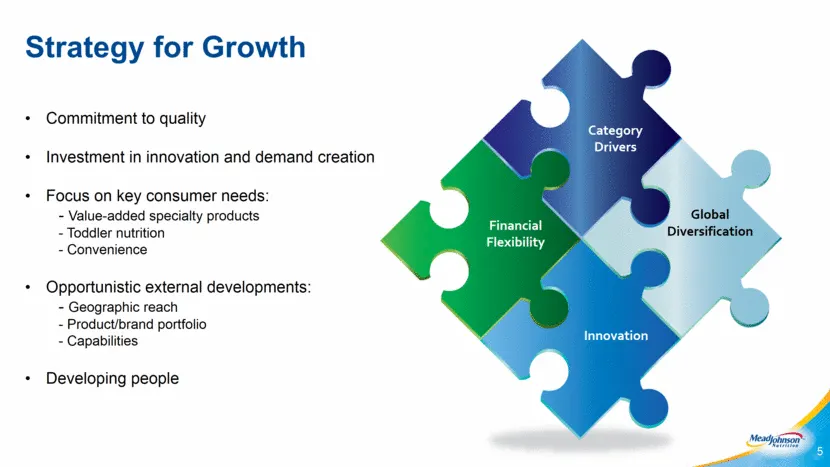
Strategy for Growth Commitment to quality Investment in innovation and demand creation Focus on key consumer needs: Value-added specialty products Toddler nutrition Convenience Opportunistic external developments: Geographic reach Product/brand portfolio Capabilities Developing people 5 Category Dri
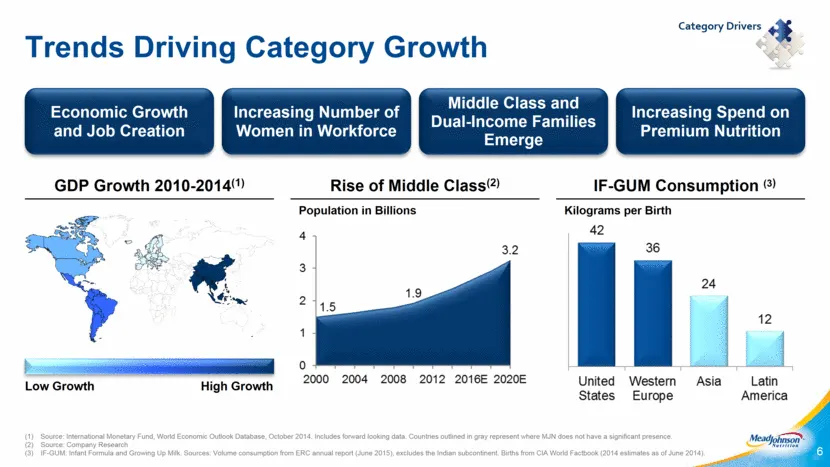
Slide 6: Trends Driving Category Growth
Trends Driving Category Growth Economic Growth and Job Creation Increasing Number of Women in Workforce Middle Class and Dual-Income Families Emerge Increasing Spend on Premium Nutrition GDP Growth 2010-2014(1) Rise of Middle Class(2) IF-GUM Consumption (3) Low Growth High Growth 6 (1) Source: Inter
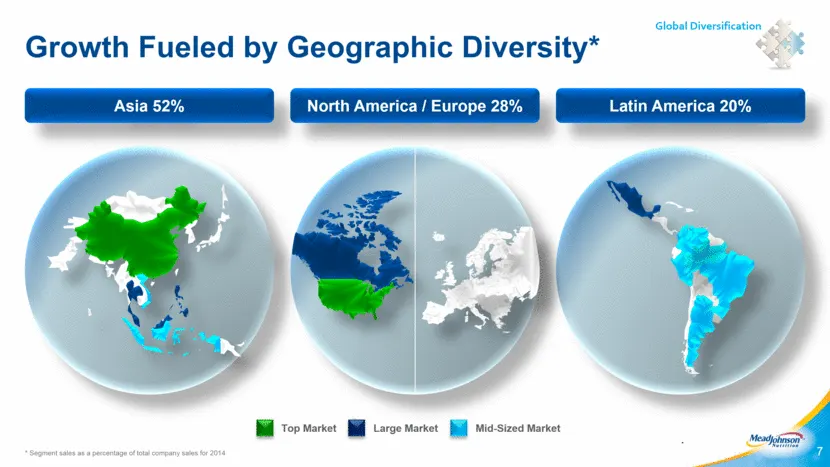
Slide 7: Growth Fueled by Geographic Diversity
Growth Fueled by Geographic Diversity* * Segment sales as a percentage of total company sales for 2014 7 North America / Europe 28% Asia 52% Latin America 20% Global Diversification Top Market Large Market Mid-Sized Market
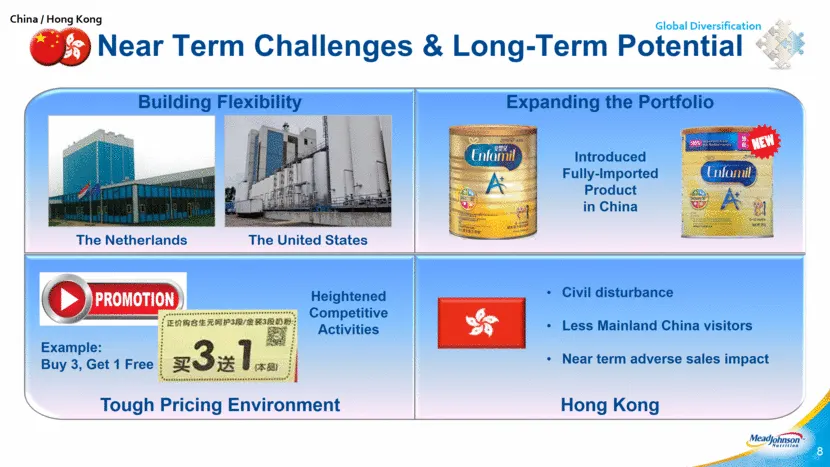
Slide 8: Building Flexibility: Near Term Challenges & Long-Term Potential
Building Flexibility Near Term Challenges & Long-Term Potential 8 Expanding the Portfolio Tough Pricing Environment Hong Kong Civil disturbance Less Mainland China visitors Near term adverse sales impact Heightened Competitive Activities Introduced Fully-Imported Product in China The Netherlands The
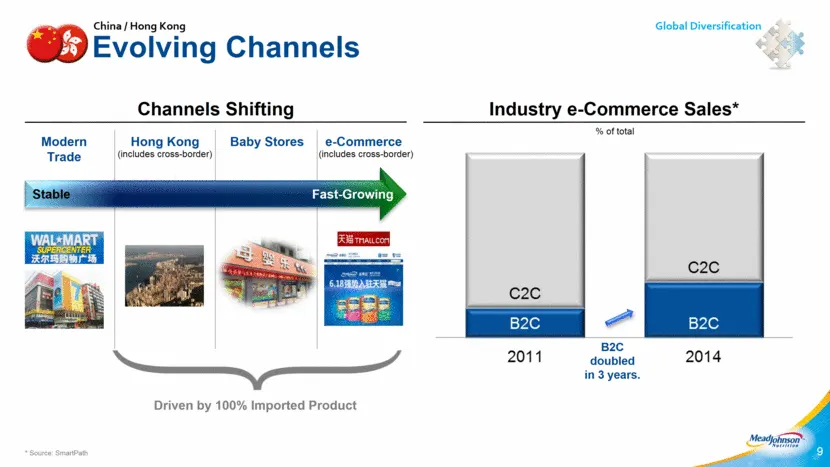
Slide 9: Evolving Channels
Evolving Channels Channels Shifting Industry e-Commerce Sales* * Source: SmartPath e-Commerce Baby Stores Modern Trade Hong Kong 9 Stable Fast-Growing Global Diversification Driven by 100% Imported Product China / Hong Kong (includes cross-border) (includes cross-border) B2C doubled in 3 years. % of
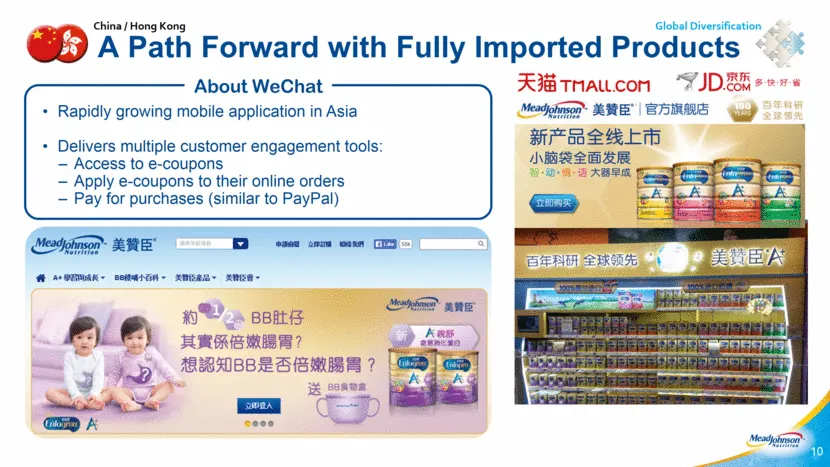
Slide 10: China / Hong Kong: A Path Forward with Fully Imported Products
10 China / Hong Kong A Path Forward with Fully Imported Products Global Diversification About WeChat Rapidly growing mobile application in Asia Delivers multiple customer engagement tools: Access to e-coupons Apply e-coupons to their online orders Pay for purchases (similar to PayPal)
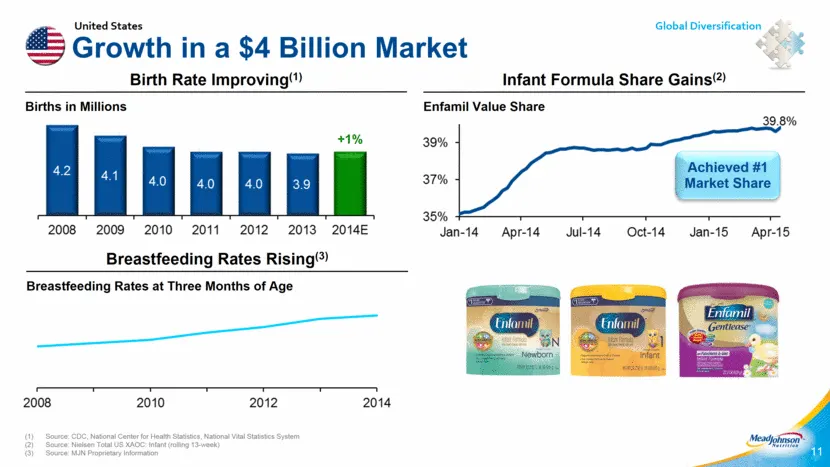
Slide 11: Growth in a $4 Billion Market
Growth in a $4 Billion Market Births in Millions Birth Rate Improving(1) +1% Infant Formula Share Gains(2) Enfamil Value Share 11 Global Diversification Source: CDC, National Center for Health Statistics, National Vital Statistics System Source: Nielsen Total US XAOC: Infant (rolling 13-week) Source
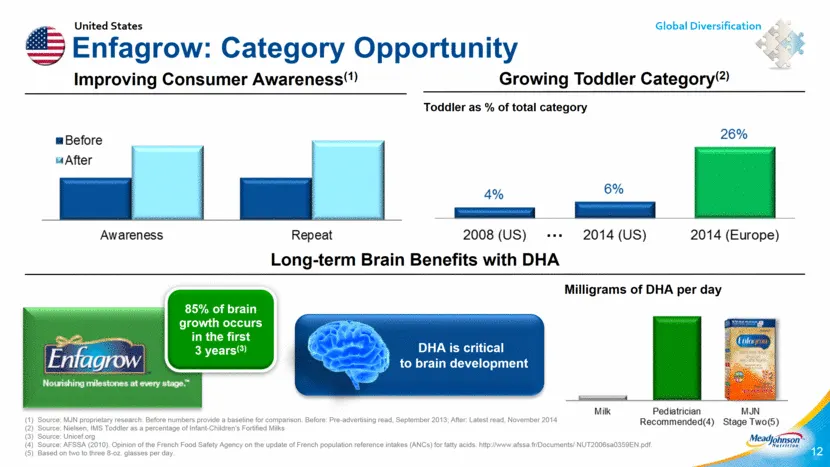
Slide 12: Enfagrow: Category Opportunity
Enfagrow: Category Opportunity Improving Consumer Awareness(1) Long-term Brain Benefits with DHA Source: MJN proprietary research. Before numbers provide a baseline for comparison. Before: Pre-advertising read, September 2013; After: Latest read, November 2014 Source: Nielsen, IMS Toddler as a perce
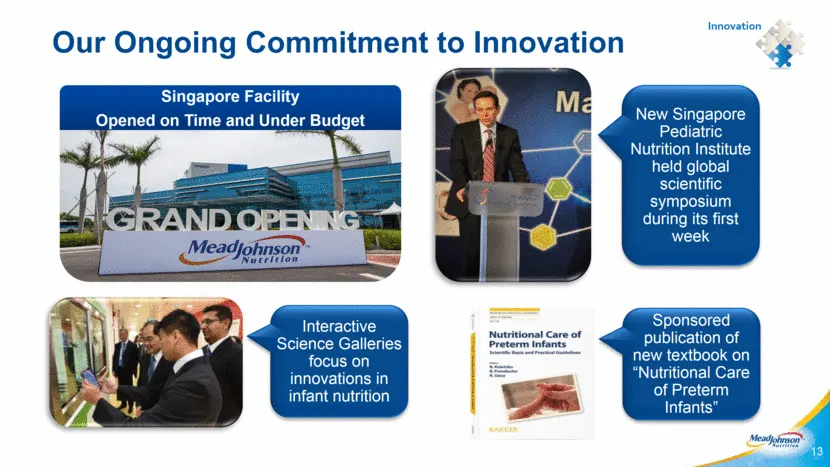
Slide 13: Our Ongoing Commitment to Innovation
Our Ongoing Commitment to Innovation 13 Innovation New Singapore Pediatric Nutrition Institute held global scientific symposium during its first week Interactive Science Galleries focus on innovations in infant nutrition Sponsored publication of new textbook on “Nutritional Care of Preterm Infants”
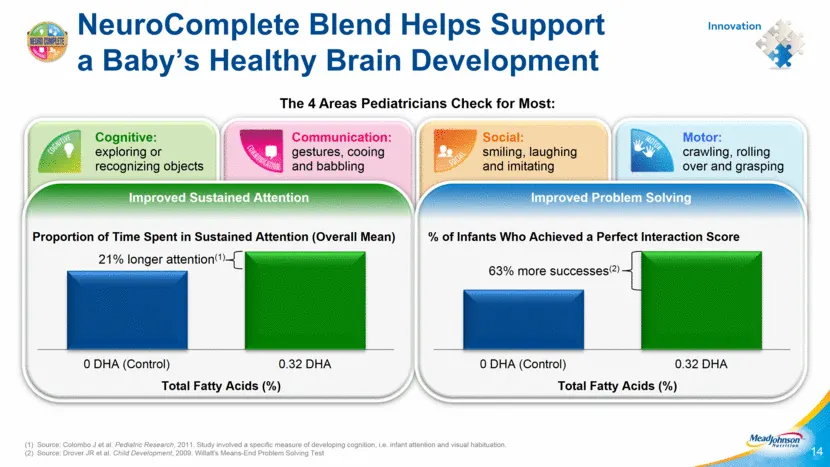
Slide 14: NeuroComplete Blend Helps Support a Baby's Healthy Brain Development
Motor: crawling, rolling over and grasping Communication: gestures, cooing and babbling Social: smiling, laughing and imitating NeuroComplete Blend Helps Support a Baby’s Healthy Brain Development 14 Innovation Cognitive: exploring or recognizing objects The 4 Areas Pediatricians Check for Most: Imp
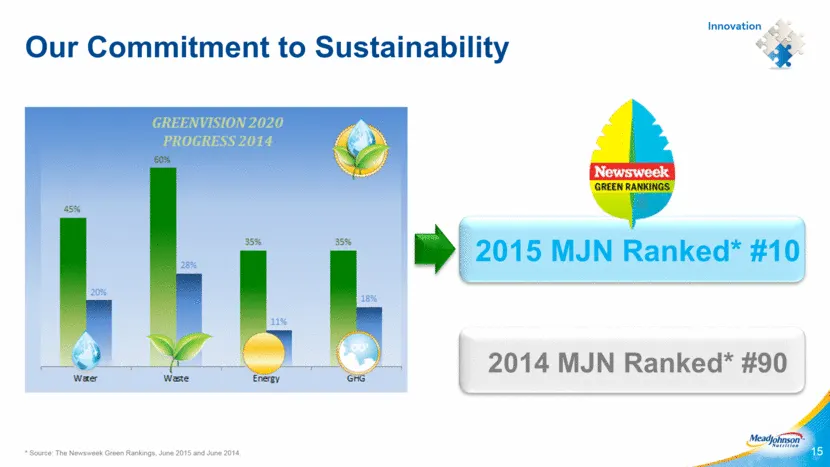
Slide 15: Our Commitment to Sustainability
Our Commitment to Sustainability 15 2015 MJN Ranked* #10 2014 MJN Ranked* #90 Innovation * Source: The Newsweek Green Rankings, June 2015 and June 2014.

Slide 16: Financial Highlights
Financial Highlights
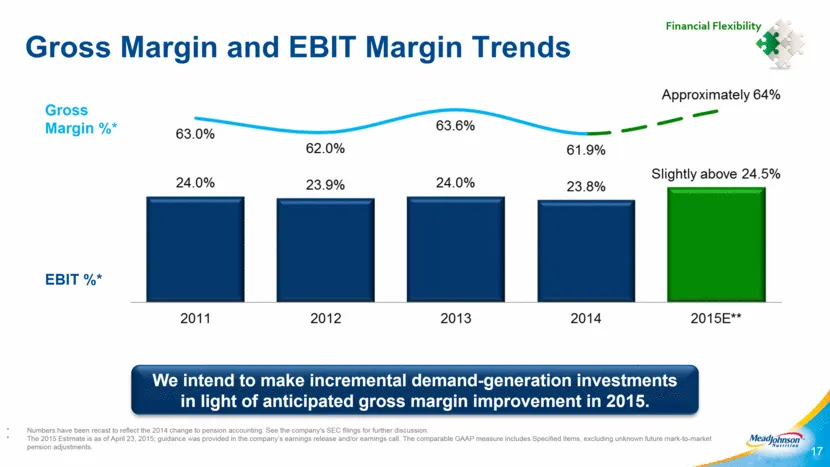
Slide 17: Gross Margin and EBIT Margin Trends
Gross Margin and EBIT Margin Trends * Numbers have been recast to reflect the 2014 change to pension accounting. See the company's SEC filings for further discussion. * The 2015 Estimate is as of April 23, 2015; guidance was provided in the company’s earnings release and/or earnings call. The compar
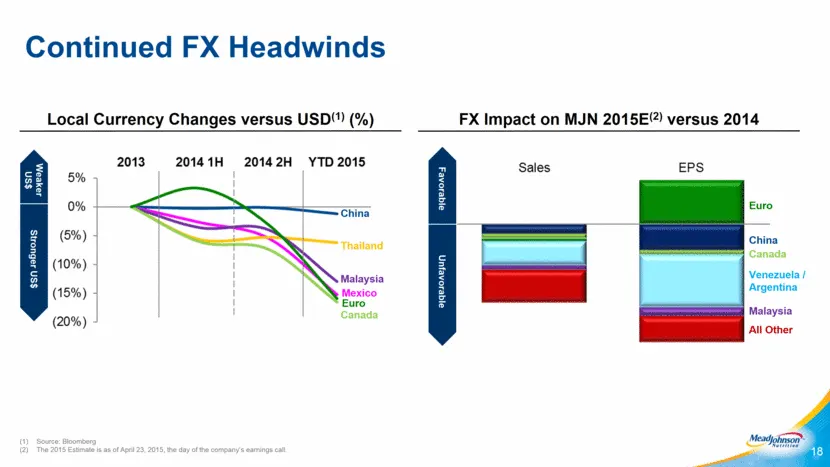
Slide 18: Continued FX Headwinds
Continued FX Headwinds Source: Bloomberg The 2015 Estimate is as of April 23, 2015, the day of the company’s earnings call. 18 Local Currency Changes versus USD(1) (%) FX Impact on MJN 2015E(2) versus 2014 Euro China Canada Venezuela / Argentina All Other Malaysia Favorable Unfavorable Weaker US$ St
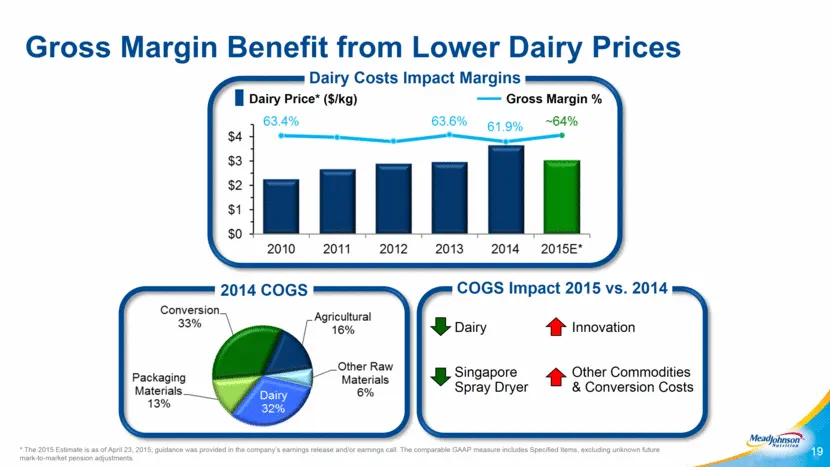
Slide 19: Gross Margin Benefit from Lower Dairy Prices
Gross Margin Benefit from Lower Dairy Prices 19 Dairy Singapore Spray Dryer Dairy Price* ($/kg) Gross Margin % Innovation Other Commodities & Conversion Costs Dairy Costs Impact Margins COGS Impact 2015 vs. 2014 2014 COGS * The 2015 Estimate is as of April 23, 2015; guidance was provided in the comp
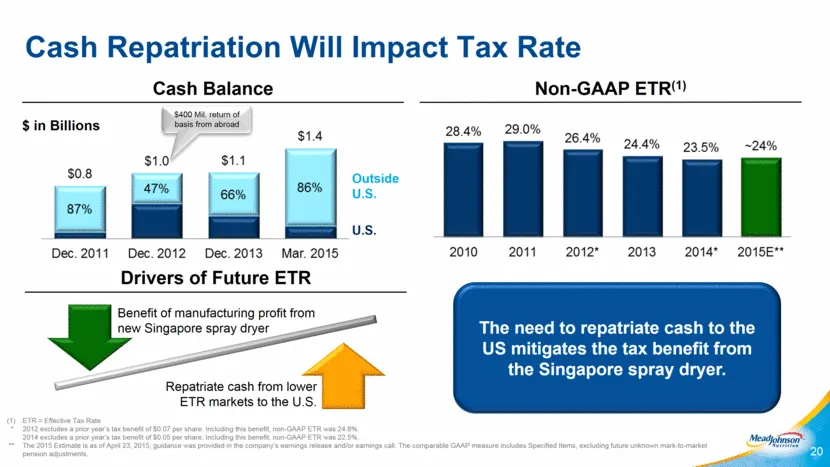
Slide 20: Cash Repatriation Will Impact Tax Rate
Cash Repatriation Will Impact Tax Rate (1) ETR = Effective Tax Rate * 2012 excludes a prior year’s tax benefit of $0.07 per share. Including this benefit, non-GAAP ETR was 24.8%. 2014 excludes a prior year’s tax benefit of $0.05 per share. Including this benefit, non-GAAP ETR was 22.5%. ** The 2015
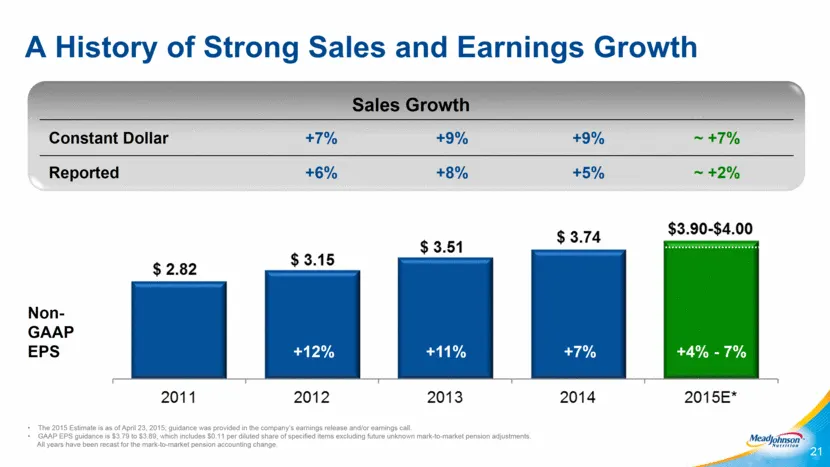
Slide 21: A History of Strong Sales and Earnings Growth
The 2015 Estimate is as of April 23, 2015; guidance was provided in the company’s earnings release and/or earnings call. GAAP EPS guidance is $3.79 to $3.89, which includes $0.11 per diluted share of specified items excluding future unknown mark-to-market pension adjustments. All years have been rec
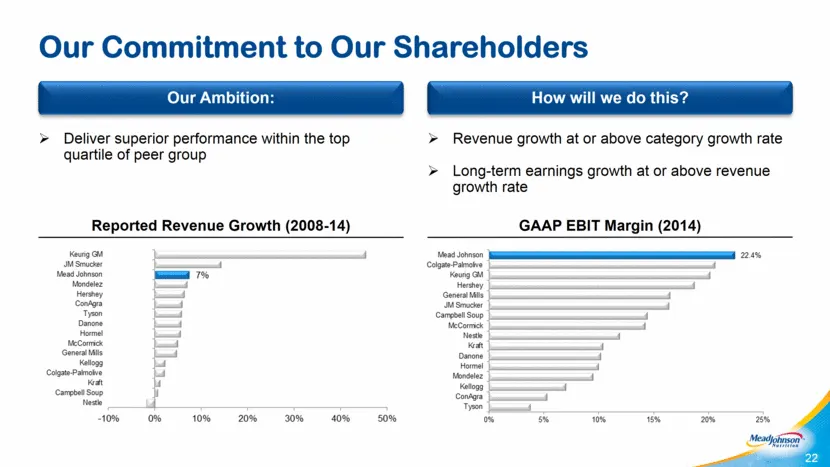
Slide 22: Our Commitment to Our Shareholders
Our Commitment to Our Shareholders 22 Our Ambition: Deliver superior performance within the top quartile of peer group How will we do this? Revenue growth at or above category growth rate Long-term earnings growth at or above revenue growth rate GAAP EBIT Margin (2014) Reported Revenue Growth (2008-
Slide 23: Appendix
Appendix 23
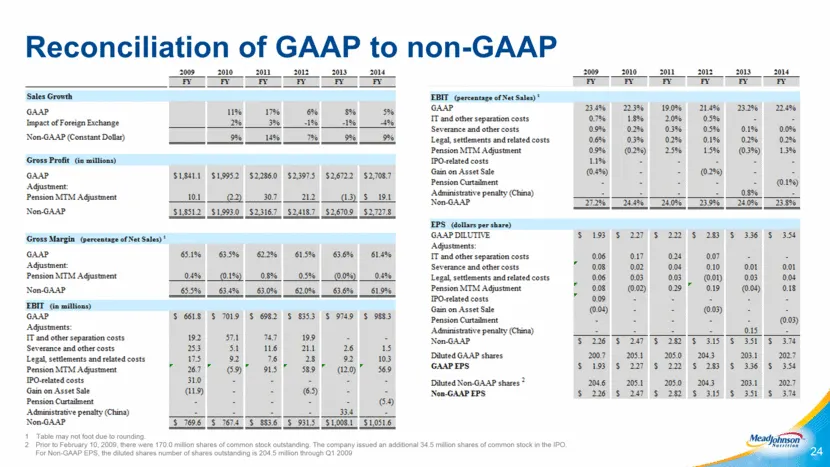
Slide 24: Reconciliation of GAAP to non-GAAP
Reconciliation of GAAP to non-GAAP 24 1 Table may not foot due to rounding. 2 Prior to February 10, 2009, there were 170.0 million shares of common stock outstanding. The company issued an additional 34.5 million shares of common stock in the IPO. For Non-GAAP EPS, the diluted shares number of share
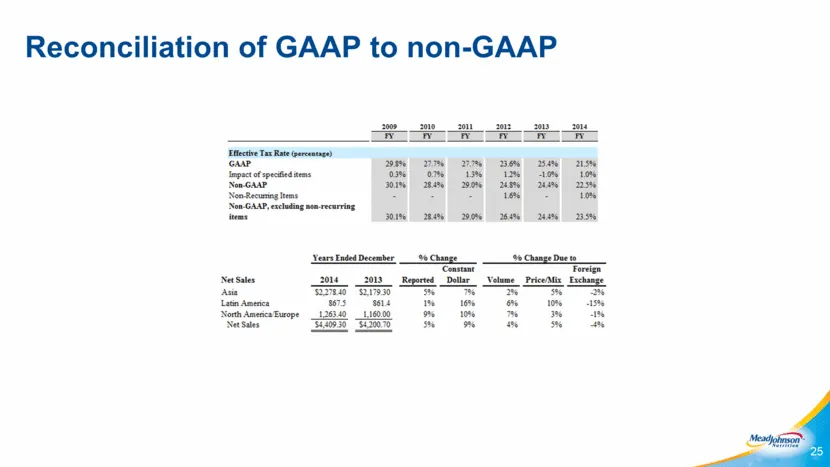
Slide 25: Reconciliation of GAAP to non-GAAP
Reconciliation of GAAP to non-GAAP 25

Slide 26: Thank you!
Thank you ! 26
Source: SEC EDGAR · 8-K filed Jun 8, 2015
More decks from Mead Johnson Nutrition CO
 Morgan Stanley Global Consumer & Retail Conference 201616 slides · Nov 15, 2016
 Barclays Global Consumer Staples Conference 201618 slides · Sep 7, 2016
 Q1 2016 Earnings Presentation20 slides · Apr 28, 2016
 FY2015 Earnings Presentation23 slides · Jan 28, 2016
 Q3 2015 Earnings Presentation26 slides · Oct 22, 2015
 Investor Day (October 2015)15 slides · Oct 22, 2015