Beverly National — Shareholder Meeting (May 2009)
18 slides from Beverly National's shareholder meeting presentation, May 28, 2009

Slide 1: Annual Meeting May 28, 2009 Beverly National Corporation
Annual Meeting May 28, 2009 Beverly National Corporation Exhibit 99.1

Slide 2: Agenda
Agenda Economic Update Industry Update 2008 Financial Performance 1 st Qtr 2009 Financial Performance Loan Portfolio and Asset Quality Review Challenges for 2009 Questions and Answers Agenda Economic Update Industry Update 2008 Financial Performance Qtr 2009 Financial Performance Loan Portfolio and

Slide 3: Economic Update
Economic Update Recession – December 2007 Interest Rate Stabilization Rising Unemployment Home Values and Sales Commercial Activity Economic Update Recession – December 2007 Interest Rate Stabilization Rising Unemployment Home Values and Sales Commercial Activity

Slide 4: Industry Update (cont.)
Industry Update (cont.) Bank Closures FDIC Insurance Premiums and Limits Stress Testing of Big Banks Capital Management Future of Regulatory Environment What Next? Industry Update Bank Closures FDIC Insurance Premiums and Limits Stress Testing of Big Banks Capital Management Future of Regulatory Env

Slide 5: 2008 In Review
2008 In Review Core Earnings Asset Quality Adjusting to Market Conditions Impact of Economic Uncertainty Back to Basics 2008 In Review Core Earnings Asset Quality Adjusting to Market Conditions Impact of Economic Uncertainty Back to Basics

Slide 6: Financial Highlights
Financial Highlights 9.89% 3.79% 9.68% 3.74% 8.45% 3.95% Capital to Asset Ratio Net Interest Margin $46,178 $45,765 $41,038 Total Capital $16.93 $17.38 $15.41 Book Value (at end of period) $47,000 $59,616 $84,425 Borrowed Funds $16,372 $11,638 $13,289 Repurchase Agreements $467,144 $472,791 $485,505

Slide 7: Net Income Analysis
Net Income Analysis $0 $4,118 Non-recurring items, net of tax $3,570 $3,951 Adjusted Net Income $3,570 ($167) Net Income as reported 12/31/07 12/31/08 ($ in thousands except per share data) (0.38)% (0.03)% $0 ($.06) As reported Adjusted 0.77% 0.82% ROA 8.88% $1.48 $1.48 7.69% ROE $1.30 Fully diluted

Slide 8: 1st Qtr 2009 Financial Performance
2009 2009 st Qtr Financial Performance Qtr Financial Performance

Slide 9: Financial Highlights
8.45% 3.95% $15.41 $41,038 $13,289 $84,425 $339,533 $338,766 $108,262 $485,505 12/31/08 9.46% 3.79% 8.61% 4.35% Capital to Asset Ratio Net Interest Margin $46,153 $41,752 Total Capital $17.33 $15.68 Book Value (at end of period) $67,715 $58,062 Borrowed Funds $9,746 $27,956 Repurchase Agreements $48

Slide 10: Net Income Analysis
$283 $367 Income Taxes $3,942 $4,160 Non-interest Expense $1,193 $1,292 Income before Income Taxes $3,953 $4,488 Net after Provision for Loan Losses $1,182 $964 Non-interest Income $6,708 $6,280 Interest and Dividend Income $925 $225 $4,713 $1,567 03/31/09 (unaudited) $910 $128 $4,081 $2,627 03/31/0

Slide 11: Net Income Analysis
03/31/08 (unaudited) 03/31/09 (unaudited) 7.92% 8.97% Return on Average Equity $0.34 $0.34 0.77% $0.35 $0.35 0.77% EPS Basic Diluted Return on Average Assets Net Income Analysis 03/31/08 (unaudited) 03/31/09 (unaudited) 7.92% 8.97% Return on Average Equity $0.34 $0.34 0.77% $0.35 $0.35 0.77% EPS Bas
Slide 12: Loan Composition
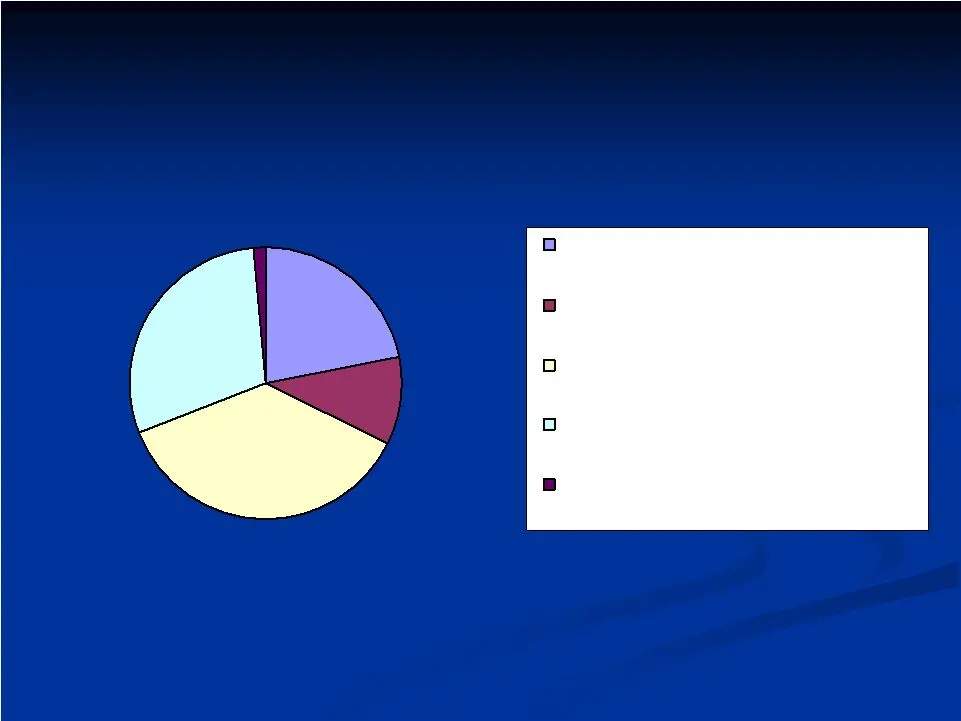
22% 10% 37% 30% 1% Loan Composition ($ in millions) Total Residential Mortgages Total Consumer Loans & Home Equity Commercial & Industrial + Owner-Occupied Comm'l RE Total Commercial Mortgages (Non- Owner Occupied Real Estate) Total Commercial Construction Loans Loan Composition ($ in millions)
Slide 13: Commercial & Industrial by Industry Segment
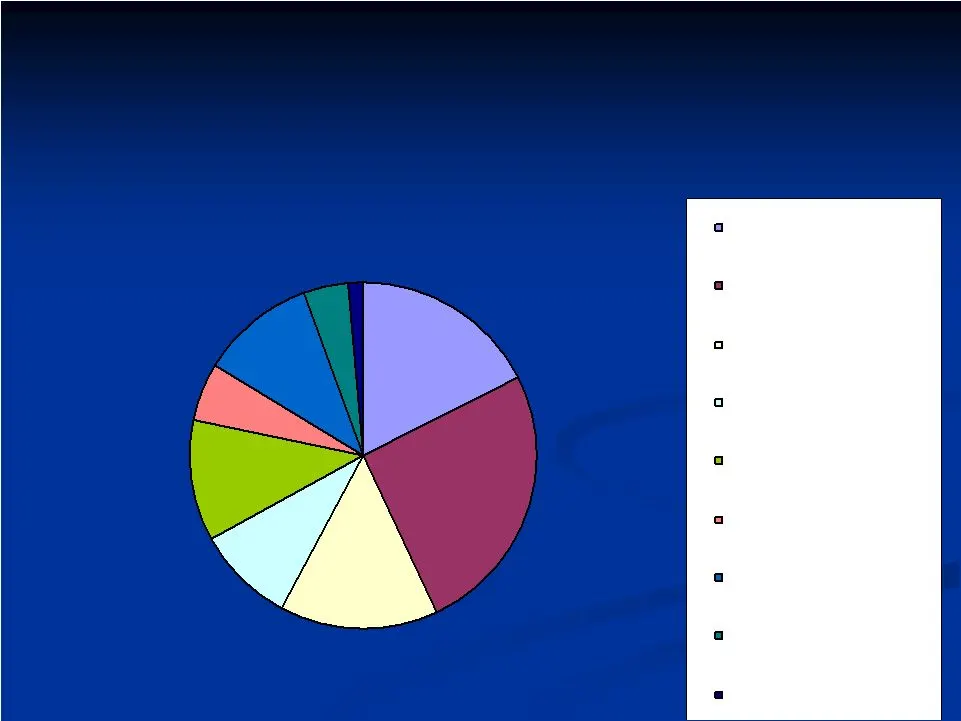
Commercial & Industrial by Industry Segment ($ in millions) 18% 26% 15% 9% 11% 5% 11% 4% 1% Commercial & Industrial by Industry Segment ($ in millions) Schools/Educational Facilities Retail Sales Medical (Healthcare) Manufacturing Professional Services Small Contractors/ Developers Restaurants/ Fran

Slide 14: Allowance for Loan Loss
Allowance for Loan Loss $2 0.0% $960 $0 0.36% $585 $2,514 0.9% $269,770 $(252) 2005 $16 0.01% $1,118 $0 0.37% $590 $3,044 1.0% $305,711 $(3) 2006 $529 0.22% $942 $0 0.40% $560 $2,181 0.9% $236,811 $(562) 2004 $174 0.05% $2,200 $0 .71% $225 $4,385 1.3% $337,312 ($1) 2009 1 st Qtr $259 0.08% $2,293 $1
Slide 15: Deposit Composition
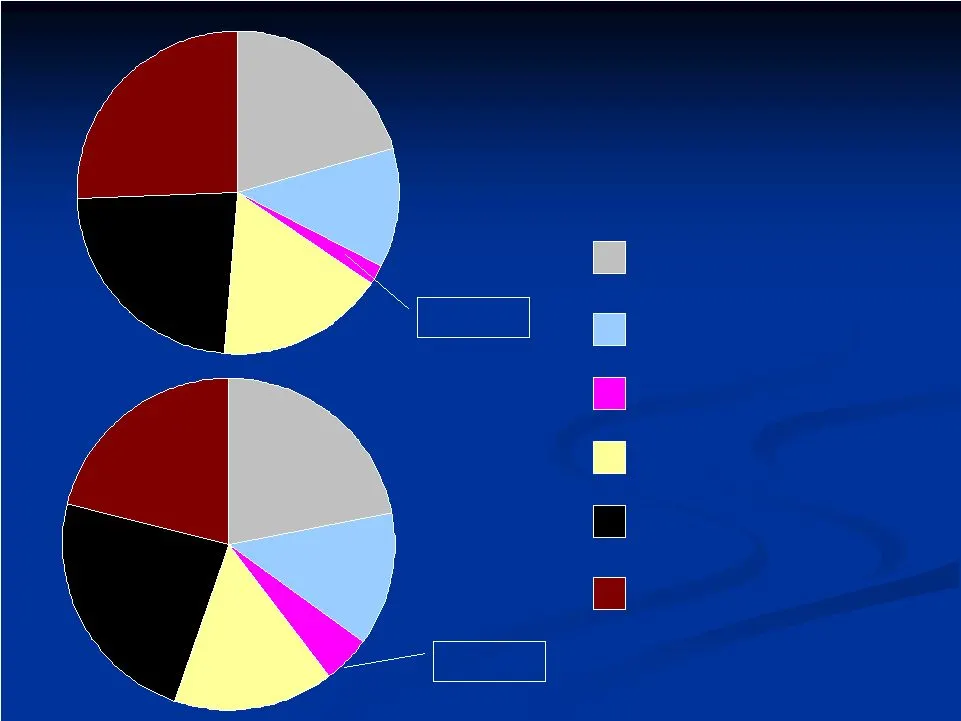
Deposit Composition Demand Deposits Regular Savings NOW Money Market Time Deposits 2007 2008 25.4 % 23.3 % 23.6% 21.2 % 1.9% E-Savings 4.8% Deposit Composition 20.7 % 11.9 % 16.8 % 22.1 % 15.4 % 12.9 %

Slide 16: Challenges for 2009
Challenges for 2009 Rising Unemployment Continued Recession Potential Impact on CRE Regulatory Changes – Capital Requirements Special Assessments Challenges for 2009 Rising Unemployment Continued Recession Potential Impact on CRE Regulatory Changes – Capital Requirements Special Assessments

Slide 17: Forward-looking statements
*Statements contained in this presentation may contain forward-looking statements within the meaning of the Private Securities Litigation Reform Act of 1995. These statements are based on the beliefs and expectations of management as well as the assumptions made using information currently available

Slide 18: Questions and Answers
Questions and Answers Questions and Answers
Source: SEC EDGAR · 8-K filed May 28, 2009