Spirit Realty Capital — Q4 2017 Earnings Presentation
29 slides from Spirit Realty Capital's earnings presentation, Feb 22, 2018
Slide 1: Supplemental Financial & Operating Information Fourth Quarter Ended December 31, 2017
Supplemental Financial & Operating Information FOURTH QUARTER ENDED DECEMBER 31, 2017
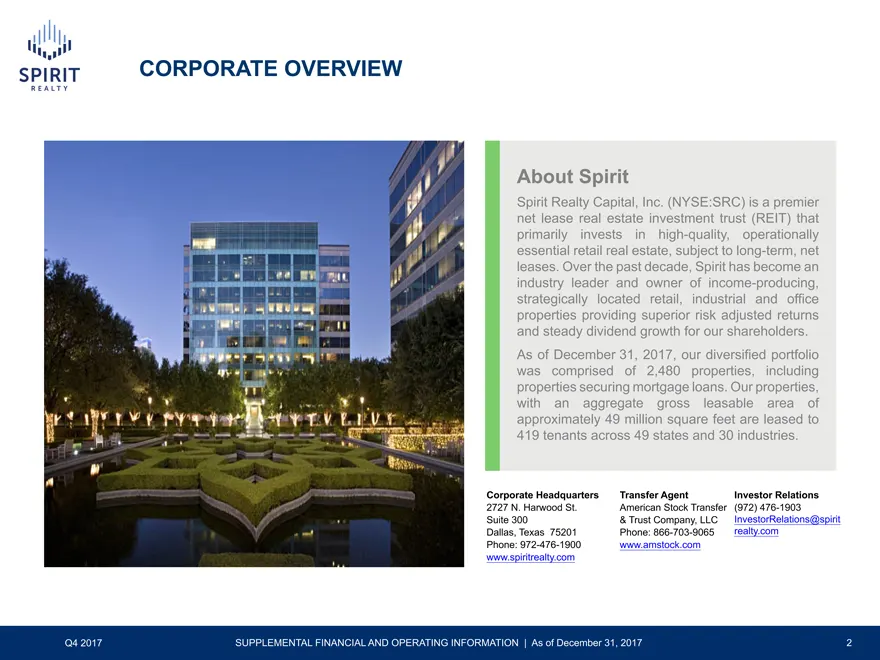
Slide 2: Corporate Overview
CORPORATE OVERVIEW About Spirit Spirit Realty Capital, Inc. (NYSE:SRC) is a premier net lease real estate investment trust (REIT) that primarily invests in high-quality, operationally essential retail real estate, subject to long-term, net leases. Over the past decade, Spirit has become an industry
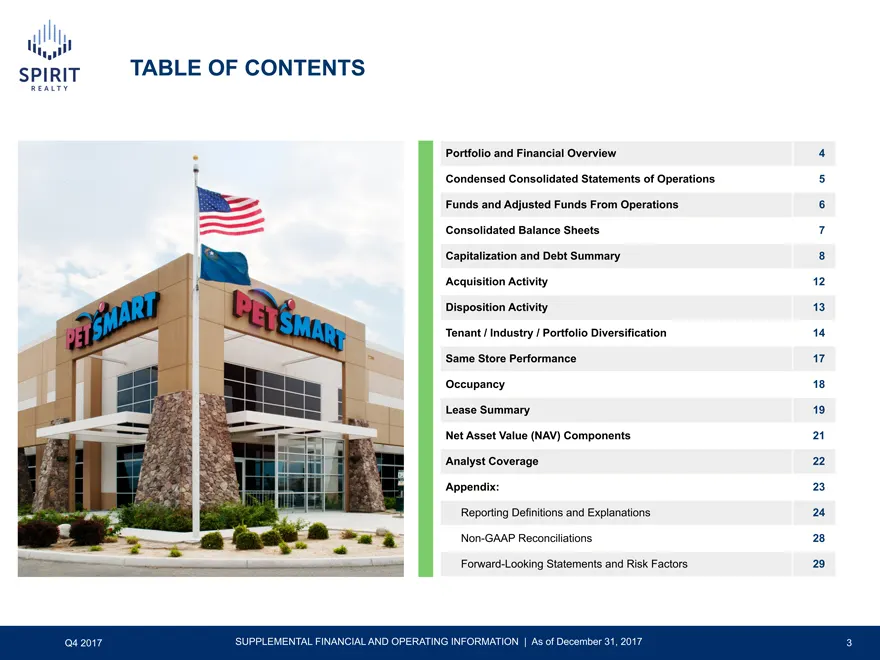
Slide 3: Table of Contents
TABLE OF CONTENTS Portfolio and Financial Overview 4 Condensed Consolidated Statements of Operations 5 Funds and Adjusted Funds From Operations 6 Consolidated Balance Sheets 7 Capitalization and Debt Summary 8 Acquisition Activity 12 Disposition Activity 13 Tenant / Industry / Portfolio Diversificat
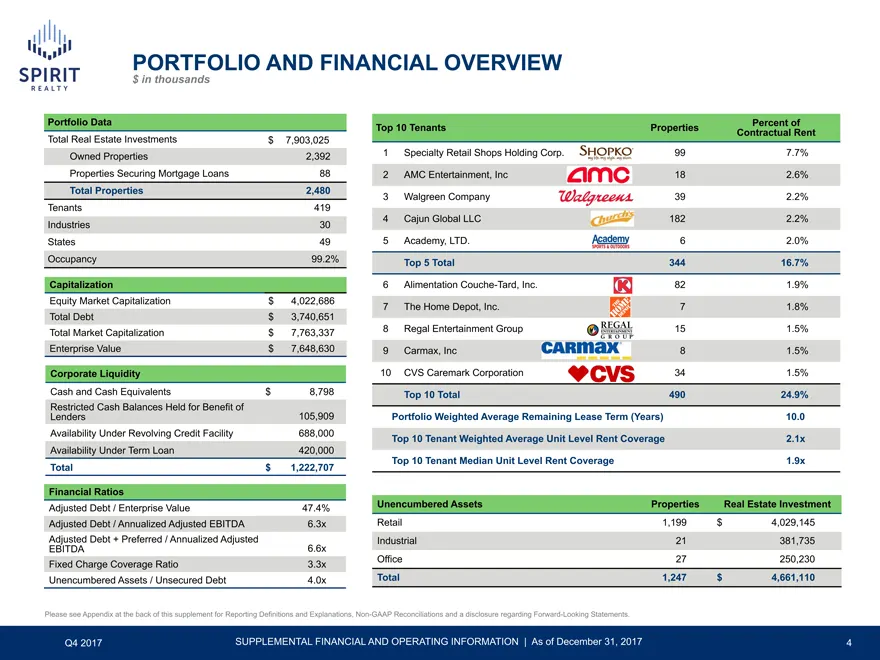
Slide 4: Portfolio and Financial Overview
PORTFOLIO AND FINANCIAL OVERVIEW $ in thousands Portfolio Data Percent of Top 10 Tenants Properties Contractual Rent Total Real Estate Investments $ 7,903,025 Owned Properties 2,392 1 Specialty Retail Shops Holding Corp. 99 7.7% Properties Securing Mortgage Loans 88 2 AMC Entertainment, Inc 18 2.6%
Slide 5: Condensed Consolidated Statements of Operations
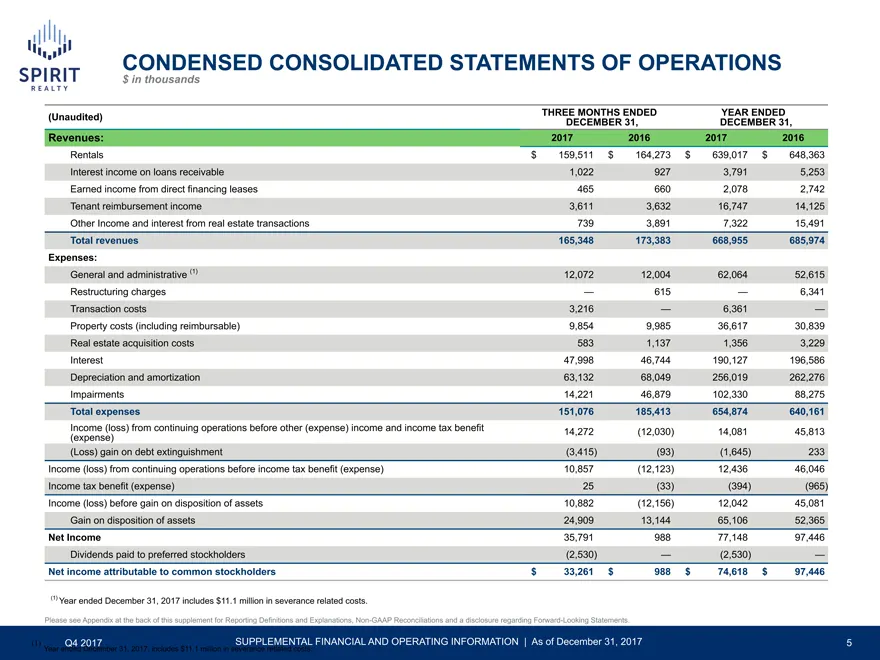
CONDENSED CONSOLIDATED STATEMENTS OF OPERATIONS $ in thousands (Unaudited) THREE MONTHS ENDED YEAR ENDED DECEMBER 31, DECEMBER 31, Revenues: 2017 2016 2017 2016 Rentals $ 159,511 $ 164,273 $ 639,017 $ 648,363 Interest income on loans receivable 1,022 927 3,791 5,253 Earned income from direct financi
Slide 6: Funds and Adjusted Funds From Operations (FFO/AFFO)
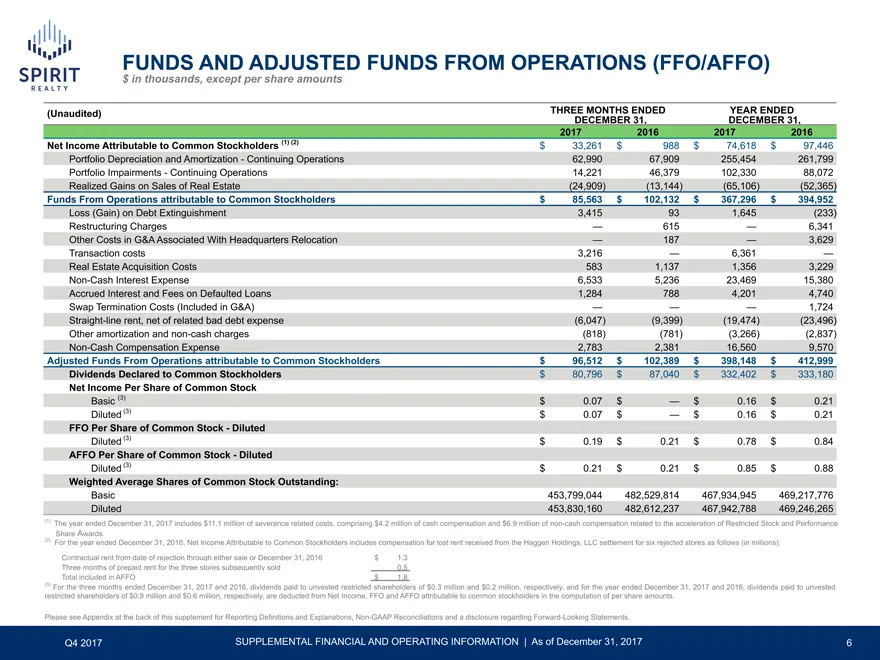
FUNDS AND ADJUSTED FUNDS FROM OPERATIONS (FFO/AFFO) $ in thousands, except per share amounts (Unaudited) THREE MONTHS ENDED YEAR ENDED DECEMBER 31, DECEMBER 31, 2017 2016 2017 2016 Net Income Attributable to Common Stockholders (1) (2) $ 33,261 $ 988 $ 74,618 $ 97,446 Portfolio Depreciation and Amor
Slide 7: Consolidated Balance Sheets
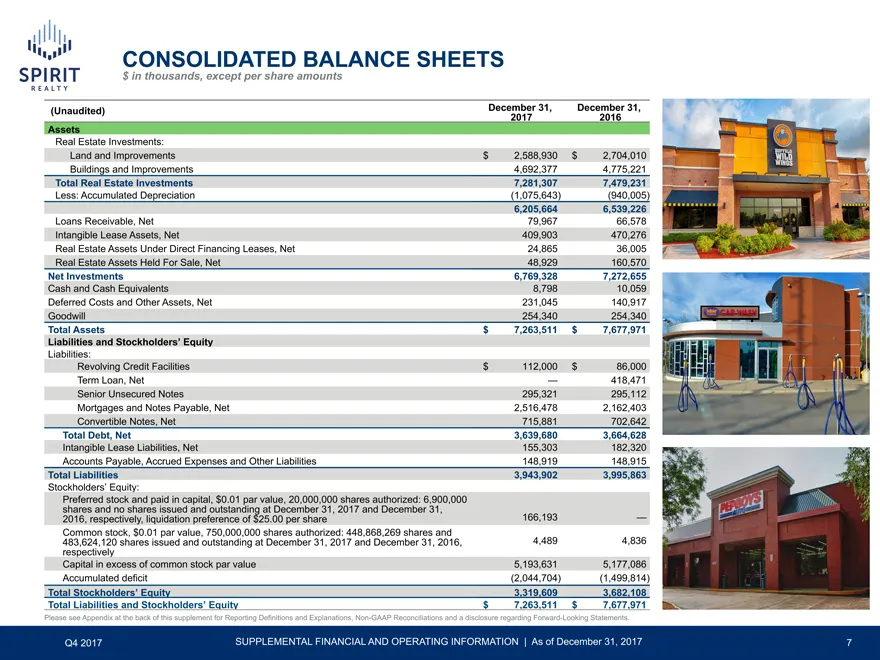
CONSOLIDATED BALANCE SHEETS $ in thousands, except per share amounts (Unaudited) December 31, December 31, 2017 2016 Assets Real Estate Investments: Land and Improvements $ 2,588,930 $ 2,704,010 Buildings and Improvements 4,692,377 4,775,221 Total Real Estate Investments 7,281,307 7,479,231 Less: Ac
Slide 8: Capitalization
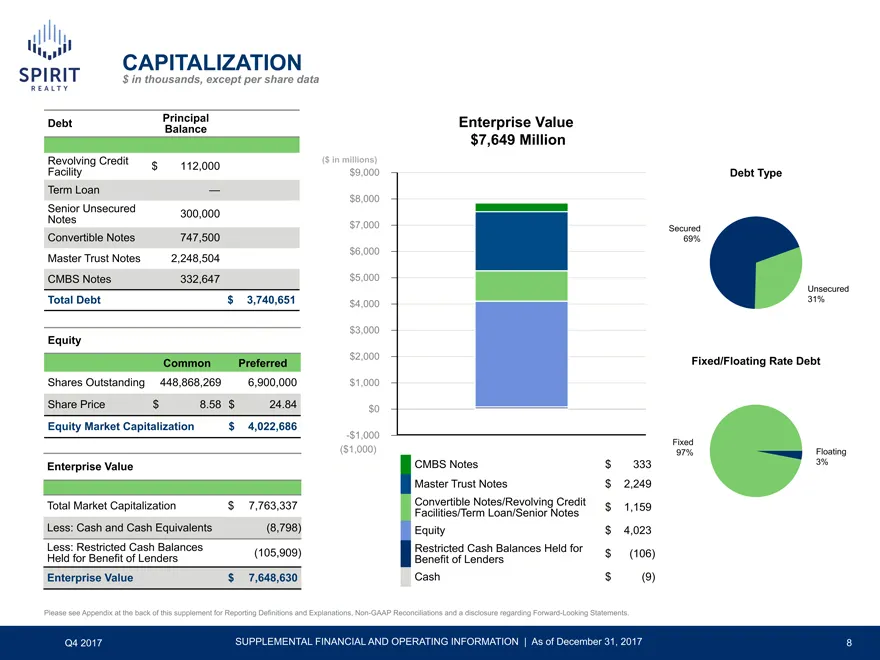
CAPITALIZATION $ in thousands, except per share data Debt Principal Enterprise Value Balance $7,649 Million Revolving Credit ($ in millions) $ 112,000 Facility $9,000 Debt Type Term Loan — $8,000 Senior Unsecured 300,000 Notes $7,000 Secured Convertible Notes 747,500 69% $6,000 Master Trust Notes 2,
Slide 9: Debt Summary
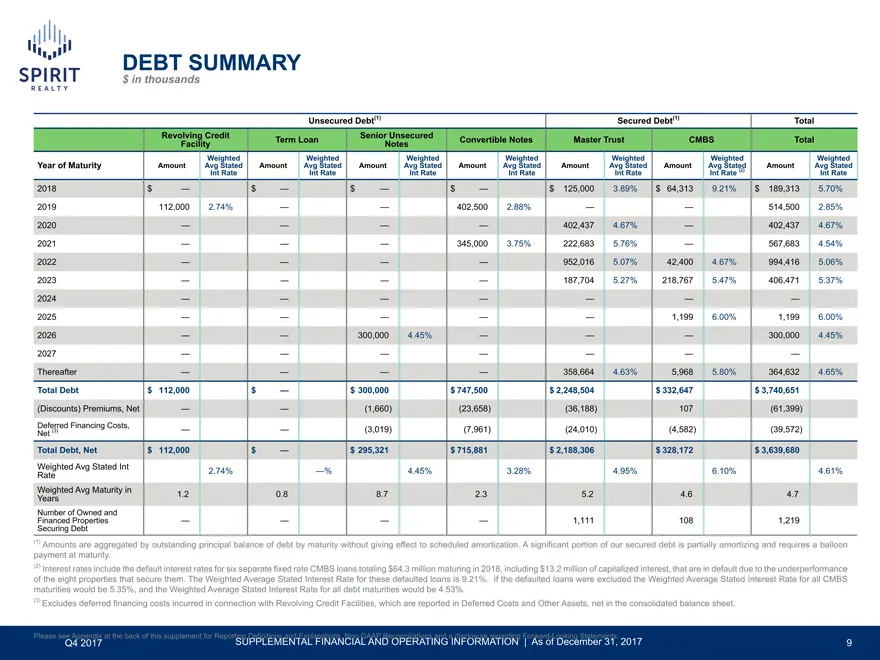
DEBT SUMMARY $ in thousands Unsecured Debt(1) Secured Debt(1) Total Revolving Credit Senior Unsecured Term Loan Convertible Notes Master Trust CMBS Total Facility Notes Weighted Weighted Weighted Weighted Weighted Weighted Weighted Year of Maturity Amount Avg Stated Amount Avg Stated Amount Avg Stat
Slide 10: Debt Maturities by Quarter
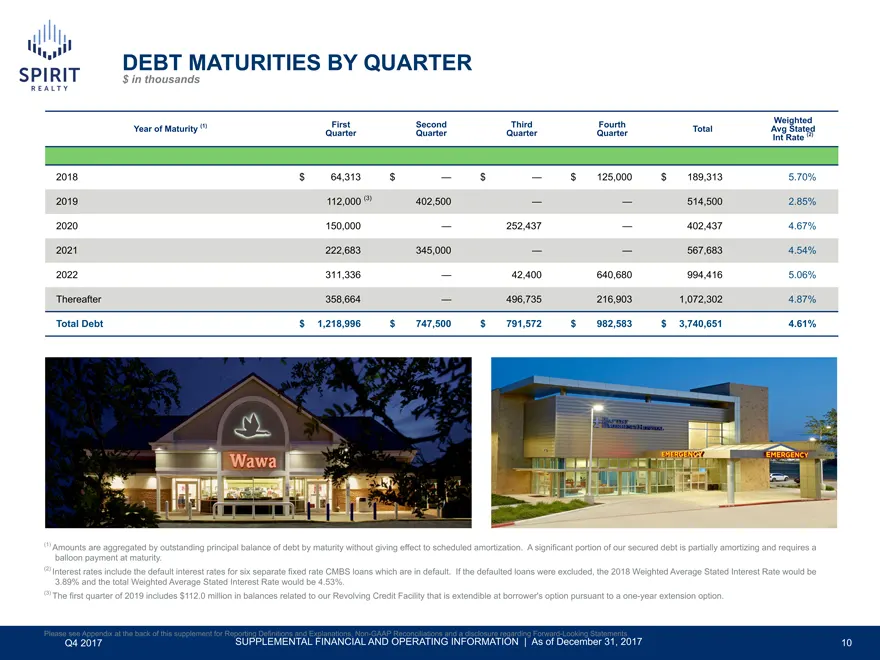
DEBT MATURITIES BY QUARTER $ in thousands Weighted Year of Maturity (1) First Second Third Fourth Total Avg Stated Quarter Quarter Quarter Quarter (2) Int Rate 2018 $ 64,313 $ — $ — $ 125,000 $ 189,313 5.70% 2019 112,000 (3) . 402,500 — — 514,500 2.85% 2020 150,000 — 252,437 — 402,437 4.67% 2021 222
Slide 11: Senior Unsecured Notes Covenant Compliance
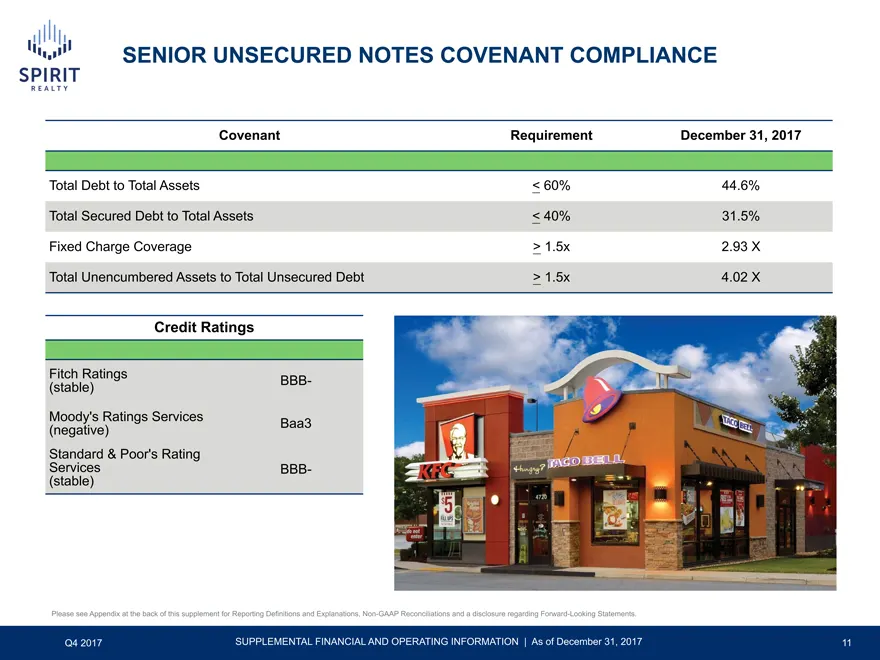
SENIOR UNSECURED NOTES COVENANT COMPLIANCE Covenant Requirement December 31, 2017 Total Debt to Total Assets < 60% 44.6% Total Secured Debt to Total Assets < 40% 31.5% Fixed Charge Coverage > 1.5x 2.93 X Total Unencumbered Assets to Total Unsecured Debt > 1.5x 4.02 X Credit Ratings Fitch Ratings BBB
Slide 12: Acquisition Activity
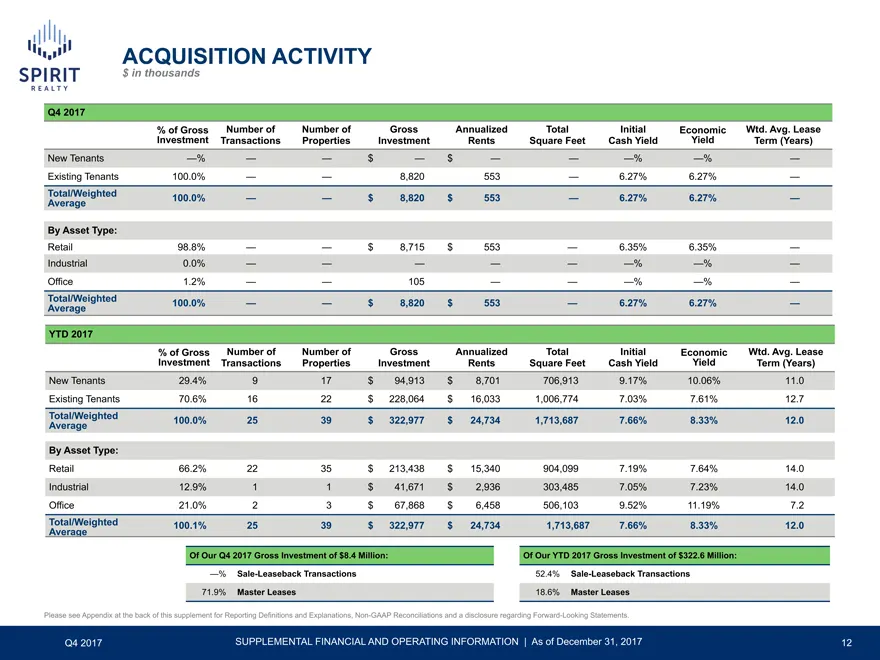
ACQUISITION ACTIVITY $ in thousands Q4 2017 % of Gross Number of Number of Gross Annualized Total Initial Economic Wtd. Avg. Lease Investment Transactions Properties Investment Rents Square Feet Cash Yield Yield Term (Years) New Tenants —% — — $ — $ — — —% —% — Existing Tenants 100.0% — — 8,820 553
Slide 13: Disposition Activity
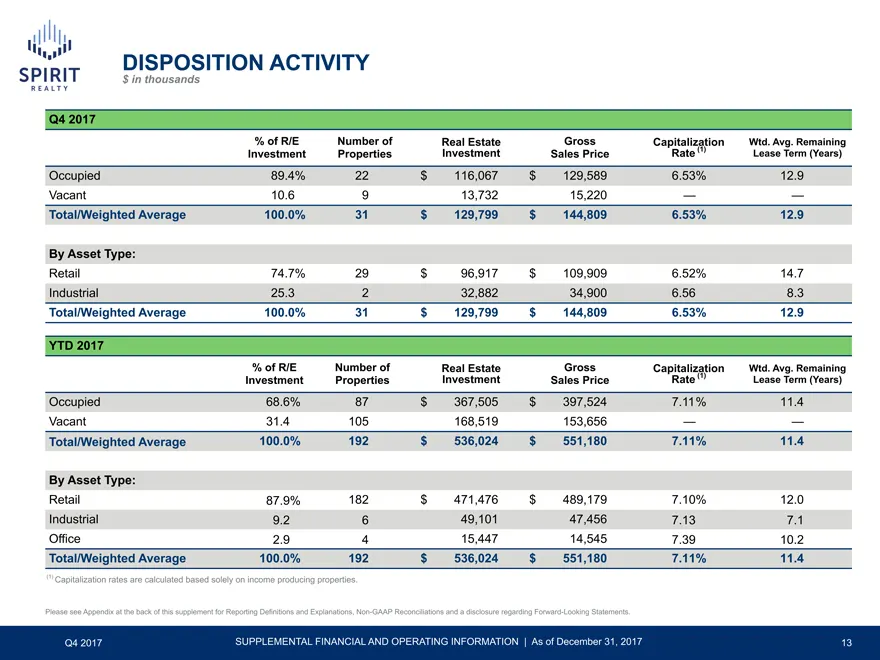
ACQUISITION ACTIVITY $ in thousands Q4 2017 % of Gross Number of Number of Gross Annualized Total Initial Economic Wtd. Avg. Lease Investment Transactions Properties Investment Rents Square Feet Cash Yield Yield Term (Years) New Tenants —% — — $ — $ — — —% —% — Existing Tenants 100.0% — — 8,820 553
Slide 14: Tenant Diversification – Top Tenants
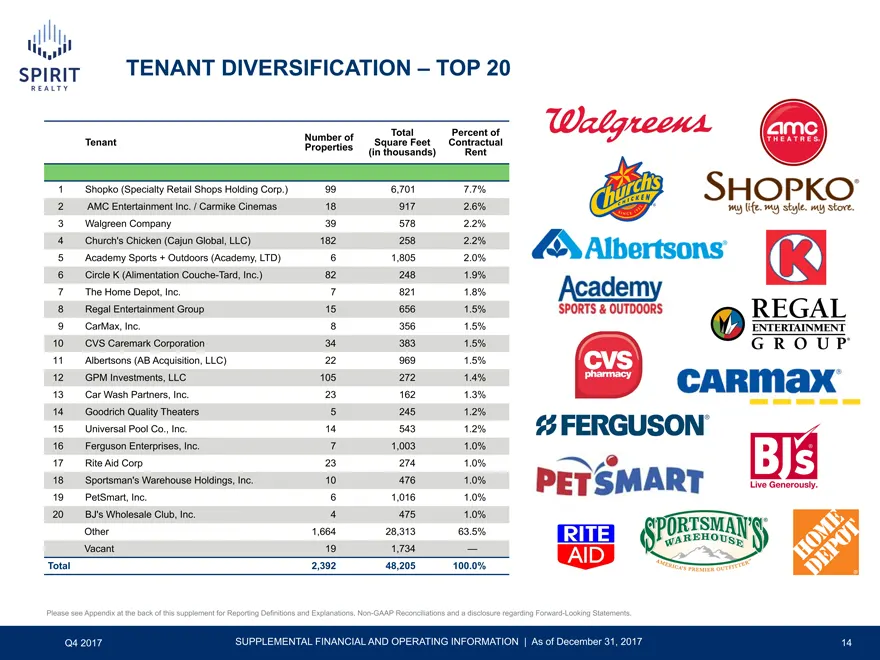
TENANT DIVERSIFICATION – TOP 20 Number of Total Percent of Tenant Square Feet Contractual Properties (in thousands) Rent 1 Shopko (Specialty Retail Shops Holding Corp.) 99 6,701 7.7% 2 AMC Entertainment Inc. / Carmike Cinemas 18 917 2.6% 3 Walgreen Company 39 578 2.2% 4 Church’s Chicken (Cajun Globa
Slide 15: Industry Diversification
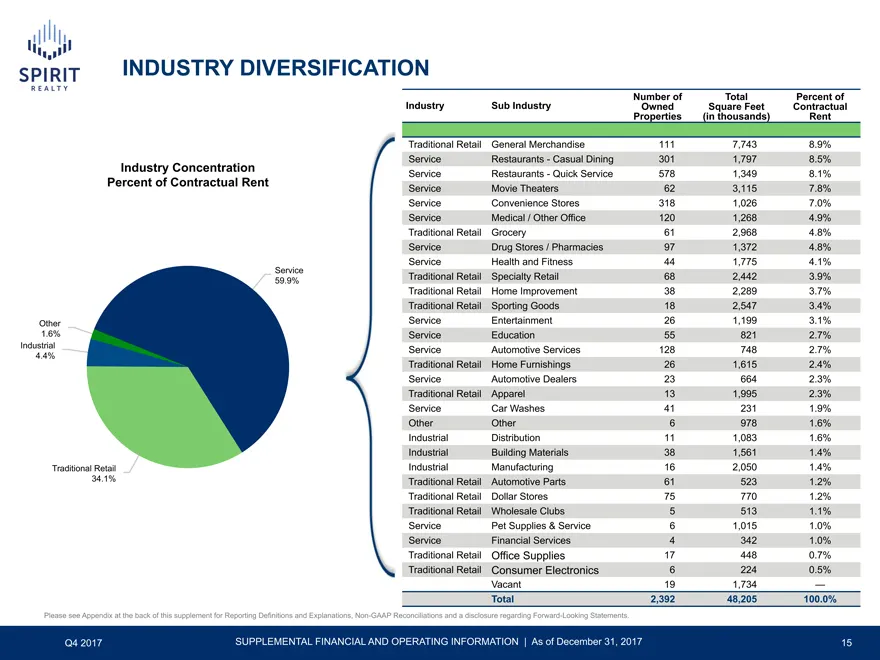
INDUSTRY DIVERSIFICATION Number of Total Percent of Industry Sub Industry Owned Square Feet Contractual Properties (in thousands) Rent Traditional Retail General Merchandise 111 7,743 8.9% Service Restaurants—Casual Dining 301 1,797 8.5% Industry Concentration Service Restaurants—Quick Service 578 1
Slide 16: Portfolio Diversification
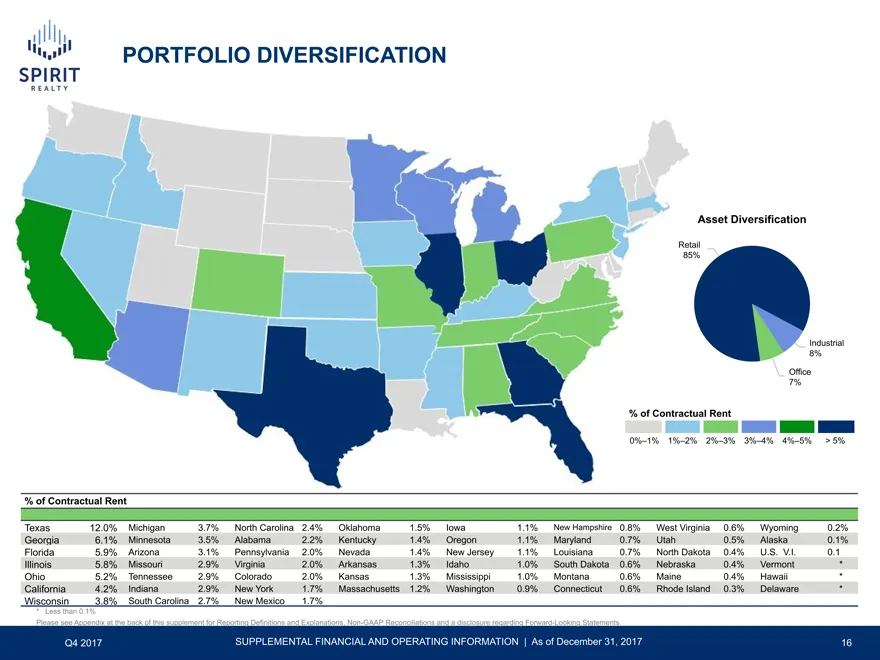
PORTFOLIO DIVERSIFICATION Asset Diversification Retail 85% Industrial 8% Office 7% % of Contractual Rent 0%–1% 1%–2% 2%–3% 3%–4% 4%–5% > 5% % of Contractual Rent Texas 12.0% Michigan 3.7% North Carolina 2.4% Oklahoma 1.5% Iowa 1.1% New Hampshire 0.8% West Virginia 0.6% Wyoming 0.2% Georgia 6.1% Minn
Slide 17: Same Store Performance
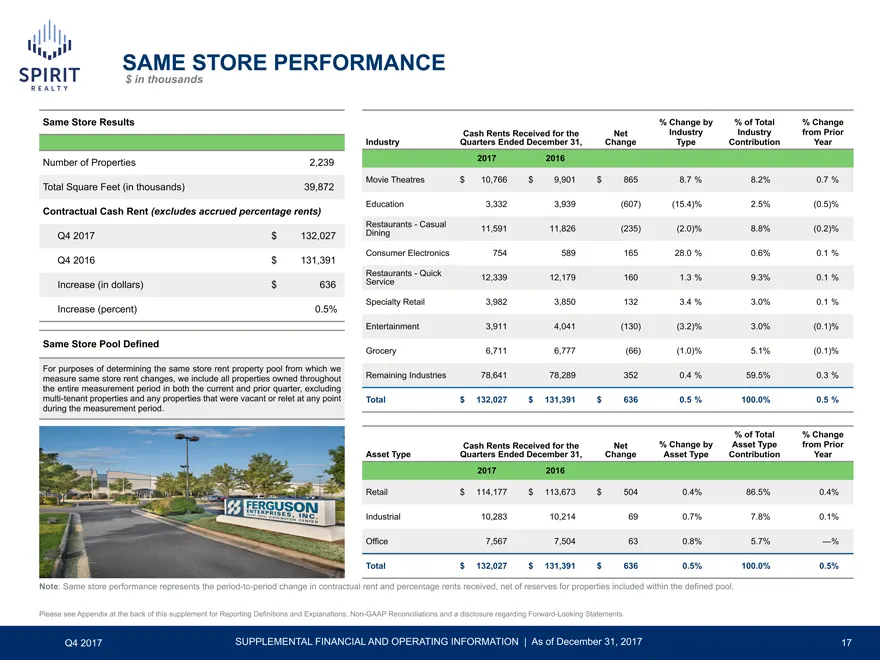
SAME STORE PERFORMANCE $ in thousands Same Store Results % Change by % of Total % Change Cash Rents Received for the Net Industry Industry from Prior Industry Quarters Ended December 31, Change Type Contribution Year Number of Properties 2,239 2017 2016 Movie Theatres $ 10,766 $ 9,901 $ 865 8.7 % 8.
Slide 18: Occupancy
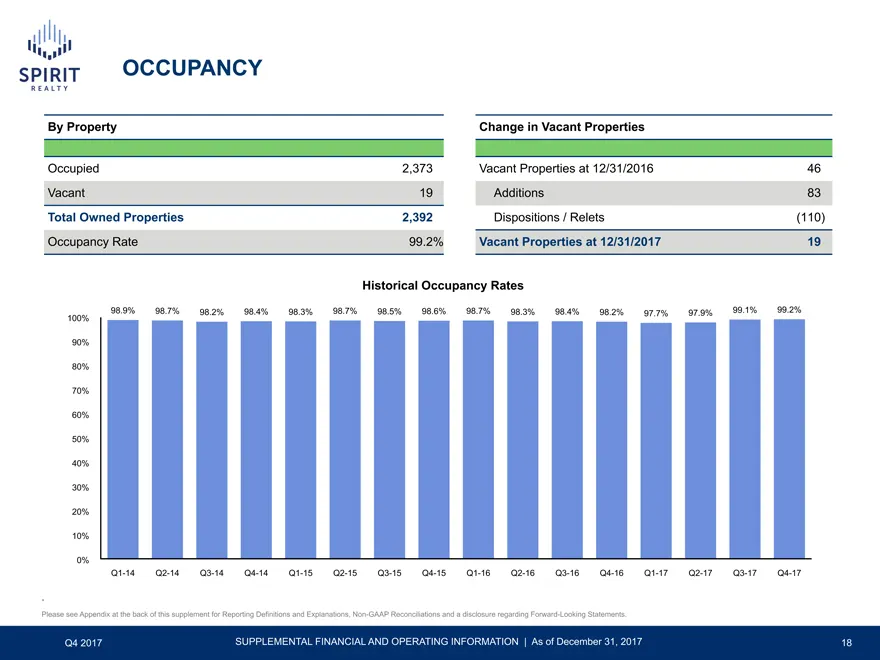
OCCUPANCY By Property Change in Vacant Properties Occupied 2,373 Vacant Properties at 12/31/2016 46 Vacant 19 Additions 83 Total Owned Properties 2,392 Dispositions / Relets (110) Occupancy Rate 99.2% Vacant Properties at 12/31/2017 19 Historical Occupancy Rates 98.9% 98.7% 98.2% 98.4% 98.3% 98.7% 9
Slide 19: Lease Structure and Expirations
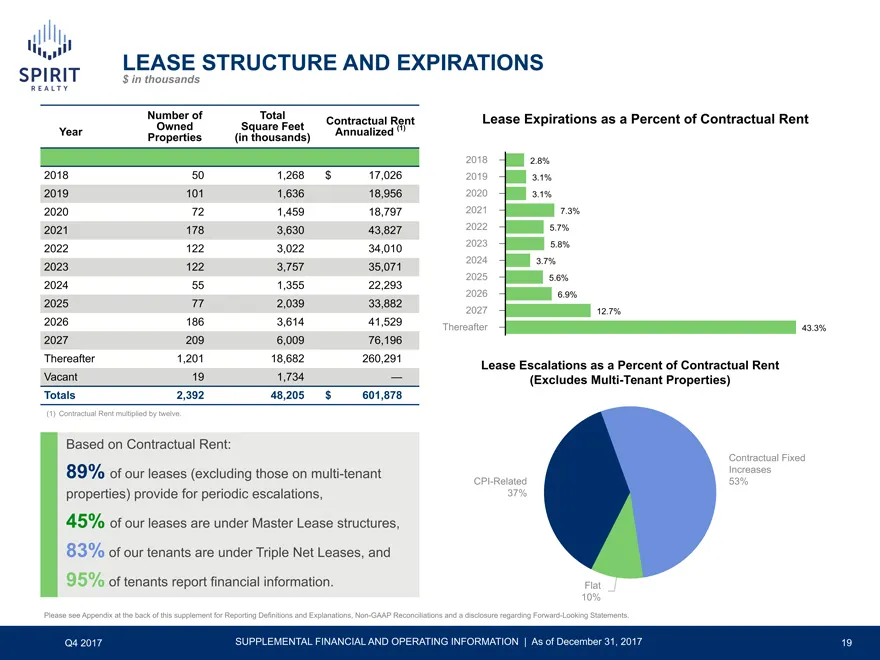
LEASE STRUCTURE AND EXPIRATIONS $ in thousands Number of Total Contractual Rent Lease Expirations as a Percent of Contractual Rent Owned Square Feet (1) Year Annualized Properties (in thousands) 2018 2.8% 2018 50 1,268 $ 17,026 2019 3.1% 2019 101 1,636 18,956 2020 3.1% 2020 72 1,459 18,797 2021 7.3%
Slide 20: Lease Activity
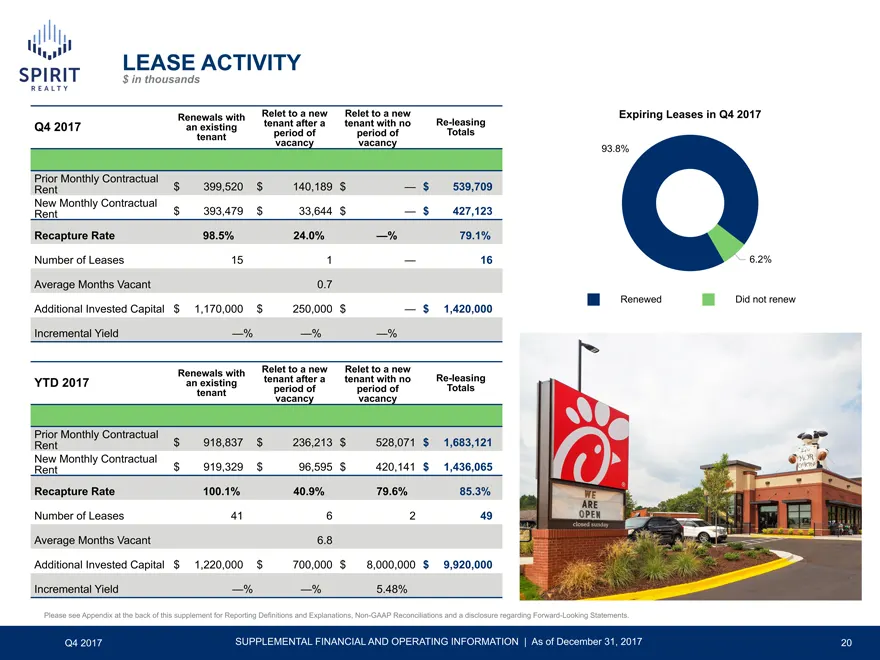
LEASE ACTIVITY $ in thousands Renewals with Relet to a new Relet to a new Expiring Leases in Q4 2017 Q4 2017 an existing tenant after a tenant with no Re-leasing tenant period of period of Totals vacancy vacancy 93.8% Prior Monthly Contractual Rent $ 399,520 $ 140,189 $ — $ 539,709 New Monthly Contr
Slide 21: Net Asset Value (NAV) Components
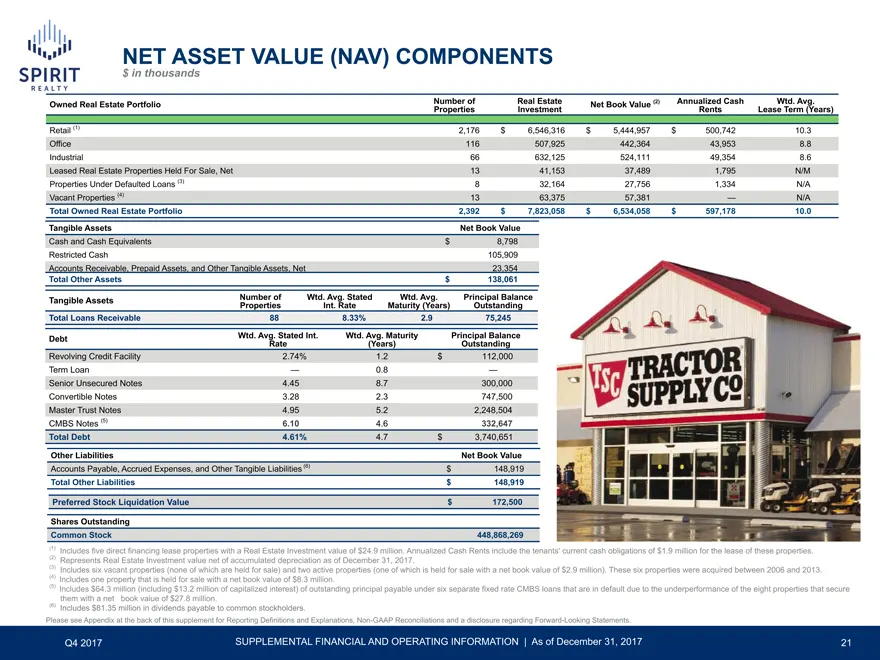
NET ASSET VALUE (NAV) COMPONENTS $ in thousands Number of Real Estate (2) Annualized Cash Wtd. Avg. Owned Real Estate Portfolio Net Book Value Properties Investment Rents Lease Term (Years) Retail (1) 2,176 $ 6,546,316 $ 5,444,957 $ 500,742 10.3 Office 116 507,925 442,364 43,953 8.8 Industrial 66 63
Slide 22: Analyst Coverage
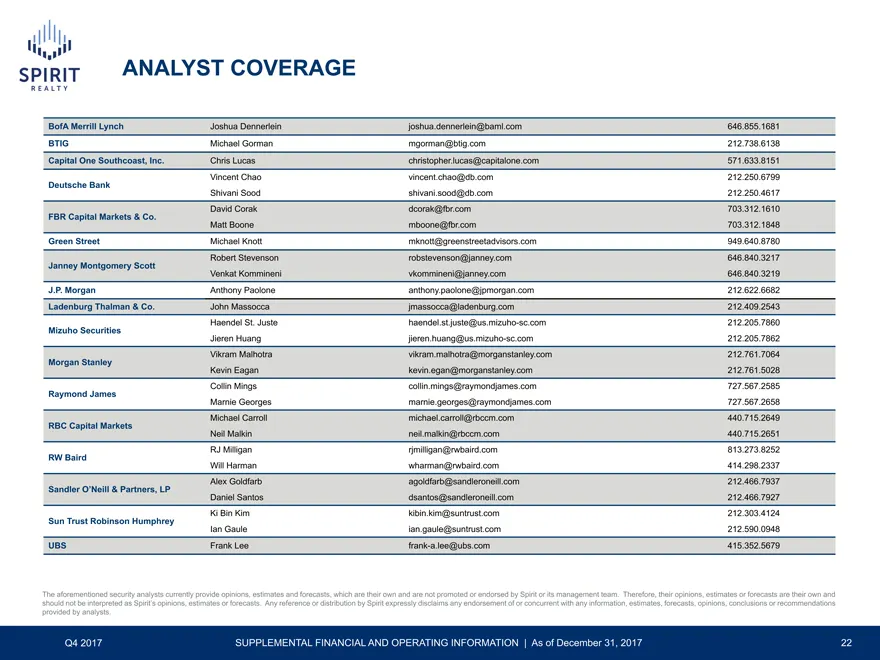
ANALYST COVERAGE BofA Merrill Lynch Joshua Dennerlein joshua.dennerlein@baml.com 646.855.1681 BTIG Michael Gorman mgorman@btig.com 212.738.6138 Capital One Southcoast, Inc. Chris Lucas christopher.lucas@capitalone.com 571.633.8151 Vincent Chao vincent.chao@db.com 212.250.6799 Deutsche Bank Shivani S
Slide 23: Appendix
Appendix Q4 20167 SUPPLEMENTAL FINANCIAL AND OPERATING INFORMATION | As of December 31, 2017 23
Slide 24: Reporting Definitions and Explanations
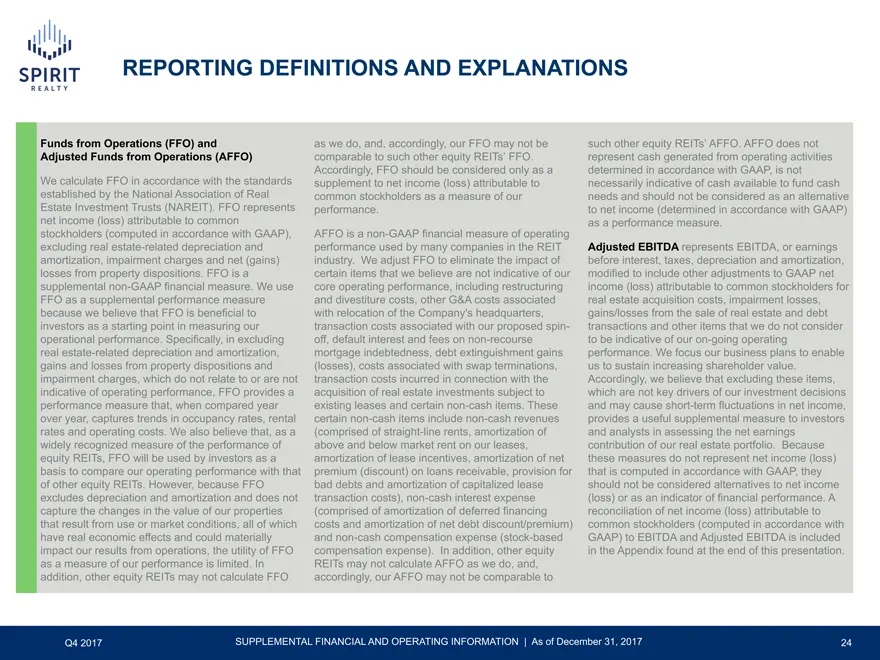
REPORTING DEFINITIONS AND EXPLANATIONS Funds from Operations (FFO) and as we do, and, accordingly, our FFO may not be such other equity REITs’ AFFO. AFFO does not Adjusted Funds from Operations (AFFO) comparable to such other equity REITs’ FFO. represent cash generated from operating activities Acco
Slide 25: Reporting Definitions and Explanations
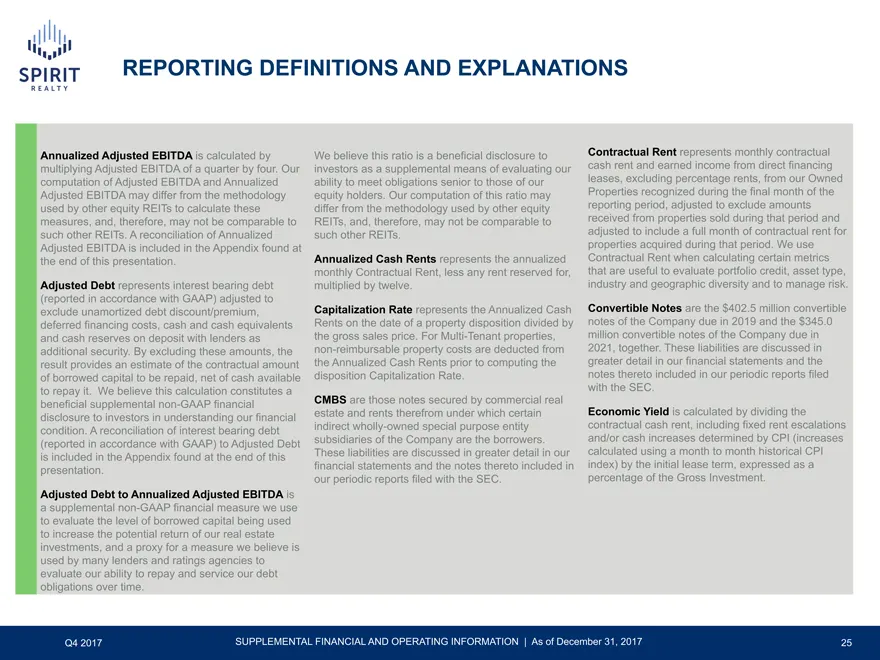
REPORTING DEFINITIONS AND EXPLANATIONS Annualized Adjusted EBITDA is calculated by We believe this ratio is a beneficial disclosure to Contractual Rent represents monthly contractual multiplying Adjusted EBITDA of a quarter by four. Our investors as a supplemental means of evaluating our cash rent a
Slide 26: Reporting Definitions and Explanations
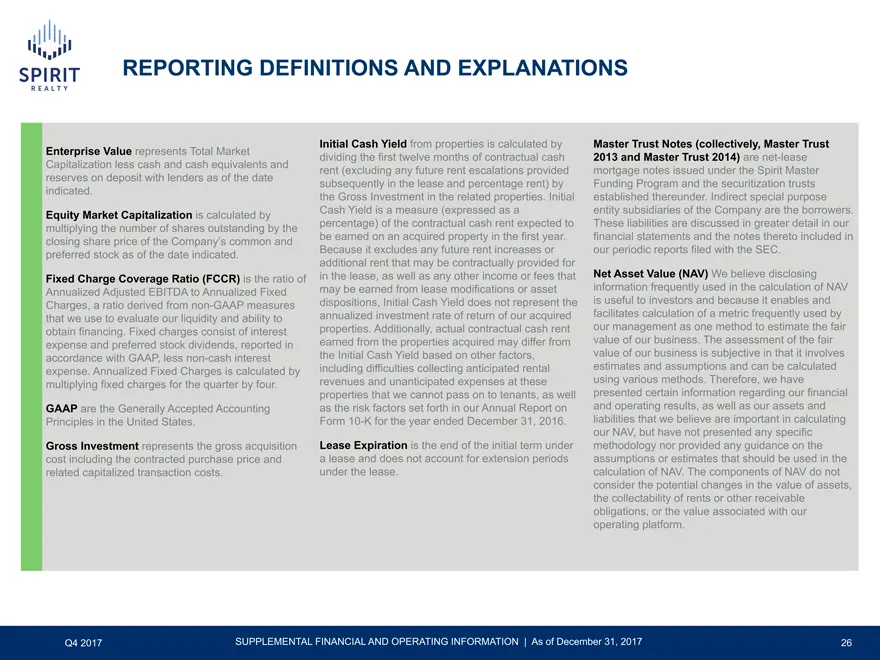
REPORTING DEFINITIONS AND EXPLANATIONS Initial Cash Yield from properties is calculated by Master Trust Notes (collectively, Master Trust Enterprise Value represents Total Market dividing the first twelve months of contractual cash 2013 and Master Trust 2014) are net-lease Capitalization less cash a
Slide 27: Reporting Definitions and Explanations
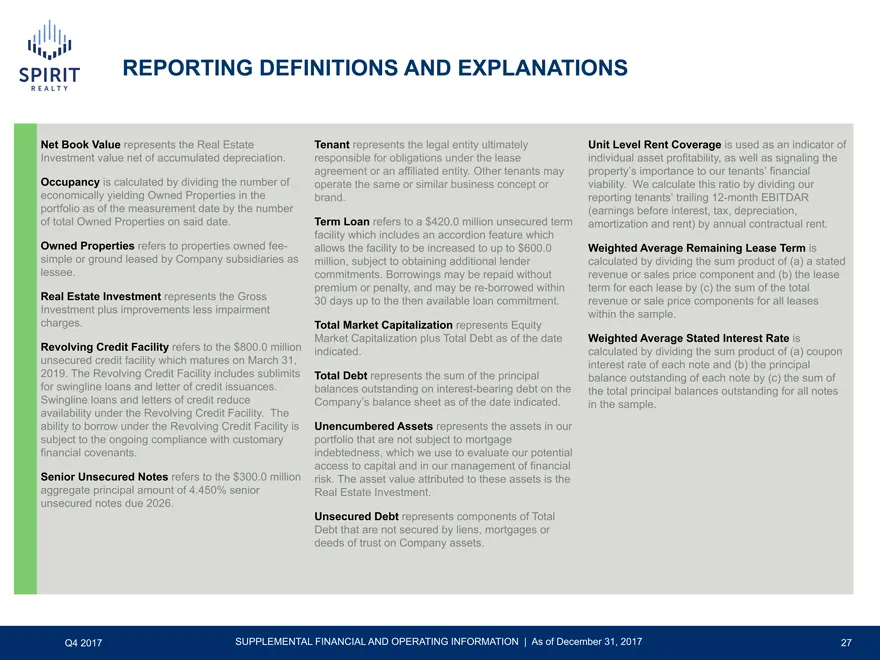
REPORTING DEFINITIONS AND EXPLANATIONS Net Book Value represents the Real Estate Tenant represents the legal entity ultimately Unit Level Rent Coverage is used as an indicator of Investment value net of accumulated depreciation. responsible for obligations under the lease individual asset profitabil
Slide 28: Non-GAAP Reconciliations
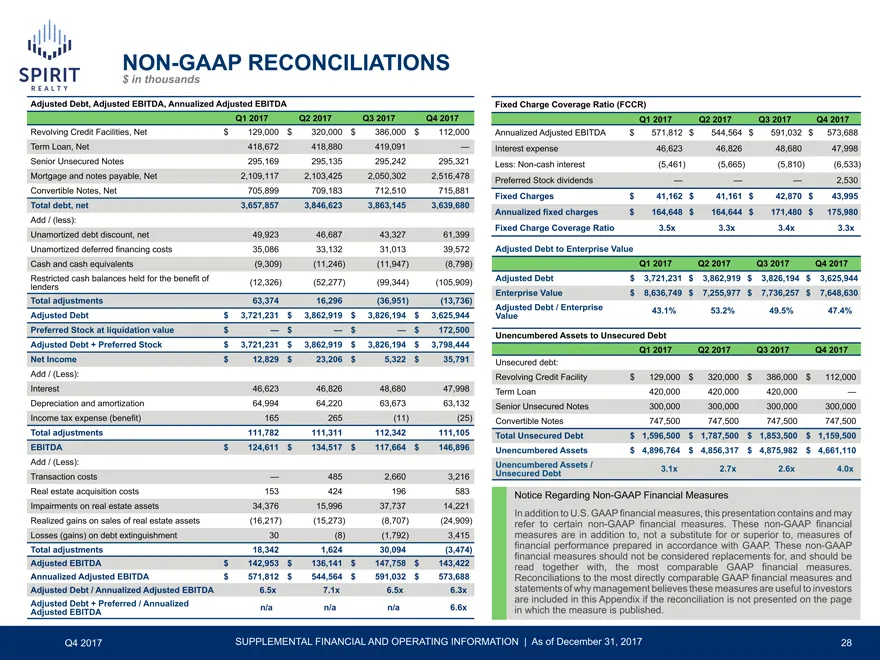
NON-GAAP RECONCILIATIONS $ in thousands Adjusted Debt, Adjusted EBITDA, Annualized Adjusted EBITDA Fixed Charge Coverage Ratio (FCCR) Q1 2017 Q2 2017 Q3 2017 Q4 2017 Q1 2017 Q2 2017 Q3 2017 Q4 2017 Revolving Credit Facilities, Net $ 129,000 $ 320,000 $ 386,000 $ 112,000 Annualized Adjusted EBITDA $
Slide 29: Forward-Looking Statements and Risk Factors
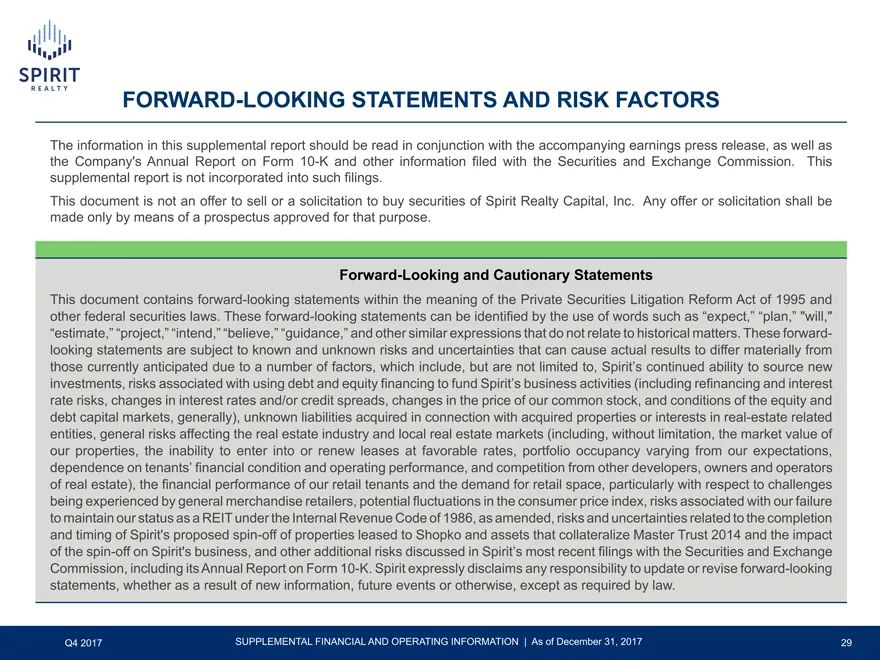
FORWARD-LOOKING STATEMENTS AND RISK FACTORS The information in this supplemental report should be read in conjunction with the accompanying earnings press release, as well as the Company’s Annual Report on Form 10-K and other information filed with the Securities and Exchange Commission. This supple
Source: SEC EDGAR · 8-K filed Feb 22, 2018
More decks from Spirit Realty Capital Inc
 Q3 2023 Earnings Presentation28 slides · Nov 2, 2023
 Merger or Acquisition (October 2023)20 slides · Oct 30, 2023
 Q2 2023 Earnings Presentation26 slides · Aug 7, 2023
 Q2 2023 Earnings Presentation26 slides · August 2023
 Q1 2023 Earnings Presentation27 slides · May 3, 2023
 Q4 2022 Earnings Presentation31 slides · Feb 28, 2023