KORU Medical Systems, Inc. · NASDAQ:KRMD
KORU Medical Systems — Q3 2026 Earnings Presentation
15 slides from KORU Medical Systems's earnings presentation, Nov 10, 2026

Slide 1: KORU Medical Systems Q3 2026 Earnings Call
KORU Medical Systems Q3 2026 Earnings Call November 10, 2026
Slide 2: Forward Looking Statements
Forward Looking Statements This presentation contains forward-looking statements within the meaning of the Private Securities Litigation Reform Act of 1995 that involve risks and uncertainties. All statements that are not historical fact are forward-looking statements. Forward-looking statements dis
Slide 3: Global Leader in Large-Volume Subcutaneous Drug Delivery
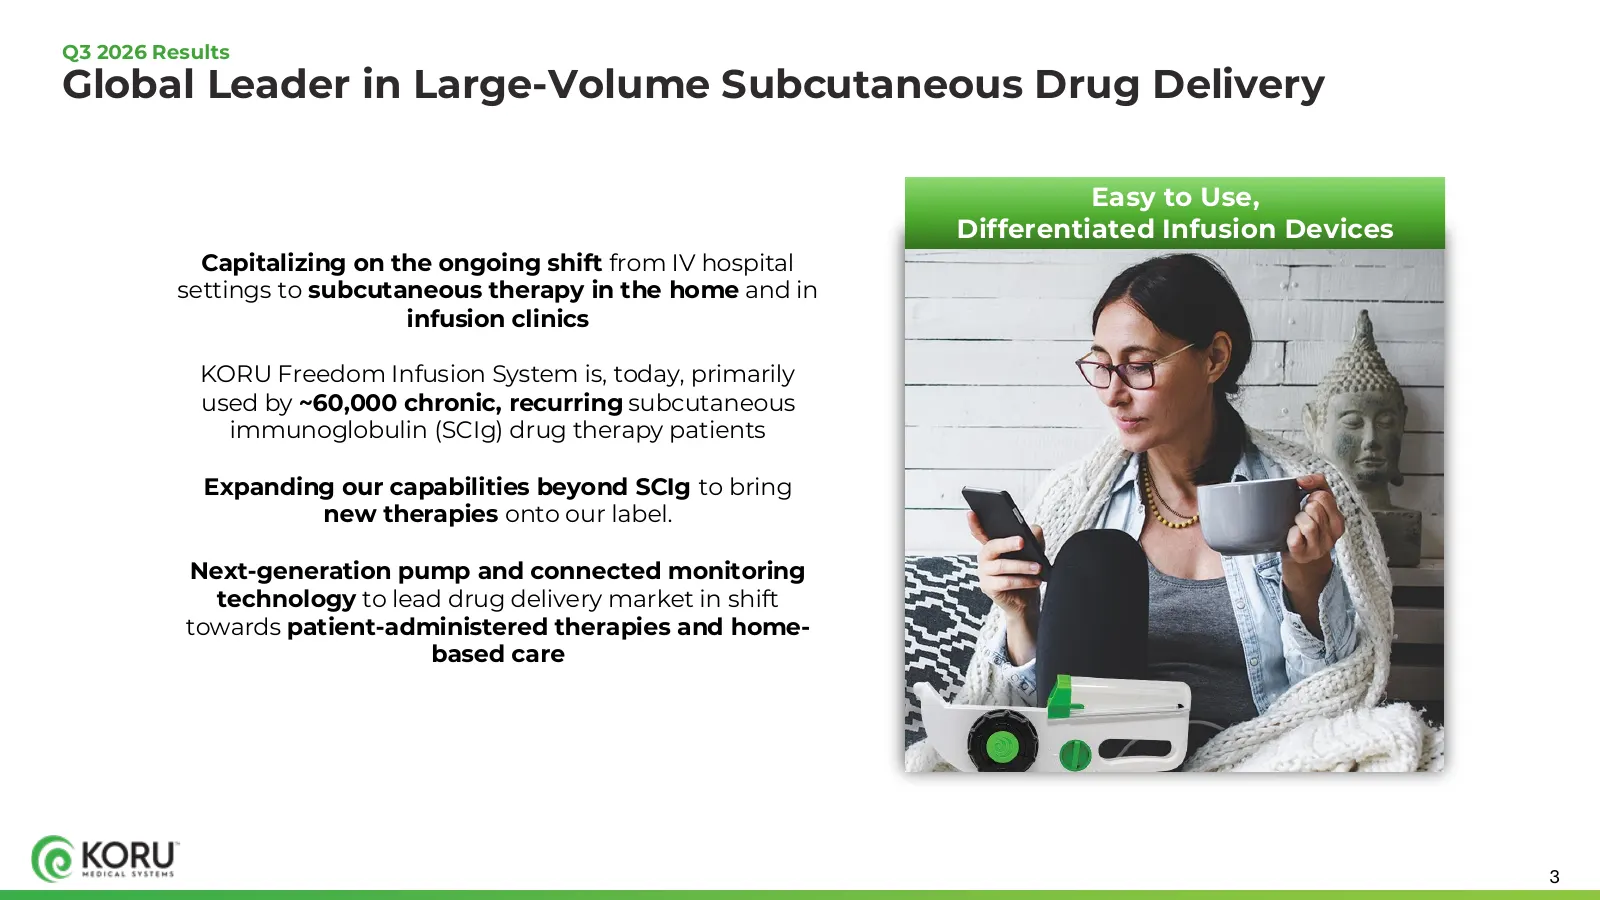
Q3 2026 Results Global Leader in Large-Volume Subcutaneous Drug Delivery Easy to Use, Differentiated Infusion Devices Capitalizing on the ongoing shift from IV hospital settings to subcutaneous therapy in the home and in infusion clinics KORU Freedom Infusion System is, today, primarily used by ~60,
Slide 4: Third Quarter Performance Highlights
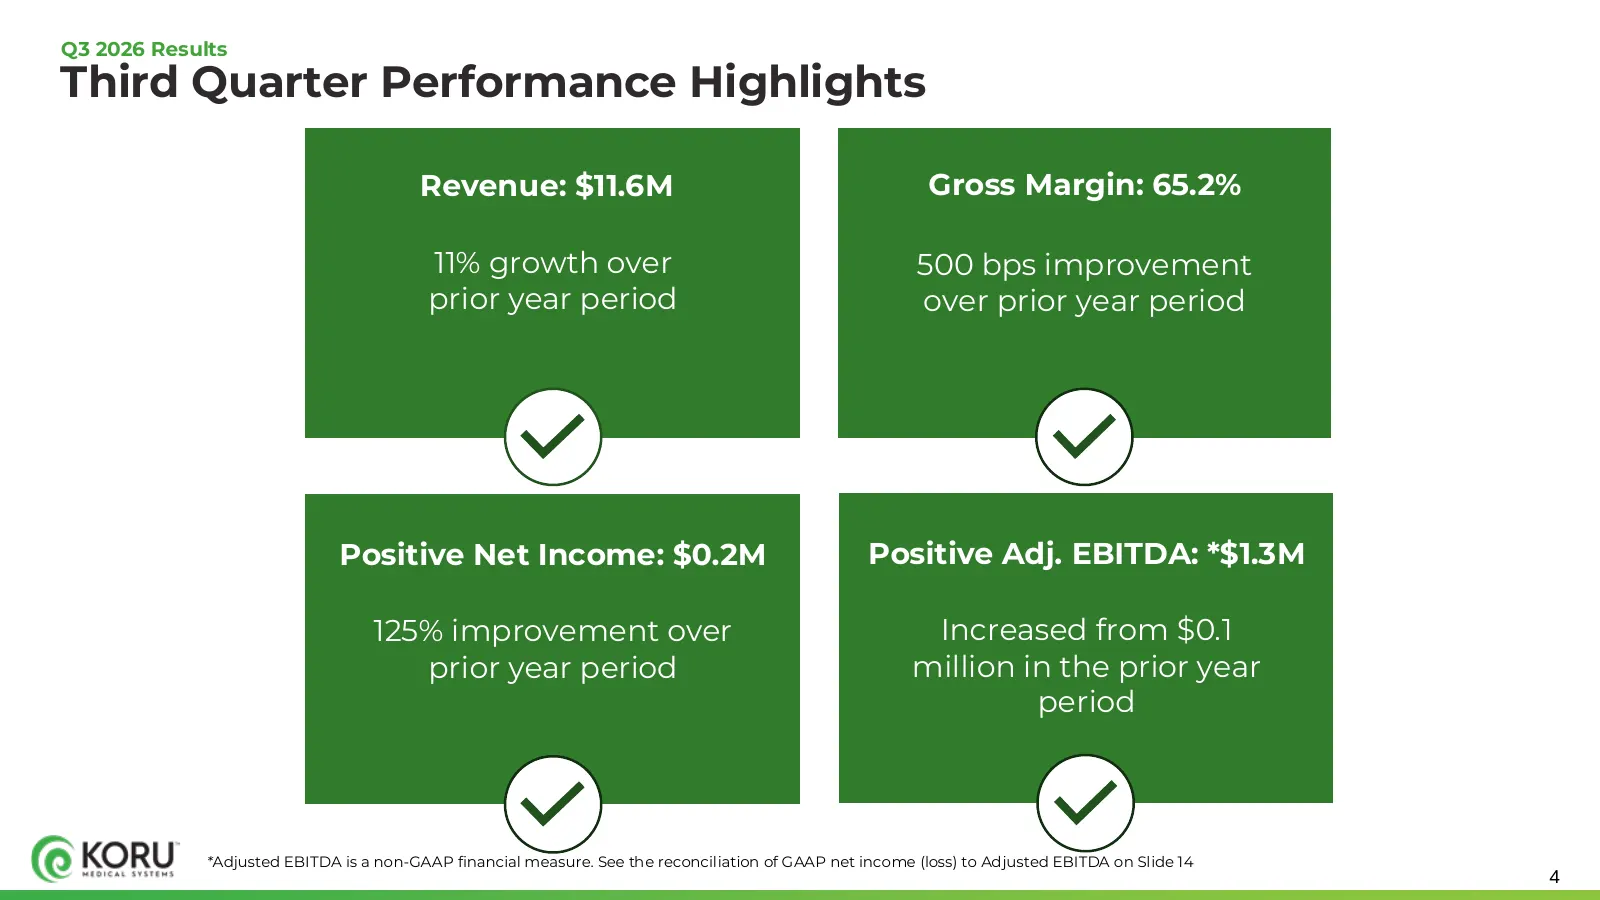
Q3 2026 Results Third Quarter Performance Highlights Revenue: $11.6M Gross Margin: 65.2% 11% growth over 500 bps improvement prior year period over prior year period Positive Net Income: $0.2M Positive Adj. EBITDA: *$1.3M 125% improvement over Increased from $0.1 prior year period million in the pri
Slide 5: Progress Across Strategic Growth Pillars
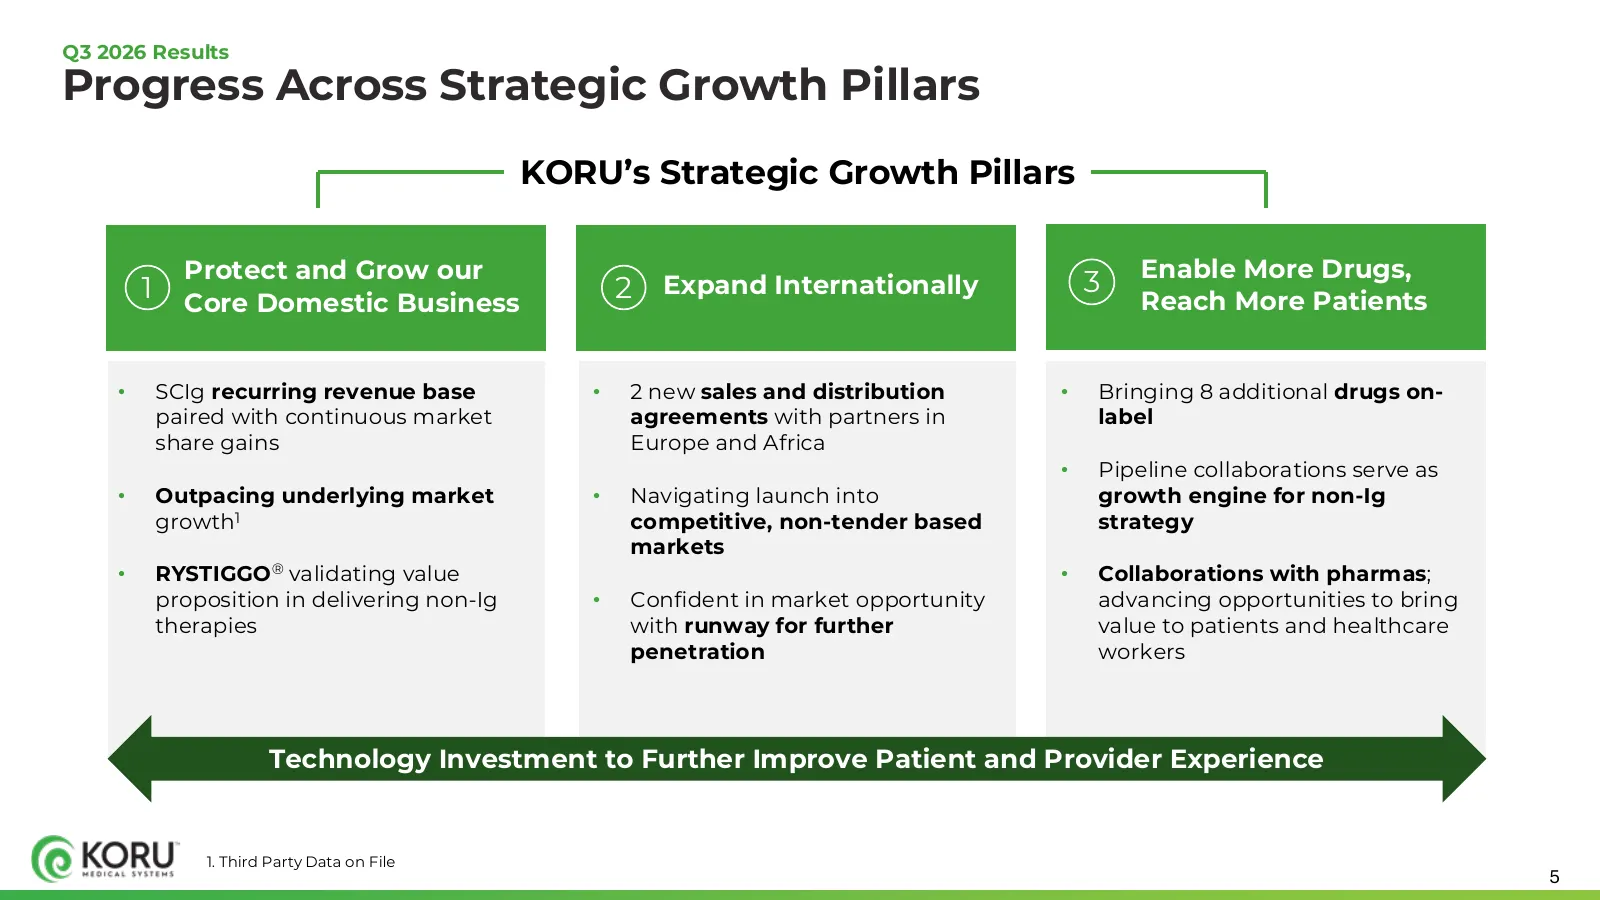
Q3 2026 Results Progress Across Strategic Growth Pillars KORU’s Strategic Growth Pillars Protect and Grow our Enable More Drugs, 1 2 Expand Internationally 3 Core Domestic Business Reach More Patients • SCIg recurring revenue base • 2 new sales and distribution • Bringing 8 additional drugs on- pair
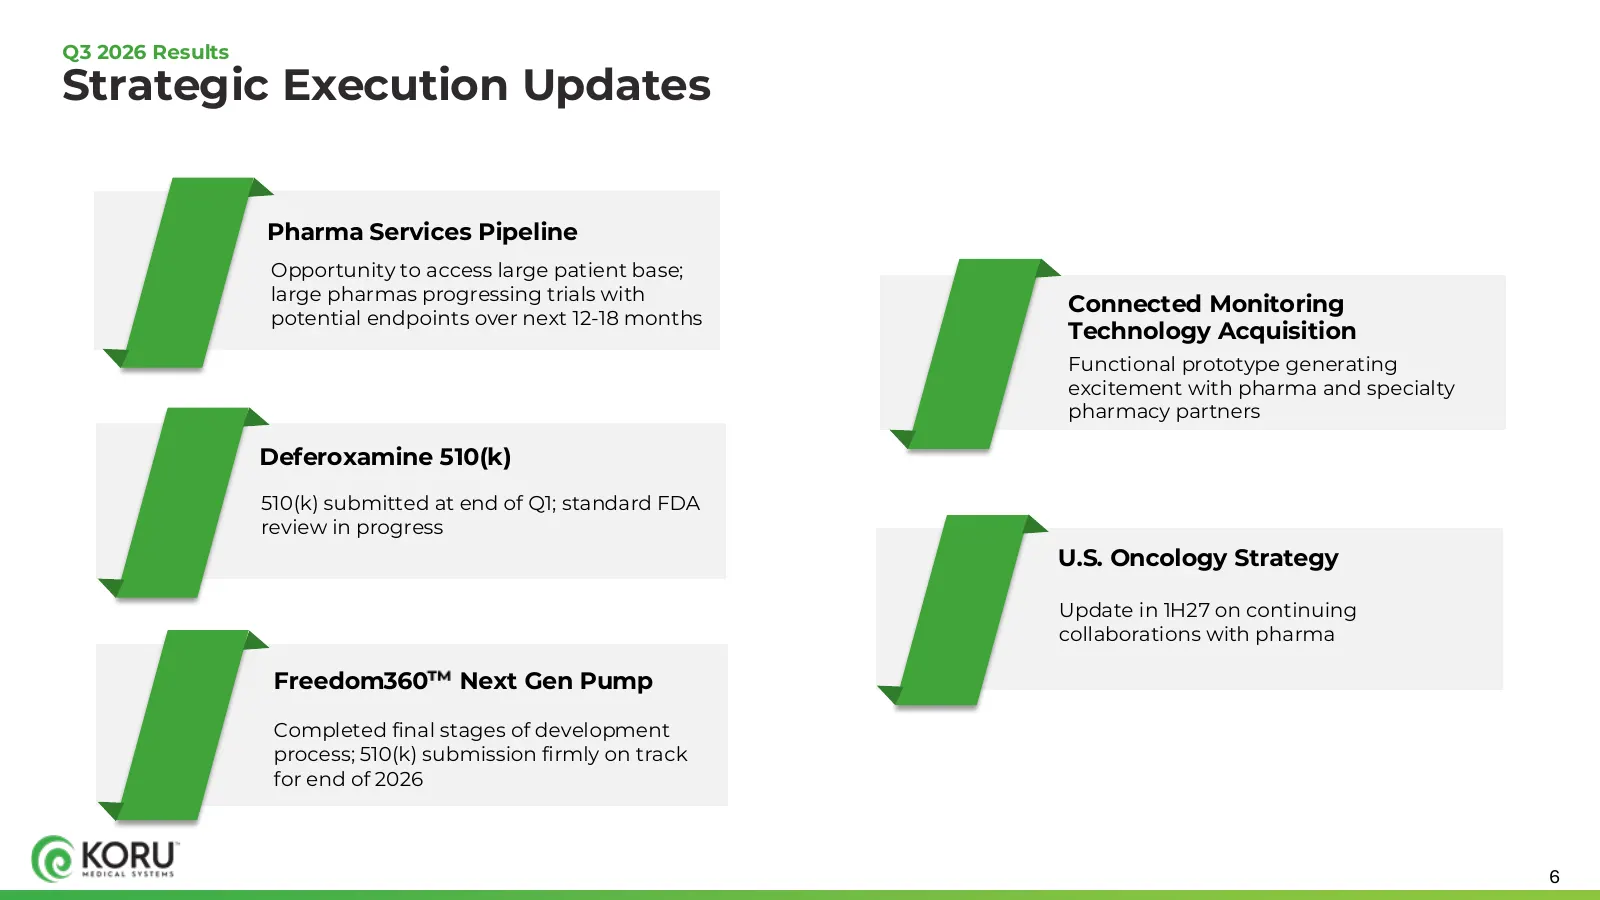
Slide 6: Strategic Execution Updates
Q3 2026 Results Strategic Execution Updates Pharma Services Pipeline Opportunity to access large patient base; large pharmas progressing trials with Connected Monitoring potential endpoints over next 12-18 months Technology Acquisition Functional prototype generating excitement with pharma and speci
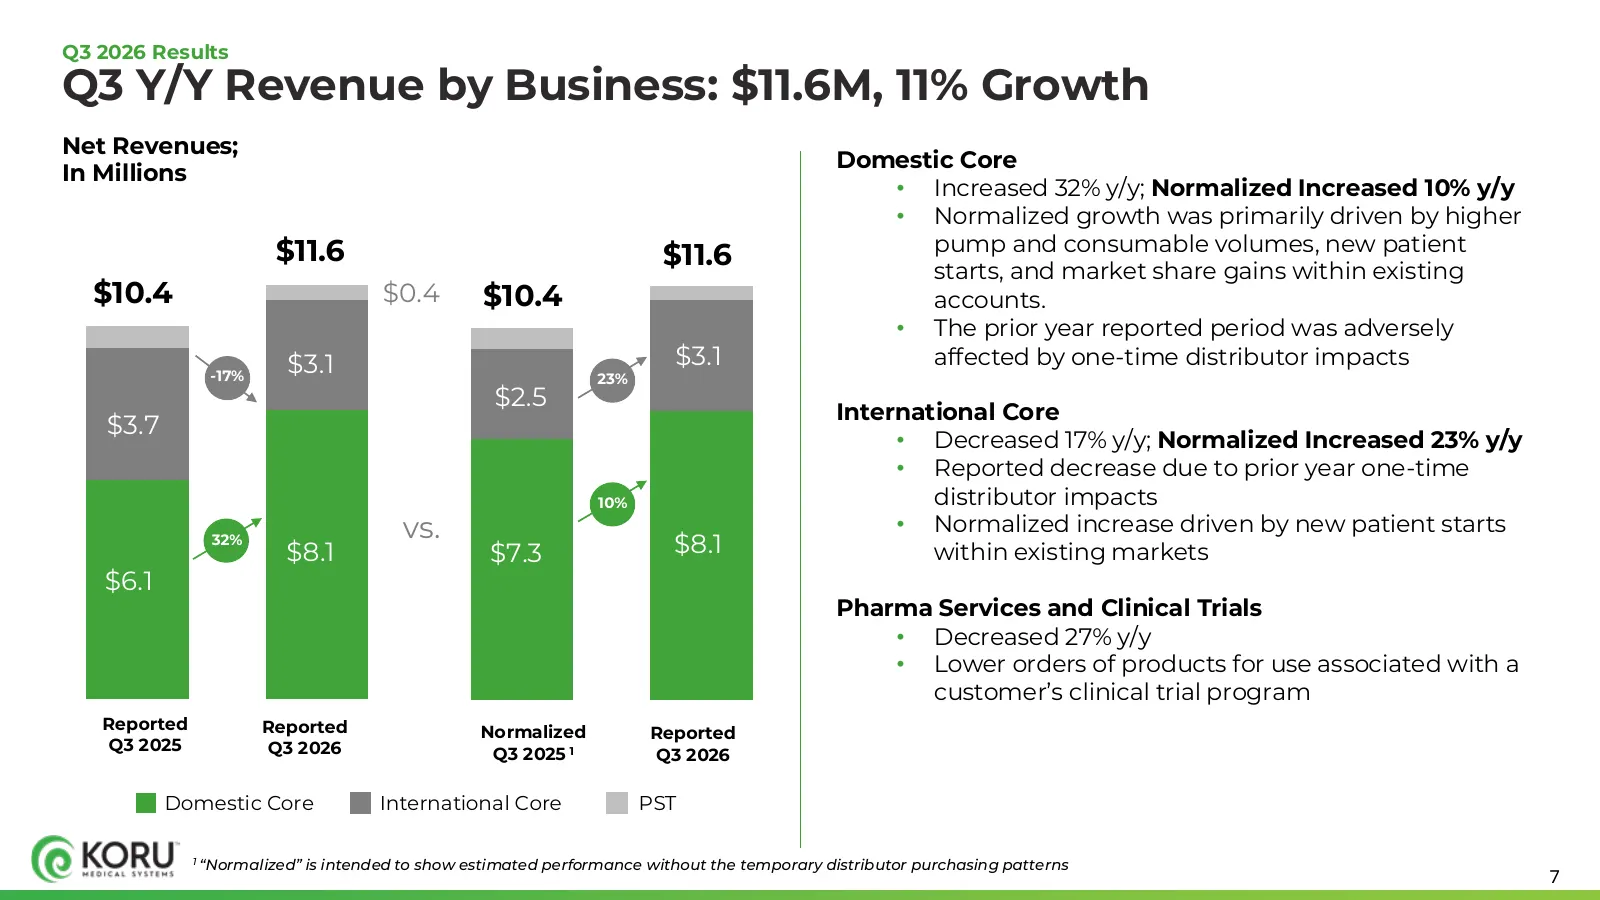
Slide 7: Q3 Y/Y Revenue by Business: $11.6M, 11% Growth
Q3 2026 Results Q3 Y/Y Revenue by Business: $11.6M, 11% Growth Net Revenues; Domestic Core In Millions • Increased 32% y/y; Normalized Increased 10% y/y • Normalized growth was primarily driven by higher $11.6 pump and consumable volumes, new patient $11.6 starts, and market share gains within exist
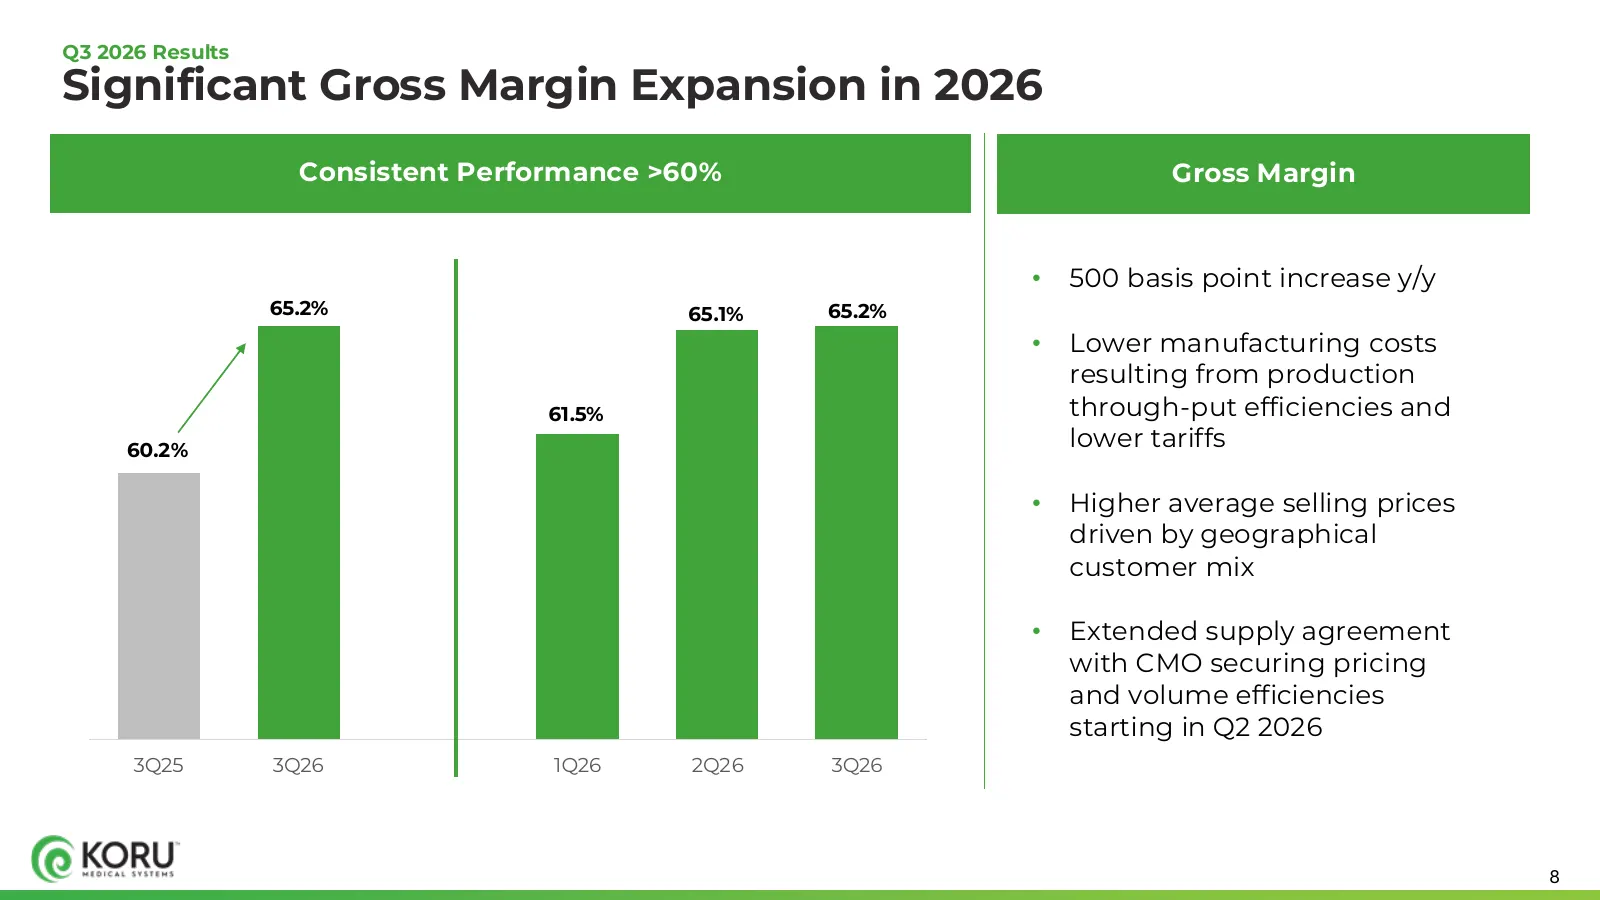
Slide 8: Significant Gross Margin Expansion in 2026
Q3 2026 Results Significant Gross Margin Expansion in 2026 Consistent Performance >60% Gross Margin • 500 basis point increase y/y 65.2% 65.1% 65.2% • Lower manufacturing costs resulting from production 61.5% through-put efficiencies and 60.2% lower tariffs • Higher average selling prices driven by
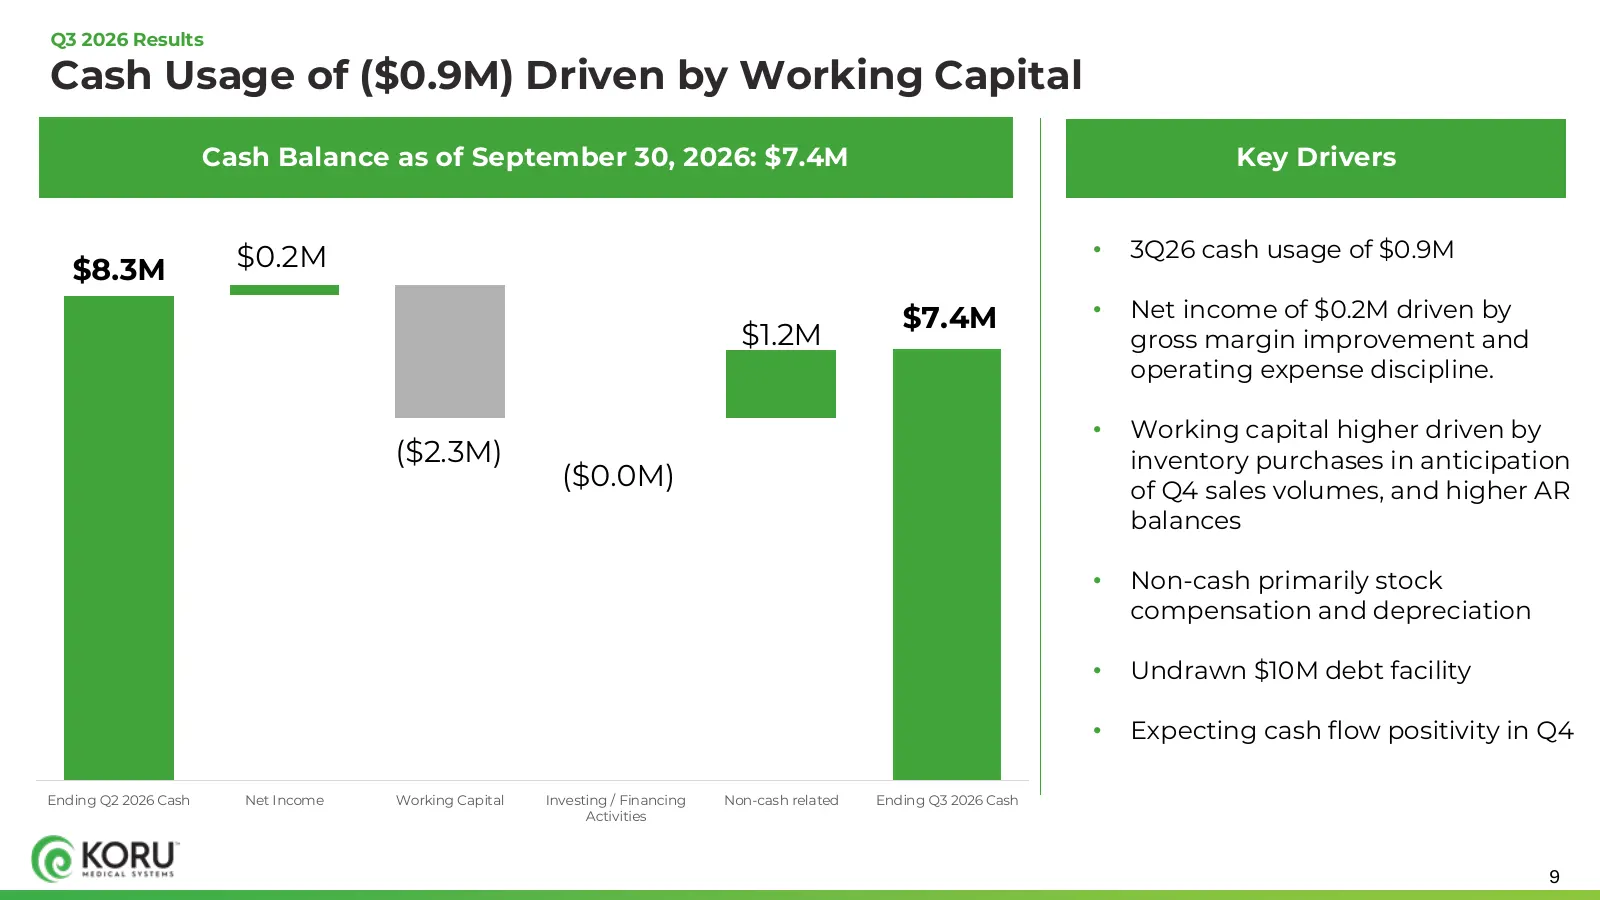
Slide 9: Cash Usage of ($0.9M) Driven by Working Capital
Q3 2026 Results Cash Usage of ($0.9M) Driven by Working Capital Cash Balance as of September 30, 2026: $7.4M Key Drivers $0.2M • 3Q26 cash usage of $0.9M $8.3M $7.4M • Net income of $0.2M driven by $1.2M gross margin improvement and operating expense discipline. • Working capital higher driven by ($
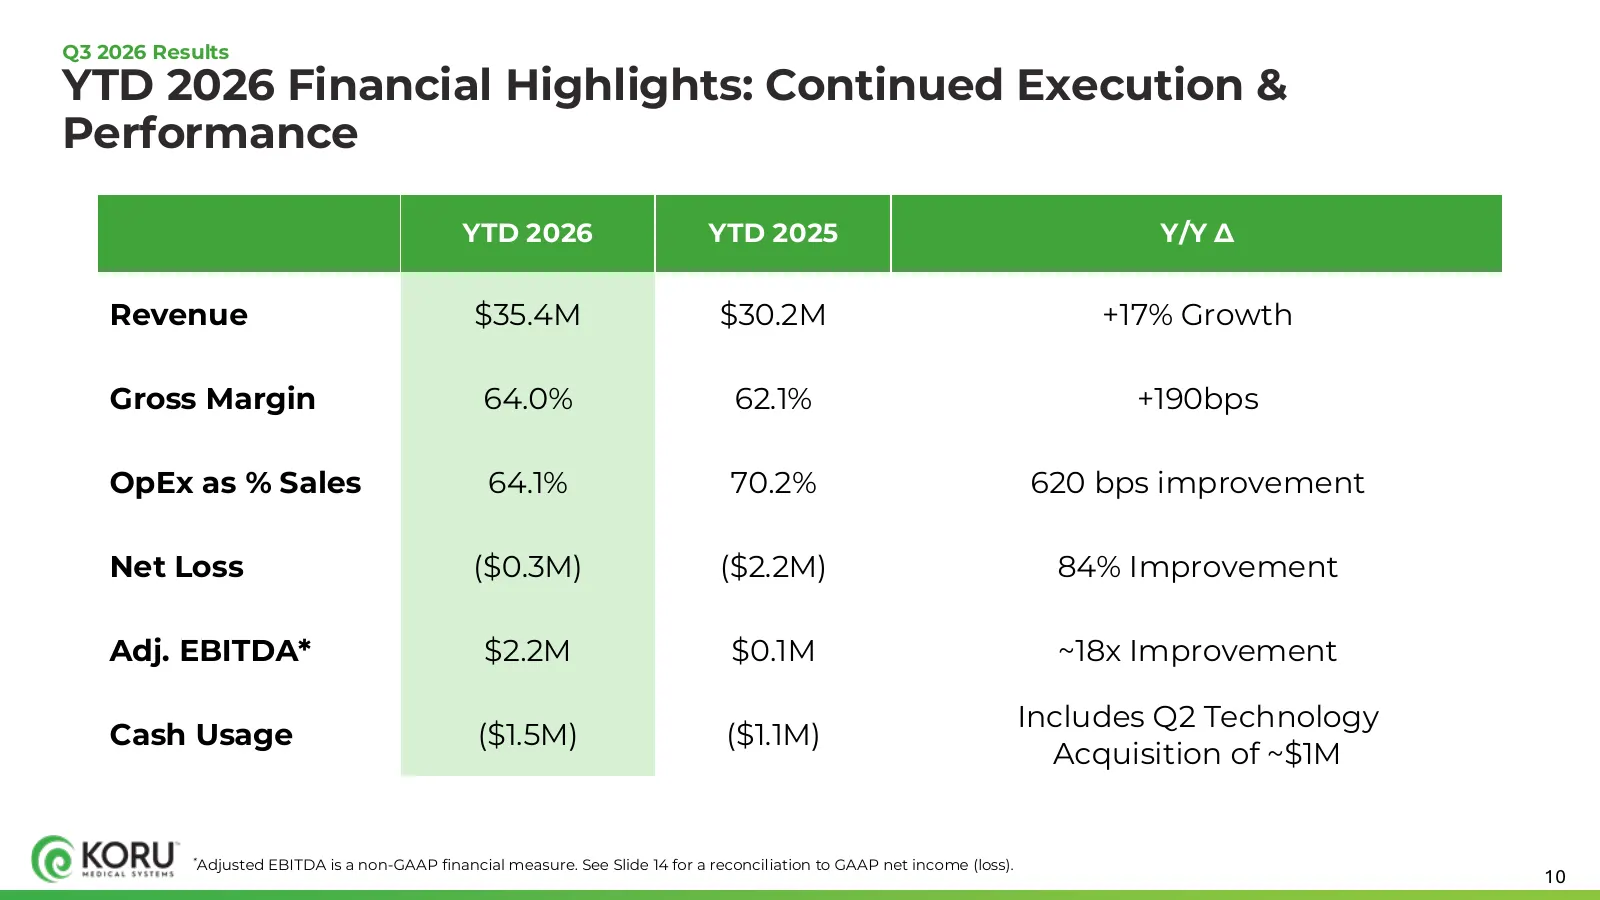
Slide 10: YTD 2026 Financial Highlights: Continued Execution & Performance
Q3 2026 Results YTD 2026 Financial Highlights: Continued Execution & Performance YTD 2026 YTD 2025 Y/Y Δ Revenue $35.4M $30.2M +17% Growth Gross Margin 64.0% 62.1% +190bps OpEx as % Sales 64.1% 70.2% 620 bps improvement Net Loss ($0.3M) ($2.2M) 84% Improvement Adj. EBITDA* $2.2M $0.1M ~18x Improveme
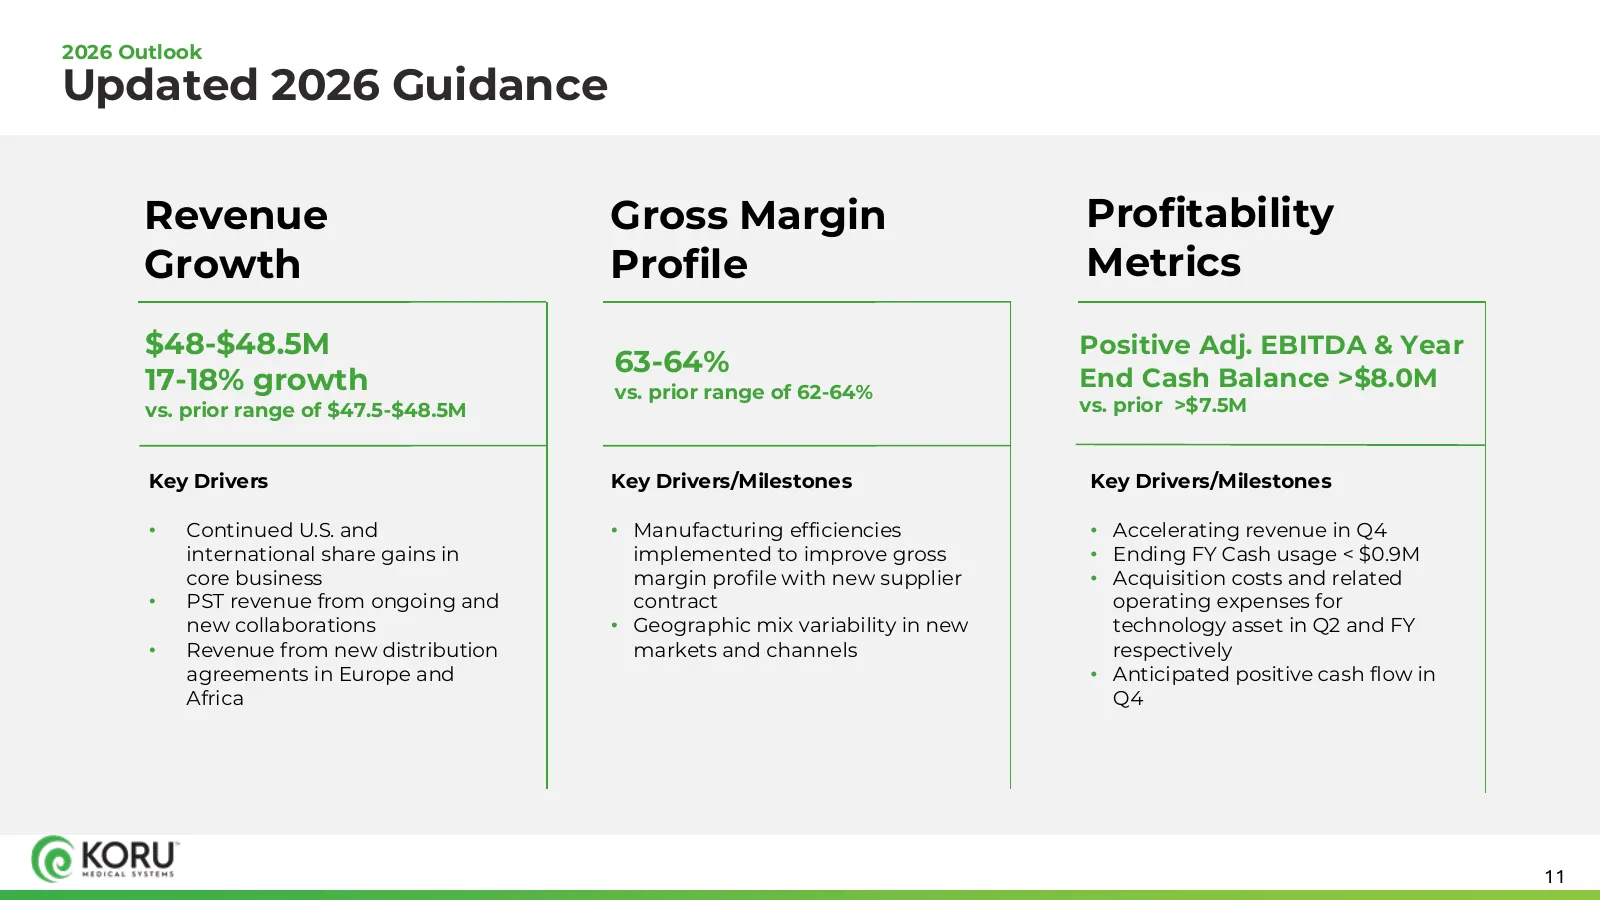
Slide 11: Updated 2026 Guidance
2026 Outlook Updated 2026 Guidance Revenue Gross Margin Profitability Growth Profile Metrics $48-$48.5M Positive Adj. EBITDA & Year 63-64% 17-18% growth vs. prior range of 62-64% End Cash Balance >$8.0M vs. prior range of $47.5-$48.5M vs. prior >$7.5M Key Drivers Key Drivers/Milestones Key Drivers/M
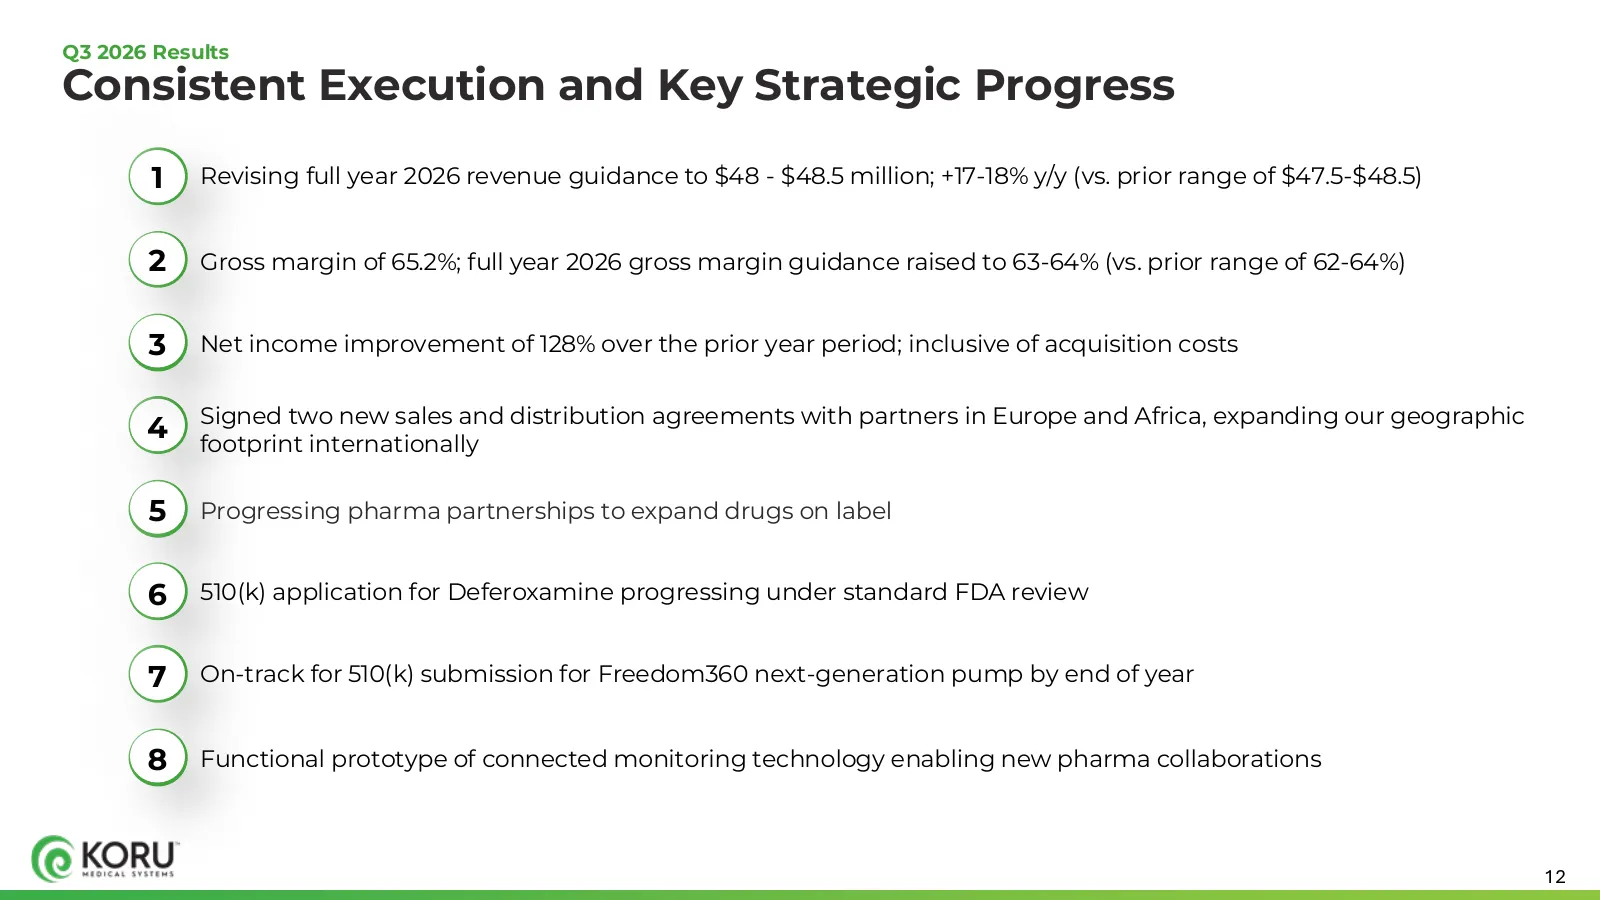
Slide 12: Consistent Execution and Key Strategic Progress
Q3 2026 Results Consistent Execution and Key Strategic Progress 1 Revising full year 2026 revenue guidance to $48 - $48.5 million; +17-18% y/y (vs. prior range of $47.5-$48.5) 2 Gross margin of 65.2%; full year 2026 gross margin guidance raised to 63-64% (vs. prior range of 62-64%) 3 Net income impr

Slide 13: Appendix
Appendix
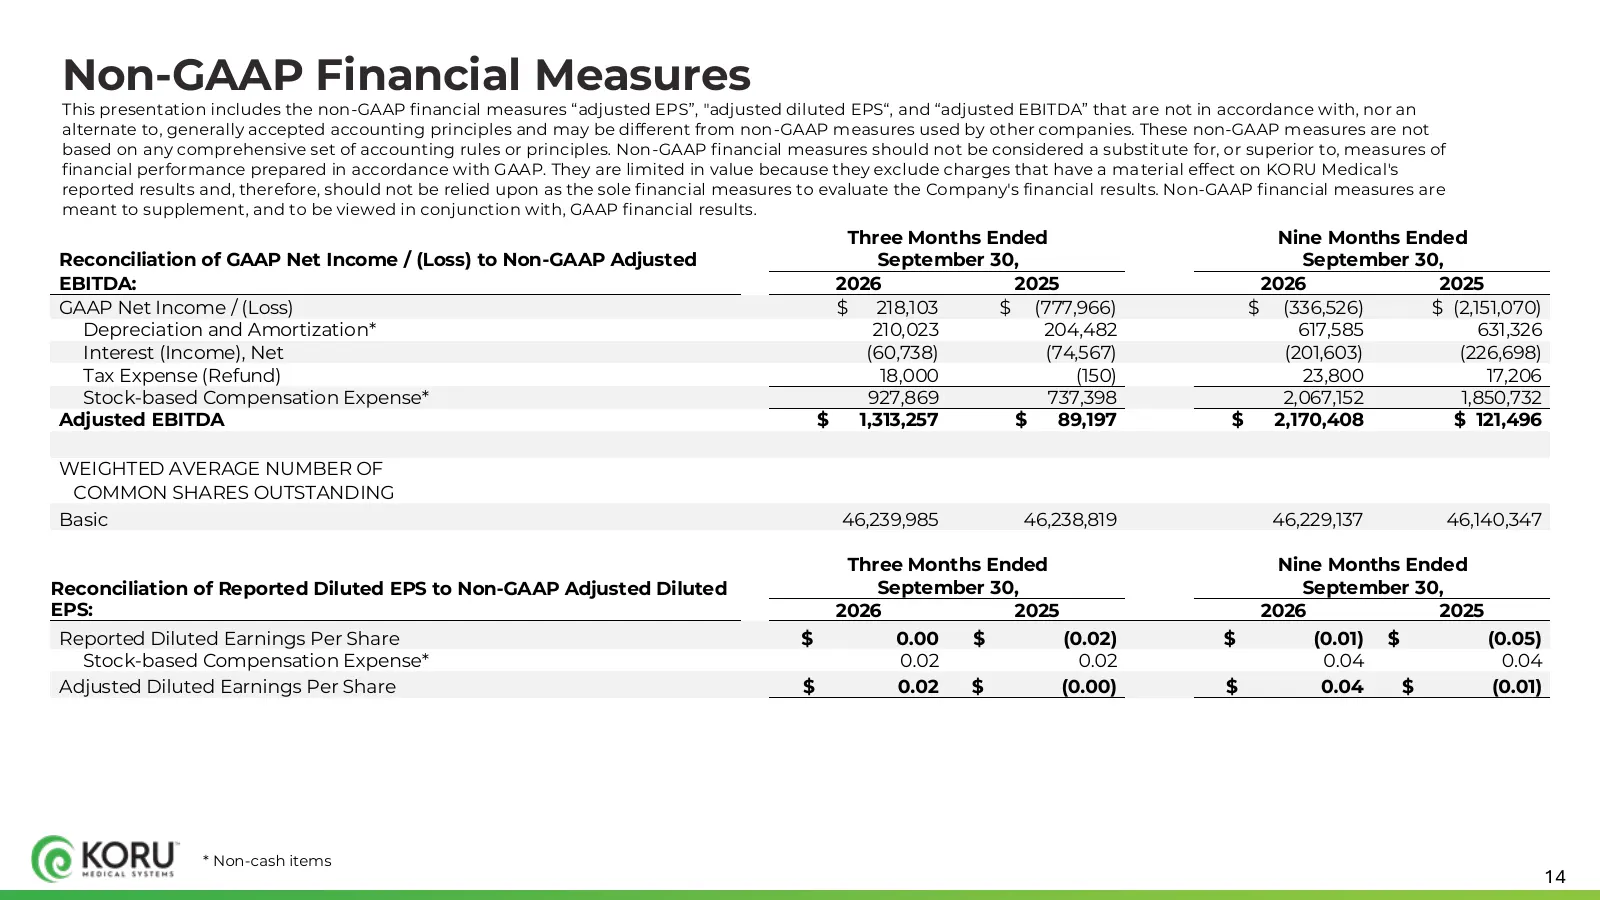
Slide 14: Non-GAAP Financial Measures
Non-GAAP Financial Measures This presentation includes the non-GAAP financial measures “adjusted EPS”, "adjusted diluted EPS“, and “adjusted EBITDA” that are not in accordance with, nor an alternate to, generally accepted accounting principles and may be different from non-GAAP measures used by othe
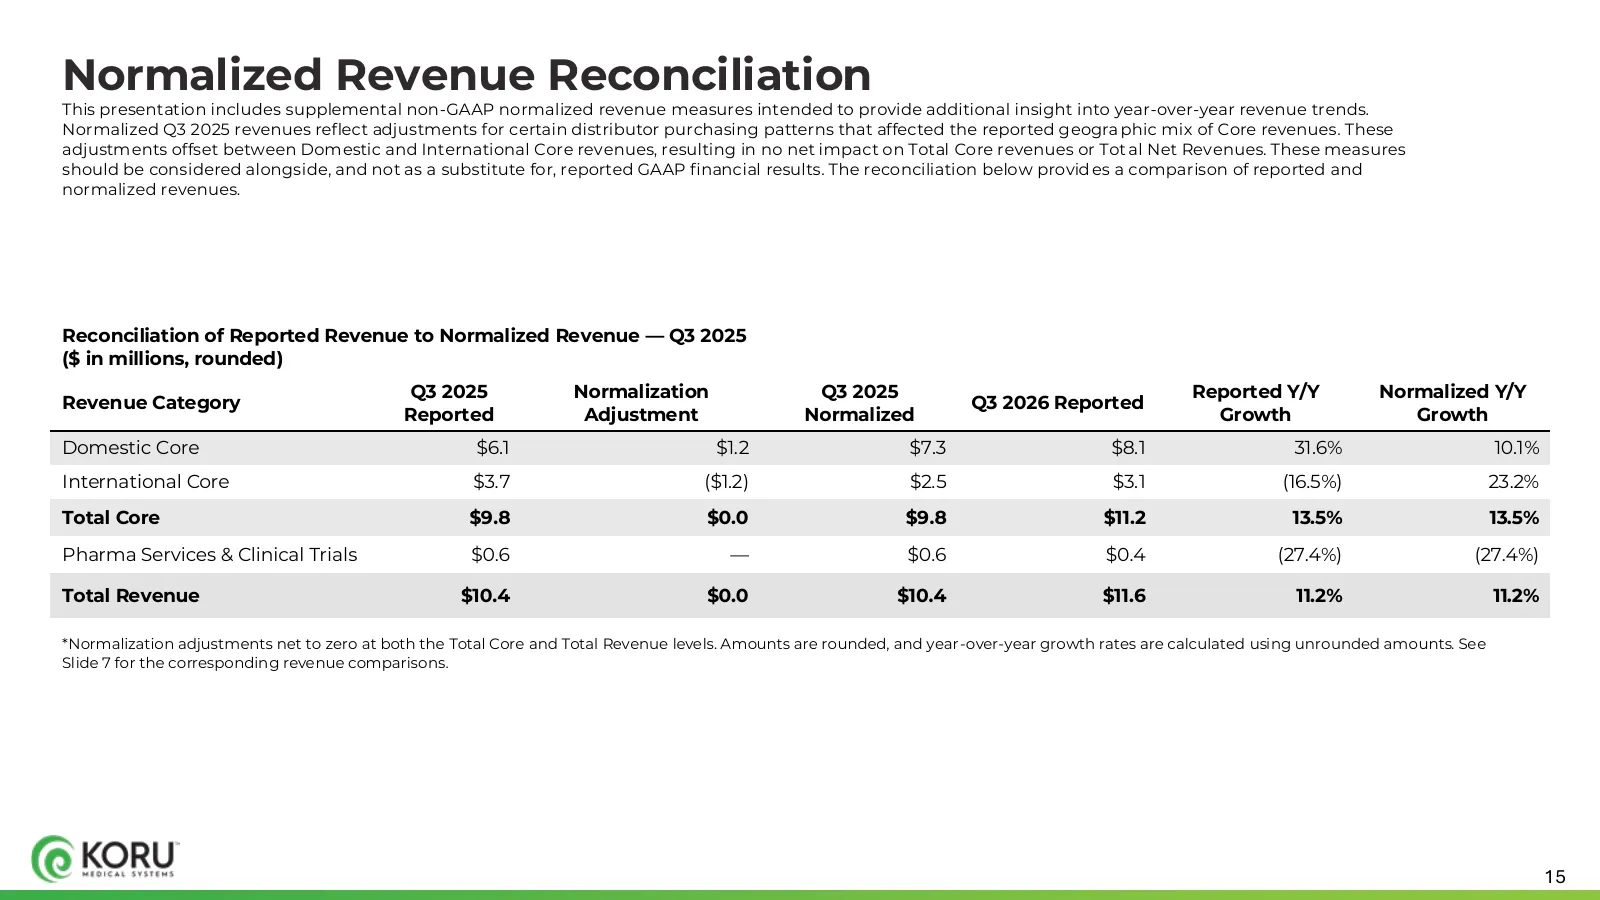
Slide 15: Normalized Revenue Reconciliation
Normalized Revenue Reconciliation This presentation includes supplemental non-GAAP normalized revenue measures intended to provide additional insight into year-over-year revenue trends. Normalized Q3 2025 revenues reflect adjustments for certain distributor purchasing patterns that affected the repo
Source: company website
More decks from KORU Medical Systems, Inc.
 Investor Presentation (November 2026)15 slides · November 2026
 Lake Street BIG10 Conference 202618 slides · September 2026
 Q2 2026 Earnings Presentation17 slides · Aug 5, 2026
 Investor Presentation (August 2026)16 slides · August 2026
 Q1 2026 Earnings Presentation14 slides · May 6, 2026
 Q4 2025 Earnings Presentation19 slides · Mar 12, 2026