Cambridge Bancorp — Investor Presentation (January 2021)
60 slides from Cambridge Bancorp's investor presentation, Jan 26, 2021
Slide 1: Investor Presentation January 26, 2021
Investor Presentation January 26, 2021 NASDAQ: CATC Parent of Cambridge Trust Company EX:99.1 CAMBRIDGE BANCORP
Slide 2: Forward Looking Statements and Non-GAAP Measures
Forward Looking Statements and Non-GAAP Measures Certain statements herein may constitute “forward-looking statements” as defined in the Private Securities Litigation Reform Act of 1995. Such forward-looking statements about the Company and its industry involve substantial risks and uncertainties. S
Slide 3: Company Profile
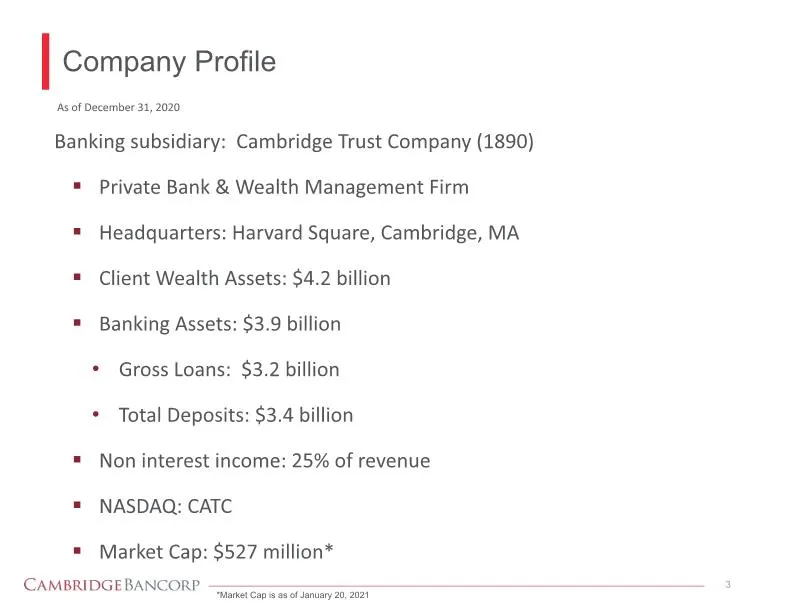
Company Profile 3 Banking subsidiary: Cambridge Trust Company (1890) Private Bank & Wealth Management Firm Headquarters: Harvard Square, Cambridge, MA Client Wealth Assets: $4.2 billion Banking Assets: $3.9 billion Gross Loans: $3.2 billion Total Deposits: $3.4 billion Non interest income: 25% of re
Slide 4: Targeted Operating Model
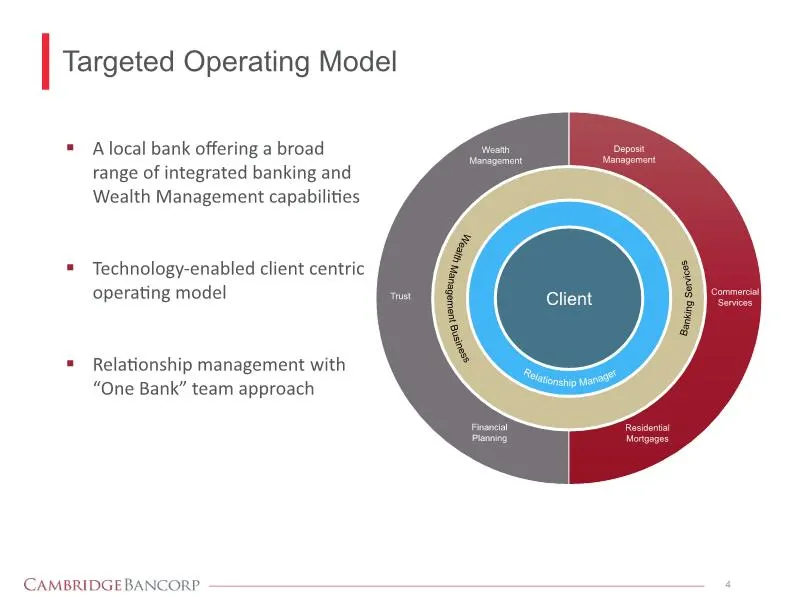
Targeted Operating Model 4 A local bank offering a broad range of integrated banking and Wealth Management capabilities Technology-enabled client centric operating model Relationship management with “One Bank” team approach Wealth Management Deposit Management Commercial Services Residential Mortgag
Slide 5: Why Cambridge Bancorp?
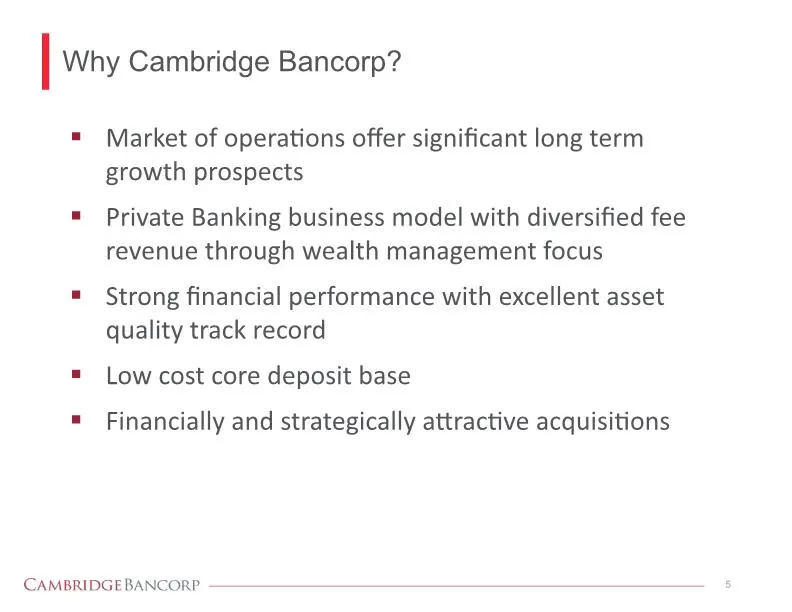
Why Cambridge Bancorp? 5 Market of operations offer significant long term growth prospects Private Banking business model with diversified fee revenue through wealth management focus Strong financial performance with excellent asset quality track record Low cost core deposit base Financially and str
Slide 6: Dynamic & Affluent Markets of Operation
6 Dynamic & Affluent Markets of Operation CAMBRIDGE BANCORP
Slide 7: Geographic Footprint
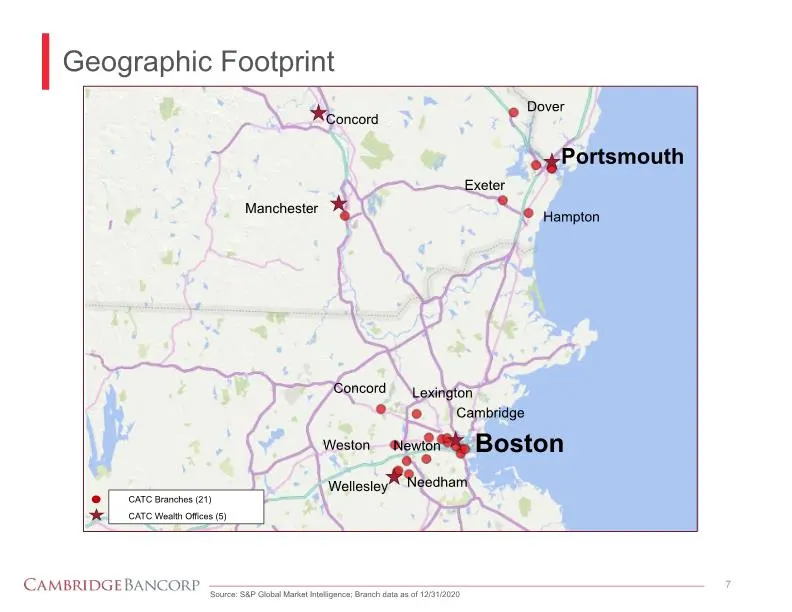
Geographic Footprint 7 Source: S&P Global Market Intelligence; Branch data as of 12/31/2020 Boston Cambridge Lexington Concord Weston Wellesley Needham Newton Portsmouth Dover Concord Manchester Hampton Exeter Portsmouth Concord Manchester Dover Exeter Hampton Concord Lexington Cambridge Boston West
Slide 8: Market Characteristics
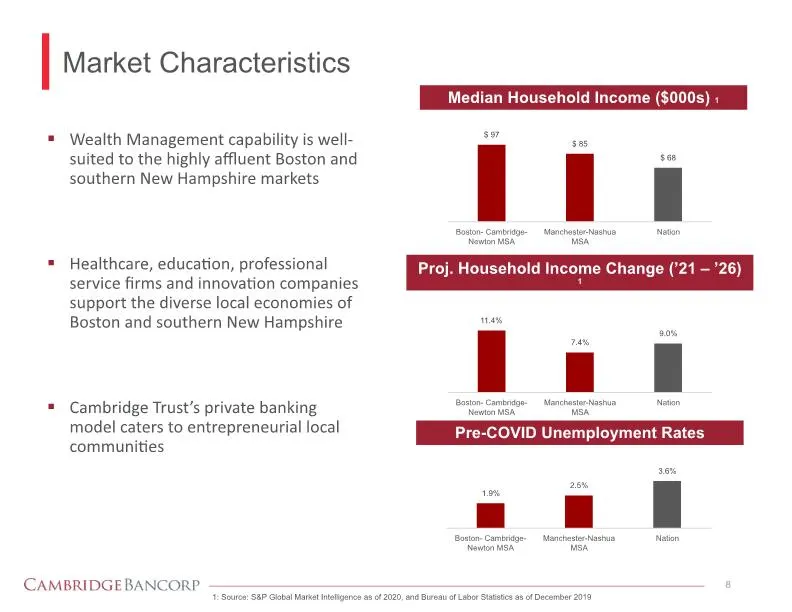
Market Characteristics 8 1: Source: S&P Global Market Intelligence as of 2020, and Bureau of Labor Statistics as of December 2019 Pre-COVID Unemployment Rates Median Household Income ($000s) 1 Proj. Household Income Change (’21 – ’26) 1 Wealth Management capability is well-suited to the highly afflu
Slide 9: Private Banking Business Model
9 Private Banking Business Model CAMBRIDGE BANCORP
Slide 10: Client Wealth Management Assets
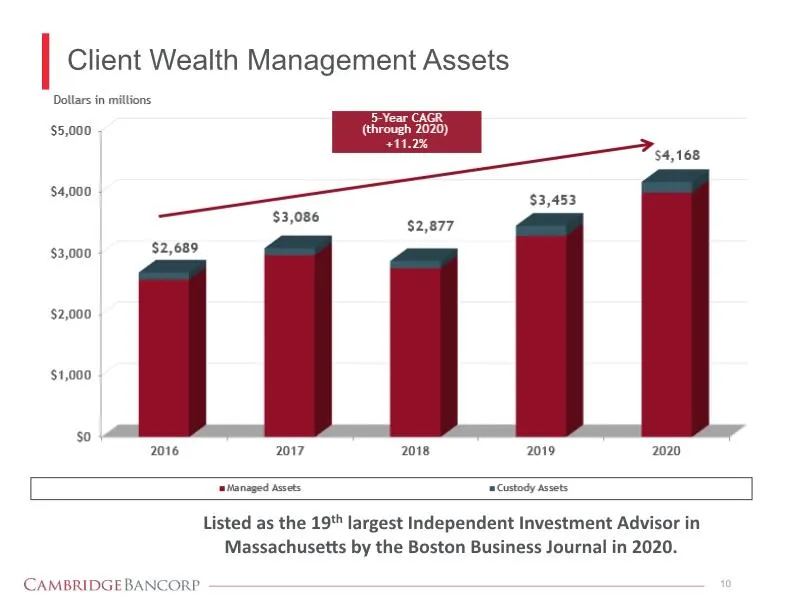
10 Client Wealth Management Assets Listed as the 19th largest Independent Investment Advisor in Massachusetts by the Boston Business Journal in 2020. Dollars in millions 5-Year CAGR (through 2020) +11.2% $ 5,000 $4,000 $3,000 $2,000 $1,000 $0 2106 $2,689 2017 $3,086 2018 $2,877 2019 $3,453 2020 $4,1
Slide 11: Wealth Management Revenue
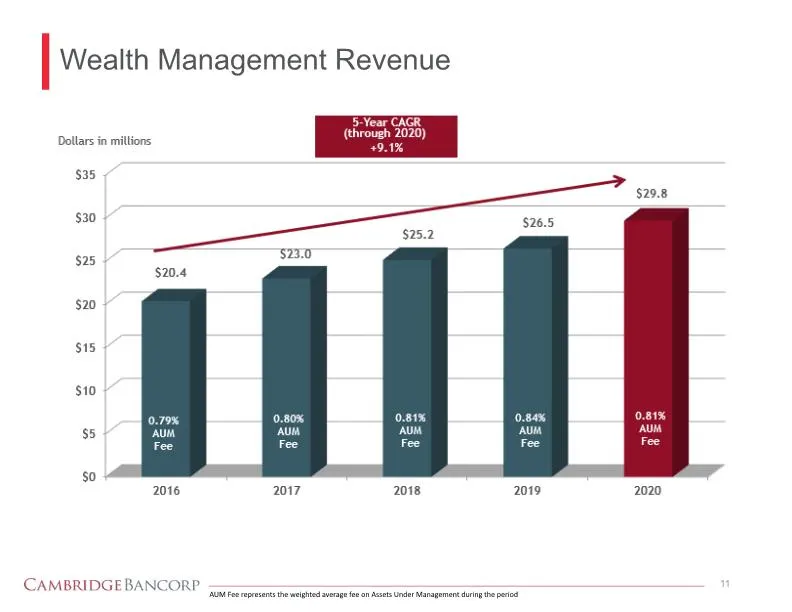
11 Wealth Management Revenue AUM Fee represents the weighted average fee on Assets Under Management during the period 5-Year CAGR (through 2020) +9.1% Dollars in millions 0.80% AUM Fee 0.81% AUM Fee 0.84% AUM Fee 0.81% AUM $35 $30 $25 $20 $15 $10 $5 $0 2016 $20.4 2017 $23.0 2018 $25.2 2019 $26.5 202
Slide 12: Net Client Flows
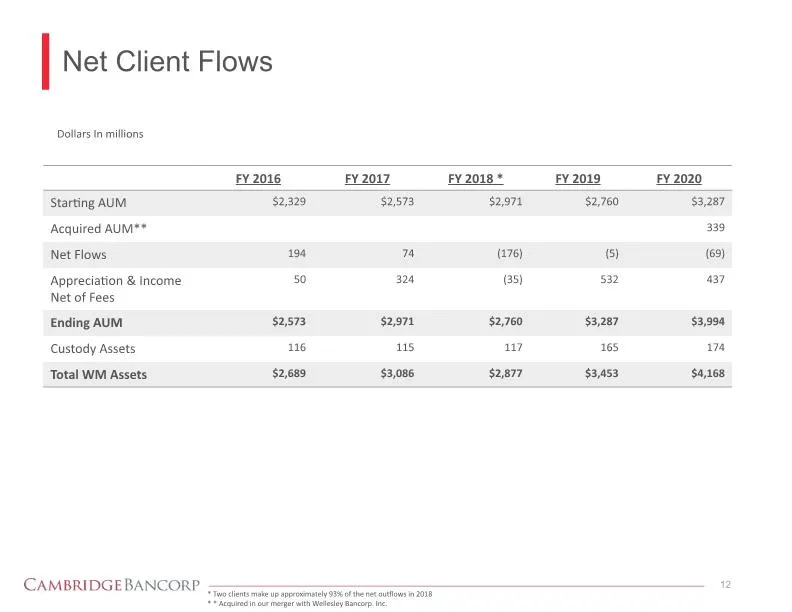
Net Client Flows 12 * Two clients make up approximately 93% of the net outflows in 2018 * * Acquired in our merger with Wellesley Bancorp. Inc. Dollars In millions FY 2016 FY 2017 FY 2018* FY 2019 FY 2020 Starting AUM $2,329 $2,573 $2,971 $2,760 $3,287 Acquired AUM** 339 Net Flows 194 74 (176) (5) (
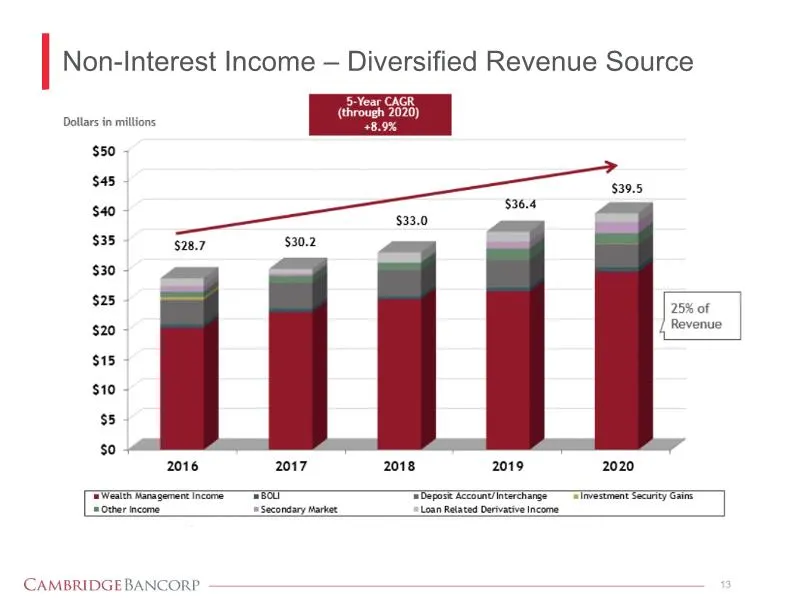
Slide 13: Non-Interest Income – Diversified Revenue Source
13 Non-Interest Income – Diversified Revenue Source Dollars in millions 25% of Revenue 5-Year CAGR (through 2020) +8.9% $39.5 $36.4 $30.2 $28.7 $50 $45 $40 $35 $30 $25 $20 $15 $10 $5 $0 2016 2017 2018 2019 2020 Wealth Management Income Other Income BOLI Secondary Market Deposit Account/Interchange L
Slide 14: Strong Financial Performance
14 Strong Financial Performance CAMBRIDGE BANCORP
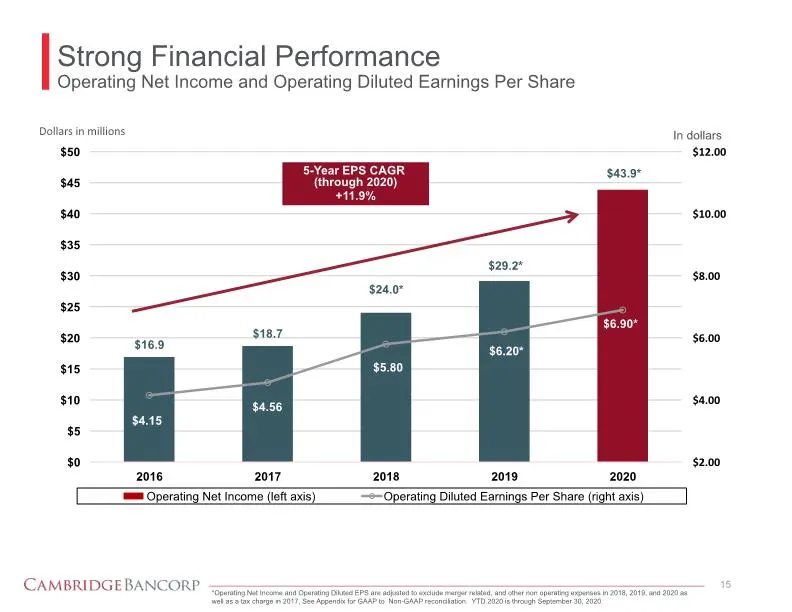
Slide 15: Strong Financial Performance
Strong Financial Performance Operating Net Income and Operating Diluted Earnings Per Share 5-Year EPS CAGR (through 2020) +11.9% In dollars *Operating Net Income and Operating Diluted EPS are adjusted to exclude merger related, and other non operating expenses in 2018, 2019, and 2020 as well as a ta
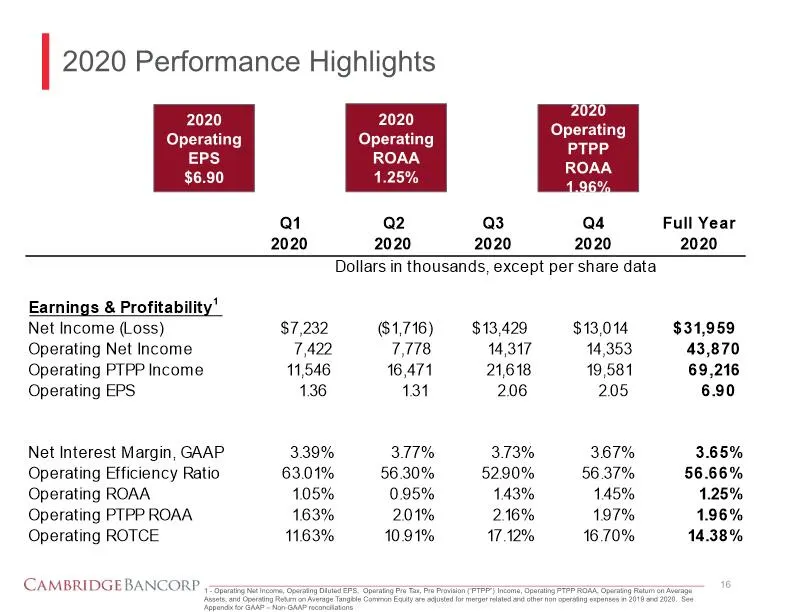
Slide 16: 2020 Performance Highlights
2020 Performance Highlights 16 1 - Operating Net Income, Operating Diluted EPS, Operating Pre Tax, Pre Provision (“PTPP”) Income, Operating PTPP ROAA, Operating Return on Average Assets, and Operating Return on Average Tangible Common Equity are adjusted for merger related and other non operating ex
Slide 17: 2020 Performance Highlights continued
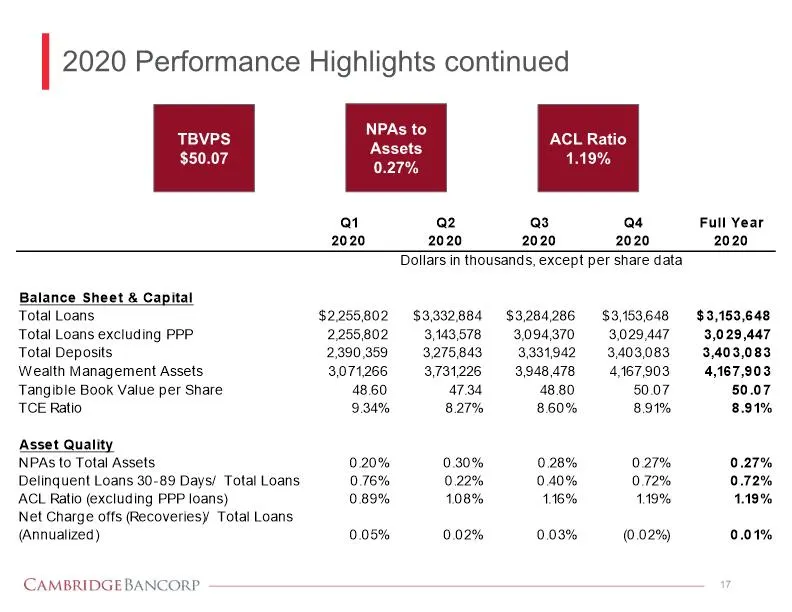
2020 Performance Highlights continued 17 TBVPS $50.07 NPAs to Assets 0.27% ACL Ratio 1.19% Q1 2020 Q2 2020 Q3 2020 Q4 2020 Full Year 2020 Dollars in thousands, except per share data Balance Sheet & Capital Total Loans $2,255,802 $3,332,884 $3,284,286 $3,153,648 $3,153,648 Total Loans excluding PPP 2
Slide 18: Net Interest Margin
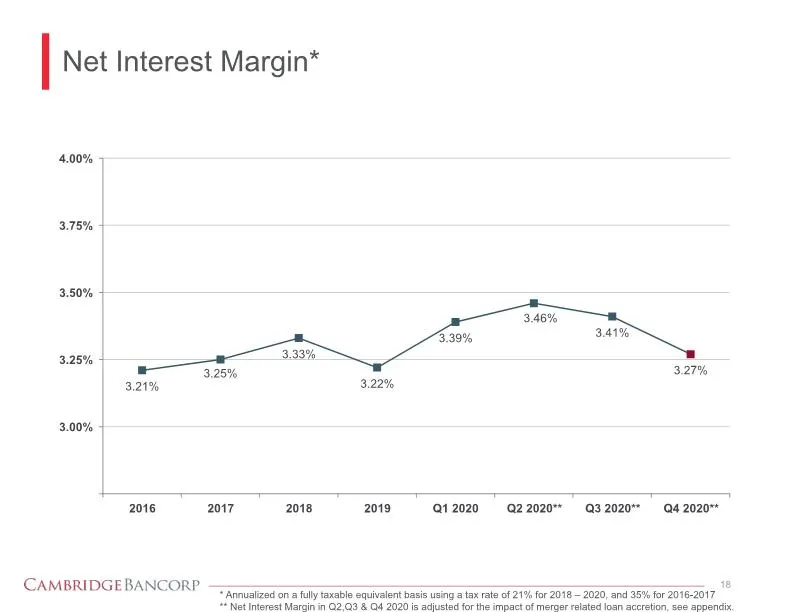
Net Interest Margin* 18 * Annualized on a fully taxable equivalent basis using a tax rate of 21% for 2018 – 2020, and 35% for 2016-2017 ** Net Interest Margin in Q2,Q3 & Q4 2020 is adjusted for the impact of merger related loan accretion, see appendix. 4.00% 3.75% 3.50% 3.25% 3.00% 2016 2017 2018 20
Slide 19: Strong Capital Position & Growing Book Value
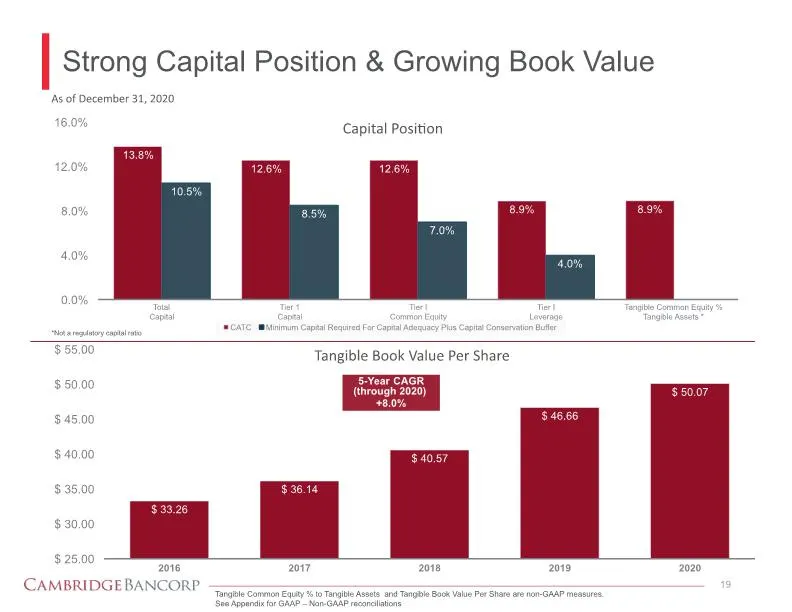
Strong Capital Position & Growing Book Value 19 As of December 31, 2020 Tangible Common Equity % to Tangible Assets and Tangible Book Value Per Share are non-GAAP measures. See Appendix for GAAP – Non-GAAP reconciliations 5-Year CAGR (through 2020) +8.0% Capital Position 16.0% 12.0% 8.0% 4.0% 0.0% T
Slide 20: Strong Liquidity Position
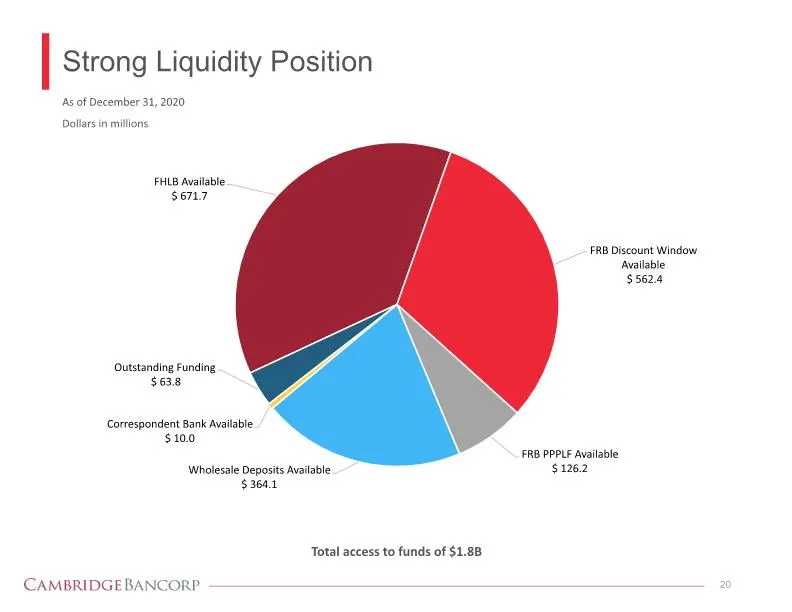
Strong Liquidity Position 20 Total access to funds of $1.8B As of December 31, 2020 Dollars in millions FHLB Available $671.7 Outstanding Funding $63.8 Correspondent Bank Available $10.0 Wholesale Deposits Available $364.1 FRB PPPLF Available $126.2 FRB Discount Window Available $562.4 CAMBRIDGE BAN
Slide 21: Asset Quality, Allowance for Credit Losses and COVID Related Deferral Details
21 Asset Quality, Allowance for Credit Losses and COVID Related Deferral Details CAMBRIDGE BANCORP
Slide 22: Asset Quality Highlights
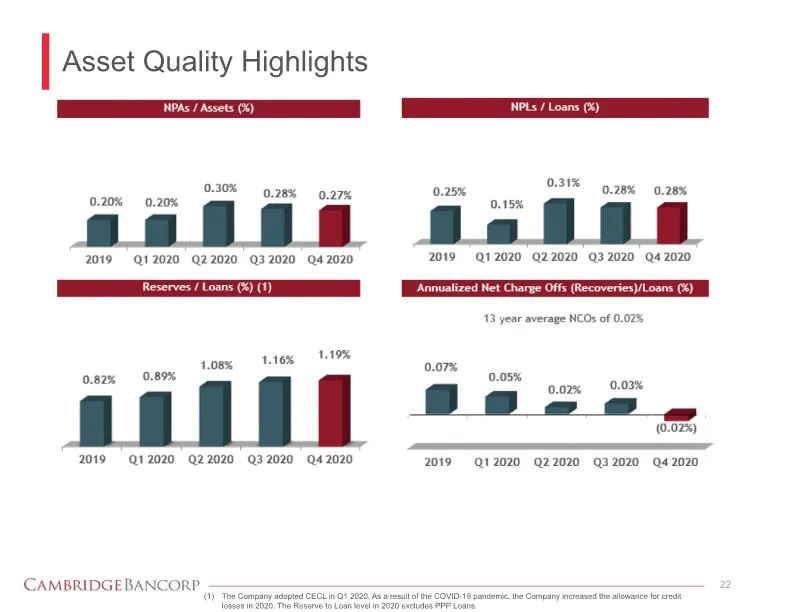
Asset Quality Highlights The Company adopted CECL in Q1 2020. As a result of the COVID-19 pandemic, the Company increased the allowance for credit losses in 2020. The Reserve to Loan level in 2020 excludes PPP Loans. 22 NPLs / Loans (%) Reserves / Loans (%) (1) Annualized Net Charge Offs (Recoveries
Slide 23: Allowance for Credit Losses (ACL)
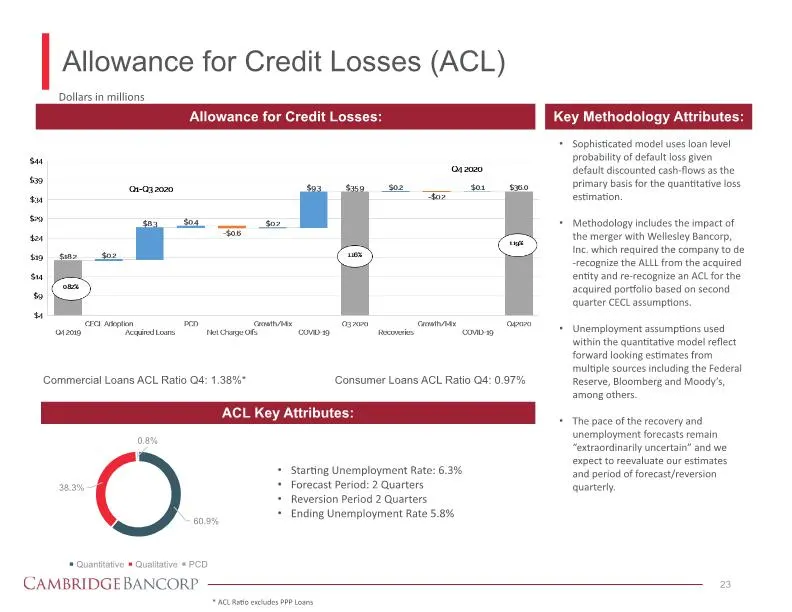
Allowance for Credit Losses (ACL) 23 Allowance for Credit Losses: Dollars in millions ACL Key Attributes: Key Methodology Attributes: Starting Unemployment Rate: 6.3% Forecast Period: 2 Quarters Reversion Period 2 Quarters Ending Unemployment Rate 5.8% Sophisticated model uses loan level probability
Slide 24: COVID-19 Loan Deferrals
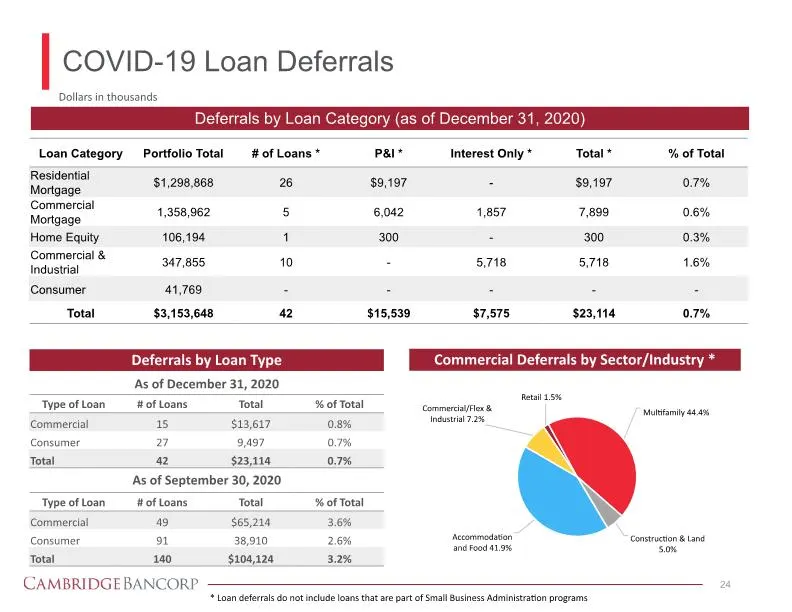
COVID-19 Loan Deferrals * Loan deferrals do not include loans that are part of Small Business Administration programs Deferrals by Loan Category (as of December 31, 2020) Deferrals by Loan Type As of December 31, 2020 As of September 30, 2020 Commercial Deferrals by Sector/Industry * Dollars in thou
Slide 25: COVID-19 Loan Deferrals Continued
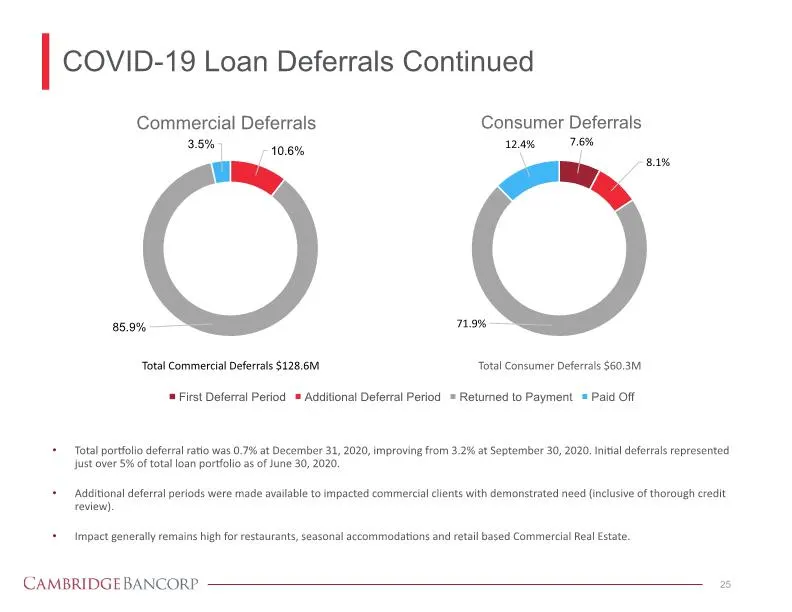
COVID-19 Loan Deferrals Continued 25 Total portfolio deferral ratio was 0.7% at December 31, 2020, improving from 3.2% at September 30, 2020. Initial deferrals represented just over 5% of total loan portfolio as of June 30, 2020. Additional deferral periods were made available to impacted commercial
Slide 26: Loan Portfolio
26 Loan Portfolio CAMBRIDGE BANCORP
Slide 27: Total Assets and Loans
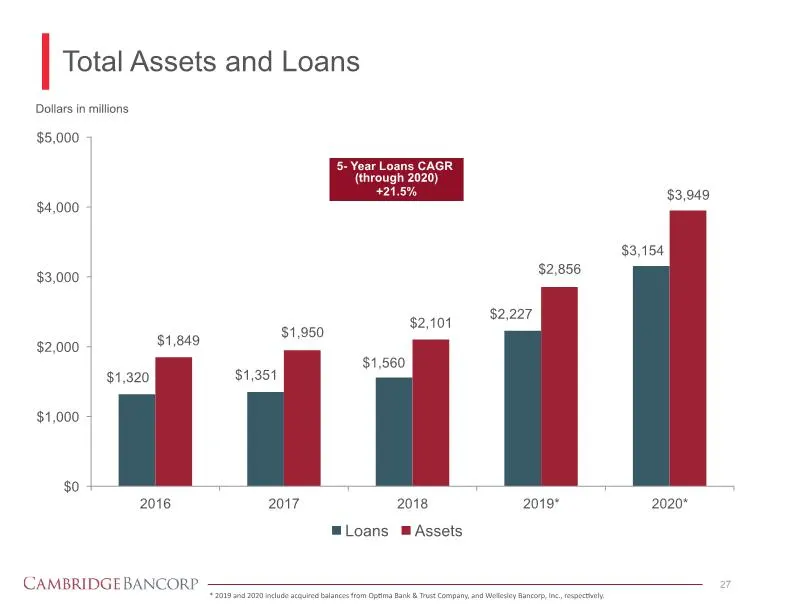
27 Dollars in millions 5- Year Loans CAGR (through 2020) +21.5% Total Assets and Loans * 2019 and 2020 include acquired balances from Optima Bank & Trust Company, and Wellesley Bancorp, Inc., respectively. $5,000 $4,000 $3,000 $2,000 $1,000 $0 2016 $1,320 $1,849 2017 $1,351 $1,950 2018 $1,560 $2,101
Slide 28: Loan Portfolio Detail
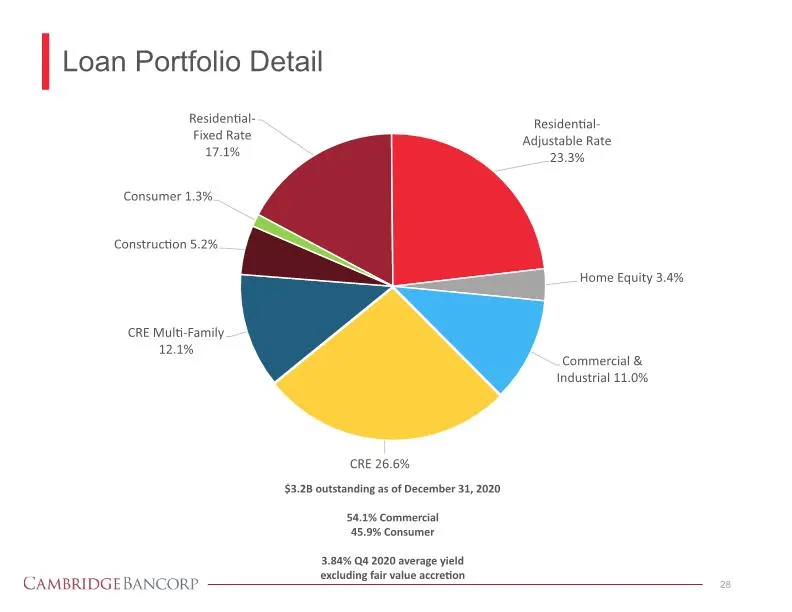
Loan Portfolio Detail 28 $3.2B outstanding as of December 31, 2020 54.1% Commercial 45.9% Consumer 3.84% Q4 2020 average yield excluding fair value accretion Residential-Fixed Rate 17.1% Consumer 1.3% Construction 5.2% CRE Multi-Family 12.1% Residential-Adjustable Rate 23.3% Home Equity 3.4% Commerc
Slide 29: Commercial & Industrial Loan Portfolio
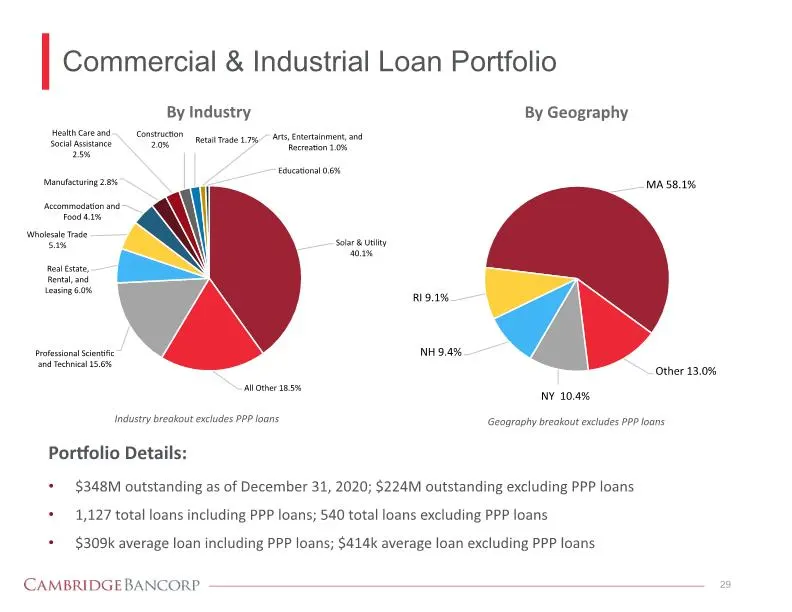
By Industry Industry breakout excludes PPP loans Commercial & Industrial Loan Portfolio 29 By Geography Portfolio Details: $348M outstanding as of December 31, 2020; $224M outstanding excluding PPP loans 1,127 total loans including PPP loans; 540 total loans excluding PPP loans $309k average loan in
Slide 30: Paycheck Protection Program (PPP)
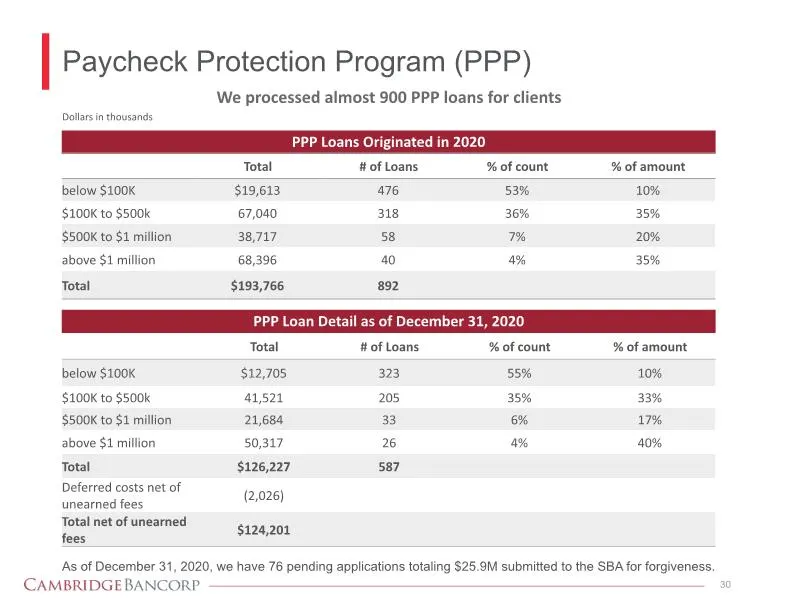
Paycheck Protection Program (PPP) 30 PPP Loans Originated in 2020 Dollars in thousands We processed almost 900 PPP loans for clients As of December 31, 2020, we have 76 pending applications totaling $25.9M submitted to the SBA for forgiveness. PPP Loan Detail as of December 31, 2020 Total # of Loans
Slide 31: Commercial Real Estate Loan Portfolio
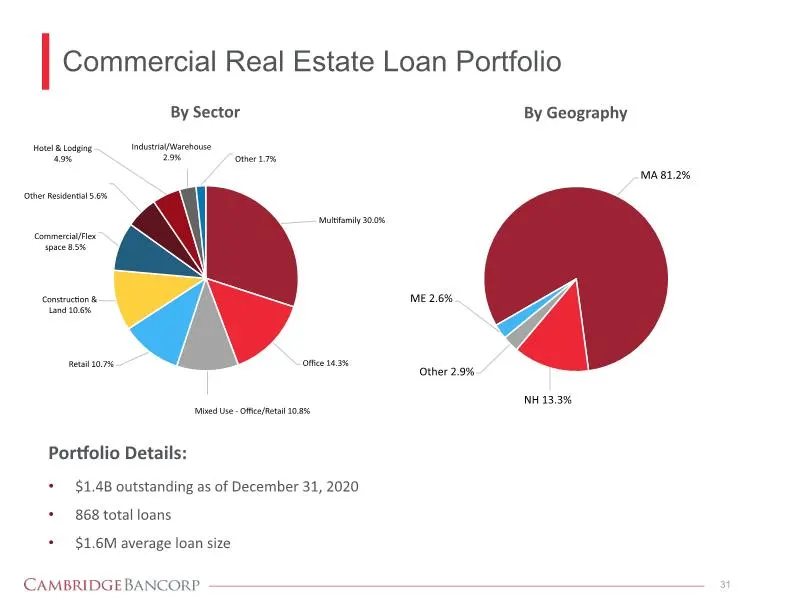
By Sector Commercial Real Estate Loan Portfolio 31 By Geography Portfolio Details: $1.4B outstanding as of December 31, 2020 868 total loans $1.6M average loan size CAMBRIDGE BANCORP Hotel & Lodging 4.9% Industrial/Warehouse 2.9% Other 1.7% Other Residential 5.6% Commercial/Flex space 8.5% Construct
Slide 32: Consumer Loan Portfolio
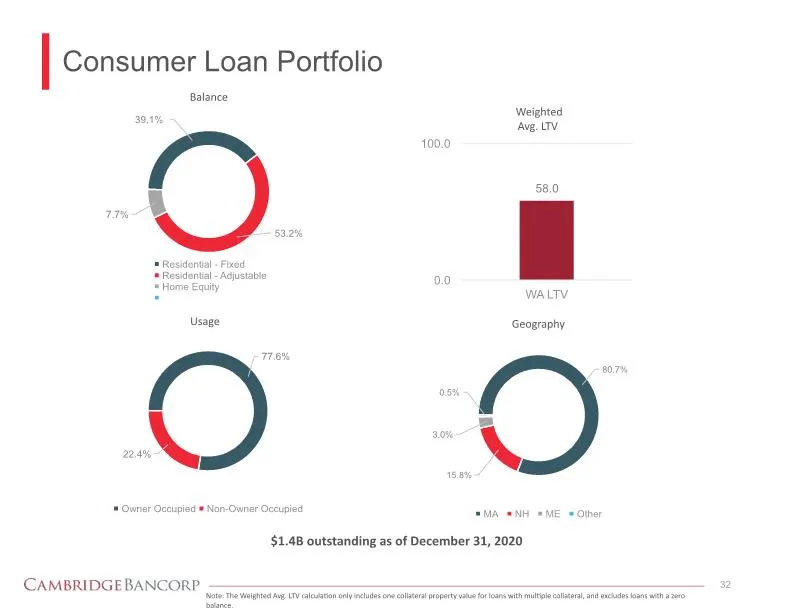
Consumer Loan Portfolio $1.4B outstanding as of December 31, 2020 32 Note: The Weighted Avg. LTV calculation only includes one collateral property value for loans with multiple collateral, and excludes loans with a zero balance. CAMBRIDGE BANCORP Balance 39.1% 7.7% 53.2% Residential – Fixed Resident
Slide 33: Expanding Commercial Services
33 Expanding Commercial Services CAMBRIDGE BANCORP
Slide 34: Historical Commercial Loan Portfolio
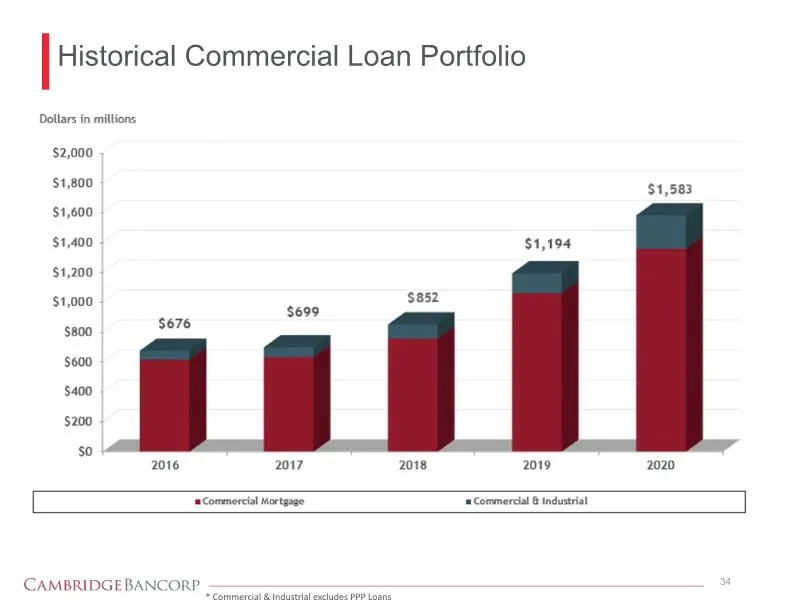
Historical Commercial Loan Portfolio 34 * Commercial & Industrial excludes PPP Loans CAMBRIDGE BANCORP Dollars in millions $ 2,000 $ 1,800 $ 1,600, $ 1,400 $ 1,200 $ 1,000 $800 $ 600 $400 $200 $0 2016 2017 2018 2019 2020 $676 $699 $ $1,194 $1,58 Commercial Mortgage Commercial & Industrial Dollars in
Slide 35: Commercial Banking Highlights
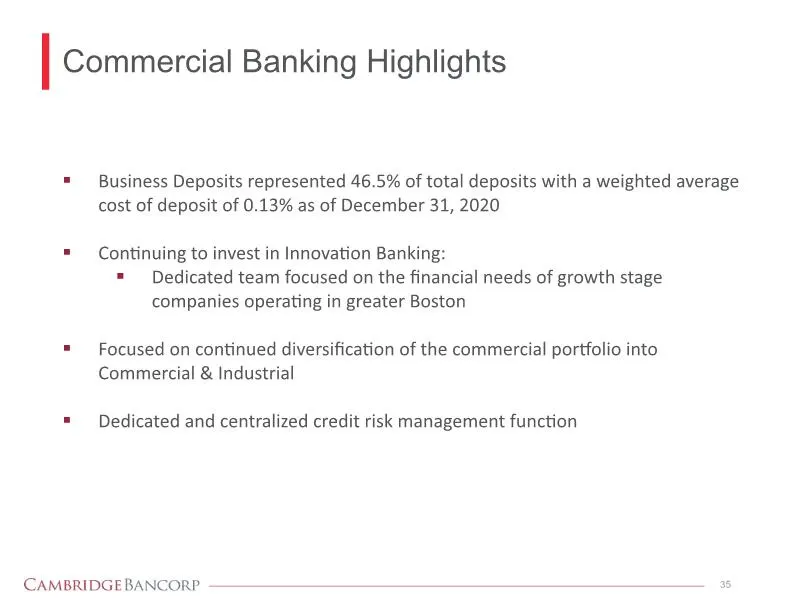
Commercial Banking Highlights 35 Business Deposits represented 46.5% of total deposits with a weighted average cost of deposit of 0.13% as of December 31, 2020 Continuing to invest in Innovation Banking: Dedicated team focused on the financial needs of growth stage companies operating in greater Bos
Slide 36: Low Cost Core Deposits
36 Low Cost Core Deposits CAMBRIDGE BANCORP
Slide 37: Deposit Profile
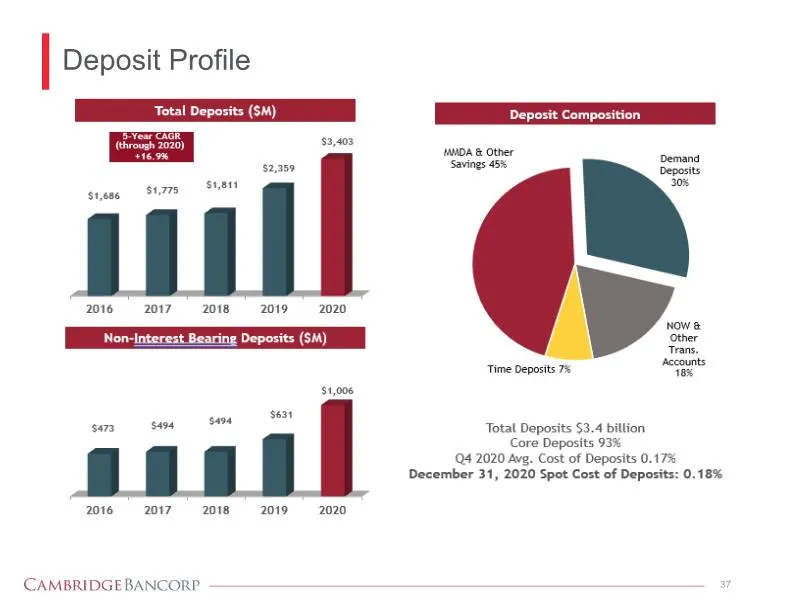
Deposit Profile 37 CAMBRIDGE BANCORP MMDA & Other Saving 45% Demand Deposits 30% Time deposits 7% NOW & Other Trans. Accounts 18% $473 $494 $494 $631 2016 2017 2018 2019 2020 $1,686 $1,775 $1,811 $2,359 $3,403 2016 2017 2018 2019 2020 $473 $494 $494 $631 $1,006 Total Deposits ($M) Non-Interest Beari
Slide 38: Historical Cost of Deposits
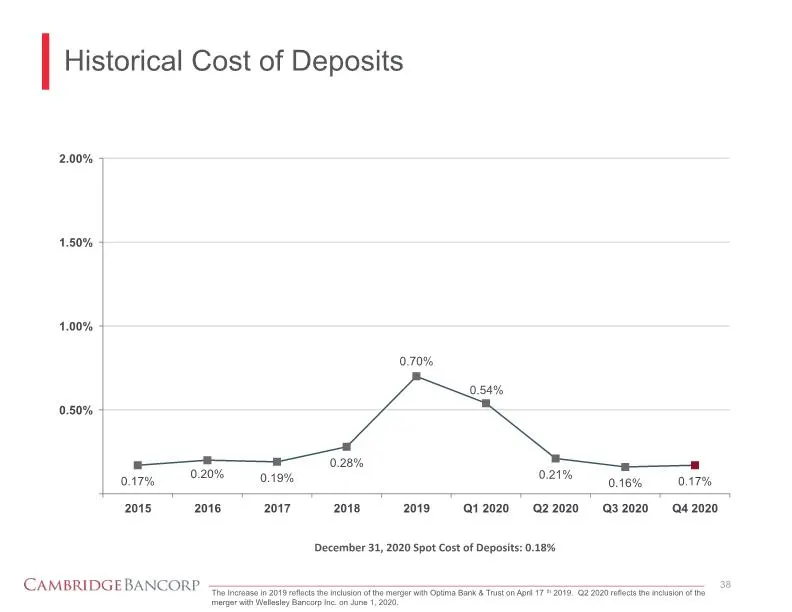
Historical Cost of Deposits 38 38 The Increase in 2019 reflects the inclusion of the merger with Optima Bank & Trust on April 17th 2019. Q2 2020 reflects the inclusion of the merger with Wellesley Bancorp Inc. on June 1, 2020. December 31, 2020 Spot Cost of Deposits: 0.18% CAMBRIDGE BANCORP 2.00% 1.

Slide 39: Financially & Strategically Attractive Mergers
39 Financially & Strategically Attractive Mergers CAMBRIDGE BANCORP
Slide 40: Overview of Merger with Wellesley Bancorp, Inc.
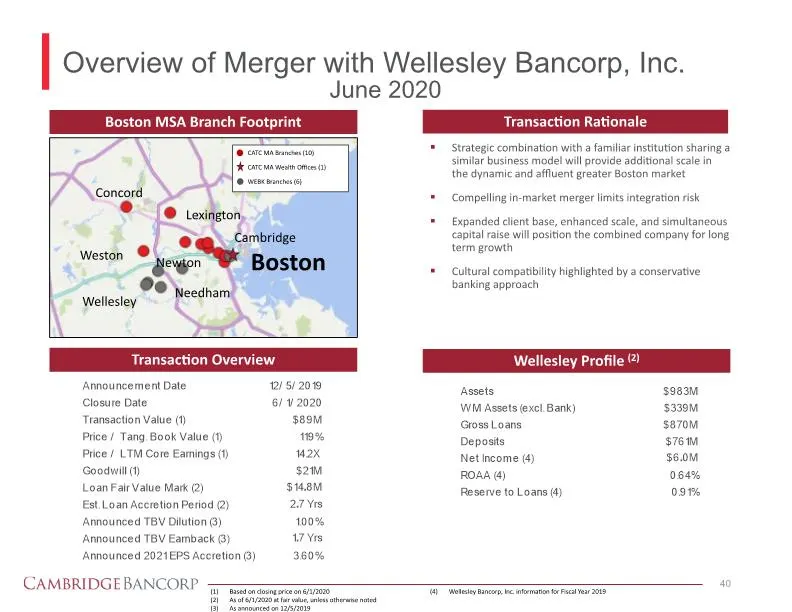
Overview of Merger with Wellesley Bancorp, Inc. 40 Transaction Overview Transaction Rationale Strategic combination with a familiar institution sharing a similar business model will provide additional scale in the dynamic and affluent greater Boston market Compelling in-market merger limits integrat
Slide 41: Overview of Merger with Optima Bank & Trust
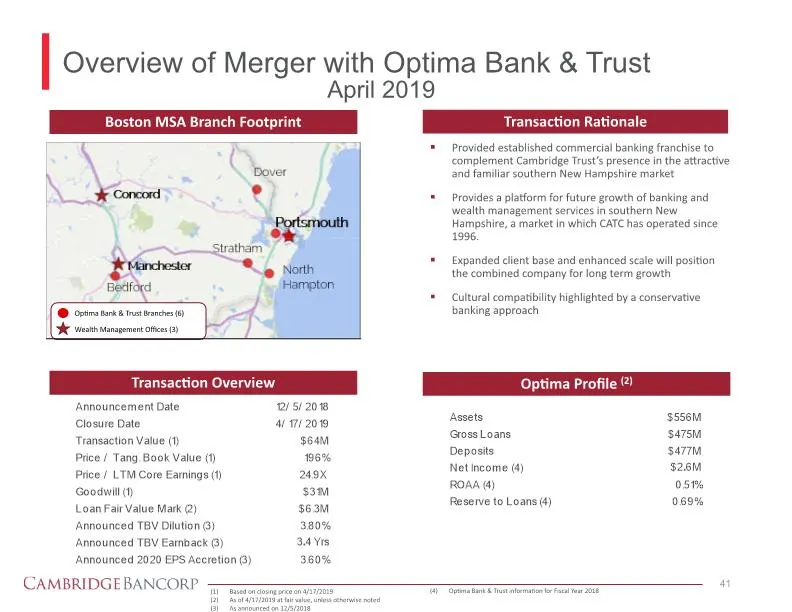
Overview of Merger with Optima Bank & Trust 41 Transaction Overview Transaction Rationale Provided established commercial banking franchise to complement Cambridge Trust’s presence in the attractive and familiar southern New Hampshire market Provides a platform for future growth of banking and wealt
Slide 42: Management Team and Strategic Focus
42 Management Team and Strategic Focus CAMBRIDGE BANCORP
Slide 43: Management Team Profile
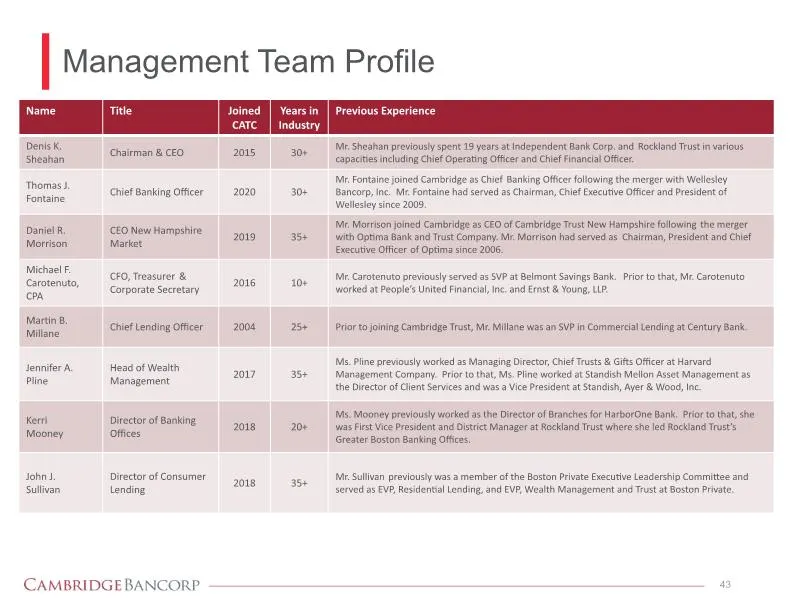
Management Team Profile 43 CAMBRIDGE BANCORP Name Title Joined CATC Years in Industry Previous Experience Denis K. Sheahan Chairman & CEO 2015 30+ Mr. Sheahan previously spent 19 years at Independent Bank Corp. and Rockland Trust in various capacities including Chief Operating Officer and Chief Fina
Slide 44: Recent Strategic Progress
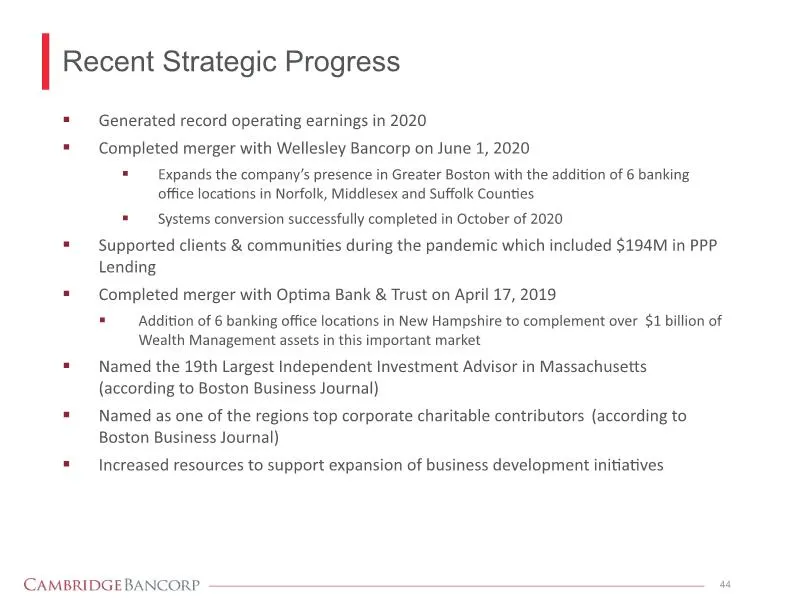
Recent Strategic Progress Generated record operating earnings in 2020 Completed merger with Wellesley Bancorp on June 1, 2020 Expands the company’s presence in Greater Boston with the addition of 6 banking office locations in Norfolk, Middlesex and Suffolk Counties Systems conversion successfully co
Slide 45: Strategic Focus
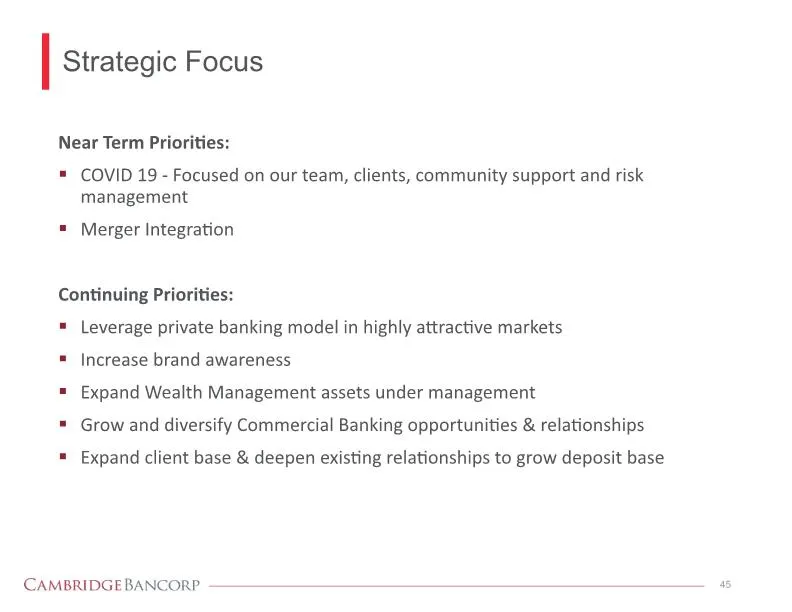
Strategic Focus 45 Near Term Priorities: COVID 19 - Focused on our team, clients, community support and risk management Merger Integration Continuing Priorities: Leverage private banking model in highly attractive markets Increase brand awareness Expand Wealth Management assets under management Grow
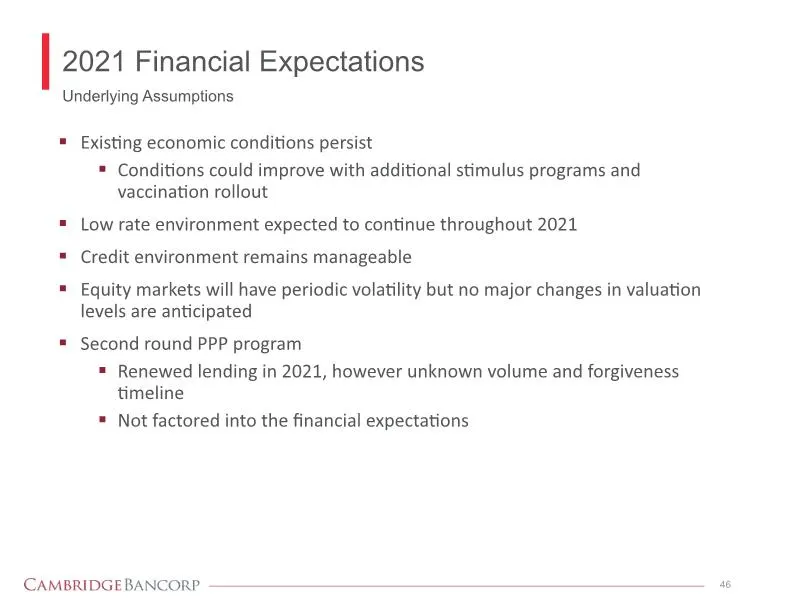
Slide 46: 2021 Financial Expectations: Underlying Assumptions
2021 Financial Expectations 46 Existing economic conditions persist Conditions could improve with additional stimulus programs and vaccination rollout Low rate environment expected to continue throughout 2021 Credit environment remains manageable Equity markets will have periodic volatility but no m
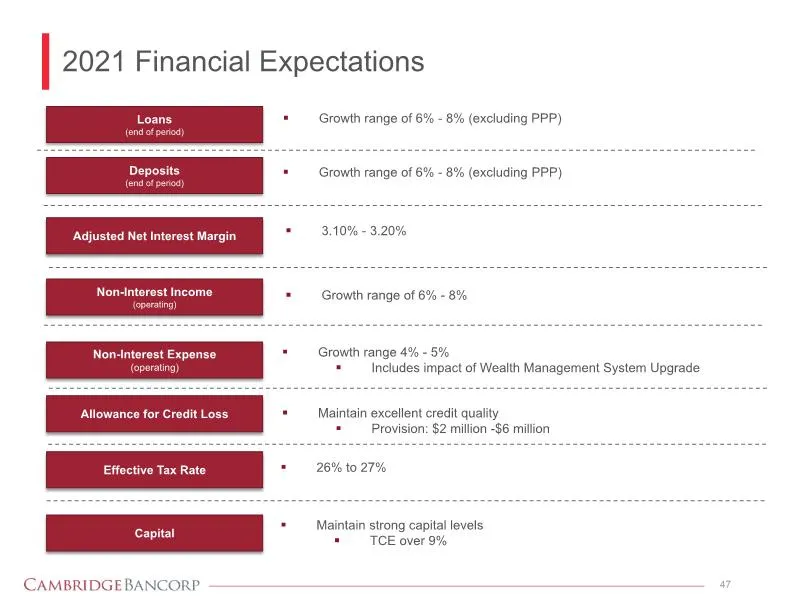
Slide 47: 2021 Financial Expectations
2021 Financial Expectations 47 Loans (end of period) Deposits (end of period) Adjusted Net Interest Margin Non-Interest Income (operating) Allowance for Credit Loss Effective Tax Rate Capital Growth range of 6% - 8% (excluding PPP) Growth range of 6% - 8% (excluding PPP) 3.10% - 3.20% Growth range o

Slide 48: Stock Performance & Dividend
48 Stock Performance & Dividend CAMBRIDGE BANCORP
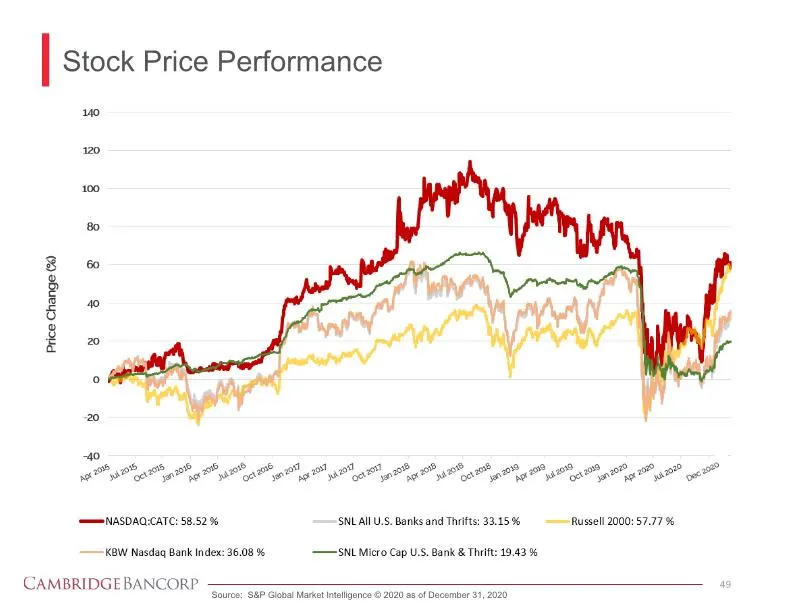
Slide 49: Stock Price Performance
Stock Price Performance 49 Source: S&P Global Market Intelligence © 2020 as of December 31, 2020 CAMBRIDGE BANCORP Price Change (%) -40 -20 0 20 40 60 0 100 120 140 Apr 2015 Jun 2015 Oct 2015 Jan 2016 Apr 2016 Jul 2016 Oct 2016 Jan 2017 Apr 2017 Jun 2017 Oct 2017 Jan 2018 Apr 2018 Jul 2018 oct 2018
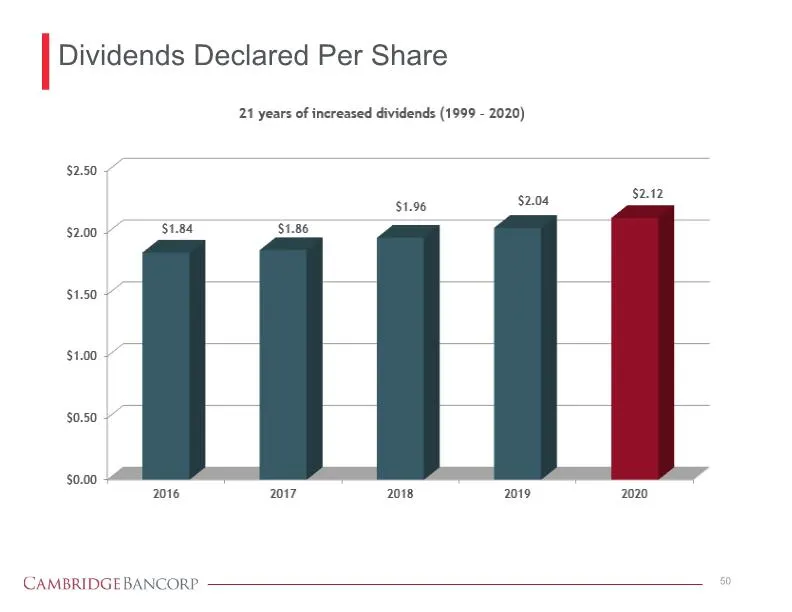
Slide 50: Dividends Declared Per Share
Dividends Declared Per Share 50 21 years of increased dividends (1999 – 2020) $2.50 $2.00 $1.50 $1.00 $0.50 2016 2017 2018 2019 2020 $1.84 $1.86 $1.96 $2.04 $2.12 CAMBRIDGE BANCORP
Slide 51: Why Cambridge Bancorp?
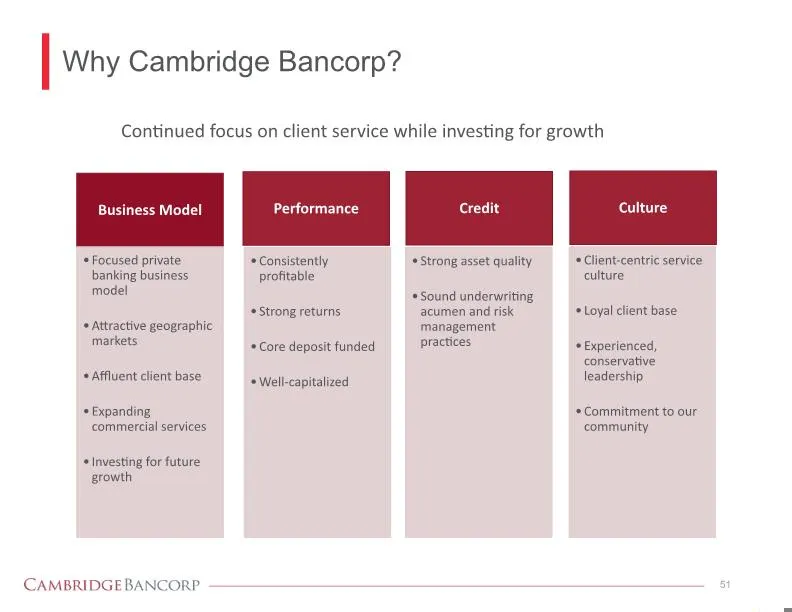
Why Cambridge Bancorp? 51 Continued focus on client service while investing for growth Business Model Performance Credit Culture Focused private banking business model Attractive geographic markets Affluent client base Expanding commercial services Investing for future growth Consistently profitable
Slide 52: Appendix
52 Appendix CAMBRIDGE BANCORP
Slide 53: Appendix - Organic Loan and Deposit Growth Table
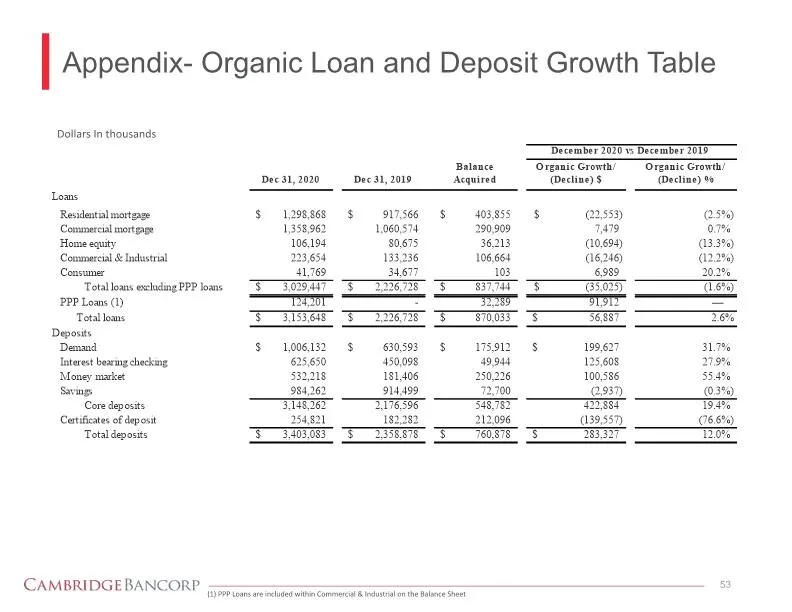
Appendix- Organic Loan and Deposit Growth Table 53 (1) PPP Loans are included within Commercial & Industrial on the Balance Sheet Dollars In thousands Loans Residential mortgage $ 1,298,868$ 917,566$ 403,855$ (22,553) (2.5%) Commercial mortgage 1,358,962 1,060,574 290,909 7,479 0.7%Home equity106,19
Slide 54: Net Interest Income (NII) Sensitivity
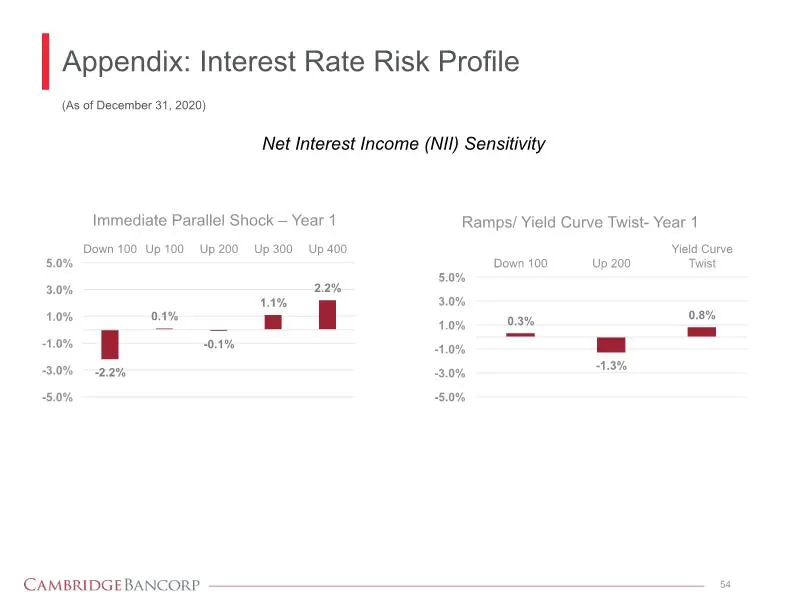
54 Net Interest Income (NII) Sensitivity (As of December 31, 2020) Appendix: Interest Rate Risk Profile Immediate Parallel Shock – Year 1 Down 100 Up 100 Up 200 Up 300 Up 400 5.0% 3.0% 1.0% -1.0% -3.0% -5.0% -2.2% 0.1% -0.1% 1.1% 2.2% Rampa/ Yield Curve Twist- Year 1 Down 100 Up200 Yield Curve Twist
Slide 55: Appendix: GAAP to Non-GAAP Reconciliations
55 Appendix: GAAP to Non-GAAP Reconciliations CAMBRIDGE BANCORP
Slide 56: Appendix – GAAP to Non-GAAP Reconciliations
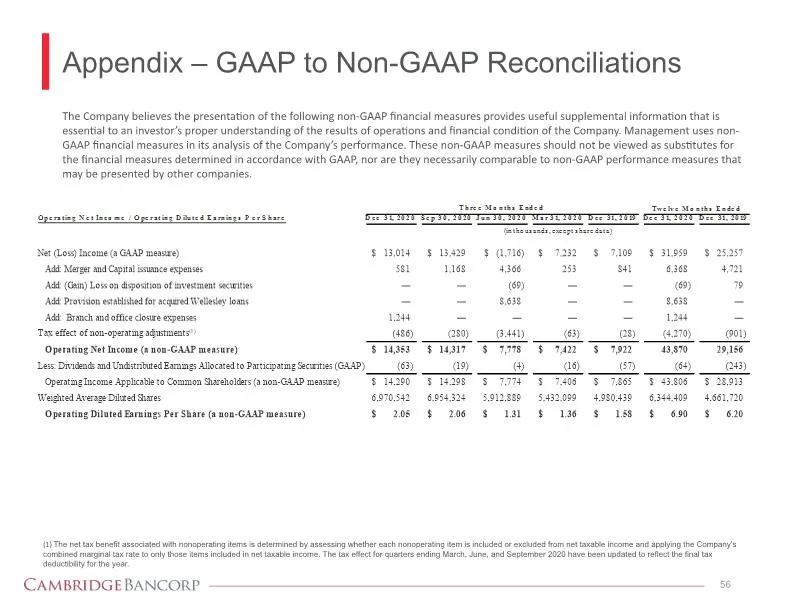
Appendix – GAAP to Non-GAAP Reconciliations 56 The Company believes the presentation of the following non-GAAP financial measures provides useful supplemental information that is essential to an investor’s proper understanding of the results of operations and financial condition of the Company. Mana
Slide 57: Appendix – GAAP to Non-GAAP Reconciliations
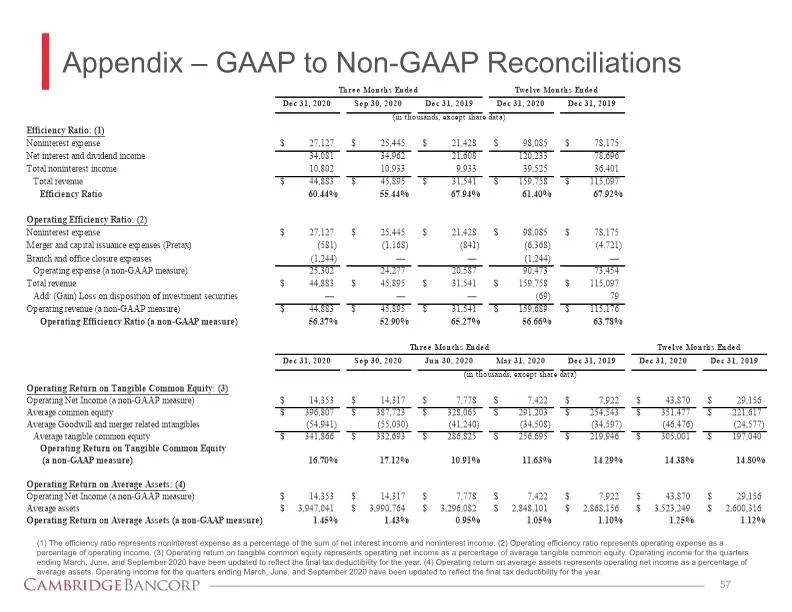
Appendix – GAAP to Non-GAAP Reconciliations 57 (1) The efficiency ratio represents noninterest expense as a percentage of the sum of net interest income and noninterest income. (2) Operating efficiency ratio represents operating expense as a percentage of operating income. (3) Operating return on ta
Slide 58: Appendix – GAAP to Non-GAAP Reconciliations
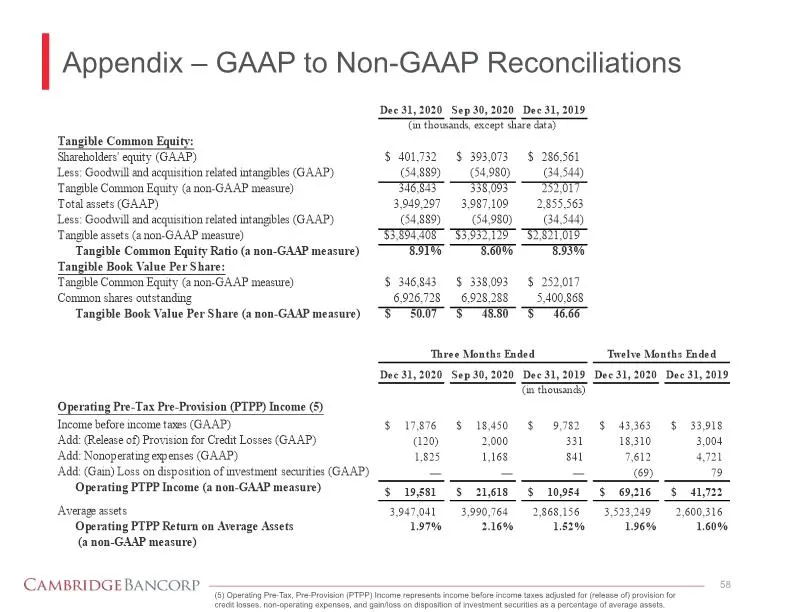
Appendix – GAAP to Non-GAAP Reconciliations 58 (5) Operating Pre-Tax, Pre-Provision (PTPP) Income represents income before income taxes adjusted for (release of) provision for credit losses, non-operating expenses, and gain/loss on disposition of investment securities as a percentage of average asse
Slide 59: Appendix – Net Interest Margin Adjustments
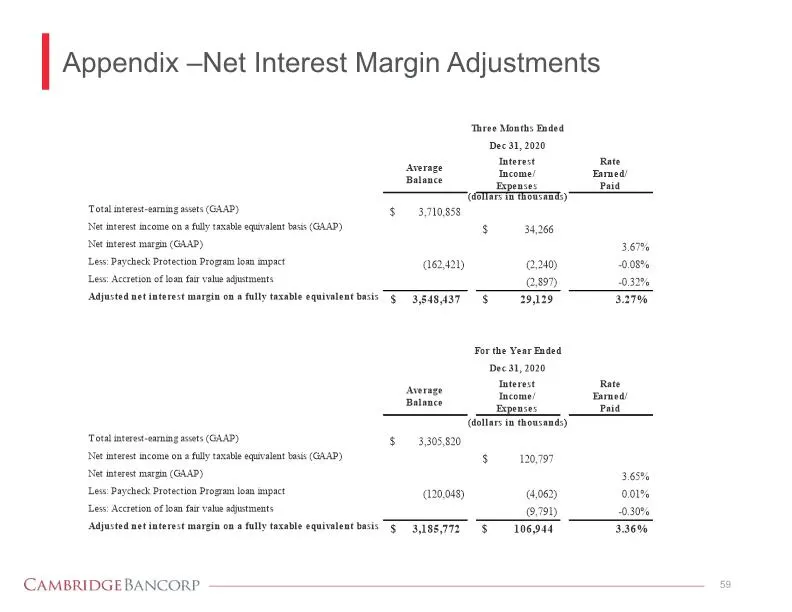
Appendix –Net Interest Margin Adjustments 59 Three Months Ended Average Balance Ended Dec 31, 2020 Average Balance Interest Income/Expenses Rate Earned/Paid (dollars in thousands) Total interest-earning assets (GAAP) $3,710,858 Net interest income on a fully taxable equivalent basis (GAAP) $34,266 N

Slide 60: Cambridge Bancorp Parent of Cambridge Trust Company
60 Cambridge Bancorp Parent of Cambridge Trust Company Denis K. Sheahan Chairman and Chief Executive Officer 617-441-1533 Michael F. Carotenuto Senior Vice President and Chief Financial Officer 617-520-5520 CAMBRIDGE BANCORP
Source: SEC EDGAR · 8-K filed Jan 26, 2021
More decks from Cambridge Bancorp
 Investor Presentation (April 2024)18 slides · Apr 23, 2024
 Investor Presentation (July 2023)27 slides · Jul 18, 2023
 Investor Presentation (April 2023)27 slides · Apr 25, 2023
 Investor Presentation (January 2023)30 slides · Jan 24, 2023
 Investor Presentation (October 2022)31 slides · Oct 18, 2022
 Investor Presentation (July 2022)31 slides · Jul 19, 2022