Barratt Redrow plc · LSE:BTRW
Barratt Redrow — Barratt Developments — H1 2012 Earnings Presentation
61 slides from Barratt Redrow's earnings presentation, Feb 22, 2012
Slide 1: Results presentation Half year ended 31 December 2011
Half Year 2012 1 Results presentation Half year ended 31 December 2011 22 February 2012
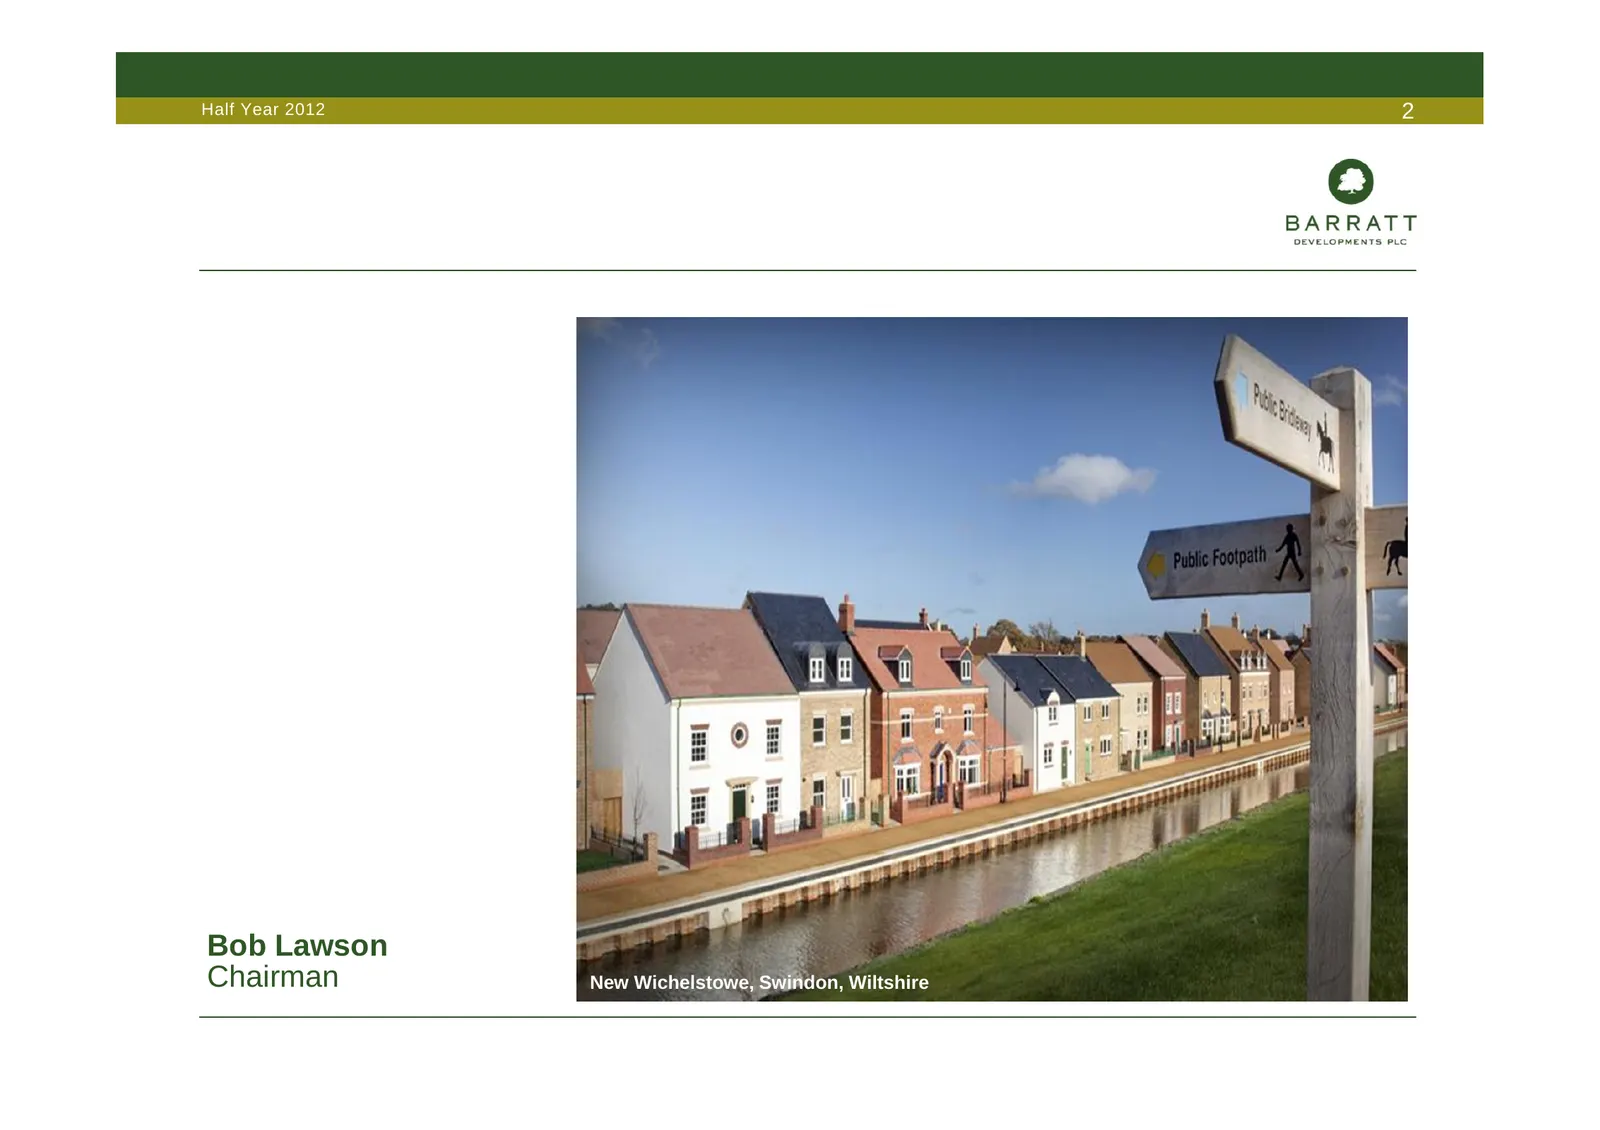
Slide 2: Bob Lawson, Chairman
Half Year 2012 2 Bob Lawson Chairman New Wichelstowe, Swindon, Wiltshire
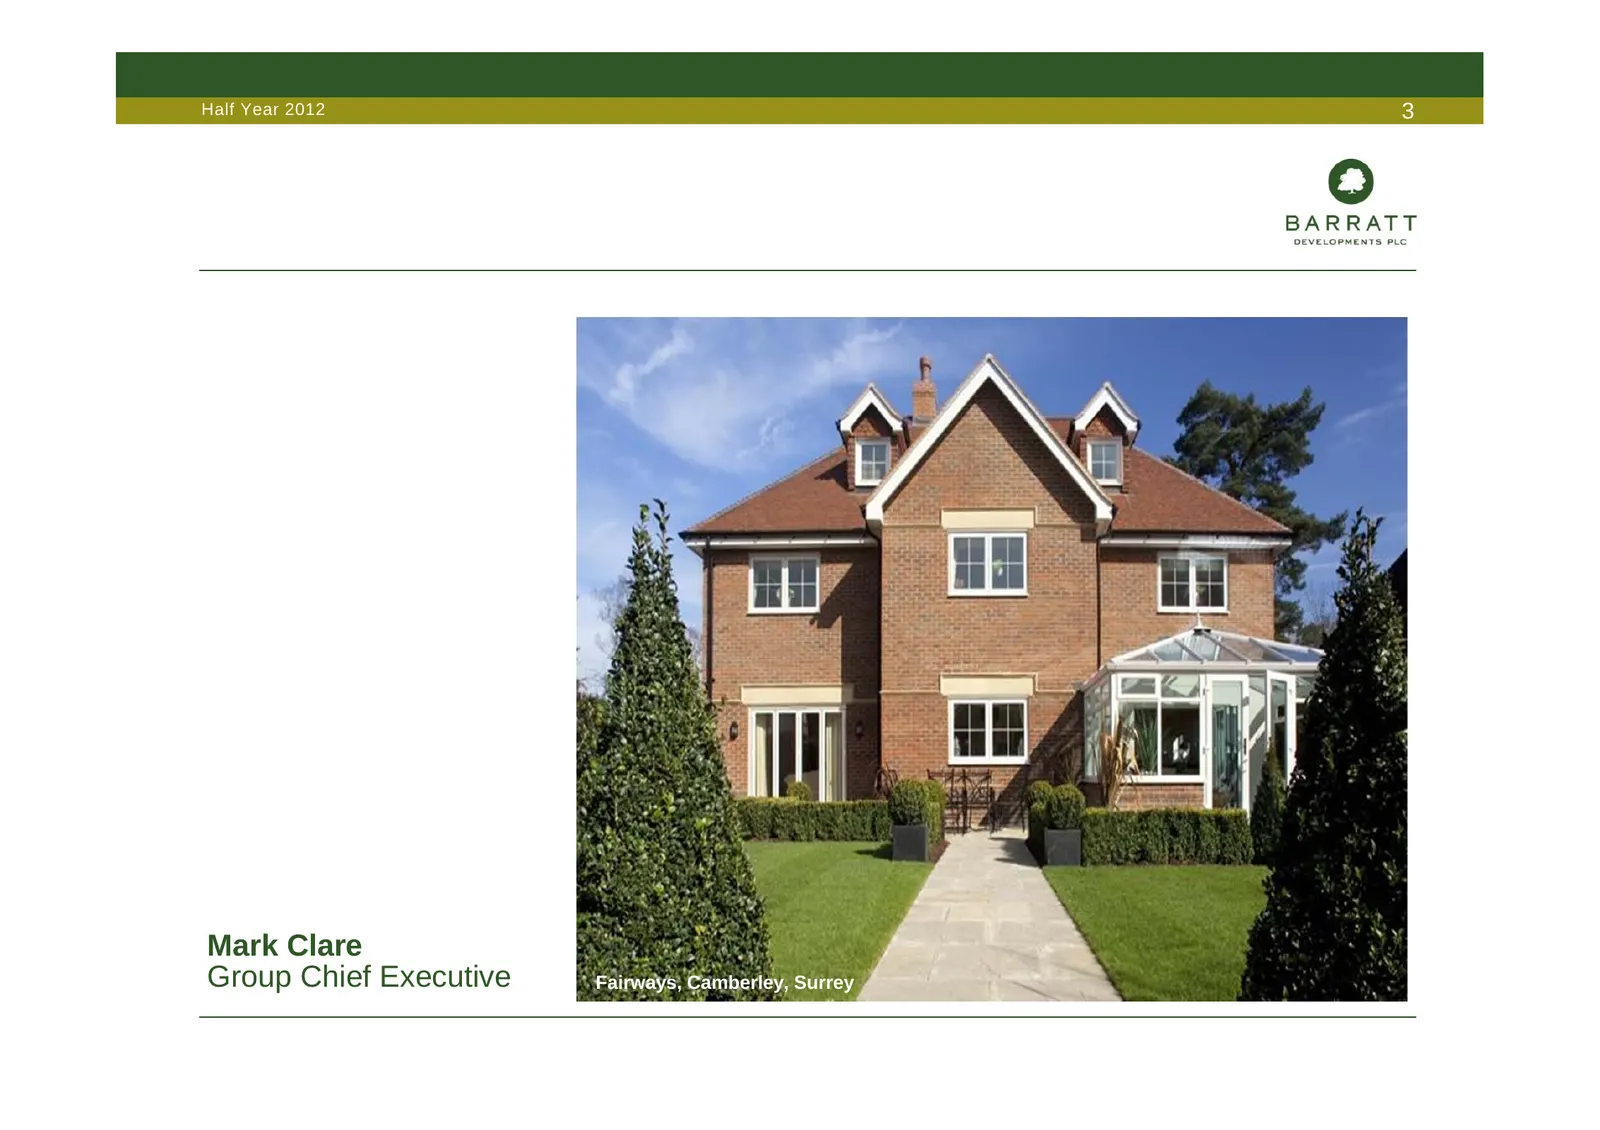
Slide 3: Mark Clare, Group Chief Executive
Half Year 2012 3 Mark Clare Group Chief Executive Fairways, Camberley, Surrey
Slide 4: Overview
Half Year 2012 4 Overview • Market update • Key highlights & sales performance • Barratt’s capabilities • Key objectives • Government’s housing strategy • Current trading and outlook
Slide 5: Market update
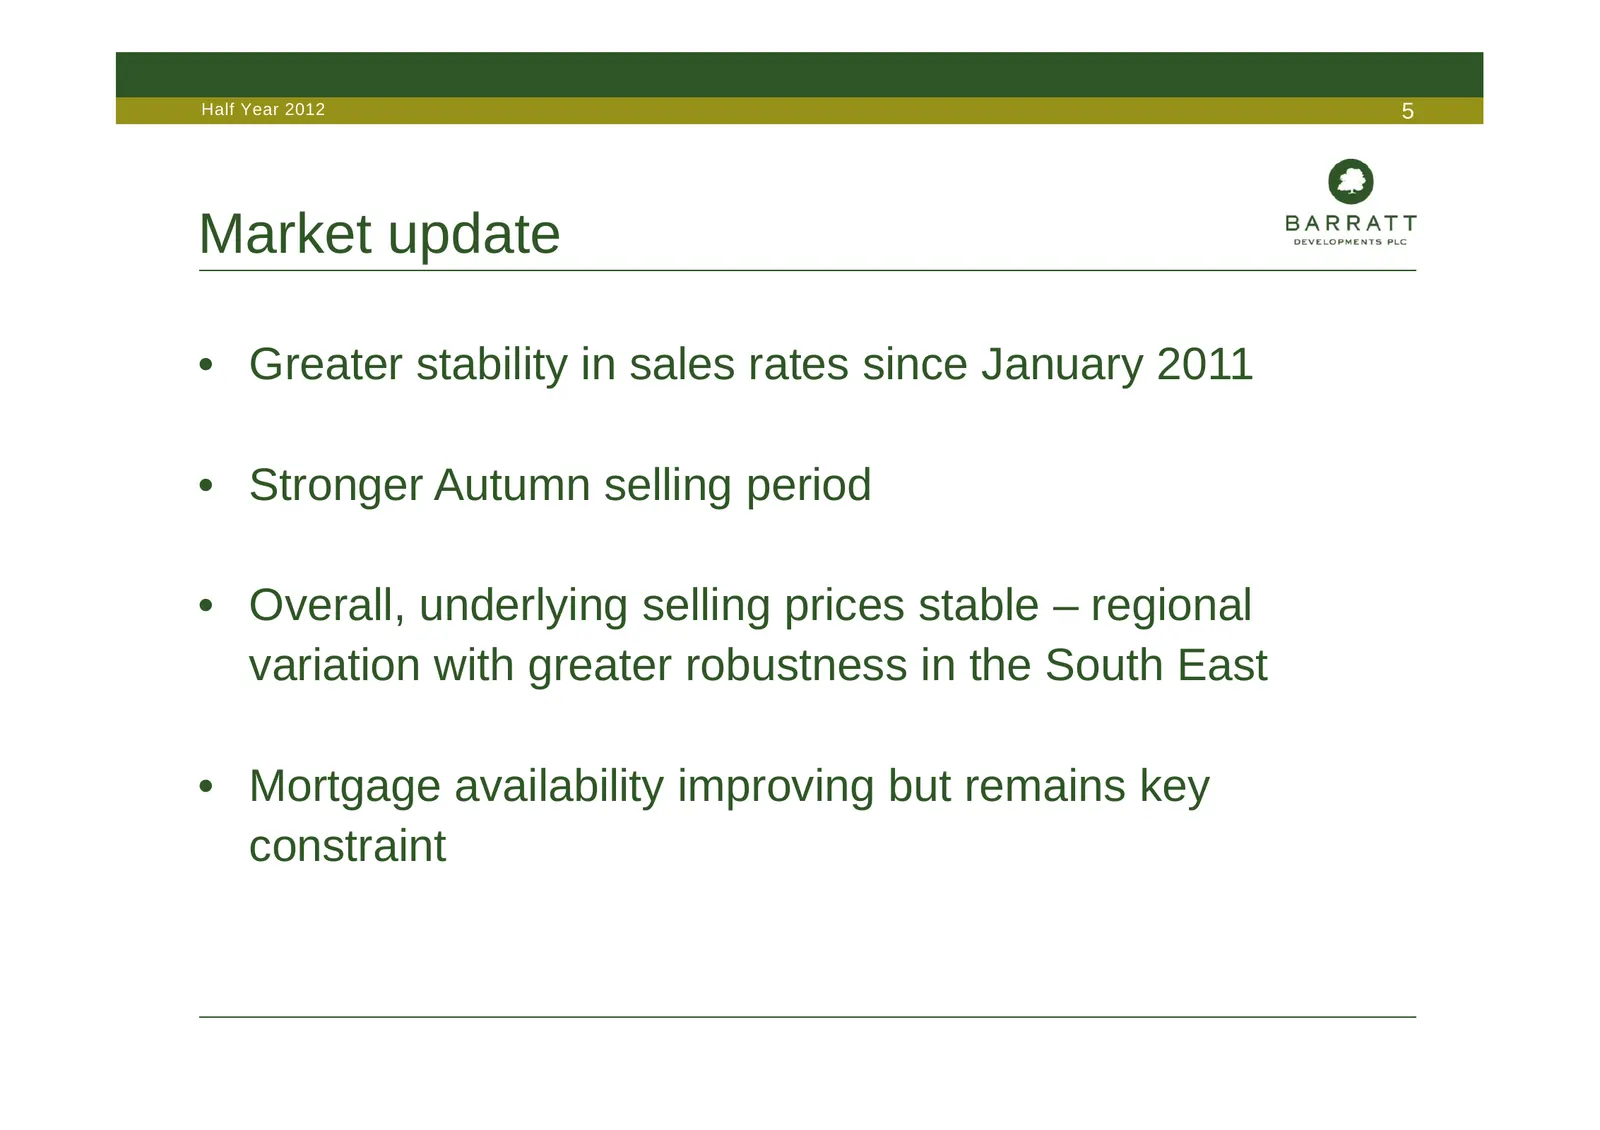
Half Year 2012 5 Market update • Greater stability in sales rates since January 2011 • Stronger Autumn selling period • Overall, underlying selling prices stable – regional variation with greater robustness in the South East • Mortgage availability improving but remains key constraint
Slide 6: Key highlights for H1 2011/12
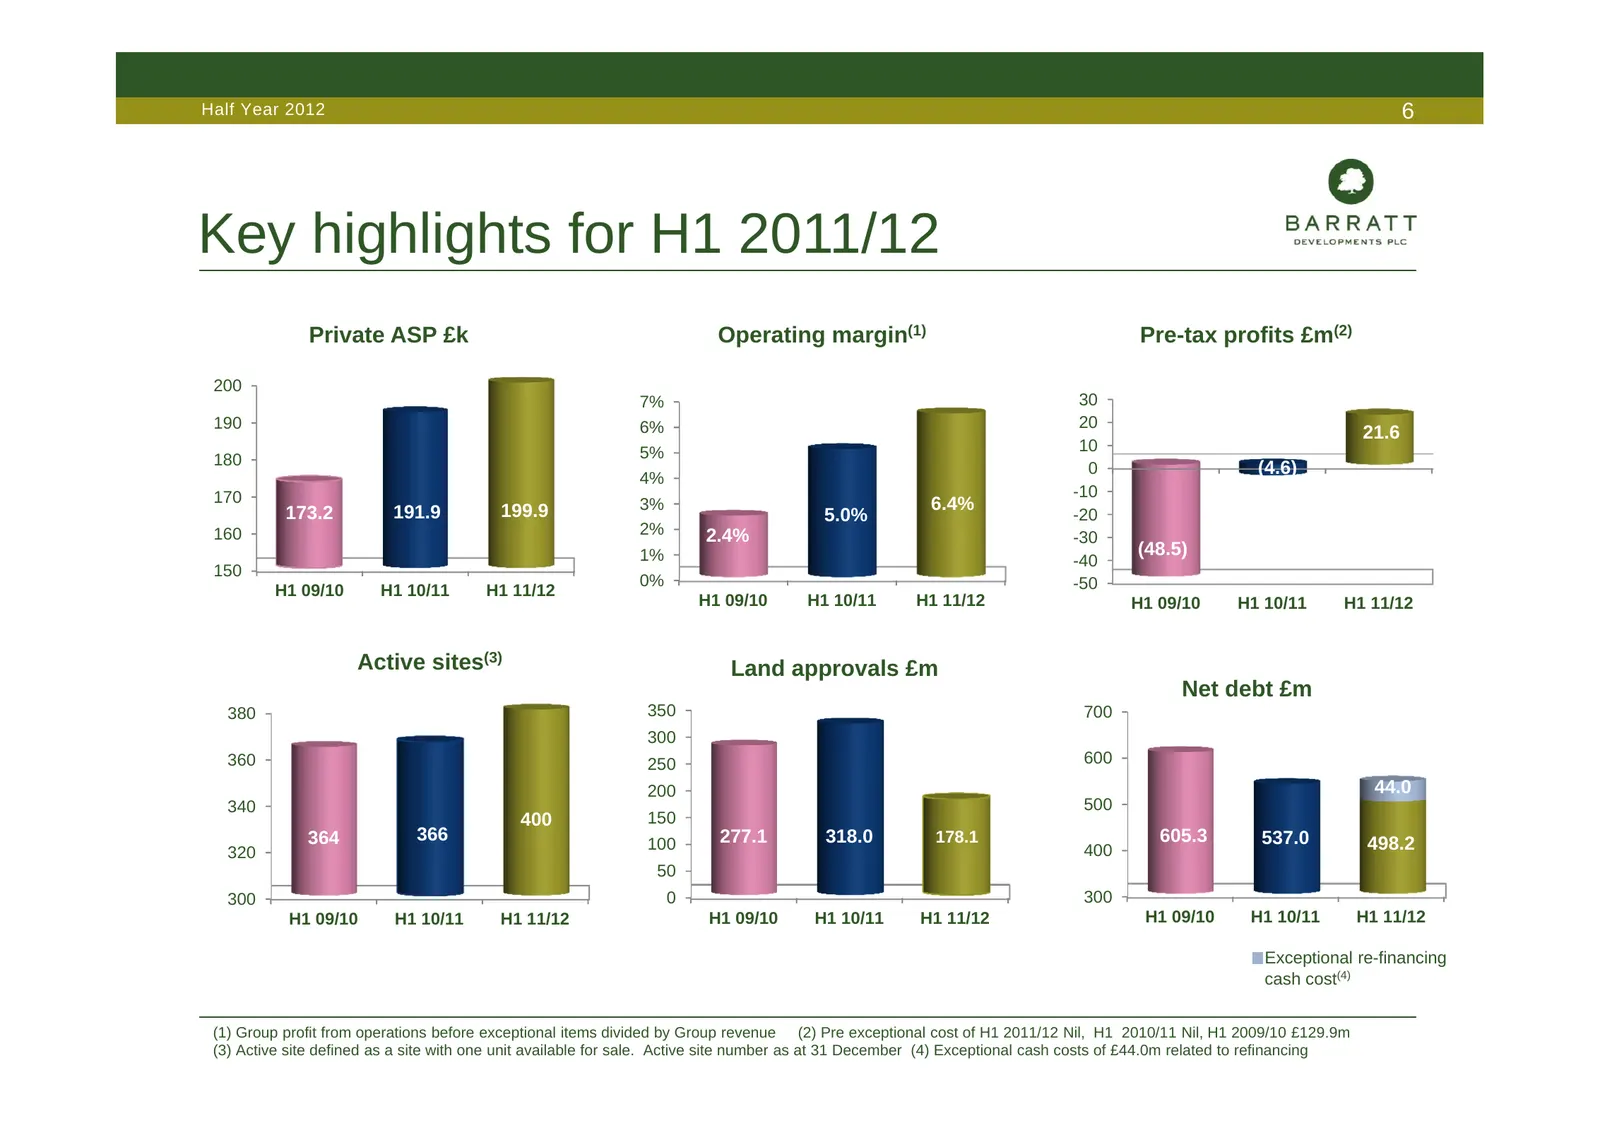
Half Year 2012 6 Key highlights for H1 2011/12 Private ASP £k Operating margin(1) Pre-tax profits £m(2) 200 7% 30 190 6% 20 21.6 5% 10 180 (4.6) 0 4% 170 -10 173.2 191.9 199.9 3% 6.4% 5.0% -20 160 2% 2.4% -30 1% (48.5) -40 150 0% -50 H1 09/10 H1 10/11 H1 11/12 H1 09/10 H1 10/11 H1 11/12 H1 09/10 H1
Slide 7: Private reservations
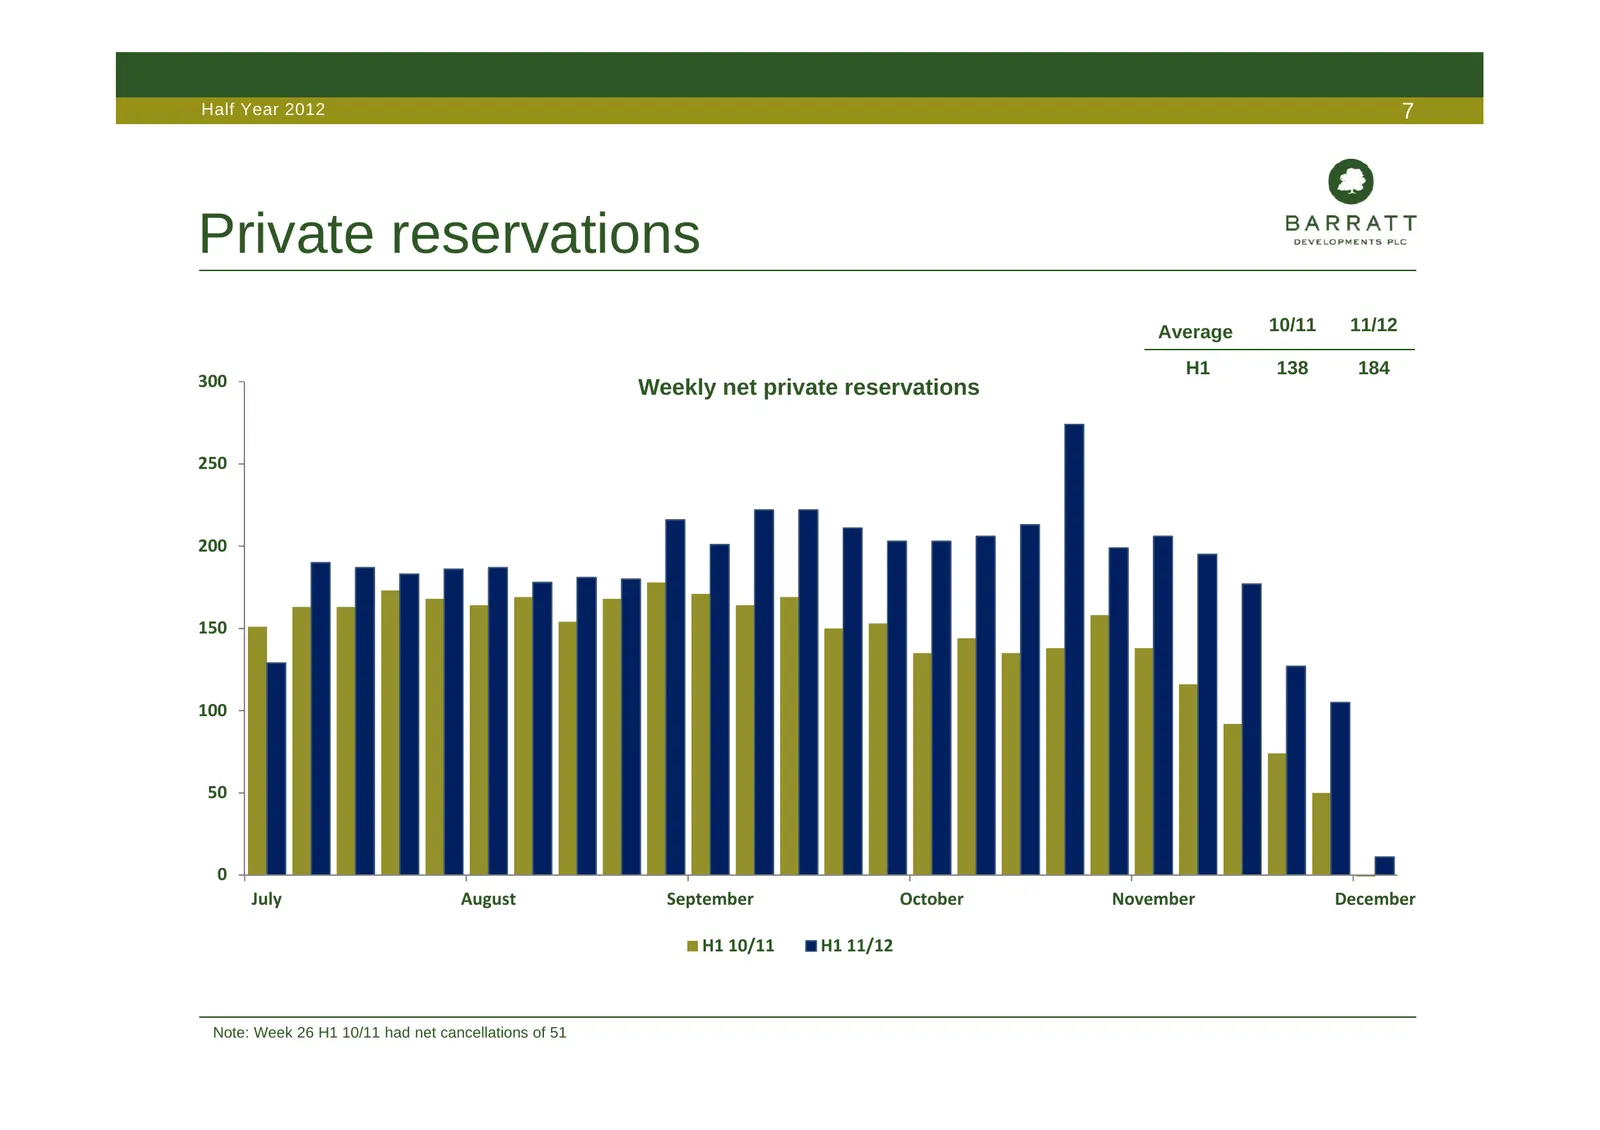
Half Year 2012 7 Private reservations Average 10/11 11/12 H1 138 184 300 Weekly net private reservations 250 200 150 100 50 0 July August September October November December H1 10/11 H1 11/12 Note: Week 26 H1 10/11 had net cancellations of 51
Slide 8: Private sales rates & active sites
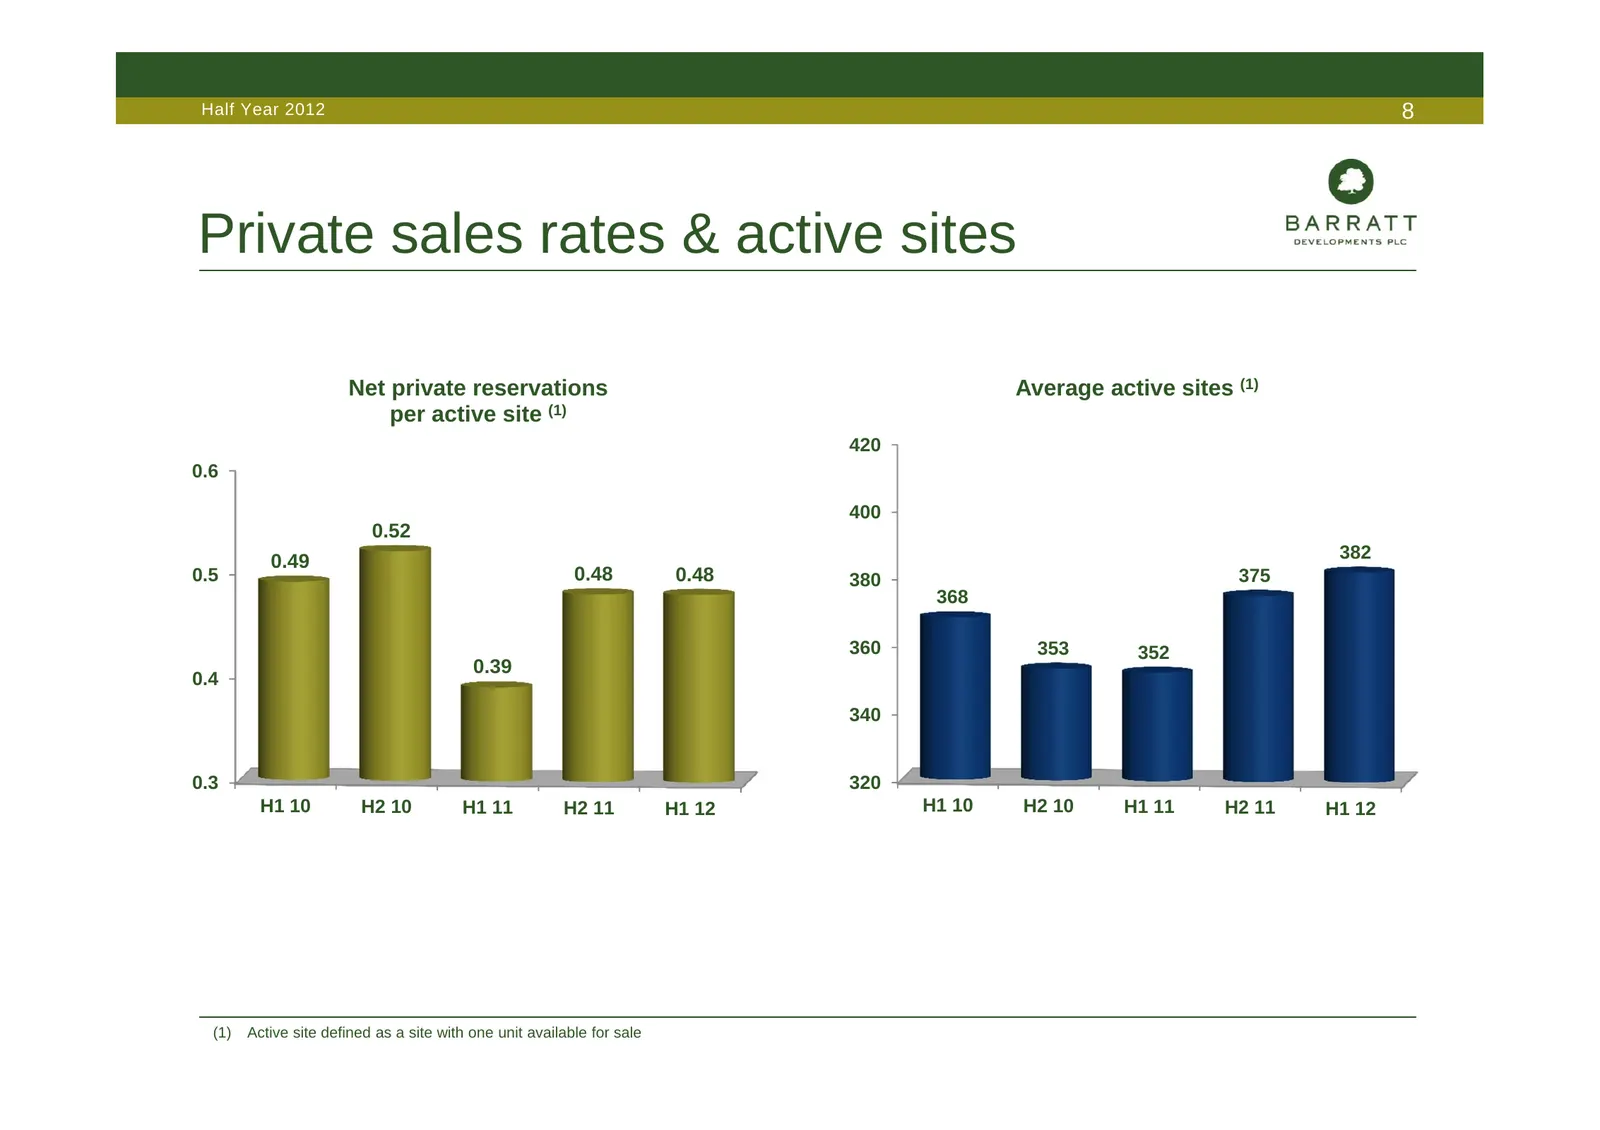
Half Year 2012 8 Private sales rates & active sites Net private reservations Average active sites (1) per active site (1) 420 0.6 400 0.52 0.49 382 0.5 0.48 0.48 380 375 368 360 353 352 0.39 0.4 340 0.3 320 H1 10 H2 10 H1 11 H2 11 H1 12 H1 10 H2 10 H1 11 H2 11 H1 12 (1) Active site defined as a site
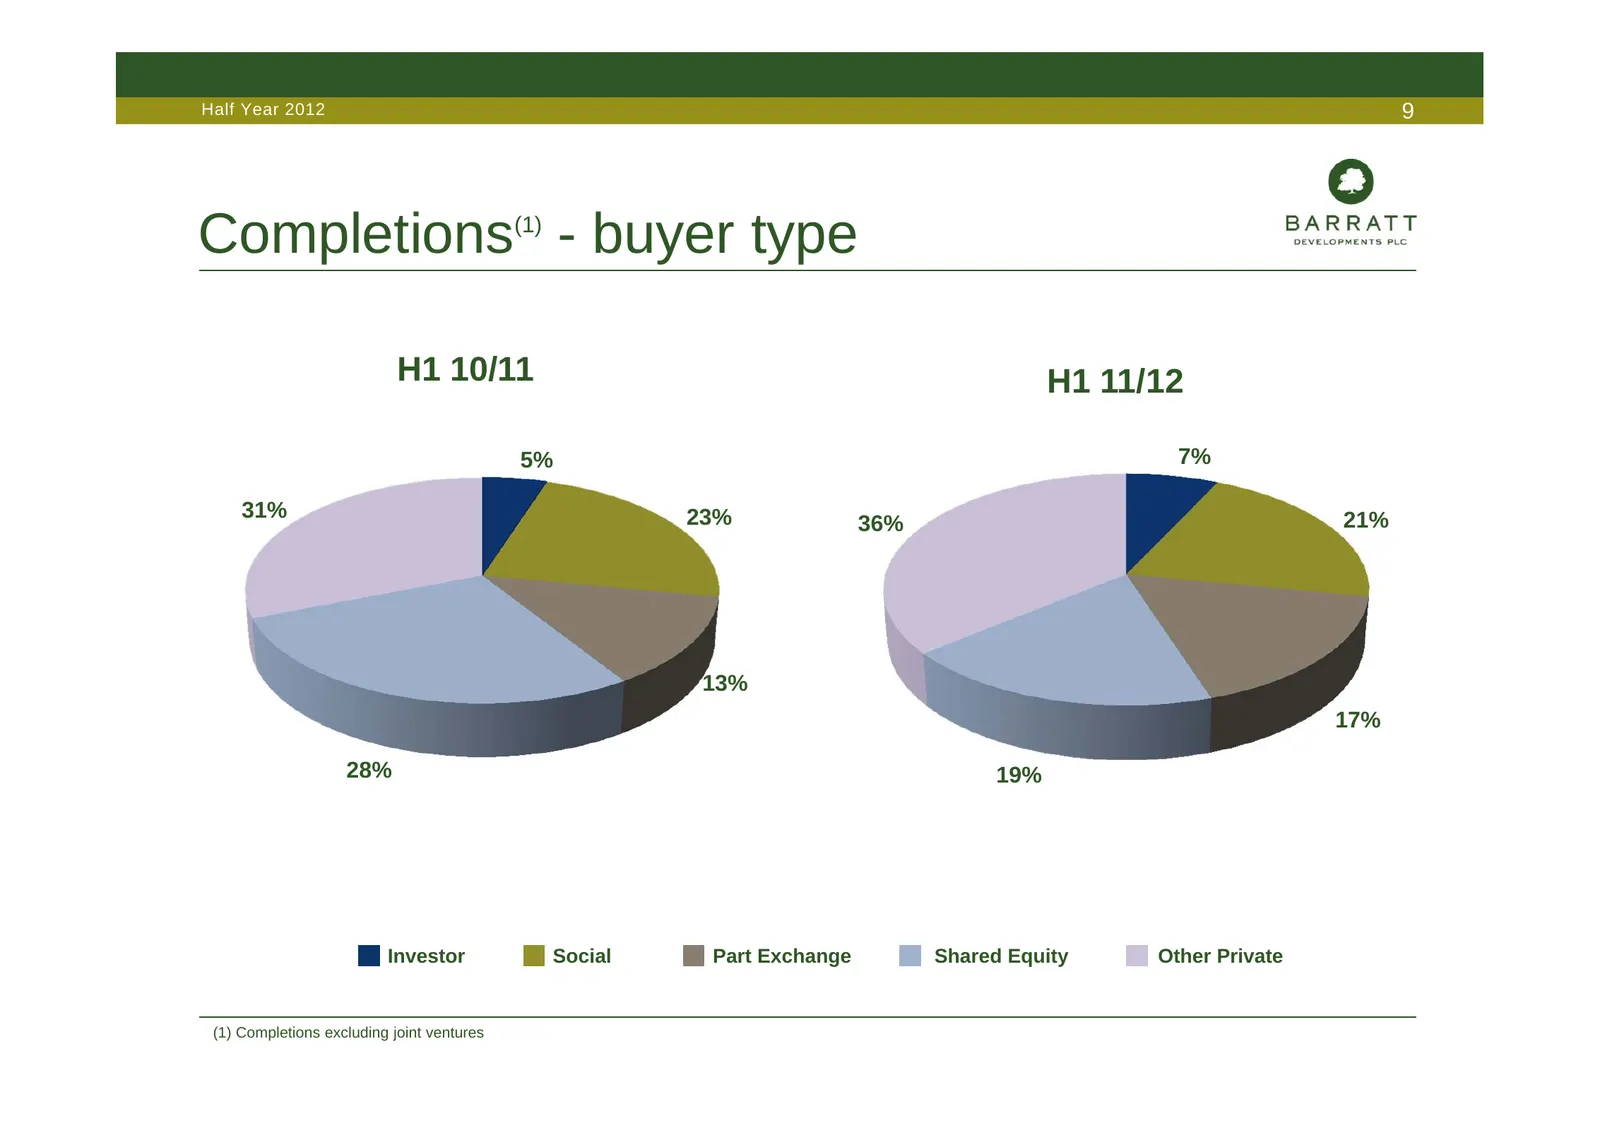
Slide 9: Completions - buyer type
Half Year 2012 9 Completions - buyer type (1) H1 10/11 H1 11/12 5% 7% 31% 23% 21% 36% 13% 17% 28% 19% Investor Social Part Exchange Shared Equity Other Private (1) Completions excluding joint ventures
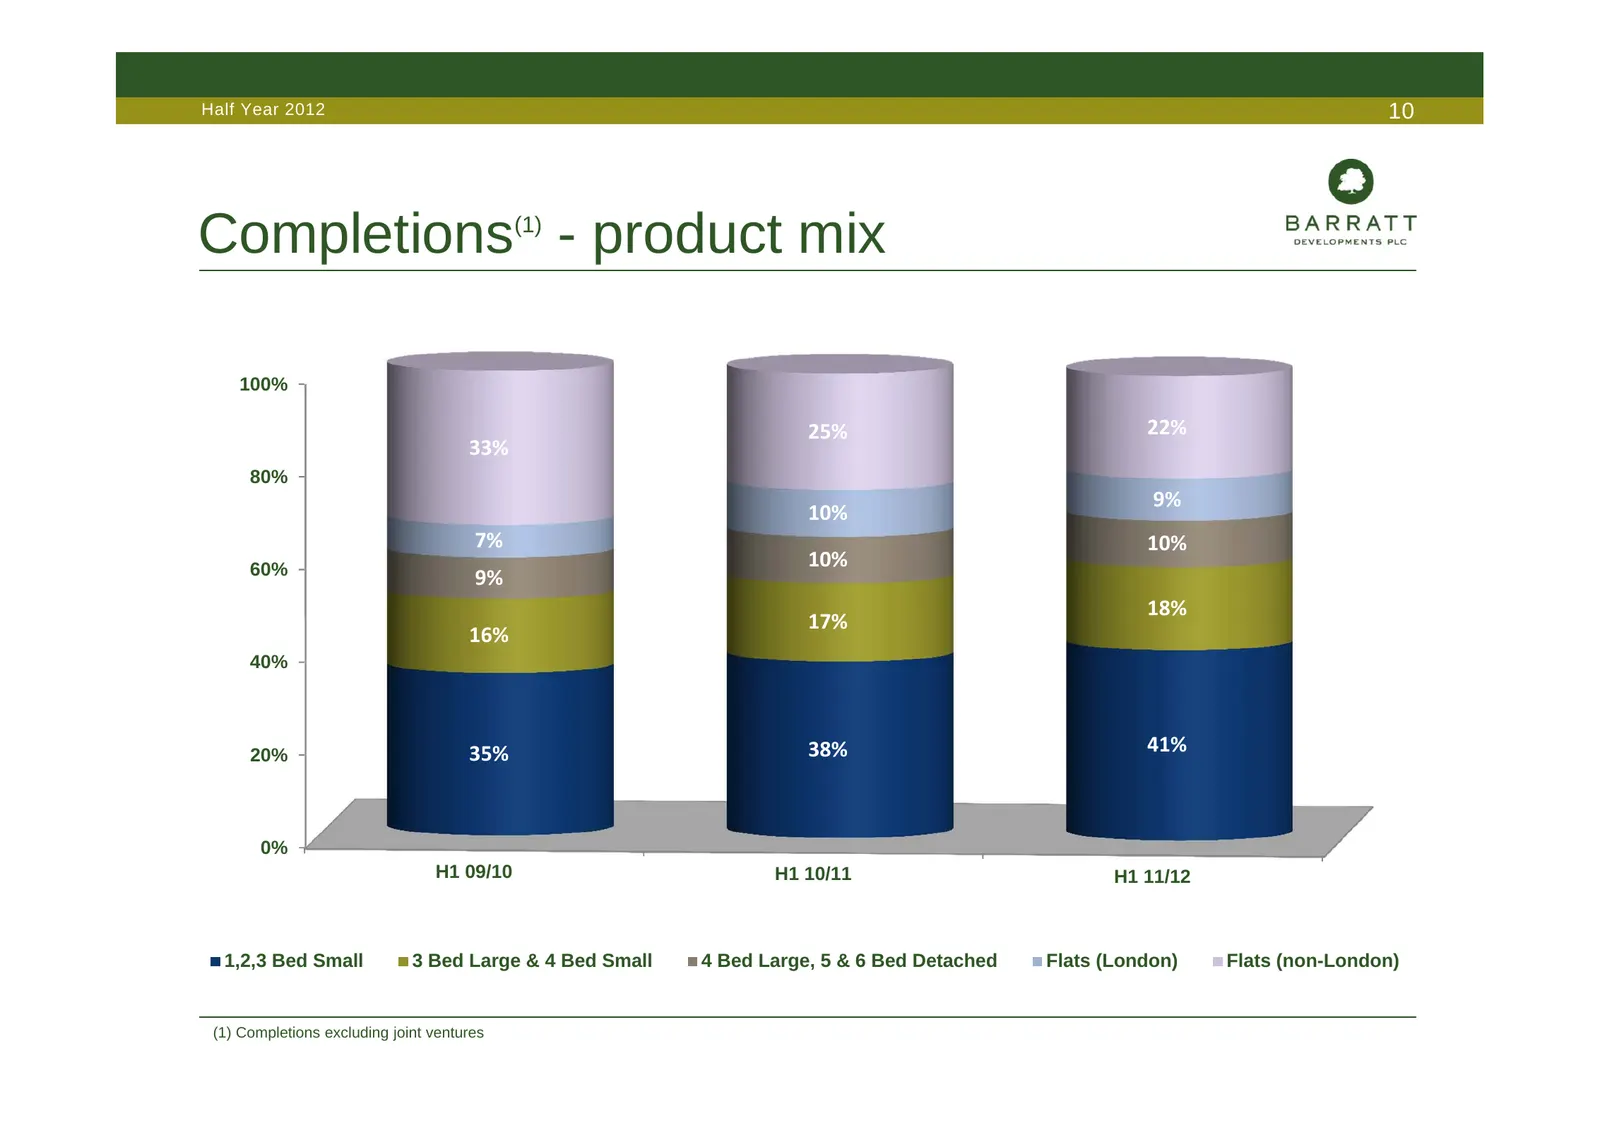
Slide 10: Completions - product mix
Half Year 2012 10 Completions - product mix (1) 100% 25% 22% 33% 80% 9% 10% 7% 10% 60% 10% 9% 18% 17% 16% 40% 20% 35% 38% 41% 0% H1 09/10 H1 10/11 H1 11/12 1,2,3 Bed Small 3 Bed Large & 4 Bed Small 4 Bed Large, 5 & 6 Bed Detached Flats (London) Flats (non-London) (1) Completions excluding joint vent
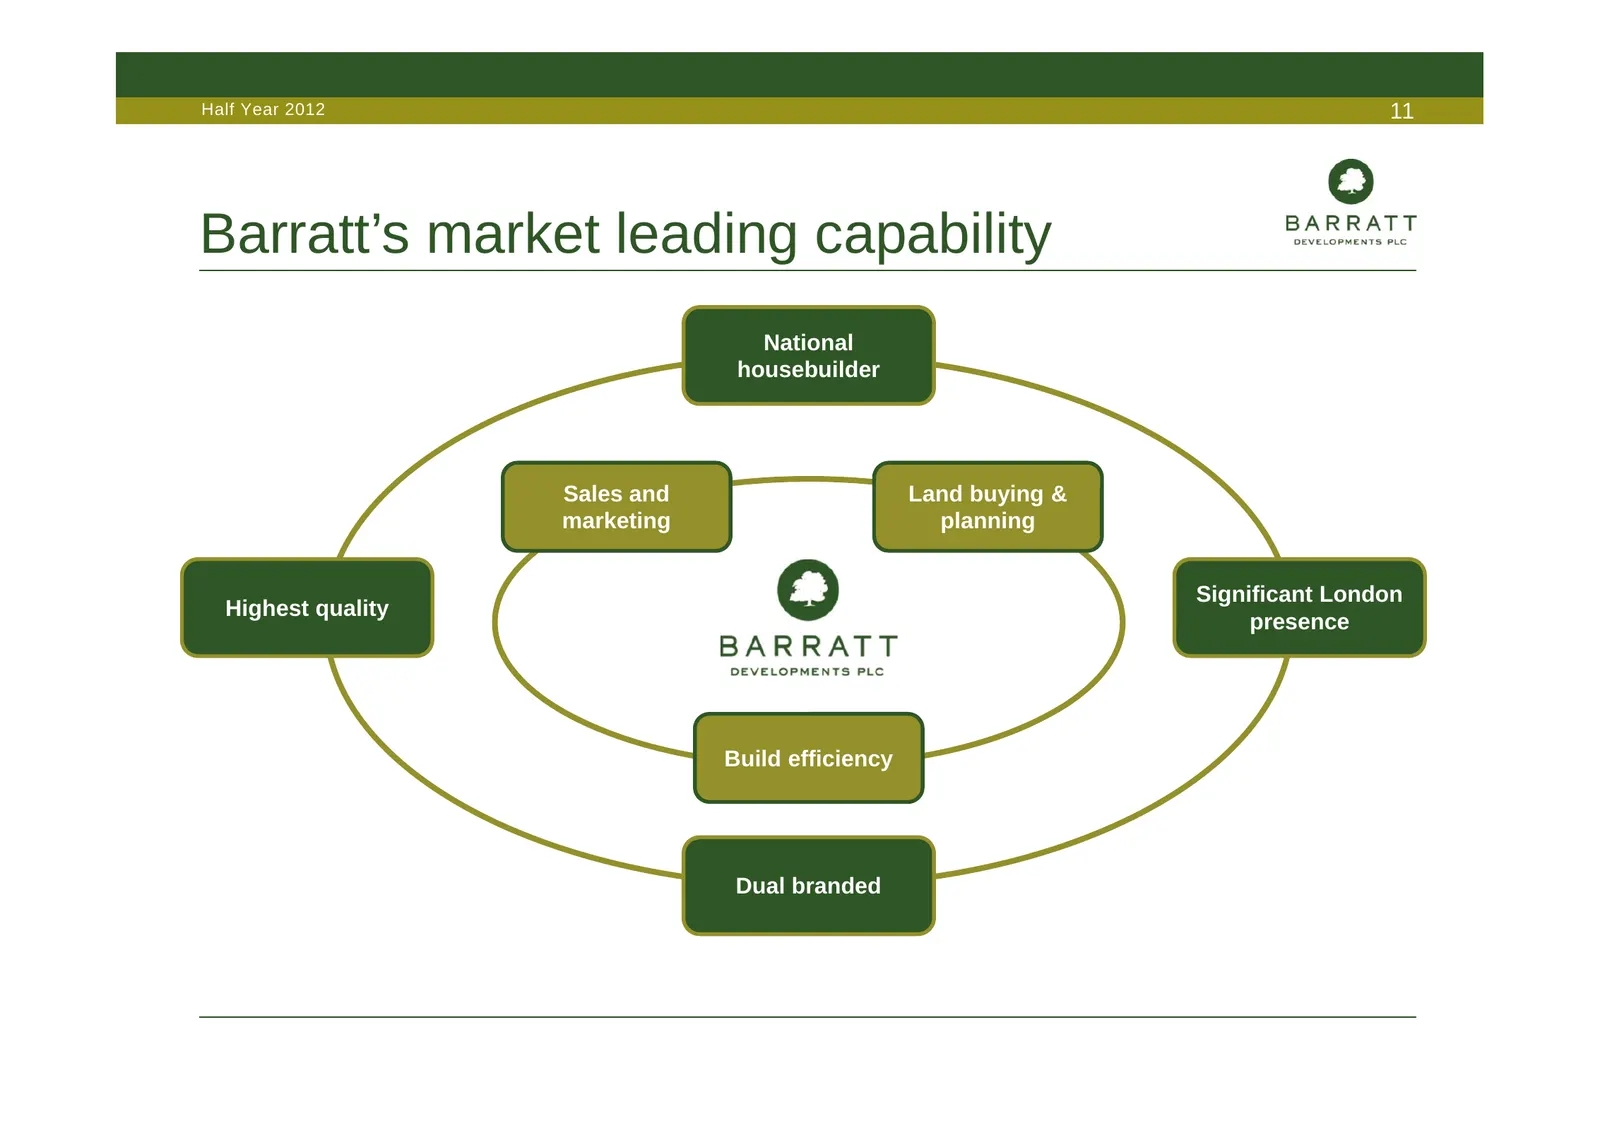
Slide 11: Barratt's market leading capability
Half Year 2012 11 Barratt’s market leading capability National housebuilder Sales and Land buying & marketing planning Significant London Highest quality presence Build efficiency Dual branded
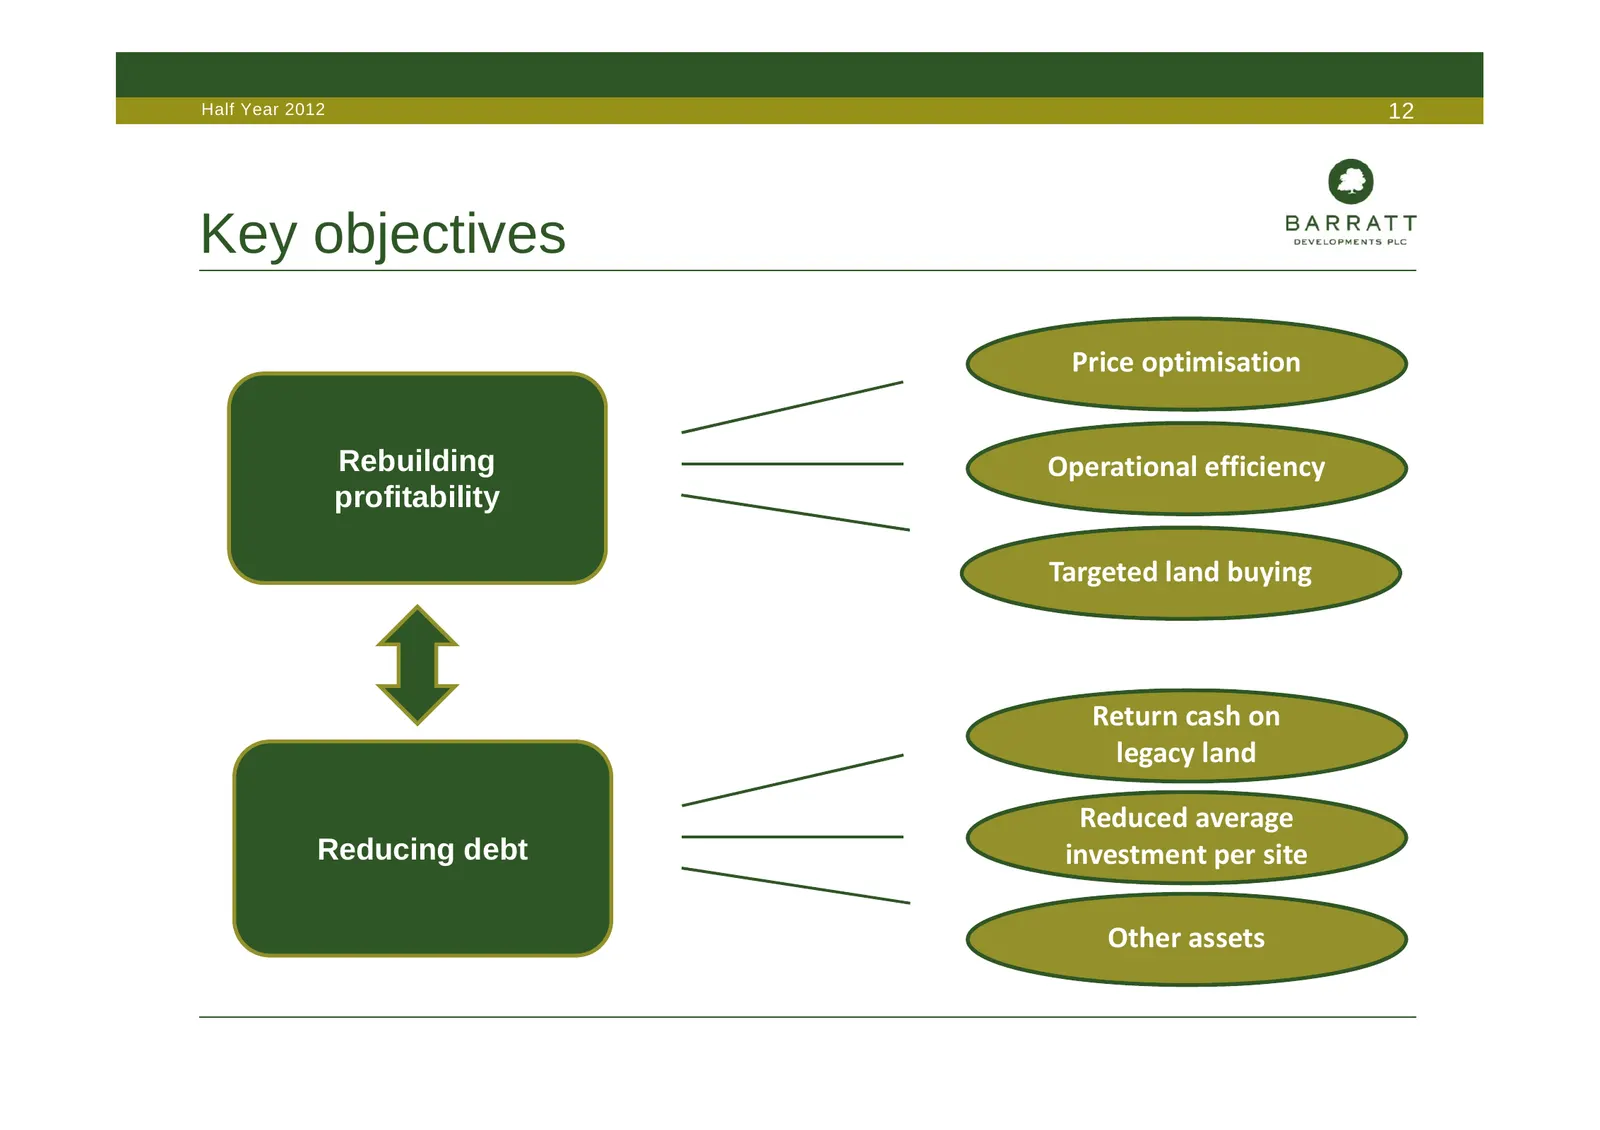
Slide 12: Key objectives
Half Year 2012 12 Key objectives Price optimisation Rebuilding Operational efficiency profitability Targeted land buying Return cash on legacy land Reduced average Reducing debt investment per site Other assets
Slide 13: Price optimisation
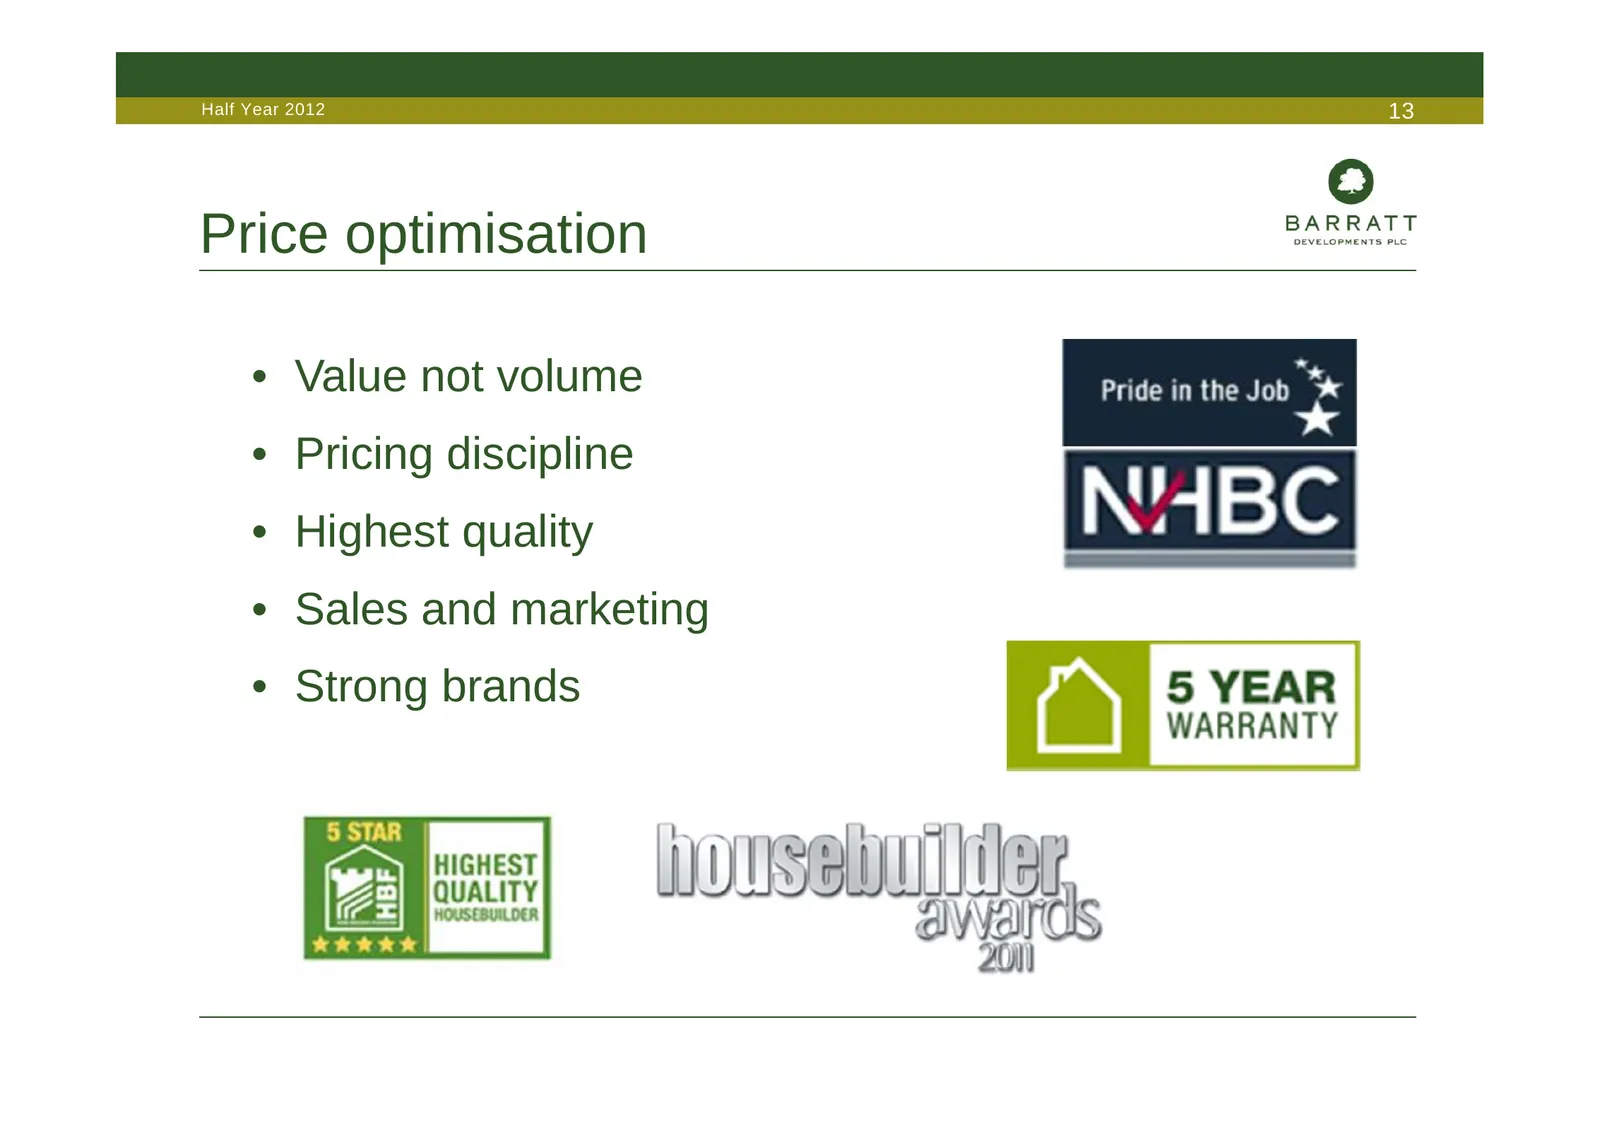
Half Year 2012 13 Price optimisation • Value not volume • Pricing discipline • Highest quality • Sales and marketing • Strong brands
Slide 14: Maximising the market potential
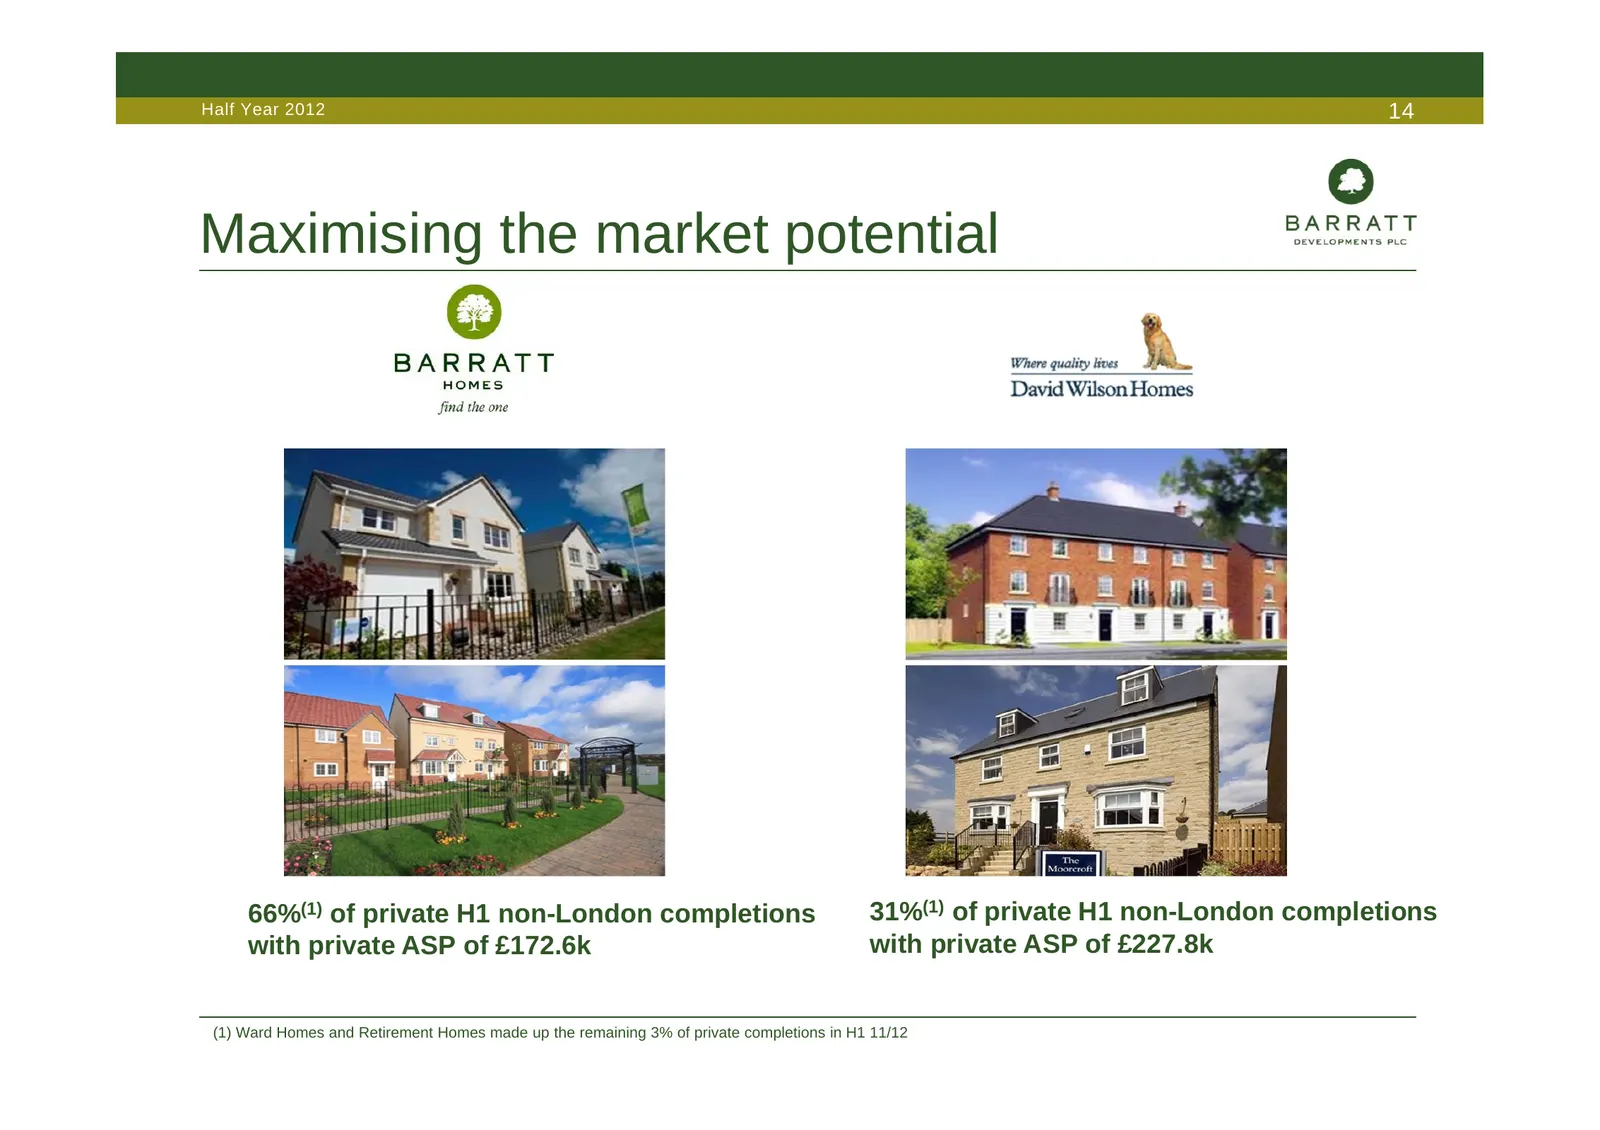
Half Year 2012 14 Maximising the market potential 66%(1) of private H1 non-London completions 31%(1) of private H1 non-London completions with private ASP of £172.6k with private ASP of £227.8k (1) Ward Homes and Retirement Homes made up the remaining 3% of private completions in H1 11/12
Slide 15: Operational efficiency
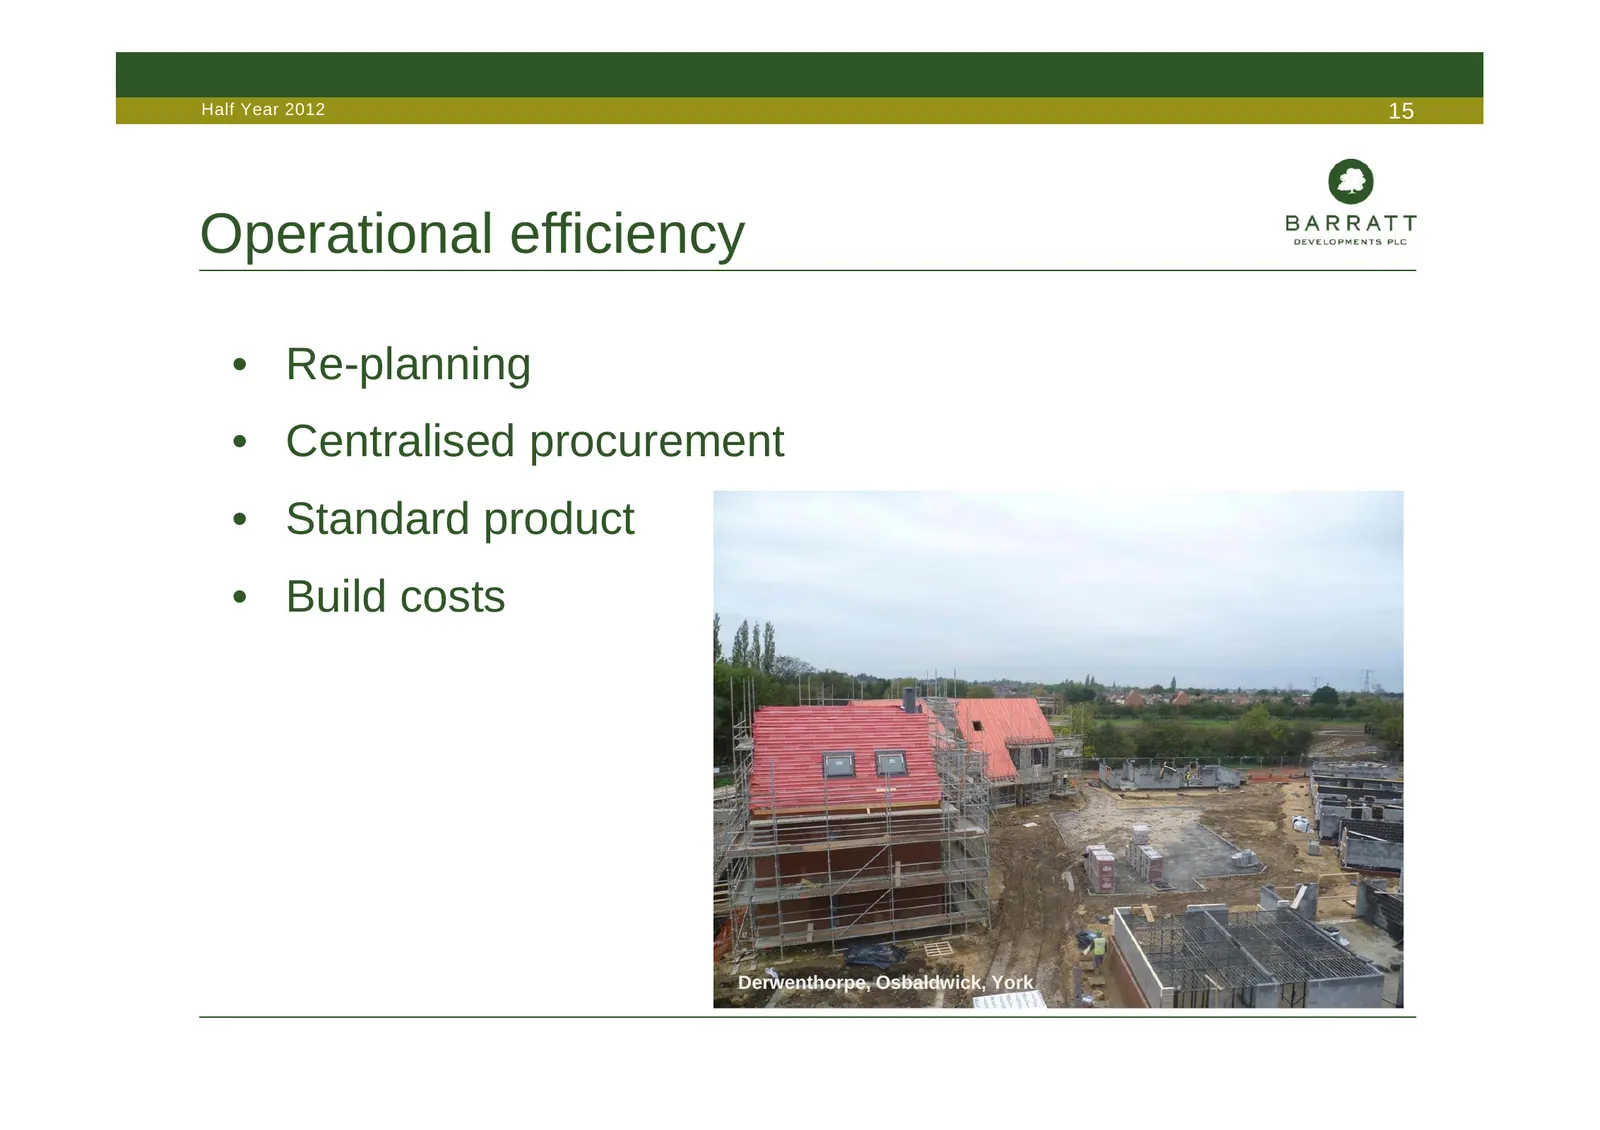
Half Year 2012 15 Operational efficiency • Re-planning • Centralised procurement • Standard product • Build costs Derwenthorpe, Osbaldwick, York
Slide 16: Targeted land buying
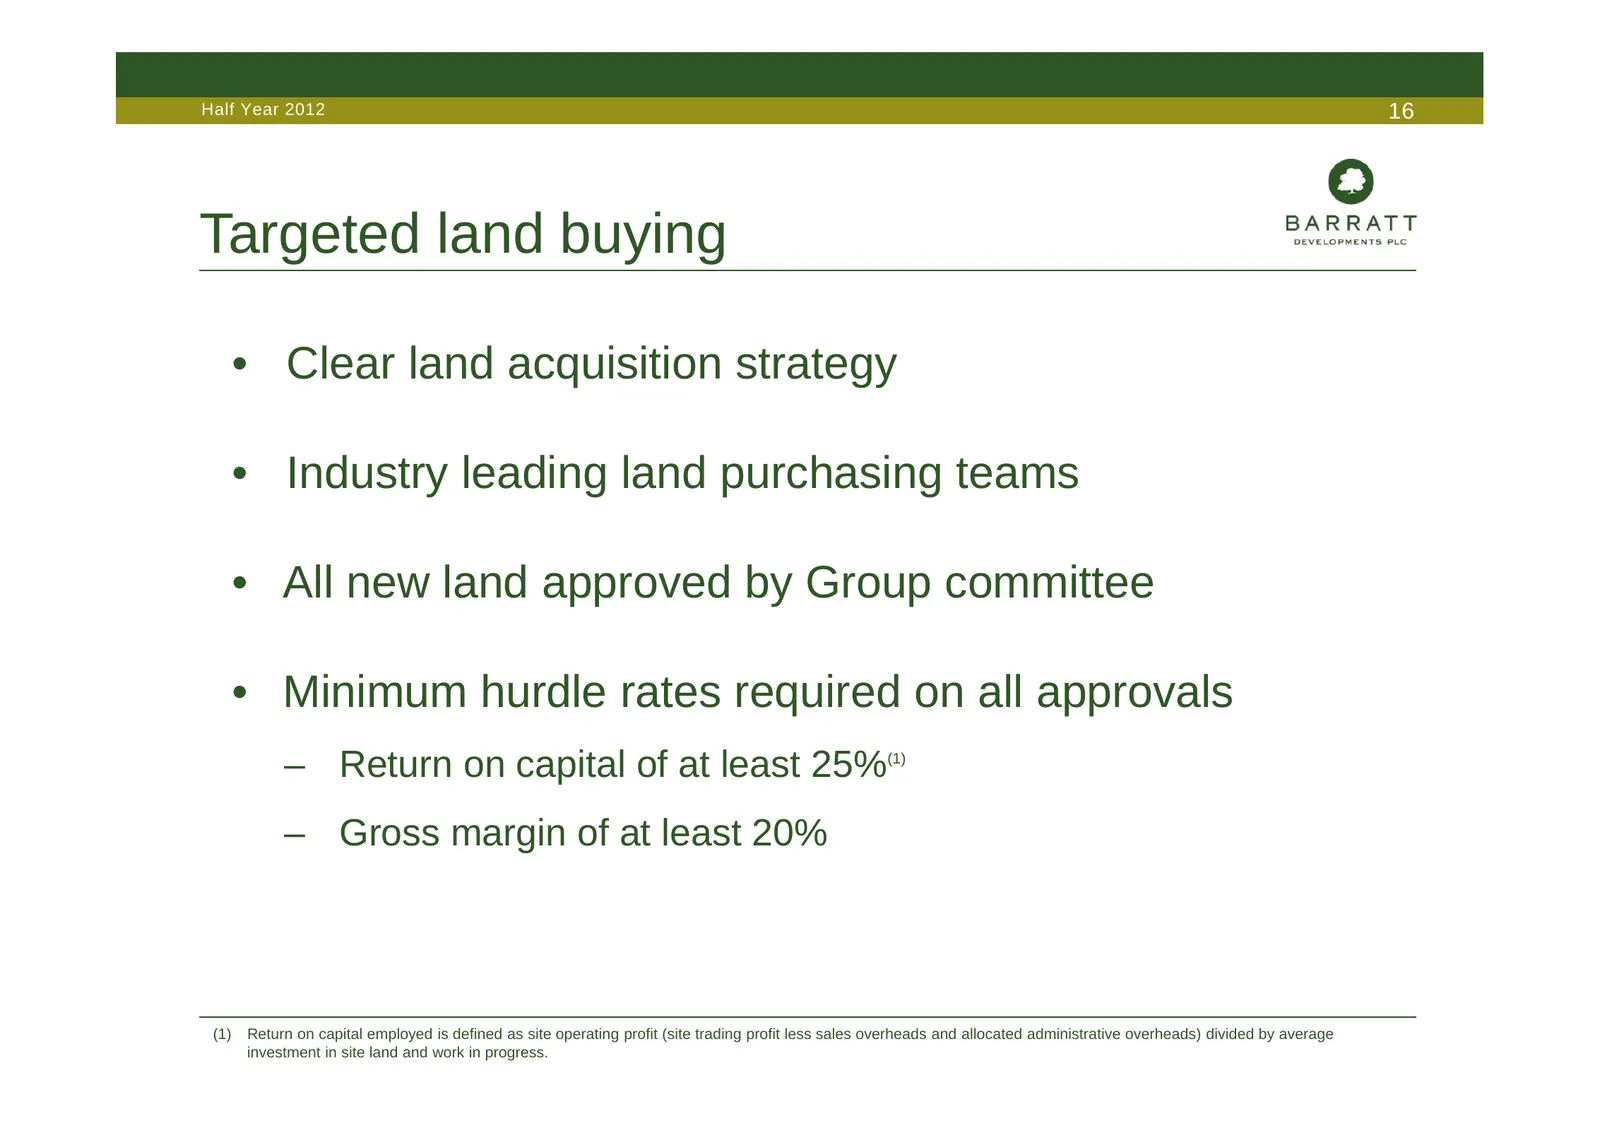
Half Year 2012 16 Targeted land buying • Clear land acquisition strategy • Industry leading land purchasing teams • All new land approved by Group committee • Minimum hurdle rates required on all approvals – Return on capital of at least 25% (1) – Gross margin of at least 20% (1) Return on capital e
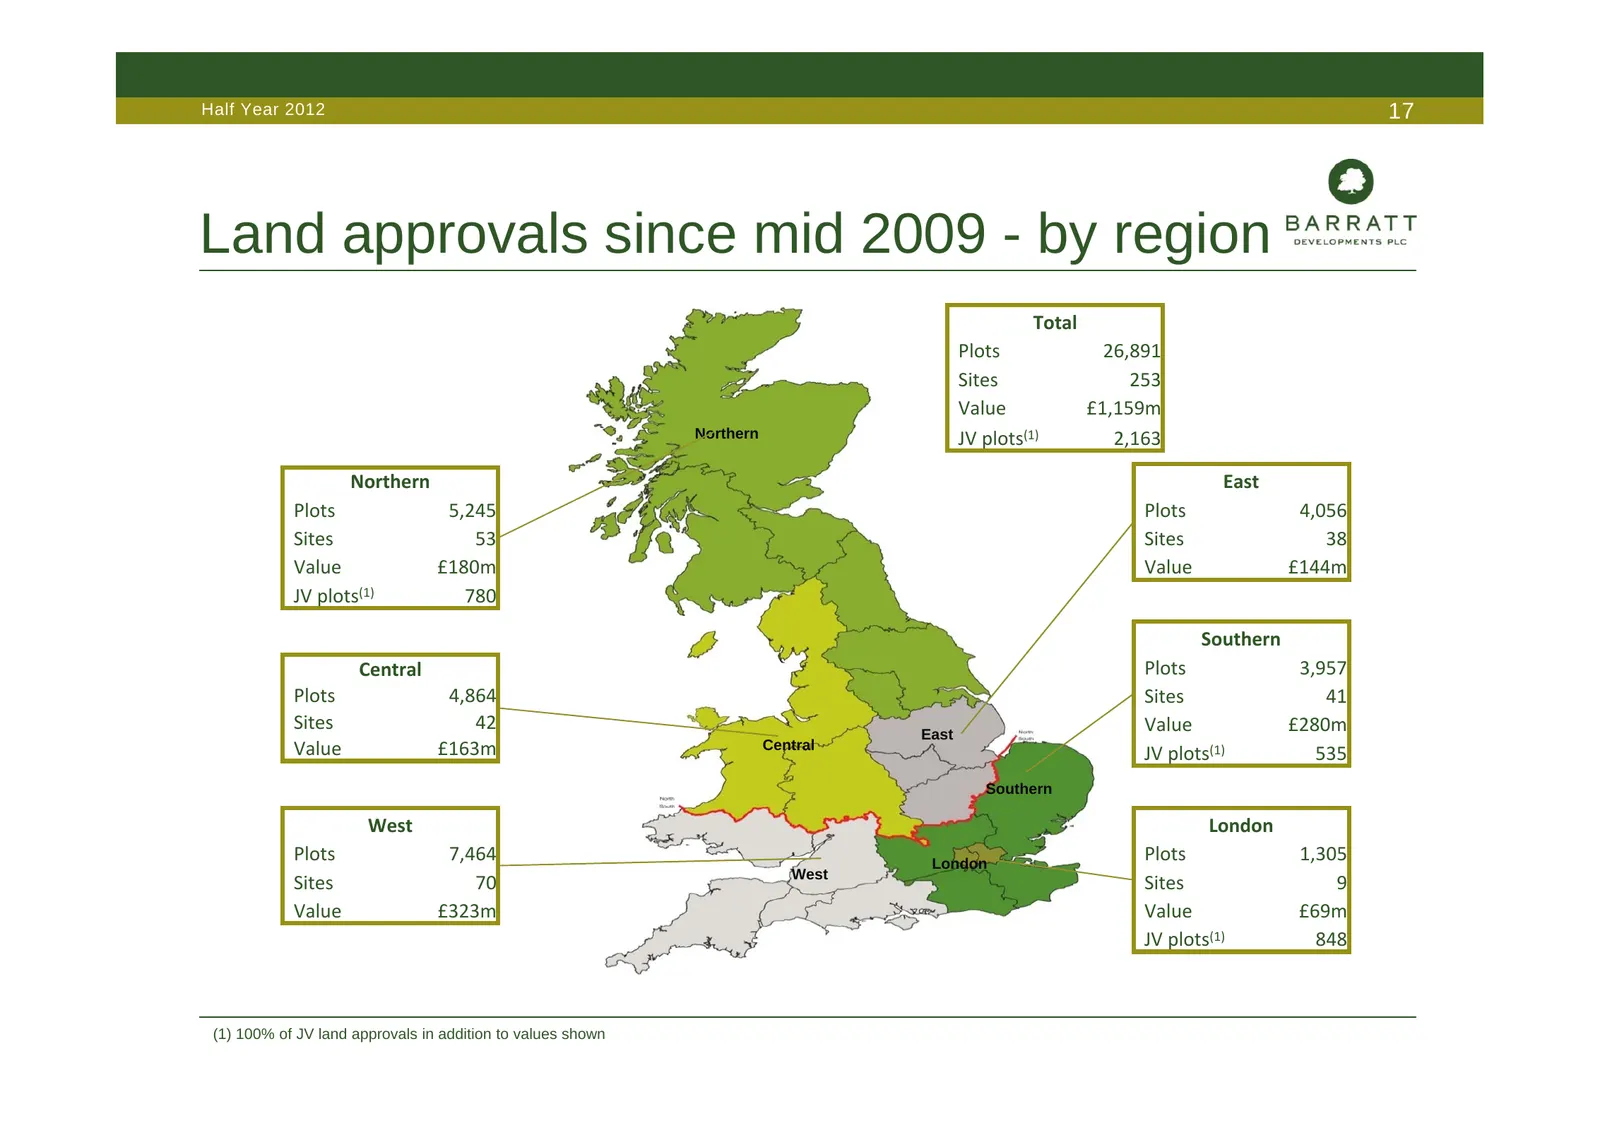
Slide 17: Land approvals since mid 2009 - by region
Half Year 2012 17 Land approvals since mid 2009 - by region Total Plots 26,891 Sites 253 Value £1,159m Northern JV plots(1) 2,163 Northern East Plots 5,245 Plots 4,056 Sites 53 Sites 38 Value £180m Value £144m JV plots(1) 780 Southern Central Plots 3,957 Plots 4,864 Sites 41 Sites 42 Value £280m Eas
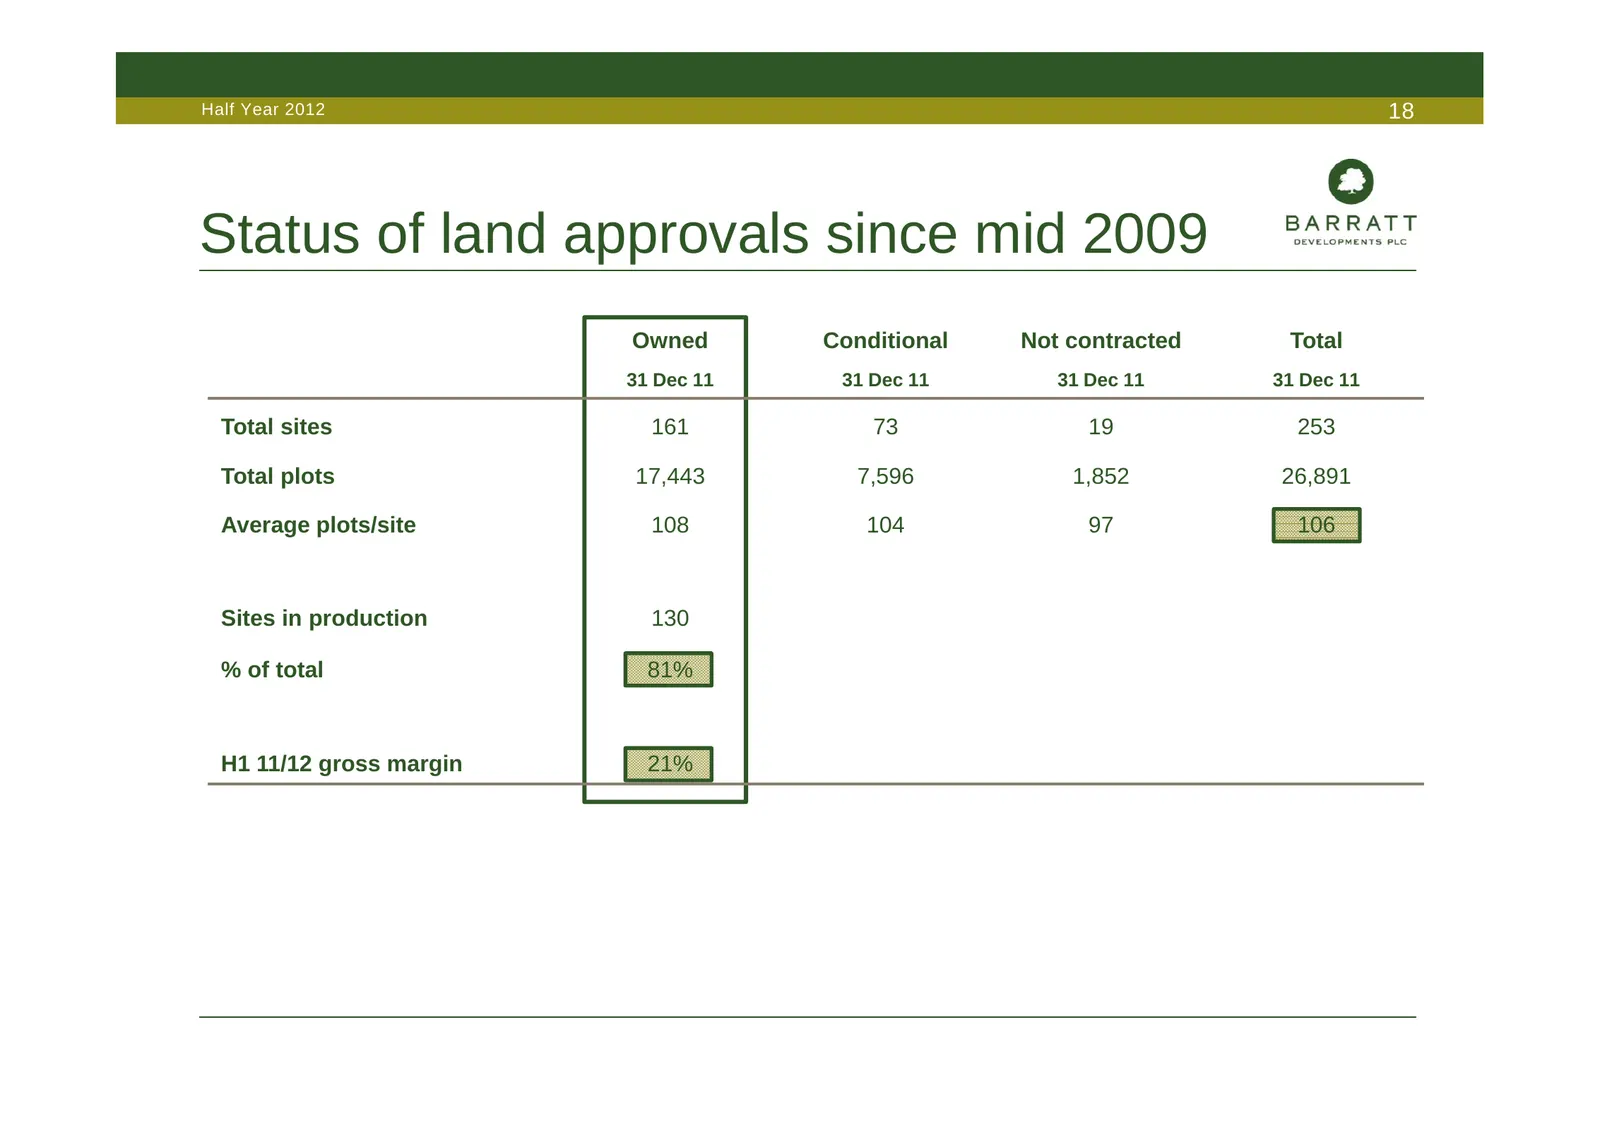
Slide 18: Status of land approvals since mid 2009
Half Year 2012 18 Status of land approvals since mid 2009 Owned Conditional Not contracted Total 31 Dec 11 31 Dec 11 31 Dec 11 31 Dec 11 Total sites 161 73 19 253 Total plots 17,443 7,596 1,852 26,891 Average plots/site 108 104 97 106 Sites in production 130 % of total 81% H1 11/12 gross margin 21%
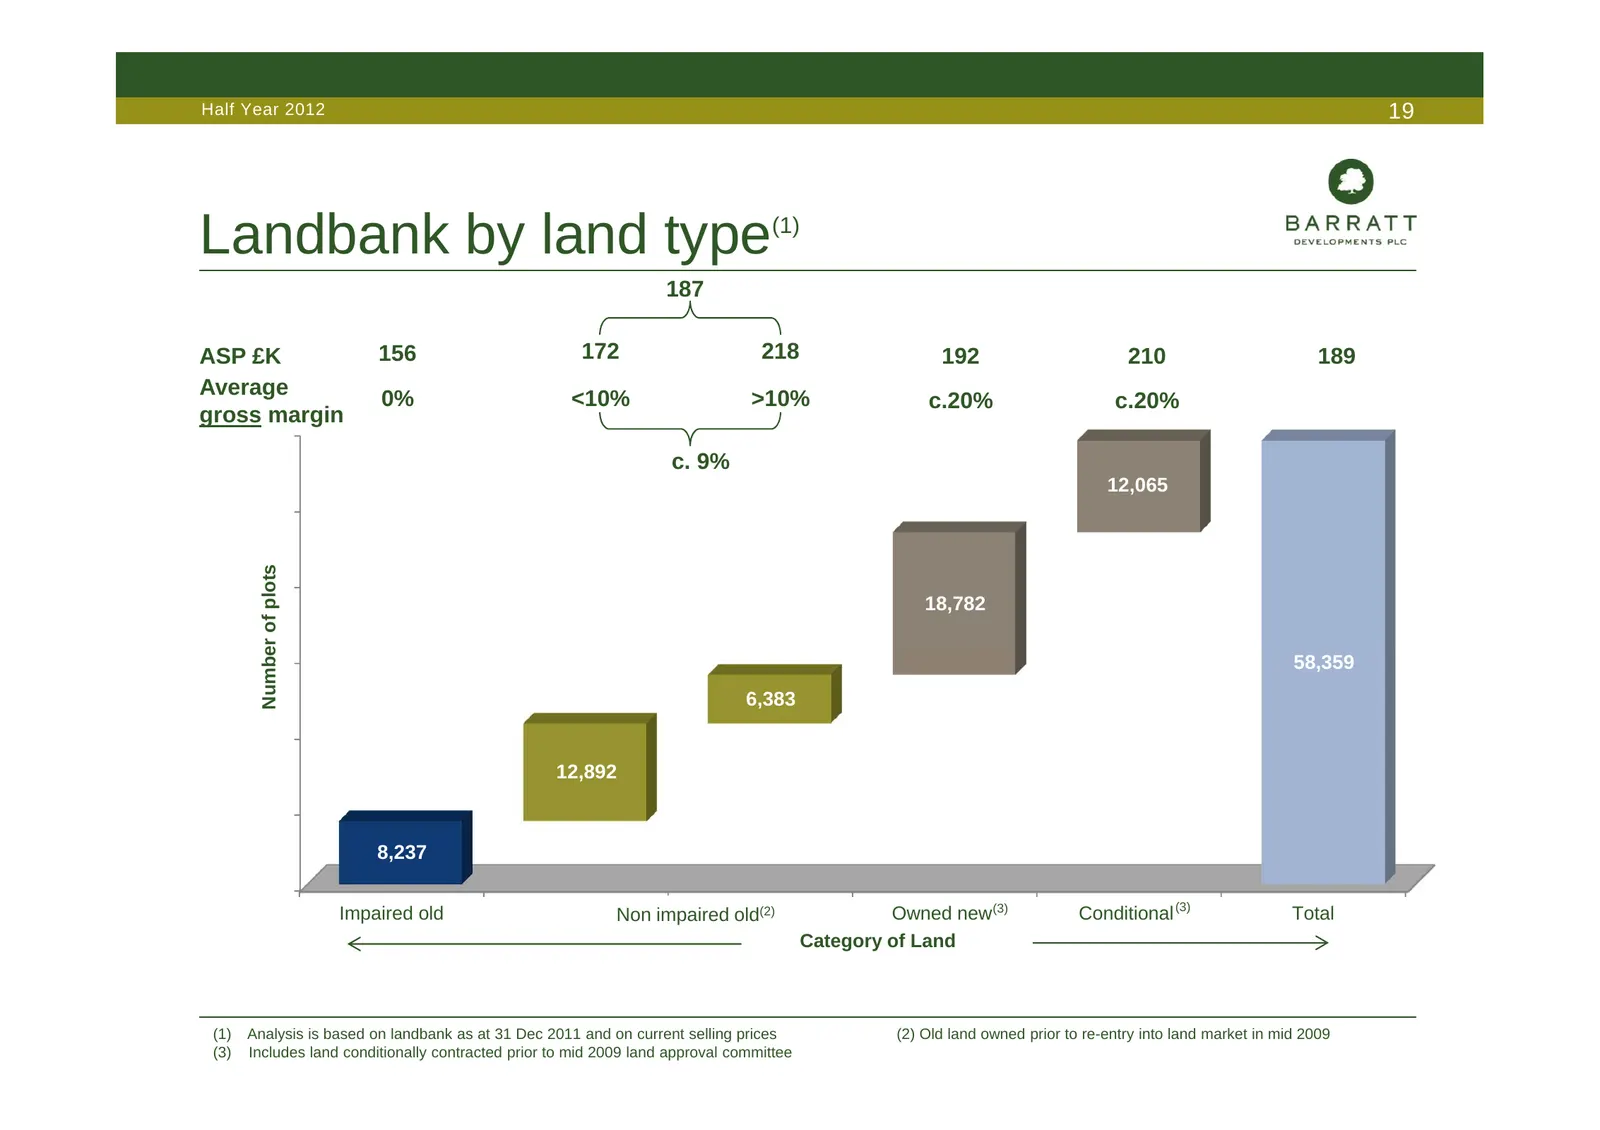
Slide 19: Landbank by land type
Half Year 2012 19 Landbank by land type (1) 187 ASP £K 156 172 218 192 210 189 Average 0% <10% >10% c.20% c.20% gross margin c. 9% 12,065 Number of plots 18,782 58,359 6,383 12,892 8,237 Impaired old Non-impairedNon old impaired old(2) Owned new(3) Conditional (3) Total Category of Land (1) Analysis
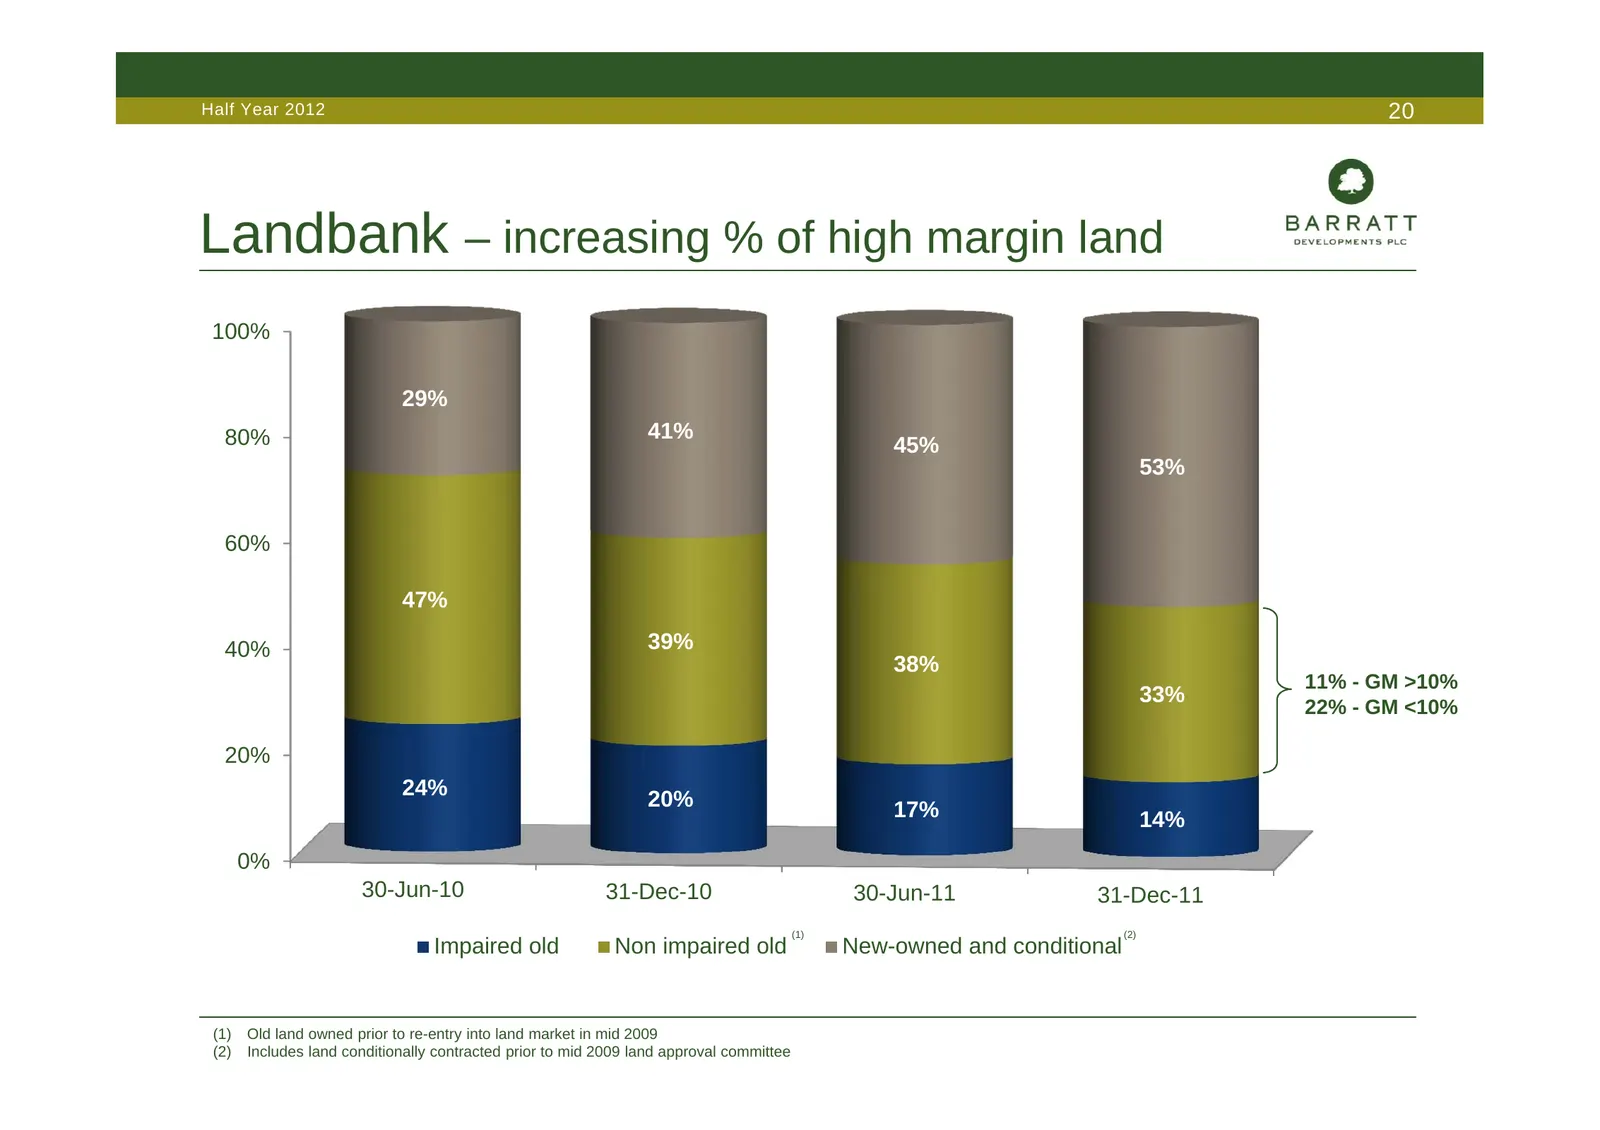
Slide 20: Landbank – increasing % of high margin land
Half Year 2012 20 Landbank – increasing % of high margin land 100% 29% 80% 41% 45% 53% 60% 47% 40% 39% 38% 11% - GM >10% 33% 22% - GM <10% 20% 24% 20% 17% 14% 0% 30-Jun-10 31-Dec-10 30-Jun-11 31-Dec-11 (1) (2) Impaired old Non impaired old New-owned and conditional (1) Old land owned prior to re-ent
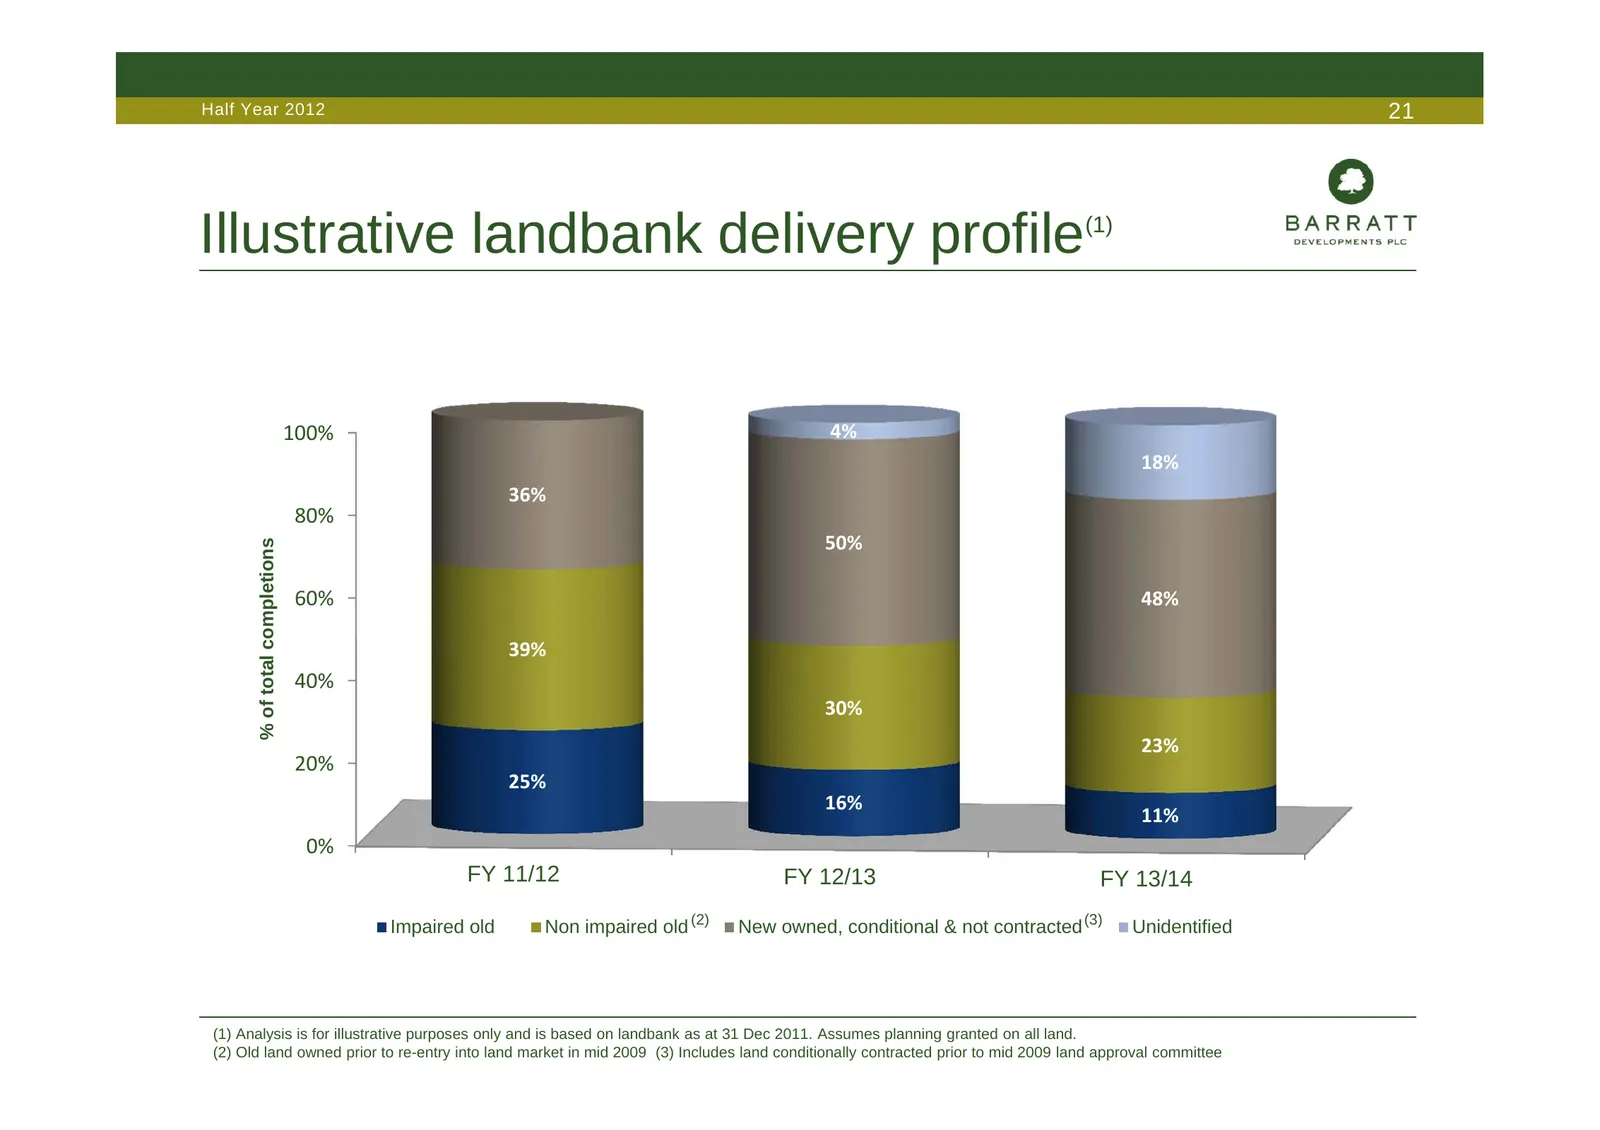
Slide 21: Illustrative landbank delivery profile
Half Year 2012 21 Illustrative landbank delivery profile (1) 100% 4% 18% 36% 80% 50% % of total completions 60% 48% 39% 40% 30% 23% 20% 25% 16% 11% 0% FY 11/12 FY 12/13 FY 13/14 Impaired old Non impaired old (2) New owned, conditional & not contracted (3) Unidentified (1) Analysis is for illustrativ
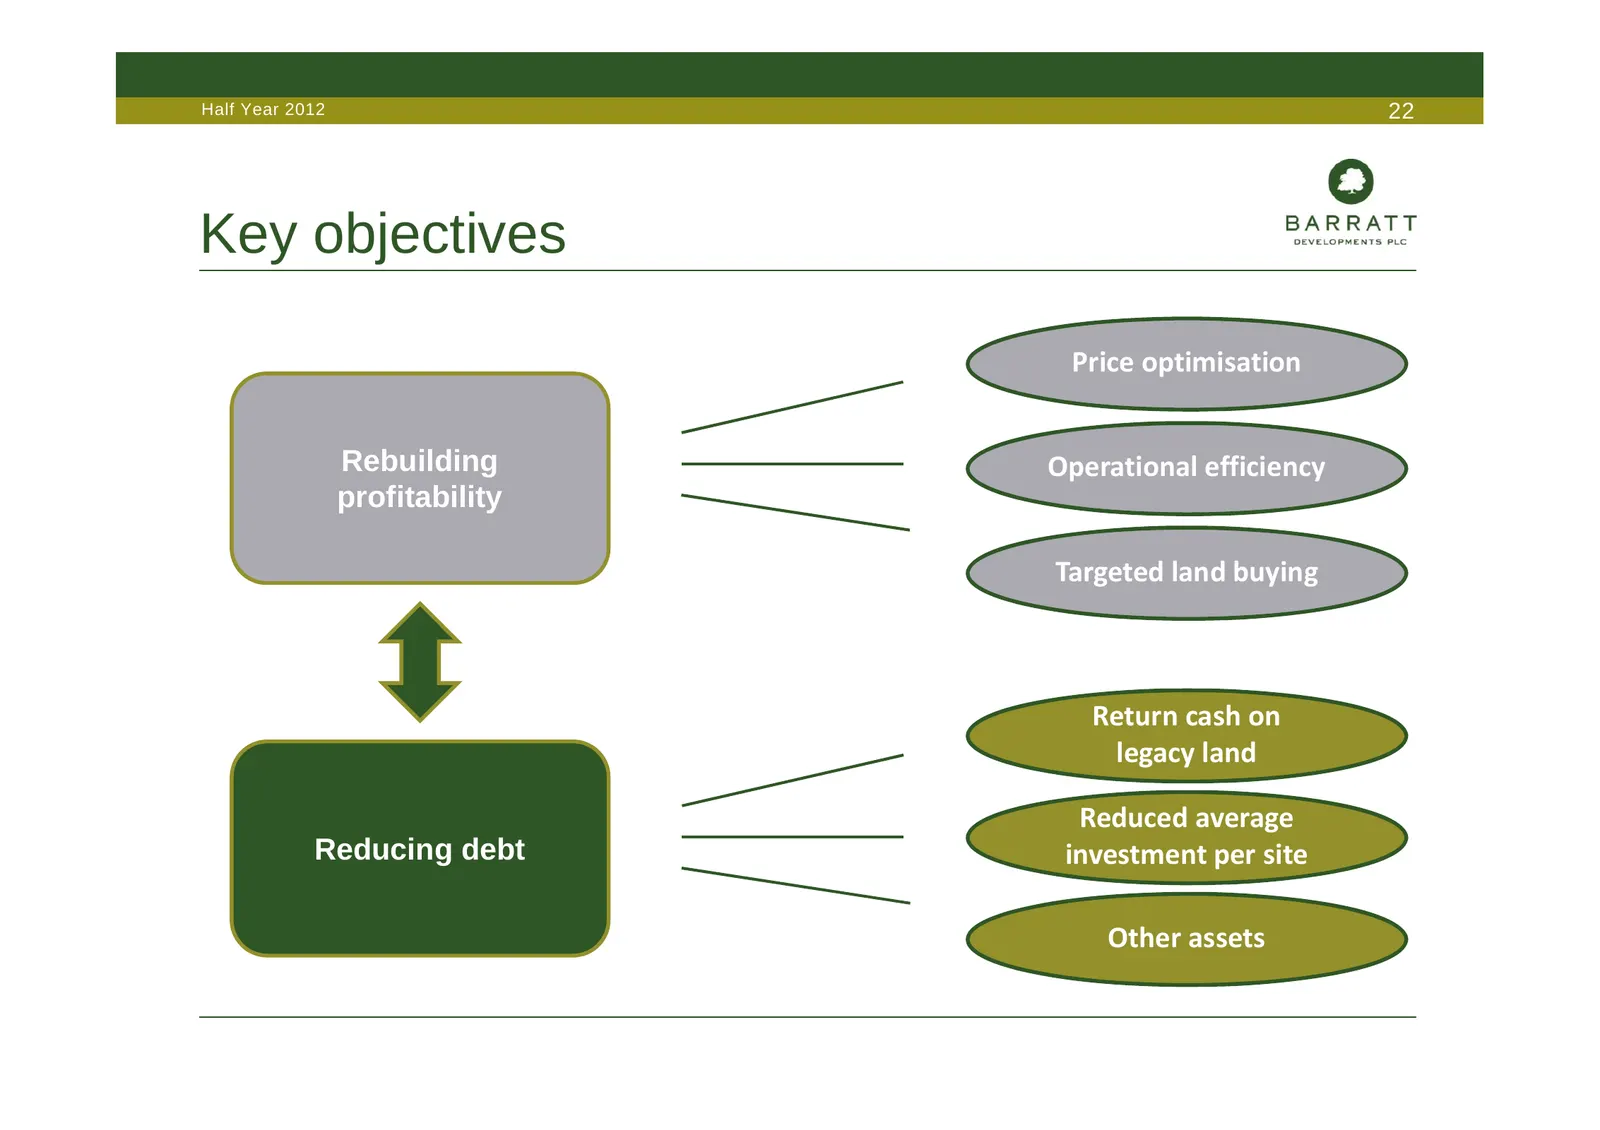
Slide 22: Key objectives
Half Year 2012 22 Key objectives Price optimisation Rebuilding Operational efficiency profitability Targeted land buying Return cash on legacy land Reduced average Reducing debt investment per site Other assets
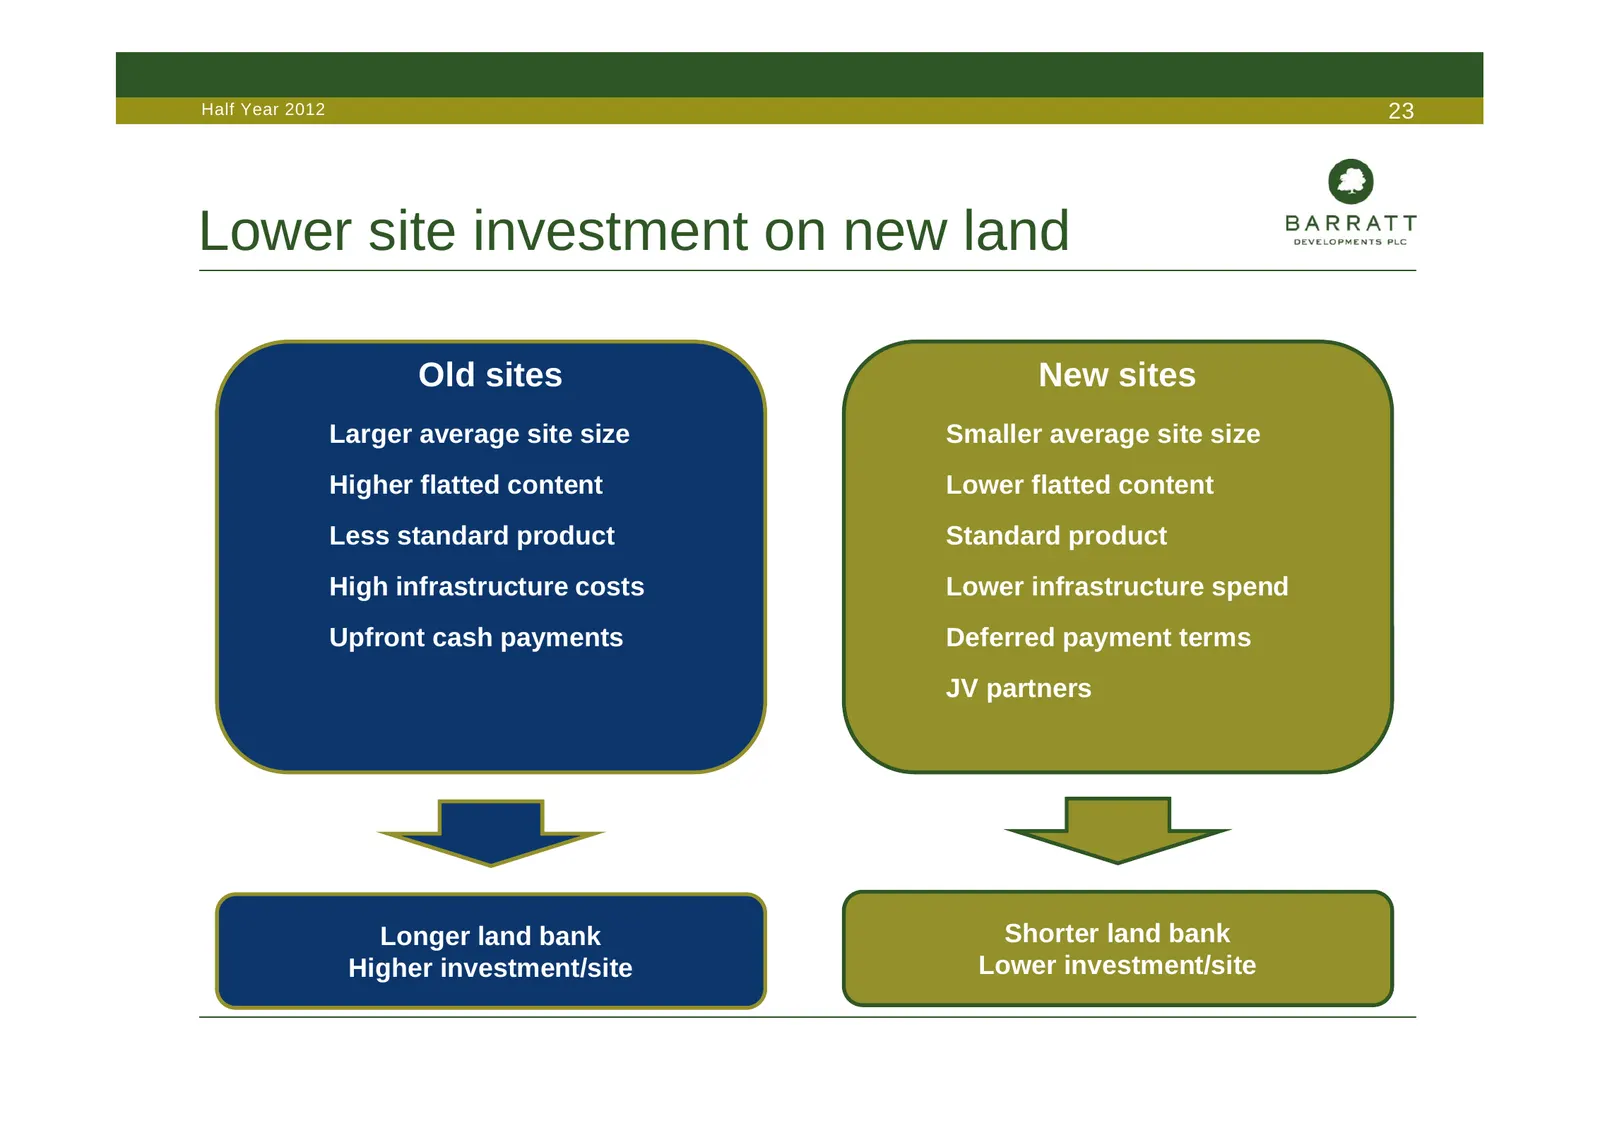
Slide 23: Lower site investment on new land
Half Year 2012 23 Lower site investment on new land Old sites New sites Larger average site size Smaller average site size Higher flatted content Lower flatted content Less standard product Standard product High infrastructure costs Lower infrastructure spend Upfront cash payments Deferred payment t
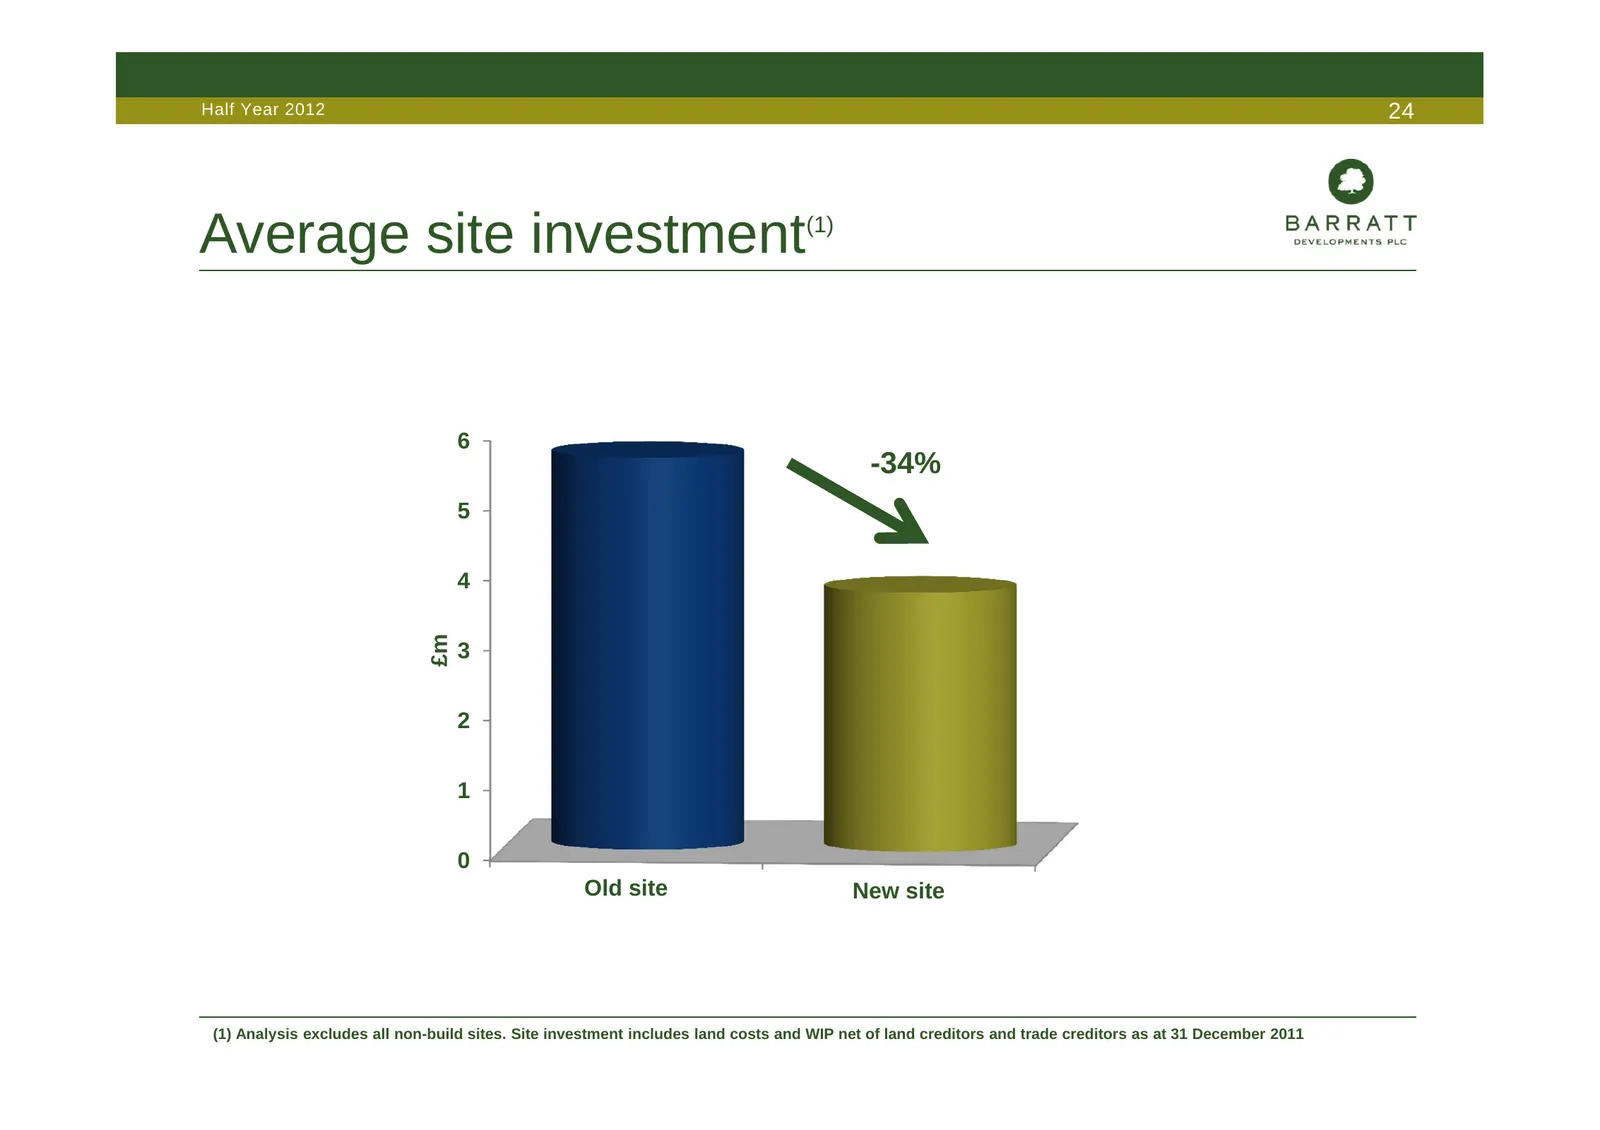
Slide 24: Average site investment
Half Year 2012 24 Average site investment (1) 6 -34% 5 4 £m 3 2 1 0 Old site New site (1) Analysis excludes all non-build sites. Site investment includes land costs and WIP net of land creditors and trade creditors as at 31 December 2011
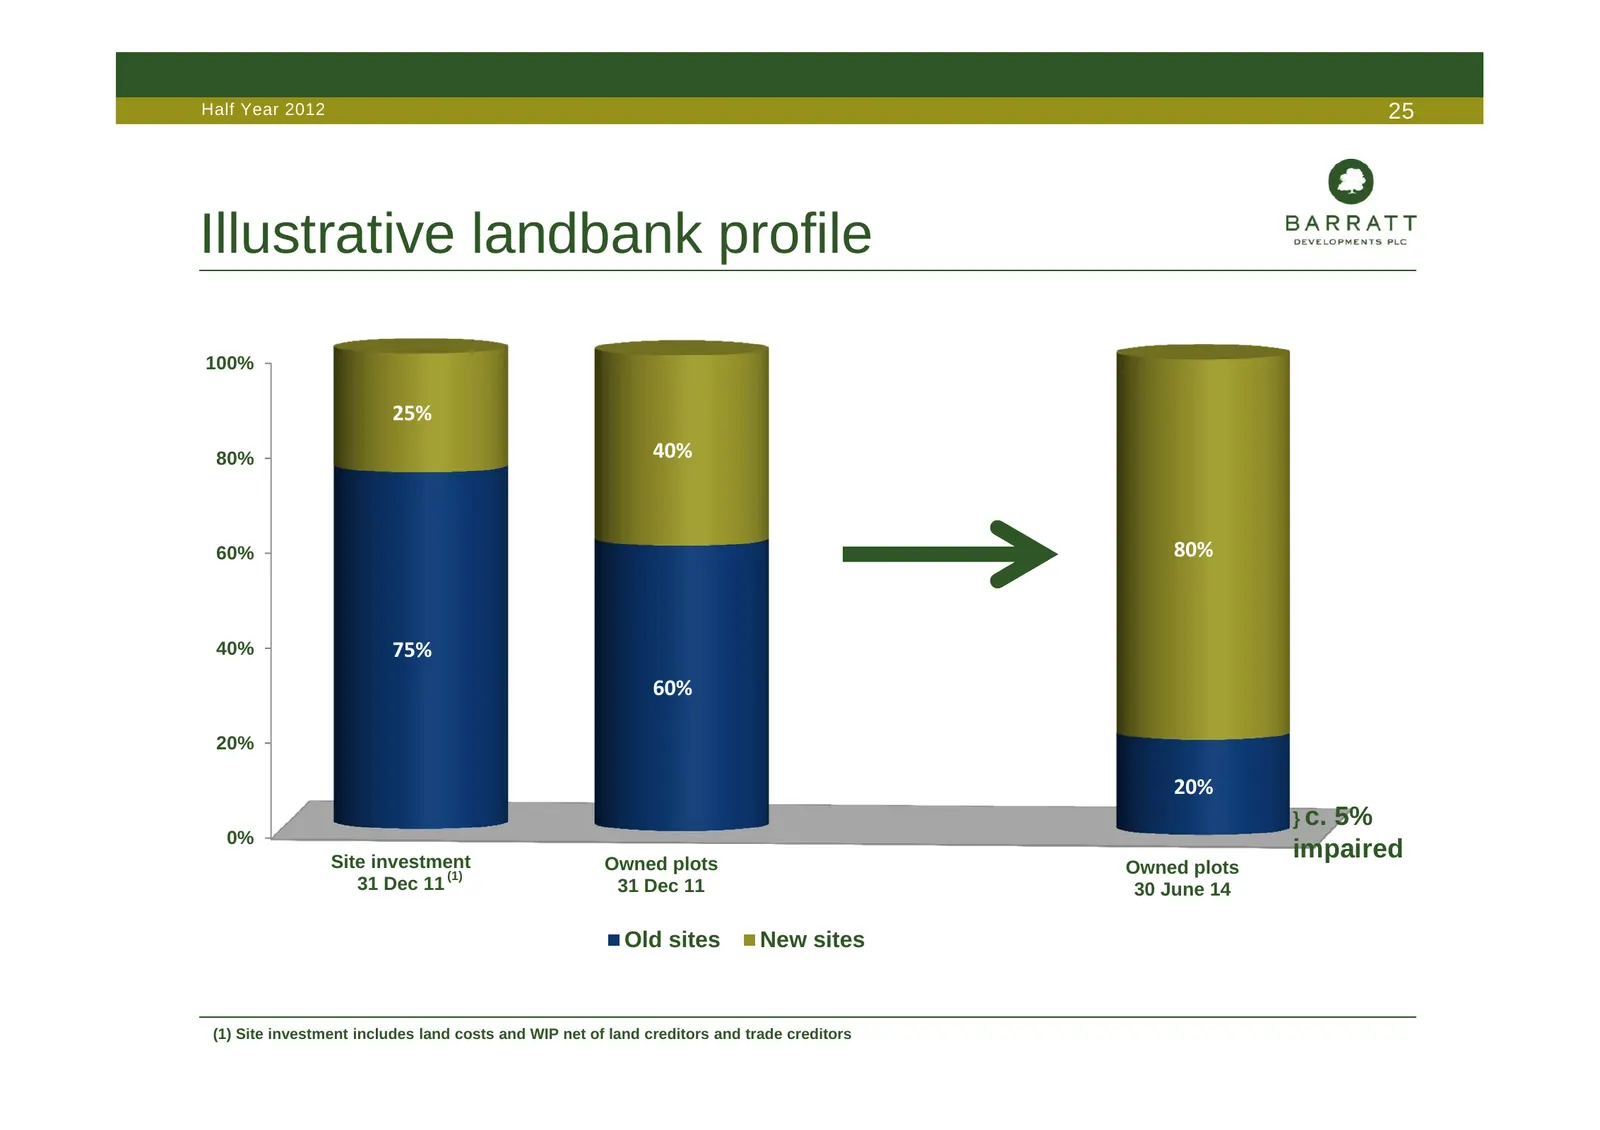
Slide 25: Illustrative landbank profile
Half Year 2012 25 Illustrative landbank profile 100% 25% 80% 40% 60% 80% 40% 75% 60% 20% 20% } c. 5% 0% Site investment Owned plots impaired (1) Owned plots 31 Dec 11 31 Dec 11 30 June 14 Old sites New sites (1) Site investment includes land costs and WIP net of land creditors and trade creditors
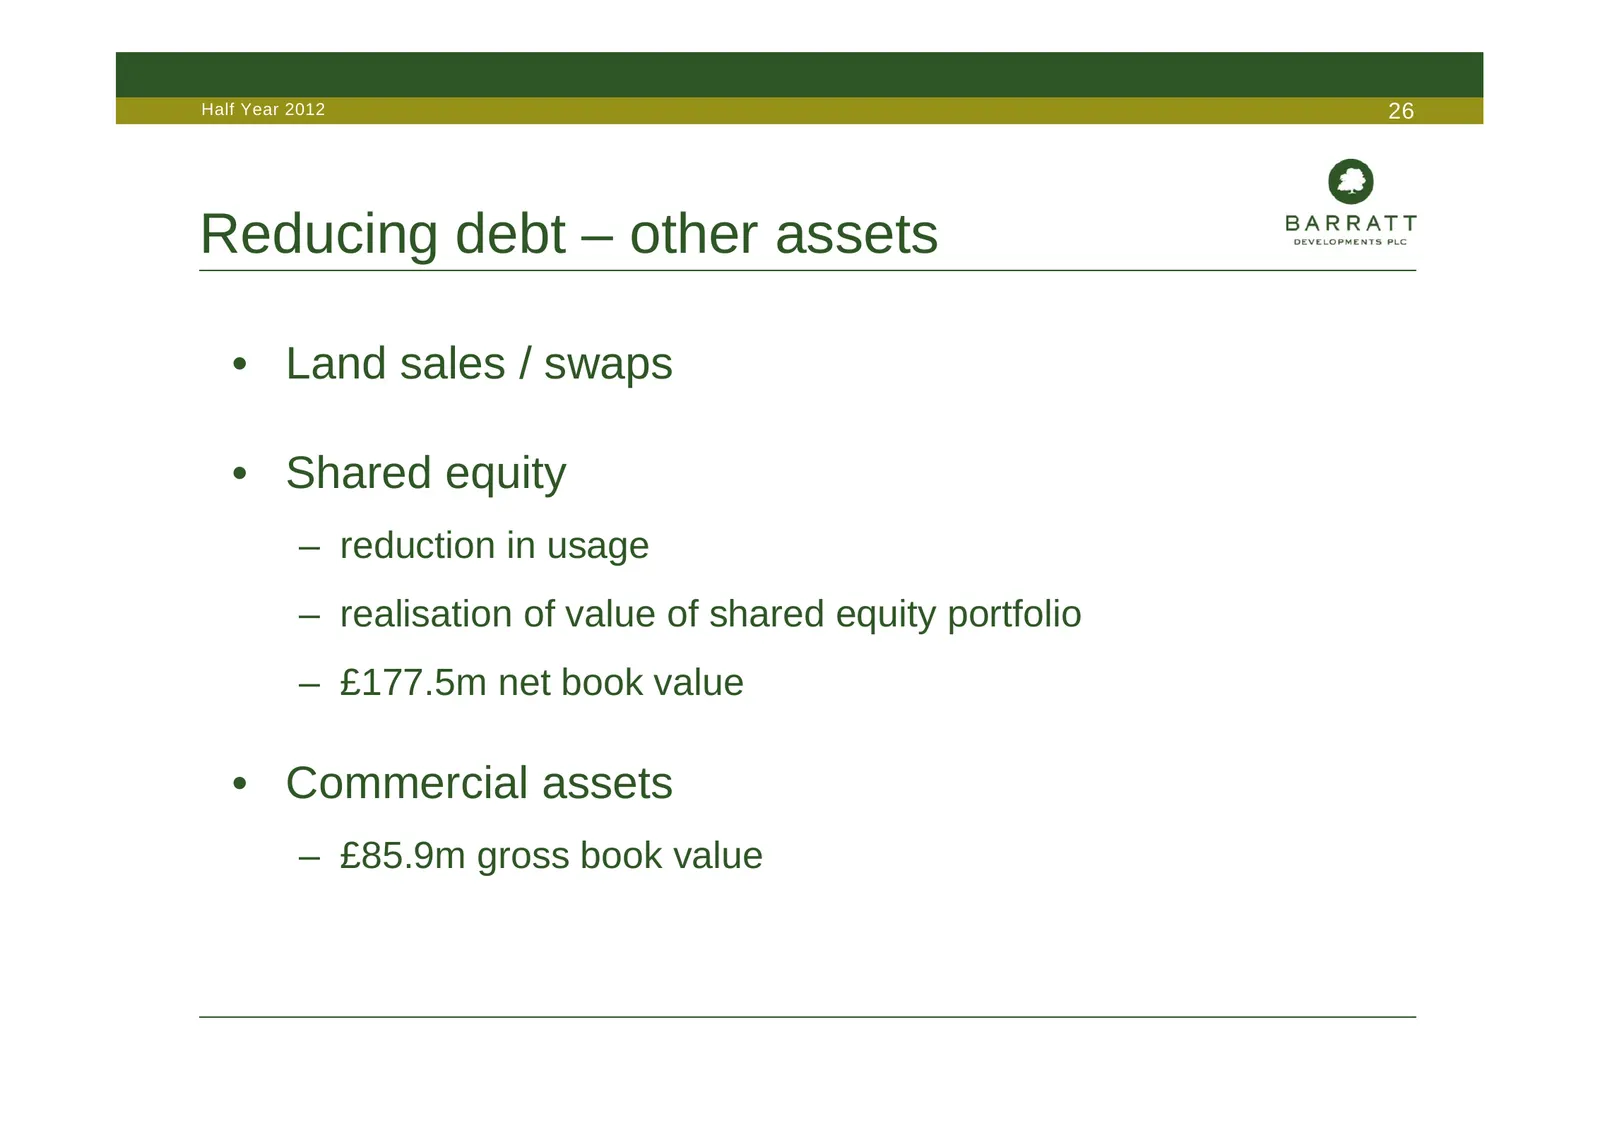
Slide 26: Reducing debt – other assets
Half Year 2012 26 Reducing debt – other assets • Land sales / swaps • Shared equity – reduction in usage – realisation of value of shared equity portfolio – £177.5m net book value • Commercial assets – £85.9m gross book value
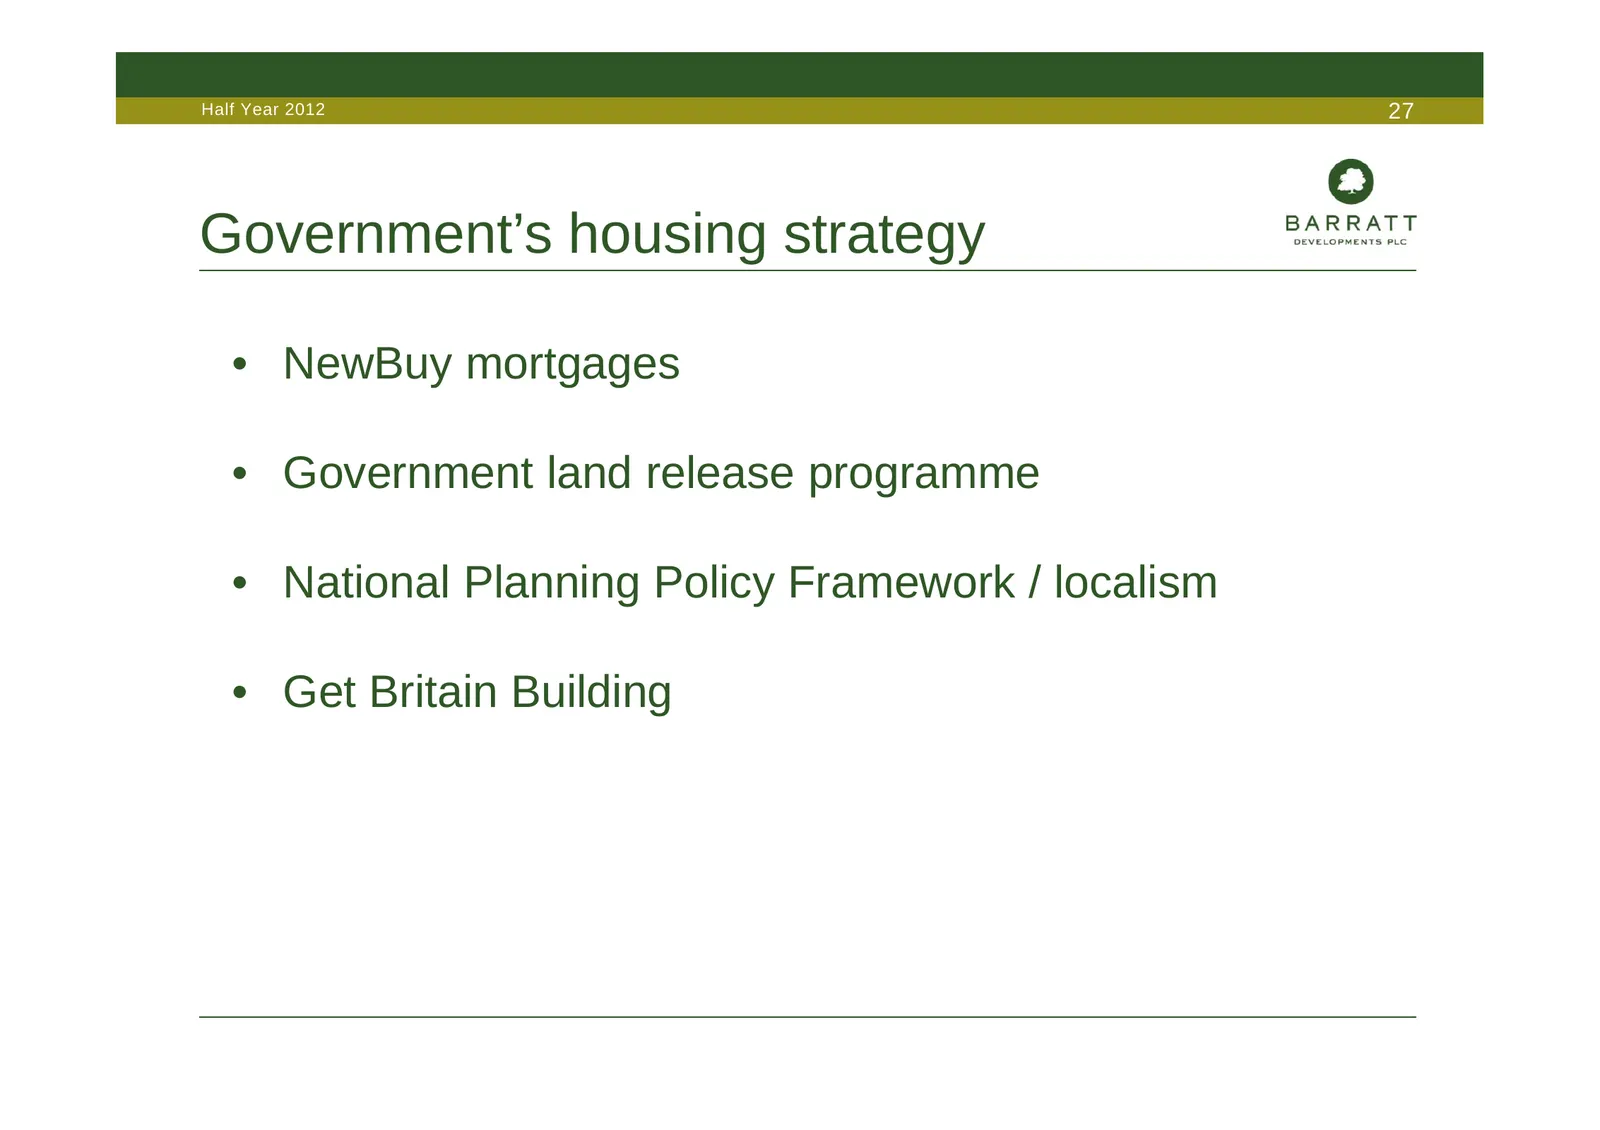
Slide 27: Government's housing strategy
Half Year 2012 27 Government’s housing strategy • NewBuy mortgages • Government land release programme • National Planning Policy Framework / localism • Get Britain Building
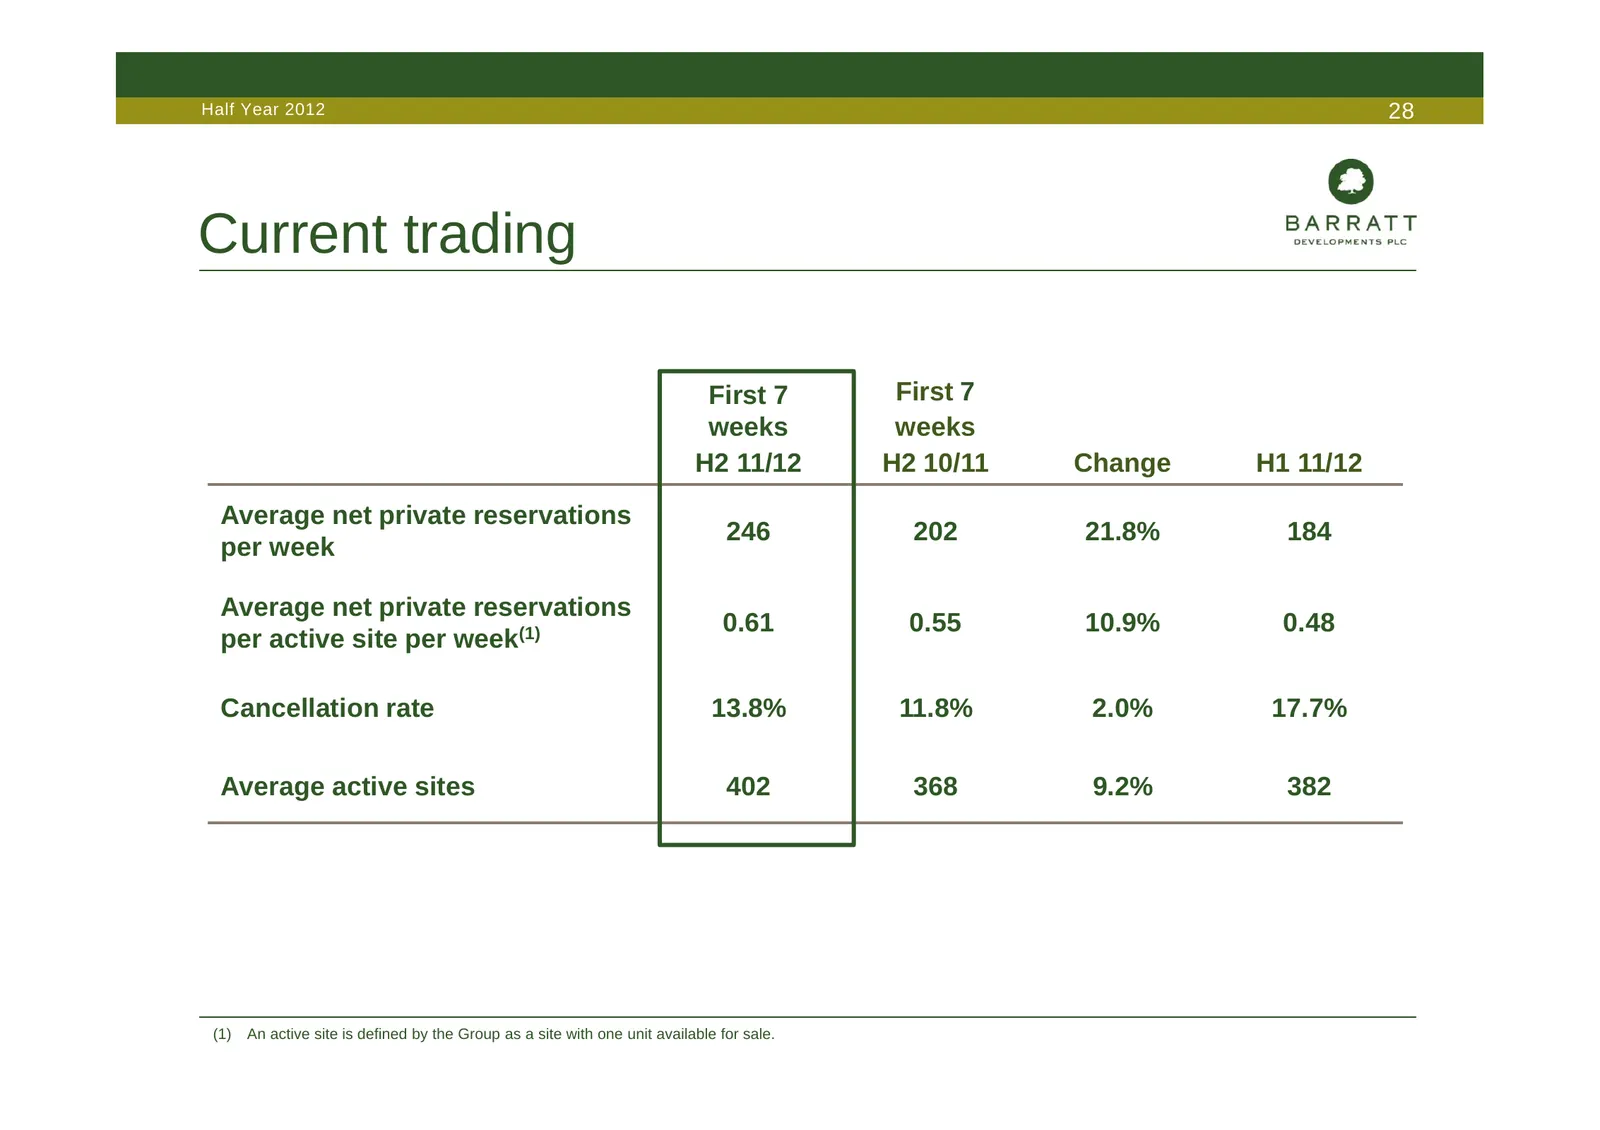
Slide 28: Current trading
Half Year 2012 28 Current trading First 7 First 7 weeks weeks H2 11/12 H2 10/11 Change H1 11/12 Average net private reservations 246 202 21.8% 184 per week Average net private reservations 0.61 0.55 10.9% 0.48 per active site per week(1) Cancellation rate 13.8% 11.8% 2.0% 17.7% Average active sites
Slide 29: Forward sales analysis
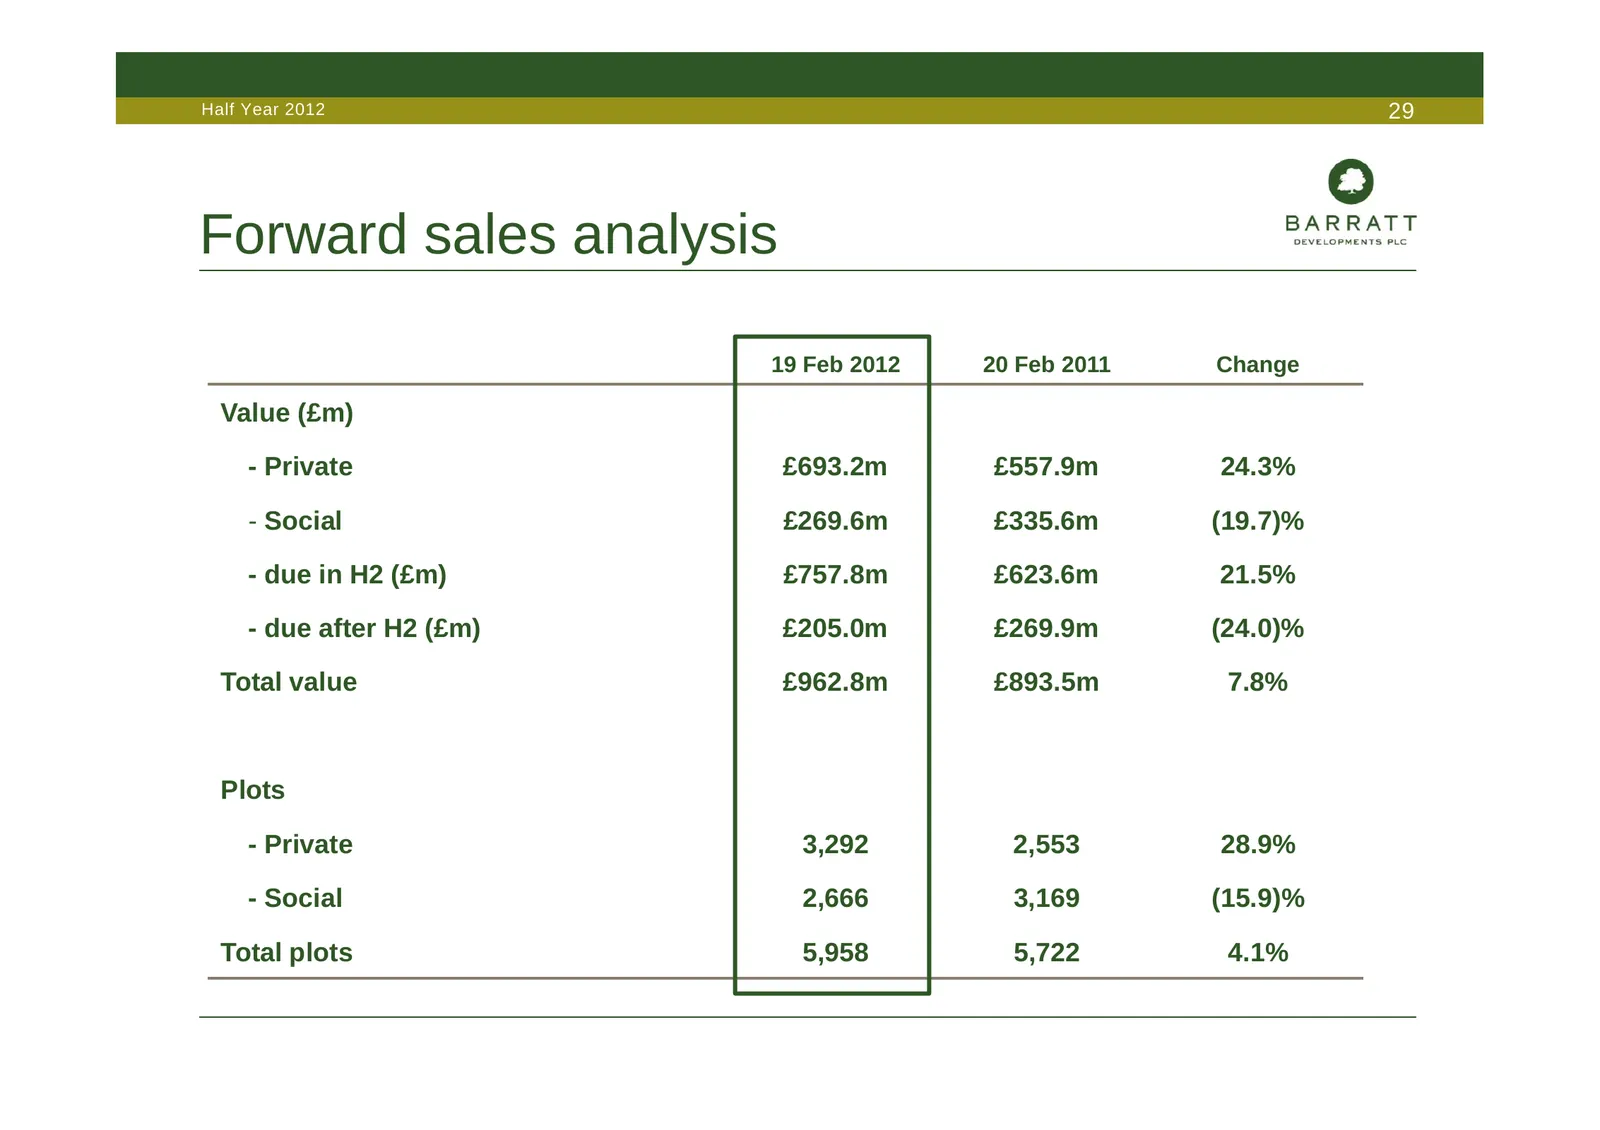
Half Year 2012 29 Forward sales analysis 19 Feb 2012 20 Feb 2011 Change Value (£m) - Private £693.2m £557.9m 24.3% - Social £269.6m £335.6m (19.7)% - due in H2 (£m) £757.8m £623.6m 21.5% - due after H2 (£m) £205.0m £269.9m (24.0)% Total value £962.8m £893.5m 7.8% Plots - Private 3,292 2,553 28.9% -
Slide 30: Outlook
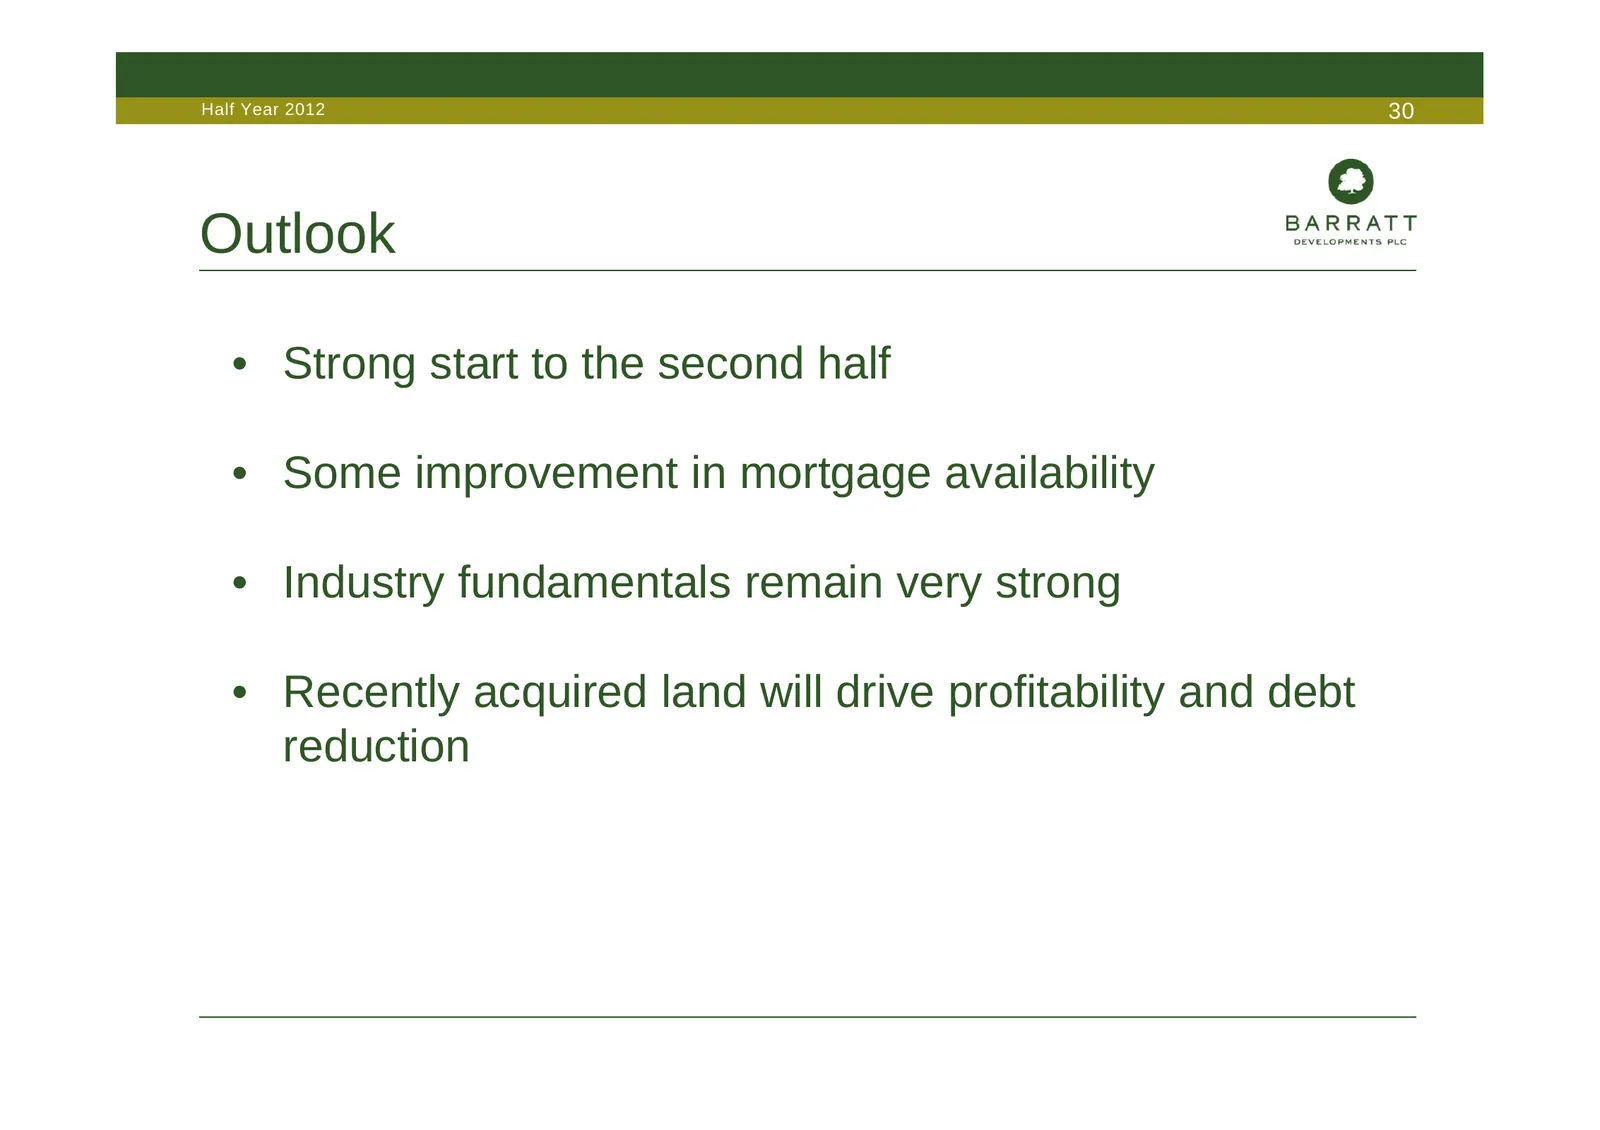
Half Year 2012 30 Outlook • Strong start to the second half • Some improvement in mortgage availability • Industry fundamentals remain very strong • Recently acquired land will drive profitability and debt reduction
Slide 31: David Thomas, Group Finance Director
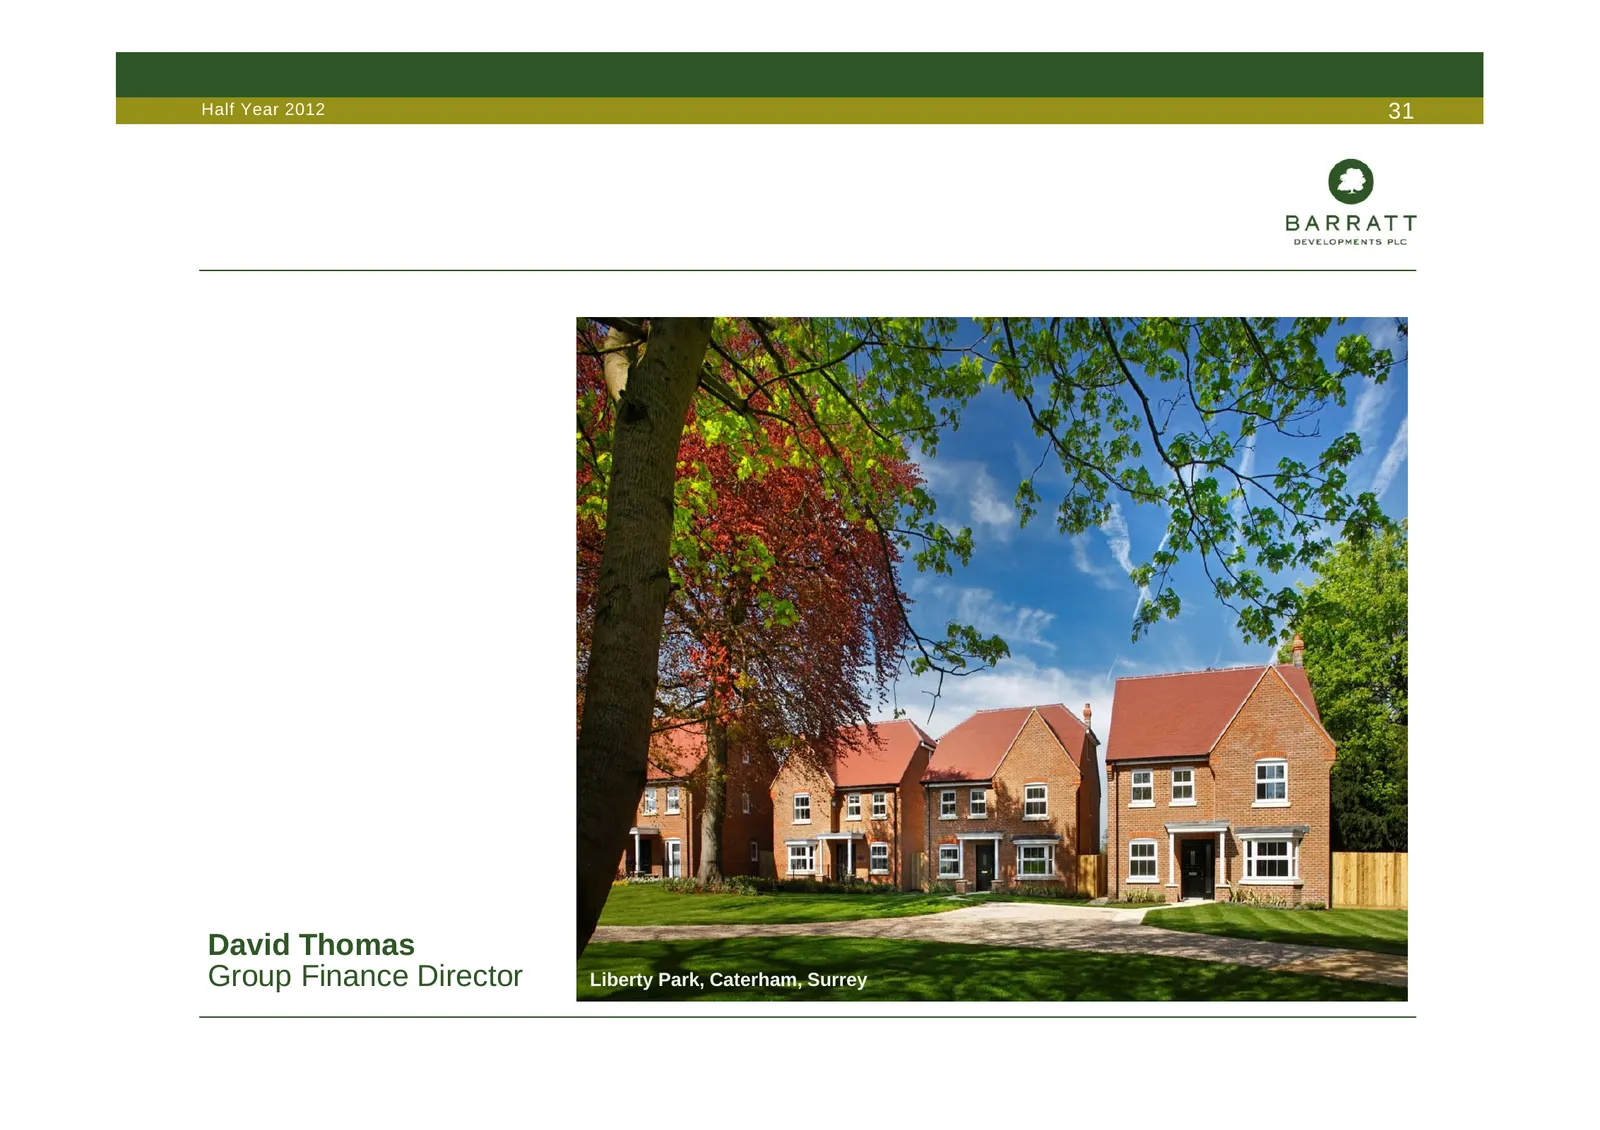
Half Year 2012 31 David Thomas Group Finance Director Greenfields Liberty Park, Caterham, Surrey
Slide 32: Overview
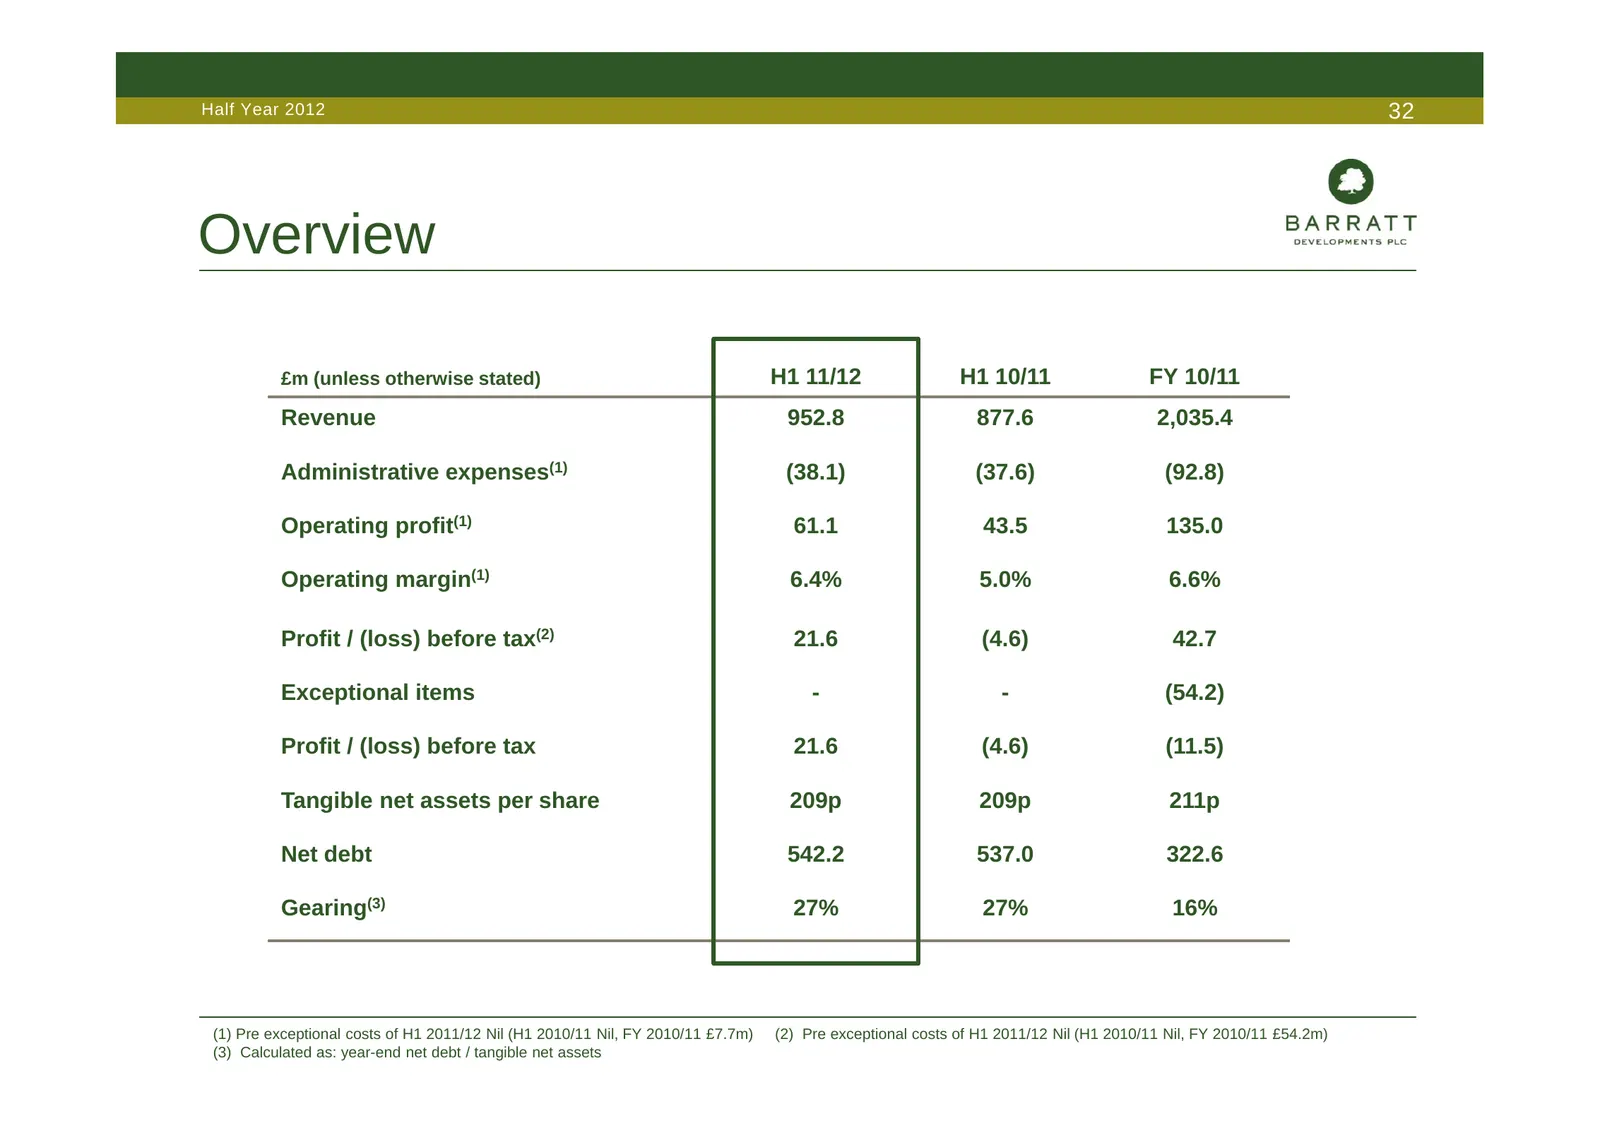
Half Year 2012 32 Overview £m (unless otherwise stated) H1 11/12 H1 10/11 FY 10/11 Revenue 952.8 877.6 2,035.4 Administrative expenses(1) (38.1) (37.6) (92.8) Operating profit(1) 61.1 43.5 135.0 Operating margin(1) 6.4% 5.0% 6.6% Profit / (loss) before tax(2) 21.6 (4.6) 42.7 Exceptional items - - (5
Slide 33: Revenue drivers
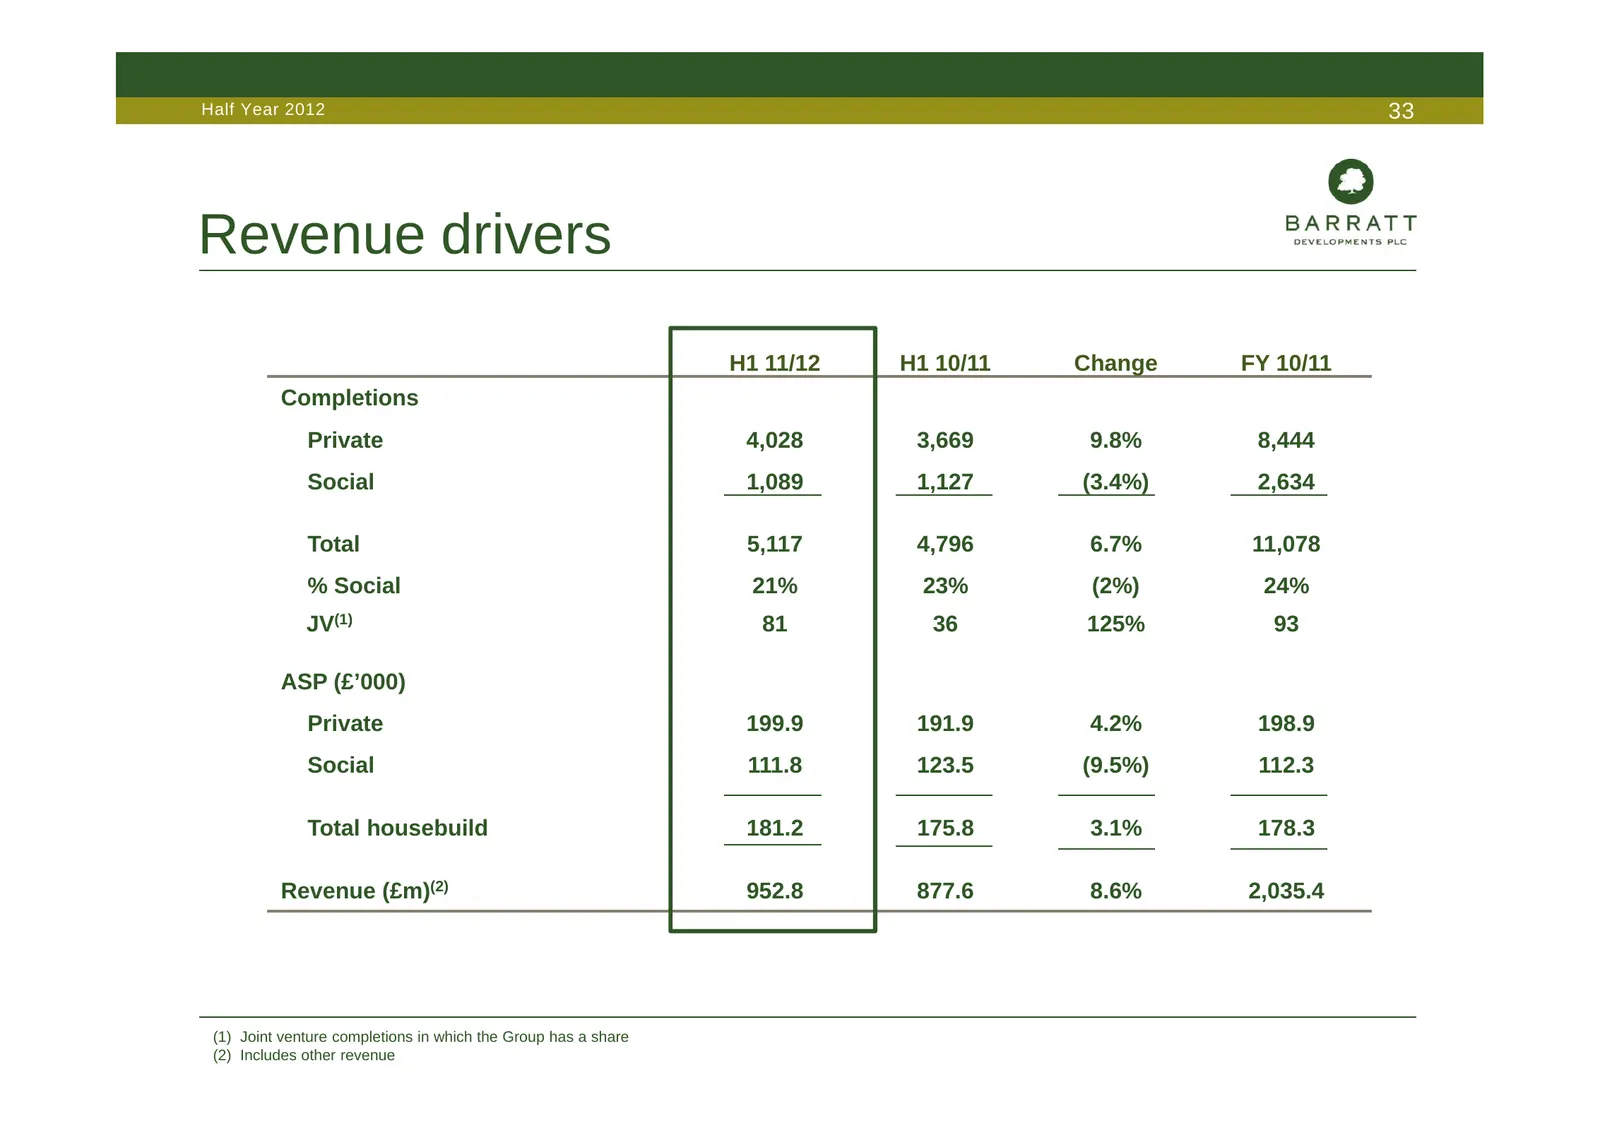
Half Year 2012 33 Revenue drivers H1 11/12 H1 10/11 Change FY 10/11 Completions Private 4,028 3,669 9.8% 8,444 Social 1,089 1,127 (3.4%) 2,634 Total 5,117 4,796 6.7% 11,078 % Social 21% 23% (2%) 24% JV(1) 81 36 125% 93 ASP (£’000) Private 199.9 191.9 4.2% 198.9 Social 111.8 123.5 (9.5%) 112.3 Total
Slide 34: Revenue and completions by region
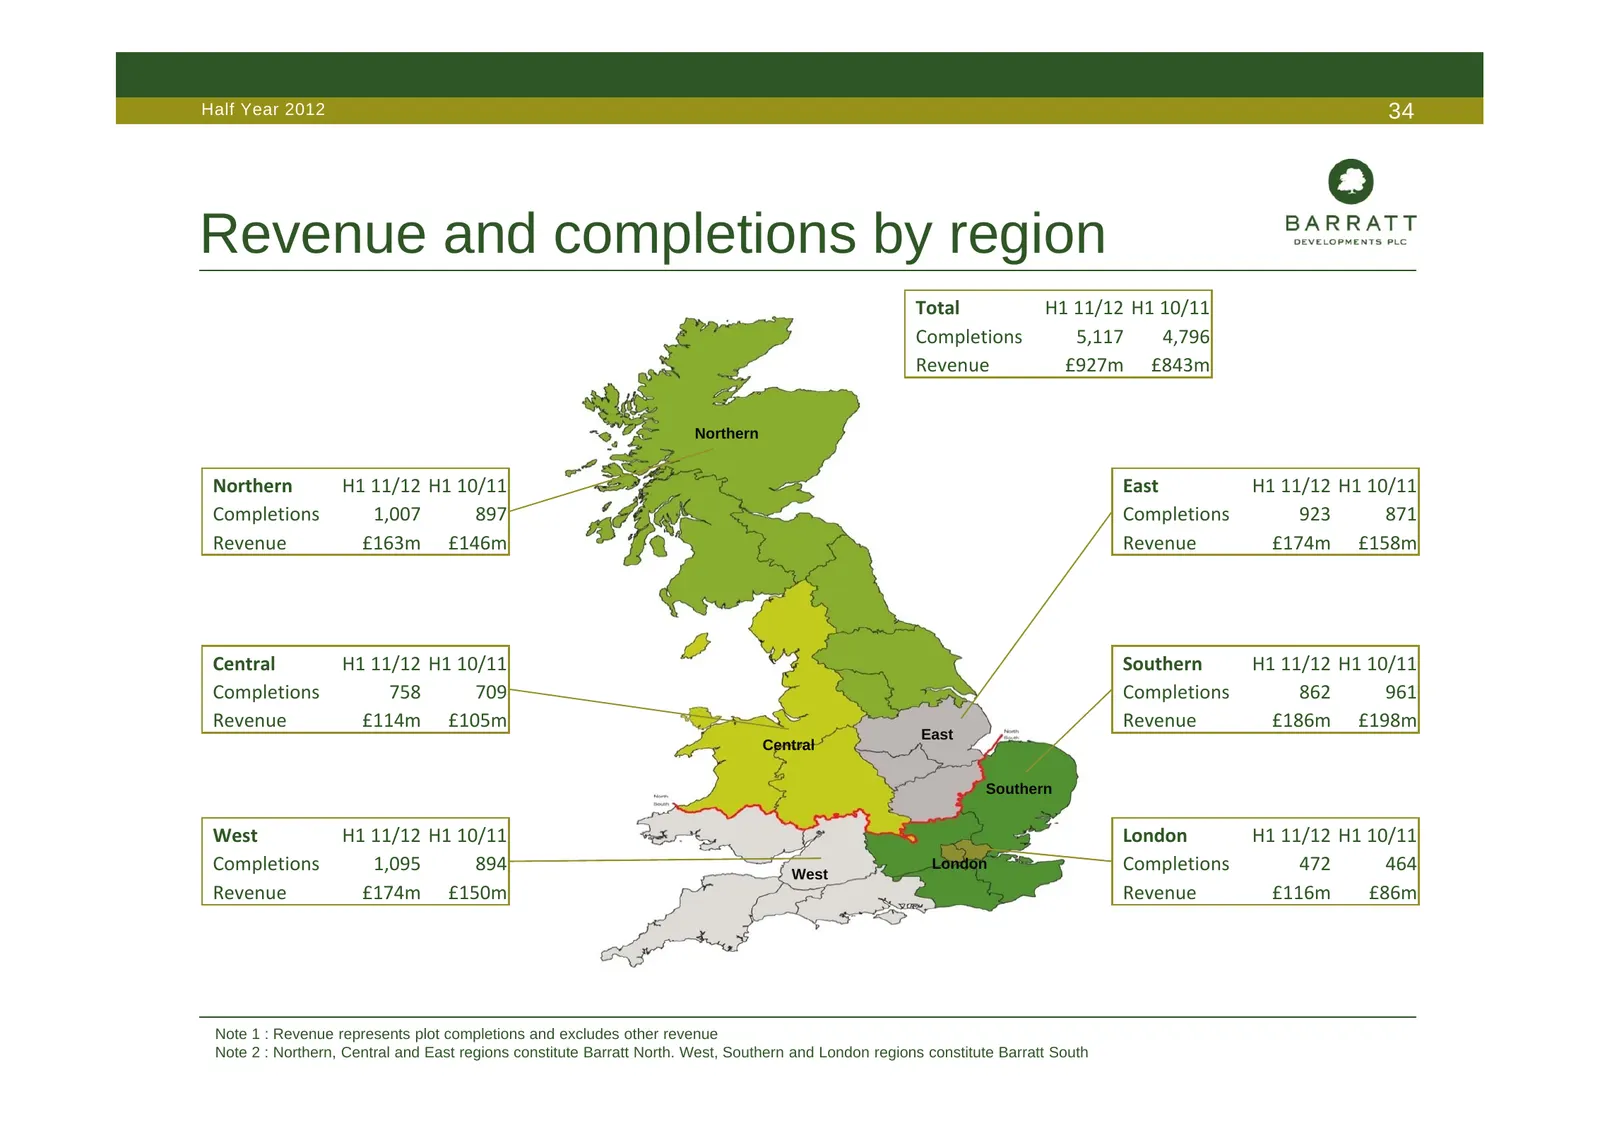
Half Year 2012 34 Revenue and completions by region Total H1 11/12 H1 10/11 Completions 5,117 4,796 Revenue £927m £843m Northern Northern H1 11/12 H1 10/11 East H1 11/12 H1 10/11 Completions 1,007 897 Completions 923 871 Revenue £163m £146m Revenue £174m £158m Central H1 11/12 H1 10/11 Southern H1 1
Slide 35: Trading overview
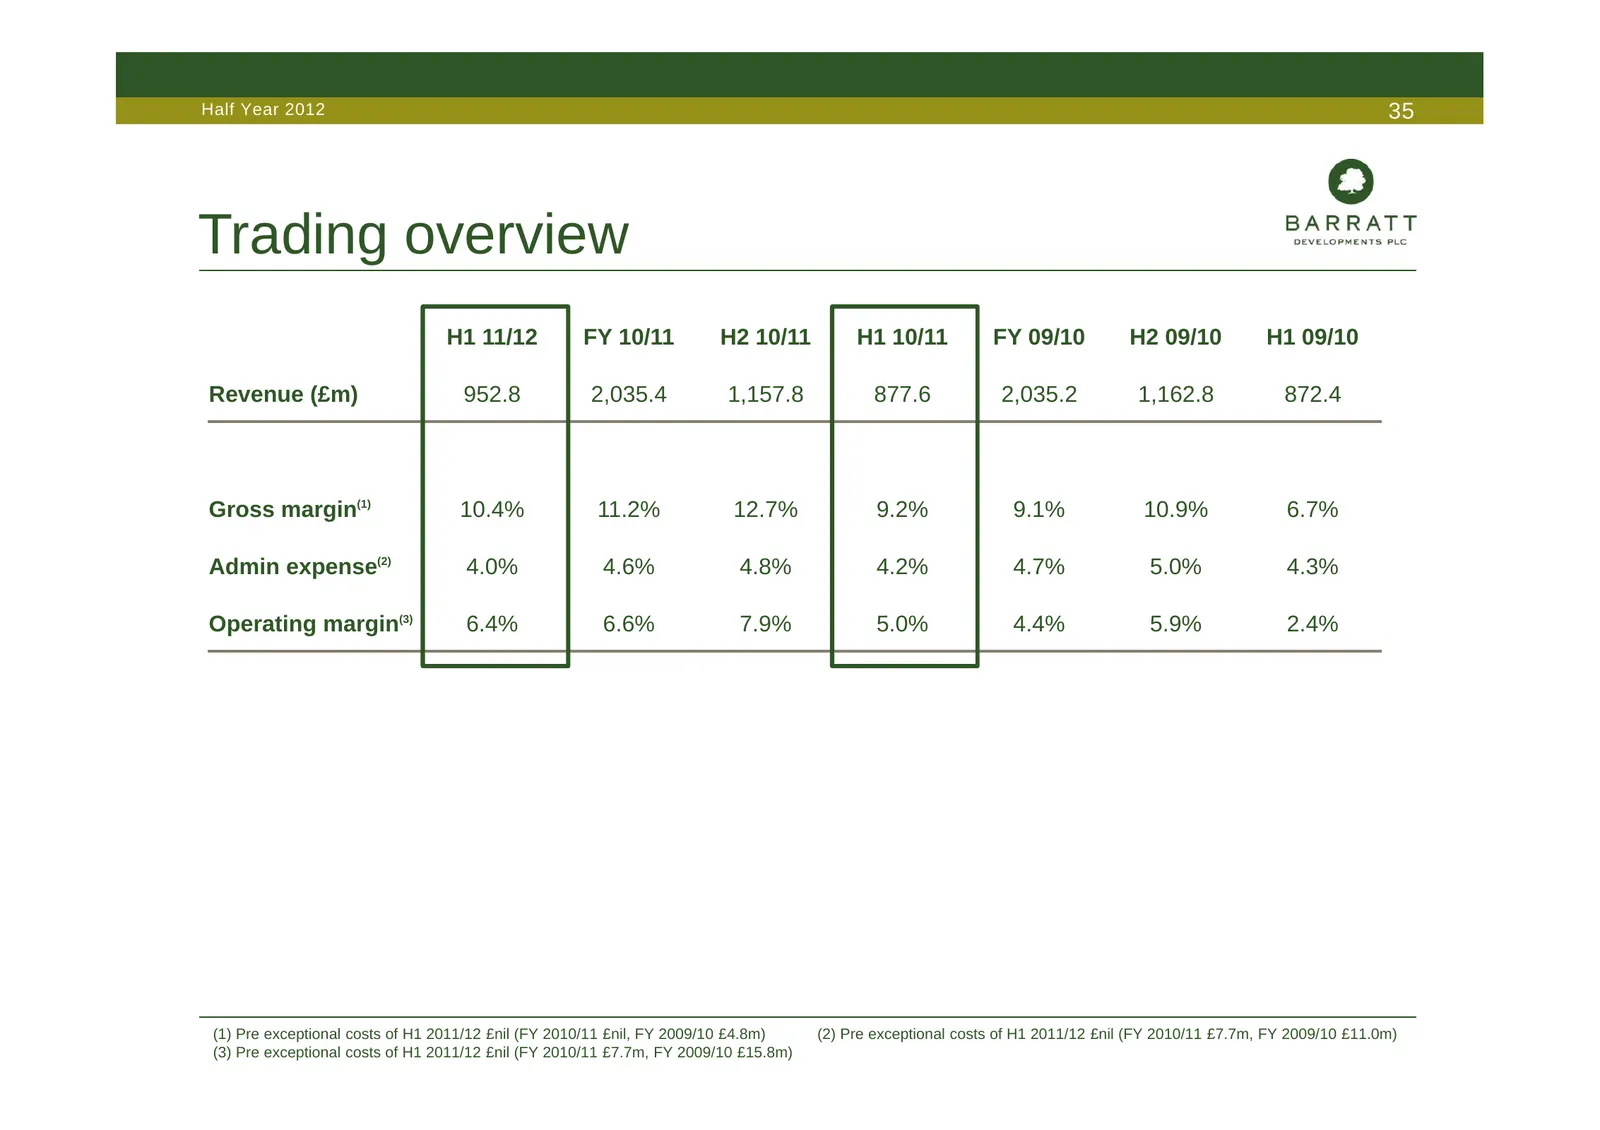
Half Year 2012 35 Trading overview H1 11/12 FY 10/11 H2 10/11 H1 10/11 FY 09/10 H2 09/10 H1 09/10 Revenue (£m) 952.8 2,035.4 1,157.8 877.6 2,035.2 1,162.8 872.4 Gross margin(1) 10.4% 11.2% 12.7% 9.2% 9.1% 10.9% 6.7% Admin expense(2) 4.0% 4.6% 4.8% 4.2% 4.7% 5.0% 4.3% Operating margin(3) 6.4% 6.6% 7.
Slide 36: Landbank delivery profile
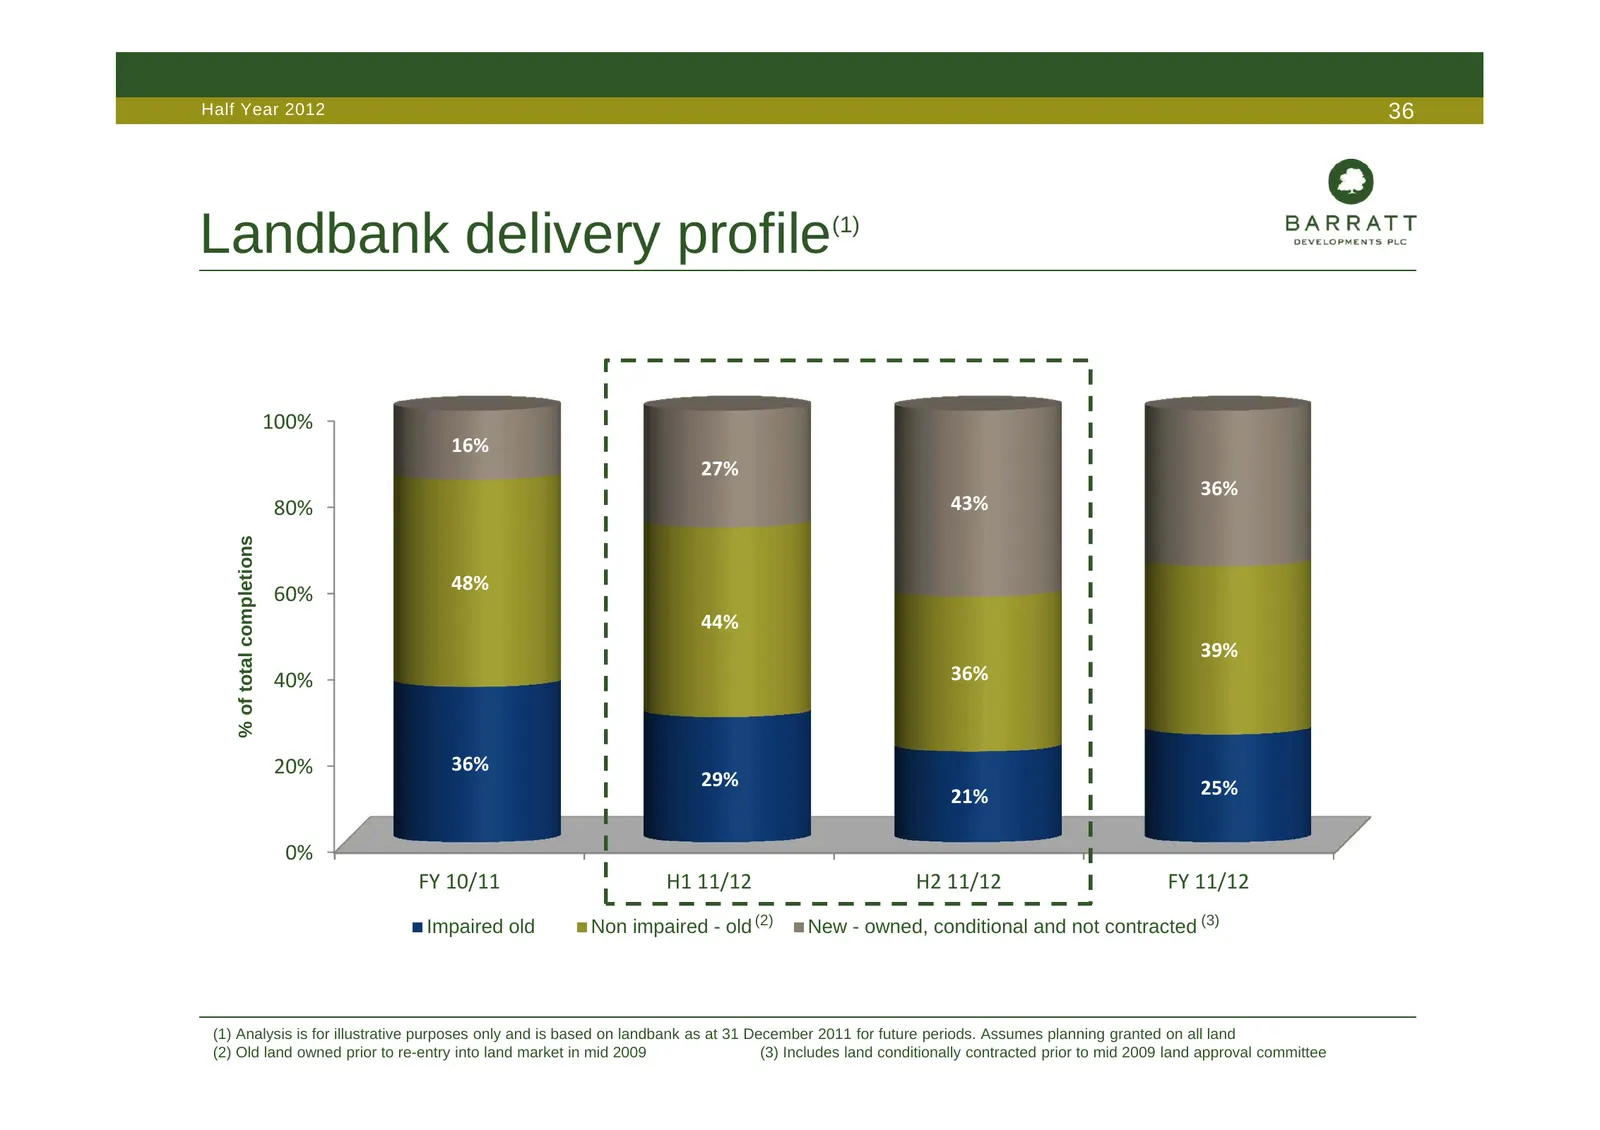
Half Year 2012 36 Landbank delivery profile (1) 100% 16% 27% 36% 80% 43% % of total completions 48% 60% 44% 39% 40% 36% 20% 36% 29% 25% 21% 0% FY 10/11 H1 11/12 H2 11/12 FY 11/12 Impaired old Non impaired - old (2) New - owned, conditional and not contracted (3) (1) Analysis is for illustrative purp
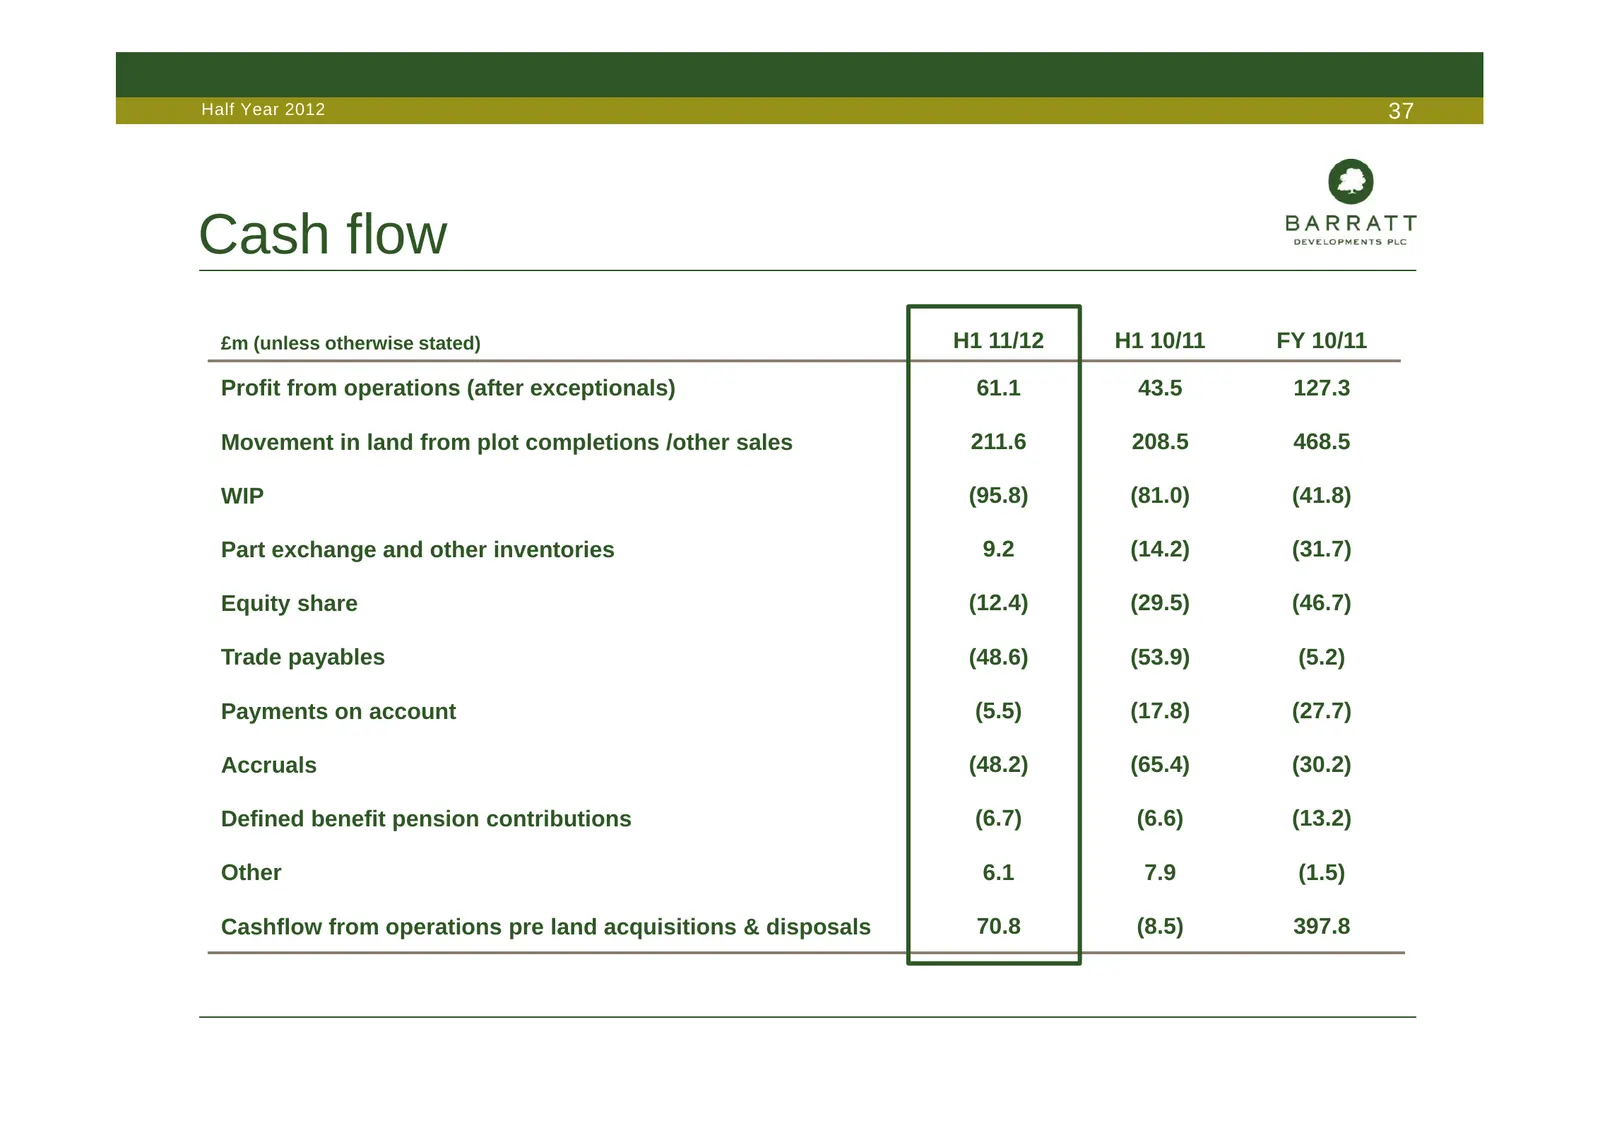
Slide 37: Cash flow
Half Year 2012 37 Cash flow £m (unless otherwise stated) H1 11/12 H1 10/11 FY 10/11 Profit from operations (after exceptionals) 61.1 43.5 127.3 Movement in land from plot completions /other sales 211.6 208.5 468.5 WIP (95.8) (81.0) (41.8) Part exchange and other inventories 9.2 (14.2) (31.7) Equity
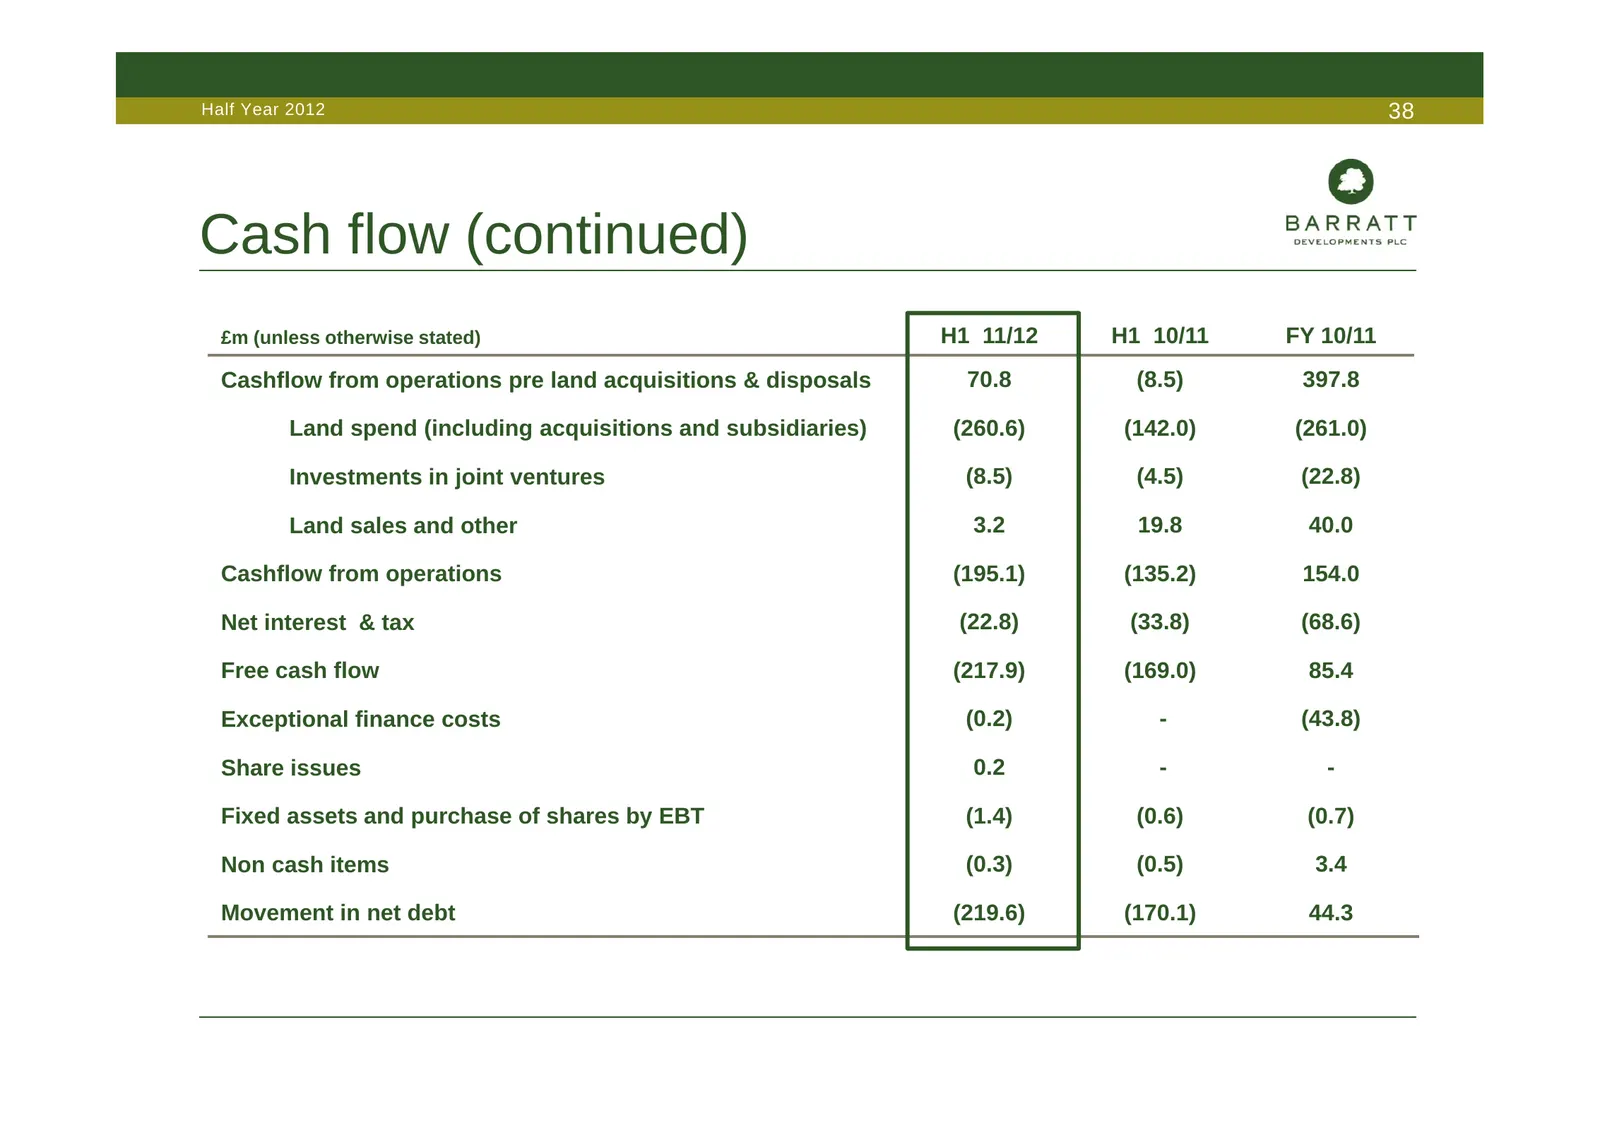
Slide 38: Cash flow (continued)
Half Year 2012 38 Cash flow (continued) £m (unless otherwise stated) H1 11/12 H1 10/11 FY 10/11 Cashflow from operations pre land acquisitions & disposals 70.8 (8.5) 397.8 Land spend (including acquisitions and subsidiaries) (260.6) (142.0) (261.0) Investments in joint ventures (8.5) (4.5) (22.8) La
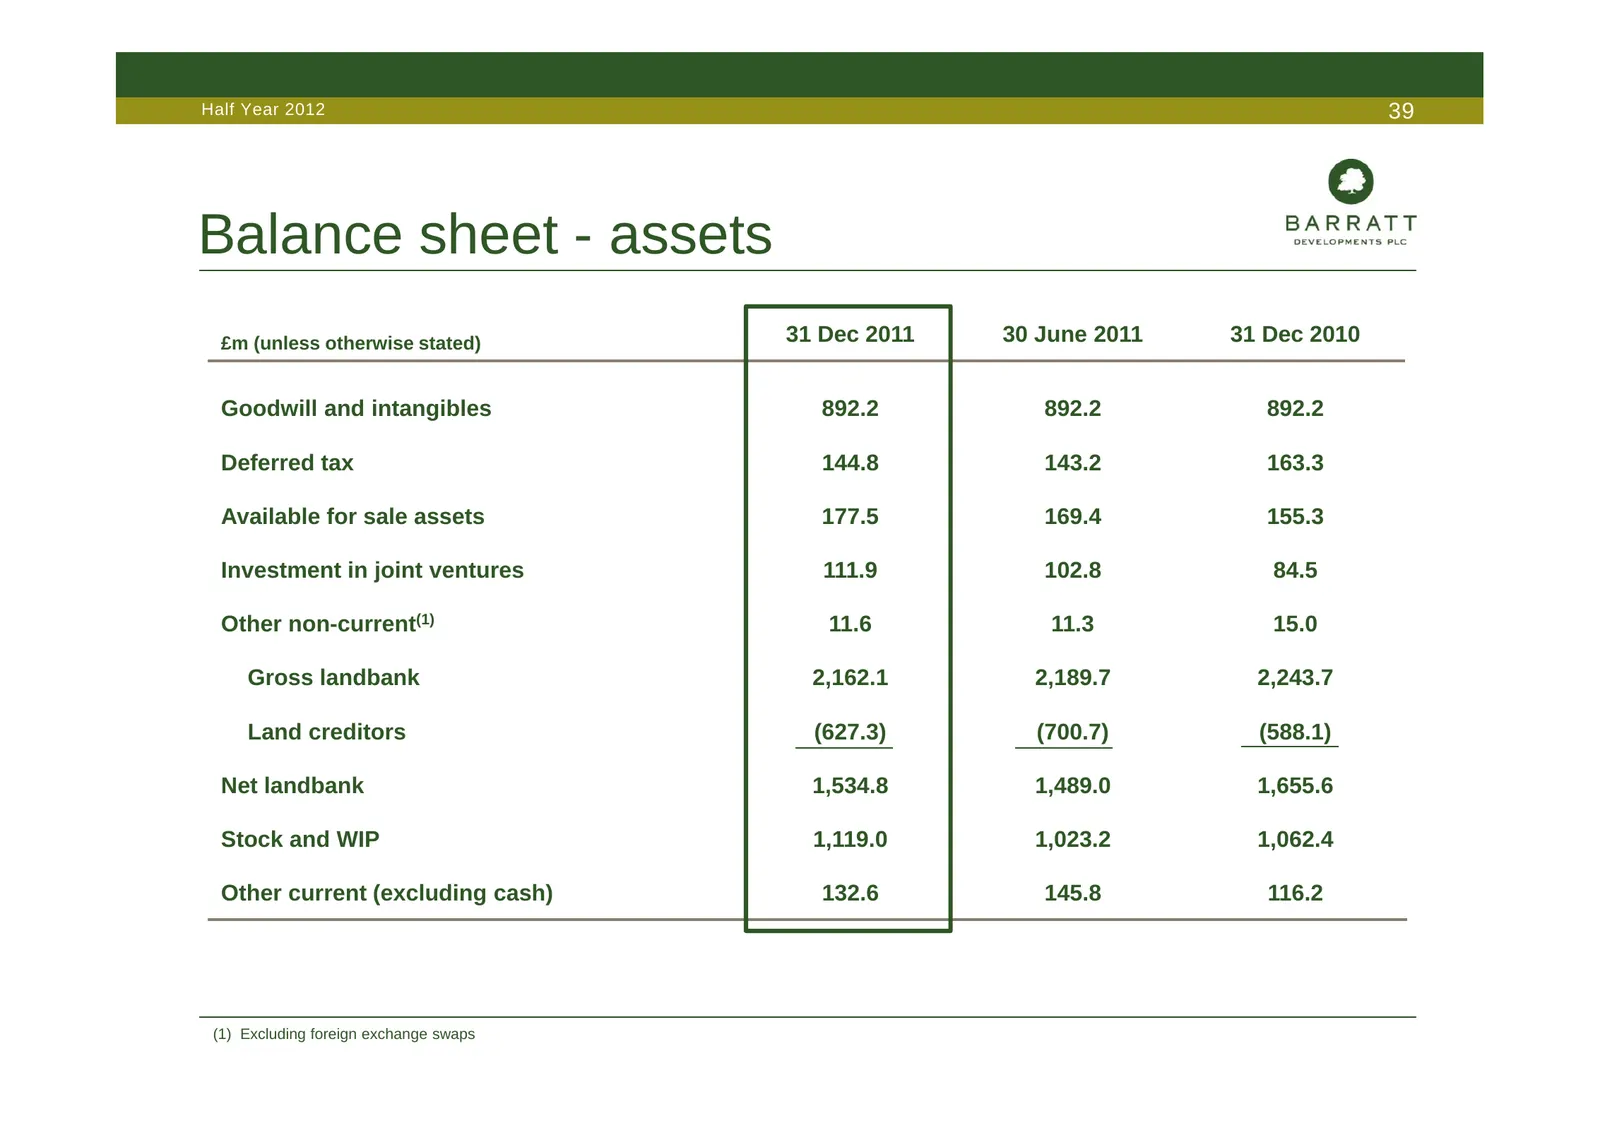
Slide 39: Balance sheet - assets
Half Year 2012 39 Balance sheet - assets £m (unless otherwise stated) 31 Dec 2011 30 June 2011 31 Dec 2010 Goodwill and intangibles 892.2 892.2 892.2 Deferred tax 144.8 143.2 163.3 Available for sale assets 177.5 169.4 155.3 Investment in joint ventures 111.9 102.8 84.5 Other non-current(1) 11.6 11.
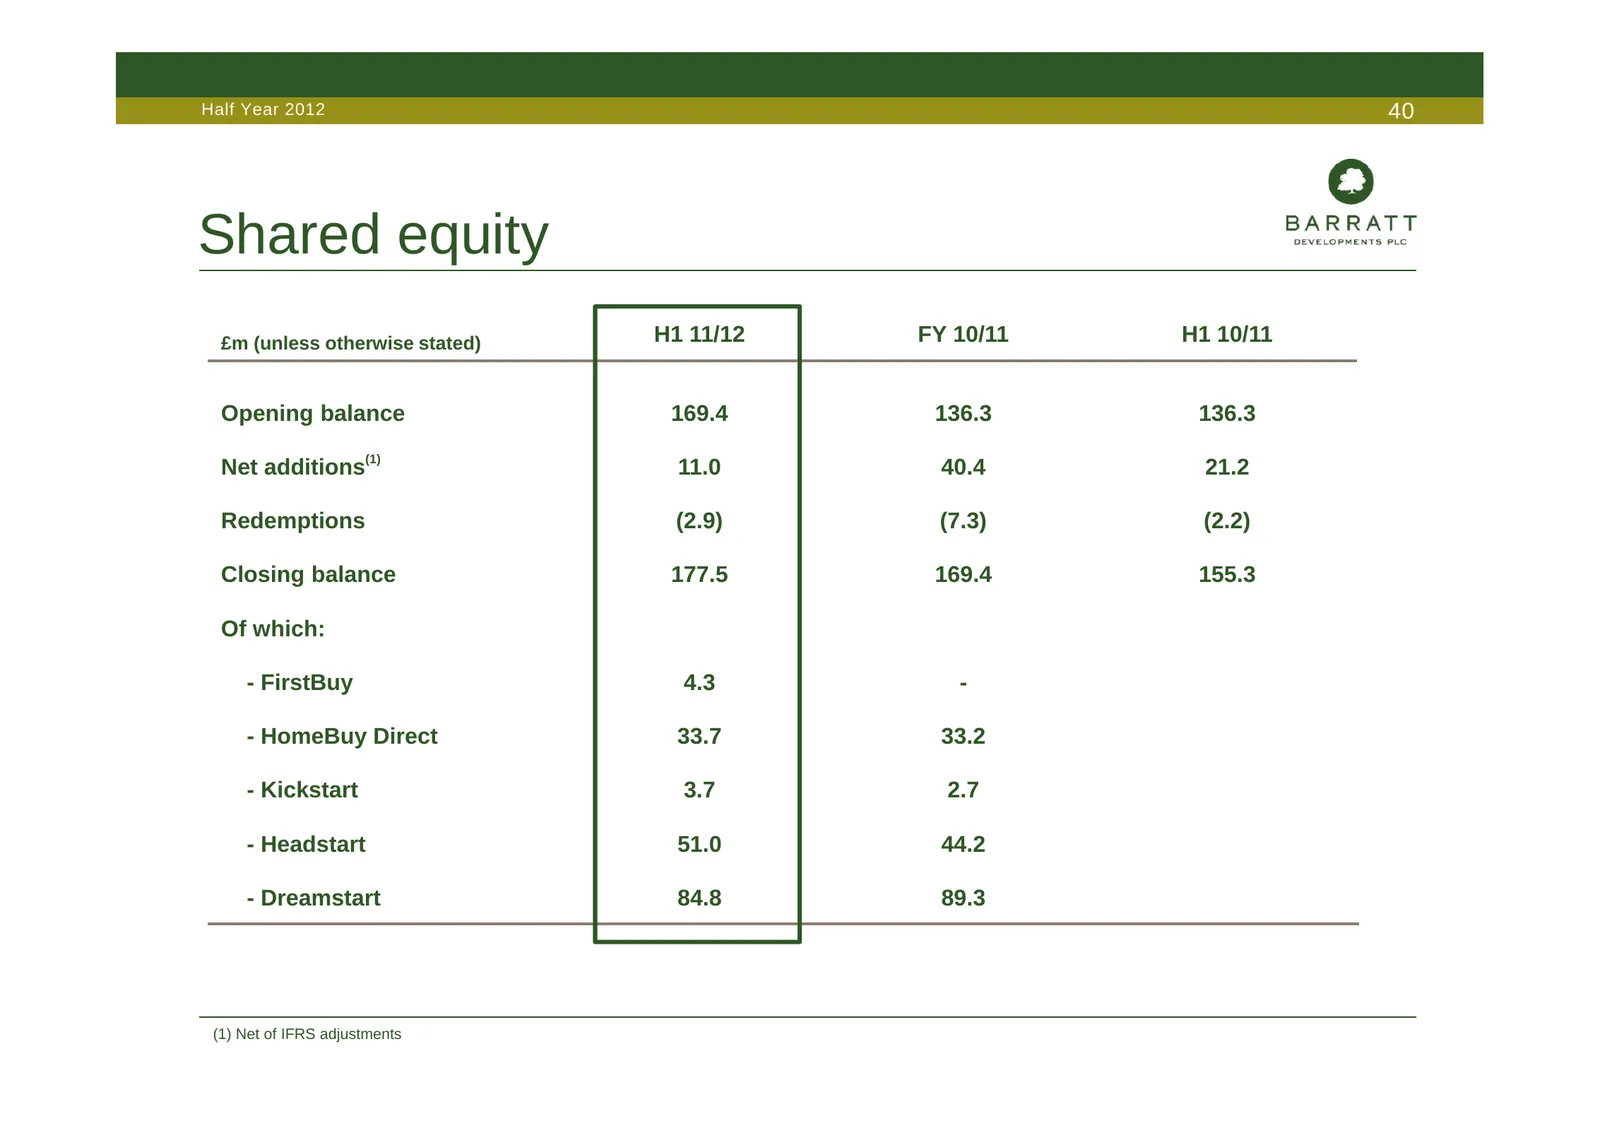
Slide 40: Shared equity
Half Year 2012 40 Shared equity £m (unless otherwise stated) H1 11/12 FY 10/11 H1 10/11 Opening balance 169.4 136.3 136.3 Net additions(1) 11.0 40.4 21.2 Redemptions (2.9) (7.3) (2.2) Closing balance 177.5 169.4 155.3 Of which: - FirstBuy 4.3 - - HomeBuy Direct 33.7 33.2 - Kickstart 3.7 2.7 - Headst
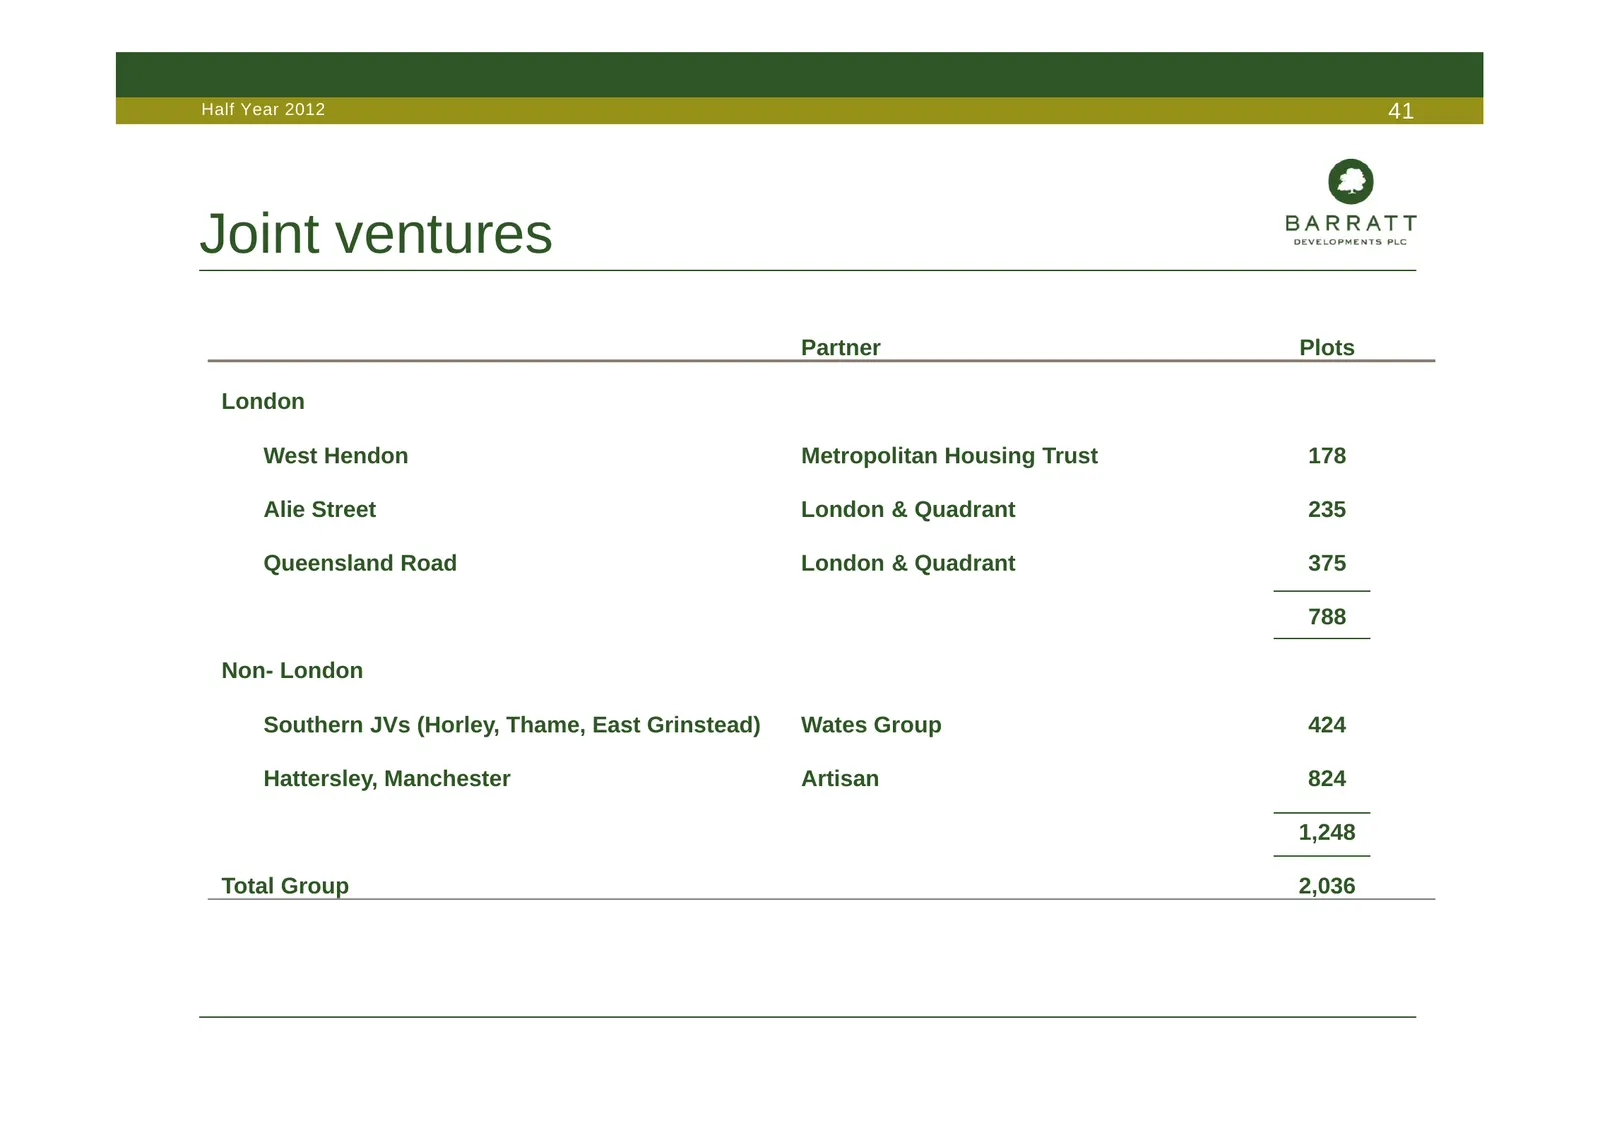
Slide 41: Joint ventures
Half Year 2012 41 Joint ventures Partner Plots London West Hendon Metropolitan Housing Trust 178 Alie Street London & Quadrant 235 Queensland Road London & Quadrant 375 788 Non- London Southern JVs (Horley, Thame, East Grinstead) Wates Group 424 Hattersley, Manchester Artisan 824 1,248 Total Group 2
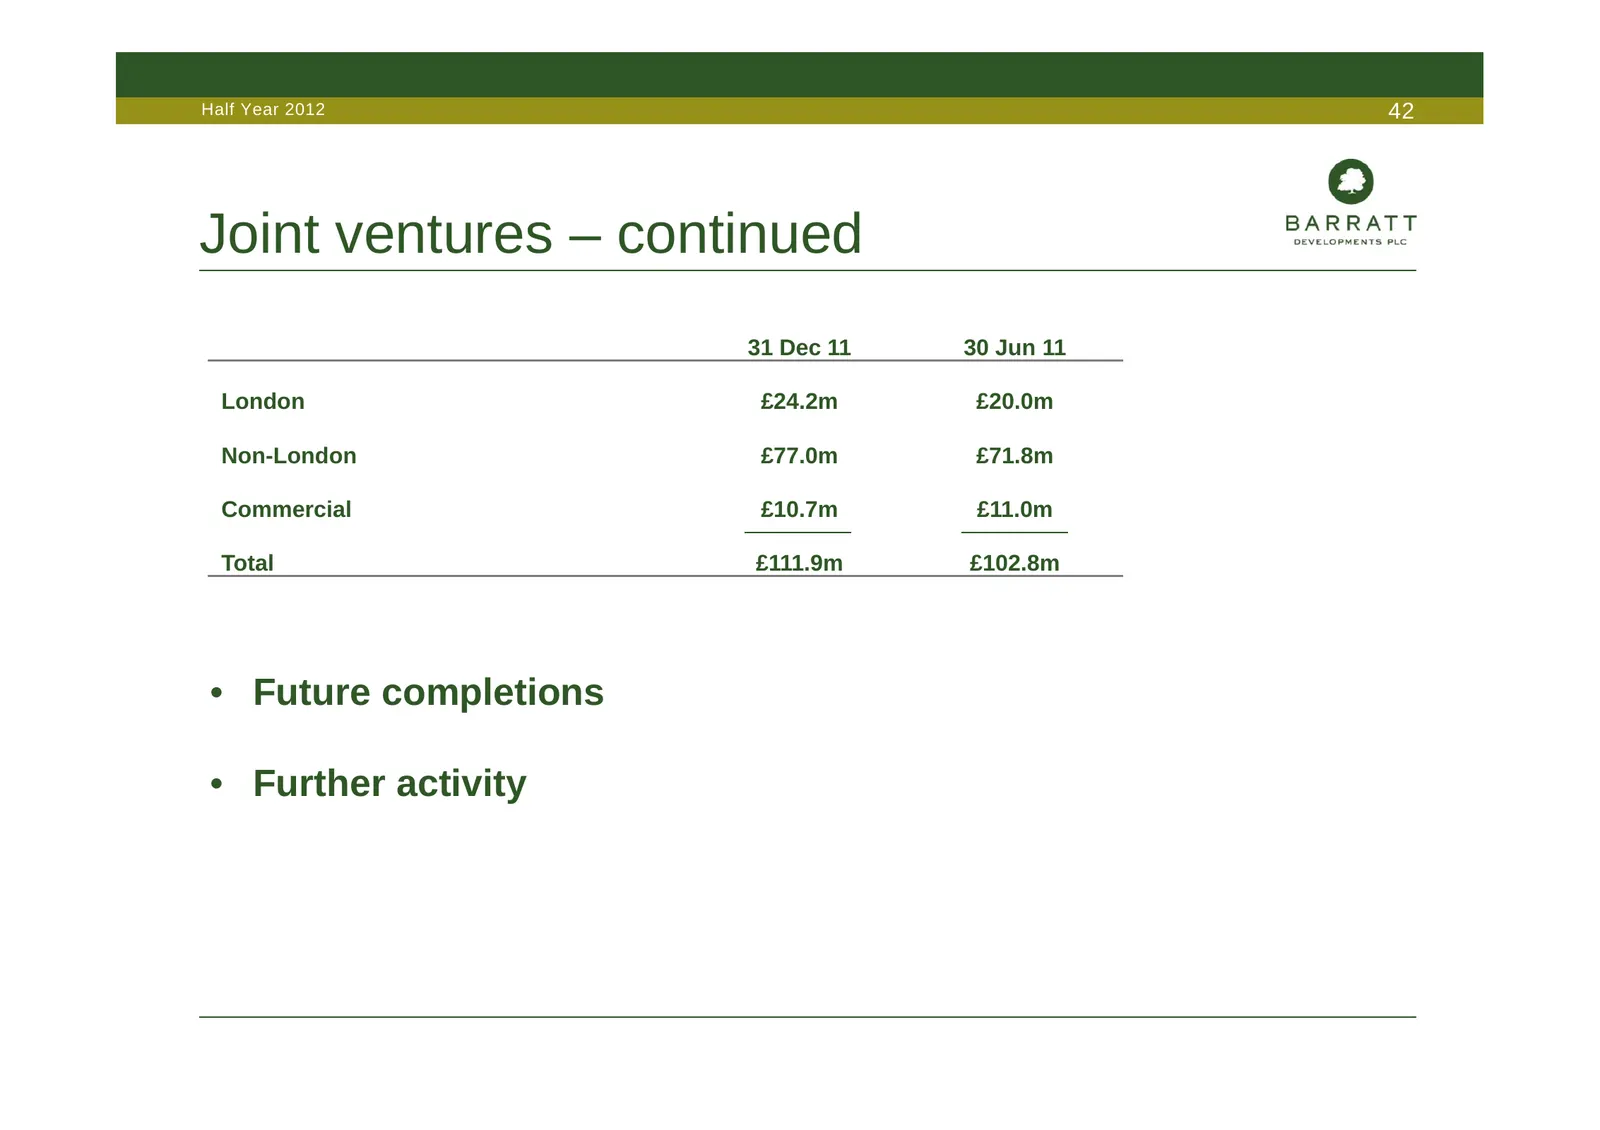
Slide 42: Joint ventures – continued
Half Year 2012 42 Joint ventures – continued 31 Dec 11 30 Jun 11 London £24.2m £20.0m Non-London £77.0m £71.8m Commercial £10.7m £11.0m Total £111.9m £102.8m • Future completions • Further activity
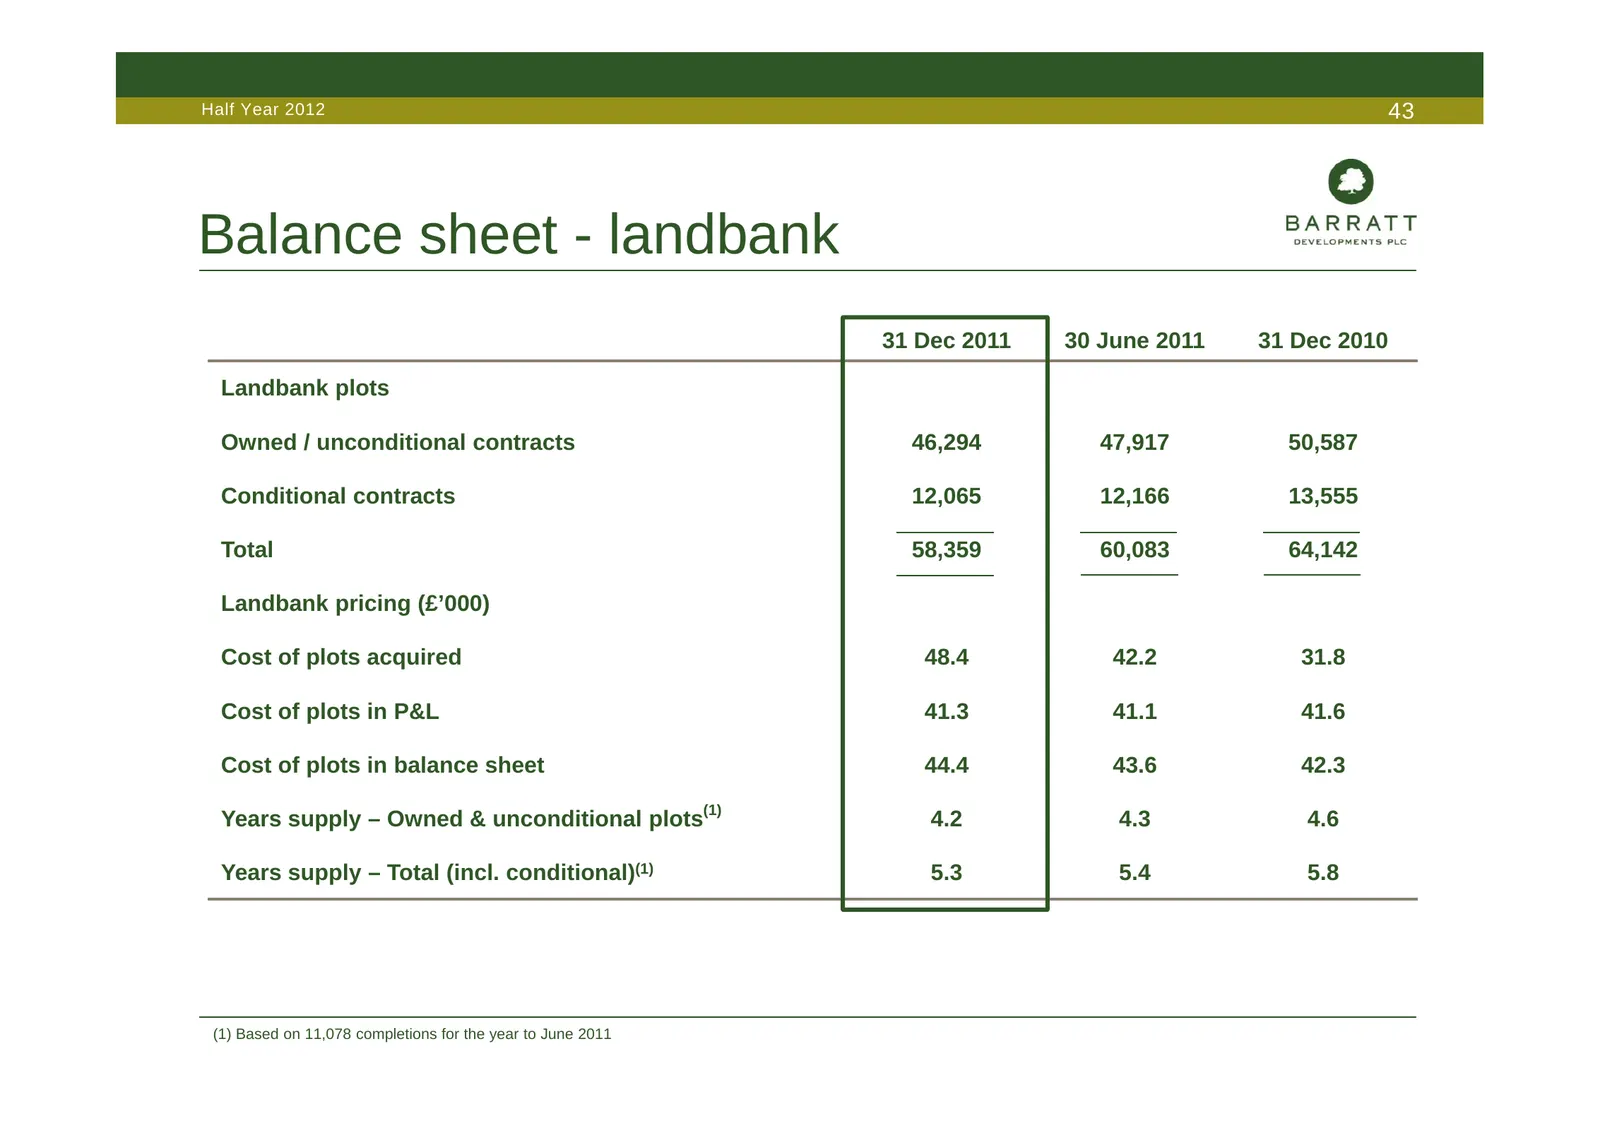
Slide 43: Balance sheet - landbank
Half Year 2012 43 Balance sheet - landbank 31 Dec 2011 30 June 2011 31 Dec 2010 Landbank plots Owned / unconditional contracts 46,294 47,917 50,587 Conditional contracts 12,065 12,166 13,555 Total 58,359 60,083 64,142 Landbank pricing (£’000) Cost of plots acquired 48.4 42.2 31.8 Cost of plots in P&
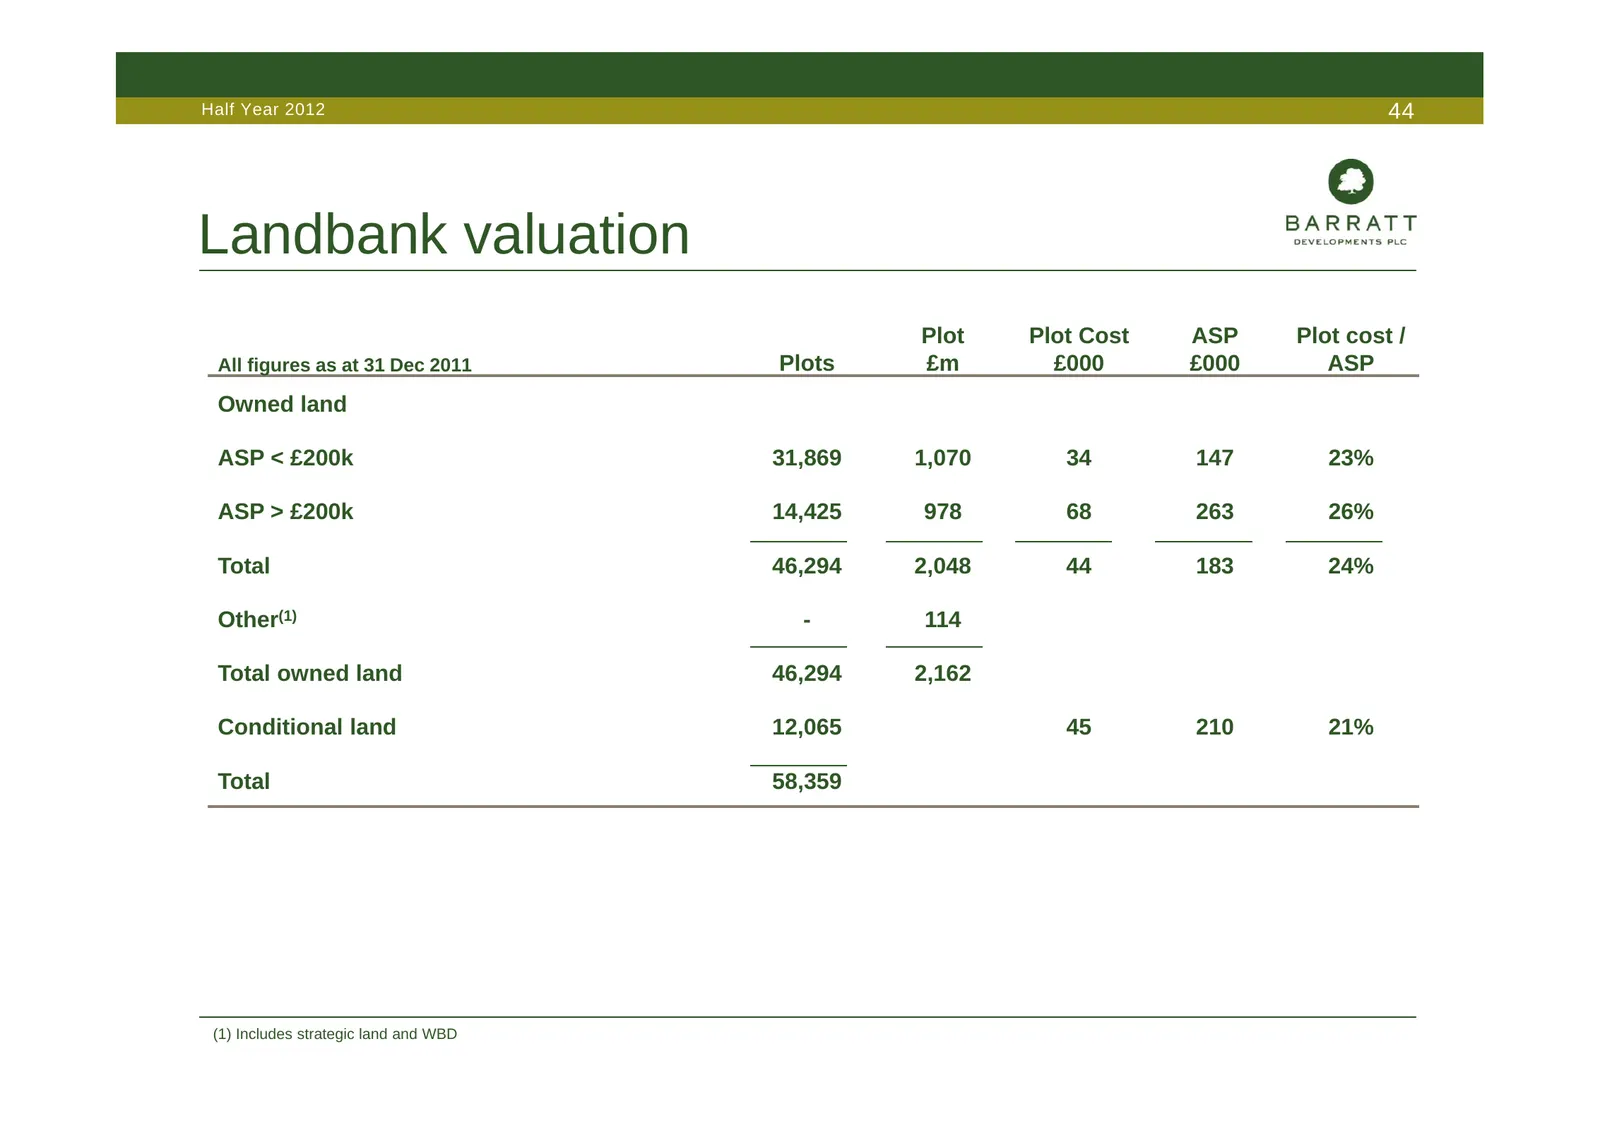
Slide 44: Landbank valuation
Half Year 2012 44 Landbank valuation Plot Plot Cost ASP Plot cost / All figures as at 31 Dec 2011 Plots £m £000 £000 ASP Owned land ASP < £200k 31,869 1,070 34 147 23% ASP > £200k 14,425 978 68 263 26% Total 46,294 2,048 44 183 24% Other(1) - 114 Total owned land 46,294 2,162 Conditional land 12,065
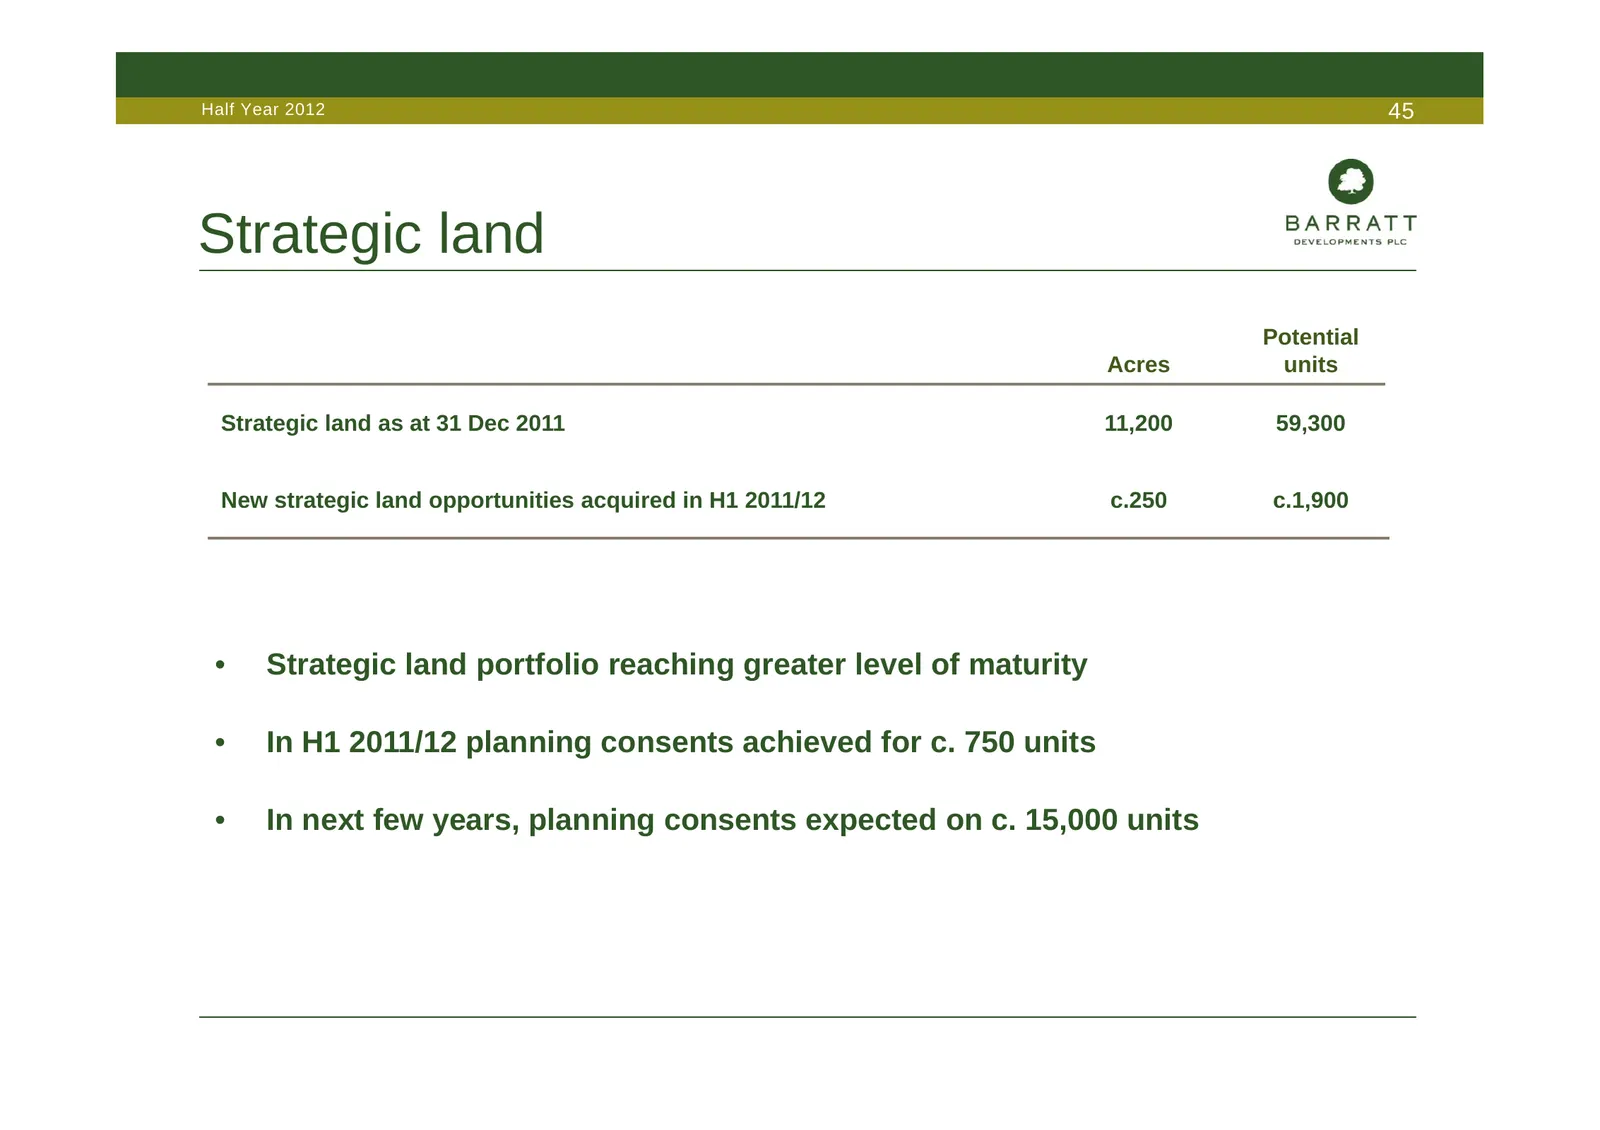
Slide 45: Strategic land
Half Year 2012 45 Strategic land Potential Acres units Strategic land as at 31 Dec 2011 11,200 59,300 New strategic land opportunities acquired in H1 2011/12 c.250 c.1,900 • Strategic land portfolio reaching greater level of maturity • In H1 2011/12 planning consents achieved for c. 750 units • In n
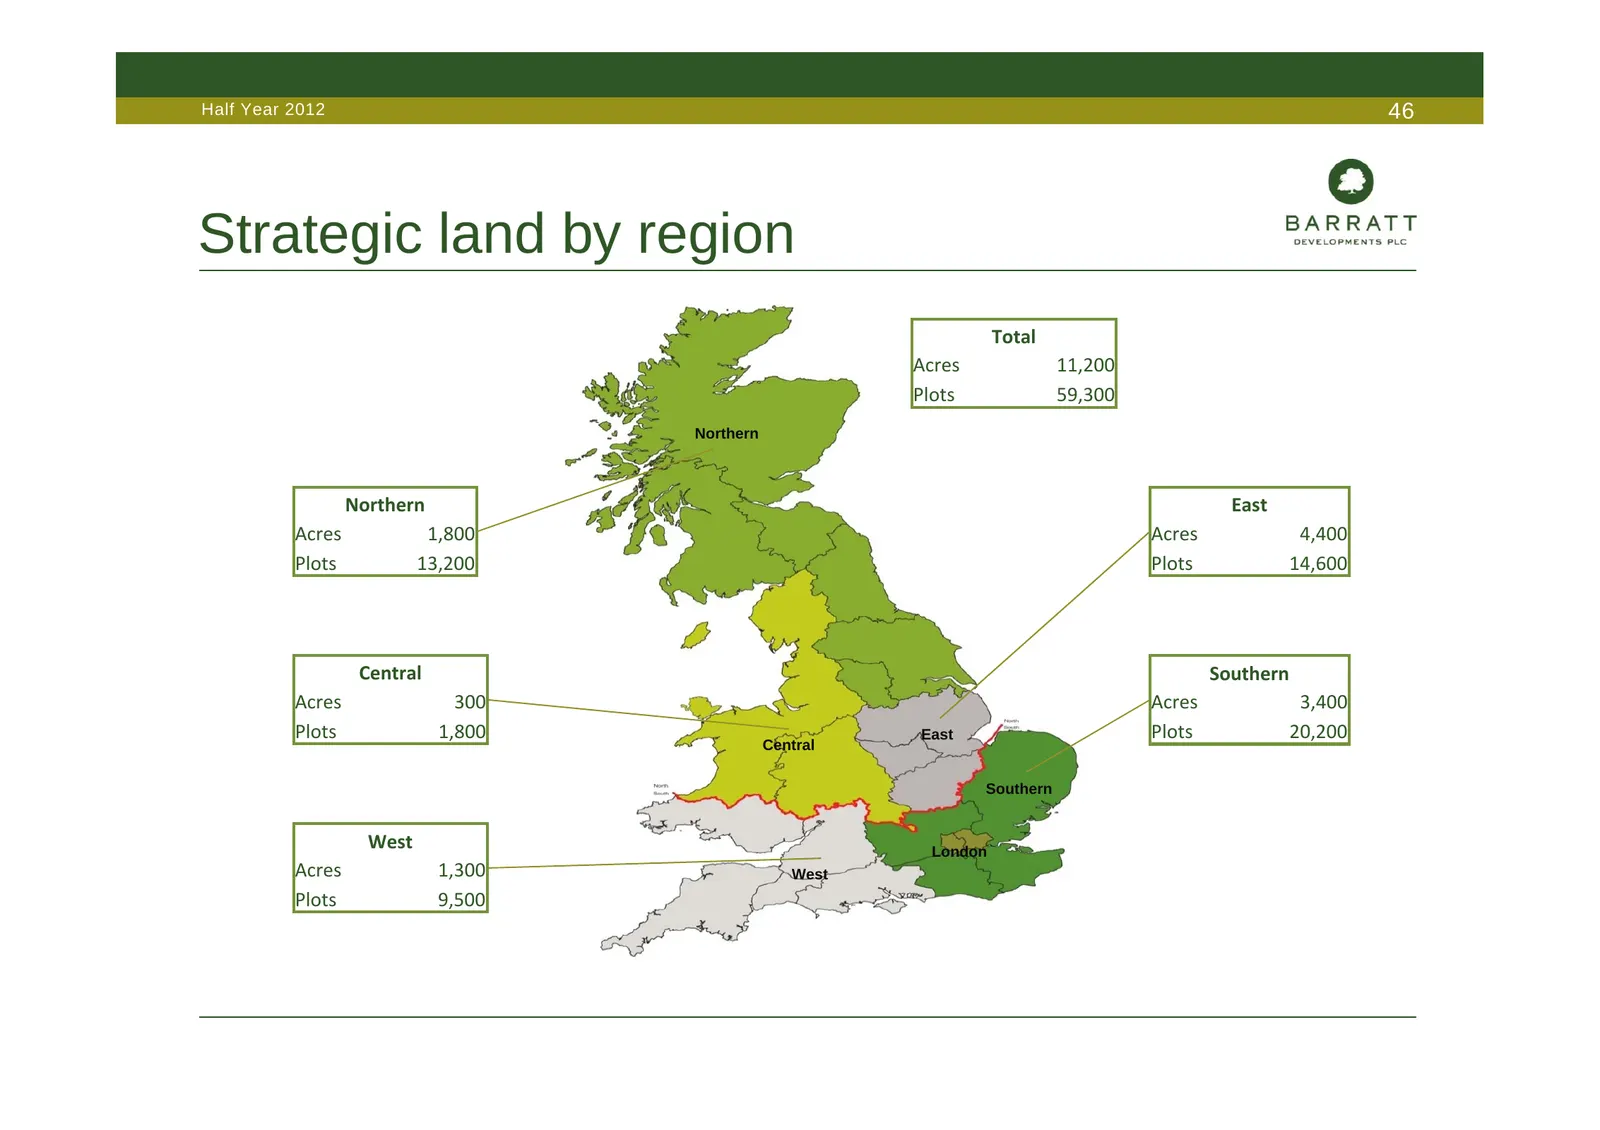
Slide 46: Strategic land by region
Half Year 2012 46 Strategic land by region Total Acres 11,200 Plots 59,300 Northern Northern East Acres 1,800 Acres 4,400 Plots 13,200 Plots 14,600 Central Southern Acres 300 Acres 3,400 Plots 1,800 East Plots 20,200 Central Southern West London Acres 1,300 West Plots 9,500
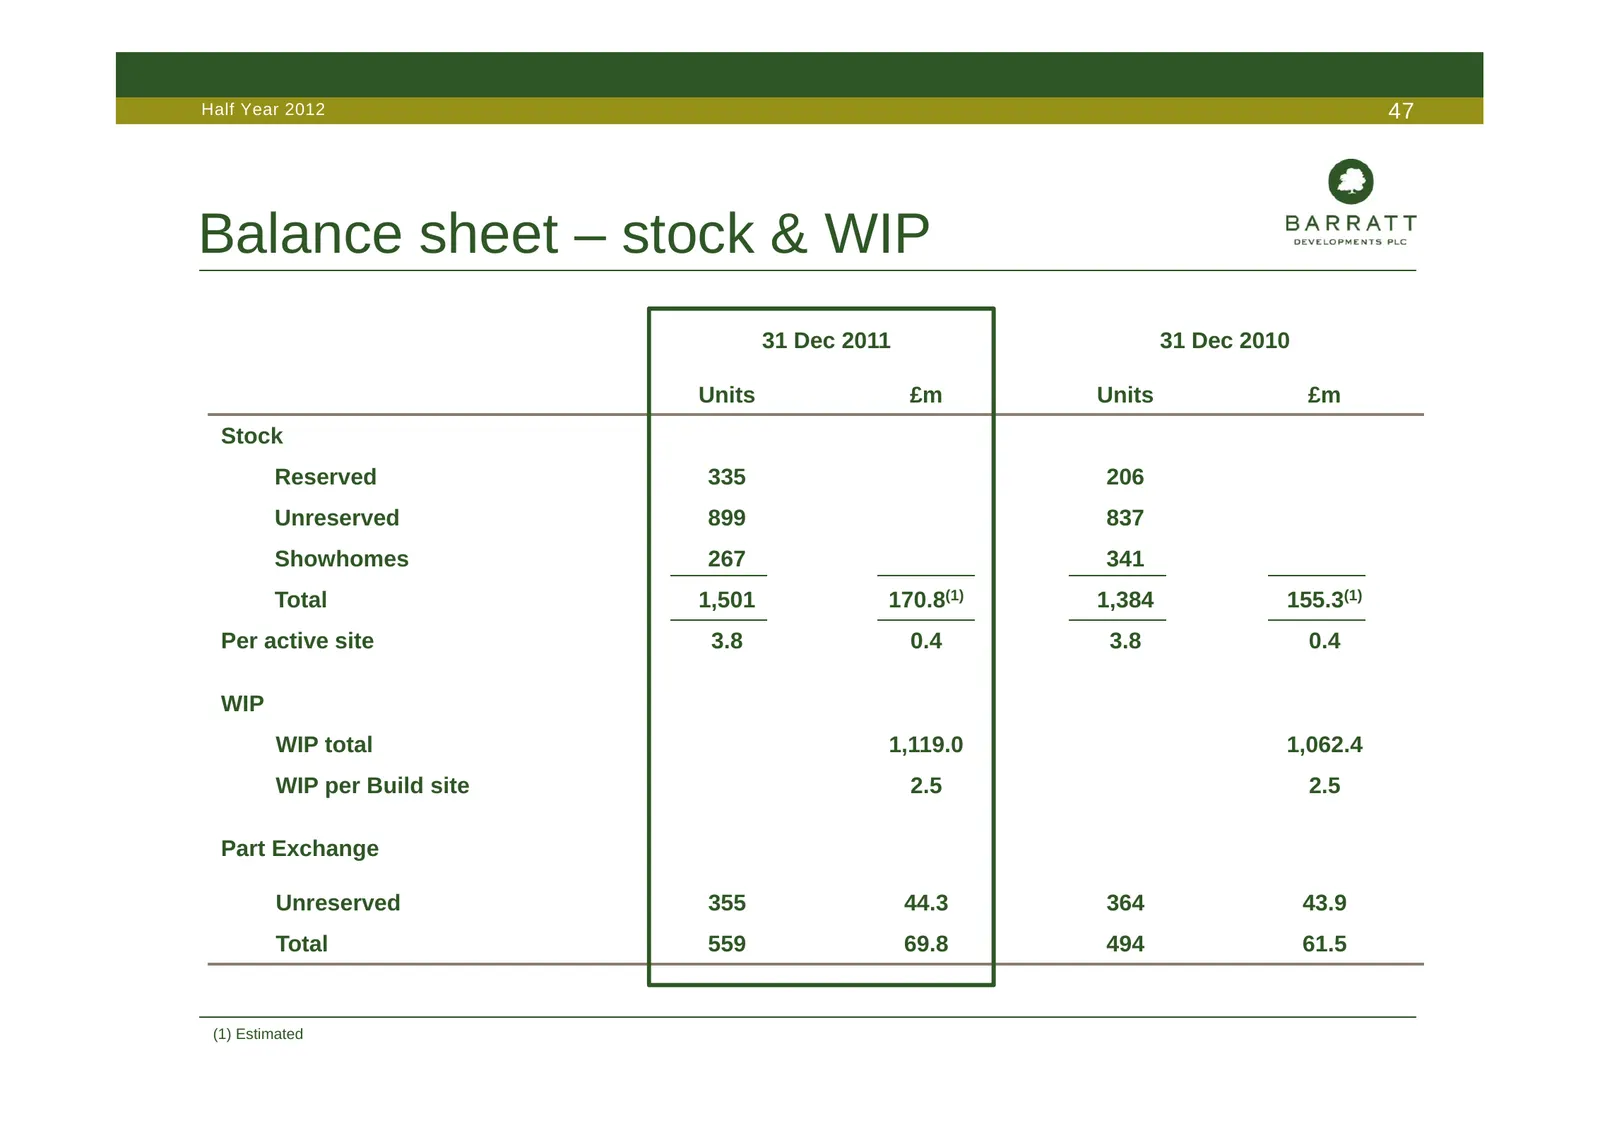
Slide 47: Balance sheet – stock & WIP
Half Year 2012 47 Balance sheet – stock & WIP 31 Dec 2011 31 Dec 2010 Units £m Units £m Stock Reserved 335 206 Unreserved 899 837 Showhomes 267 341 Total 1,501 170.8(1) 1,384 155.3(1) Per active site 3.8 0.4 3.8 0.4 WIP WIP total 1,119.0 1,062.4 WIP per Build site 2.5 2.5 Part Exchange Unreserved 35
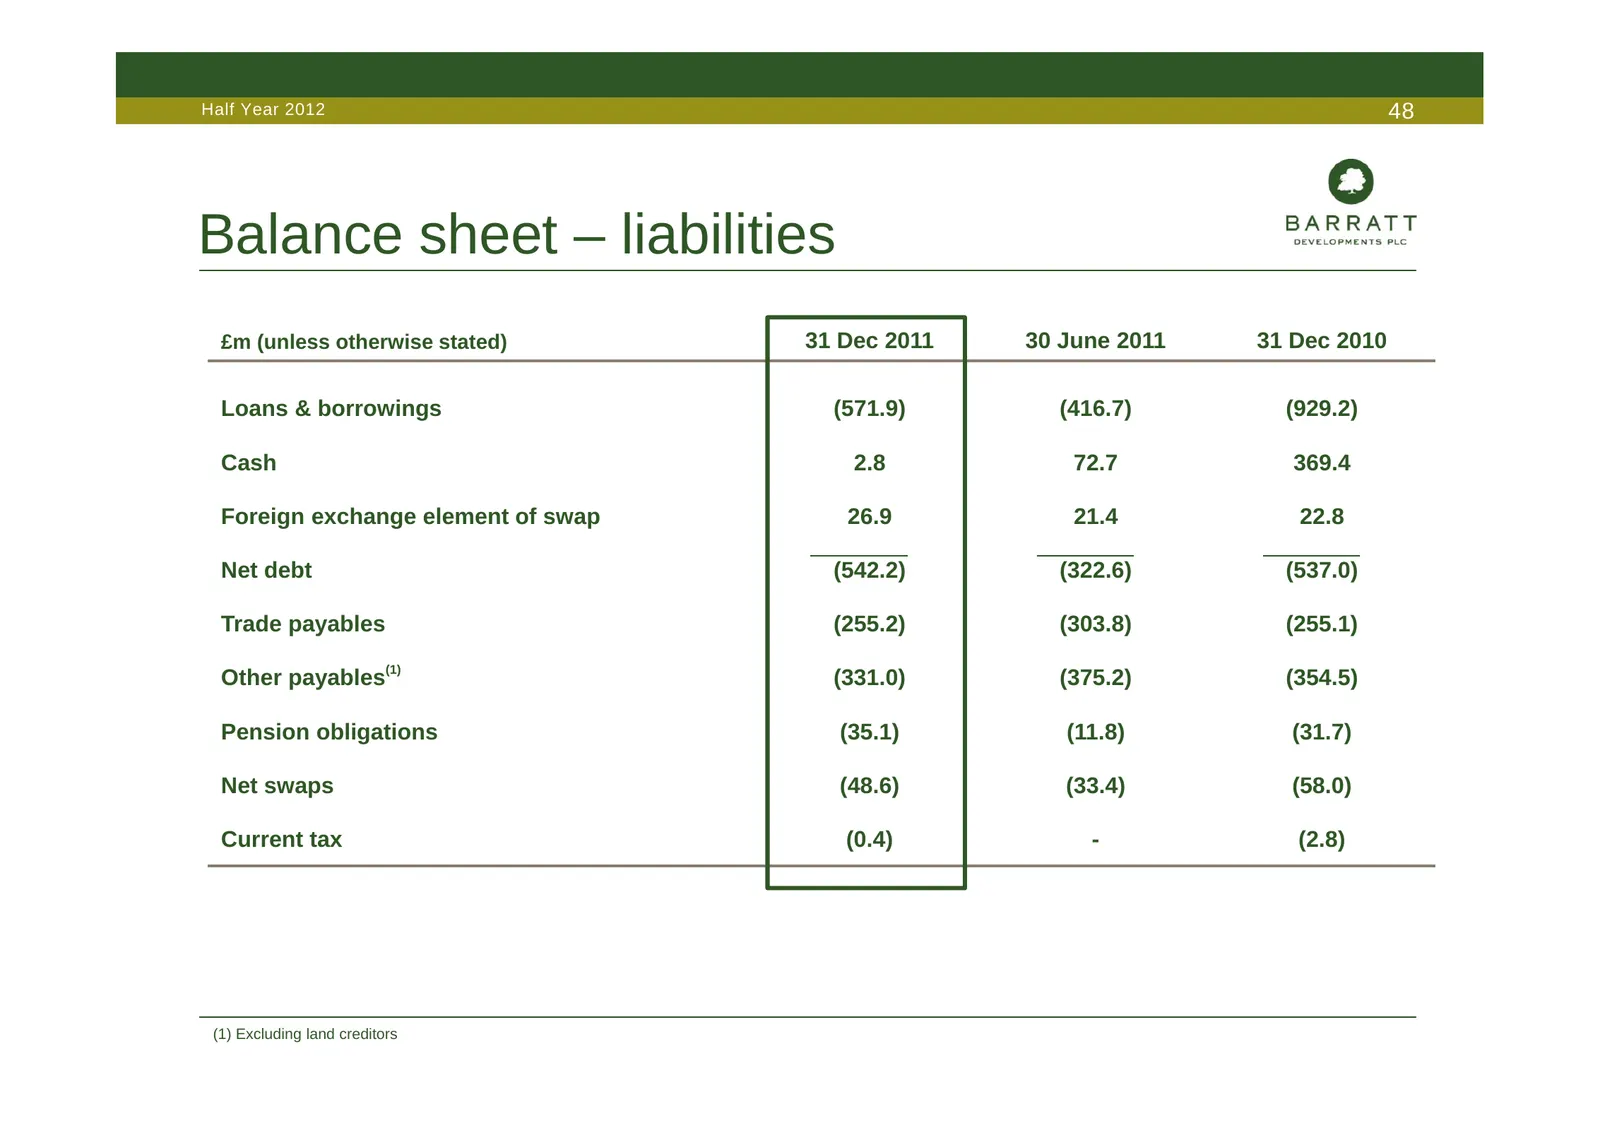
Slide 48: Balance sheet – liabilities
Half Year 2012 48 Balance sheet – liabilities £m (unless otherwise stated) 31 Dec 2011 30 June 2011 31 Dec 2010 Loans & borrowings (571.9) (416.7) (929.2) Cash 2.8 72.7 369.4 Foreign exchange element of swap 26.9 21.4 22.8 Net debt (542.2) (322.6) (537.0) Trade payables (255.2) (303.8) (255.1) Other
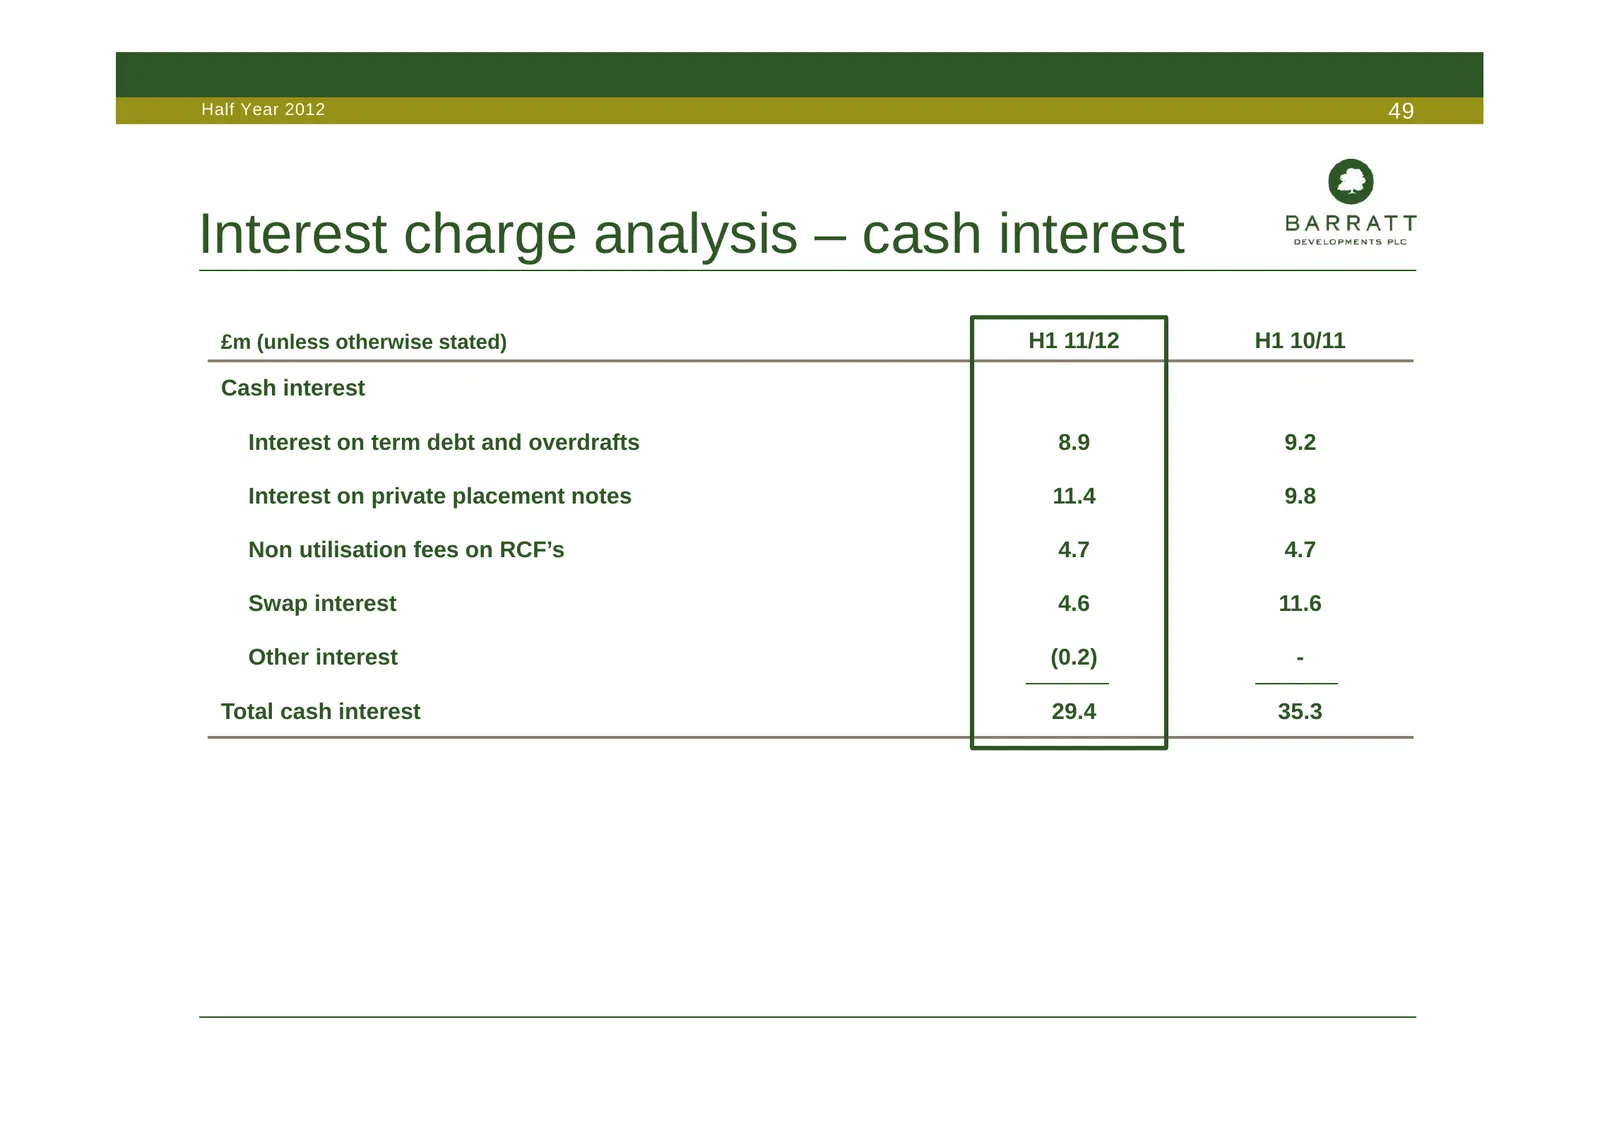
Slide 49: Interest charge analysis – cash interest
Half Year 2012 49 Interest charge analysis – cash interest £m (unless otherwise stated) H1 11/12 H1 10/11 Cash interest Interest on term debt and overdrafts 8.9 9.2 Interest on private placement notes 11.4 9.8 Non utilisation fees on RCF’s 4.7 4.7 Swap interest 4.6 11.6 Other interest (0.2) - Total
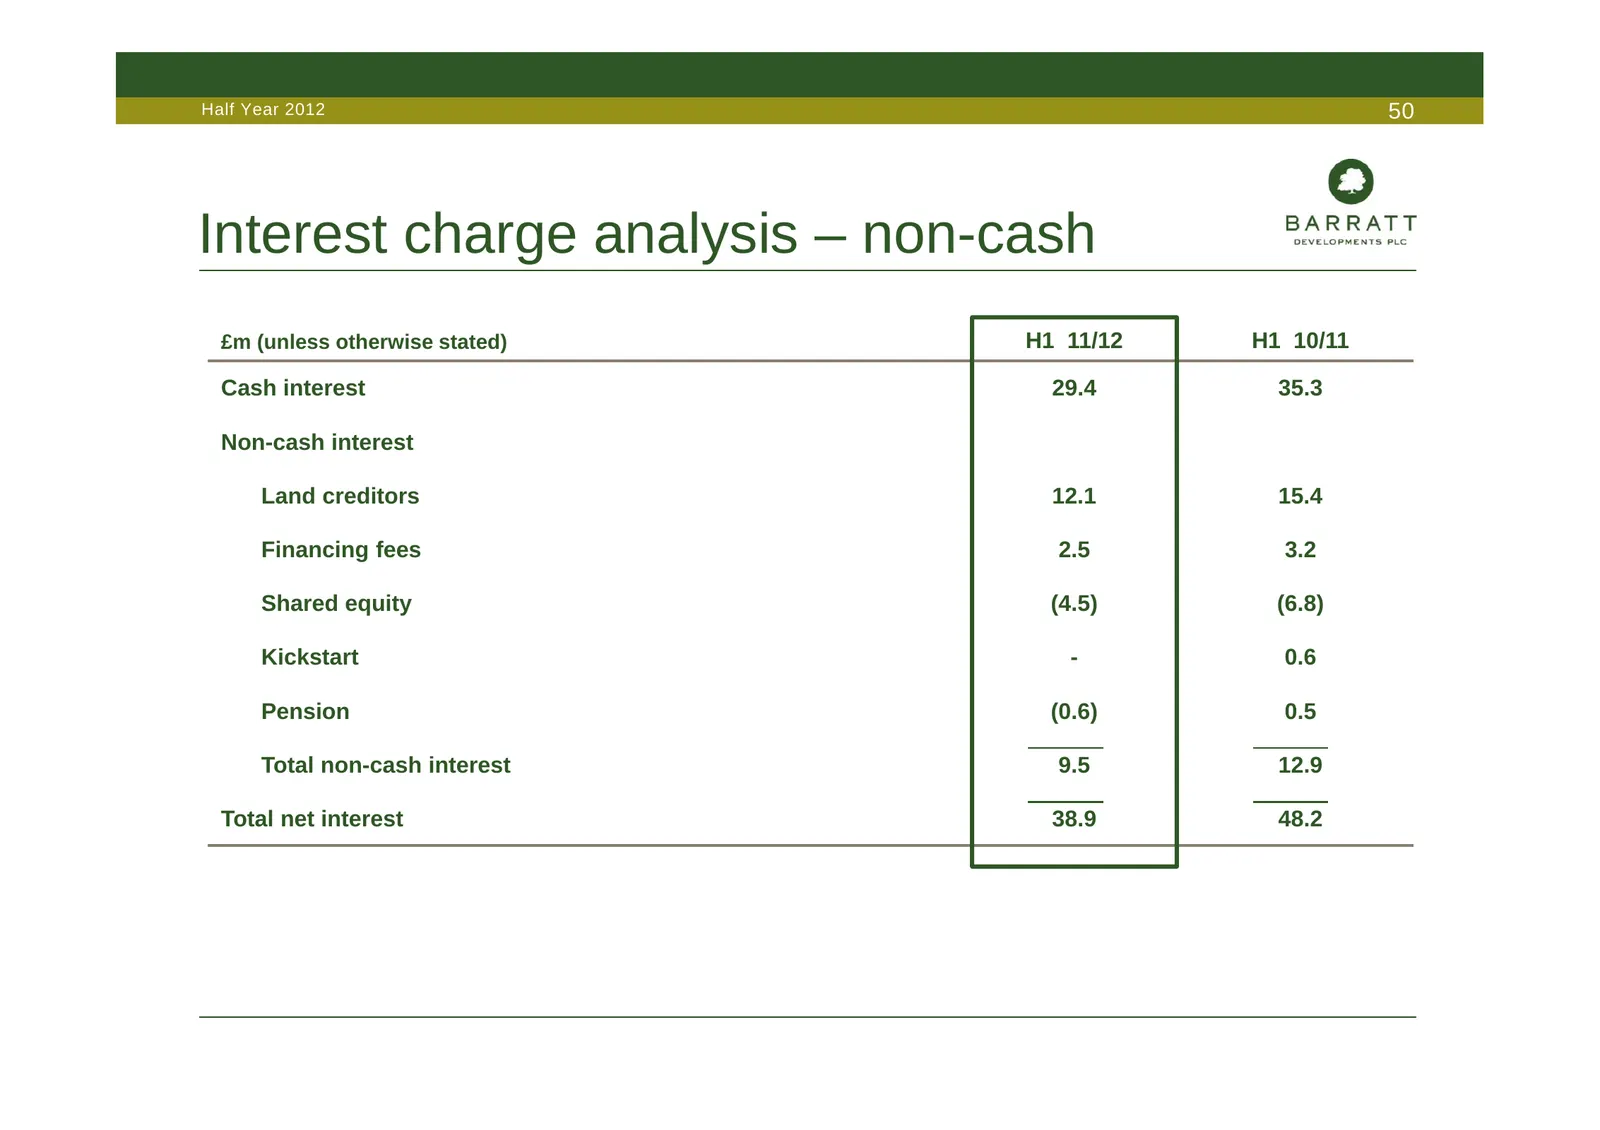
Slide 50: Interest charge analysis – non-cash
Half Year 2012 50 Interest charge analysis – non-cash £m (unless otherwise stated) H1 11/12 H1 10/11 Cash interest 29.4 35.3 Non-cash interest Land creditors 12.1 15.4 Financing fees 2.5 3.2 Shared equity (4.5) (6.8) Kickstart - 0.6 Pension (0.6) 0.5 Total non-cash interest 9.5 12.9 Total net intere
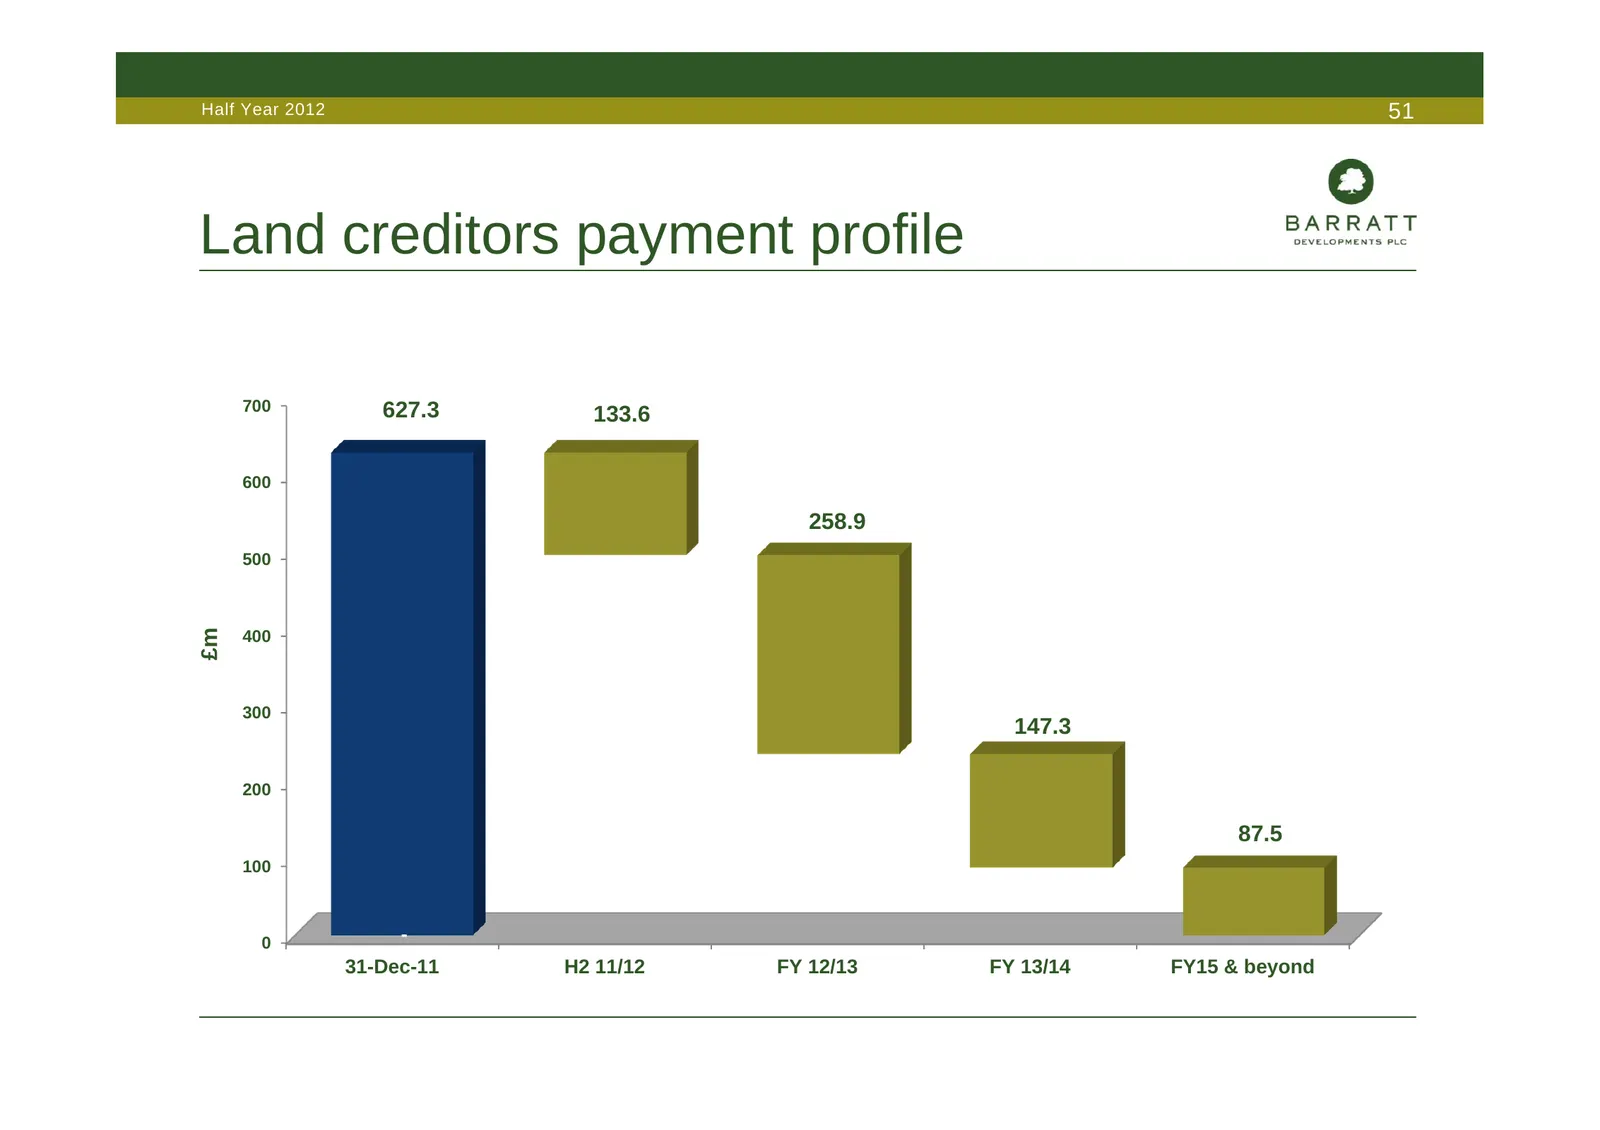
Slide 51: Land creditors payment profile
Half Year 2012 51 Land creditors payment profile 700 627.3 133.6 600 258.9 500 £m 400 300 147.3 200 87.5 100 0 - 31-Dec-11 H2 11/12 FY 12/13 FY 13/14 FY15 & beyond
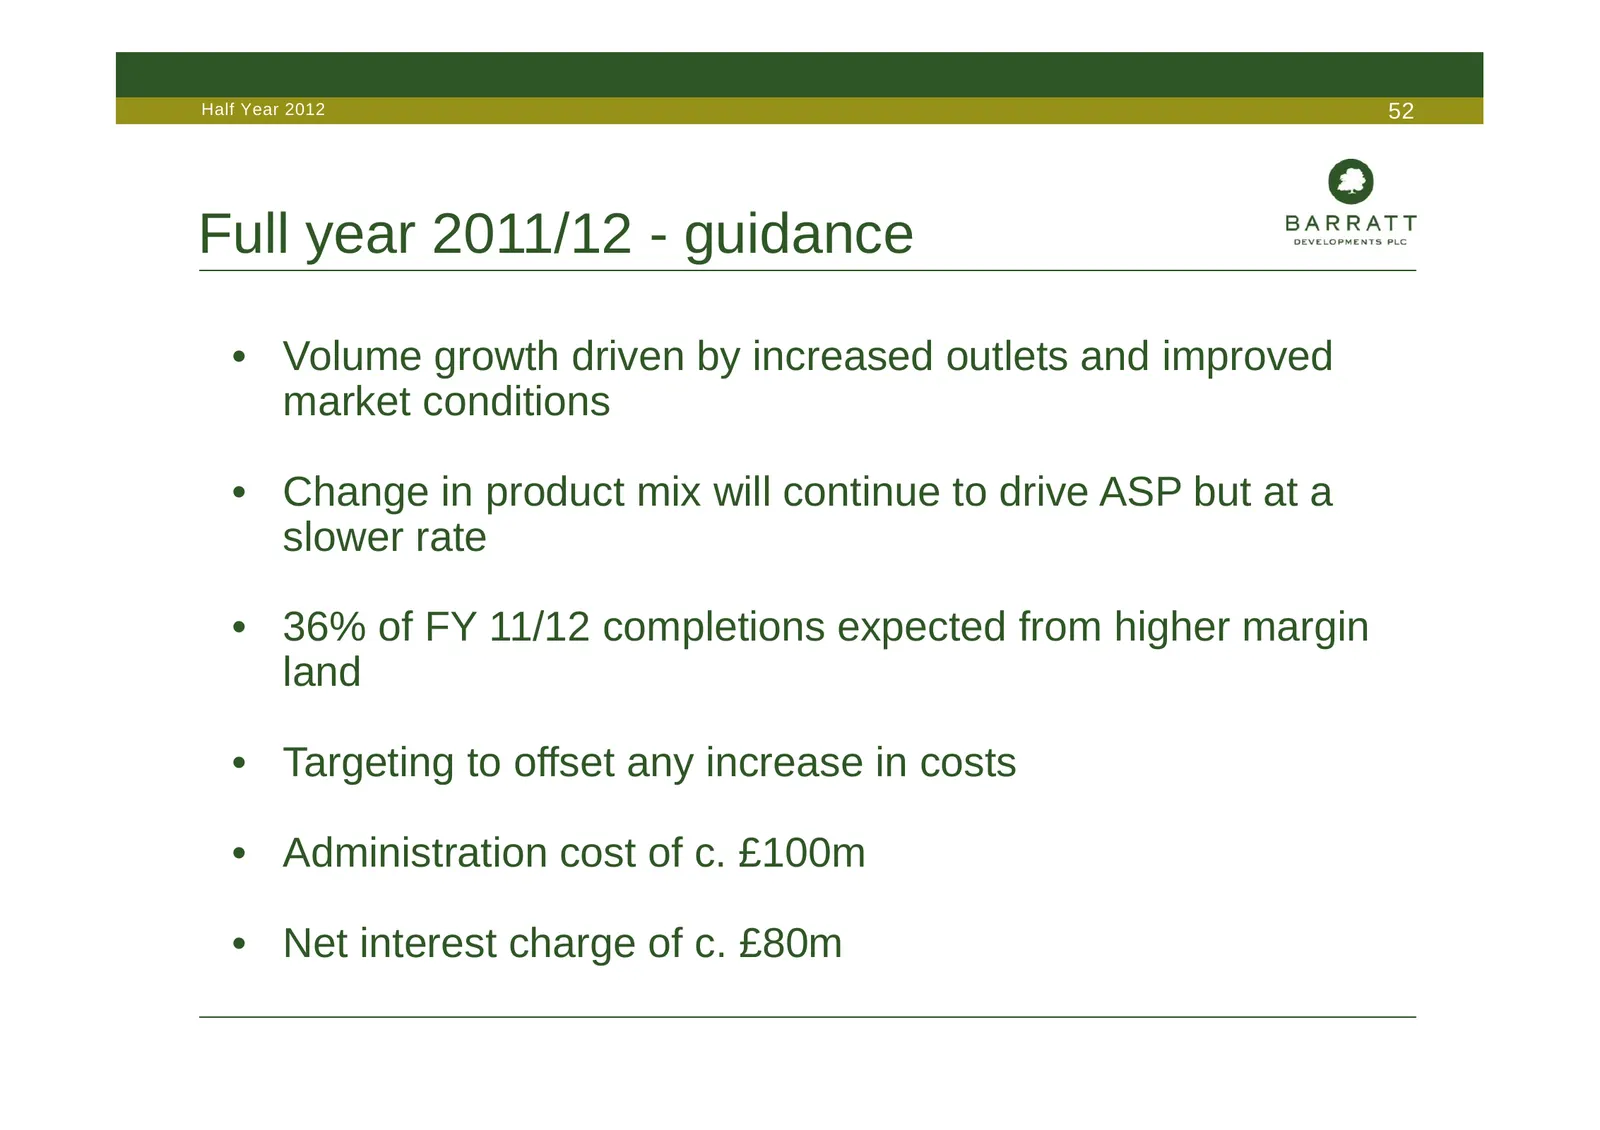
Slide 52: Full year 2011/12 - guidance
Half Year 2012 52 Full year 2011/12 - guidance • Volume growth driven by increased outlets and improved market conditions • Change in product mix will continue to drive ASP but at a slower rate • 36% of FY 11/12 completions expected from higher margin land • Targeting to offset any increase in costs
Slide 53: Q&A
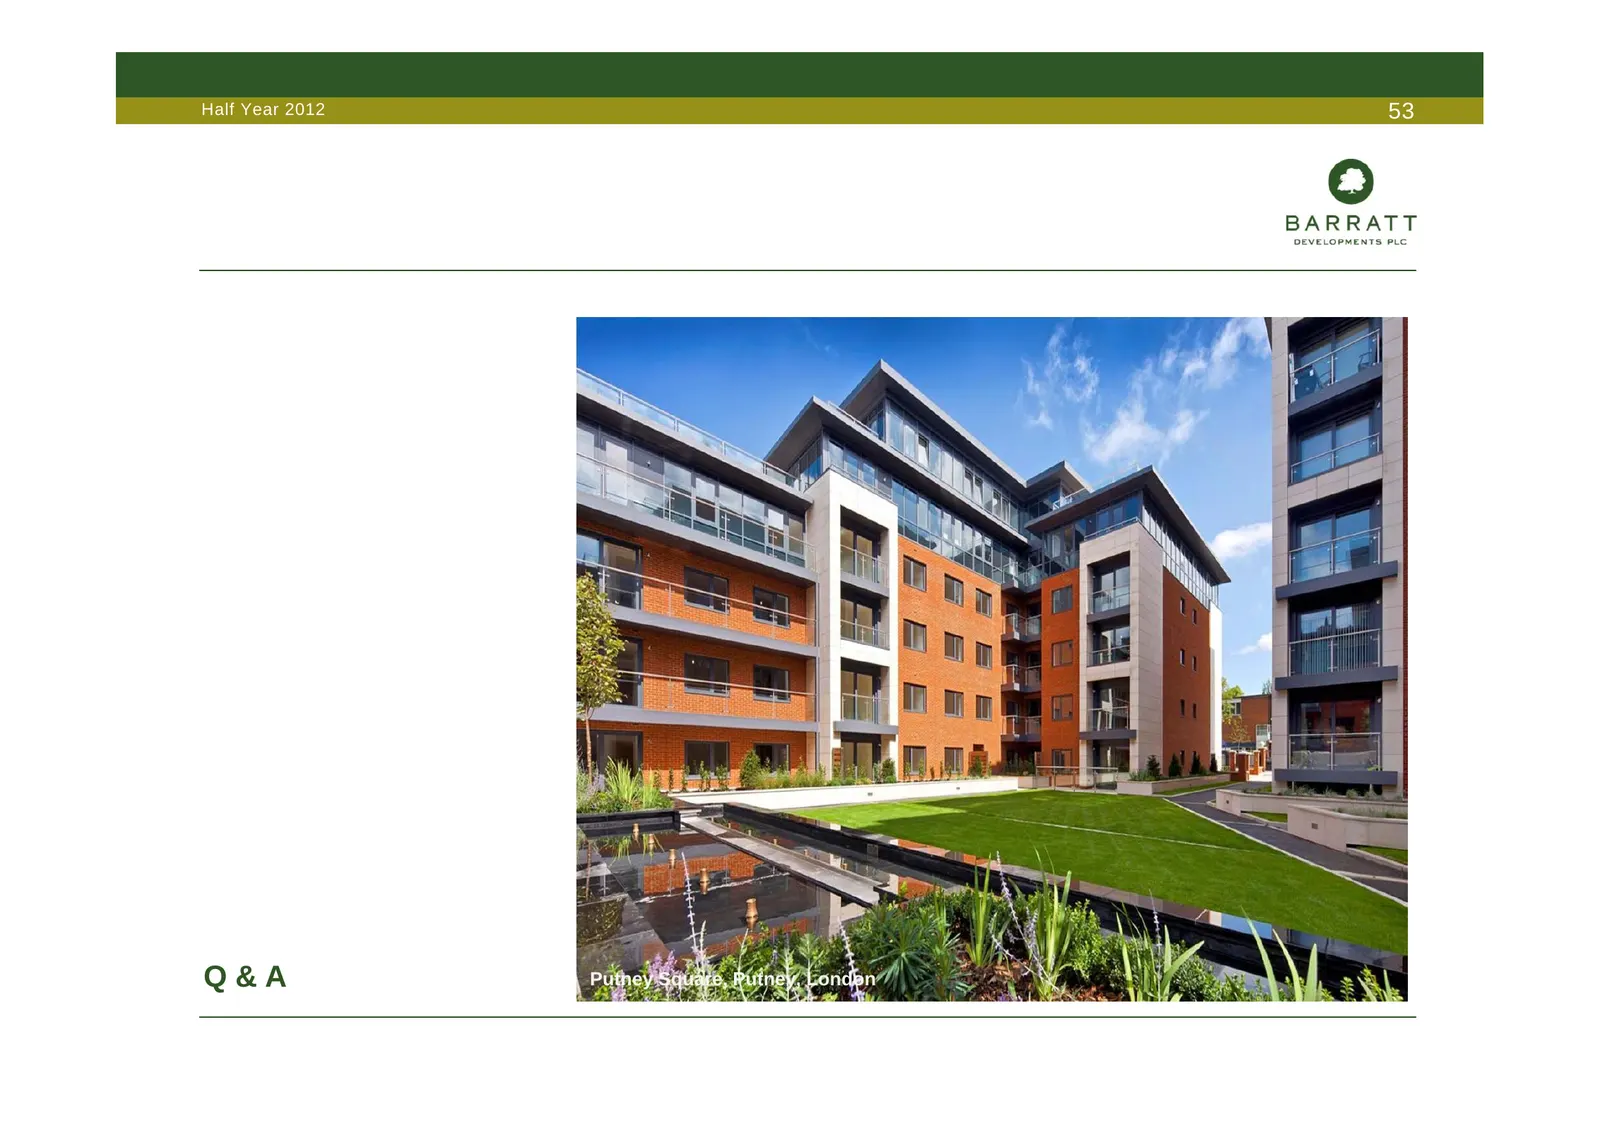
Half Year 2012 53 Q&A Putney Square, Putney, London
Slide 54: Appendices
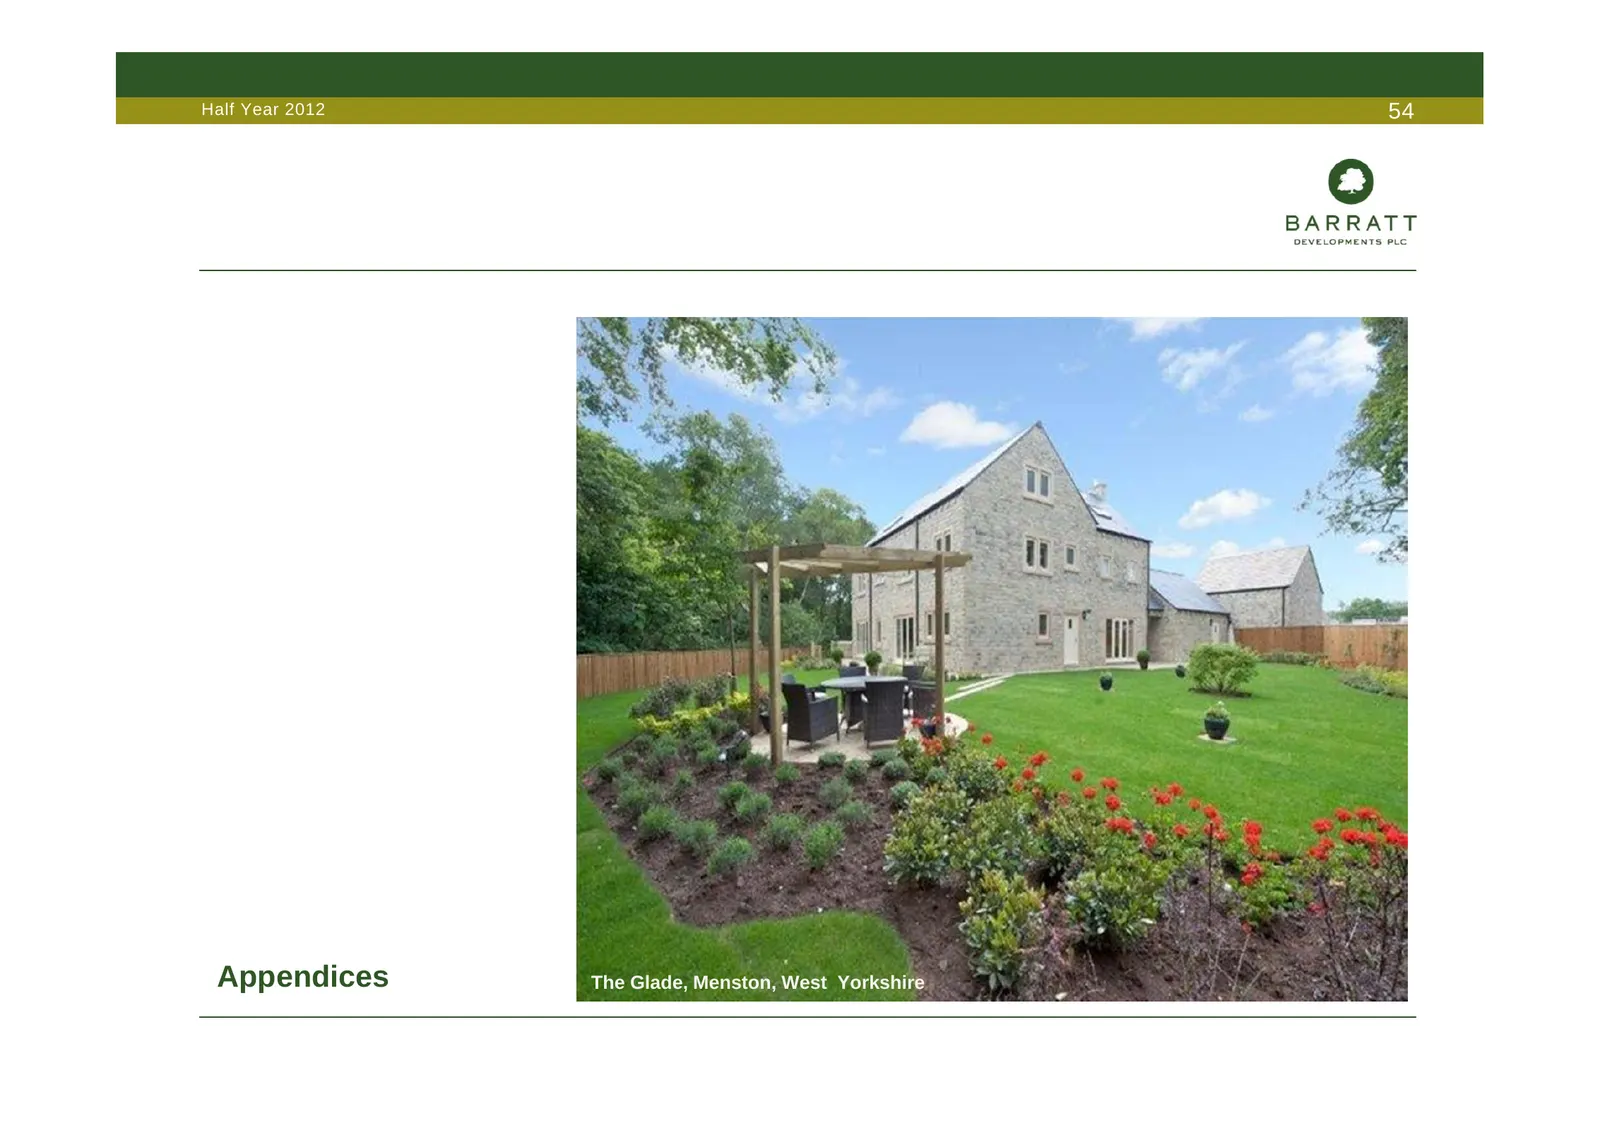
Half Year 2012 54 Appendices The Glade, Menston, West Yorkshire
Slide 55: Completions : houses v flats
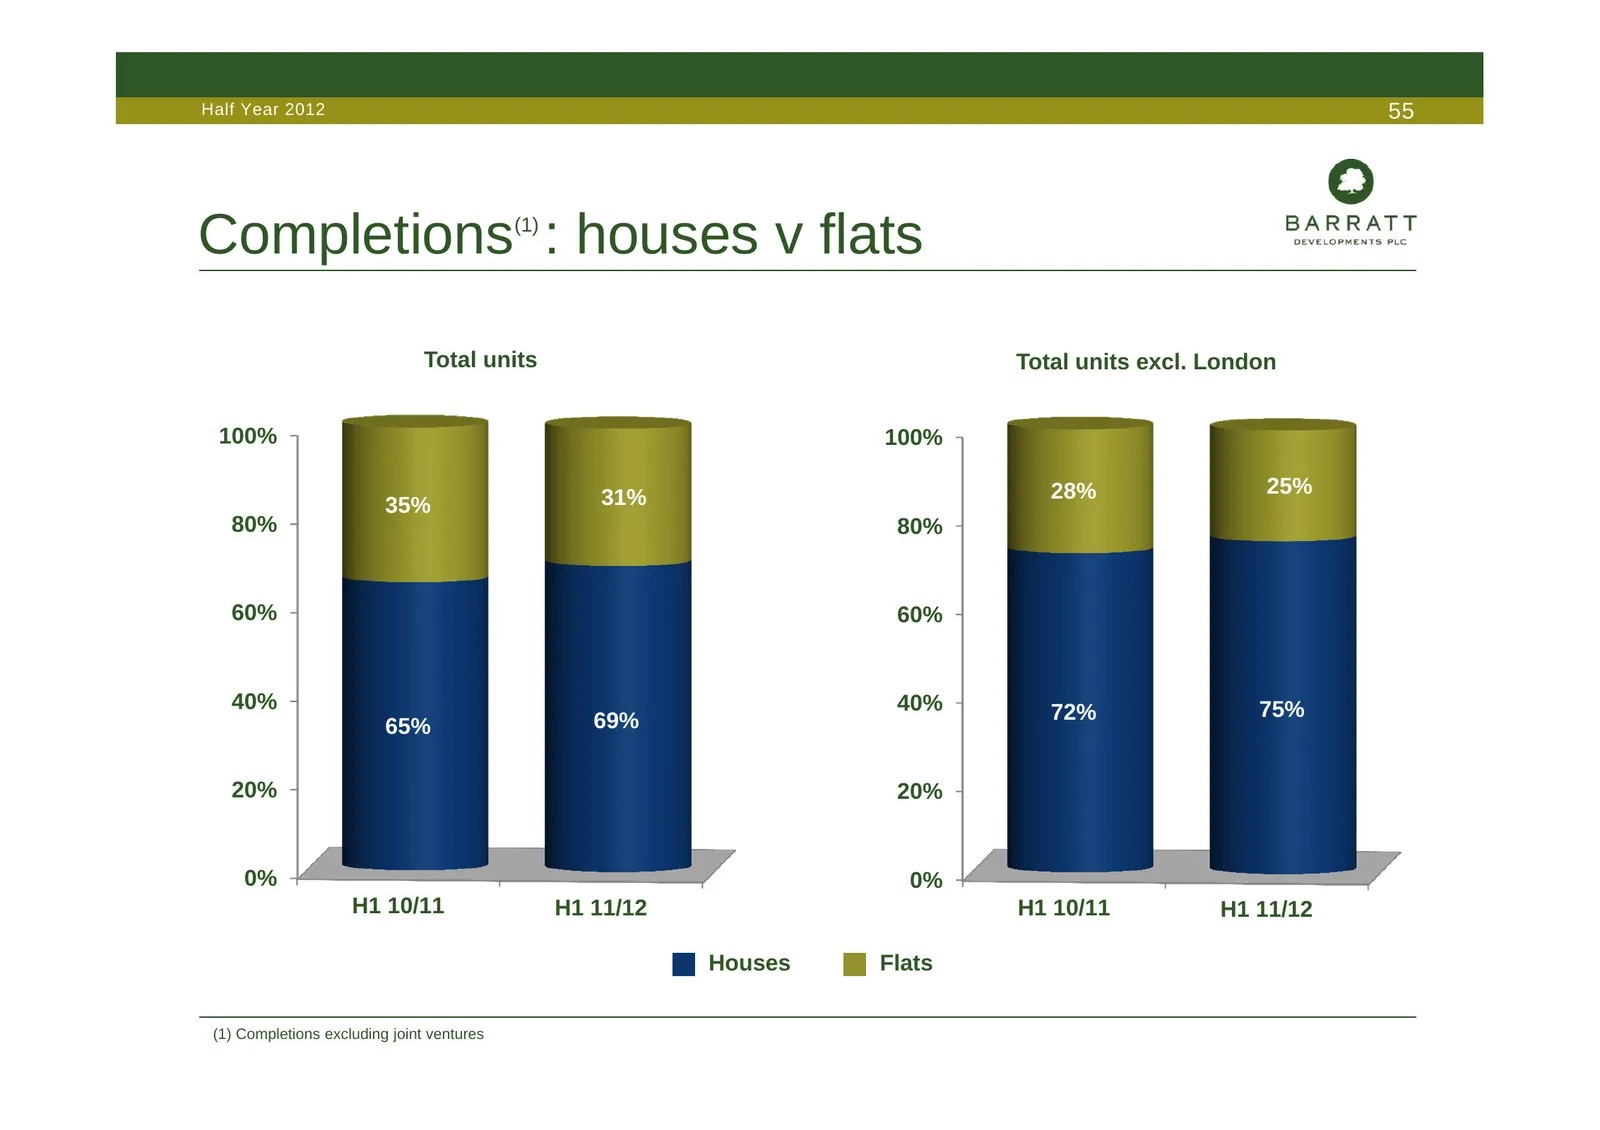
Half Year 2012 55 Completions : houses v flats (1) Total units Total units excl. London 100% 100% 28% 25% 35% 31% 80% 80% 60% 60% 40% 40% 72% 75% 65% 69% 20% 20% 0% 0% H1 10/11 H1 11/12 H1 10/11 H1 11/12 Houses Flats (1) Completions excluding joint ventures
Slide 56: Private completions – price segments
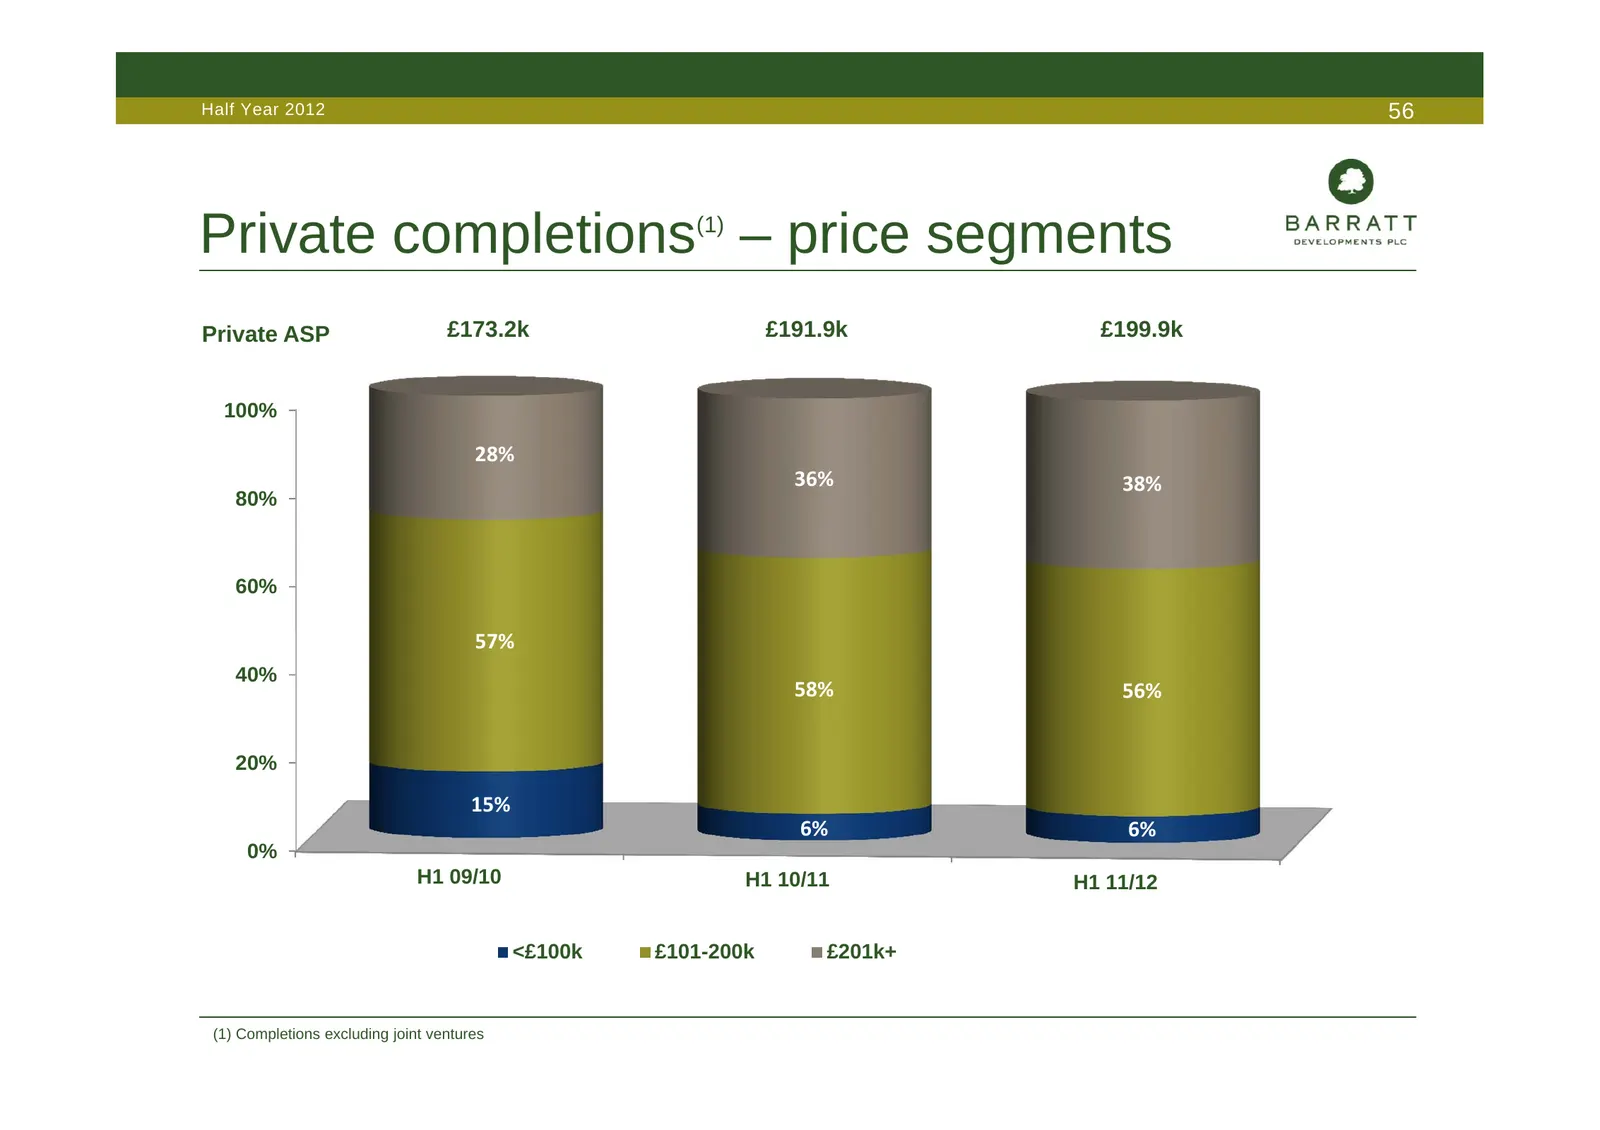
Half Year 2012 56 Private completions – price segments (1) Private ASP £173.2k £191.9k £199.9k 100% 28% 36% 38% 80% 60% 57% 40% 58% 56% 20% 15% 6% 6% 0% H1 09/10 H1 10/11 H1 11/12 <£100k £101-200k £201k+ (1) Completions excluding joint ventures
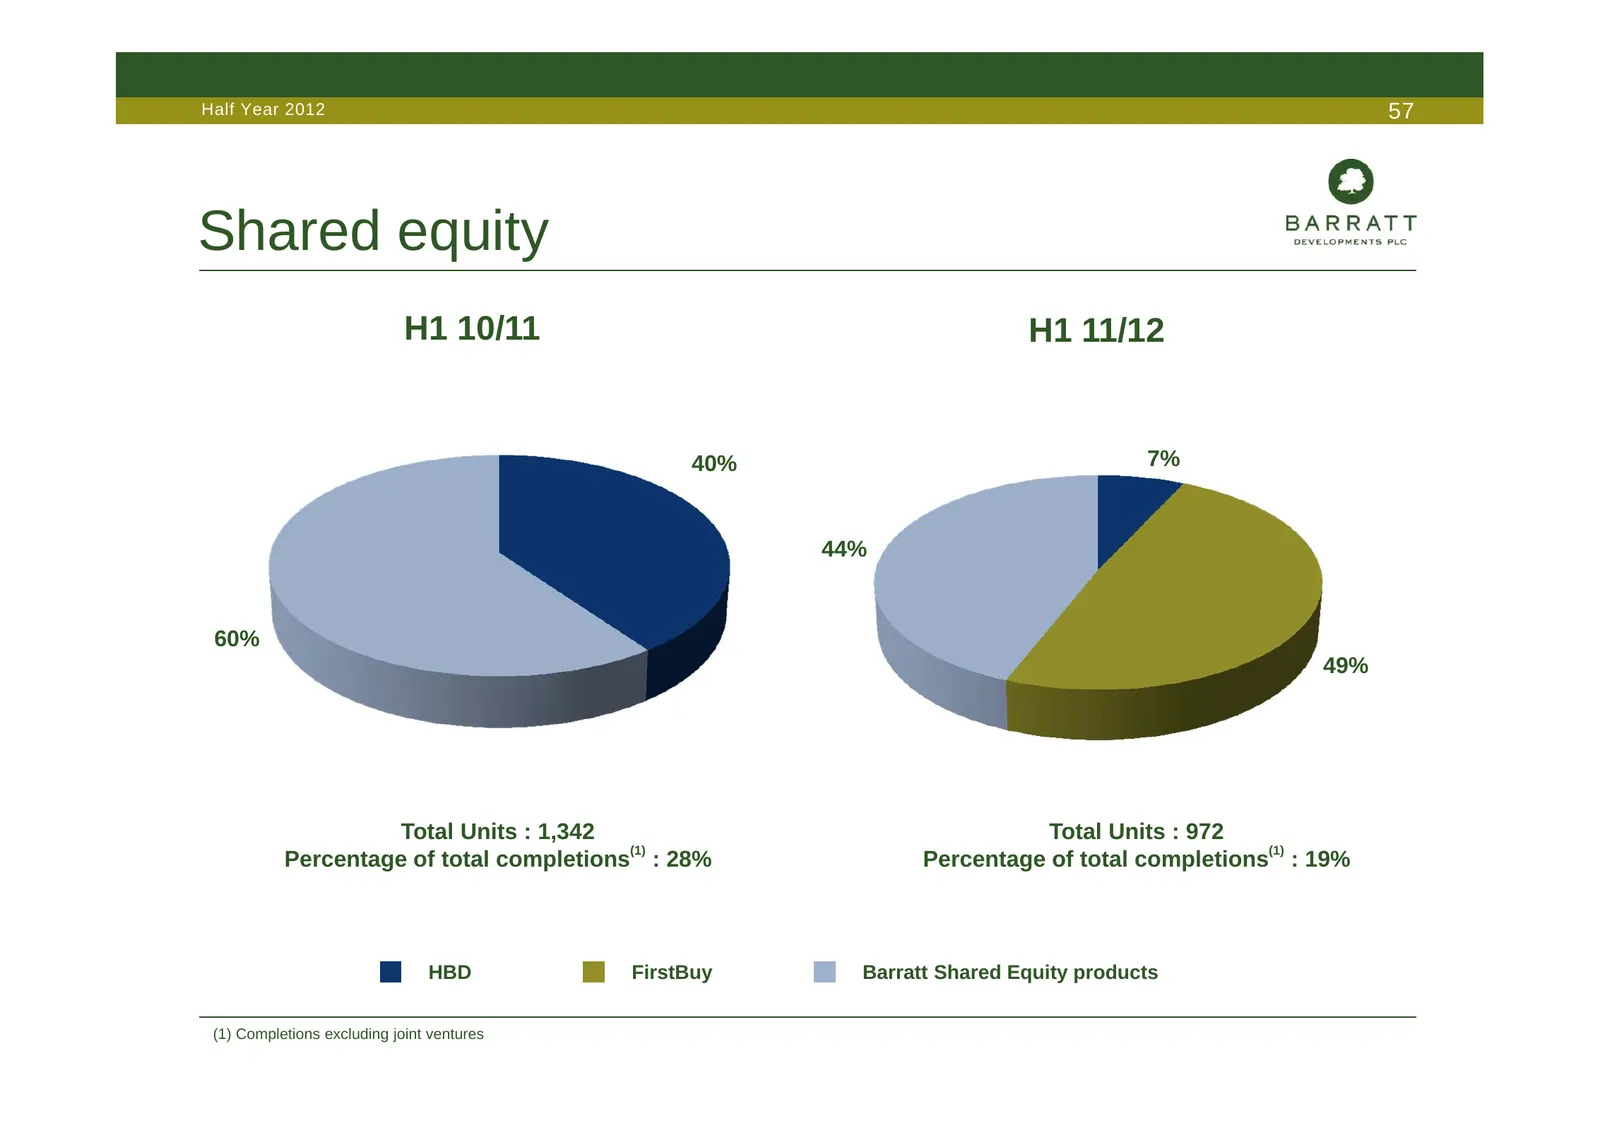
Slide 57: Shared equity
Half Year 2012 57 Shared equity H1 10/11 H1 11/12 40% 7% 44% 60% 49% Total Units : 1,342 Total Units : 972 Percentage of total completions(1) : 28% Percentage of total completions(1) : 19% HBD FirstBuy Barratt Shared Equity products (1) Completions excluding joint ventures
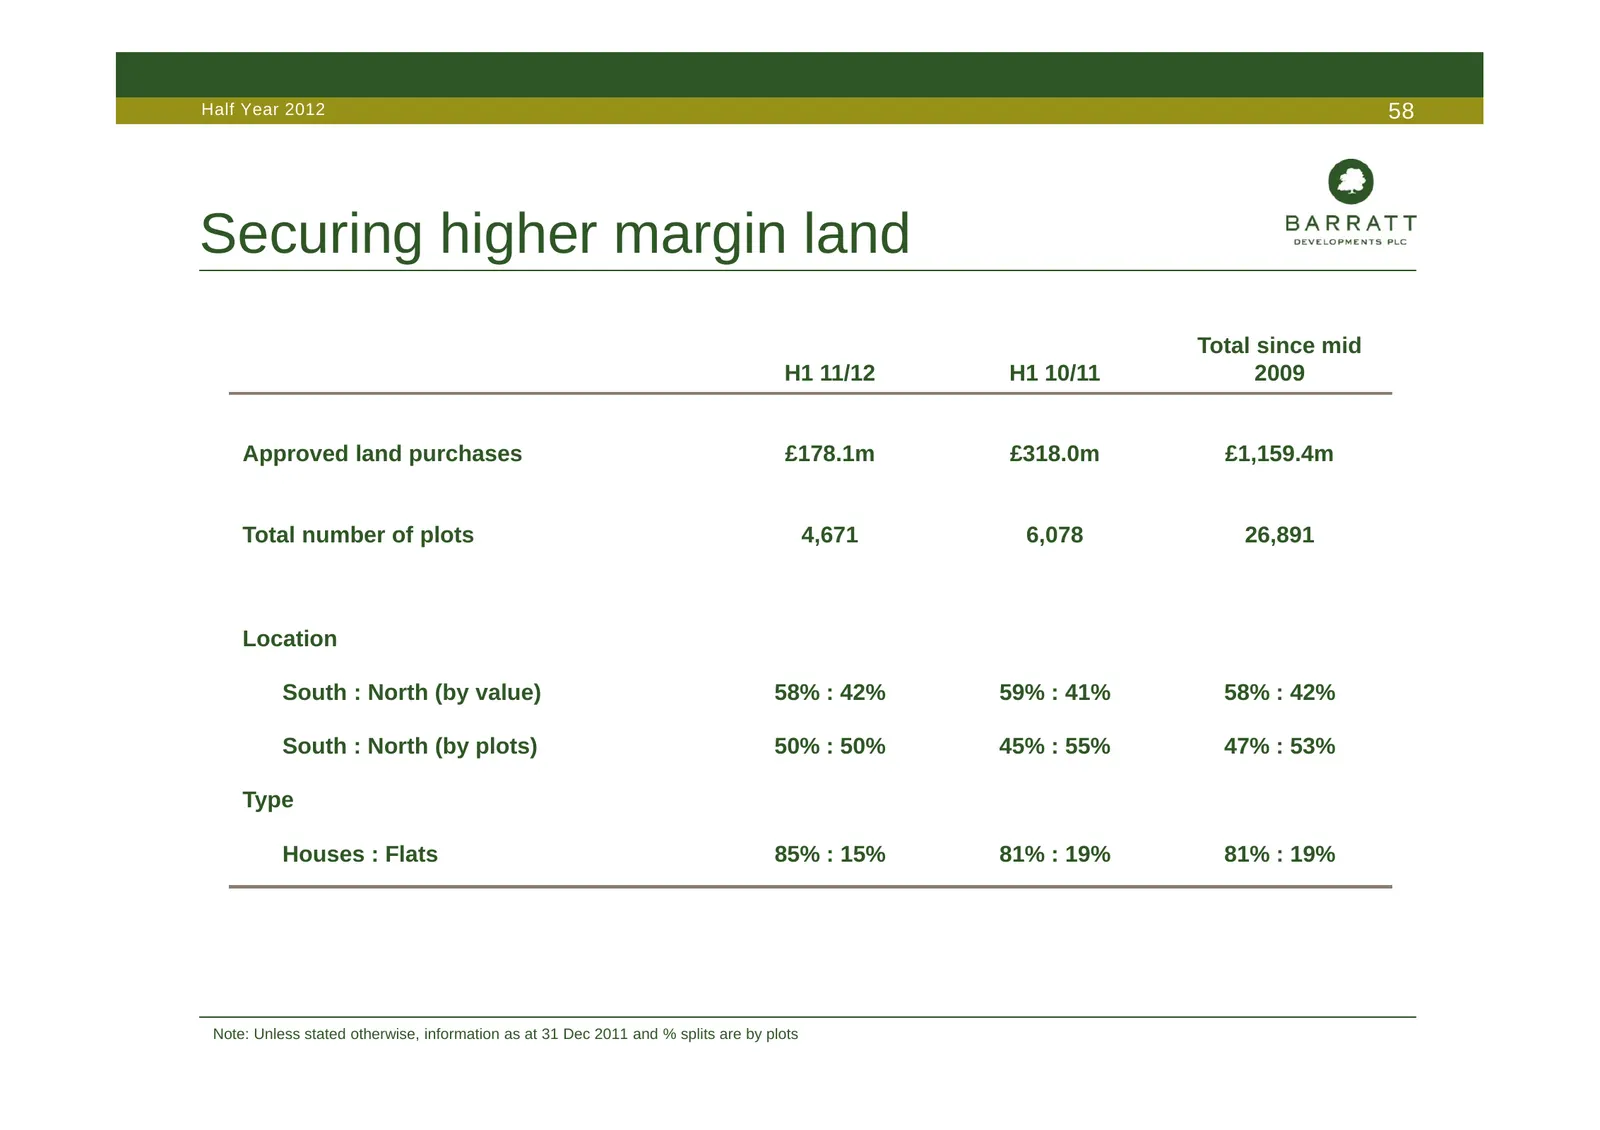
Slide 58: Securing higher margin land
Half Year 2012 58 Securing higher margin land Total since mid H1 11/12 H1 10/11 2009 Approved land purchases £178.1m £318.0m £1,159.4m Total number of plots 4,671 6,078 26,891 Location South : North (by value) 58% : 42% 59% : 41% 58% : 42% South : North (by plots) 50% : 50% 45% : 55% 47% : 53% Type
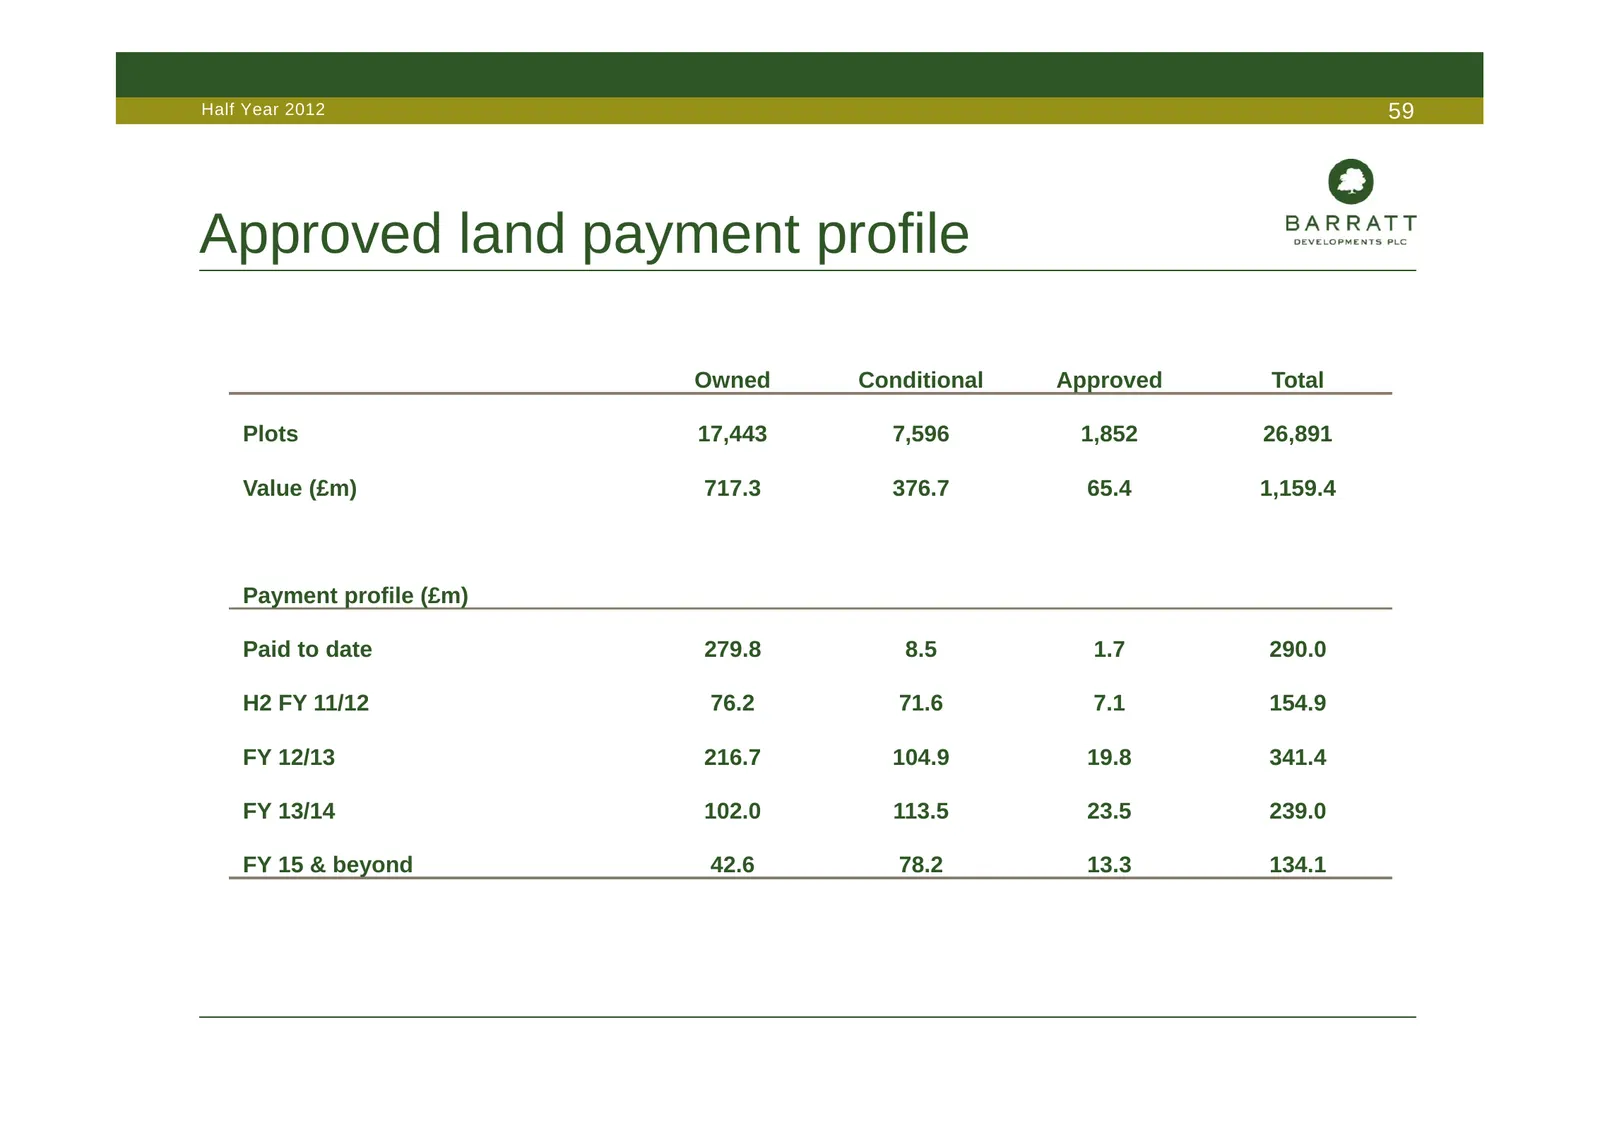
Slide 59: Approved land payment profile
Half Year 2012 59 Approved land payment profile Owned Conditional Approved Total Plots 17,443 7,596 1,852 26,891 Value (£m) 717.3 376.7 65.4 1,159.4 Payment profile (£m) Paid to date 279.8 8.5 1.7 290.0 H2 FY 11/12 76.2 71.6 7.1 154.9 FY 12/13 216.7 104.9 19.8 341.4 FY 13/14 102.0 113.5 23.5 239.0 F
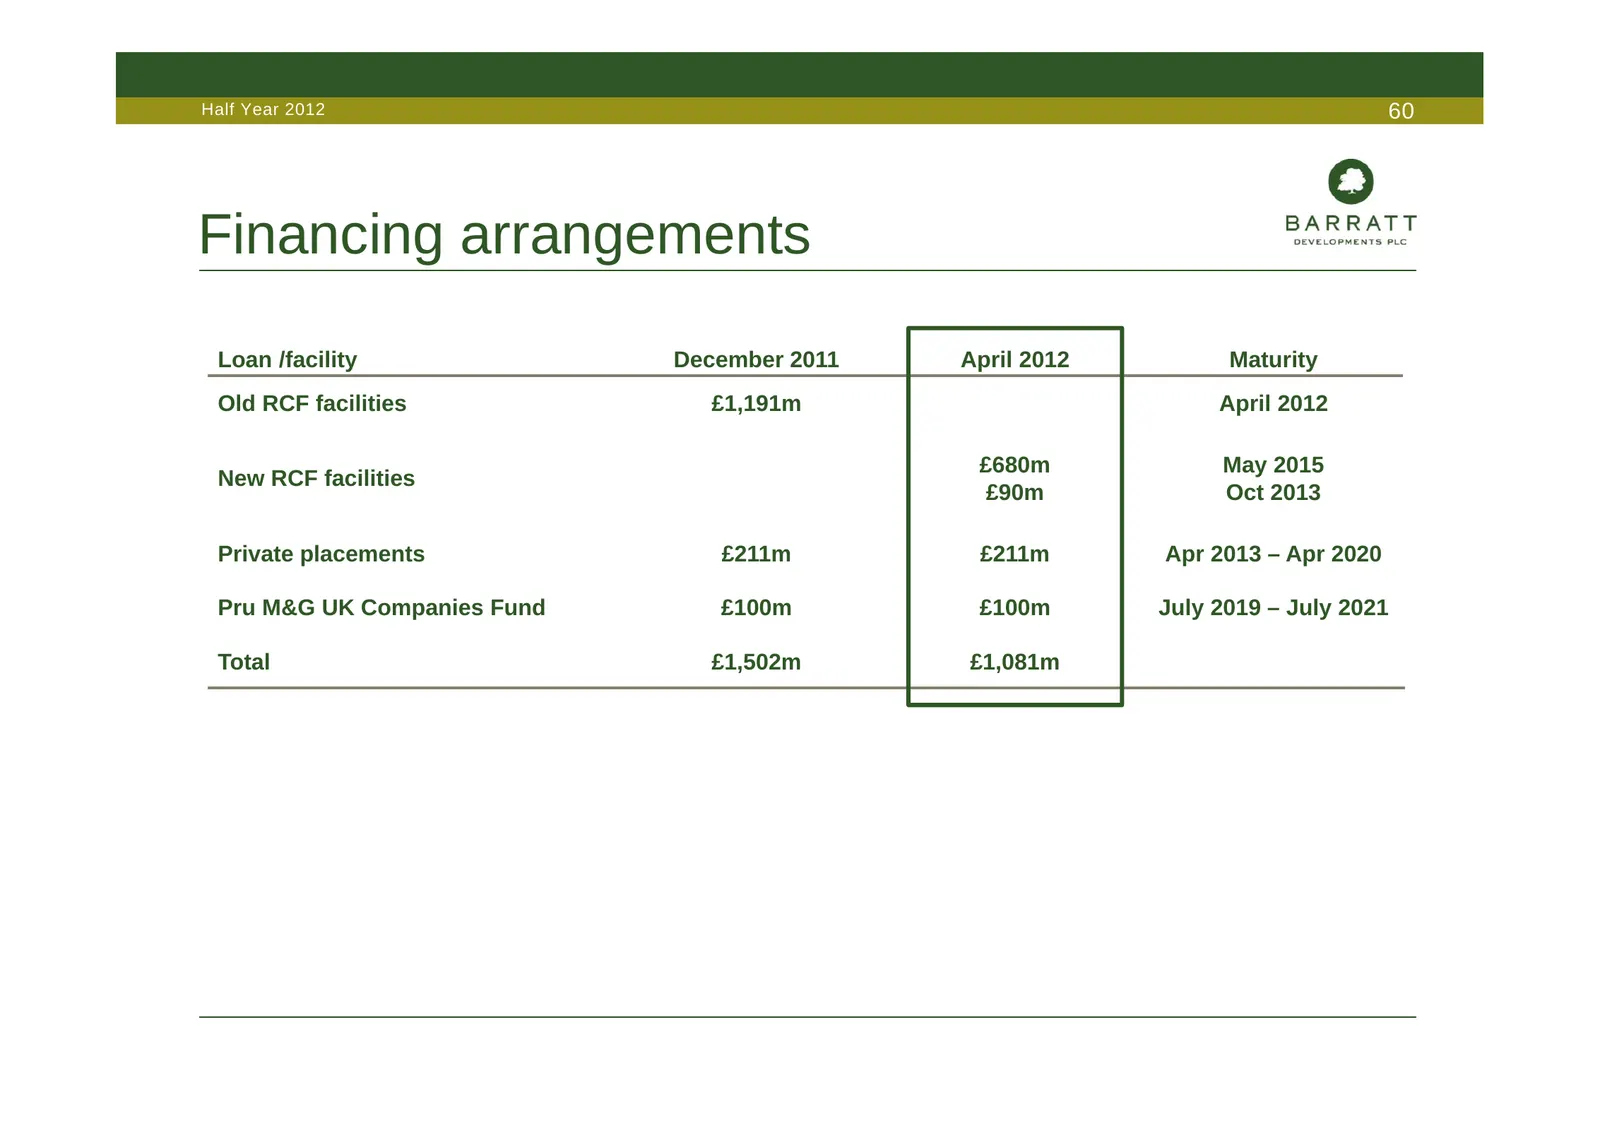
Slide 60: Financing arrangements
Half Year 2012 60 Financing arrangements Loan /facility December 2011 April 2012 Maturity Old RCF facilities £1,191m April 2012 £680m May 2015 New RCF facilities £90m Oct 2013 Private placements £211m £211m Apr 2013 – Apr 2020 Pru M&G UK Companies Fund £100m £100m July 2019 – July 2021 Total £1,502m
Slide 61: Disclaimer
Half Year 2012 61 Disclaimer This document has been prepared by Barratt Developments PLC (the “Company”) solely for use at a presentation in connection with the Company's Interim Results Announcement in respect of the half year ended 31 Dec 2011. For the purposes of this notice, the presentation (th
Source: Internet Archive copy of barrattdevelopments.co.uk
More decks from Barratt Redrow plc
 FY2026 Earnings Presentation59 slides · Sep 16, 2026
 HY26 Earnings Presentation59 slides · Feb 11, 2026
 FY2025 Earnings Presentation60 slides · Sep 17, 2025
 Corporate Update (May 2025)30 slides · May 1, 2025
 Investor Day (February 2025)40 slides · Feb 12, 2025
 HY25 Earnings Presentation51 slides · Feb 12, 2025