ITT Inc. · NYSE:ITT
ITT — ITT Industries — Q3 2005 Earnings Presentation
12 slides from ITT's earnings presentation, Oct 27, 2005
Slide 1: Third Quarter 2005 Investor Review
Third Quarter 2005 Investor Review October 27, 2005
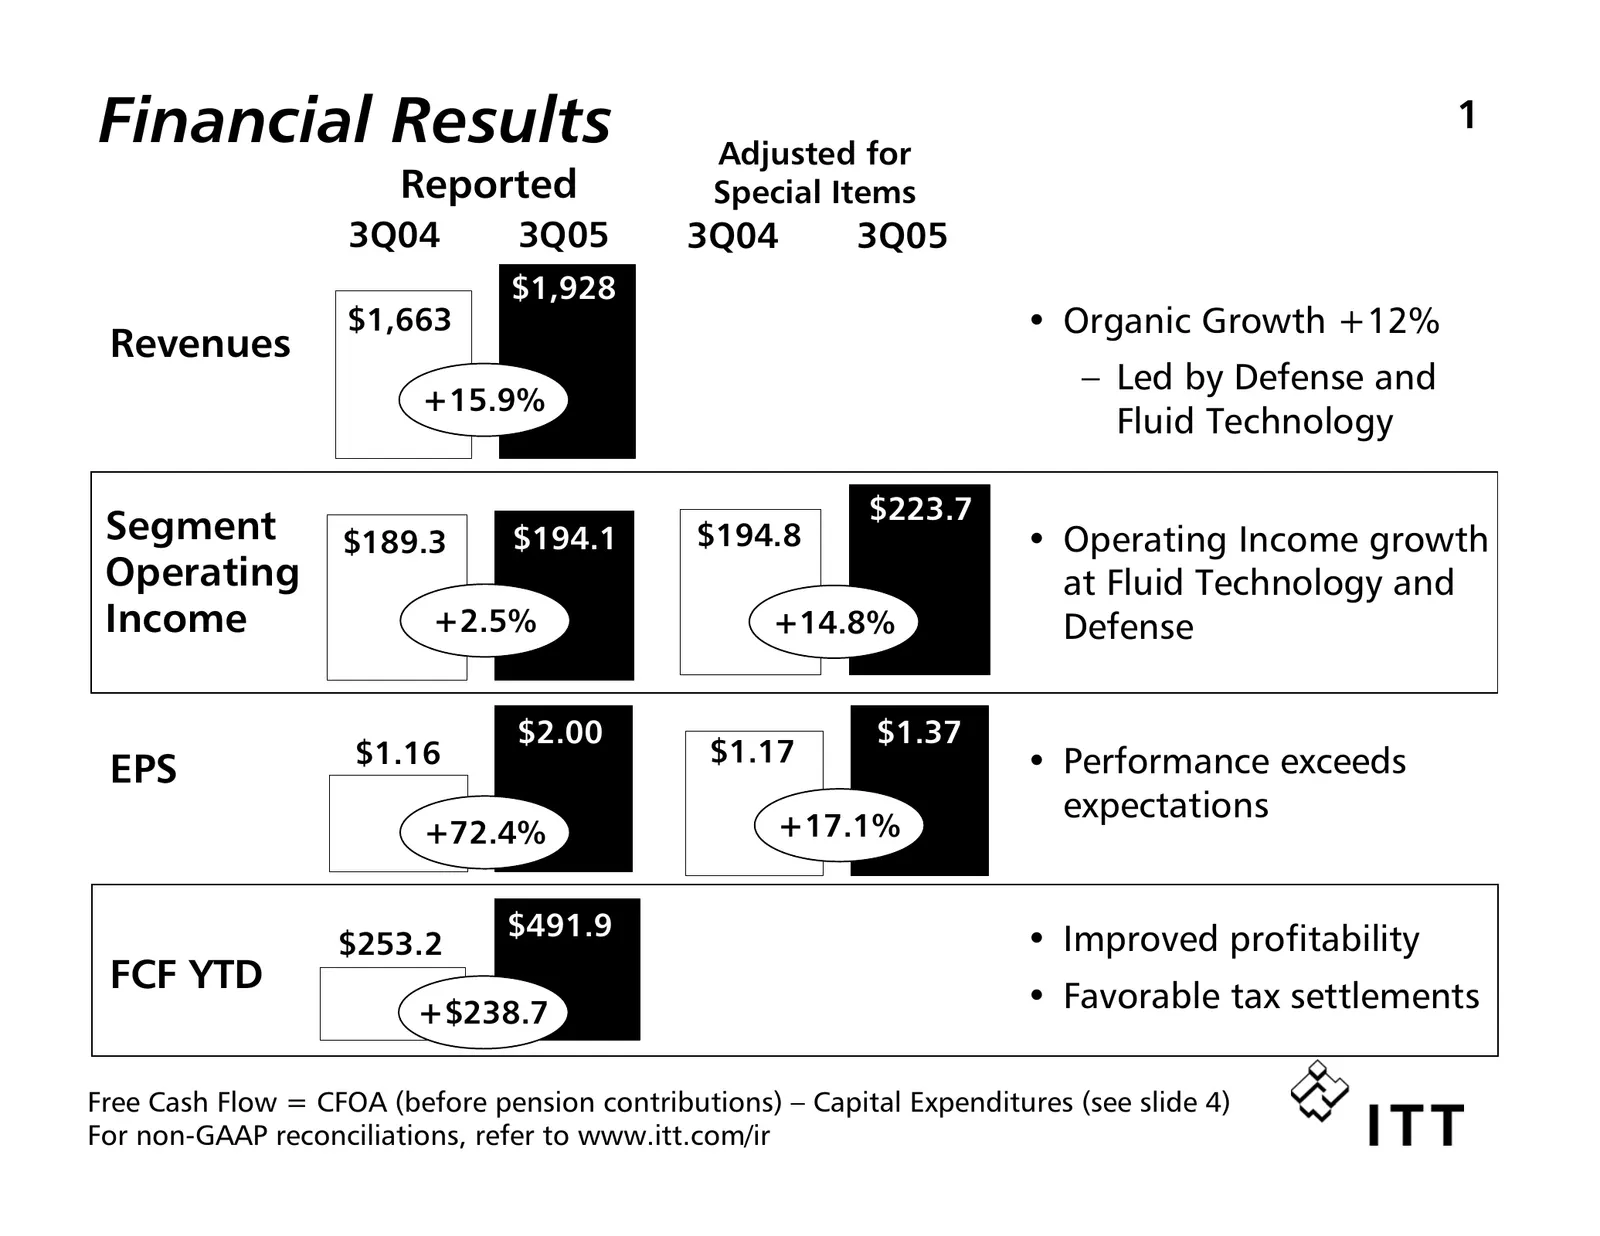
Slide 2: Financial Results Adjusted for Reported Special Items
Financial Results Adjusted for 1 Reported Special Items 3Q04 3Q05 3Q04 3Q05 $1,928 $1,663 • Organic Growth +12% Revenues – Led by Defense and +15.9% Fluid Technology $223.7 Segment $189.3 $194.1 $194.8 • Operating Income growth Operating at Fluid Technology and Income +2.5% +14.8% Defense $2.00 $1.3
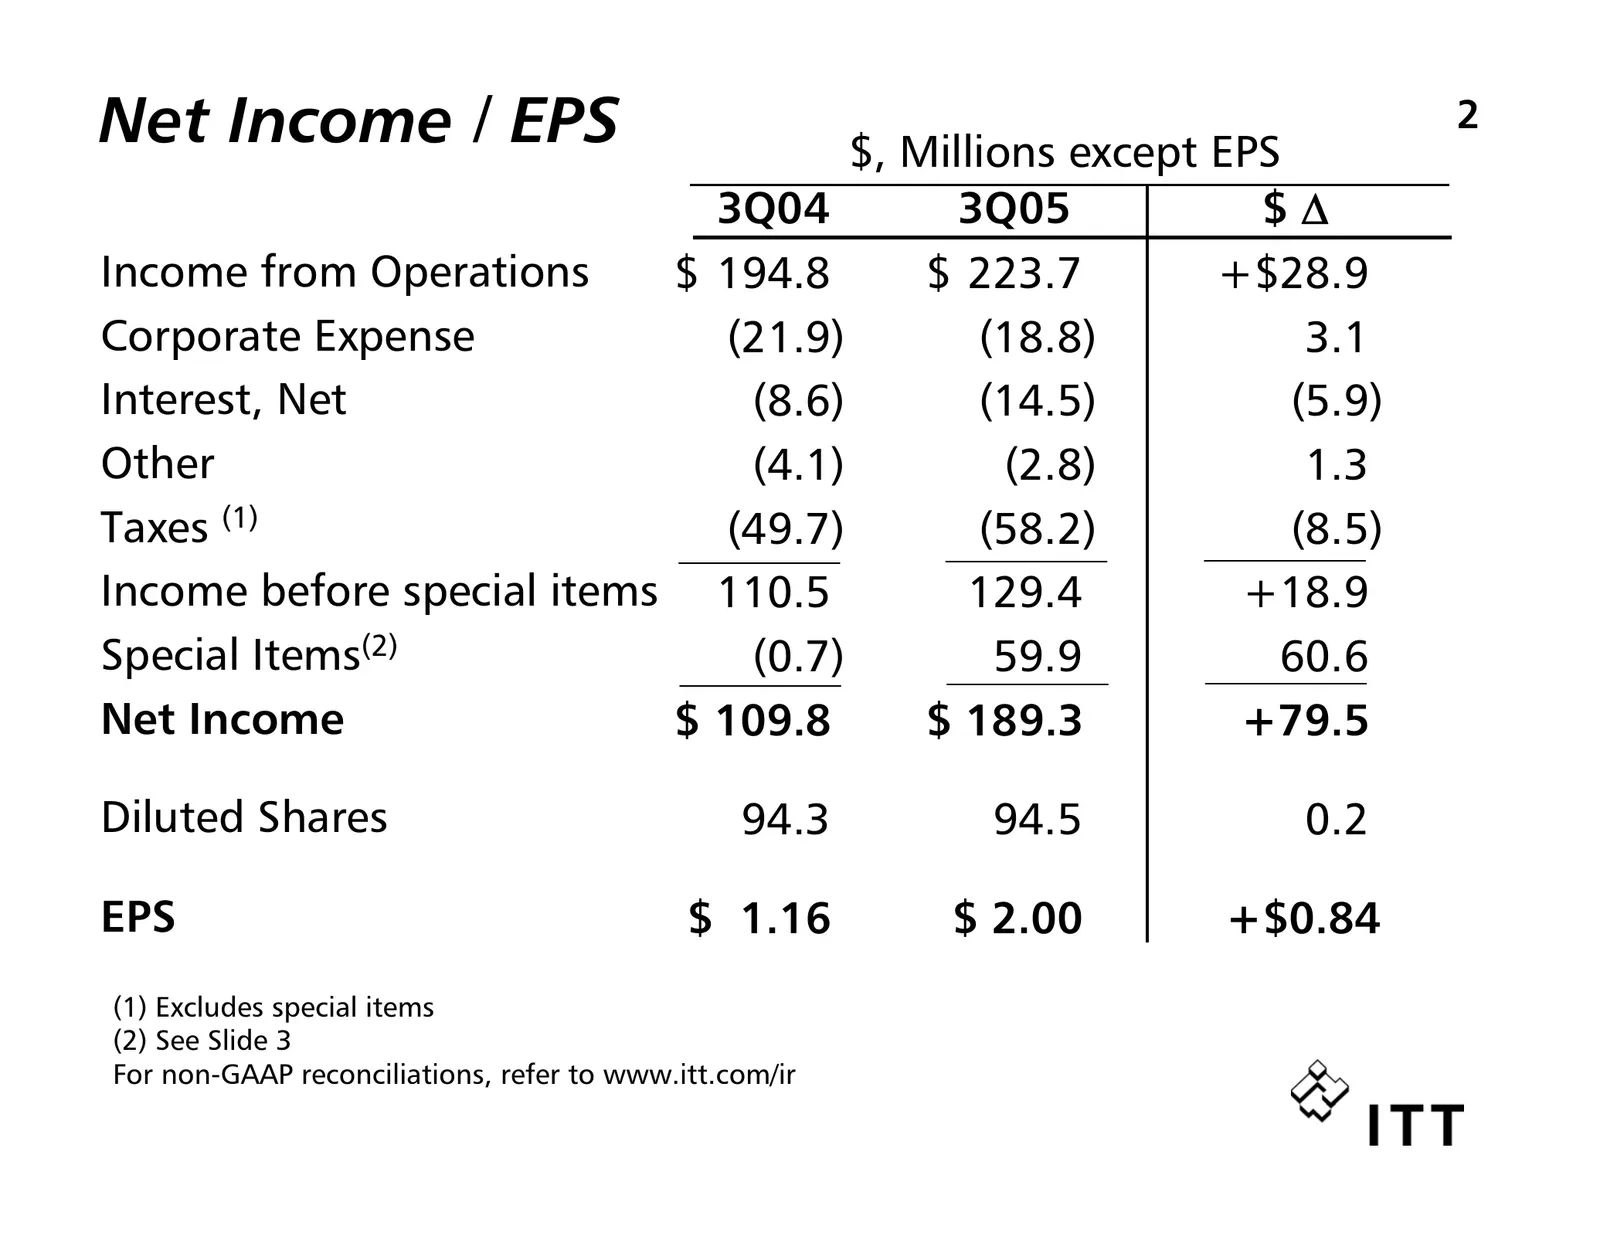
Slide 3: Net Income / EPS
Net Income / EPS $, Millions except EPS 2 3Q04 3Q05 $∆ Income from Operations $ 194.8 $ 223.7 +$28.9 Corporate Expense (21.9) (18.8) 3.1 Interest, Net (8.6) (14.5) (5.9) Other (4.1) (2.8) 1.3 Taxes (1) (49.7) (58.2) (8.5) Income before special items 110.5 129.4 +18.9 Special Items(2) (0.7) 59.9 60.6
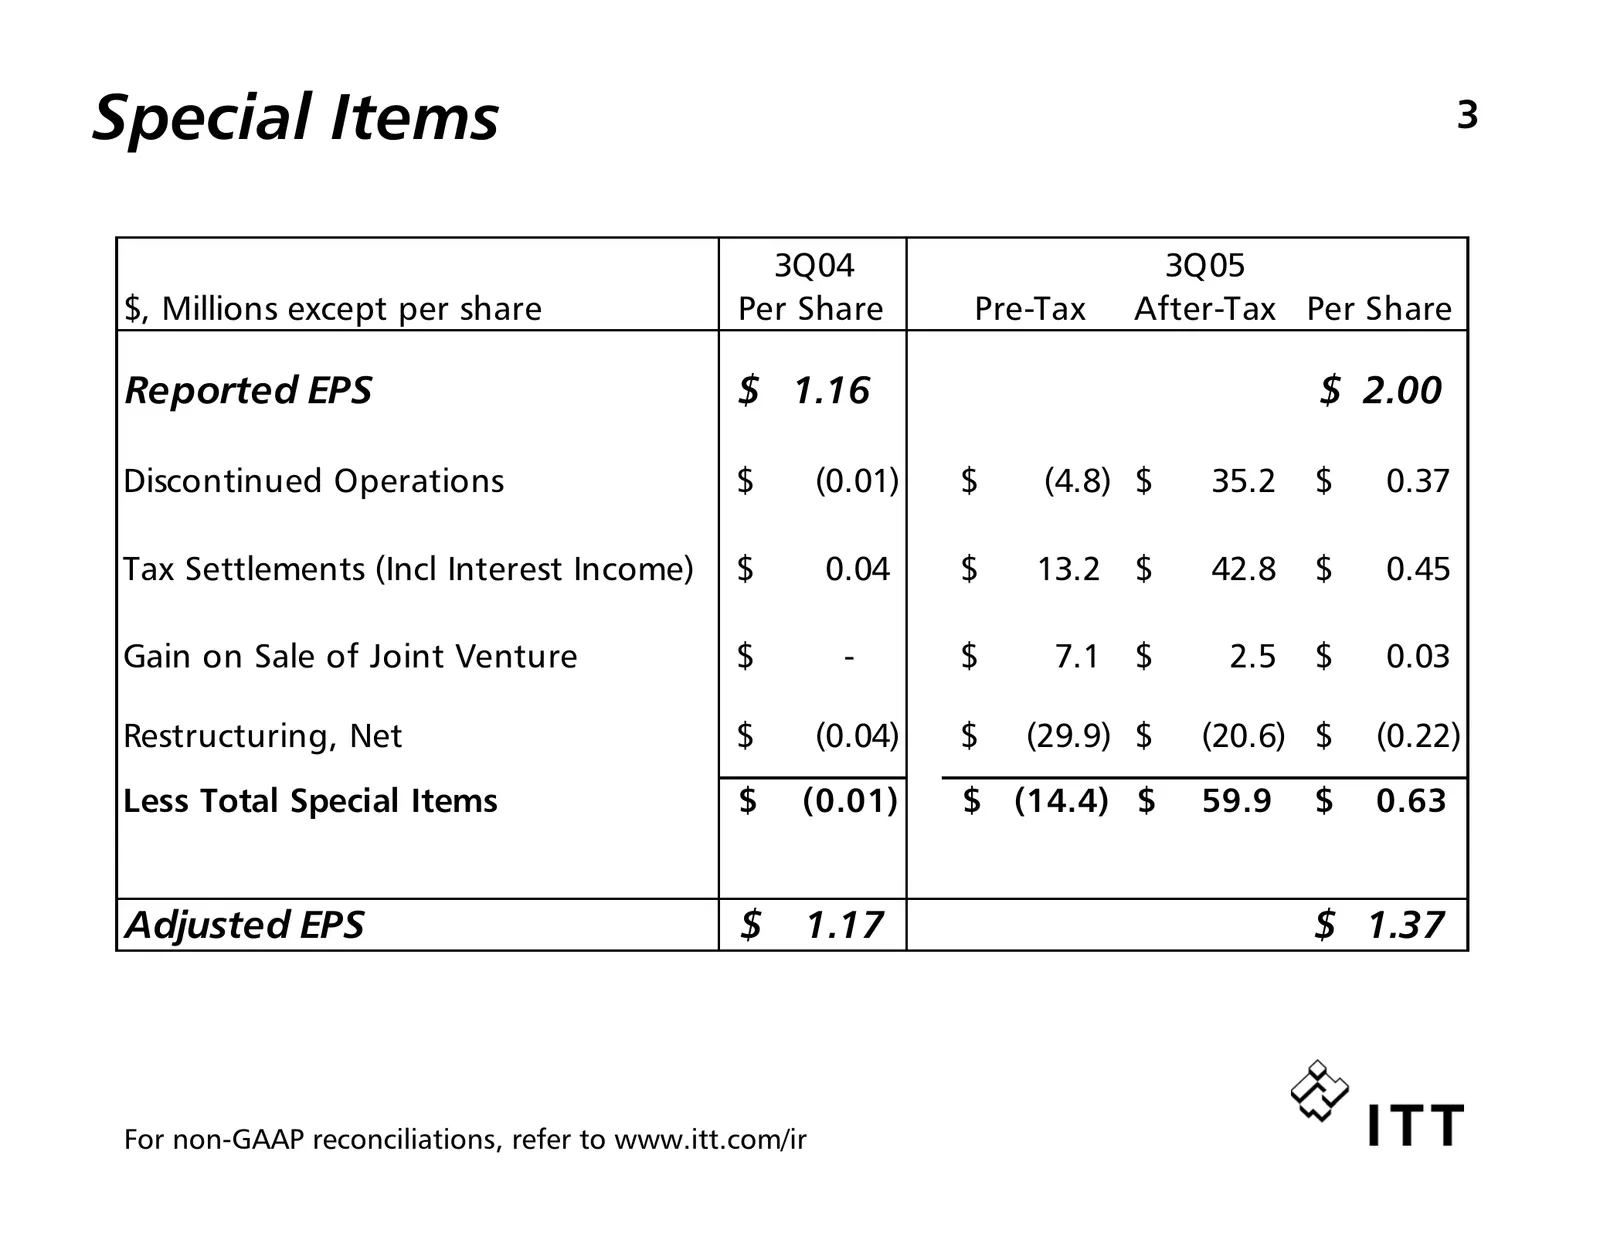
Slide 4: Special Items
Special Items 3 3Q04 3Q05 $, Millions except per share Per Share Pre-Tax After-Tax Per Share Reported EPS $ 1.16 $ 2.00 Discontinued Operations $ (0.01) $ (4.8) $ 35.2 $ 0.37 Tax Settlements (Incl Interest Income) $ 0.04 $ 13.2 $ 42.8 $ 0.45 Gain on Sale of Joint Venture $ - $ 7.1 $ 2.5 $ 0.03 Restr
Slide 5: Cash from Operations
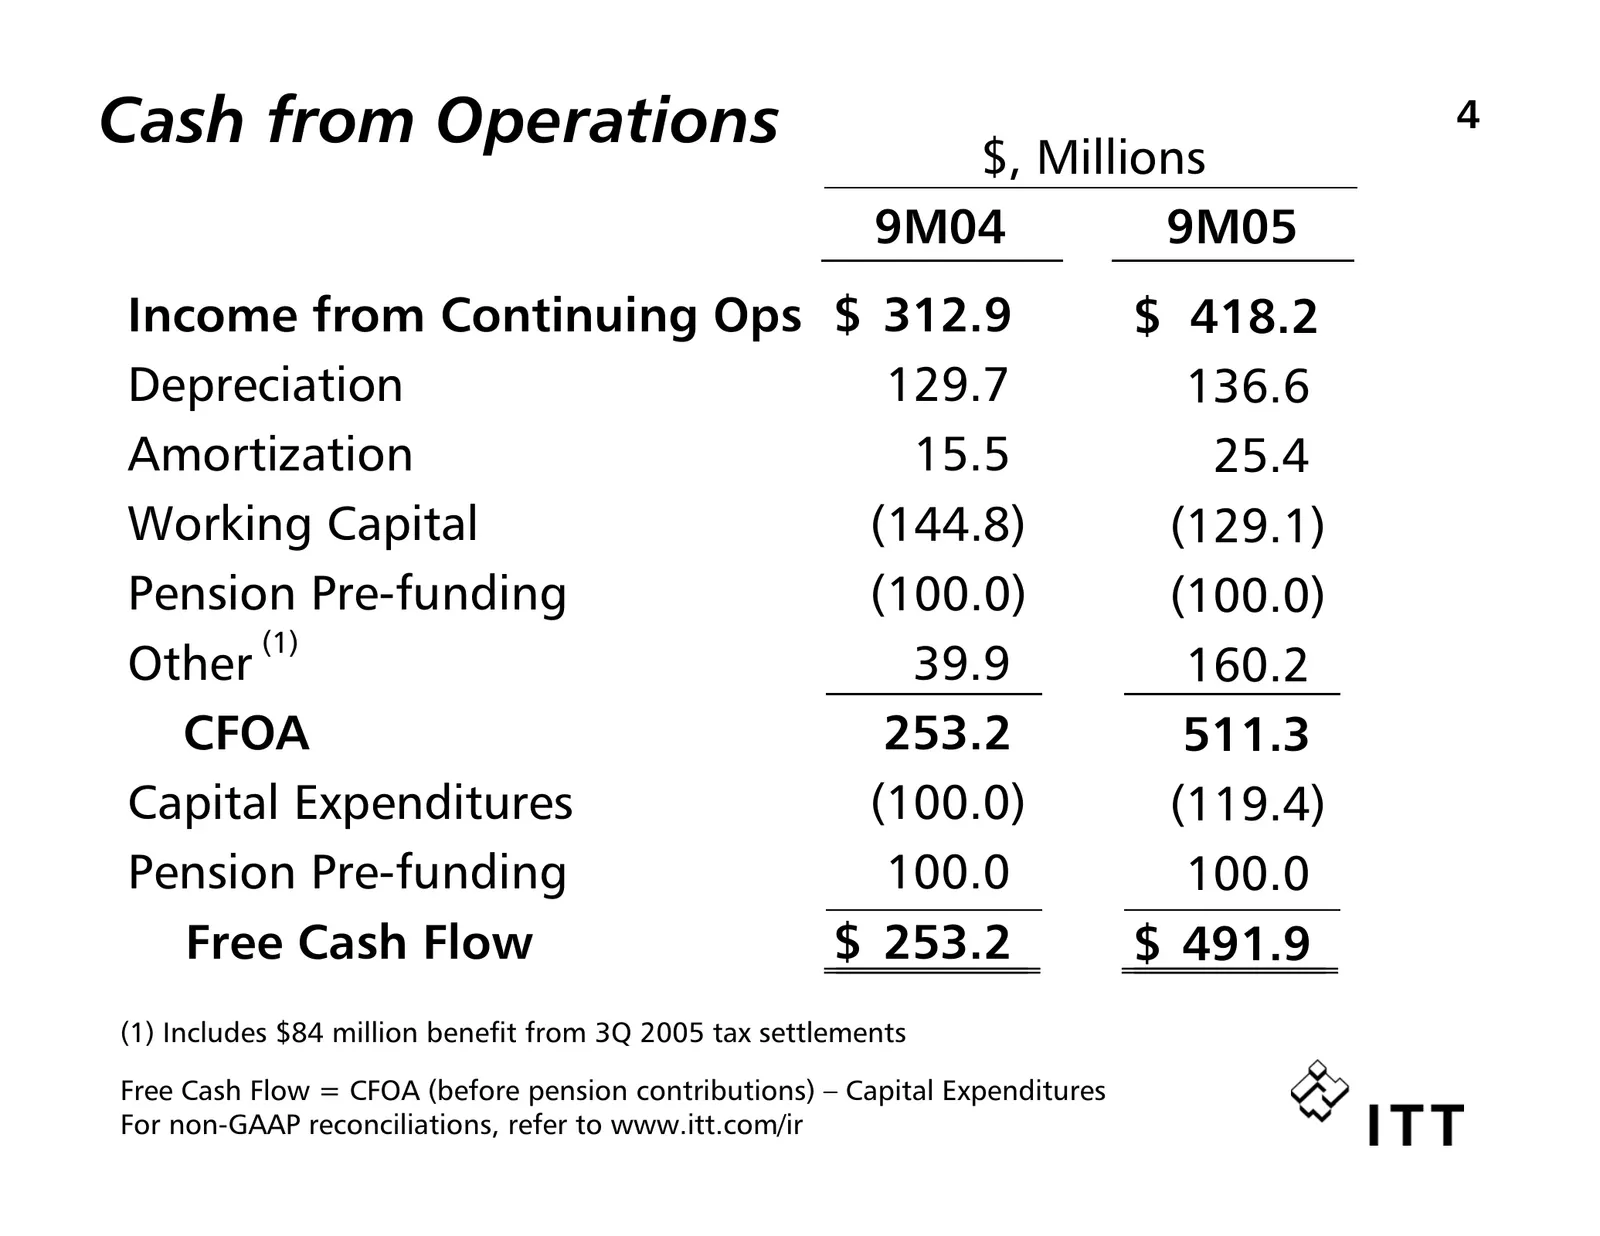
Cash from Operations $, Millions 4 9M04 9M05 Income from Continuing Ops $ 312.9 $ 418.2 Depreciation 129.7 136.6 Amortization 15.5 25.4 Working Capital (144.8) (129.1) Pension Pre-funding (100.0) (100.0) (1) Other 39.9 160.2 CFOA 253.2 511.3 Capital Expenditures (100.0) (119.4) Pension Pre-funding 1
Slide 6: Balance Sheet
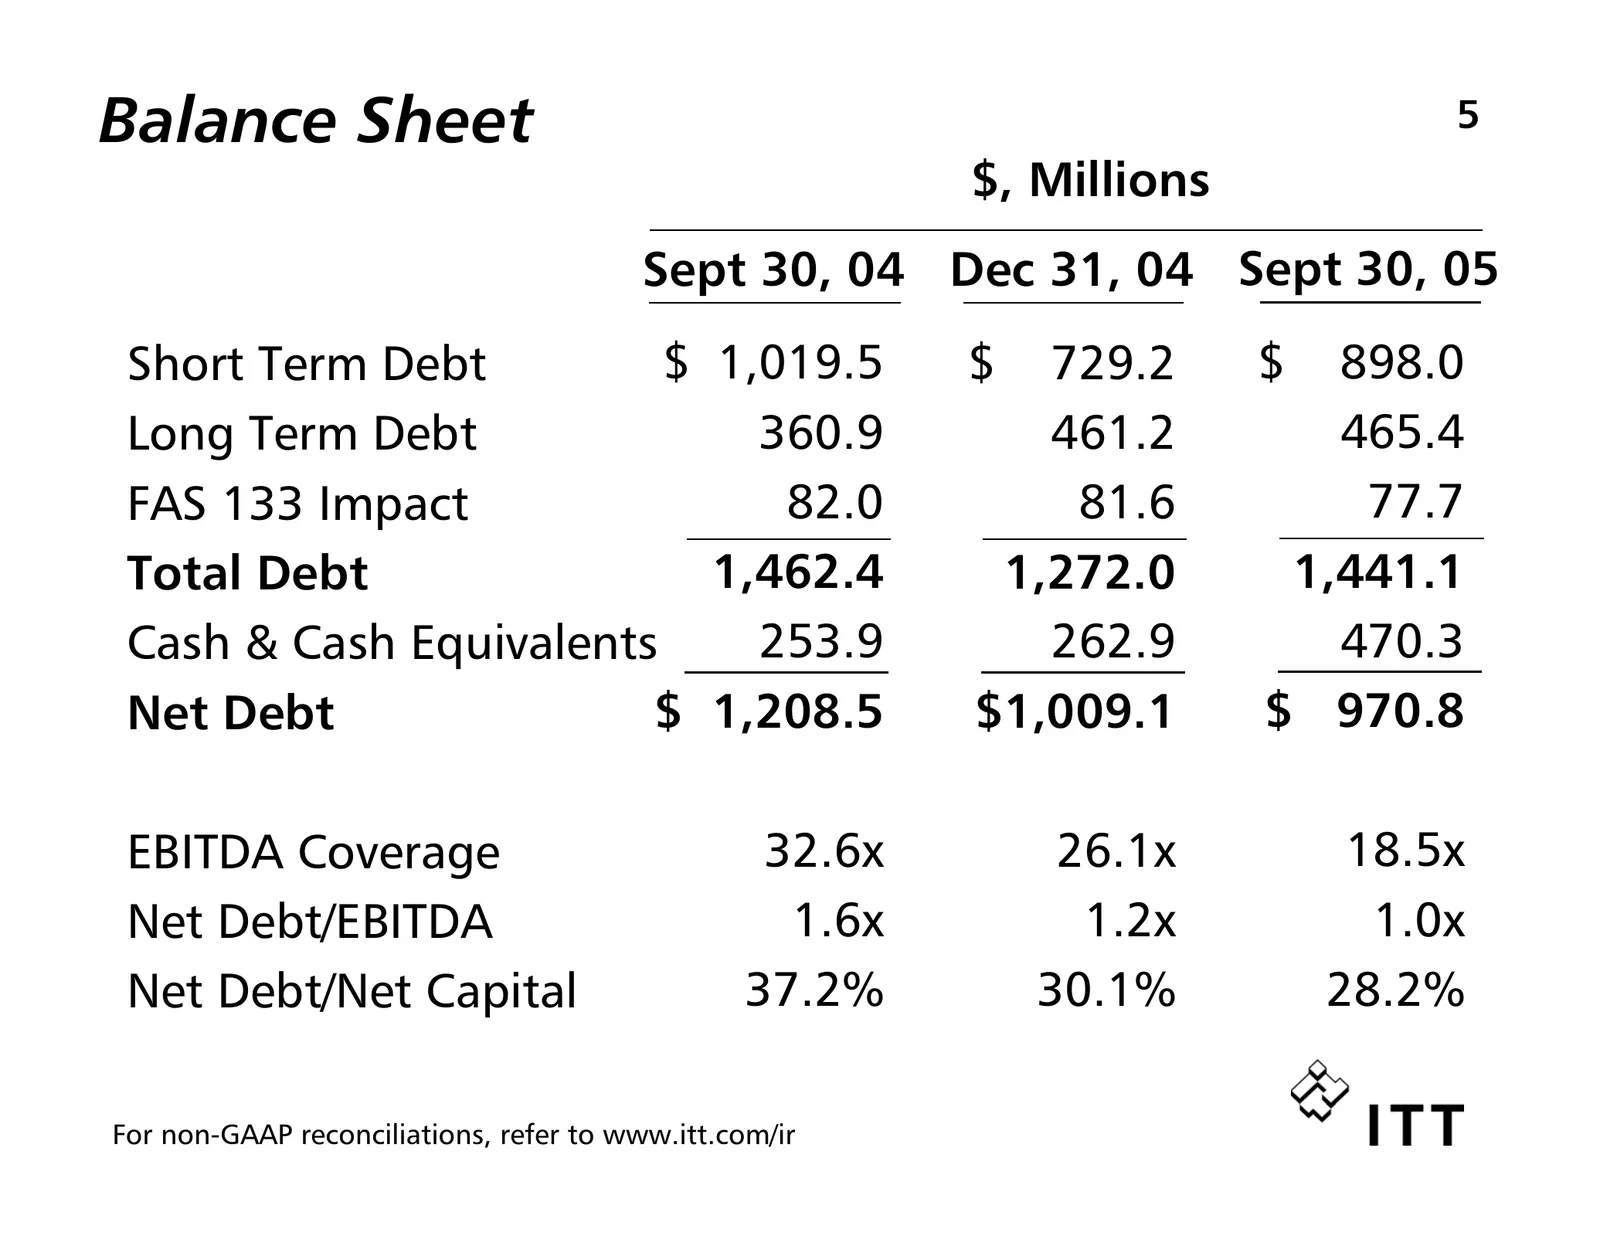
Balance Sheet 5 $, Millions Sept 30, 04 Dec 31, 04 Sept 30, 05 Short Term Debt $ 1,019.5 $ 729.2 $ 898.0 Long Term Debt 360.9 461.2 465.4 FAS 133 Impact 82.0 81.6 77.7 Total Debt 1,462.4 1,272.0 1,441.1 Cash & Cash Equivalents 253.9 262.9 470.3 Net Debt $ 1,208.5 $1,009.1 $ 970.8 EBITDA Coverage 32.
Slide 7: Fluid Technology
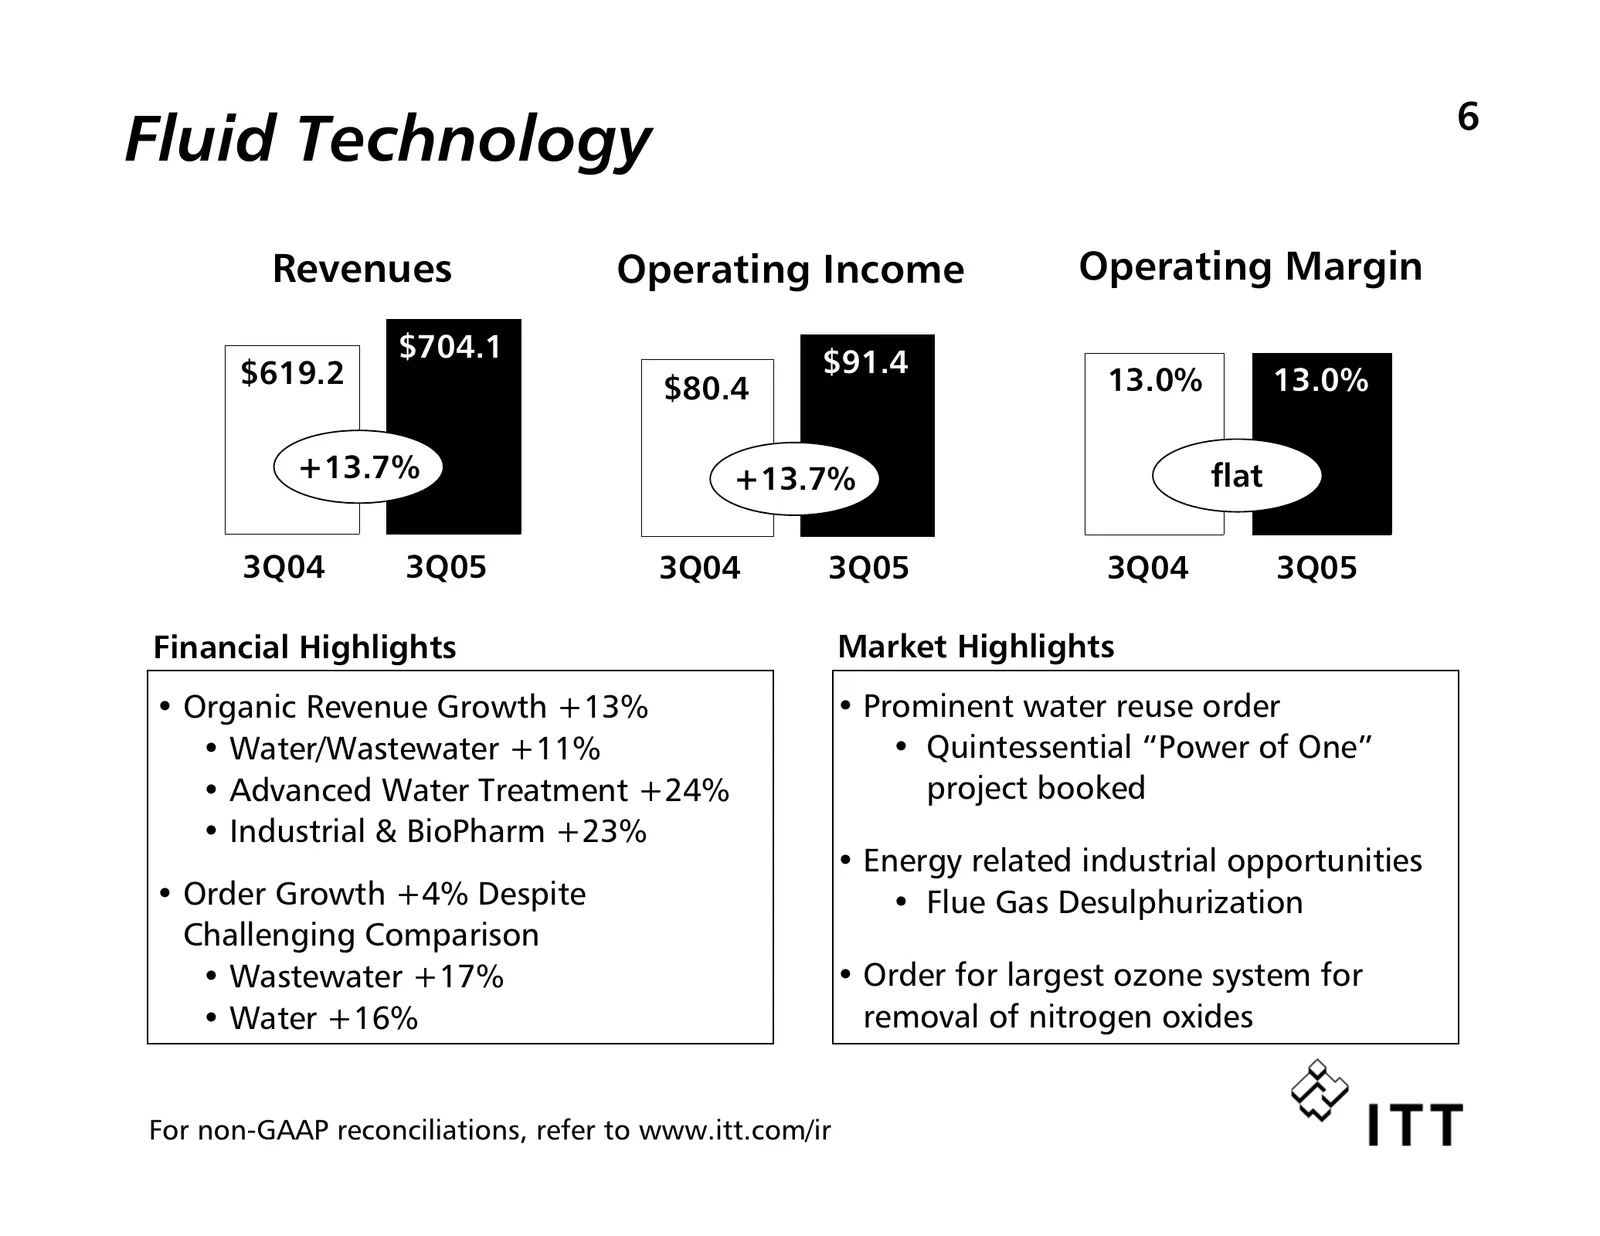
6 Fluid Technology Revenues Operating Income Operating Margin $704.1 $91.4 $619.2 $80.4 13.0% 13.0% +13.7% +13.7% flat 3Q04 3Q05 3Q04 3Q05 3Q04 3Q05 Financial Highlights Market Highlights • Organic Revenue Growth +13% • Prominent water reuse order • Water/Wastewater +11% • Quintessential “Power of O
Slide 8: Defense Electronics & Services
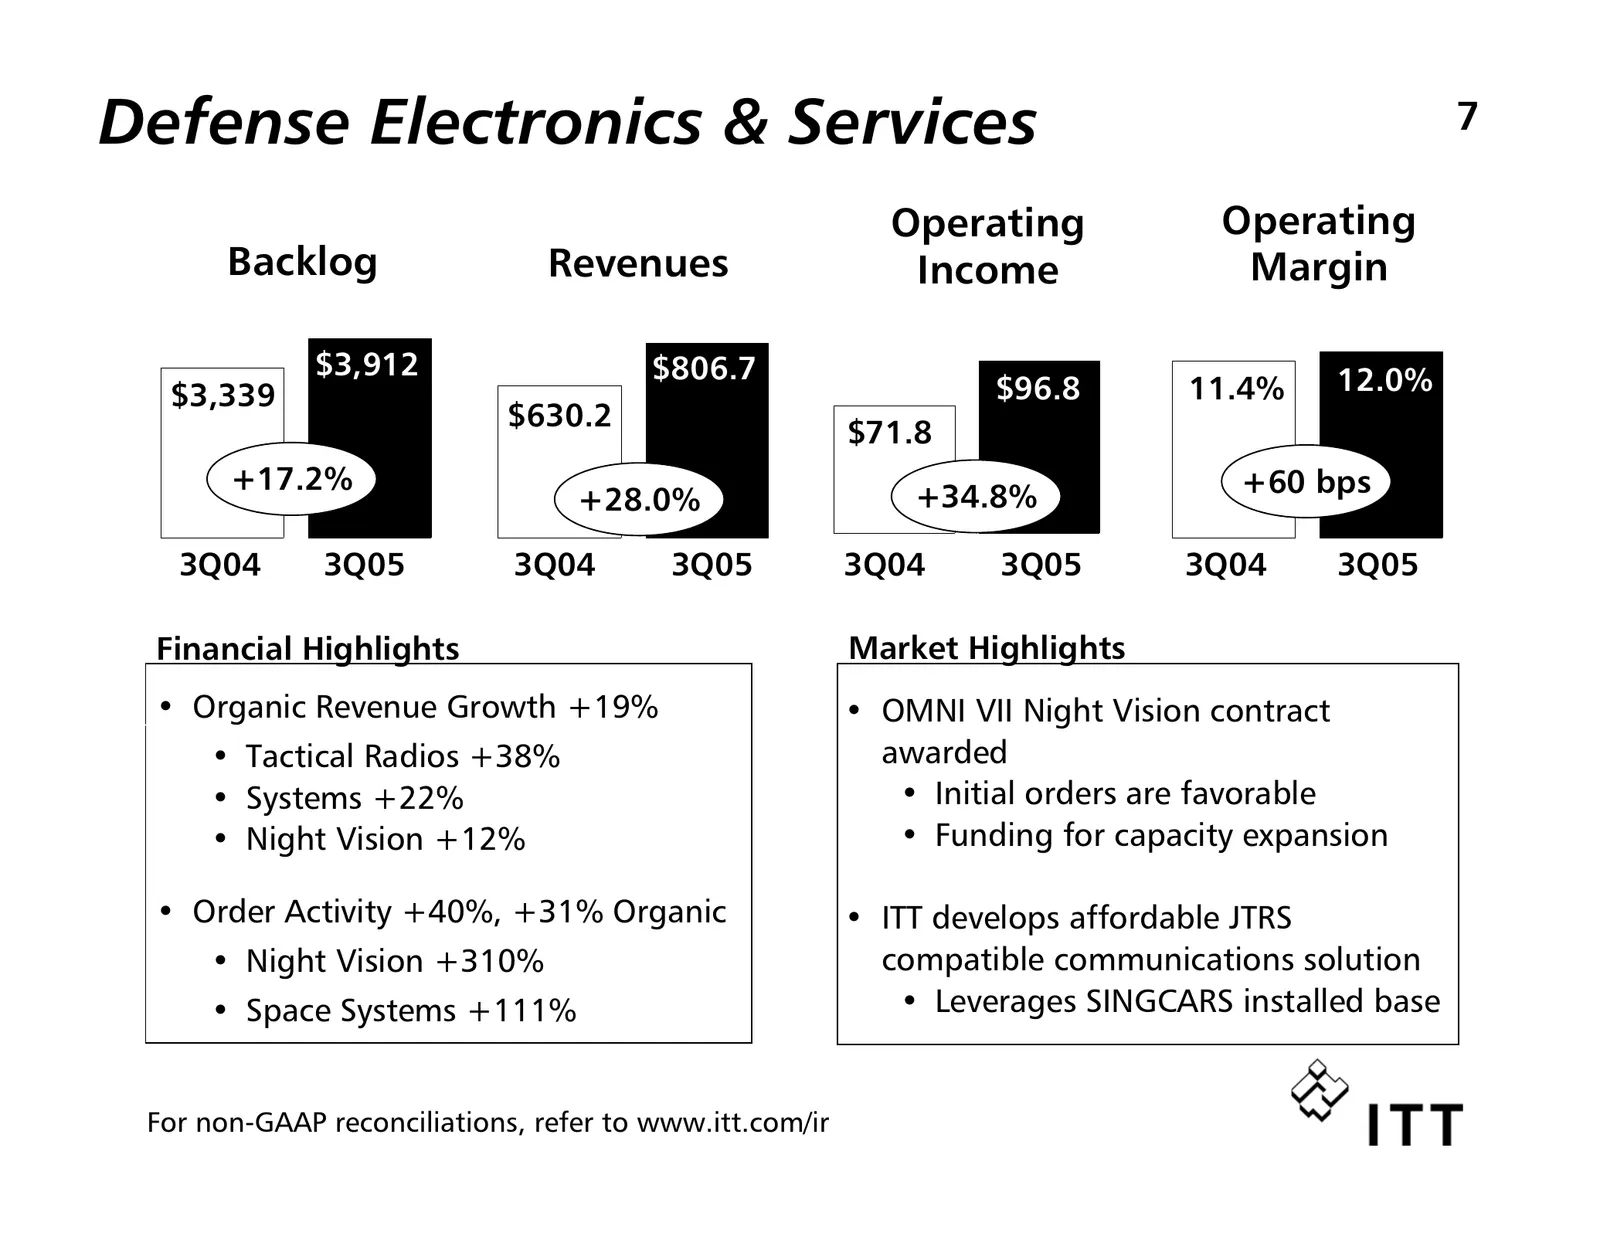
Defense Electronics & Services 7 Operating Operating Backlog Revenues Income Margin $3,912 $806.7 12.0% $3,339 $96.8 11.4% $630.2 $71.8 +17.2% +60 bps +28.0% +34.8% 3Q04 3Q05 3Q04 3Q05 3Q04 3Q05 3Q04 3Q05 Financial Highlights Market Highlights • Organic Revenue Growth +19% • OMNI VII Night Vision co
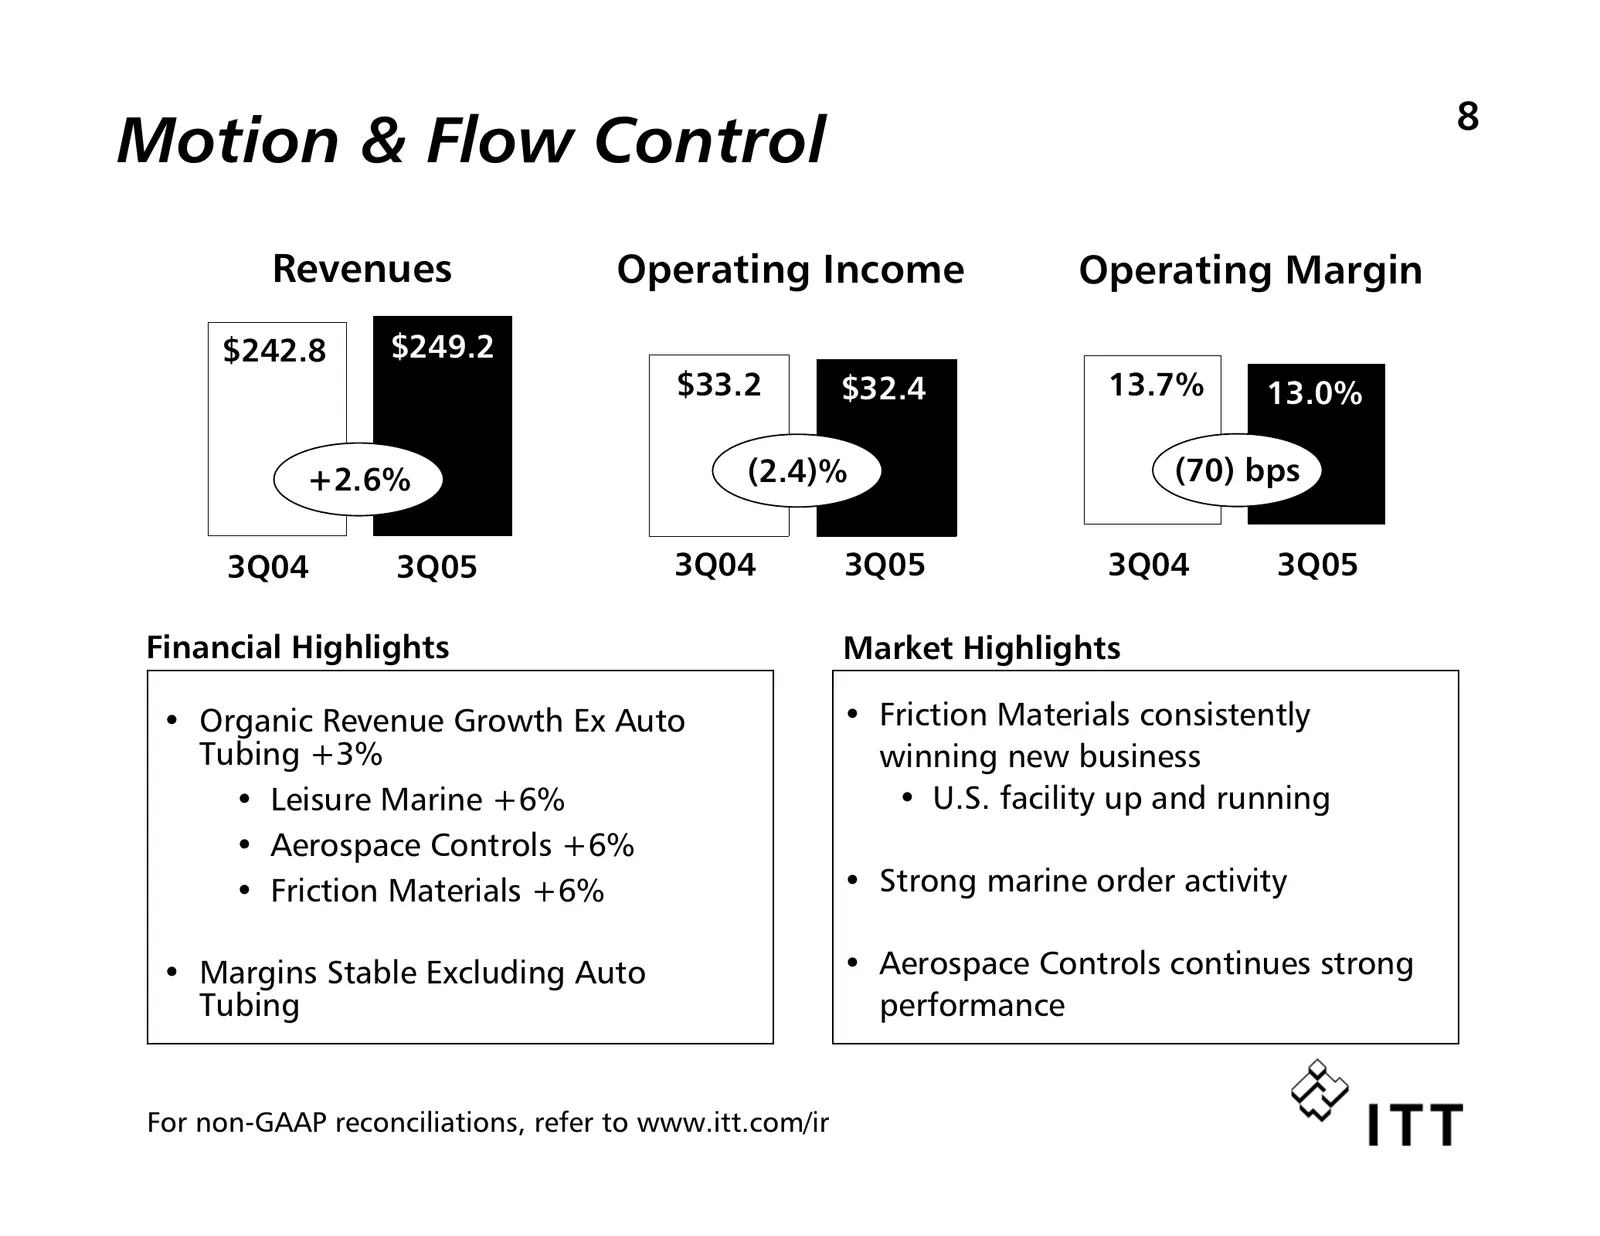
Slide 9: Motion & Flow Control
8 Motion & Flow Control Revenues Operating Income Operating Margin $242.8 $249.2 $33.2 $32.4 13.7% 13.0% +2.6% (2.4)% (70) bps 3Q04 3Q05 3Q04 3Q05 3Q04 3Q05 Financial Highlights Market Highlights • Organic Revenue Growth Ex Auto • Friction Materials consistently Tubing +3% winning new business • Lei
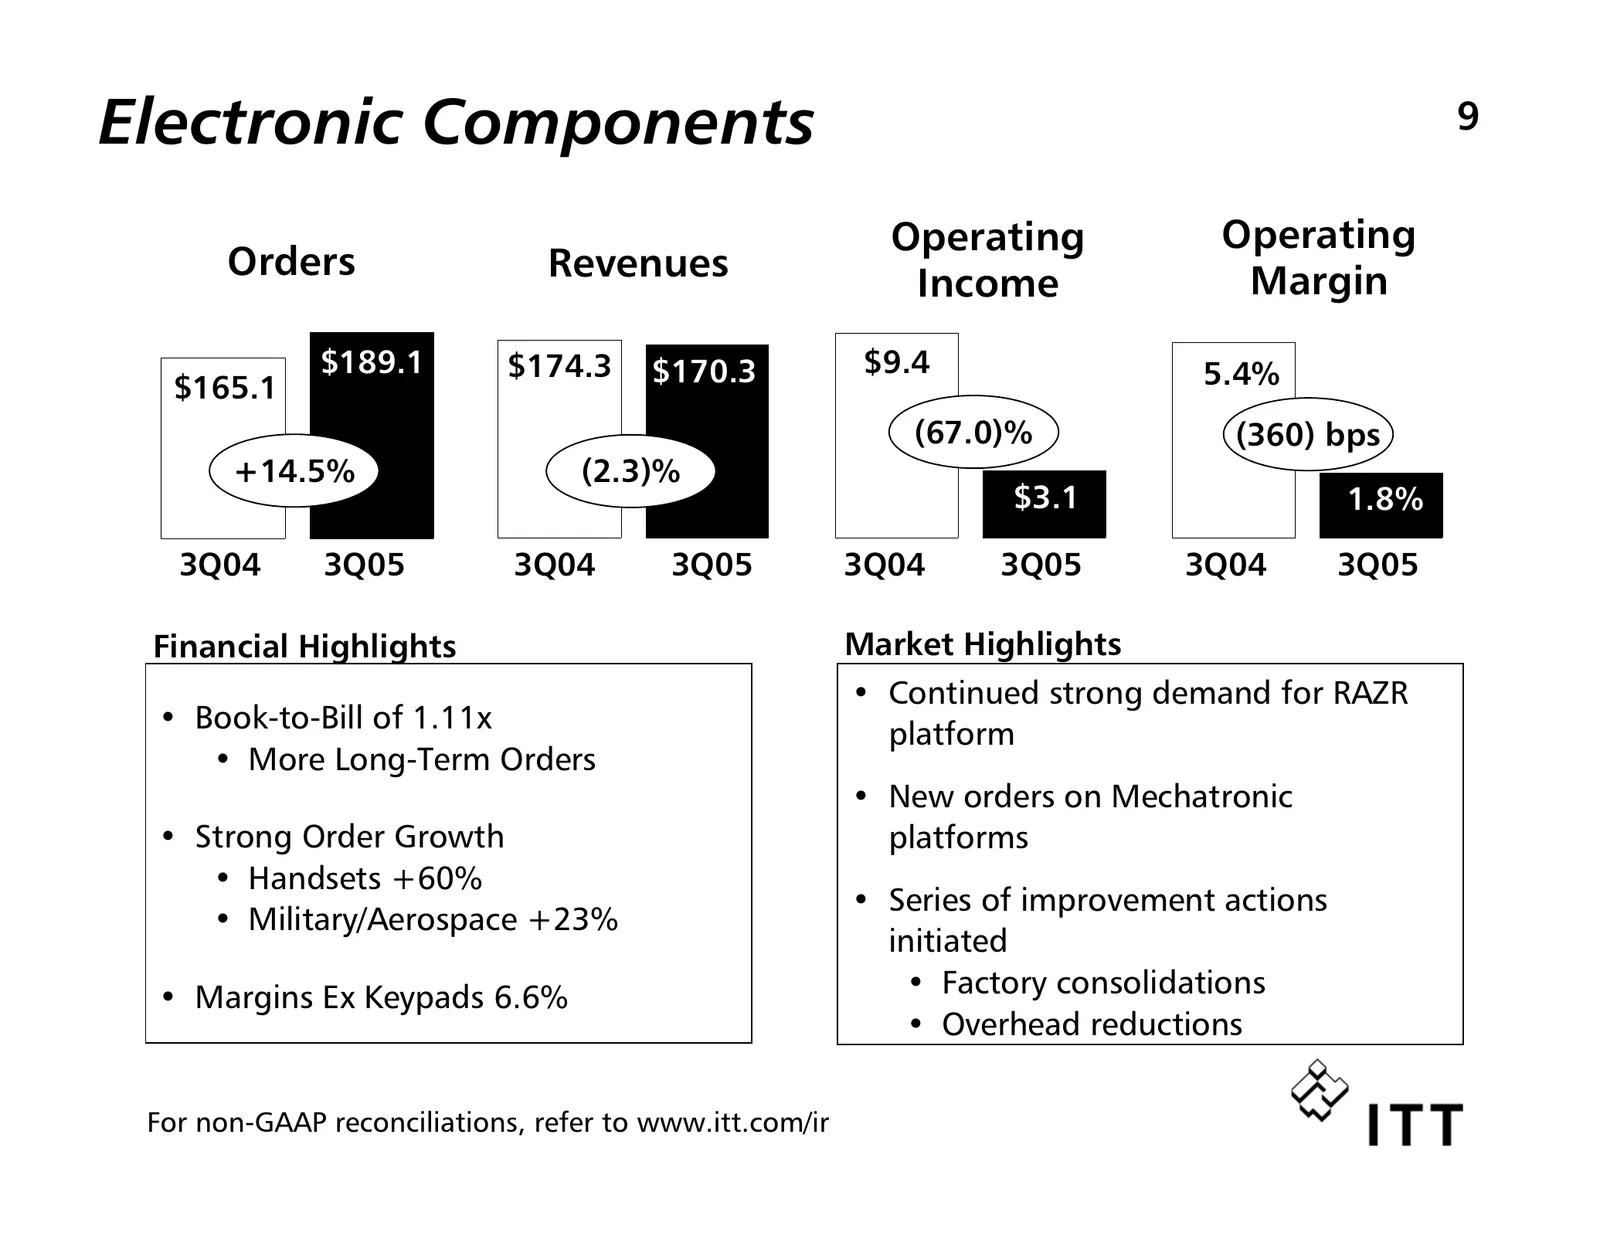
Slide 10: Electronic Components
Electronic Components 9 Operating Operating Orders Revenues Margin Income $189.1 $174.3 $170.3 $9.4 5.4% $165.1 (67.0)% (360) bps +14.5% (2.3)% $3.1 1.8% 3Q04 3Q05 3Q04 3Q05 3Q04 3Q05 3Q04 3Q05 Financial Highlights Market Highlights • Continued strong demand for RAZR • Book-to-Bill of 1.11x platform
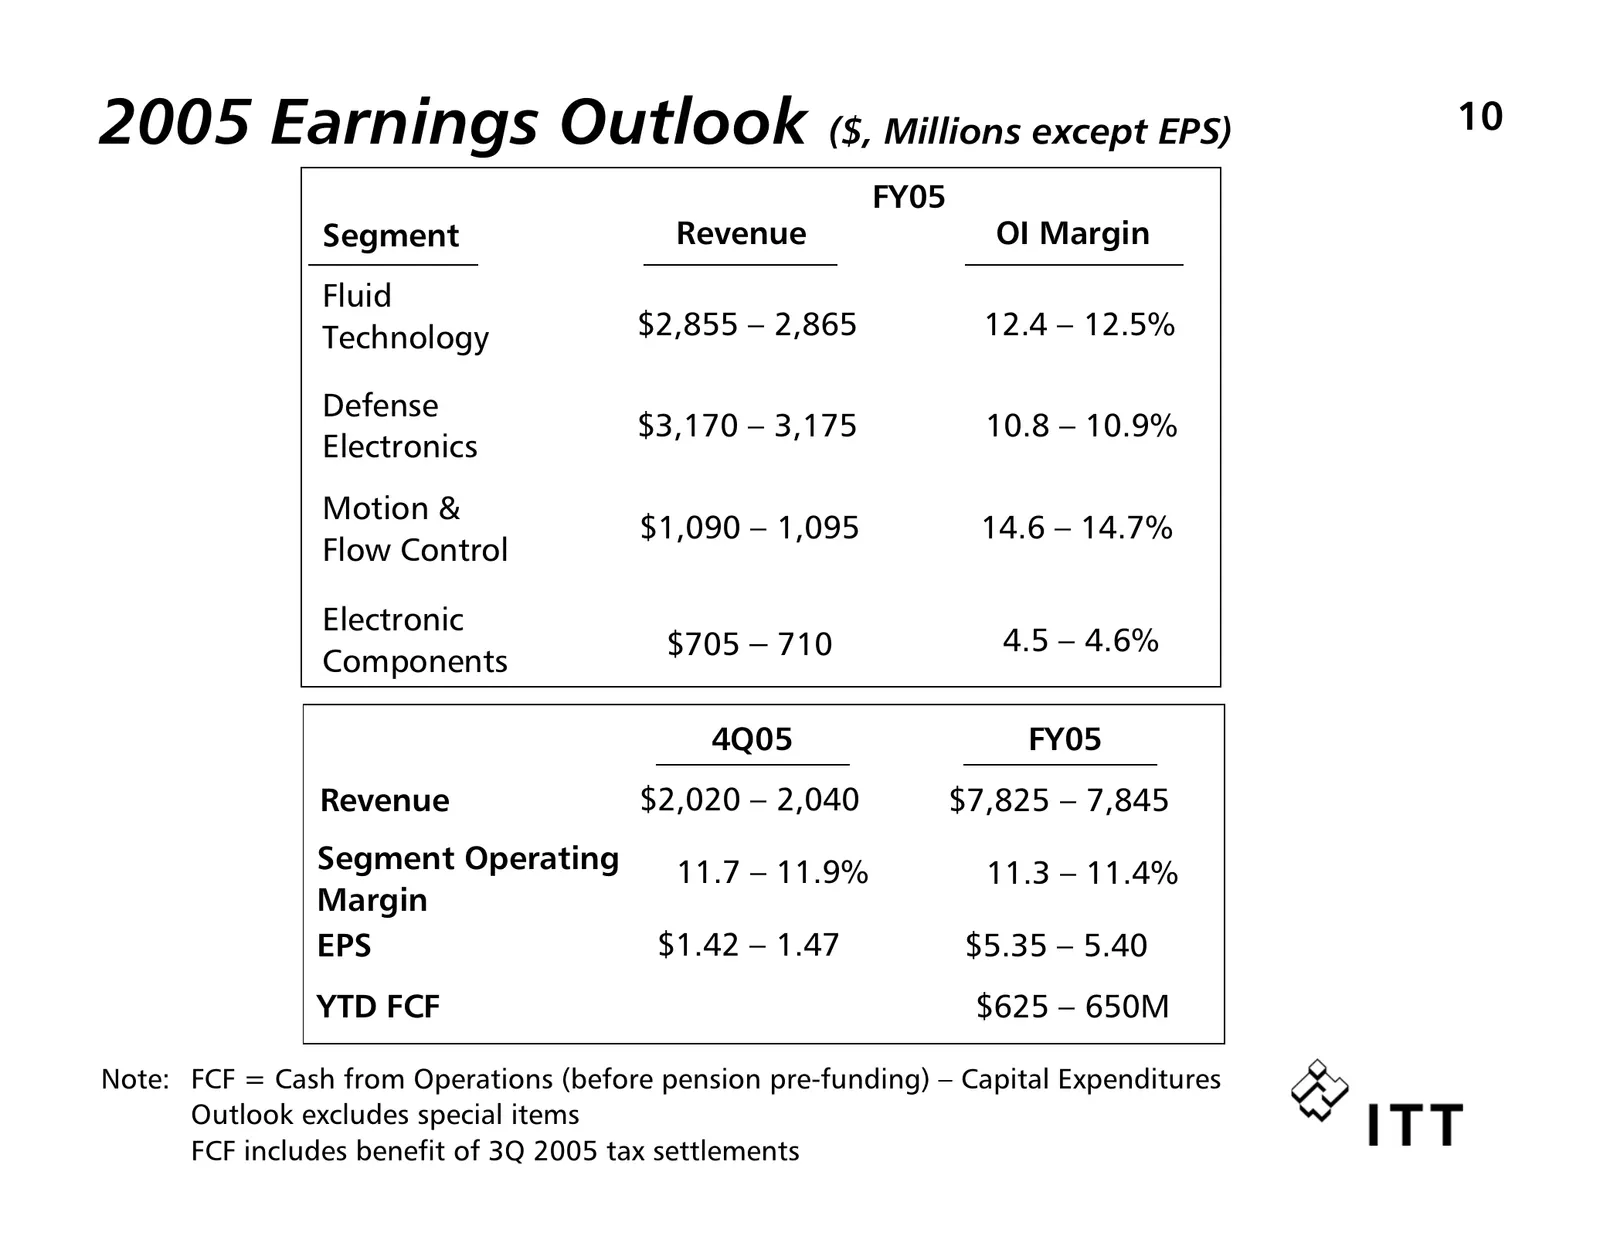
Slide 11: 2005 Earnings Outlook
2005 Earnings Outlook ($, Millions except EPS) 10 FY05 Segment Revenue OI Margin Fluid Technology $2,855 – 2,865 12.4 – 12.5% Defense $3,170 – 3,175 10.8 – 10.9% Electronics Motion & $1,090 – 1,095 14.6 – 14.7% Flow Control Electronic $705 – 710 4.5 – 4.6% Components 4Q05 FY05 Revenue $2,020 – 2,040

Slide 12: ITT Engineered for life
Y itt Engineered for life
Source: Internet Archive copy of itt.com
More decks from ITT Inc.
 D.A. Davidson 25th Annual Diversified Industrials & Services Conference (September 2026)13 slides · Sep 24, 2026
 Q2 2026 Earnings Presentation19 slides · Aug 6, 2026
 Q1 2026 Earnings Presentation22 slides · May 6, 2026
 Q4 2025 Earnings Presentation21 slides · Feb 5, 2026
 Merger or Acquisition (December 2025)20 slides · Dec 5, 2025
 Q3 2025 Earnings Presentation15 slides · Oct 29, 2025