Sigma-Aldrich — Investor Day (March 2008)
153 slides from Sigma-Aldrich's investor day presentation, Mar 19, 2008
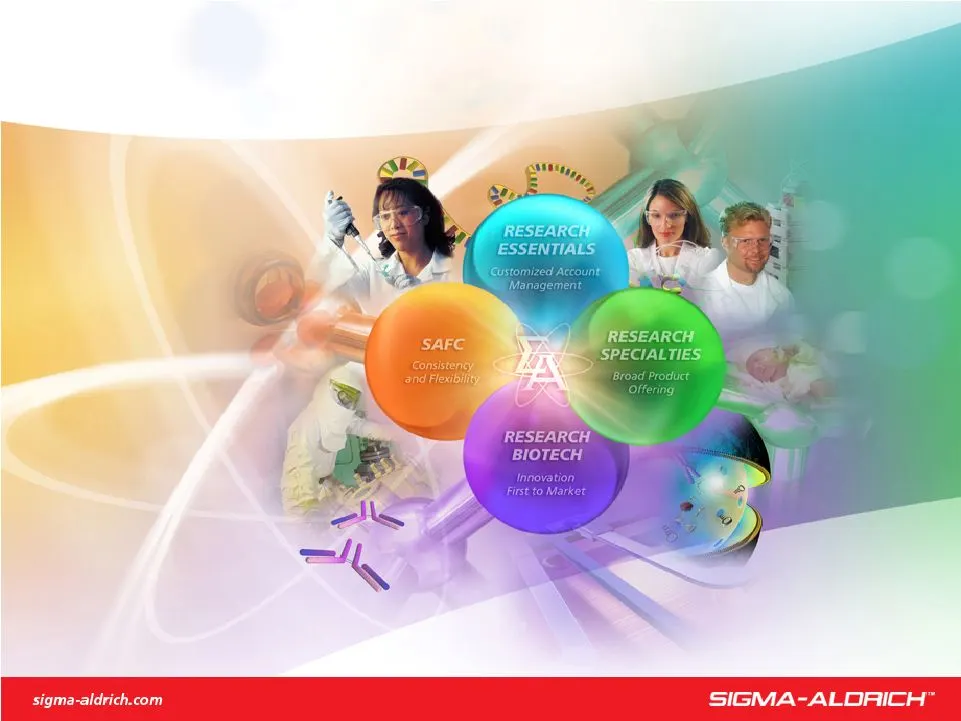
Slide 1: Sigma-Aldrich Corporation
Sigma-Aldrich Corporation We are Committed to Accelerating our Customers’ Success through Leadership in Life Science, High Technology and Service Exhibit 99.1

Slide 2: Cautionary Statements
Cautionary Statements Our presentation today will include forward looking statements about the Company’s future performance, goals, strategic actions and initiatives and similar intentions and beliefs, including expectations for sales and earnings growth, cash flow, debt levels, share repurchases an
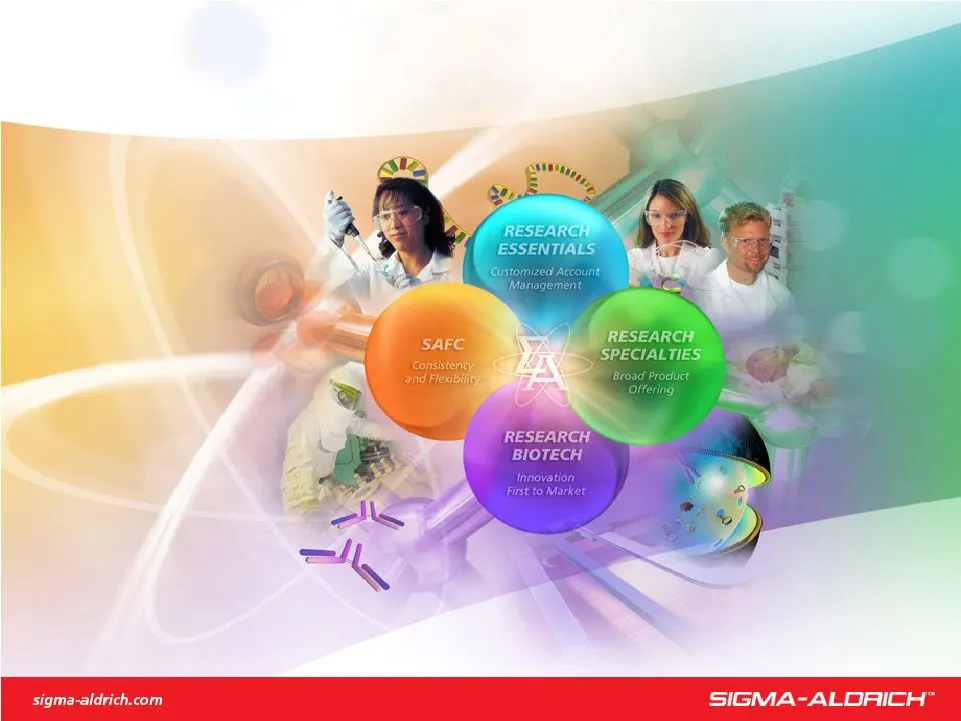
Slide 3: Committed to Accelerating our Customers' Success
We are Committed to Accelerating our Customers’ Success through Leadership in Life Science, High Technology and Service Enhancing Global Reach Through Excellence
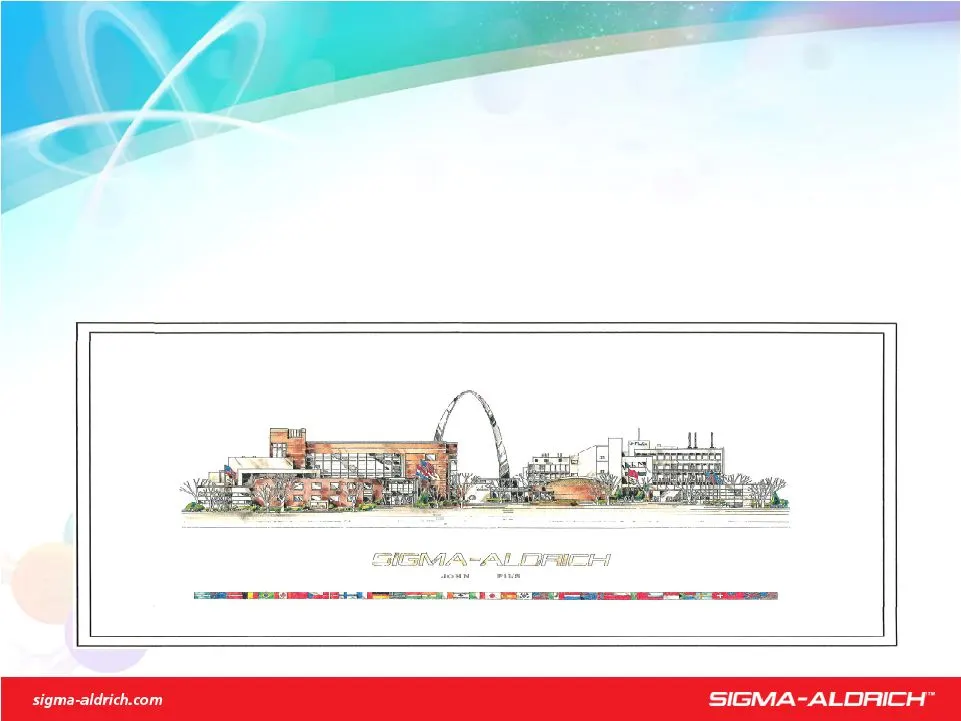
Slide 4: Celebrating $2 Billion In Sales
Celebrating $2 Billion In Sales Major Milestone For Sigma-Aldrich Global Reach Of Company Leadership In Life Science & High Technology
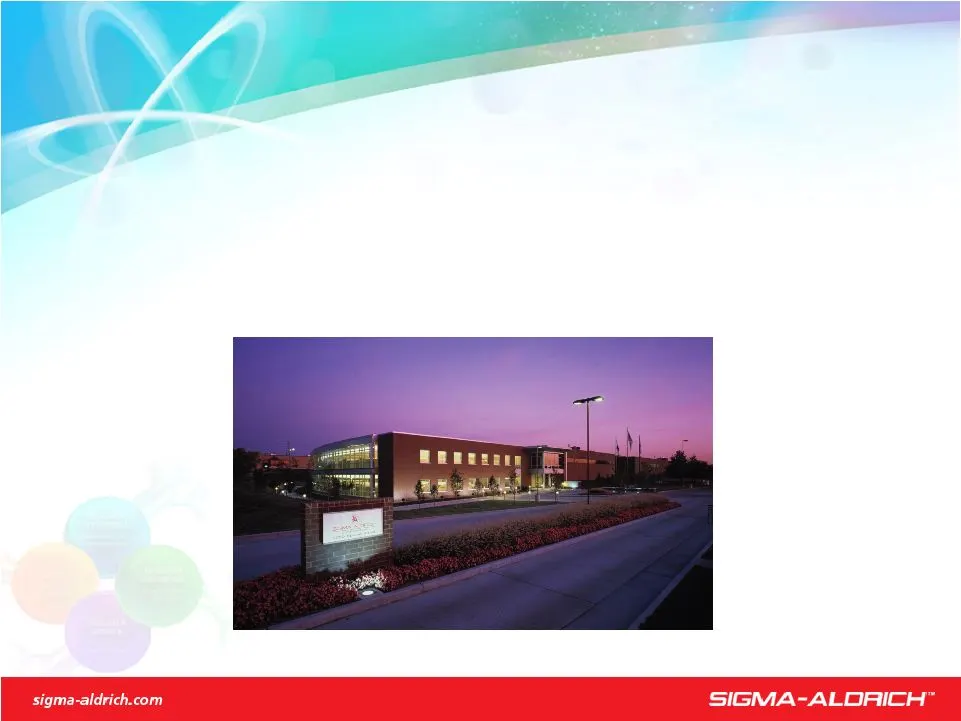
Slide 5: Major Supplier In Life Science & High Technology
A Major Supplier In Life Science & High Technology Sigma-Aldrich Overview 2007 Performance - $2.0 Billion in Sales - 21.5% Pretax Margin - 20.6% Return on Equity - Strong Cash Flow 130,000 Products 1,000,000 Customers 80,000 Accounts 7,900 Employees in 36 Countries

Slide 6: Five Key Initiatives To Achieve Objectives
Five Key Initiatives To Achieve Objectives Increase Focus on Becoming Customer Centric Maintain Leadership in Life Science & High Technology Strategic Plan Objectives Building For The Future Strategic Financial Achieve Minimum 10% Annual Top & Bottom Line Growth Maintain 20% Return on Equity Retain

Slide 7: Achieve Above Market Growth
Achieve Above Market Growth Sales Growth Goals Building For The Future Research Essentials % % 4-5 % % Research Specialties 7-8 Research Biotech 7-8 >10 SAFC 8-9 >10 Internal % % % % Acquisitions Total % Sales Mix Organic Growth Expected Growth Growth Long-Term
Slide 8: Largest Research Chemical Supplier & Top Fine Chemical Company
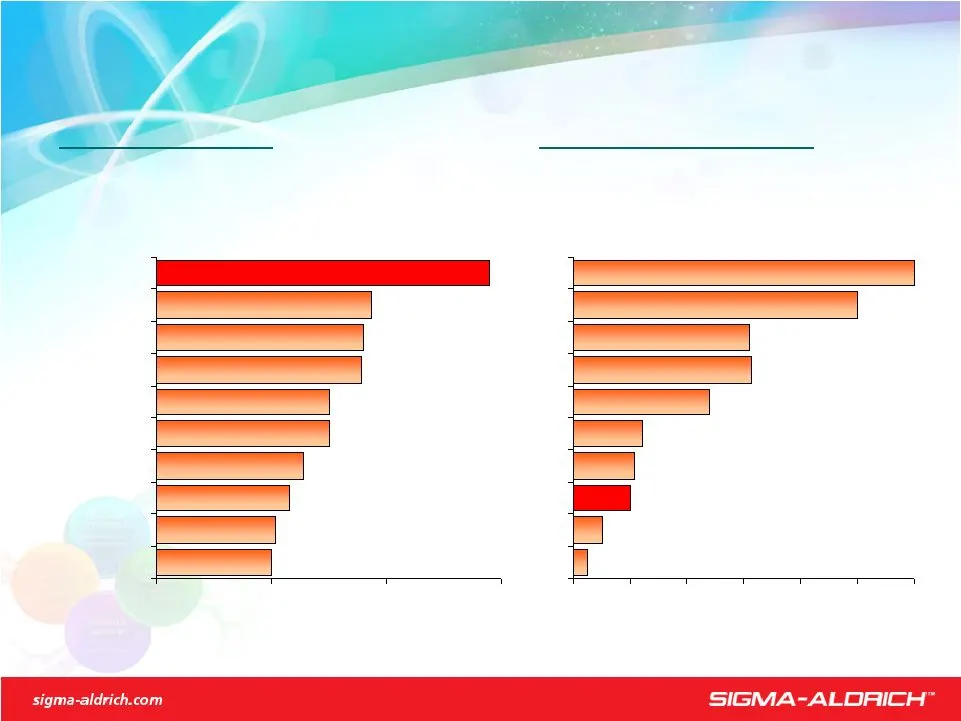
Largest Research Chemical Supplier & Top 10 Fine Chemical Company Research Market $10 Billion Worldwide 3-4% Growth USA 40%; Europe 35%; Int’l 25% Our Markets Fine Chemical Market $50 Billion Worldwide 2-3% Growth USA 55%; Europe 30%; Int’l 15% 0.5 1.5 VWR Becton Dickinson Qiagen Wako Thermo Fisher
Slide 9: Financial Performance: Compound Growth
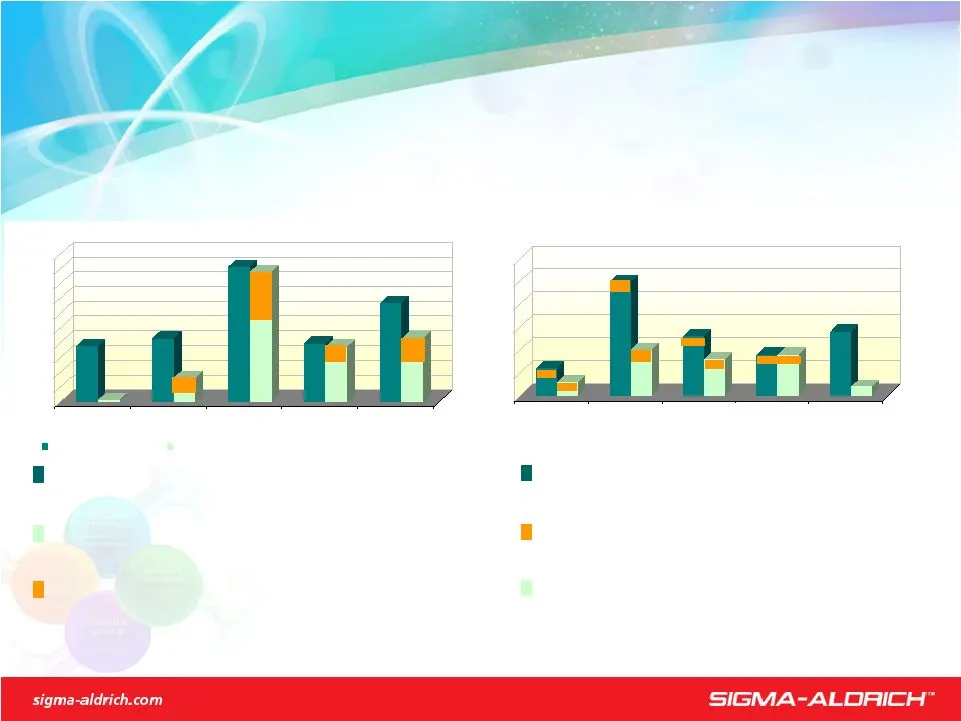
Year Compound Growth: Sales - 11% ; EPS - 13% Sales Growth 7.6% 0.3% 8.6% 3.3% 18.3% 17.6% 7.9% 7.5% 13.4% 8.6% 0% 2% 4% 6% 8% 10% 12% 14% 16% 18% 20% Reported Adjusted for Currency/Acquisitions Reported Acquisition Benefit Financial Performance Adjusted for Currency/Acquisitions Profit (EPS) Growth
Slide 10: Sales Growth Exceeds Market Growth Rate
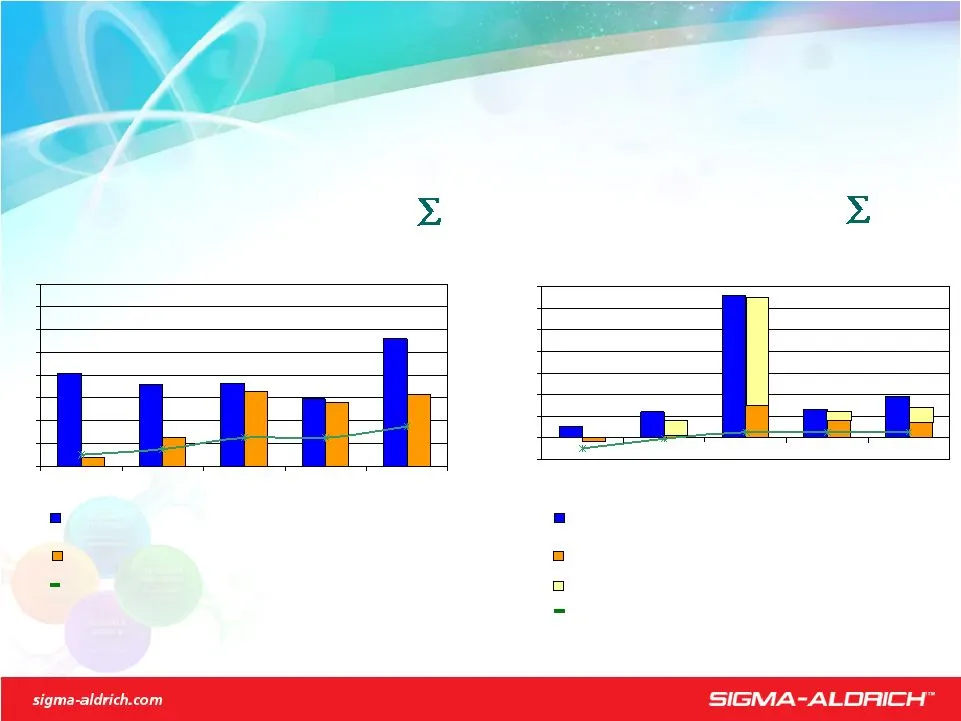
Sales Growth Exceeds Market Growth Rate 0% 2% 4% 6% 8% 10% 12% 14% 16% Financial Performance – Sales Growth Reported Research Chemicals (71% -A) Fine Chemicals (29% -A) -10% 0% 10% 20% 30% 40% 50% 60% 70% Market Adjusted for Currency Reported Market Adjusted for Currency/Acquisitions Acquisitions
Slide 11: EPS Contributors - 2007 vs. 2006
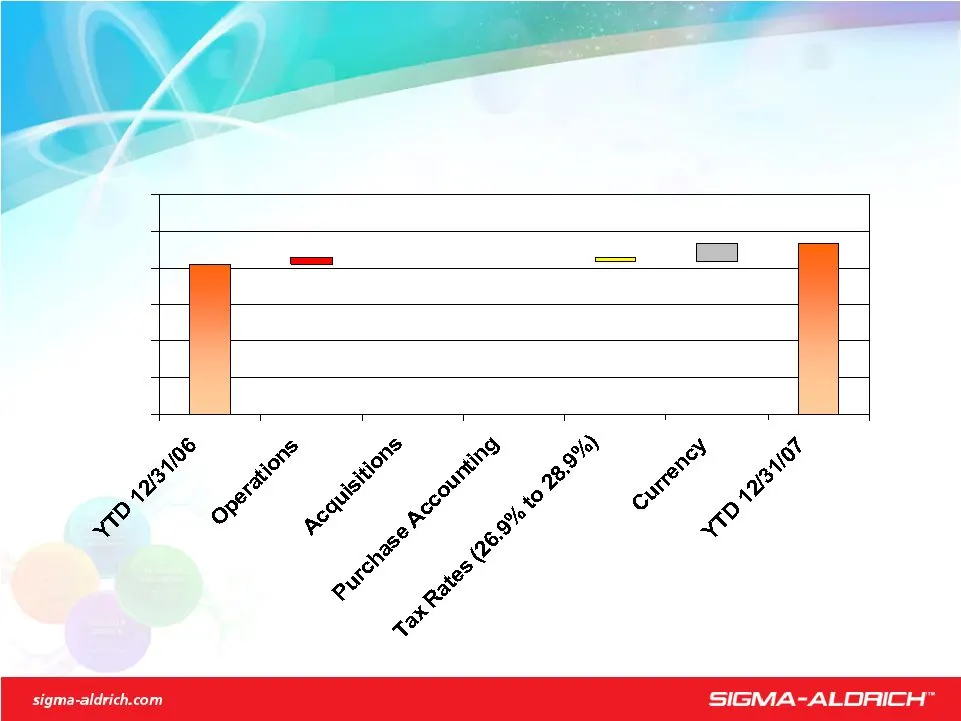
EPS Contributors - 2007 vs. 2006 Financial Performance $0.00 $0.50 $1.00 $1.50 $2.00 $2.50 $3.00 $2.05 $0.10 5% ($0.01) (1%) $0.02 1% ($0.07) (3%) $0.25 12% $2.34 YTD 2007 Gain Primarily From Operations and Favorable Currency
Slide 12: Return on Equity Target Achieved For Years
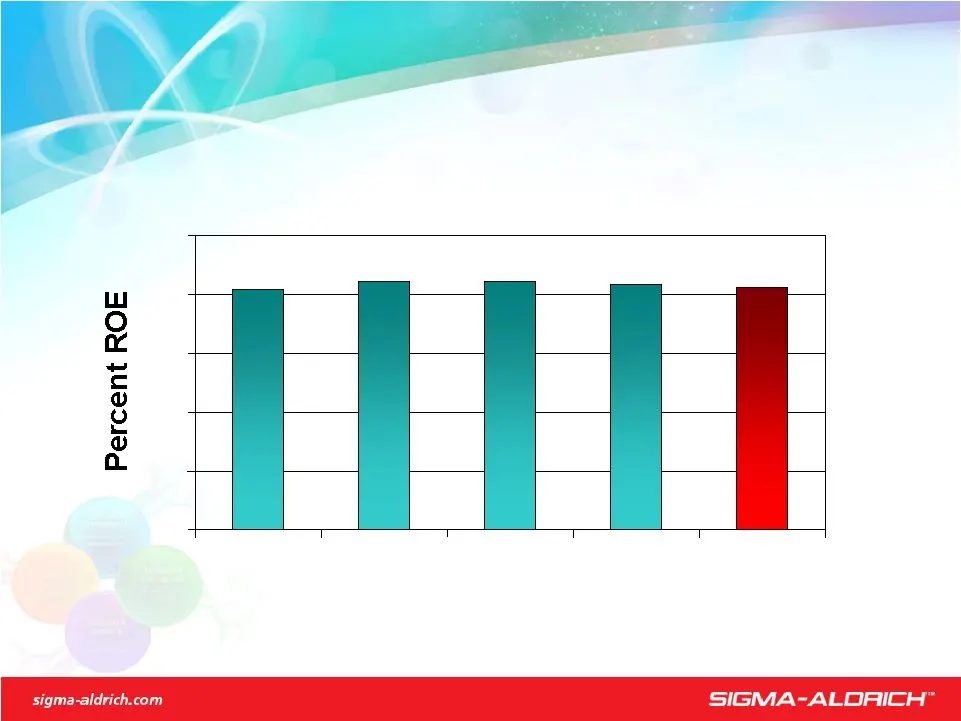
20% Target Achieved For 5 Years Return on Equity Financial Performance 20.4% 21.1% 21.1% 20.9% 20.6% 0% 5% 10% 15% 20% 25%
Slide 13: Customers' Success Drives Above Market Growth
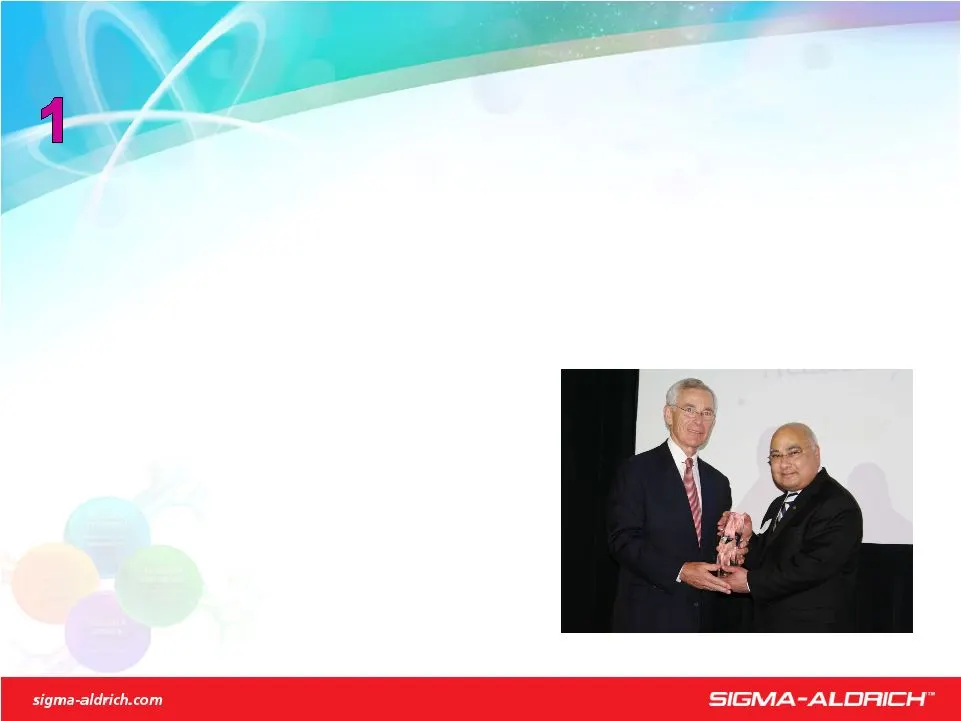
Accelerating Customers' Success Drives Above Market Growth 2007 Highlights Service Remained Strong Research Achieved 95% Same Day Shipment SAFC Improved On Time Deliveries To 86%, With Future Order Growth >30% Employees Recognized By Customers For Customer Success Driven Approach Official Recognitio
Slide 14: Expand In Faster Growing Geographic Markets
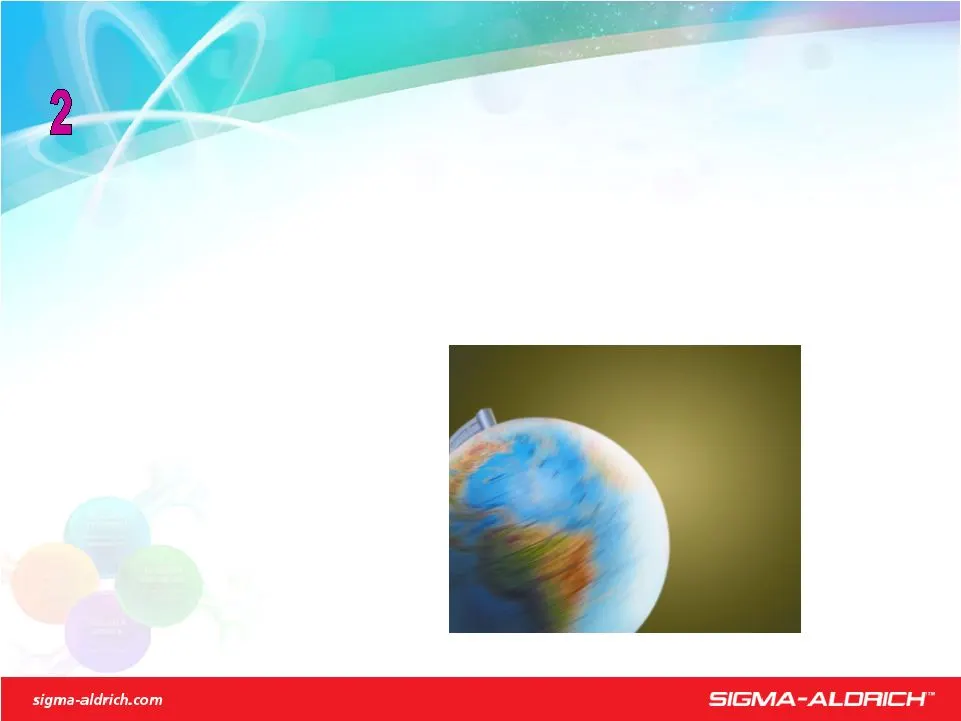
25% Of Sales In CAPLA Markets By 2010 2007 Highlights Sales Growth In CAPLA: 20% Commitments To Produce And Store Products Closer To Customers In China and South Korea Commenced Project to Expand Fermentation Capabilities in Israel Expand In Faster Growing Geographic Markets
Slide 15: Build On Internet Superiority
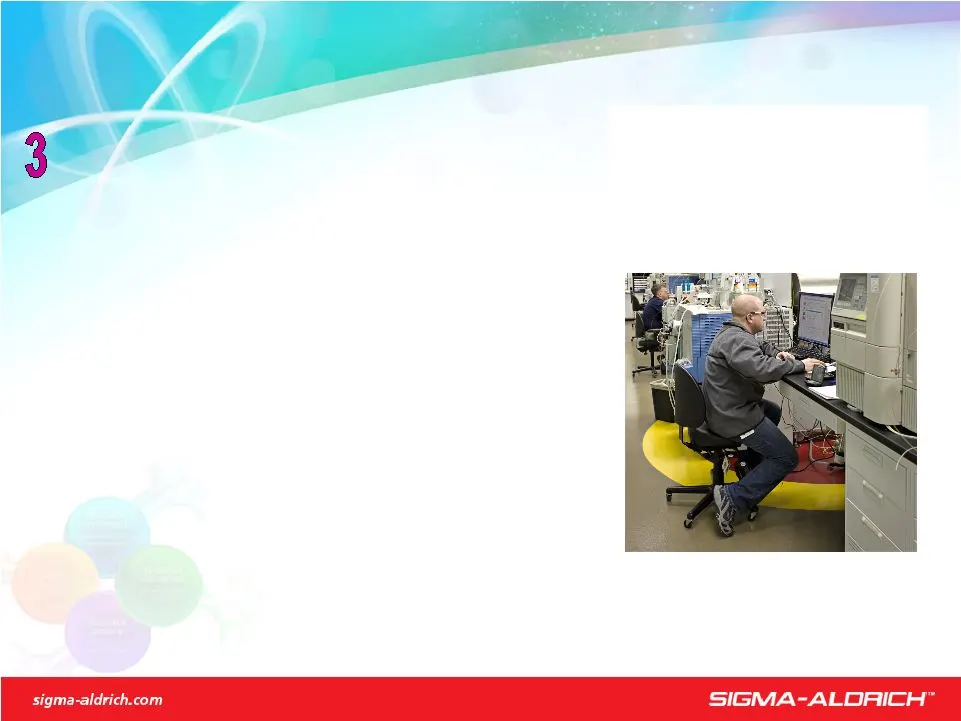
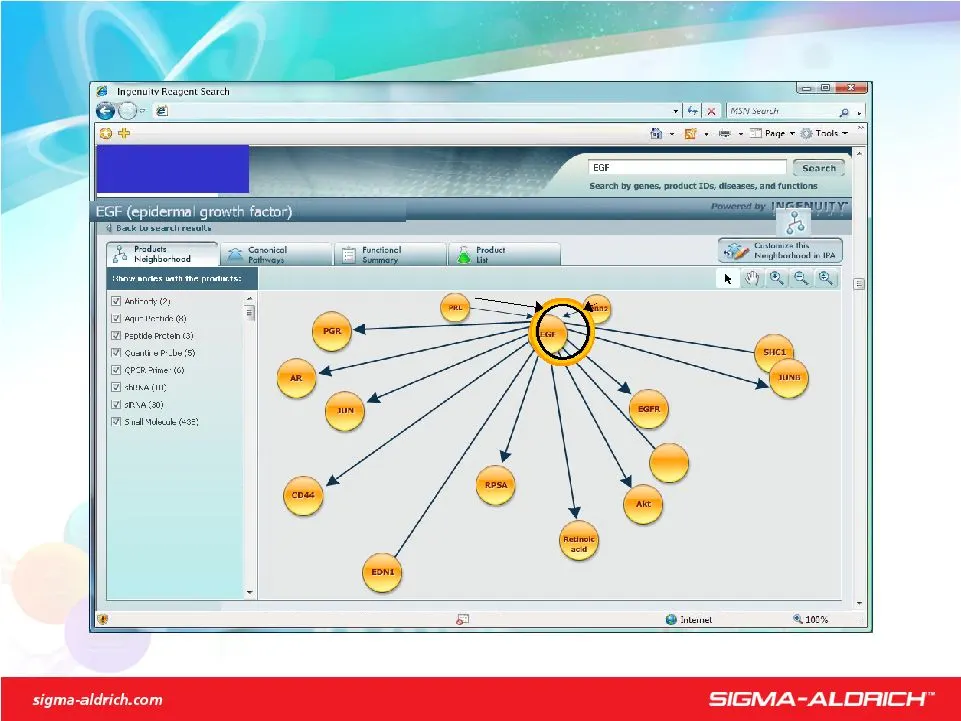
E-Centric Organization 2007 Highlights Key Drivers – Migration To Electronic Commerce Improved Search Capabilities Enhanced Infra Structure (Websphere) Entered Into Research Partnership With Ingenuity Introduced Online Chat For Technical Service Inquiries Build On Internet Superiority
Slide 16: Leverage Process Improvement
2007 Highlights Involved Customers In Improvement Initiatives Improved Product Quality Implemented A Multi-Year Supply Chain Initiative Leverage Process Improvement Achieved $15.0 Million Savings Target While Improving Quality & Service
Slide 17: Added New Capabilities Through Acquisitions
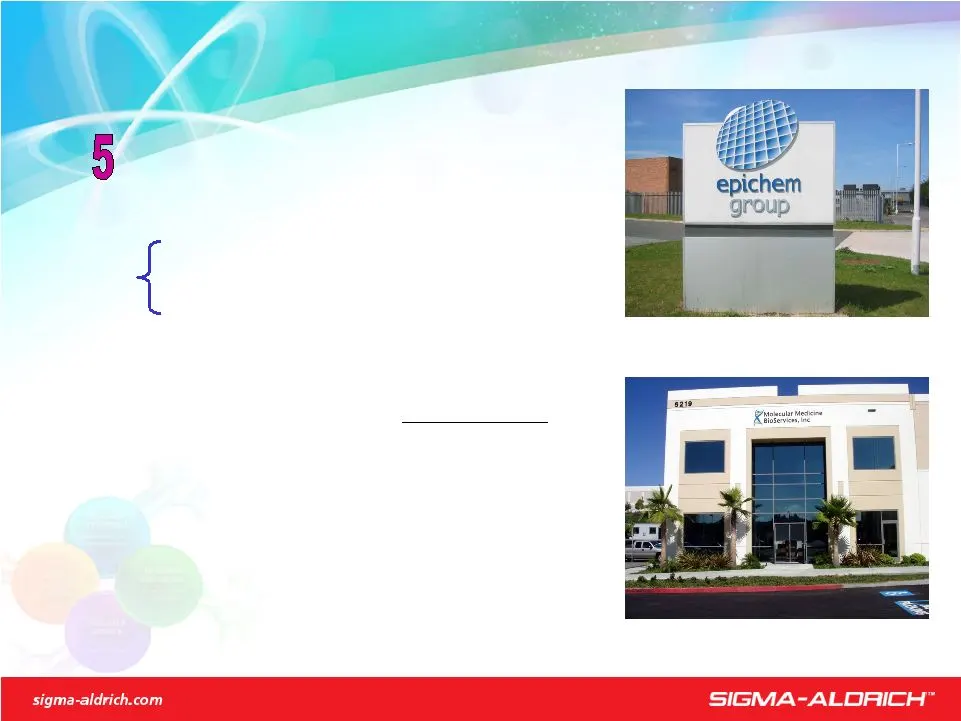
Added New Capabilities 2007 Highlights Acquisitions Epichem Molecular Medicine BioServices In-Licensed >45 Technologies Including Sangamo Biosciences Revenue Stream = Outlicensing $1.4 Million Fill Growth Target Through Acquisitions MMB Epichem Annualized Revenue $52 Million

Slide 18: Summary of 2007 Performance
Plan Initiatives On-Track Summary of 2007 Performance Successfully Continued Implementing New Initiatives Launched Supply Chain Initiative Achieved Geographic Expansion & Internet Goals Achieved Process Improvement Savings Objective Added Technology, Capacity & Geographic Reach Through Two Acquisiti
Slide 19: Stock Performance
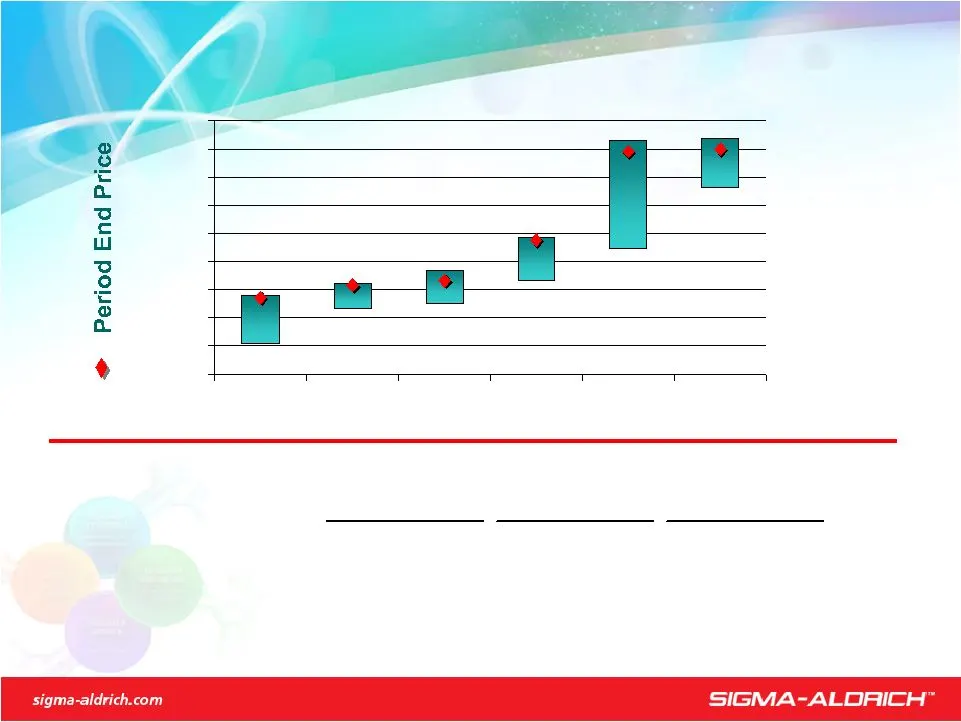
17% Compound Annual Growth - Last 5+ Years Stock Performance (*) Post-Split (To 2-29) Low 21 High 29 High 31 Low 27 Low 28 High 34 Low 31 High 40 Low 37 High 57 High 57 Low 48 5-Years 3-Years 1-Year Dow Jones S&P 500 NASDAQ Sigma-Aldrich Last Last Last Price History (*) Stock Returns $15 $20 $25 $30

Slide 20: 2008 Projections
Exceed Market Growth / Increase Pre-Tax Margins 2008 Projections Key Assumptions December 2007 FX Rates Effective Tax Rate Of 30-32% Repurchase Of Up To 4 Million Shares Sales (excluding future acquisitions) Organic % Currency % Acquisition <1 % Total % EPS ($2.52 - 2.62) % Return On Equity > 20 % F
Slide 21: 2008 Challenges
New Programs Supporting Five Initiatives To Offset Market Conditions 2008 Challenges Big Pharma Focused On Driving Drugs To Market U.S. Academic Funding Less Than Robust Growth Impact of Economic Slowdown on SAFC Growth

Slide 22: 2008 Opportunities
Efforts To Drive Organic Sales Growth To 7% 2008 Opportunities Expanded Sales Efforts Increased Outsourcing By Pharma Companies - Growth In CRO’s - Clinical Trials Conducted Abroad - Larger Relationships With Key Suppliers Growth In Small And Medium Size Biotechs Opportunities In Emerging Markets Ex

Slide 23: Company Planning History
Regularly Scheduled Reviews Company Planning History Outcome 1999 Plan Developed "One Company" Approach Divested B-Line Systems Committed To Repurchase Shares Add Leverage Shareholding and Performance Reward Programs Added 2001 Update Divested Diagnostics 2002 Plan Sales & Marketing Activities Enhan
Slide 24: 2008 Plan Builds On Current Initiatives
2008 Plan Builds On Current Initiatives 2008 Company Plan Approach Intend To Follow Past Approach - Use Cross-Section Of Internal Resources - Engage External Consultant Evolutionary - Sharpen Focus On Existing Initiatives - Implement Supply Chain Initiatives To Improve Margins
Slide 25: Formal Approach To Business Planning
Formal Approach To Business Planning Company Planning Approach Develop Plans With 3-Year Implementation Cycle Interim Review Midway To Sharpen Focus Involve Employees With “High Potential” Timing Develop And Communicate Plan Q2-Q4 2008 Implement Q1 2009
Slide 26: Recent Promotions & New Responsibilities Strengthen Mgmt Team
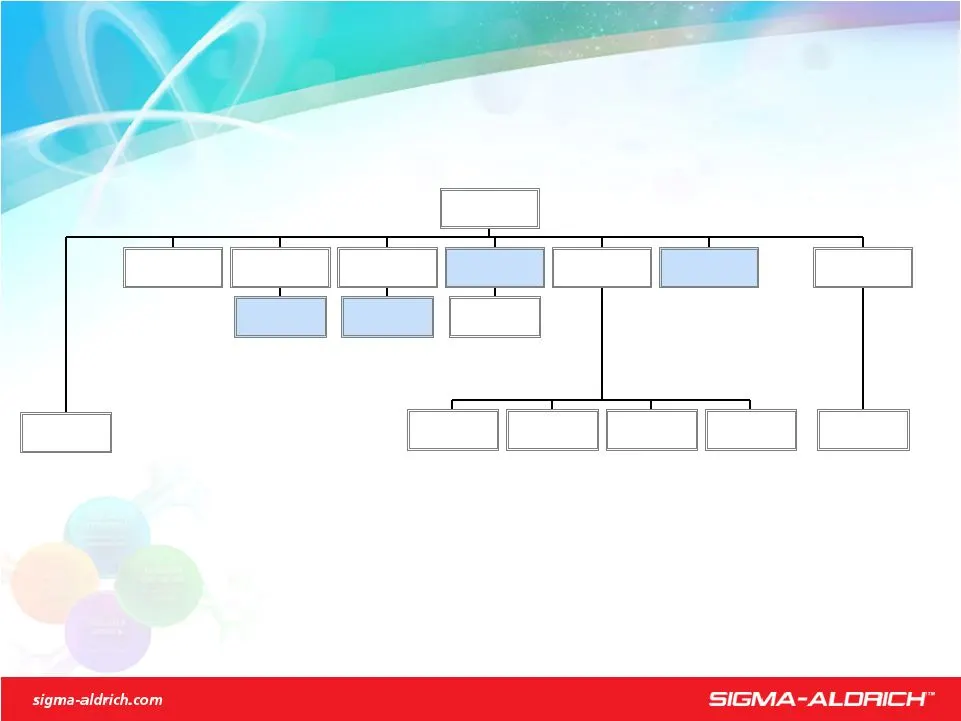
Recent Promotions & New Responsibilities Strengthen Mgmt Team Organization Jai Nagarkatti President & CEO Doug Rau Vice President Human Resources Frank Wicks President SAFC Dave Julien President Research Specialties Operations & Marketing Gilles Cottier President Research Essentials International Da
Slide 27: We are Committed to Accelerating our Customers' Success
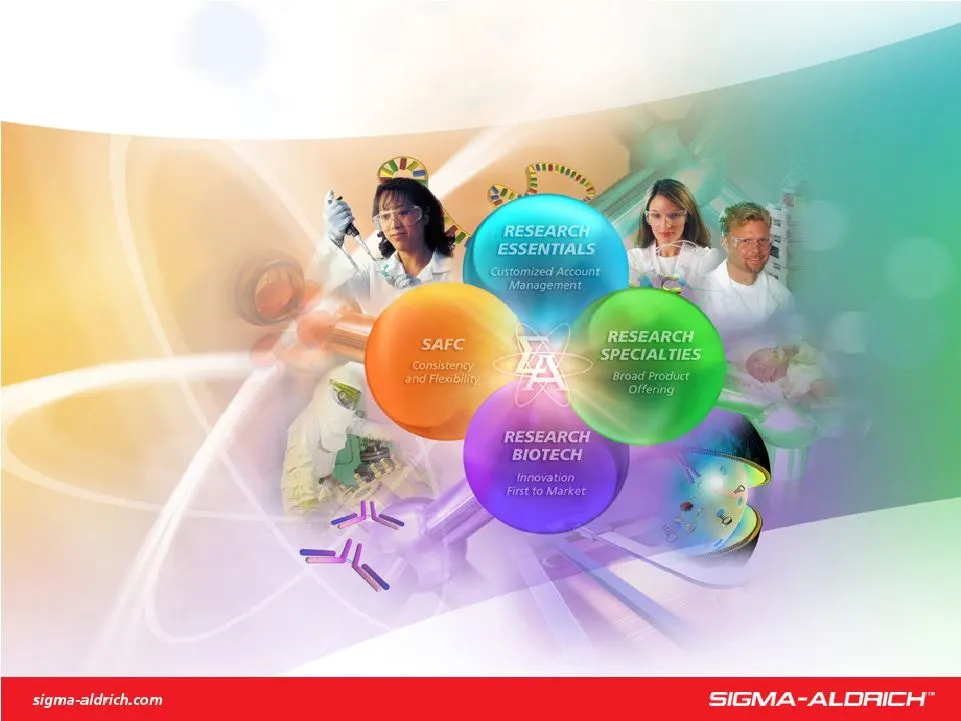
We are Committed to Accelerating our Customers’ Success through Leadership in Life Science, High Technology and Service Enhancing Global Reach Through Excellence

Slide 28: Five Key Initiatives
Initiatives Set Actions For 2006 - Building For The Future 1. Align Structure With Customers And Markets 2. Expand In Faster Growing Geographic Markets 3. Build On Internet Superiority 4. Leverage Process Improvement For Excellent Investment Returns 5. Fill Growth Target Through Acquisitions Five Ke
Slide 29: Business Units Overview: Research Essentials
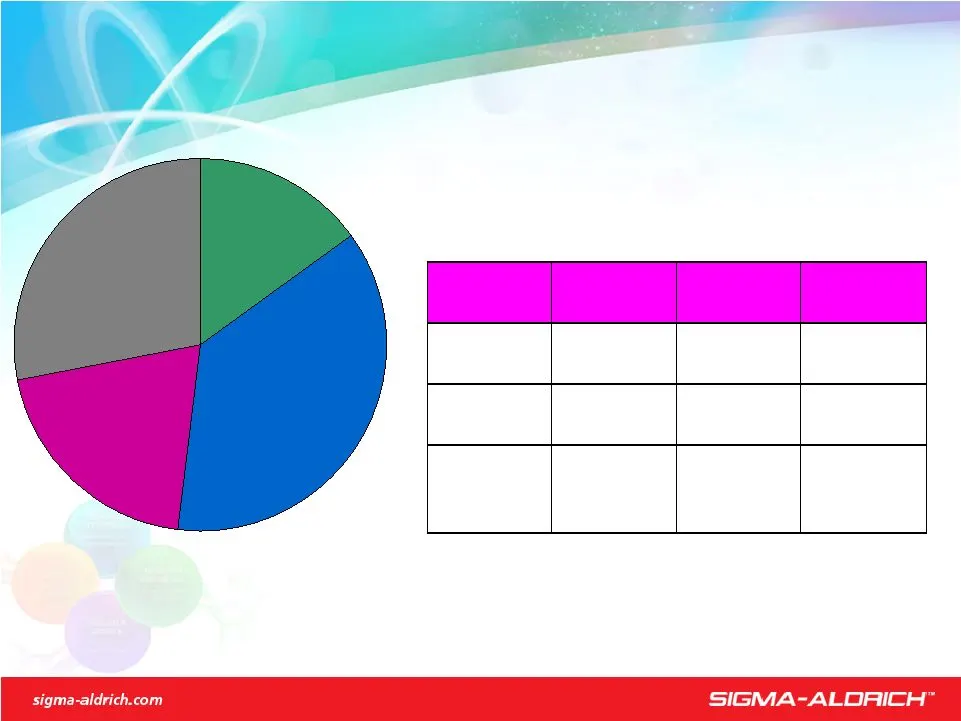
Research Specialties 37% ($761M) Research Essentials 19% ($388M) SAFC 29% ($591M Research Biotech 15% ($299M) Research Essentials Business Units Customer Types Driving Forces Long-Term Growth Goal Research Essentials Economic Buyers Relationship Selling 4% Research Specialties Lab Scientists Transac
Slide 30: Research Essentials Market Overview
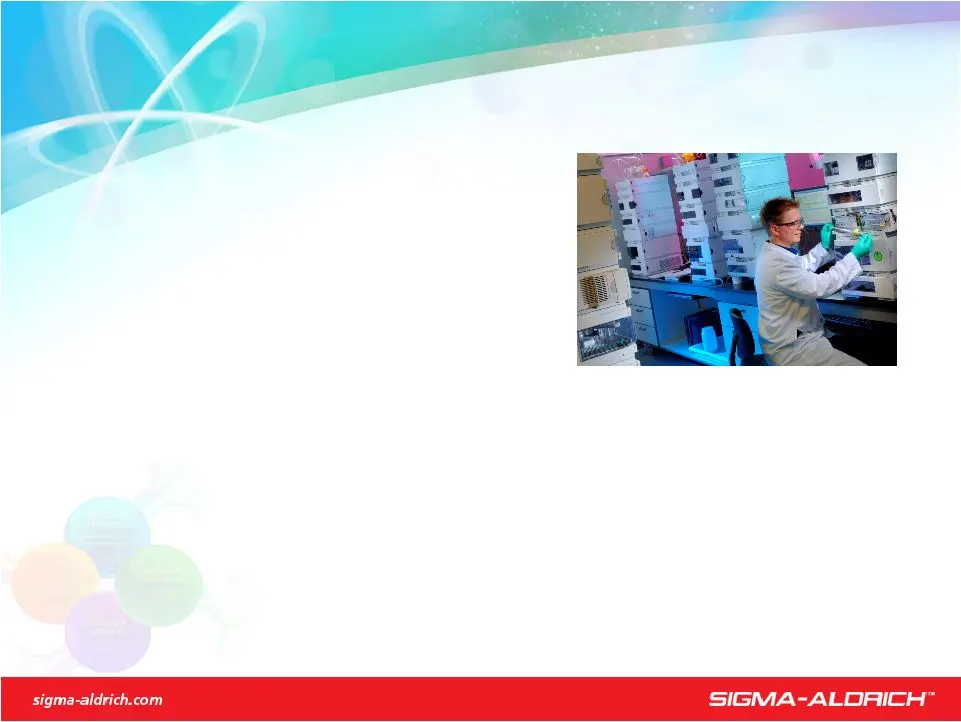
Research Essentials Market Overview Market - Growth ~ 2% - Size >$2.0 Billion - SIAL Share ~15 % Customer Requirements - Low Transactional Costs - Customized Service, Packaging, And Pricing - Responsive And Flexible Account Management - Support Customers Where The Work Gets Done Competitors - US And
Slide 31: Research Essentials Business Unit Overview
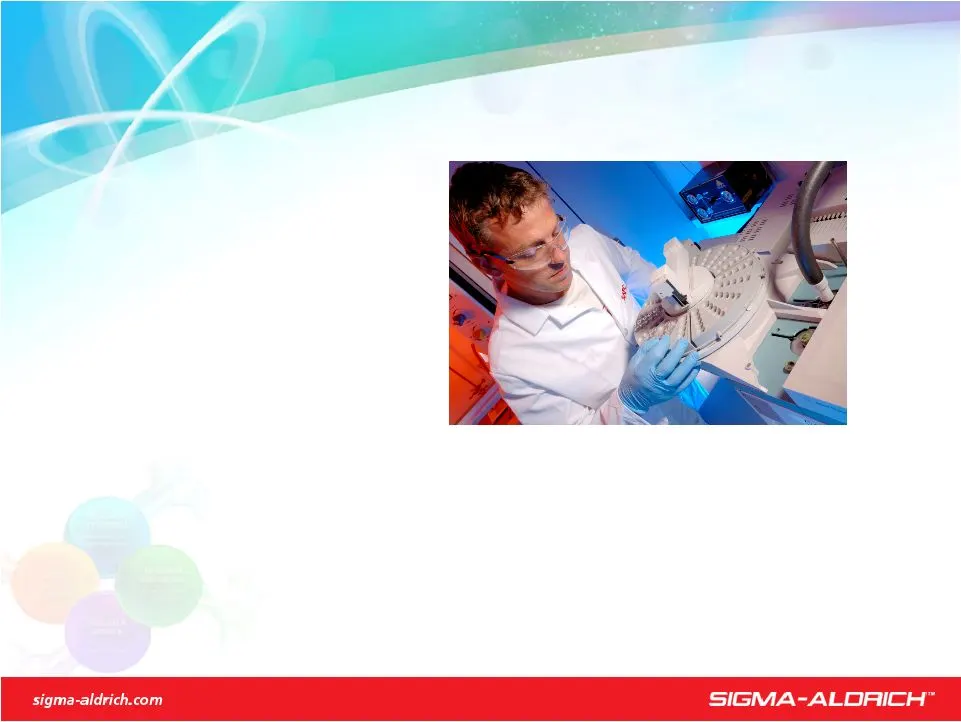
Research Essentials Is Our Base Business With Research Specialties Research Essentials Business Unit Overview ~10,000 Products $388 M Sales Competitive Pricing A Broad Customer Base With 80,000 Accounts Account Management is Key
Slide 32: Relationship Selling
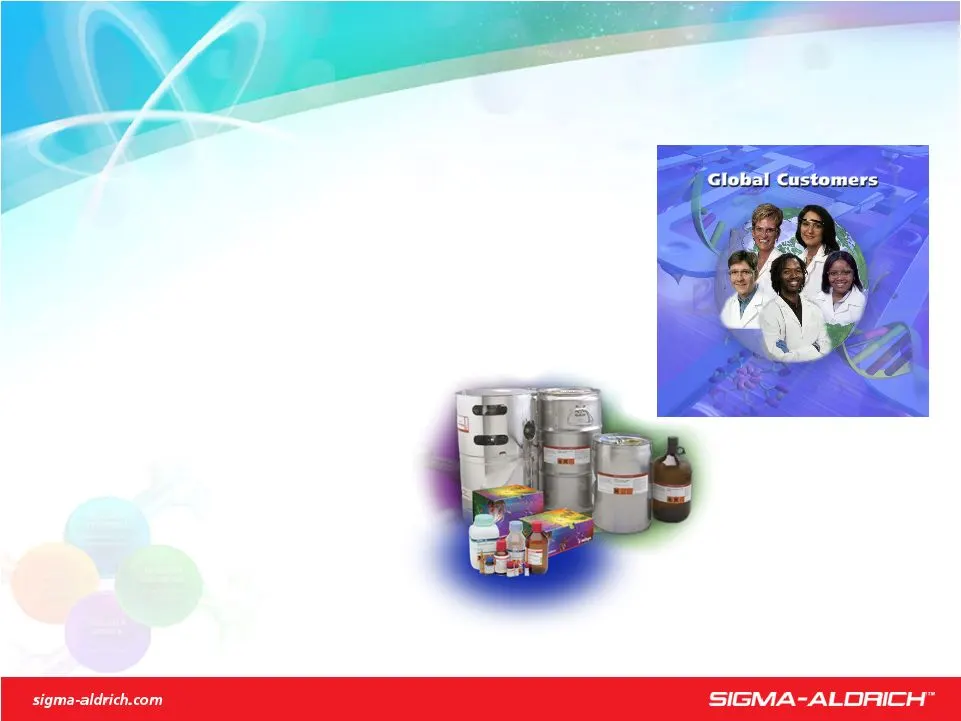
Relationship Selling Research Essentials Value Drivers Global Account Management Product Portfolio - Differentiated Pricing - Consistent Quality - Customization
Slide 33: Plan Globally-Service Locally
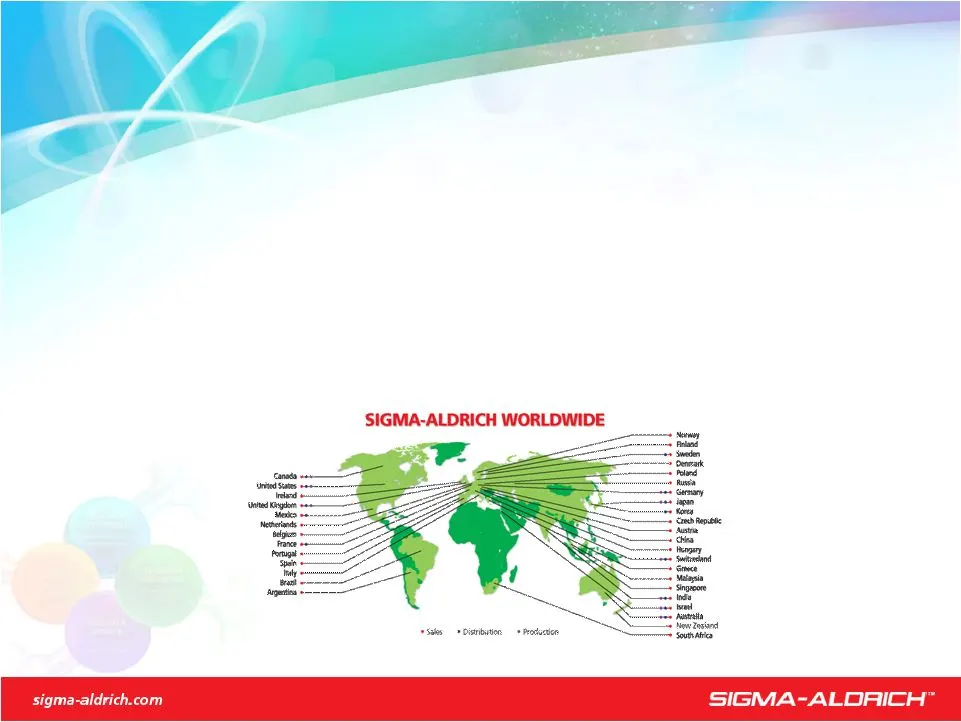
Plan Globally-Service Locally Research Essentials Value Drivers International Operations - Conduct Business In Local Languages - Supply Chain Enhancement - Support Customers Shift To Where The Work Gets Done

Slide 34: Focus On Global Innovation
Focus On Global Innovation Research Essentials Strategy Align Resources To Meet Changing Needs Of Our Largest Customers Create Value Through Business Solutions For Economic Buyer Leverage Our Global Presence And Common Systems Maximize Components Of Our Pricing Strategy Continue To Build Infrastruct
Slide 35: Take Market Share For Growth
Take Market Share For Growth Product Portfolio - Maximize Pricing Strategy - Differentiate Marketing Approach By Product Initiatives - Reduce Cost Through Supply Chain & OEM Initiatives Research Essentials Growth Opportunities And Tactics

Slide 36: Take Market Share For Growth
Take Market Share For Growth Leverage Global Presence - Enhance Service And Build Infrastructure In High Growth Economies With Aggressive Focus In China & India - Increase Use Of Selected International Locations To Support Our Overall Global Business Strategy - Build Organization Depth By Managing O

Slide 37: Leverage Strong Leadership Position
Leverage Strong Leadership Position Research Essentials Distinct Advantages Over Competitors Strong Global Brand Recognition Demonstrated Service & Process Improvement Culture Trusted Business Partner Established Global Presence Across Developed & Fast Growing Economies Common Systems Broad Product

Slide 38: Deliver Above-Target Growth
Deliver Above-Target Growth Research Essentials 2007 Results 2007 Results: 4.6% Sales Growth (Currency Adjusted) Key Drivers - Value Pricing, Product Initiatives, Account Management Focus - CAPLA - 20% Sales Growth Brazil, China & India Growing ~35 to 50% - Announced Plan To Build Hi-Tech Packaging

Slide 39: Take Market Share & Leverage Global Reach
Take Market Share & Leverage Global Reach Research Essentials 2008 Goals And Initiatives Sales Increase Goal - 4 to 5% Major Initiatives Product Portfolio : - Expand On Best Practices - Focus On Cell Culture - Drive OEM Supply Agreements CAPLA: - Add Distribution & Manufacturing Capabilities In Chin
Slide 40: Business Units Overview: Research Specialties
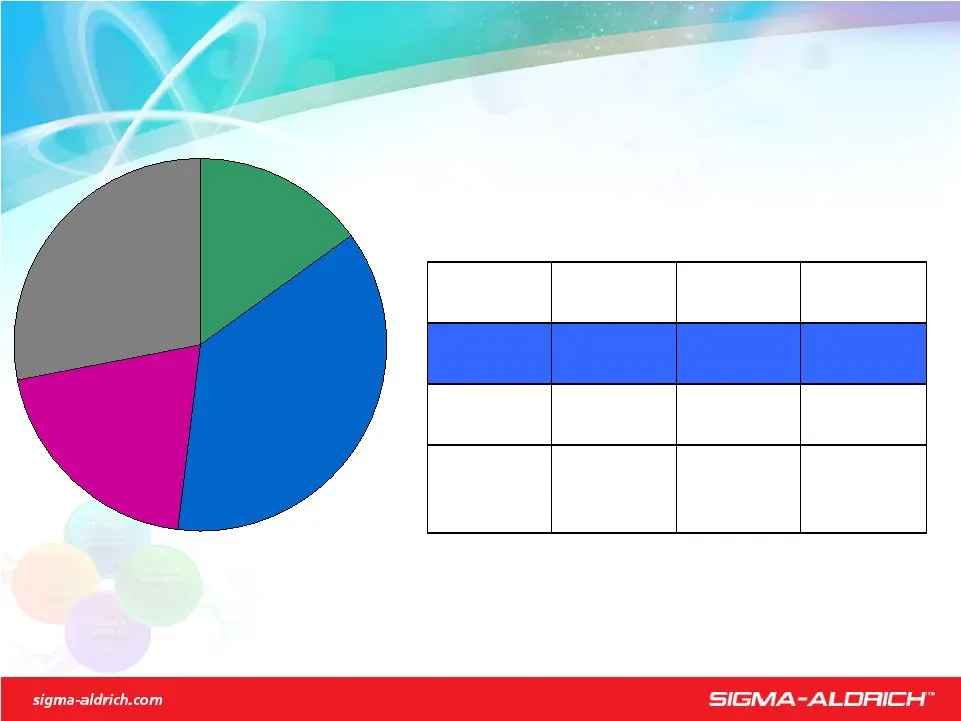
Research Specialties 37% ($761M) Research Essentials 19% ($388M) SAFC 29% ($591M Research Biotech 15% ($299M) Research Specialties Lab Scientists Transactional Selling 6% Innovative Solutions In Services & Products Research Specialties Business Units Customer Types Driving Forces Long-Term Growth Go
Slide 41: We Are The Leader
We Are The Leader Research Specialties Market Overview Market - Growth – 3 to 4% - Size >$2.5 Billion - SIAL Share ~ 30% Customer Requirements - Easy To Locate Products - Simple And Transparent Order Processes - Product Availability And Rapid Delivery Competitors - A Few Large Competitors - Numerous
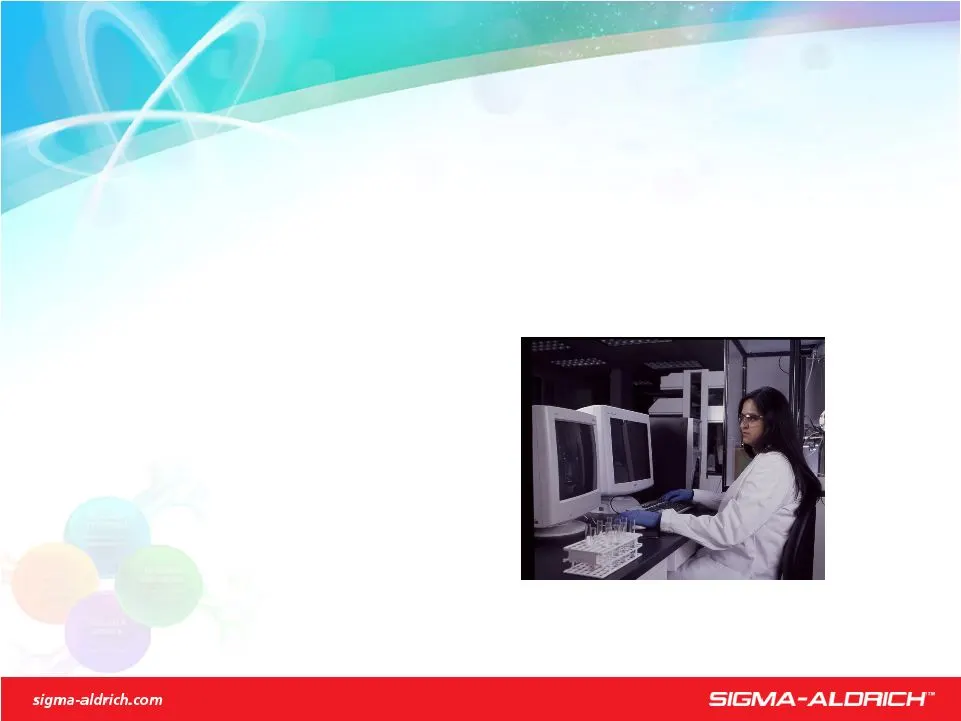
Slide 42: Research Specialties Business Unit Overview
Research Specialties Business Unit Overview ~100,000 Products $ 761 M Sales Mainly Sold At Catalog Prices, Low Discounts. High Margin, High Inventories 1M End Users Number 1 In Many Markets Internet And Catalog Are Key Research Specialties Is Our Base Business With Research Essentials
Slide 43: The Leader In Customer & Technical Services
The Leader In Customer & Technical Services Research Specialties Value Drivers Product Portfolio - Breadth Of Line - Specialty, Unique And Common Products - Innovative, New Products ~3,000 Per Year - Competitively Priced - Consistent Quality And Availability Internet, Catalog And Customer Service -

Slide 44: Revitalize Our Core Business
Revitalize Our Core Business Research Specialties Strategy Maintain #1 Market Position Enhance World-Class Internet Target Marketing Across Customers, Regions And Products Provide Innovative New Products And Differentiate Services Provide High Quality Products in Shortest Cycle Time Expand Geographi

Slide 45: Broadest Product Line Available
Broadest Product Line Available Research Specialties Growth Opportunities And Tactics Product Portfolio - Enhance Business Development Function - Increase Collaboration, Licensing, And Exclusive Relationships - Innovative New Products - Provide Innovative Services - Address Niche Market Opportunitie
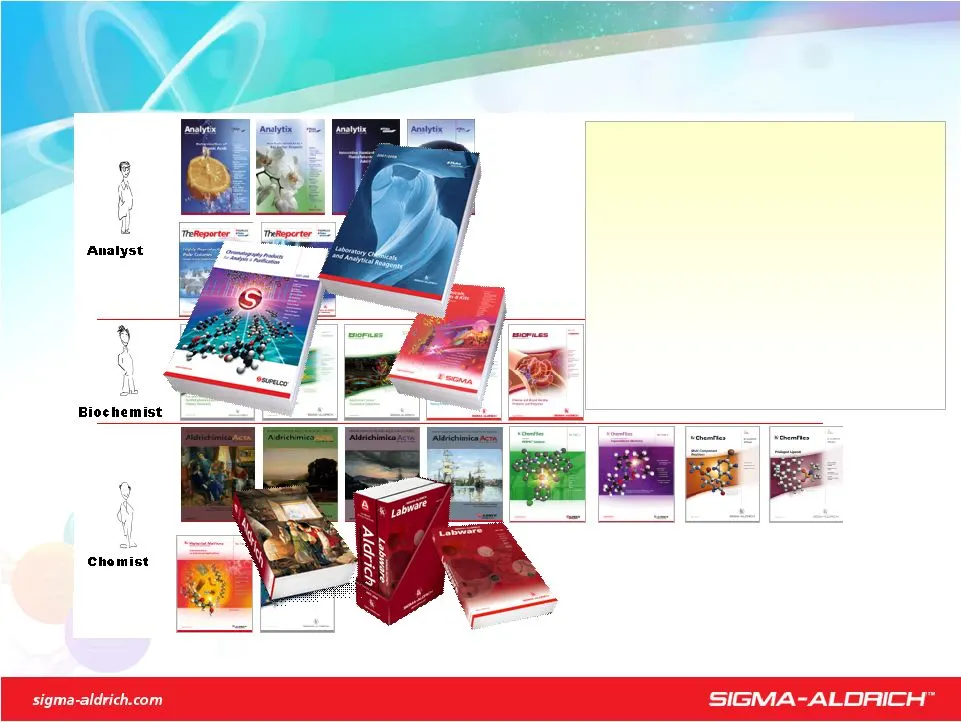
Slide 46: Recognized As #1 Catalogs In Market
Recognized As #1 Catalogs In Market Research Specialties Growth Opportunities And Tactics Our Firepower: Print Global Coverage 1 M catalogs/year 3 M newsletters, 30 issues/year Hitting the Target 1.6 M names, up to date, incl profiles Directed to specified “communities” Being Effective Well-recogniz
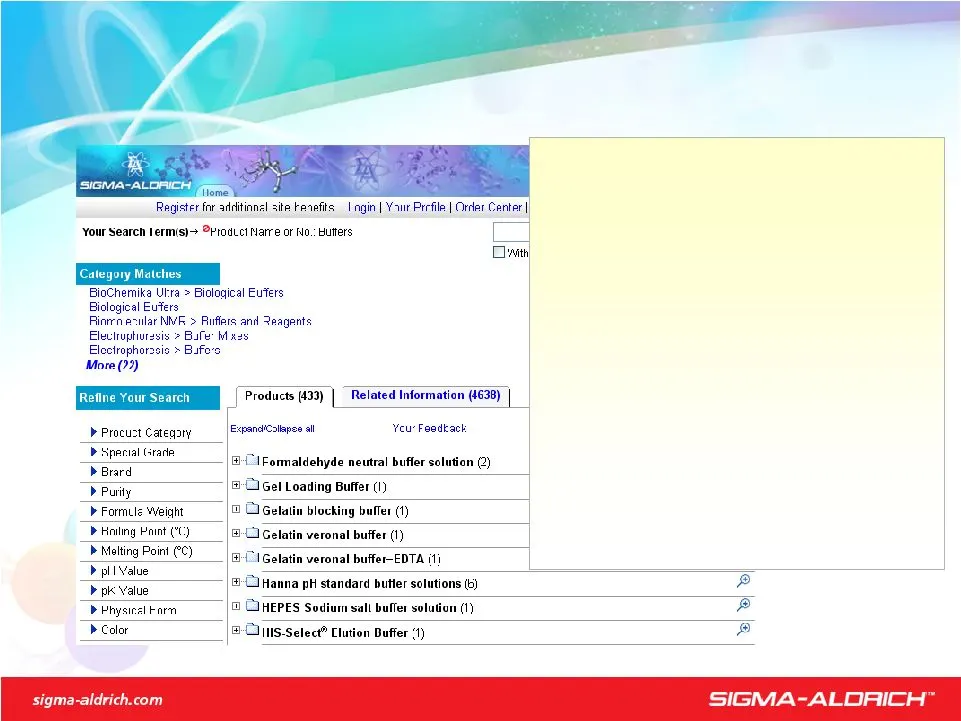
Slide 47: The Catalog Of The Future
The Catalog Of The Future Our Shopping Mall: The Web Number 1 Site in Research Industry: 23 M Visits In 2007 Extraordinary Search Capabilities 660K Registered Web Users 5 M E-Mails Search Engine Marketing Sponsored Ads, Collaboration Merchandising E-Commerce: $550 M Sales Research Specialties Growth
Slide 48: Extend Our Offering Of Products And Services
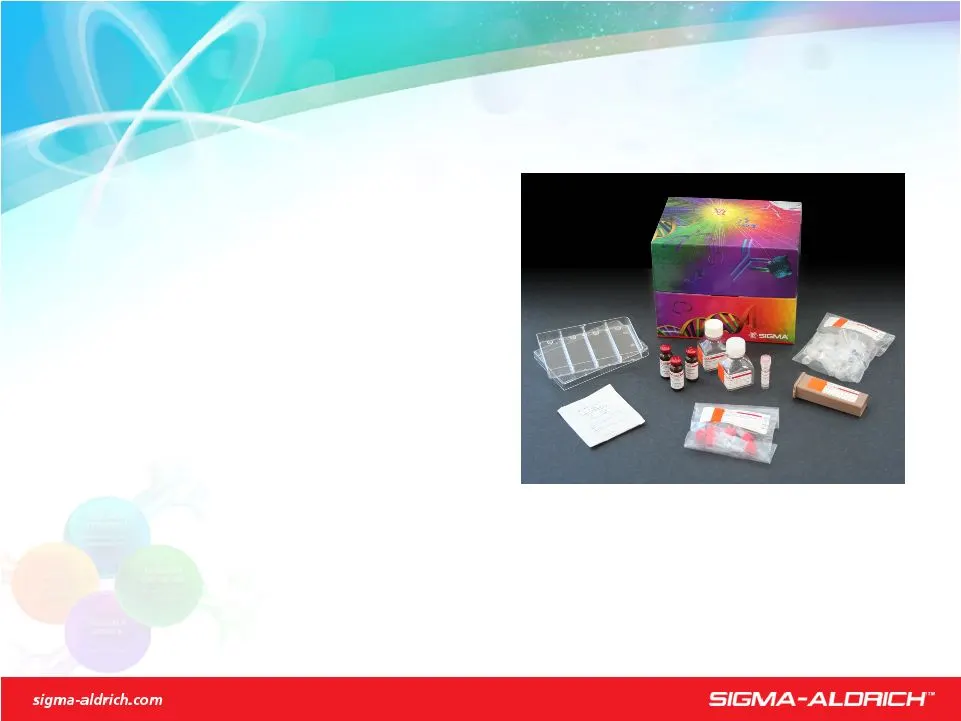
Extend Our Offering Of Products And Services New Products New “Solutions” And Services New Platforms/Collaborations - Ionic Liquids - Chem Dose Tablets - Hybrid Particle Technology - SAMS (Self-Assembly Materials) Acquisitions (IP/Companies) Research Specialties Growth Opportunities And Tactics Inno
Slide 49: Strengthen Our Leadership Position
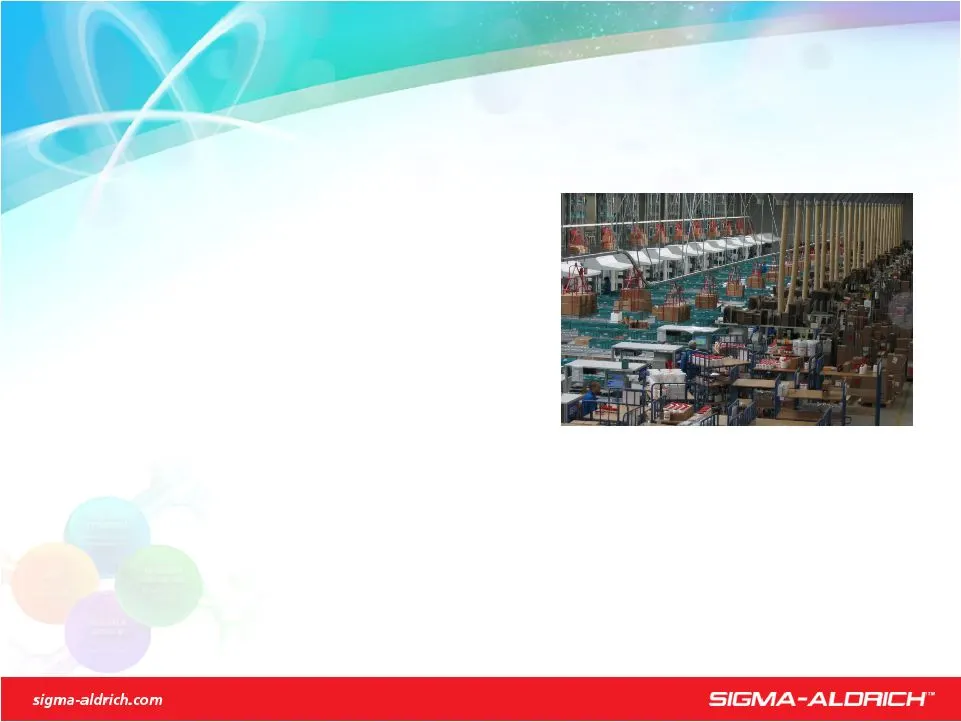
Strengthen Our Leadership Position Research Specialties Distinct Advantages Over Competitors Customer Communication - 1 Million Customer Contact Data - 660K Web Registration Internet, Catalog And Newsletter - 23M Internet Visits - 1M New Catalogs/Annually - 3M Newsletters/Annually Global Reach And S
Slide 50: Delivered Above Target Growth
Delivered Above Target Growth Research Specialties 2007 Results 2007 Results: 8.3% Sales Growth (Currency Adjusted) Key Drivers - New Services And Products - International Expansion - Price - Internet - Global Agreements/Relationships - Targeted Marketing

Slide 51: Continue To Add Services
Continue To Add Services Research Specialties 2008 Goals And Initiatives Products - Expand Attractive Groups; Selectively Add Resources Customer Communication - Refine Segment Ownership - Sales Development In Asia/Pacific (SAMS, Web, Print, Local Adaptions) - Drive Change From Print To Web - Improve
Slide 52: Business Units Overview: Research Biotech
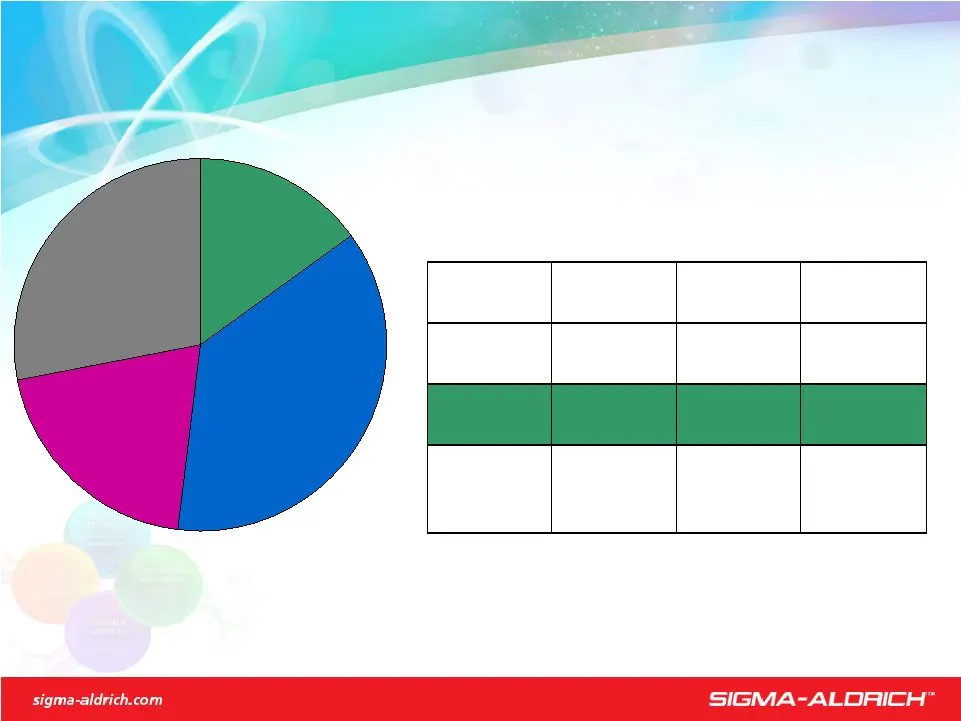
Research Specialties 37% ($761M) Research Essentials 19% ($388M) SAFC 29% ($591M Research Biotech 15% ($299M) Innovative Life Science Products Research Biotech Business Units Customer Types Driving Forces Long-Term Growth Goal Research Essentials Economic Buyers Relationship Selling 4% Research Spec
Slide 53: Continued Investment In Technology
Continued Investment In Technology Research Biotech Market Overview Market - Growth - 4-5% - Size – >$5.0 Billion - SIAL Share >5% Customer Requirements - Technology And Solution-Oriented Products - Data Associated With Products - Technical Sales And Support - Service And Quality Competitors - Invit
Slide 54: Continually Expand Technology Portfolio
Continually Expand Technology Portfolio Research Biotech Business Unit Overview ~20,000 Products $299 M Sales Product Innovation And Ease Of Use Key Internet Search Capabilities Required Intellectual Property Portfolio Facilitates Market Growth FTO Essential For Pharma Biotech R&D Capabilities Essen
Slide 55: Providing Innovative Solutions
Providing Innovative Solutions Research Biotech Value Drivers Product Portfolio - Enabling - Validation Data - Timesaving And Convenience Sales, Marketing and Business Development - “White Coat” Selling With A Technical Sales Force - Access to Knowledge ( Scientists) - Applications Marketing On The

Slide 56: Lead With Break Through Products
Lead With Break Through Products First To Market With Innovative, Solution Oriented Products Focus On The Drug Discovery Workflow Increase Value Of Existing Product Lines By Adding Scientific Data To Our Products - Antibodies- Prestige Program - Application Data - Ingenuity Target Market Sub-Segment
Slide 57: Broad Opportunities In Biotechnology
Broad Opportunities In Biotechnology Research Biotech Growth Opportunities And Tactics Emerging Market Sub-Segments (Genomics/Proteomics/Functional Genomics) Large Pharma And Biotech Projects Custom Collaborations - Technology Access Programs Recent Acquisitions And Licensed Technologies - Sangamo -
Slide 58: Innovation Is A Facilitator To Our Strategy
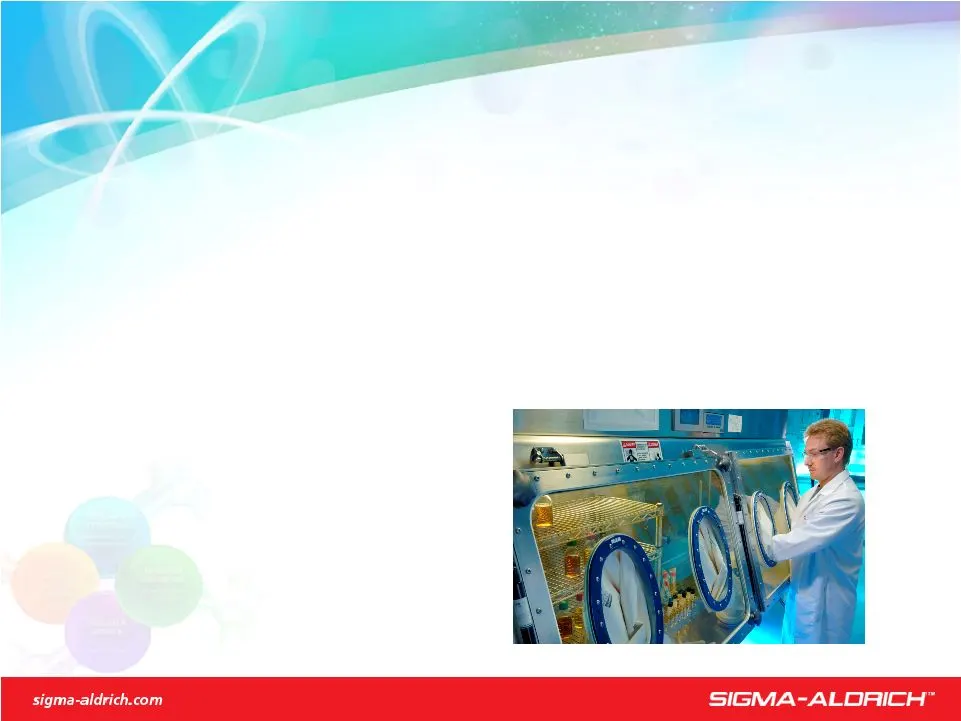
Innovation Is A Facilitator To Our Strategy Gene Editing Technology-Sangamo Epigenetics-Epigentik Web Based Content- Ingenuity Antibodies That Are Validated With Science-Atlas VC investments To Put A Stake In Horizon III Technologies And Markets Research Biotech Growth Opportunities And Tactics
Slide 59: Broad Search Selections Improve Customer Experience
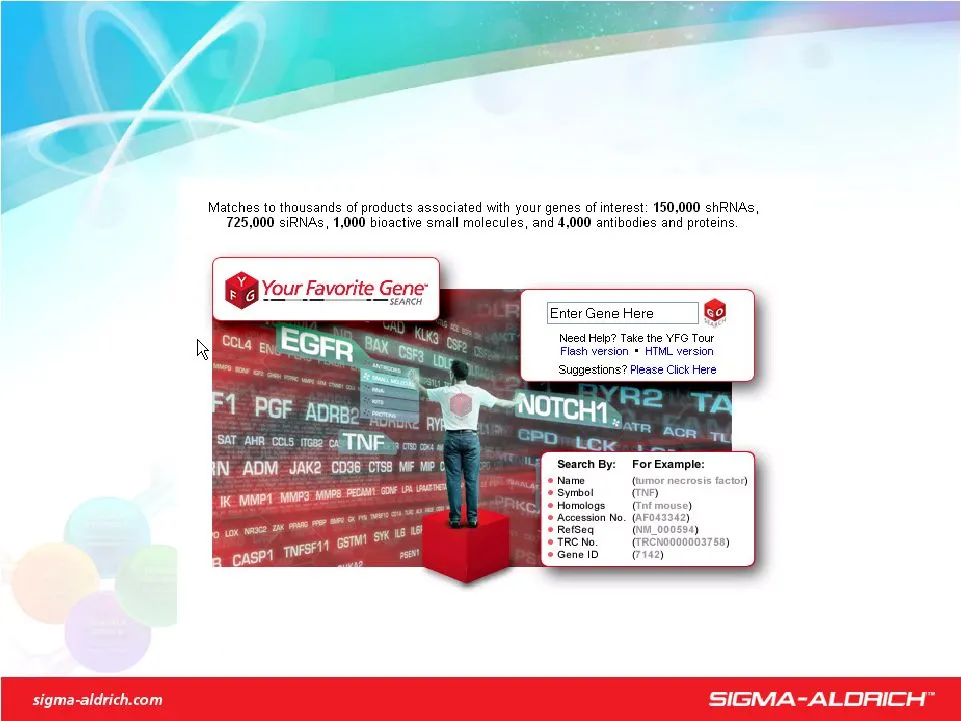
Broad Search Selections Improve Customer Experience Drive Awareness Of New Products With Scientific Content On The Web Research Biotech Growth Opportunities And Tactics
Slide 60: Ingenuity: Adding Content To Search
60 Ingenuity Adding Content To Search Research Biotech
Slide 61: Partnership With Sangamo
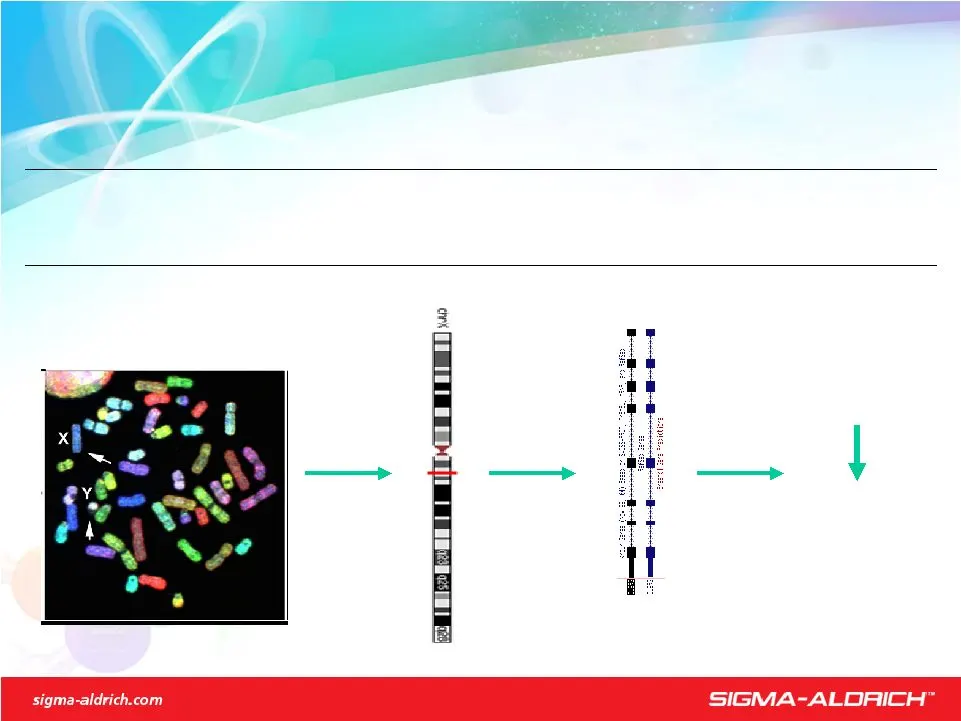
Partnership With Sangamo Gene Modification - Ultimate Gene Silencing! - Correction ; Disruption ; Insertion Gene Editing Within A Living Cell P : CCA L 230: CTC Targeting A Genomic Location With Base Pair Resolution Research Biotech Growth Opportunities And Tactics
Slide 62: Technology Through Collaborations
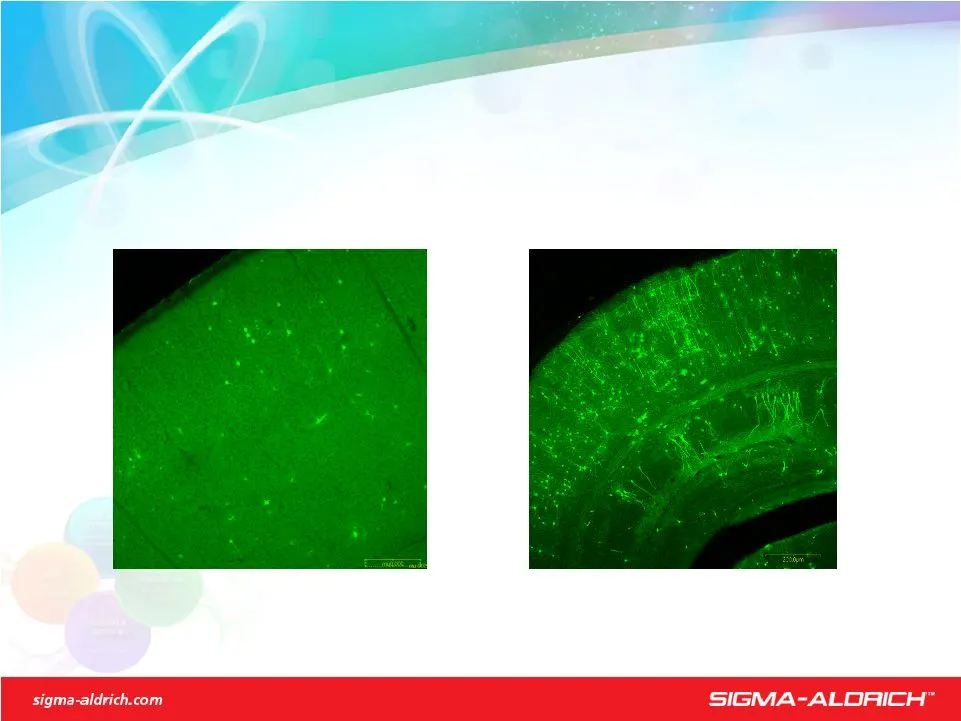
Technology Through Collaborations Example: Custom Lentivirus Production For In Vivo Uses Media Alone GFP-Lentivirus Purified For In Vivo Utilization Rat Brain – Injections On Day E15 Innovative Technology Provide Enabling Products Research Biotech Growth Opportunities And Tactics
Slide 63: Invest In Venture Capital Opportunities
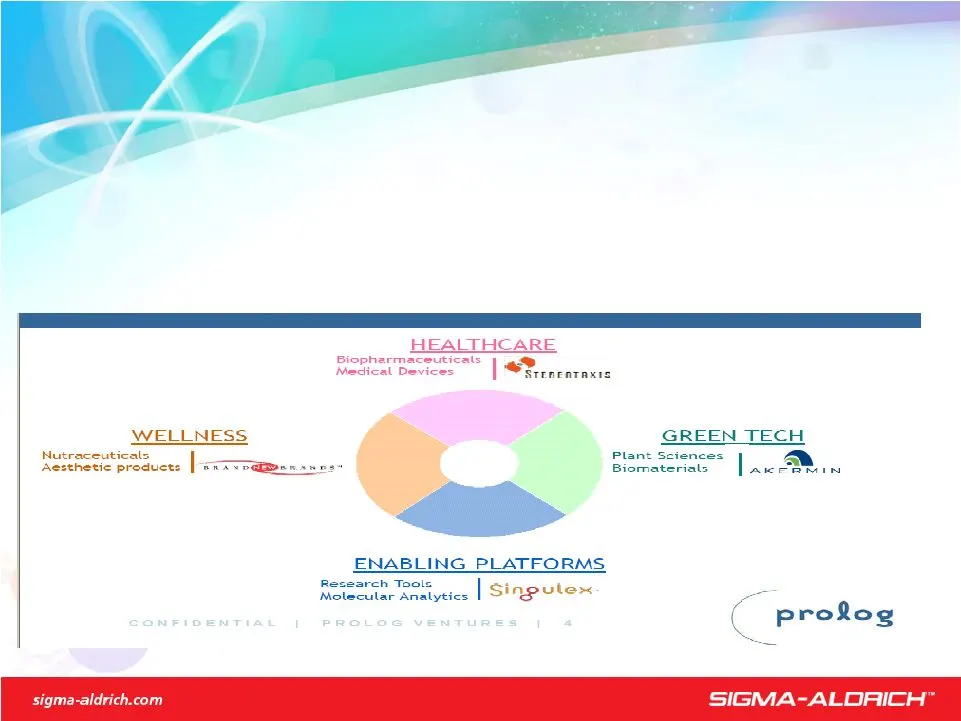
Invest In Venture Capital Opportunities Strategic Partner Investment In Prolog Ventures •Early Stage Life Science Venture Fund •Access To Deal Flow For 2 nd And 3 rd Horizon Technologies •Early Look At Potential Acquisitions And Emerging Markets •Introduction To Thought Leaders And Entrepreneurial T
Slide 64: Broadest Capabilities In Gene To Drug Spectrum
Broadest Capabilities In Gene To Drug Spectrum Research Biotech Distinct Advantages Over Competitors Broad Access To Customers/Collaborators Expanding And Exclusive Internet Content And Capabilities In Depth Expertise Across The Research Workflow Widest IP Portfolio In Gene Silencing First To Market
Slide 65: Growth Accelerated Later In 2007
Growth Accelerated Later In 2007 Research Biotech 2007 Results 2007 Results: 3.7% Sales Growth (Currency Adjusted) Key Drivers - Strong Growth In Genomics and Functional Genomics - Slow Growth In Genosys - New Technologies Gaining Traction

Slide 66: Increase Technical Focus In Products And Sales
Increase Technical Focus In Products And Sales Research Biotech 2008 Goals And Initiatives Continued Focus On Pharma/Biotech Major Growth Opportunities With Gene Silencing Products Key New Product Launches In Genomics, Functional Genomics, Cell Signalling Add Science To Our Products - New Web Conten
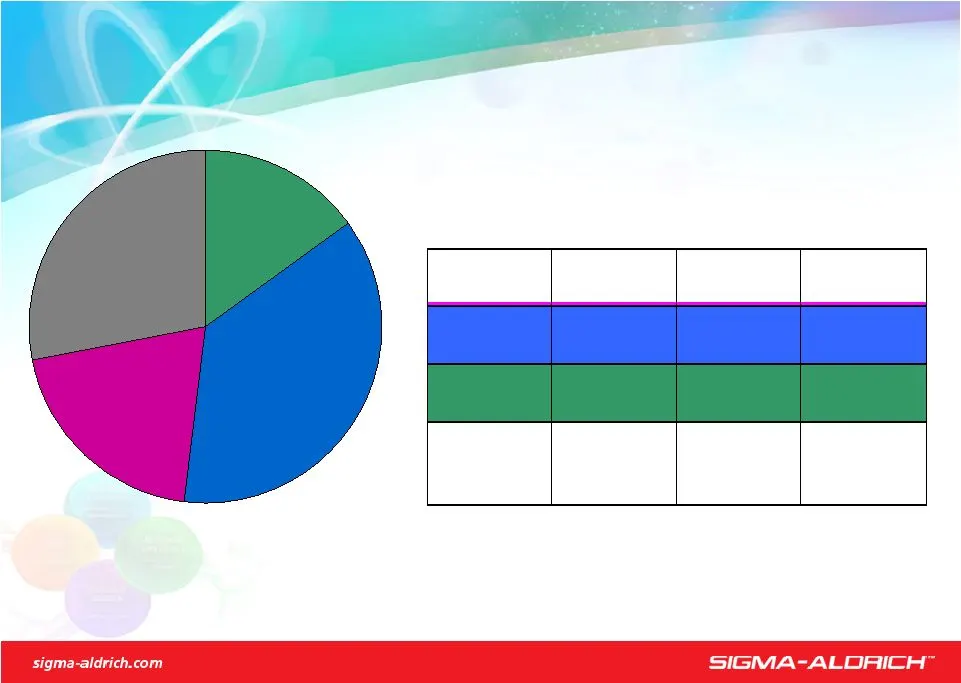
Slide 67: SIGMA-ALDRICH
SIGMA-ALDRICH
Slide 68: Research Sales: Changing Landscape In Key Market Segments
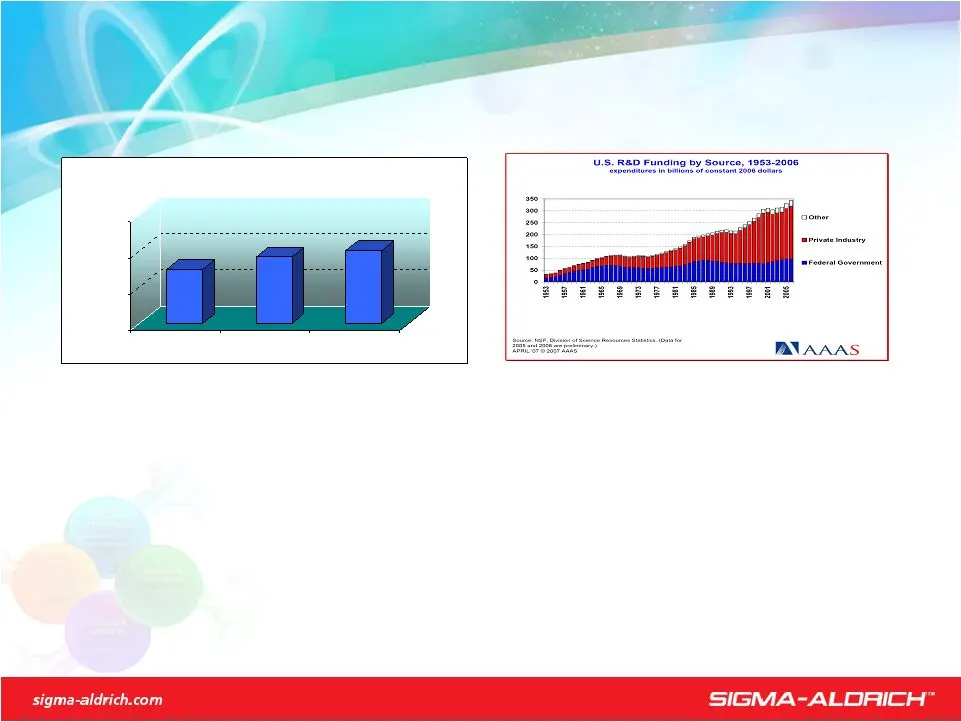
Research Sales Academia & Pharma Trends Changing Landscape In Key Market Segments Source: AAAS Reports I through XXXII, based on OMB and agency R&D budget data – Revised April, 2007. Includes conduct of R&D and R&D facilities. Government Funding Decreasing, Becoming More Focused Collaborative Indust

Slide 69: Research Sales: Changing Landscape
Research Sales Changing Landscape Trends Pharma: Consolidations, Weak Research Academia: Decreasing Funding Internet: Ready Availability Of Information Customer Behavior Doing More With Less Increased Collaborations Creation Of Centers Of Excellence Increased Levels Of Outsourcing Partnerships & All
Slide 70: Challenge in Customer Engagement
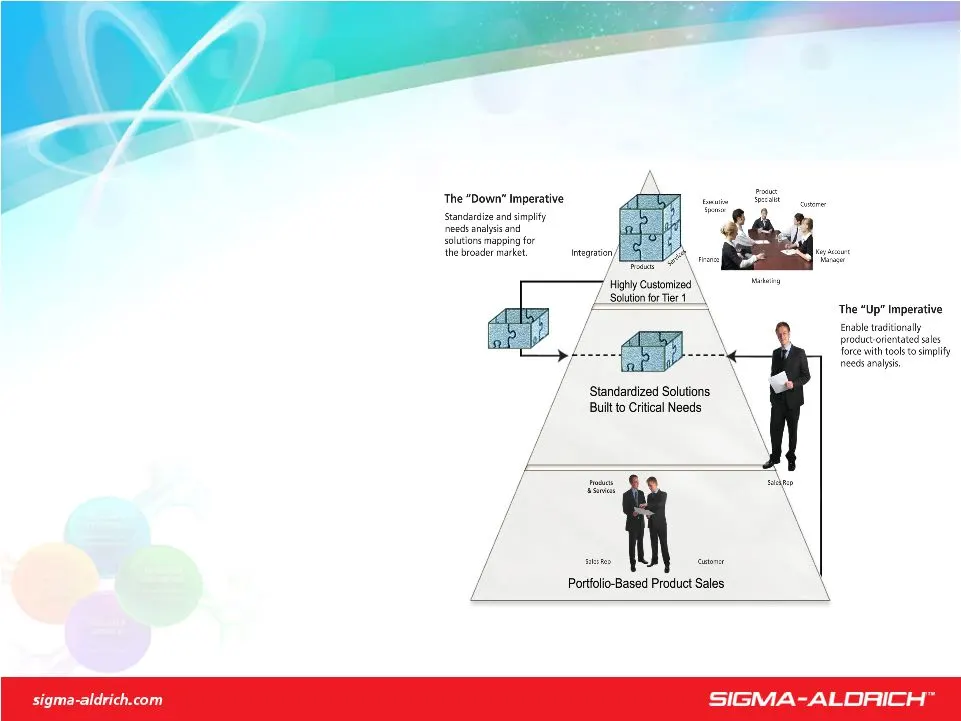
Research Sales Challenge in Customer Engagement Needs Analysis Often Fails Without Resource Intensive Support... … Requiring A Simplified Sales Approach To Achieve Customer Engagement In The Majority Of The Market Source: Sales Exec Council
Slide 71: Communicate The Value Proposition
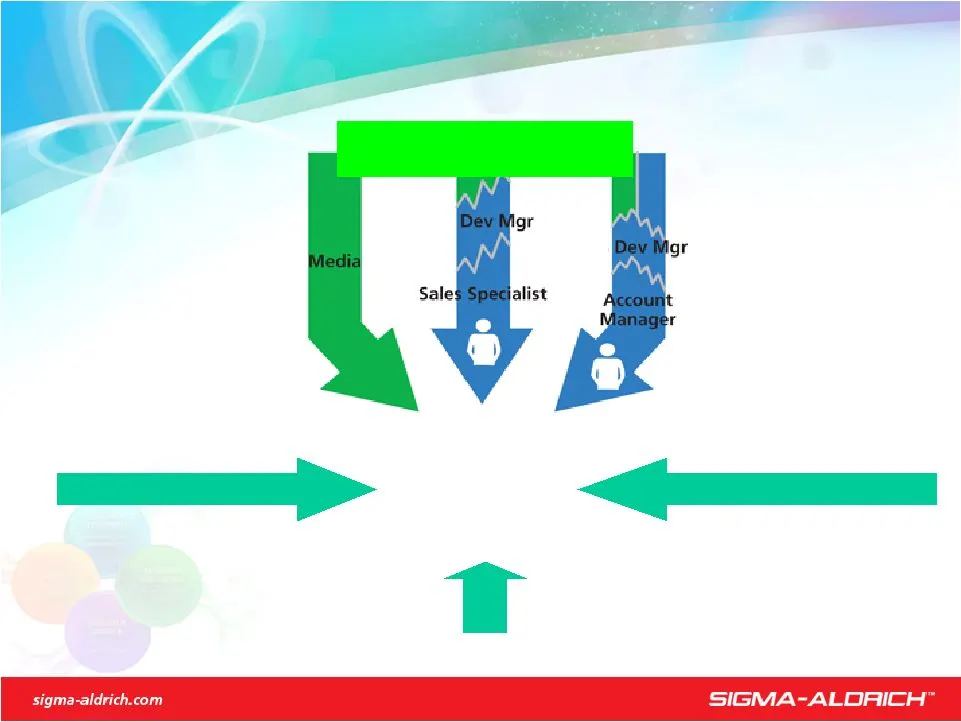
Communicate The Value Proposition Sales Sales CUSTOMER Communication Mix Products & Services Logistics Price, Discount, T&C Research Sales Value Drivers

Slide 72: Comprehensive Relationship With Key Accounts
Comprehensive Relationship With Key Accounts Research Sales Strategy Align Sales Resource – Account Managers & Sales Specialists To Better Capitalize On Sales Opportunities - Promote Innovative & Value Added Solutions (Business, Product and Application) - Address Total Cost of Ownership - Strive For

Slide 73: Act Globally - Differentiate Approach By Customer
Act Globally - Differentiate Approach By Customer Research Sales Growth Opportunity And Tactics Account Management (Global, Regional, Local) - Differentiate Products And Services Through Customized Business Solutions - Improve Customer Interaction Through Sales Analytics To Increase Sales Effectiven
Slide 74: Combined Approach Enhanced Sales Growth
Combined Approach Enhanced Sales Growth Research Sales 2007 Results High Single Digit Growth With Our 3,000 Worldwide Managed Accounts Low Double Digit Growth In Several Life Science And Analytical Segments, Innovative Technologies Slower Then Expected Increased Demand For Customized Solutions Offic

Slide 75: Increase Activities With Managed Accounts
Increase Activities With Managed Accounts Research Sales 2008 Goals & Initiatives Managed Accounts Goal 7+ % - Expand On New And Innovative Business Solutions - Focus On Largest Customers & Biotech Accounts - Leverage Differentiated Technology Selling Approach Focus On Innovative Technologies/Produc
Slide 76: Business Units Overview: SAFC
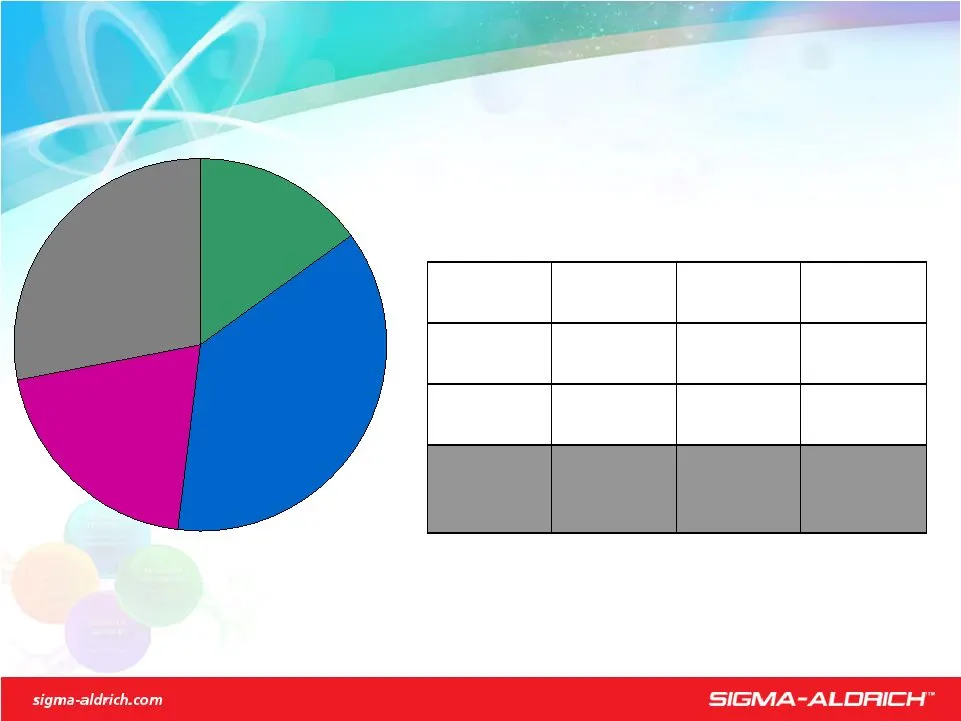
Research Specialties 37% ($761M) Research Essentials 19% ($388M) SAFC 29% ($591M) Research Biotech 15% ($299M) SAFC Project & Development Managers Customer Intimacy >10% SAFC Business Units Customer Types Driving Forces Long-Term Growth Goal Research Essentials Economic Buyers Relationship Selling 4

Slide 77: Changing Market Dynamics Provide Opportunities
Changing Market Dynamics Provide Opportunities SAFC Market Overview Market - Size - $50 Billion - Growth – 2-3% - SIAL Share – Top 10 Player Customer Requirements - Products From Stock: Quality, Availability and Price - Make To Order: On-Time, On Quantity, On Quality, Solution Provider - Serum Free
Slide 78: Expanding SAFC's Capabilities
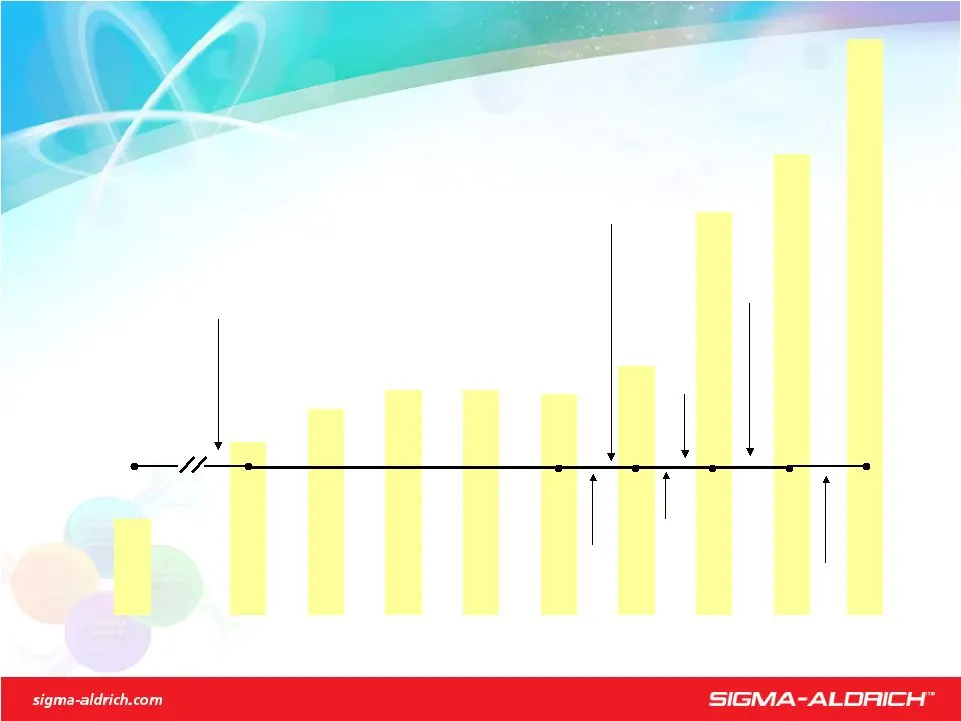
Expanding SAFC's Capabilities SAFC Business Unit Overview Fine Chemicals Division Organized Operational Improvements 1999 Strategic Plan Strategic Plan JRH & Proligo Acquired SAFC Branded Ultrafine & Tetrionics Acquired Iropharm & Pharmorphix Acquired Epichem & MMB Acquired

Slide 79: Provide World-Class Chemistry And Biochemistry Support
Provide World-Class Chemistry And Biochemistry Support SAFC Value Drivers Small Molecule API And Biologic Drug Products Technical Expertise Industry Leading Project Mgmt SAFC Pharma Complex Custom Development & Manufacturing 20% SAFC Supply Solutions Customized Raw Materials Broad Range Of Raw Mater

Slide 80: Exceed Customer Expectations
Exceed Customer Expectations SAFC Strategy Gain Market Share In High Growth Segments Through Exceeding Customer Expectations Seek Niche Technology Opportunities To Expand The Current Capability Profile Strengthen Existing Skills As The Responsive Experts To The Biopharmaceutical Industry Continued F
Slide 81: Be The Industry Leader In Development And Manufacturing Services
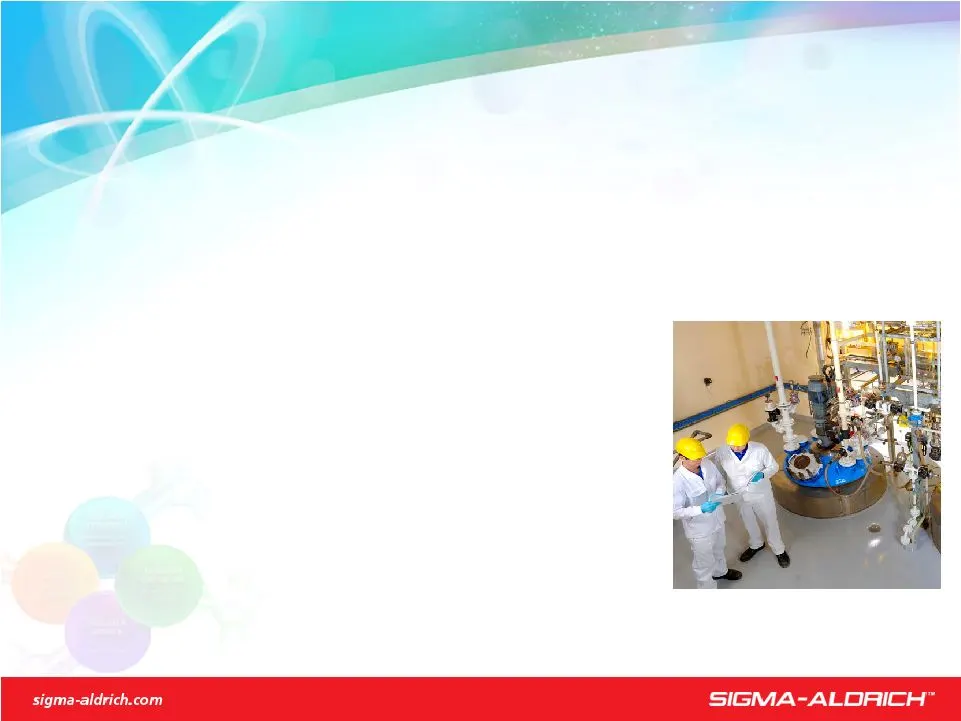
Be The Industry Leader In Development And Manufacturing Services SAFC Pharma Growth Opportunities And Tactics - Novel Excipients & Adjuvants - Bacterial & Fungal Fermentation - Analytical Services & Development - Animal or Plant Sourced API’s - Chiral Separations - Viral Drug Product - Medicinal Che

Slide 82: Be The #1 Supplier To The Biopharmaceutical Industry
Be The #1 Supplier To The Biopharmaceutical Industry SAFC Biosciences Growth Opportunities And Tactics Focus On Supplying Cell Culture Based Critical Raw Materials Through - Increasing Customer Intimacy - Capturing Early and Late Stage Clinical Projects - Continuing To Develop And Offer Single Use D
Slide 83: Be A Total Supply Chain Partner
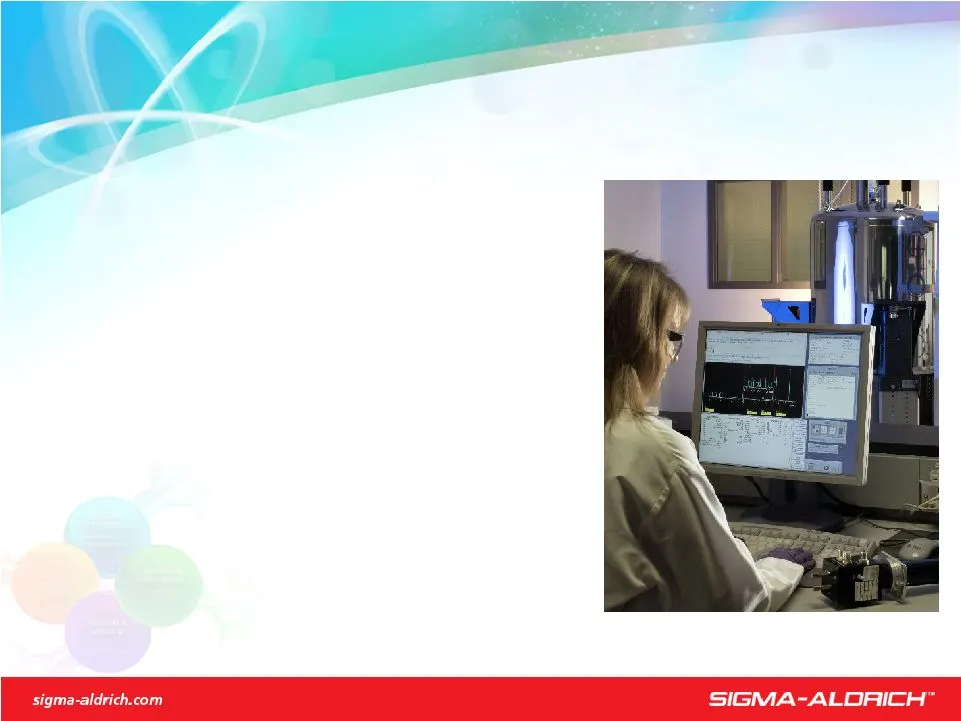
Be A Total Supply Chain Partner SAFC Supply Solutions Growth Opportunities And Tactics Target Market Segments With Enhanced Quality And Customized Solutions - Production Raw Materials - Services Across The Supply Chain - Solution Provider - Enhanced Quality Systems
Slide 84: Be An Innovator In New Technologies
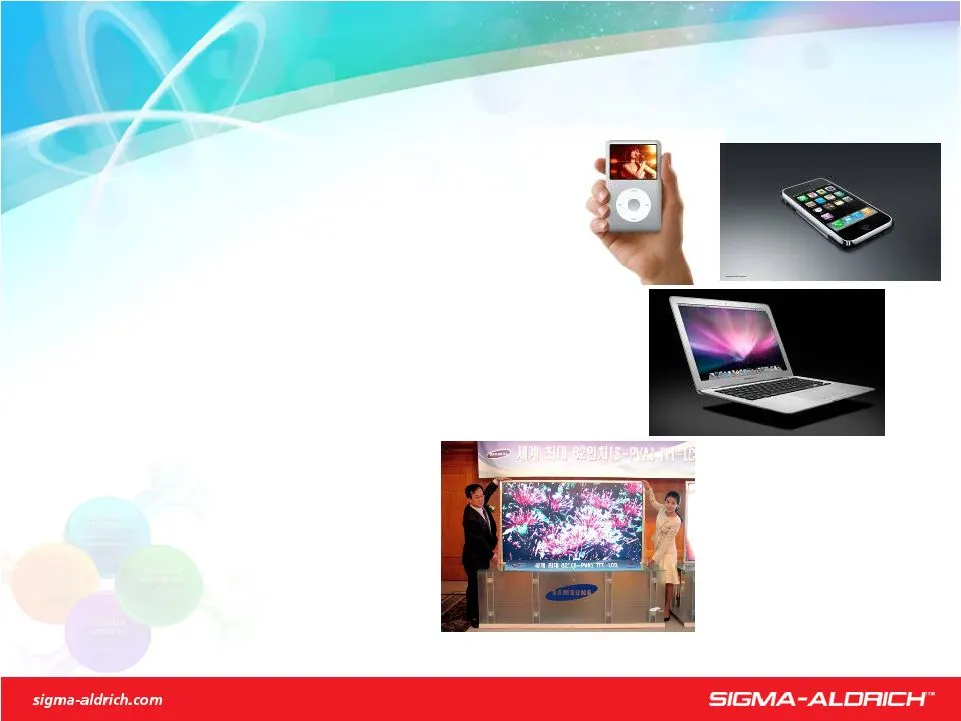
Be An Innovator In New Technologies SAFC Hitech Growth Opportunities and Tactics Focus On Collaborative Chemistry Services Enabling Future Technology For Performance Materials - Compound Semiconductor Markets - Silicon Semiconductors - Large Area Displays - Photovoltaics

Slide 85: Unrivalled Scientific Knowledge & Global Reach
Unrivalled Scientific Knowledge & Global Reach SAFC Distinct Advantages Over Competitors Breadth, Depth and Diversity of Chemical Knowledge Expanding Technology Offering Strong Project Management Global Infrastructure Financial Stability

Slide 86: Vast Range Of Capabilities Drives Growth
Vast Range Of Capabilities Drives Growth SAFC 2007 Results 2007 Results: 14.7% Currency Adjusted Sales Growth; (7.1% Adjusted For Currency And Epichem Acquisition) Key Drivers: - Continued Strong Performance Of Supply Solutions - Organic Pharma Growth >20% - CAPLA Region Double Digit Growth - Biosci

Slide 87: New Activities / Capacity To Increase Growth Rate
New Activities / Capacity To Increase Growth Rate SAFC 2008 Goals and Initiatives Sales Increase Goal – 8 to 9% Major Initiatives: Implement A Global Accounts Strategy Complete Capacity Expansion Initiatives Continue To Resource And Train In High Growth International Areas Fuel Growth In Hitech Expa

Slide 88: Five Key Initiatives
Initiatives Set Actions For 2006 - Building For The Future 1. Align Structure With Customers And Markets 2. Expand In Faster Growing Geographic Markets 3. Build On Internet Superiority 4. Leverage Process Improvement For Excellent Investment Returns 5. Fill Growth Target Through Acquisitions Five Ke
Slide 89: Sales Growth (Reported)
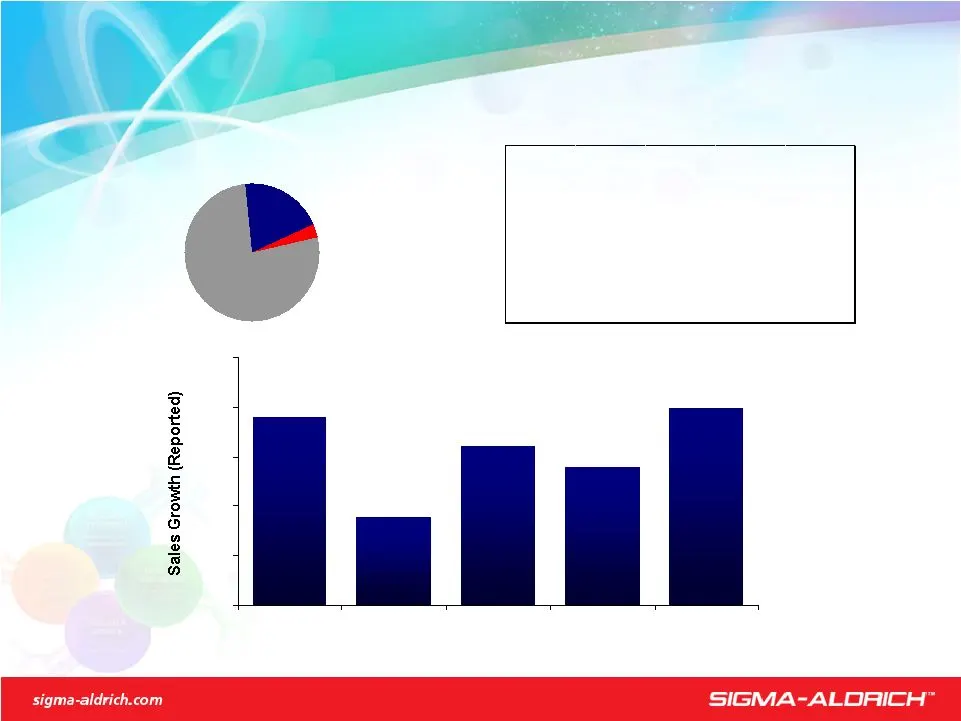
Sales Growth (Reported) SIGMA-ALDRICH

Slide 90: CAPLA: 25% Of Total Sales By 2010
CAPLA 25% Of Total Sales By 2010 CAPLA 2007 Sales USA & Europe 78% CAPLA 20% Exports to CAPLA 2% 19% 9% 16% 14% 20% 0% 5% 10% 15% 20% 25% Brazil 34% China 35% India 50% Faster Growing Markets (2007 Reported Sales Growth):

Slide 91: Buuneney COO °
Buuneney COO ° uopnqysia # 9 Oe CS © FOO seg @ COC HOCCOCBE DE

Slide 92: Innovative Customer Solutions
Innovative Customer Solutions Revitalize Japan Sales - Infrastructure In Place To Support Growth - Increase Research Direct End User Selling - Leverage Price Strategy To Increase Margin Localize Products And Services - Expand Local OEM Of High Volume Essentials And Difficult To Transport Items - Dev
Slide 93: Doubled Sales Between 2005 & 2007 - Employees
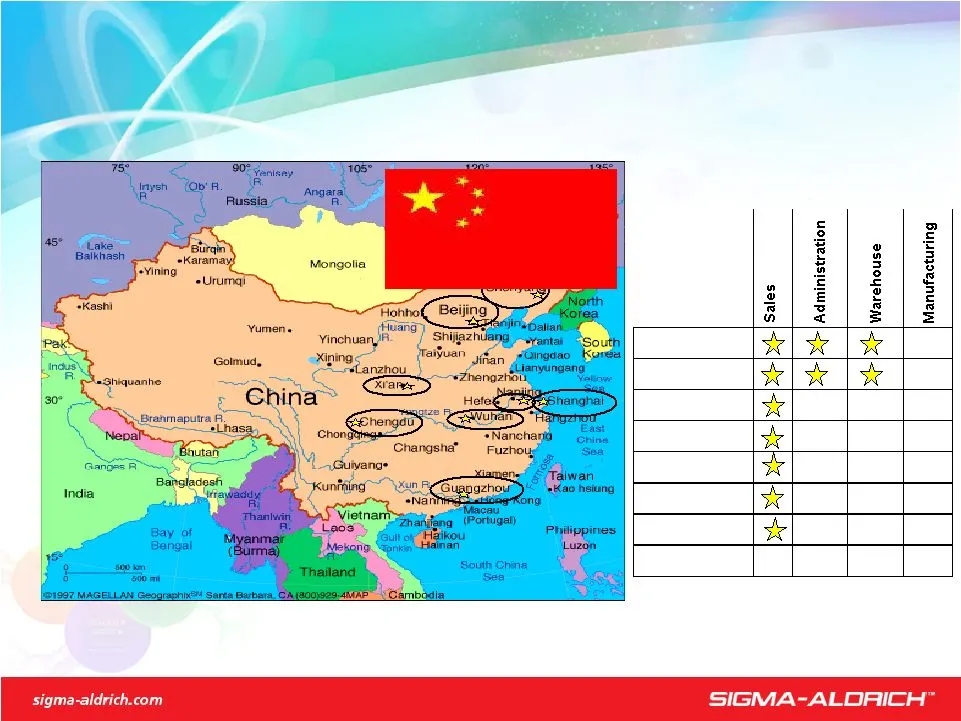
Doubled Sales Between 2005 & 2007 - 100 Employees Wuxi CAPLA Increase Presence in Rapidly Growing Countries Shanghai Beijing Guangzhou Shenyang XI'an Wuhan Chengdu Wuxi (New Site)
Slide 94: Doubled Sales Between 2005 & 2007 - Employees
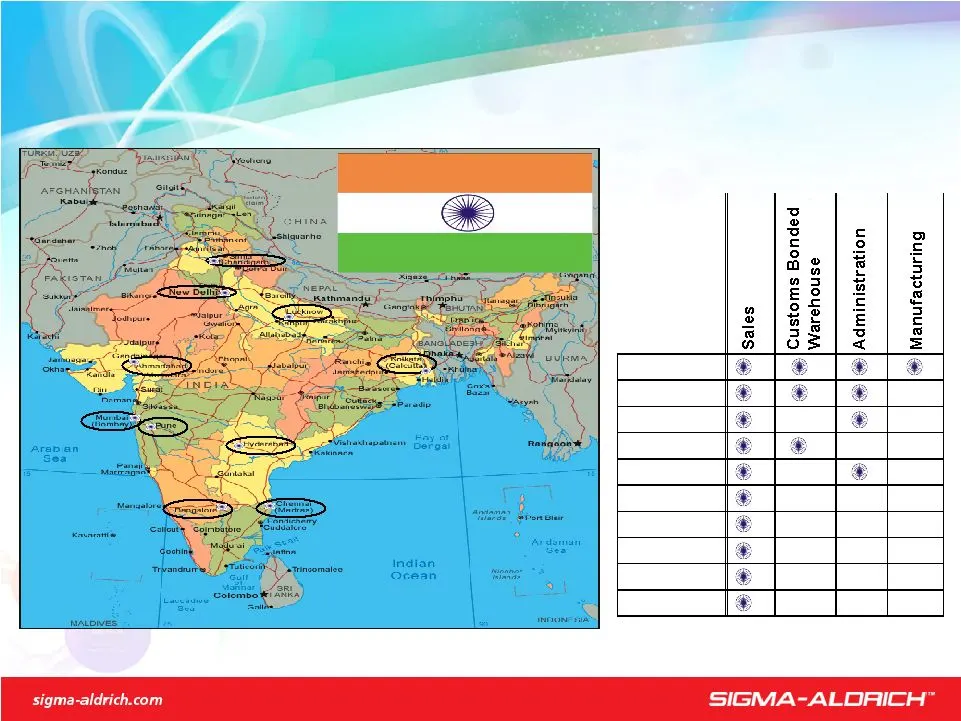
Doubled Sales Between 2005 & 2007 - 200 Employees CAPLA Increase Presence in Rapidly Growing Countries Bangalore Hyderabad Mumbai Kolkata New Delhi Q2 08 Pune Lucknow Chandigarh Chennai Ahmadabad

Slide 95: Geographic Expansion
Geographic Expansion Leverage Our Geographic Reach To Extend New Products And Services Continue Aggressive Review Of Targets In Rapidly Growing Markets - Will Continue To Be Judicious On The Evaluation Successful Integration Of Acquisitions With Assets In CAPLA CAPLA Increase Acquisitions, Partnersh

Slide 96: Operational Excellence
Operational Excellence Expand Infrastructure To Manage Growth - Increase Infrastructure in Rapidly Growing Markets To Support Local Customers - Develop Operations In New Geographic Markets Focus On Customer Service Enhancements - Continue To Accelerate Collaboration With Contract Research Organizati

Slide 97: CAPLA 25% Of Sales By 2010
CAPLA 25% Of Sales By 2010 CAPLA Plan Is On Track – Continue To… Accelerate Growth In Rapidly Growing Countries Add Local Products And Services To Meet Customers’ Needs Increase Infrastructure To Support Growth Leverage Process Improvement To Drive Profitability And Innovation Develop Local Talent C

Slide 98: Five Key Initiatives
Initiatives Set Actions For 2006 - Building For The Future 1. Align Structure With Customers And Markets 2. Expand In Faster Growing Geographic Markets 3. Build On Internet Superiority 4. Leverage Process Improvement For Excellent Investment Returns 5. Fill Growth Target Through Acquisitions Five Ke
Slide 99: eCommerce Sales
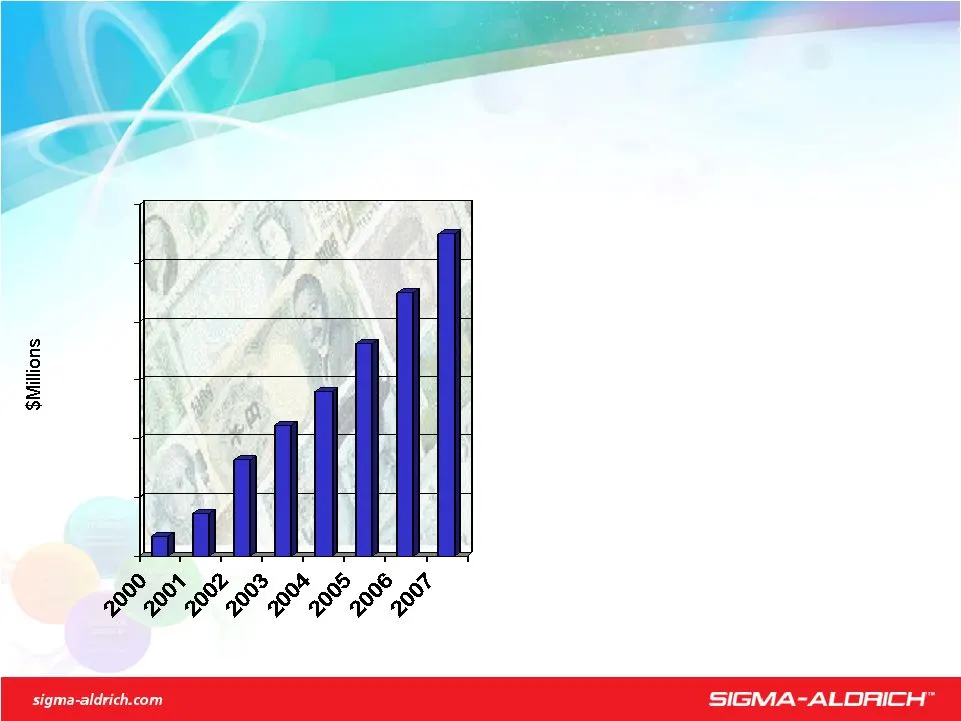
eCommerce Sales Using ‘e’ to Integrate With Customer Processes $550 Million In “e”Sales For 2007 ~40% Of Sigma-Aldrich Research Sales Now Transacted Electronically System-To-System (B2B) Integration Linking Deeper Into Customer Business Processes: Evolution Beyond “e” Orders International eCommerce
Slide 100: Leverage Content - The Conversion Funnel
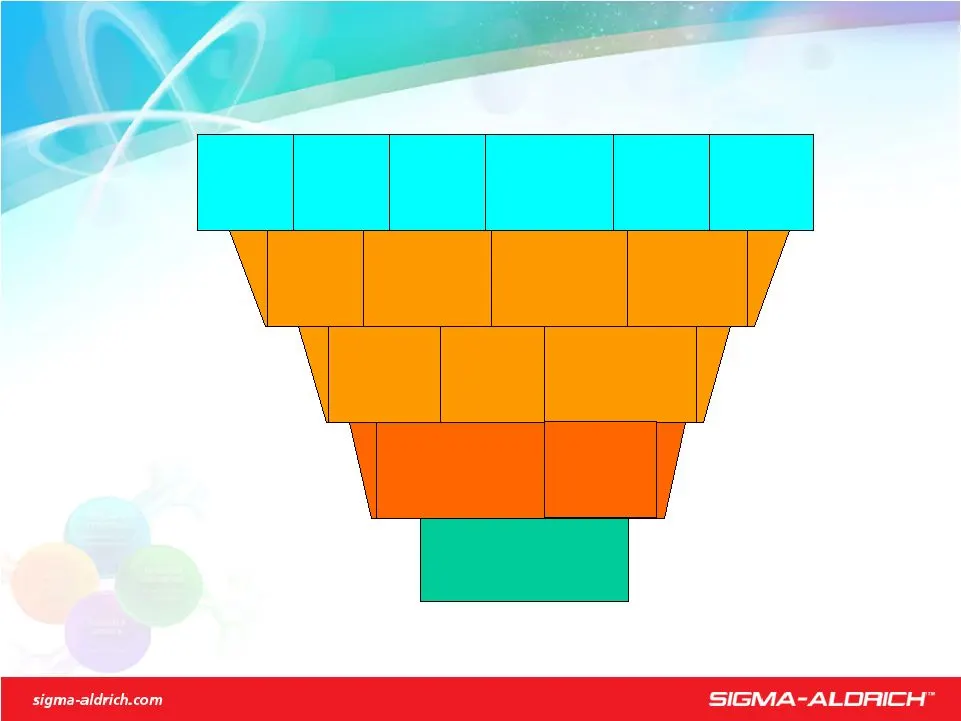
Leverage Content – The Conversion Funnel PPC Affiliates SEO Contextual Networks Social Networks Verticals eCommerce Functionality AWARENESS INTEREST PURCHASE CONVINCE In-site Search Content Rich Media Content Interactive Content Site Usability Product Detail Content Registration On-line Services In-
Slide 101: Faster Is Better
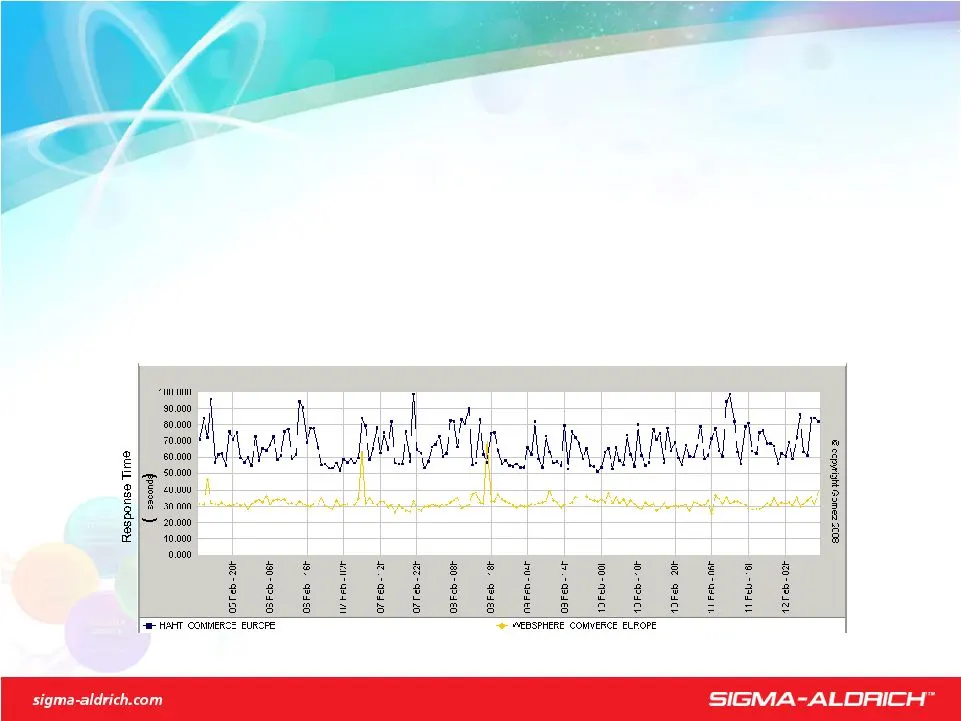
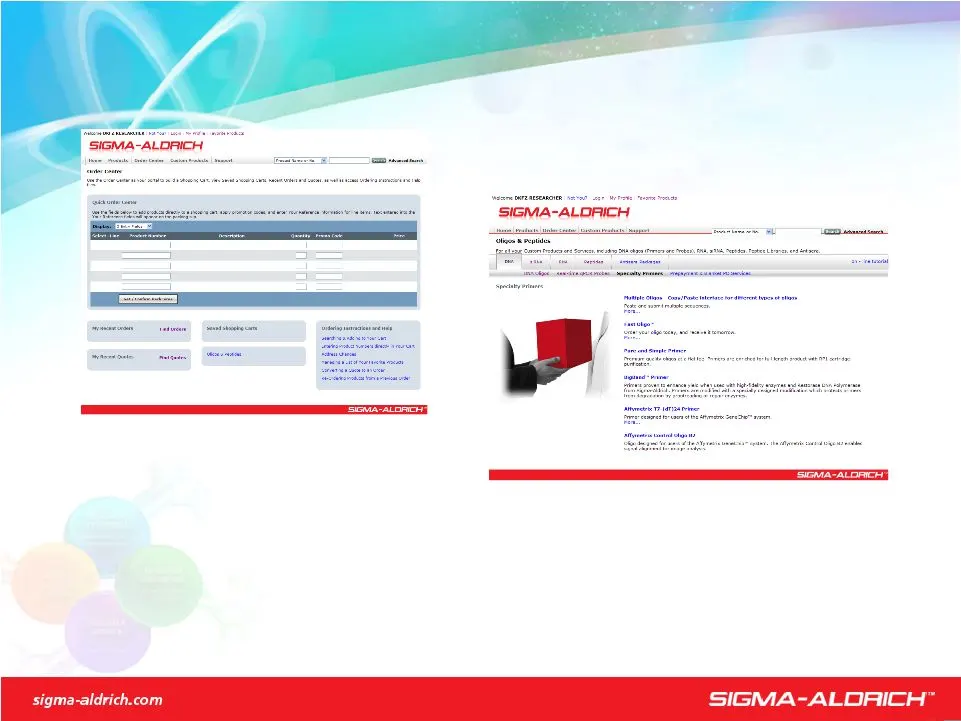
Faster Is Better Improving the Customer Experience WebSphere Commerce – Ordering: Easier And Faster “Well Done! You Took An Already Good Web Site And Made It Better…Hopefully I Will Discover More Useful Additions As I Continue To Use The New Site.” Gregory Kienast Chemical Tracking & Stock Coord. Un
Slide 102: Facilitating Custom Product Ordering
Facilitating "Custom" Product Ordering Growing Beyond “Ready to Ship” Products Sigma-Aldrich Is No Longer Just About Pre-Pack Materials Sitting In Our Warehouses Making eCommerce Work For All Business Units & Product Lines
Slide 103: Improving The Search Experience
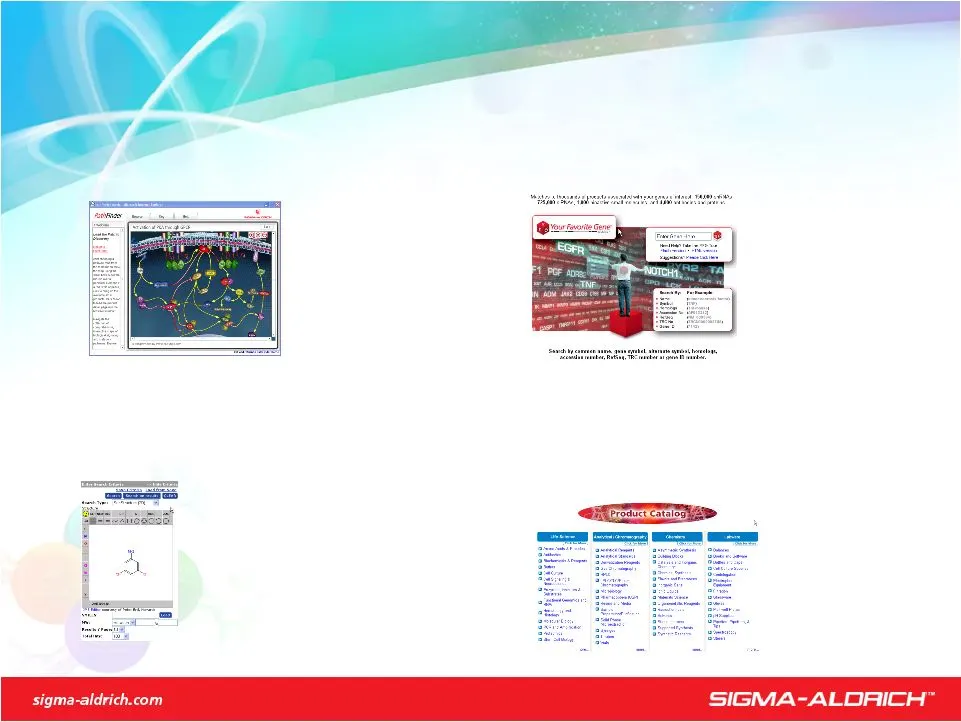
Improving The Search Experience Changing The Assumptions Behind Search Find Products Associated With Genes With Your Favorite Gene ™ Find Products Related To Biological Pathways With PathFinder Browse For Products Using The Traditional Catalog Index With The Online Product Catalog Search For Chemica
Slide 104: Improving The Hit Rate
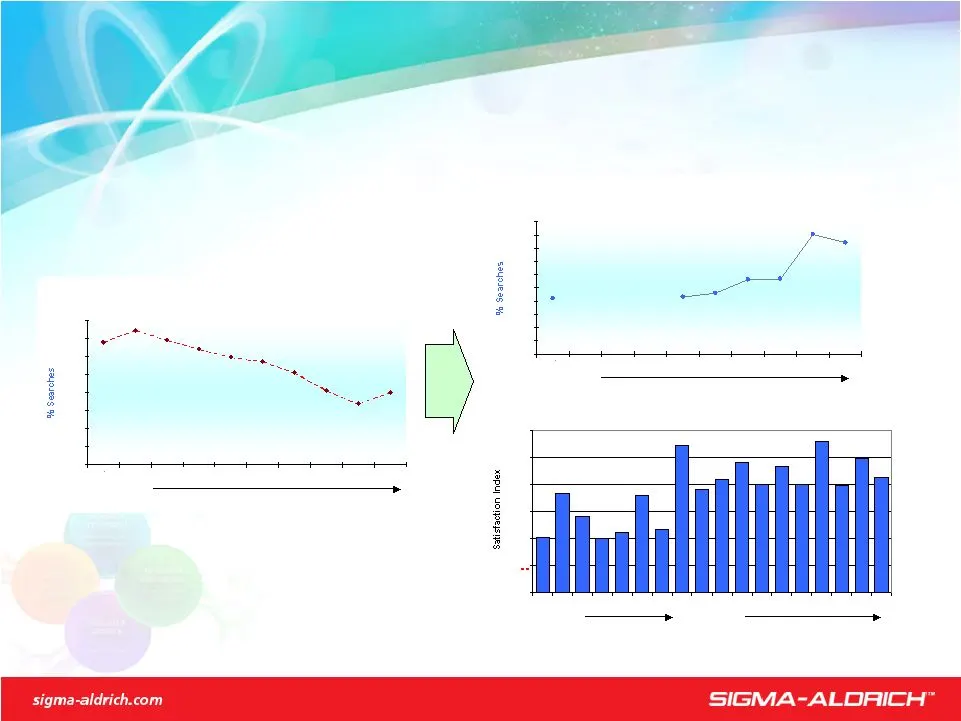
Improving The "Hit" Rate Improving Search Through Analytics Null Search Normalized to Site Views 3.00% 3.50% 4.00% 4.50% 5.00% 5.50% 6.00% 6.50% 7.00% 21.92% decrease in Null Searches YTD Buy/Search Ratio Normalized to Site Visits 2.00% 2.05% 2.10% 2.15% 2.20% 2.25% 2.30% 2.35% 2.40% 2.45% 2.50% 9.5
Slide 105: Multi-Language Capabilities
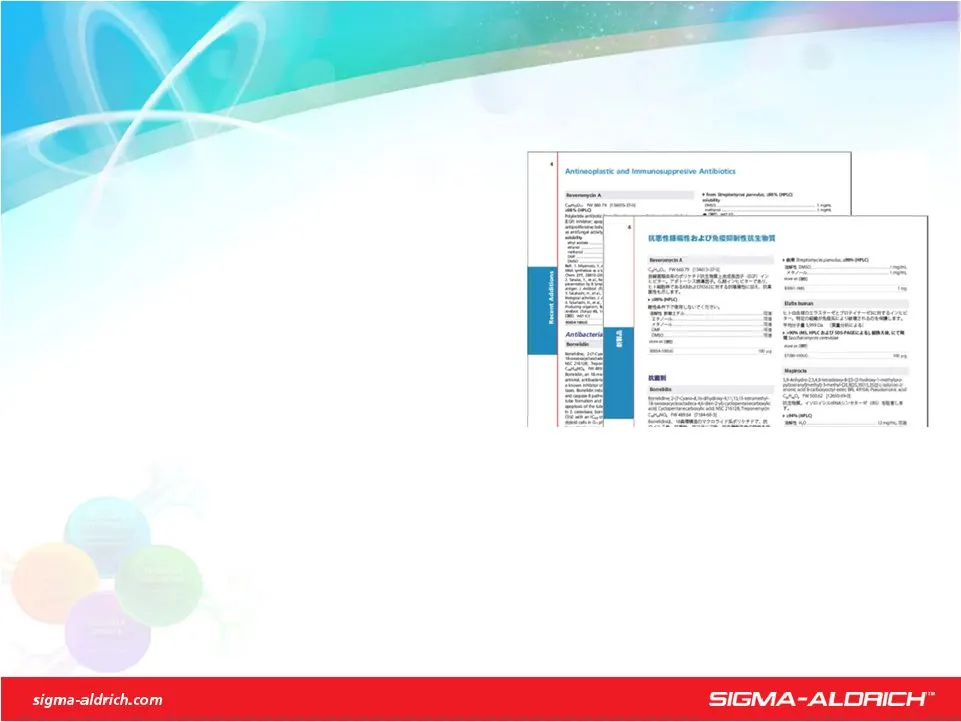
Multi-Language Capabilities New Content Translation Process New Web Content Management System New Multi-Language Search Architecture ~30,000 Japanese products have been translated. Website search available in July – print materials available now. Focus on Global Content
Slide 106: #1 In Our Industry
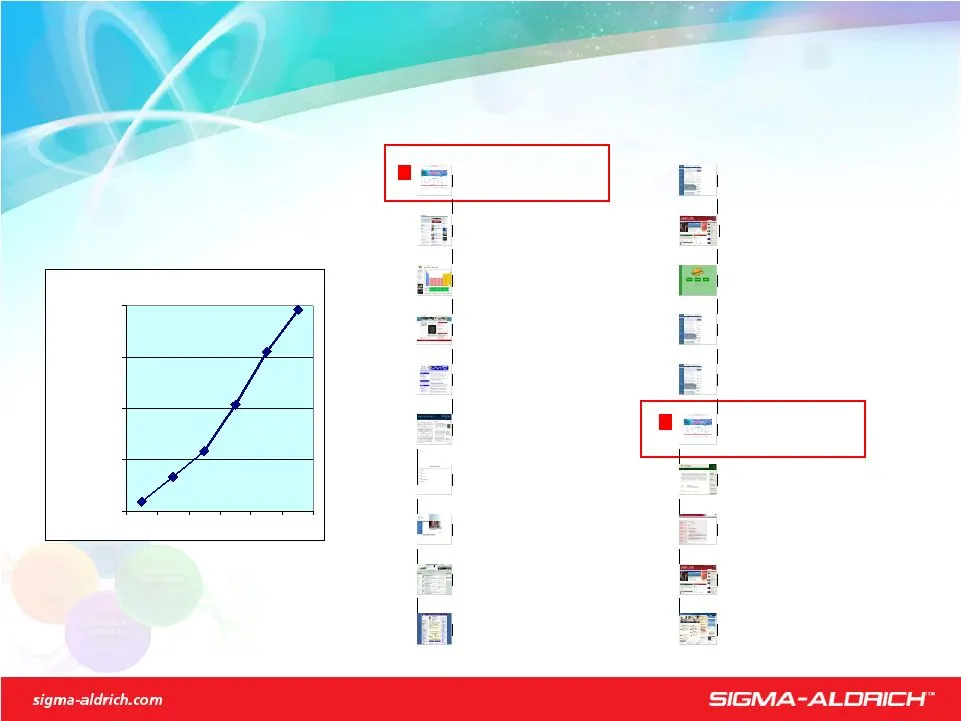
#1 In Our Industry Customer Validation Annual Website Visits 7,000,000 11,000,000 15,000,000 19,000,000 23,000,000 Strong Site Growth Continues … Sigma-Aldrich.com Is Now The Most Popular Chemistry Site In The World Most Popular In Biology Alexa Rankings, March 2008 The most visited sites in all 'Bi

Slide 107: Continue To Innovate
Continue To Innovate 2008 & Beyond Engrain Sigma-Aldrich Website Even Deeper Into Our Customers’ Processes Extend Our Expertise In Connecting With Customers Refine Our Integrated Approach To Content, Search, Analytics, And Usability Utilize Global Content Management Capabilities To Provide Localized

Slide 108: Building For The Future
Building For The Future 1. Align Structure With Customers And Markets 2. Expand In Faster Growing Geographic Markets 3. Build On Internet Superiority 4. Leverage Process Improvement For Excellent Investment Returns 5. Fill Growth Target Through Acquisitions Five Key Initiatives

Slide 109: Supply Chain Initiative To Enhance Margins
Supply Chain Initiative To Enhance Margins Leveraging Process Improvement Revitalize Our Supply Chain Continue Efforts To Maintain Investment Returns

Slide 110: Eight Major Initiatives
Eight Major Initiatives Procurement Custom Services Facilities Distribution Consolidation and Decoupling Slow Seller Management Planning and Forecasting Freight Management Supply Chain

Slide 111: Largest Opportunities Are In Two Broad Areas
Largest Opportunities Are In Two Broad Areas Revitalizing Our Supply Chain “ What We Sell” Custom Services Consolidation And Decoupling Slow Seller Management “How We Execute” Planning And Forecasting Facilities Distribution Freight Management Procurement
Slide 112: Options
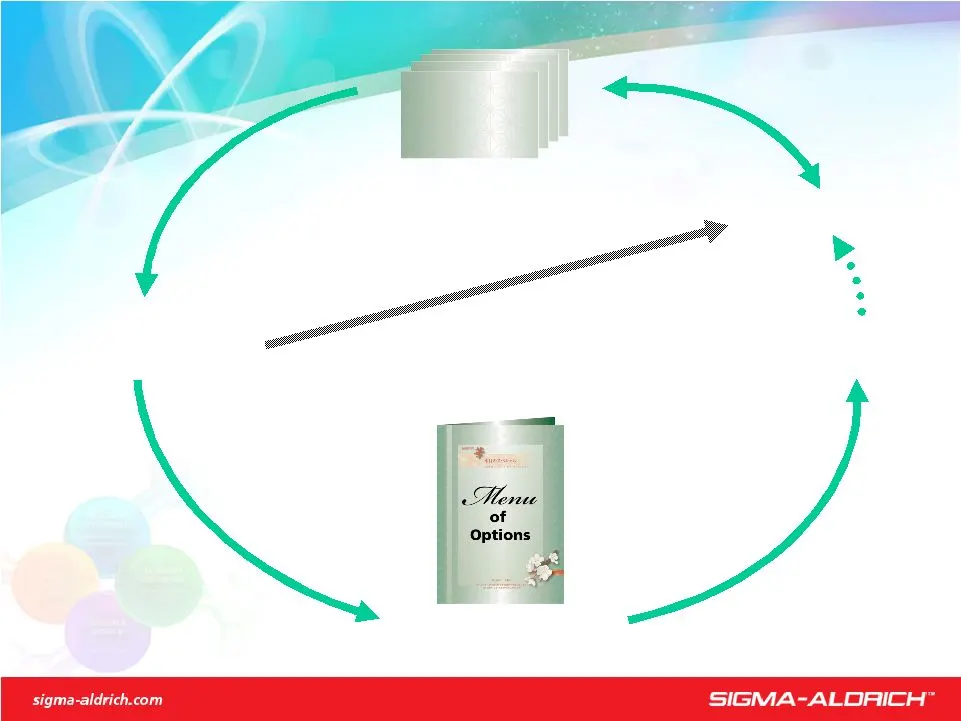
Options SIGMA-ALDRICH

Slide 113

Slide 114: Top Line Growth Through Custom Services
Top Line Growth Through Custom Services Customer Request Business Analysis Supply Chain Process Improvement Systems Flexible, Robust, Processes Marketing Popular Configurations Other Customer Sales Process of Organic Growth Rapid Response Processes Business Analysis Custom Services
Slide 115: Consolidation and Decoupling
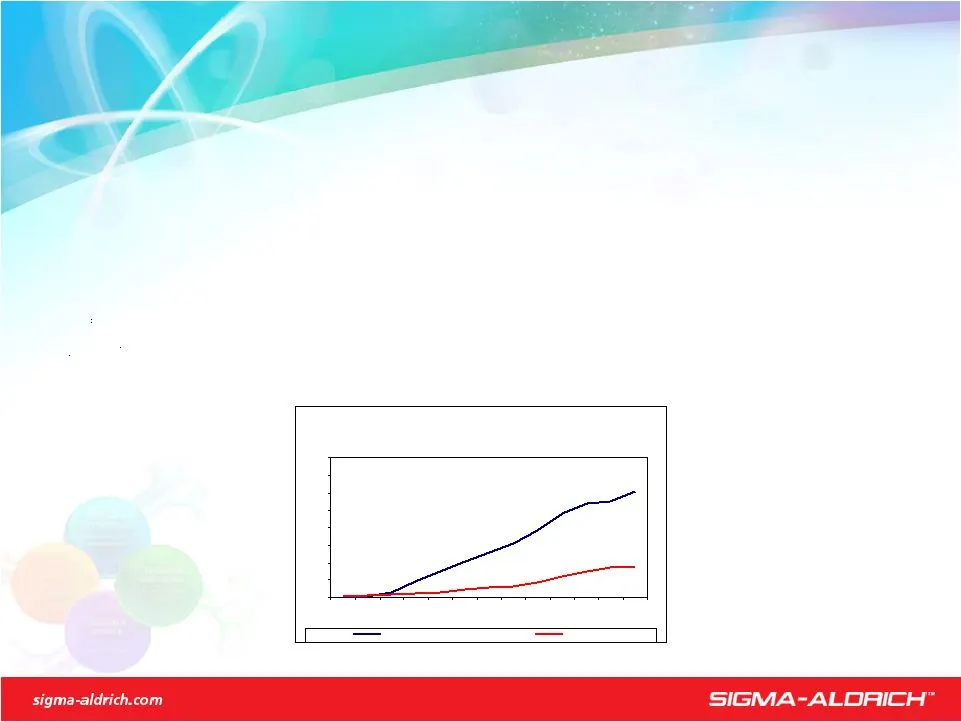
Result Is Sales Neutral And Reduces Cost Consolidation and Decoupling Simplify Product Offering While Maintaining Breadth Of Product Line - Consolidate Redundant Brand/Grade Offerings - Eliminate Unnecessary SKUs Enable Improved Efficiency Through Flexibility - Decoupling Brands From Sites - Purchas

Slide 116: Slow Seller Management
Slow Sell Hubs Global Drop Ship New Approach To Improve Profitability Slow Seller Management Packaging Strategy Annual Stock Return Forecasting Process & Stocking Policy Changes Slow Sellers “Bring Customers To The Store” 94K Products (70%) Sell <30 Units/Yr - 6% Of Research-Based Sales - 15% Of Inv
Slide 117: S-A's 95% Fill Rate Costs $600+M In Inventory
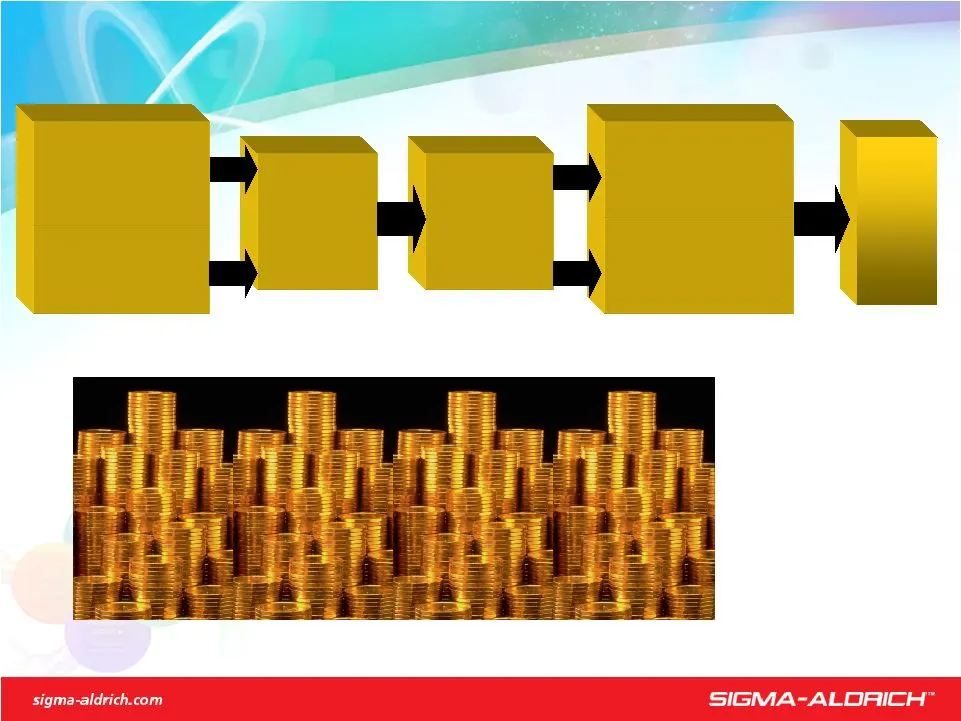
S-A's 95% Fill Rate Costs $600+M In Inventory Planning And Forecasting Production QC Packaging 95% fill rate Produced cumulated Inventory $600+ Million Procurement Procured cumulated

Slide 118: Improved Service At Lower Costs
Improved Service At Lower Costs Planning and Forecasting Improve Demand Planning - Customer-Based Demand Management - Increase Product Availability In CAPLA To Support High Growth Rate Implement Sales And Operations Planning - Continued Planning Skill Development - Process Improvements- On-Time Perf

Slide 119: Facilities: Some Easy Wins Are Complete Or In Process
Some "Easy Wins" Are Complete Or In Process Facilities Rapid Asia-Pacific Sales Growth Requires Infrastructure Investment Focus Long-Term Regional And Global Facility Plans - Align Along Centers Of Excellence Integrate Acquisitions Consolidation
Slide 120: Global Distribution - Future
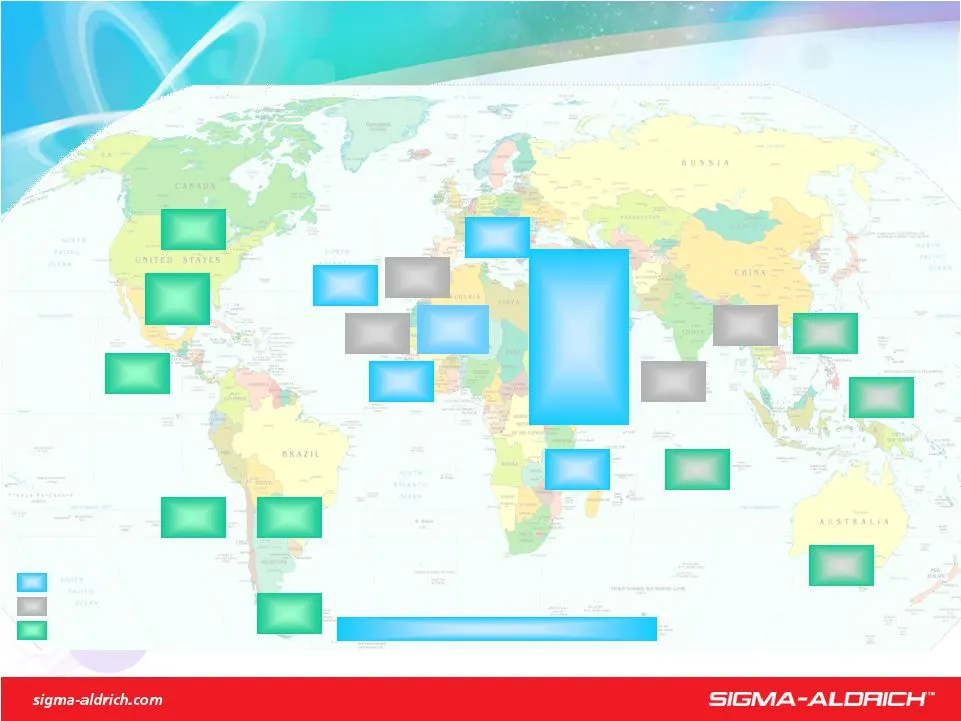
Global Distribution - Future CDC CDC Europe Europe South Korea Australia Ireland UK Spain Portugal France Argentina Brazil CDC CDC US US China Canada India Japan Chile Venezuela Mexico Sales Subsidaries: • Belgium • Netherland • Italy • Denmark • Poland • Czech Republic • Hungary • Austria • Russia
Slide 121: Freight Management
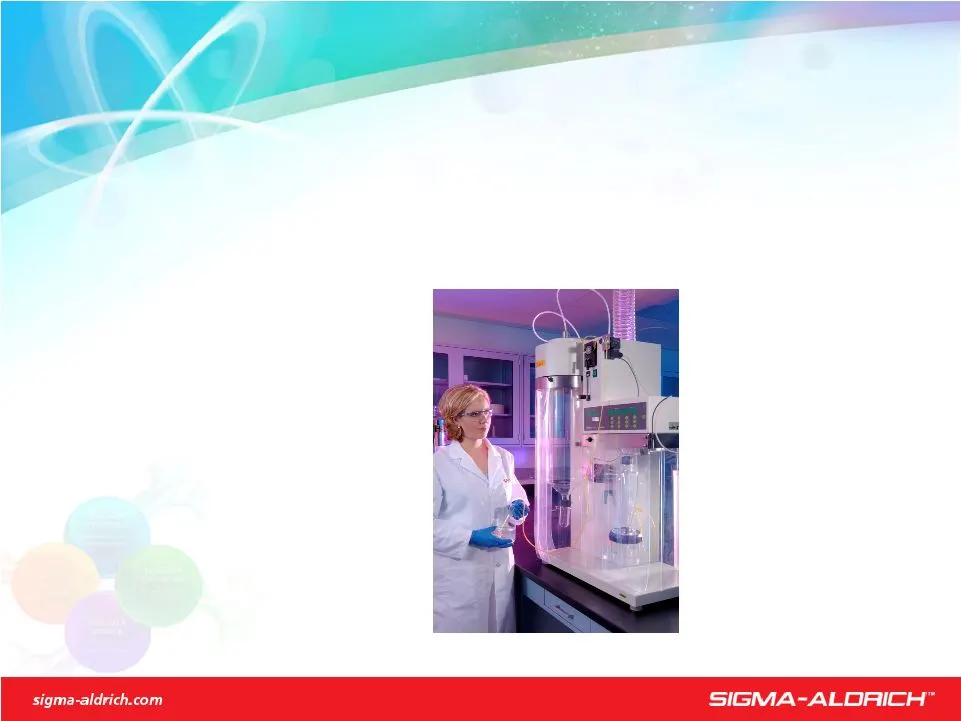
Freight Management Leverage Our Spend Organize Globally Reduce Number Of Carriers And Freight Forwarders Improve Efficiency Annual Freight Spend Is $100M; Largest Opportunity In Europe & CAPLA

Slide 122: Largest Opportunity For Margin Improvement
Largest Opportunity For Margin Improvement Procurement Leverage Our Spend - Global, Integrated Organization - Provide Additional Skills Training For Sourcing Teams - Implement Additional Spend Analysis And Contract Management Tools Manage Our Vendors - Focus On 20% Of Suppliers That Represent 80% Of

Slide 123: Pretax Margins Expected To Improve By 1.5% by 2012
Pretax Margins Expected To Improve By 1.5% by 2012 Savings & EPS Benefits Expected Savings $0-$2 $10-$15 $20-$25 $25-$35 $35-$45 ($millions, pretax) EPS Benefit $0-$0.01 $.05-$.08 $.11-$.14 $.14-$.19 $.19-$.24
Slide 124: Simple, Common Approach Is Foundation Of Success
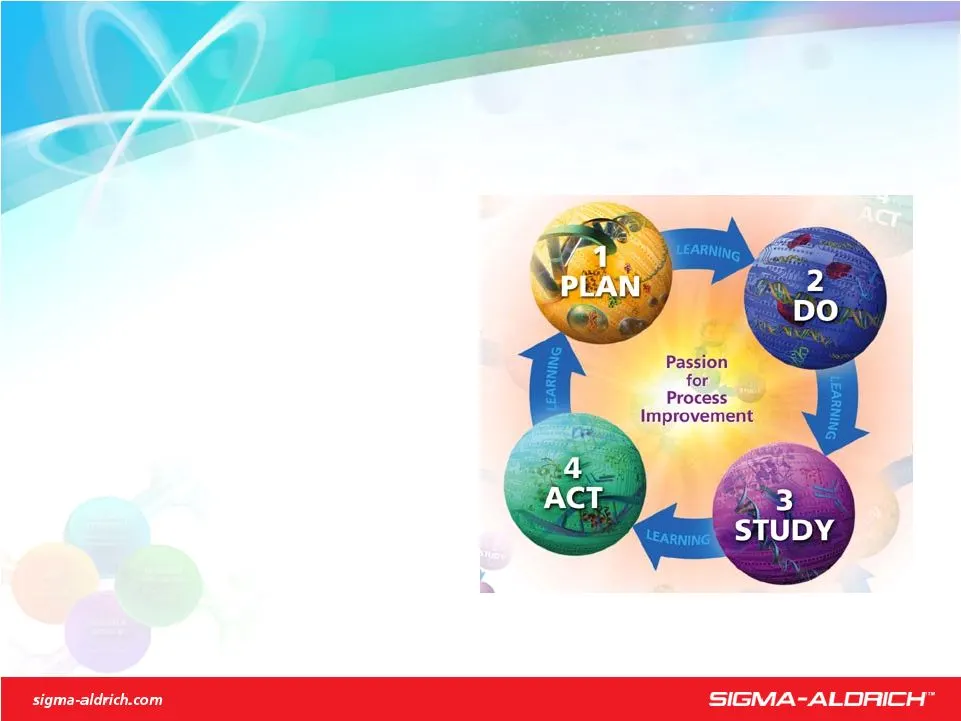
Simple, Common Approach Is Foundation Of Success Continue Efforts To Maintain Investment Results AIM For Improvement In Key Business Processes MEASURES To Determine If Changes Are Improvements CHANGES To Anything And Everything Can Be Tested For Improvement
Slide 125: Sixth Straight Year Of $15+ Million In Savings
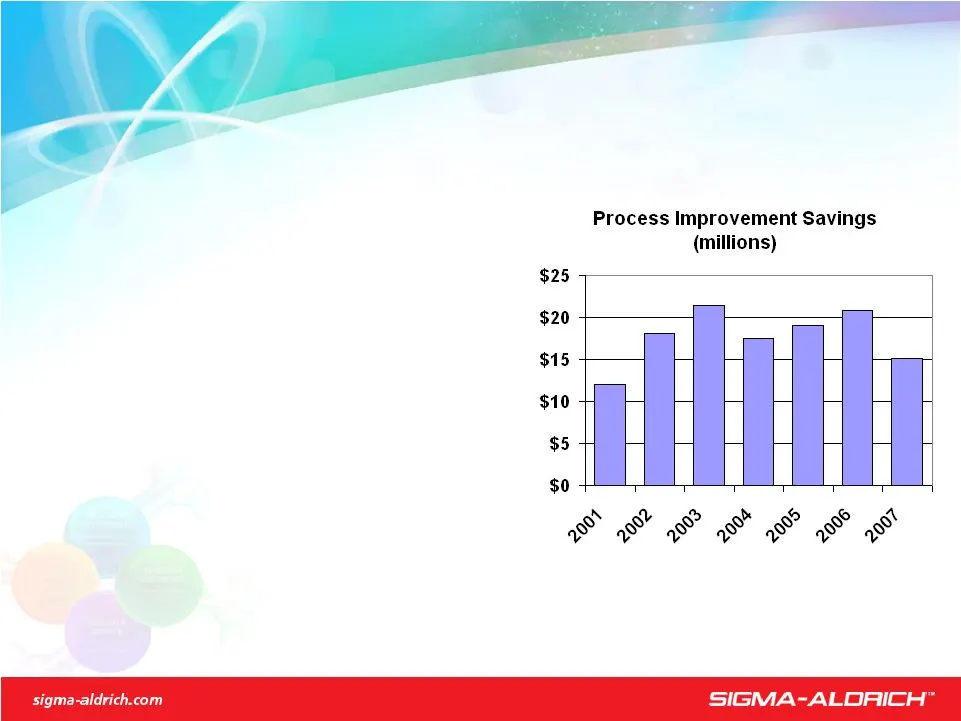
Sixth Straight Year Of $15+ Million In Savings Process Improvement Results “It’s All About The Business!” Superior Improvements = Superior Performance Documented Savings Are A Fraction Of The Impact

Slide 126: Producing Material Improvements To The Bottom Line
Producing Material Improvements To The Bottom Line Process Improvement Cost Savings – Global Purchasing Efforts Saved More Than $10 Million Impact From 30 Advanced Improver Projects In Locations Growing Impact On Top-Line Growth Initiatives Quality and Safety Focused Improvements Have Led To Record

Slide 127: $15 Million Savings Goal To Hold Existing Margins
$15 Million Savings Goal To Hold Existing Margins Process Improvement Focus – Spread Of Improvement Efforts And Support Into CAPLA Broadening The Improver Network Through Hands-On Skill Development Launch Of Multiple Initiatives Aimed At Reducing The Environmental Impact Of Our Operations Continued

Slide 128: Aligning With Our Communities
Aligning With Our Communities Global Citizenship Environmental Sustainability = Social Responsibility = Corporate Accountability
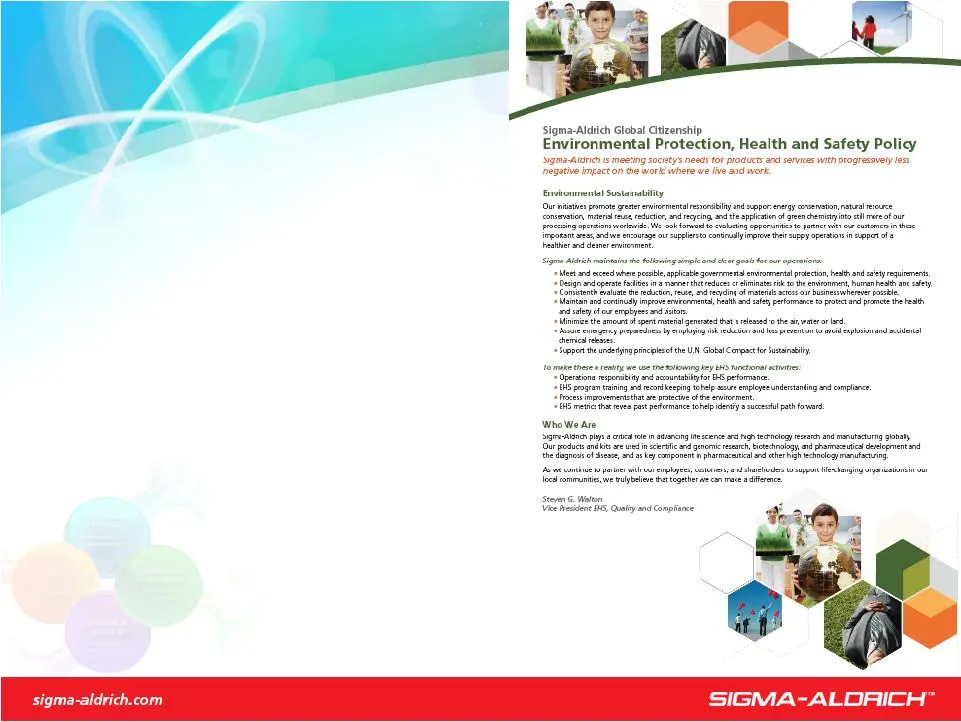
Slide 129: Sustainability Metrics To Be Published
Sustainability Metrics To Be Published Environmental Sustainability 2008 Projects Worldwide Energy Measurement And Conservation Technology Sharing (Reduce, Reuse, Recycle) - Internal - eNet - External – Customers / Investors Via Public Website
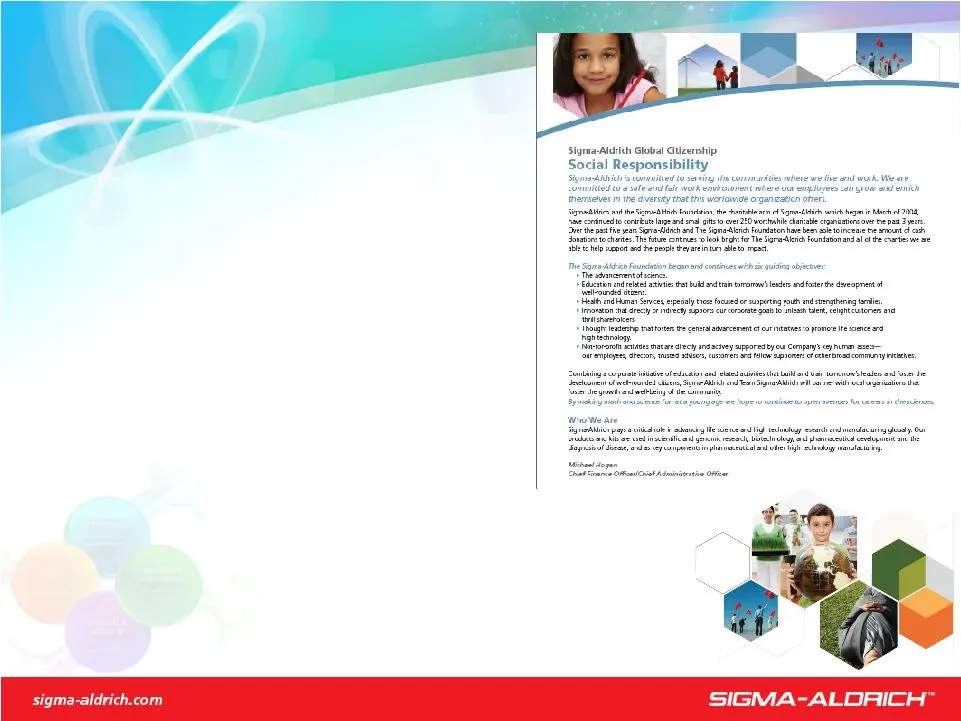
Slide 130: Sustaining Successful Communities
Sustaining Successful Communities Social Responsibility 2008 Projects Communities - Team Sigma-Aldrich Workplace - Outstanding Safety Performance - Recognition For Improvement (Safety, Quality, Environment) Customers - Highest Quality And Leading Edge Products - Translate Discoveries Into Meaningful
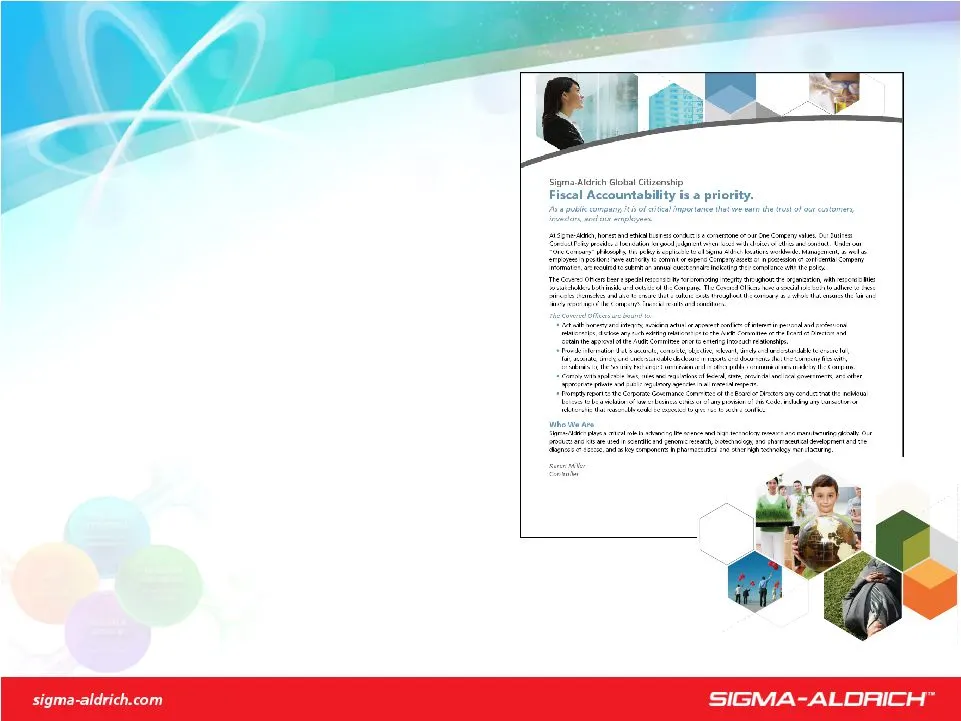
Slide 131: Earn The Trust Of Customers, Investors & Employees
Earn The Trust Of Customers, Investors & Employees Corporate Accountability 2008 Projects Fiscal: Using The Data Governance: Act With Integrity

Slide 132: Five Key Initiatives
Initiatives Set Actions For 2006 - Building For The Future 1. Align Structure With Customers And Markets 2. Expand In Faster Growing Geographic Markets 3. Build On Internet Superiority 4. Leverage Process Improvement For Excellent Investment Returns 5. Fill Growth Target Through Acquisitions Five Ke

Slide 133: Acquisitions - General Criteria
Add To Growth/Maintain Returns Acquisitions – General Criteria Acquisitions Must Create Shareholder Value Over Reasonable Planning Horizon: - Both Sales And Profit Growth > Long-Term Target (10%) - Meet Or Exceed Cost Of Capital (Roughly 15%) - Enhance Life Science/High Technology Position Annual Re

Slide 134: Need Expansion Into New Markets To Fill Revenue Gap
Need Expansion Into New Markets To Fill Revenue Gap Acquisitions – Investment Opportunities New Market Opportunities In: - Regenerative Medicine (Stem Cells) - Electronics (Material Science) - Biomaterials (Material Science) - Contract Research Services - Analytical Services - Automation Reagents -

Slide 135: Add Capabilities With Focus On Global Innovation
Add Capabilities With Focus On Global Innovation Acquisitions – Broad Strategy Primary Focus On Biotech, SAFC And Emerging Markets: - Biotech: “First To Market” Technologies For Development And Launch Of Innovative, Solution-Oriented Products - SAFC: - Capabilities To Retain/Enhance #1 Position In B
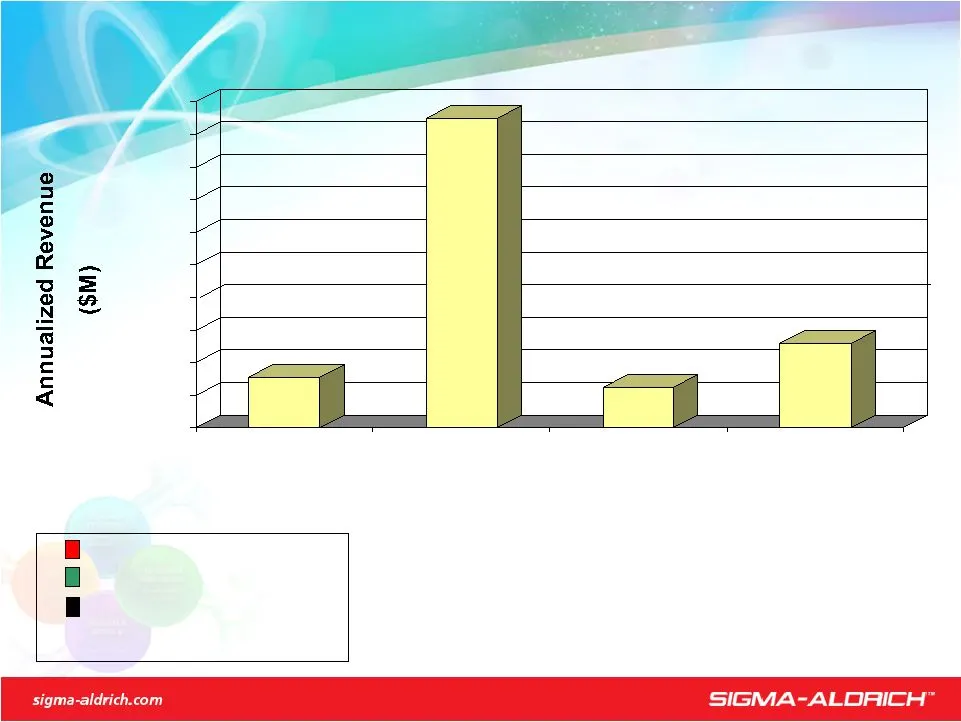
Slide 136: Acquisitions - Annualized Revenue Added
Acquisitions – Annualized Revenue Added UltraFine (Capacity) Tetrionics (Technology) JRH (Product Line) Proligo (Technology) Beijing Superior (Geography) Iropharm (Capacity) Pharmorphix (Technology) Advanced Separation Technologies (Technology) Epichem (Technology) Molecular Medicine BioServices (Te
Slide 137: Screened Candidates Enter Internal Review Process
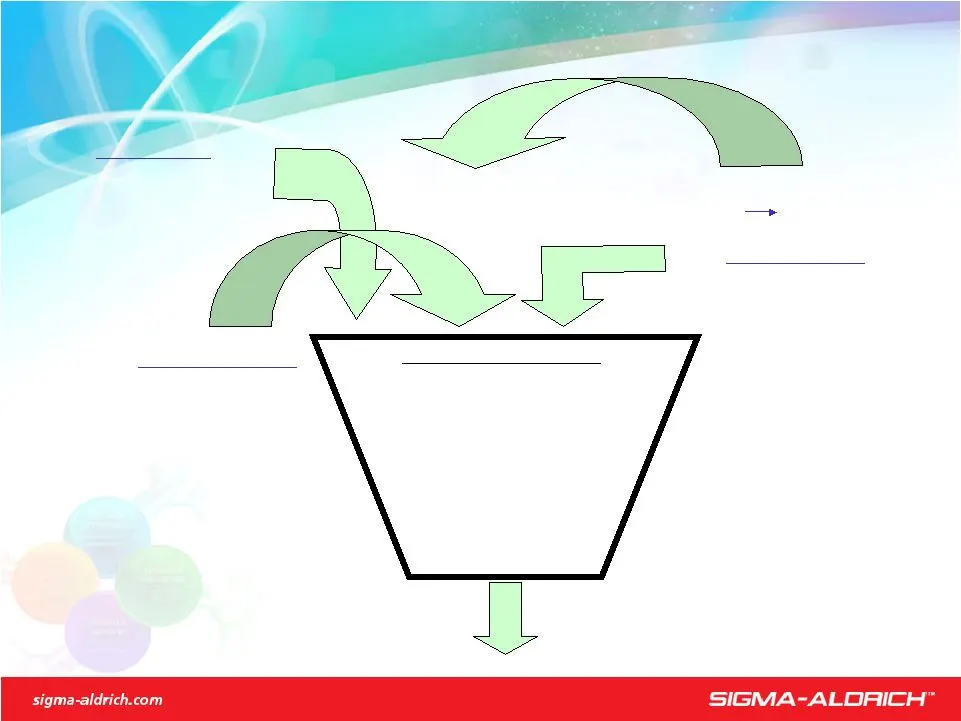
Screened Candidates Enter Internal Review Process Acquisitions - How We Source Candidates Third Parties • Venture Capital Firms Investment Bankers Direct Candidate Contact Internal Groups Business Development (Staff & Web Site) International Team Sales, R&D Marketing External Contacts Personal/Busin
Slide 138: Enough Target To Achieve Objective
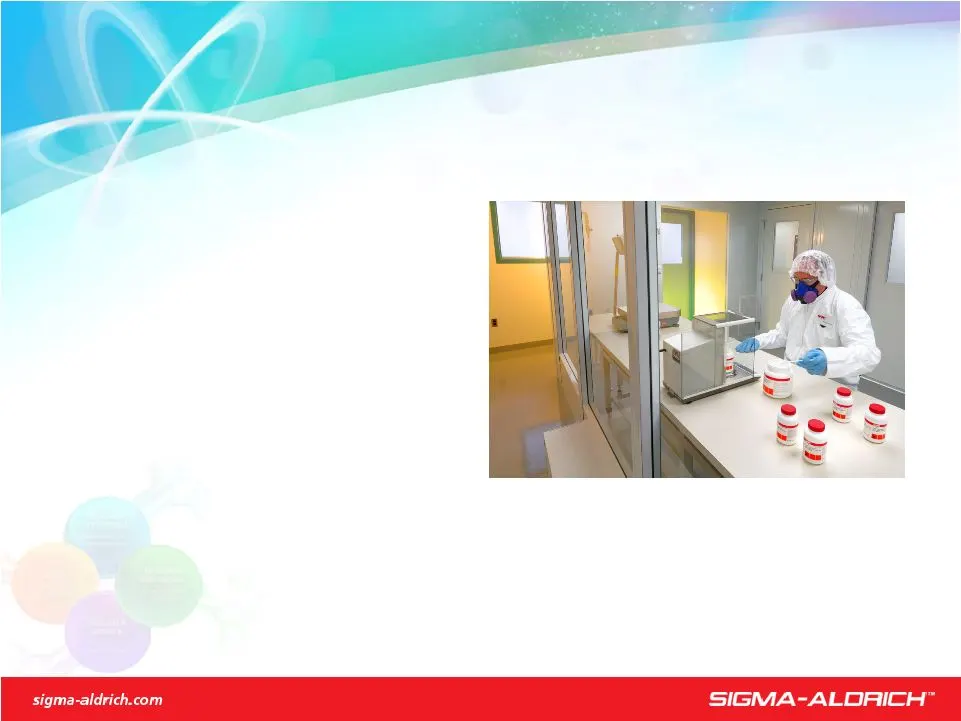
Enough Target To Achieve Objective Acquisitions – Internal Review Horizons Screen - Revitalize - Growth Opportunities - Future Business Business Unit Analysis EMG Review Target Contact - Availability - Technical Details Due Diligence Formulate Proposal Board Approval (As Applicable)

Slide 139: Strategic Plan Financial Objectives
Strategic Plan Financial Objectives Obtain Minimum 10% Top And Bottom Line Growth Maintain 20% Return On Equity Over Plan Period Maintain Effective Debt To Capital Ratio Reinvest Cash In Sales And EPS Growth
Slide 140: Balance Sheet ($ In Millions)
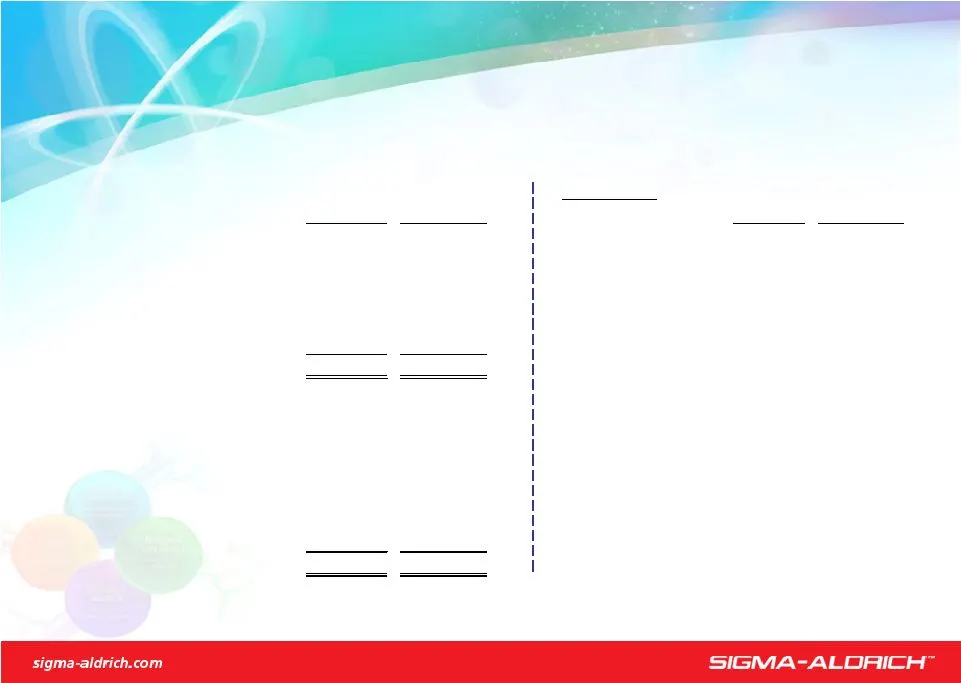
($ In Millions) Balance Sheet ASSETS KEY RATIOS Cash $ $ Receivable DSO Receivables US Inventories Europe Other Current Assets CAPLA Property, Plant and Equipment Other Assets Inventory MOH (1) 7.3 7.6 2,629 $ 2,334 $ Debt to Capital 25.0 % 27.2 % LIABILITIES AND EQUITY Short-term Debt $ $ Other Cur
Slide 141: Balance Sheet ($ In Millions)
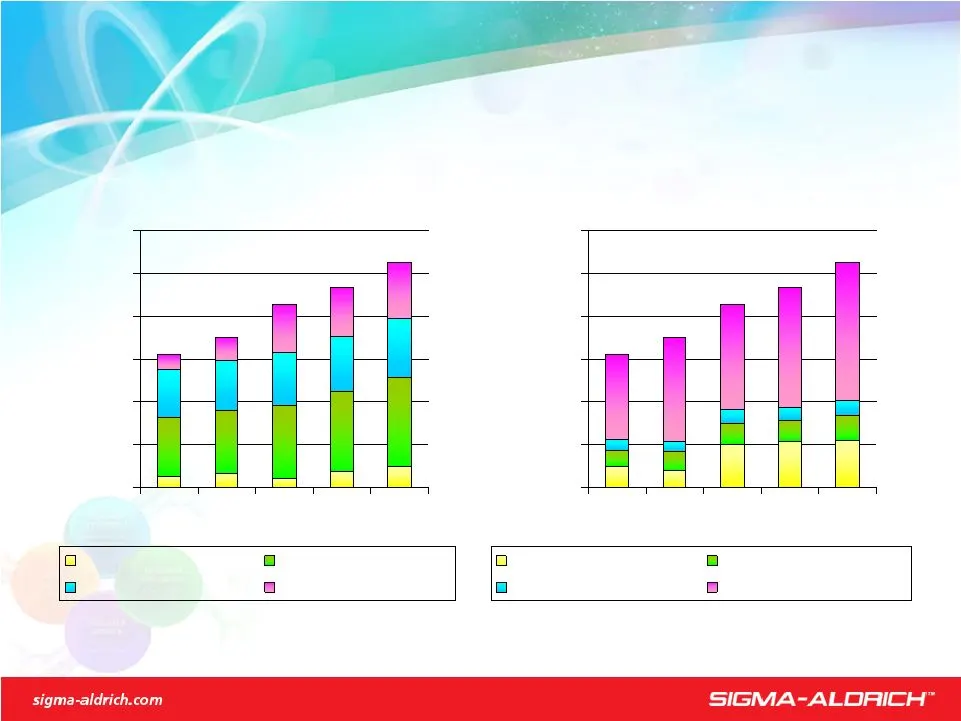
($ In Millions) Balance Sheet ASSETS $0 $500 $1,000 $1,500 $2,000 $2,500 $3,000 Cash Other Current Assets PP&E Other Assets LIABILITIES & EQUITY $0 $500 $1,000 $1,500 $2,000 $2,500 $3,000 Total Debt Other Current Liab. Other Noncurrent Liab. Equity
Slide 142: Hold DSO & MOH / Maintain Debt Ratio
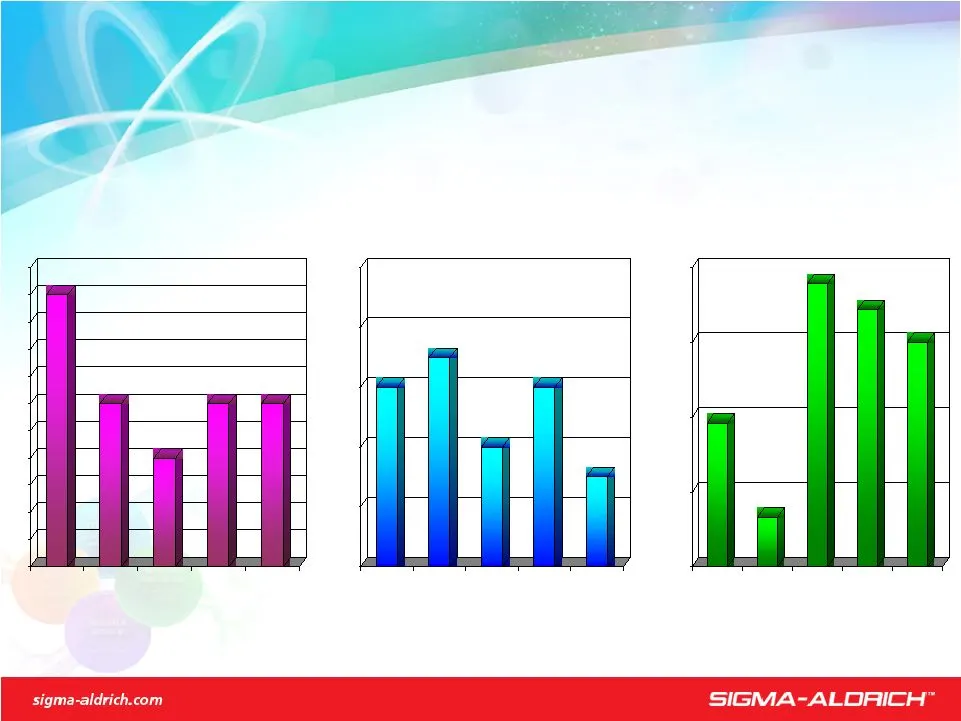
Balance Sheet Hold DSO & MOH / Maintain Debt Ratio Accounts Receivable Days Sales Outstanding (DSO) Inventory Months On-Hand (MOH) Dept-To-Capital Ratio 7.6 7.7 7.4 7.6 7.3 7.0 7.2 7.4 7.6 7.8 8.0 19.6% 13.3% 28.9% 27.2% 25.0% 10.0% 15.0% 20.0% 25.0% 30.0%
Slide 143: Active Working Capital Management
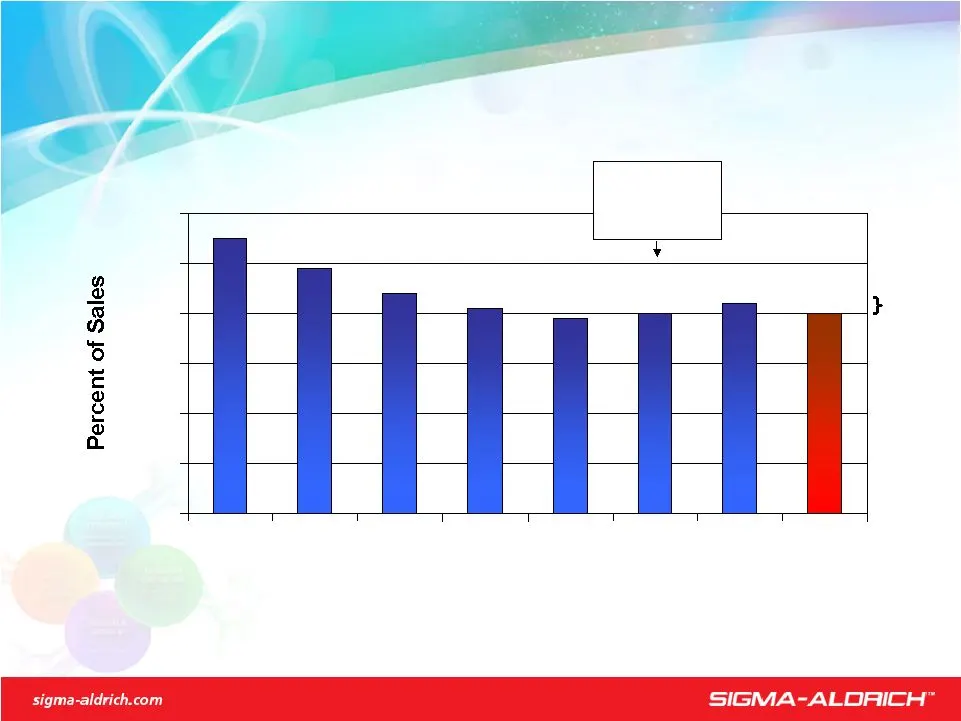
Active Working Capital Management 55% 49% 44% 41% 39% 40% 42% 40% 0% 10% 20% 30% 40% 50% 60% Excluding JRH & Proligo 37% Percentage of Sales: (Accounts Receivable + Inventory – Accounts Payable) / Sales Provided $300 Million in Cash 2000-2007 ($48.2) Million
Slide 144: Cash Flow - Sources and Uses
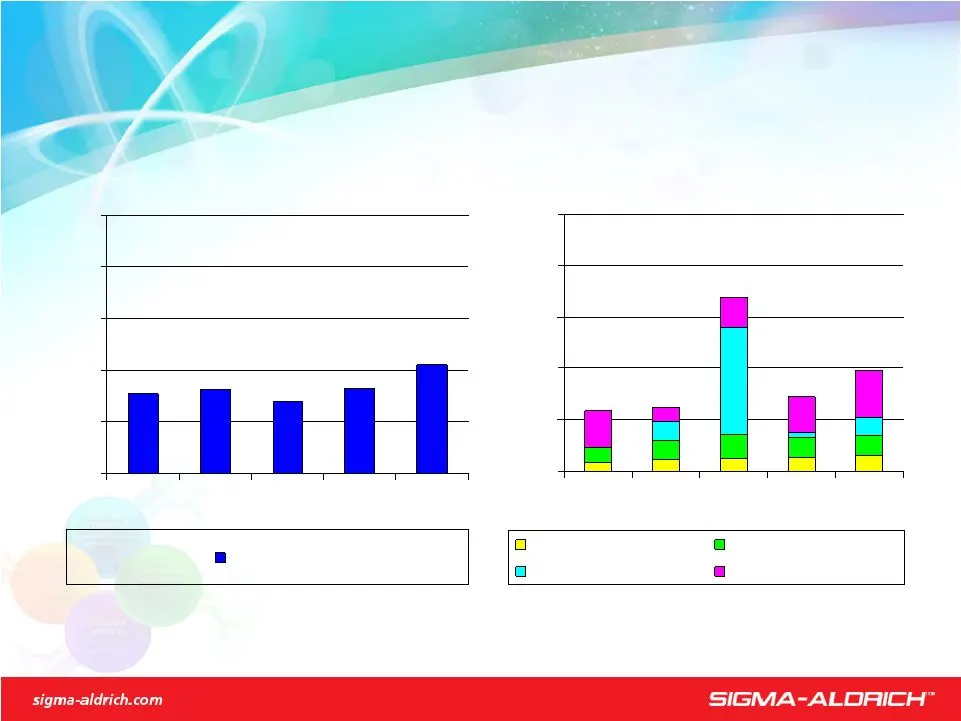
Cash Flow - Sources and Uses Sources Operations Uses Dividends Capital Expenditures Acquisitions Share Repurchase (in 000’s) Operations Self-Funding; Use Debt for Share Repurchases & Acquisitions

Slide 145: Have Repurchased 84.0 Million Shares To Date
Have Repurchased 84.0 Million Shares To Date 5.2m - 1999 45.9m - 2000 8.2m – 2001 5.2m – 2002 5.5m – 2.0m – 2004 4.0m – 2005 4.0m – 2006 4.0m – Represents ~40% of Otherwise Outstanding Shares Average Price: $20.46 Per Share (“All In”) Authorized Up To 6.0 Million More Shares Shares Outstanding 12/31

Slide 146: Rewards Tied To Performance
Rewards Tied To Performance Performance Share Holding Opportunity Requirement Target Number Positions Included (Salary Multiple) (% Of Salary) Chairman 3X - President & CEO 3X 67% Business Unit Presidents, CAO/CFO, General Counsel) 2X 50-55% Key Management Group 1X 25-30% Senior Management Group 0.5

Slide 147: Operating Cash Flow
Operating Cash Flow $ 420 – Cash Requirements - Capital Expenditures $ 115 - Dividends $ 66 - Acquisitions TBD - Share Repurchase TBD Expected Cash Flow – (In Millions) Financially Strong Nearly $250 Million Available

Slide 148: Directors & Employee Shareholding
Directors $ 406 $ 560 $ 2,970 7.3 Officers/Executives 8,832 11,203 28,635 3.2 Directors/Managers 3,928 11,425 20,021 5.1 $13,166 $23,188 $51,626 3.9 Times Current Total Shareholdings Current Requirement Requirement @ 12/31/07 Requirement Directors & Employee Shareholding (000’s)
Slide 149: Enhancing Global Reach Through Excellence
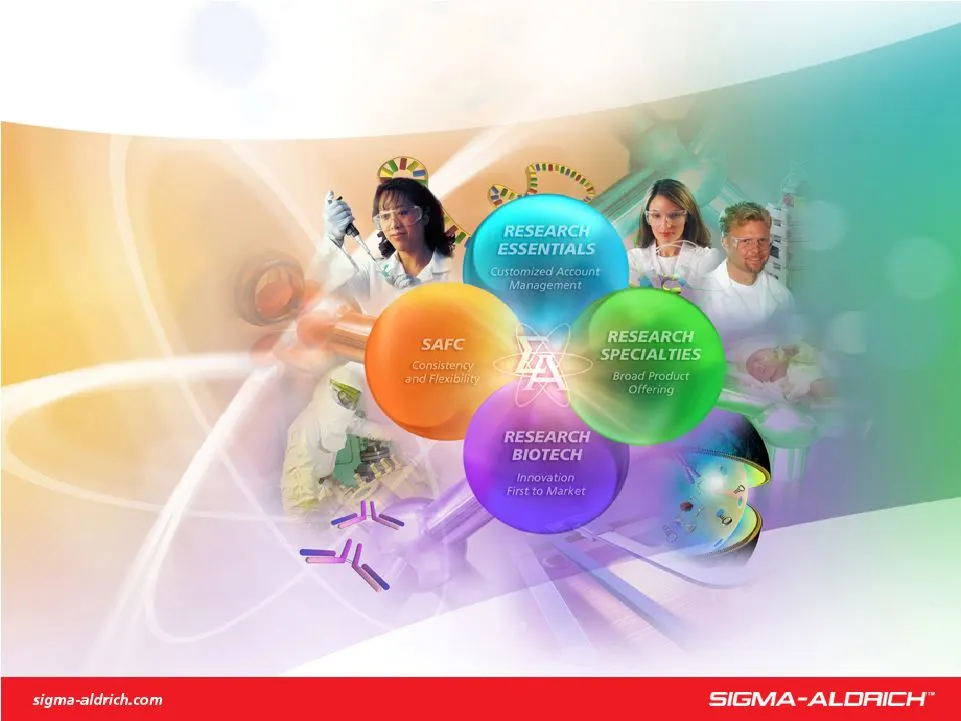
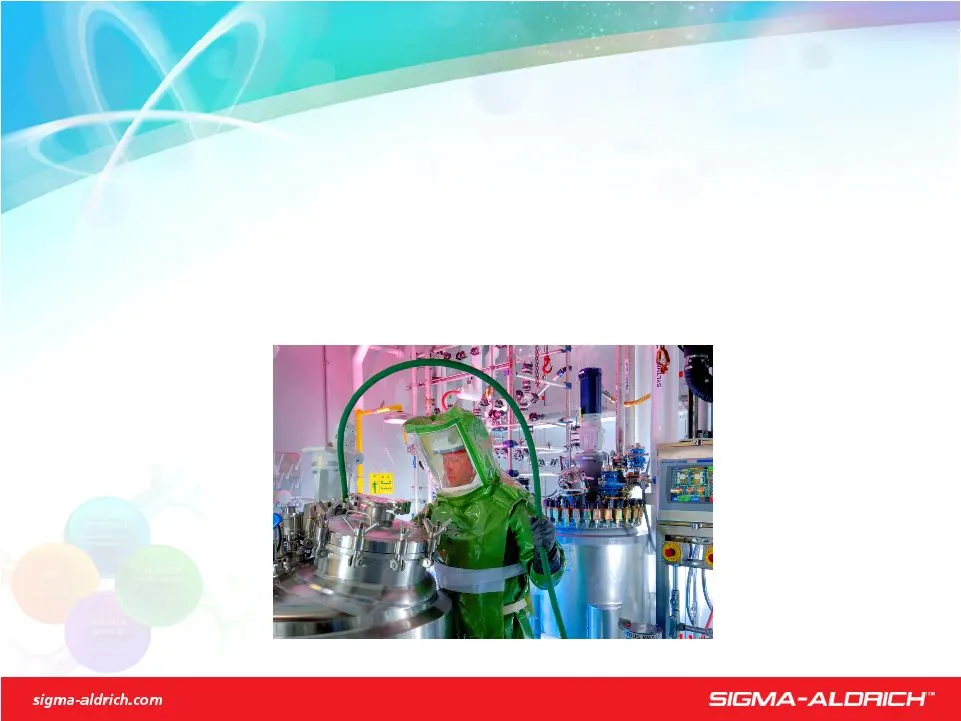
Enhancing Global Reach Through Excellence
Slide 150: 2008 Goals
2008 Goals Deliver Sales & EPS Forecast Develop Plan To Drive Growth For 2009 – Build Bench Strength To Support Long-Term Growth Enhance Environmental Sustainability

Slide 151: 2008 Forecast
2008 Forecast Sales - Organic Growth 7% - Currency (At 12/31/07 Rates) 3% EPS $2.52 – 2.62 + 8 – 12% ROE >20%
Slide 152: Summary
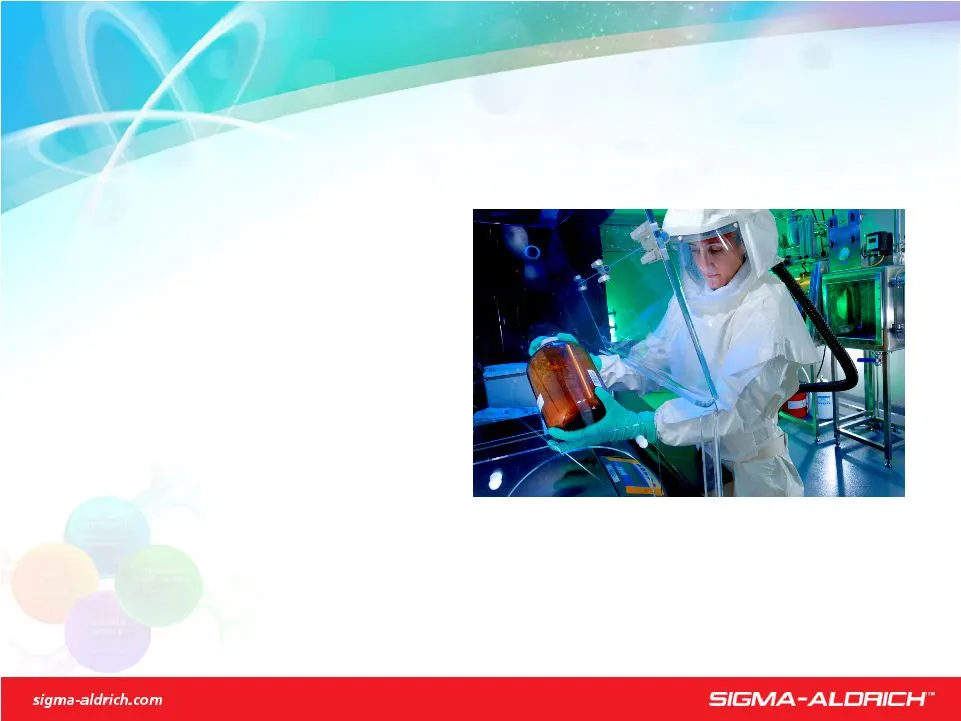
Summary Five Key Customer Success Drive Initiatives - Customer-Centric Approach - Geographic Opportunities - Internet Superiority - Process Improvement - Acquisitions Competitive Advantages - Broad & Innovative Offering - Global Presence - Superior Technical Service Financial - Strong Financial Posi
Slide 153: Sigma-Aldrich Corporation
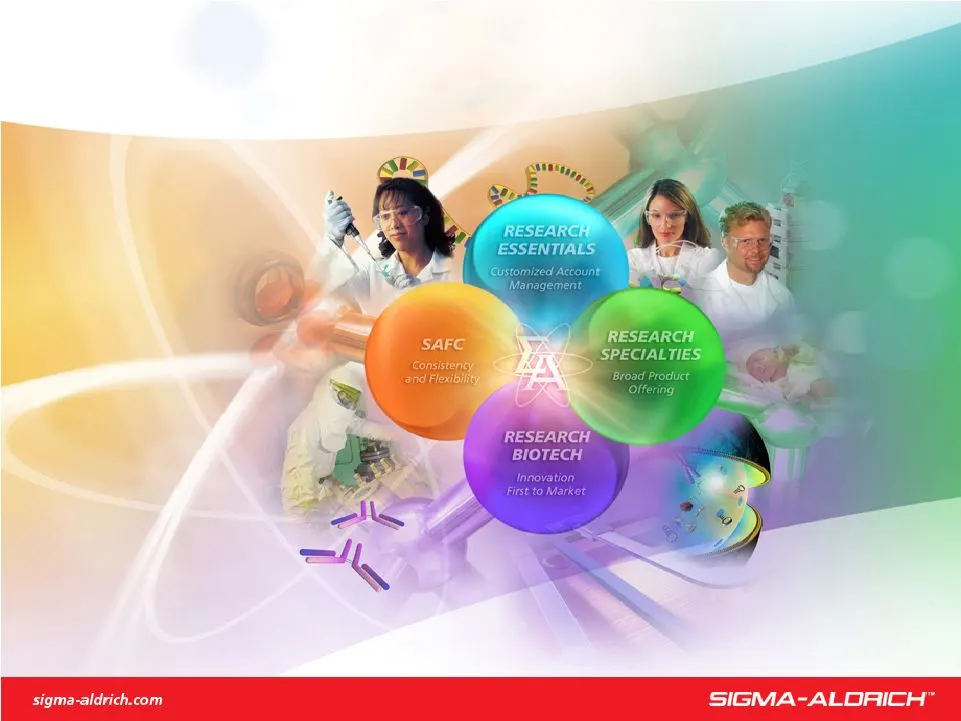
Sigma-Aldrich Corporation We are Committed to Accelerating our Customers’ Success through Leadership in Life Science, High Technology and Service
Source: SEC EDGAR · 8-K filed Mar 19, 2008
More decks from Sigma-Aldrich Corp
 Merger or Acquisition (October 2014)40 slides · Oct 2, 2014
 Merger or Acquisition (September 2014)11 slides · Sep 23, 2014
 Merger or Acquisition (September 2014)55 slides · Sep 22, 2014
 J.P. Morgan Healthcare Conference 201428 slides · Jan 13, 2014
 Investor Presentation (September 2013)25 slides · Sep 11, 2013
 Q2 2013 Earnings Presentation17 slides · Jul 23, 2013