Southern Union — Non-Deal Roadshow (August 2010)
22 slides from Southern Union's roadshow presentation, Aug 18, 2010
Slide 1: Natural Gas Infrastructure & Production Investor Meetings
Tuohy Brothers Natural Gas Infrastructure & Production Investor Meetings August 18, 2010 www.sug.com
Slide 2: Forward Looking Statements
Forward Looking Statements Forward-Looking Statements contained in this presentation that include company expectations or predictions di ti off th the ffuture t are fforward-looking d l ki statements t t t iintended t d d tto b be covereddb by the safe harbor provisions of the Securities Act of 1933
Slide 3: Company Overview
Company Overview • Focus F on naturall gas infrastructure i f – Attractive industry outlook – Natural g gas is keyy to America’s energy gy future – High-quality assets with diverse supply and strong markets • Principally regulated asset base – Provides d earnings andd cash h fl flow stability b l th
Slide 4: Map of Operations
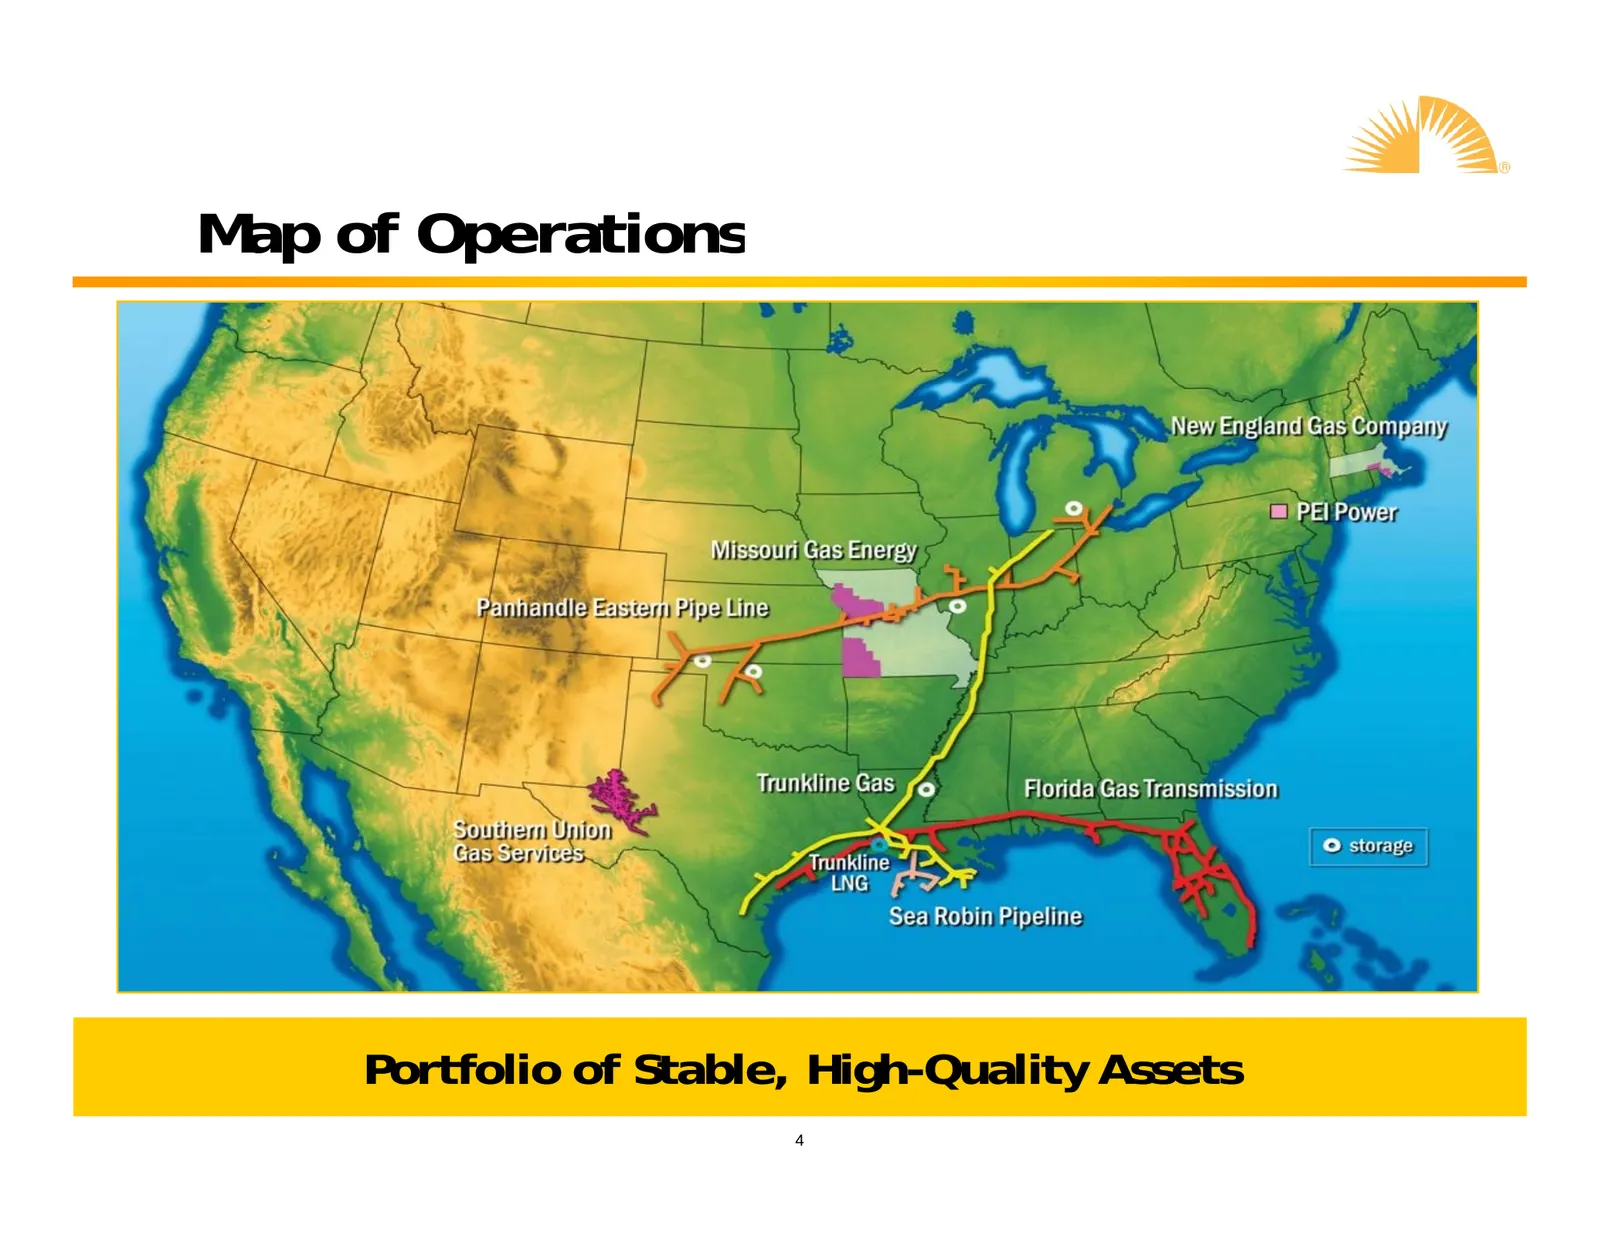
Map of Operations Portfolio of Stable, High-Quality Assets 4
Slide 5: Company Facts
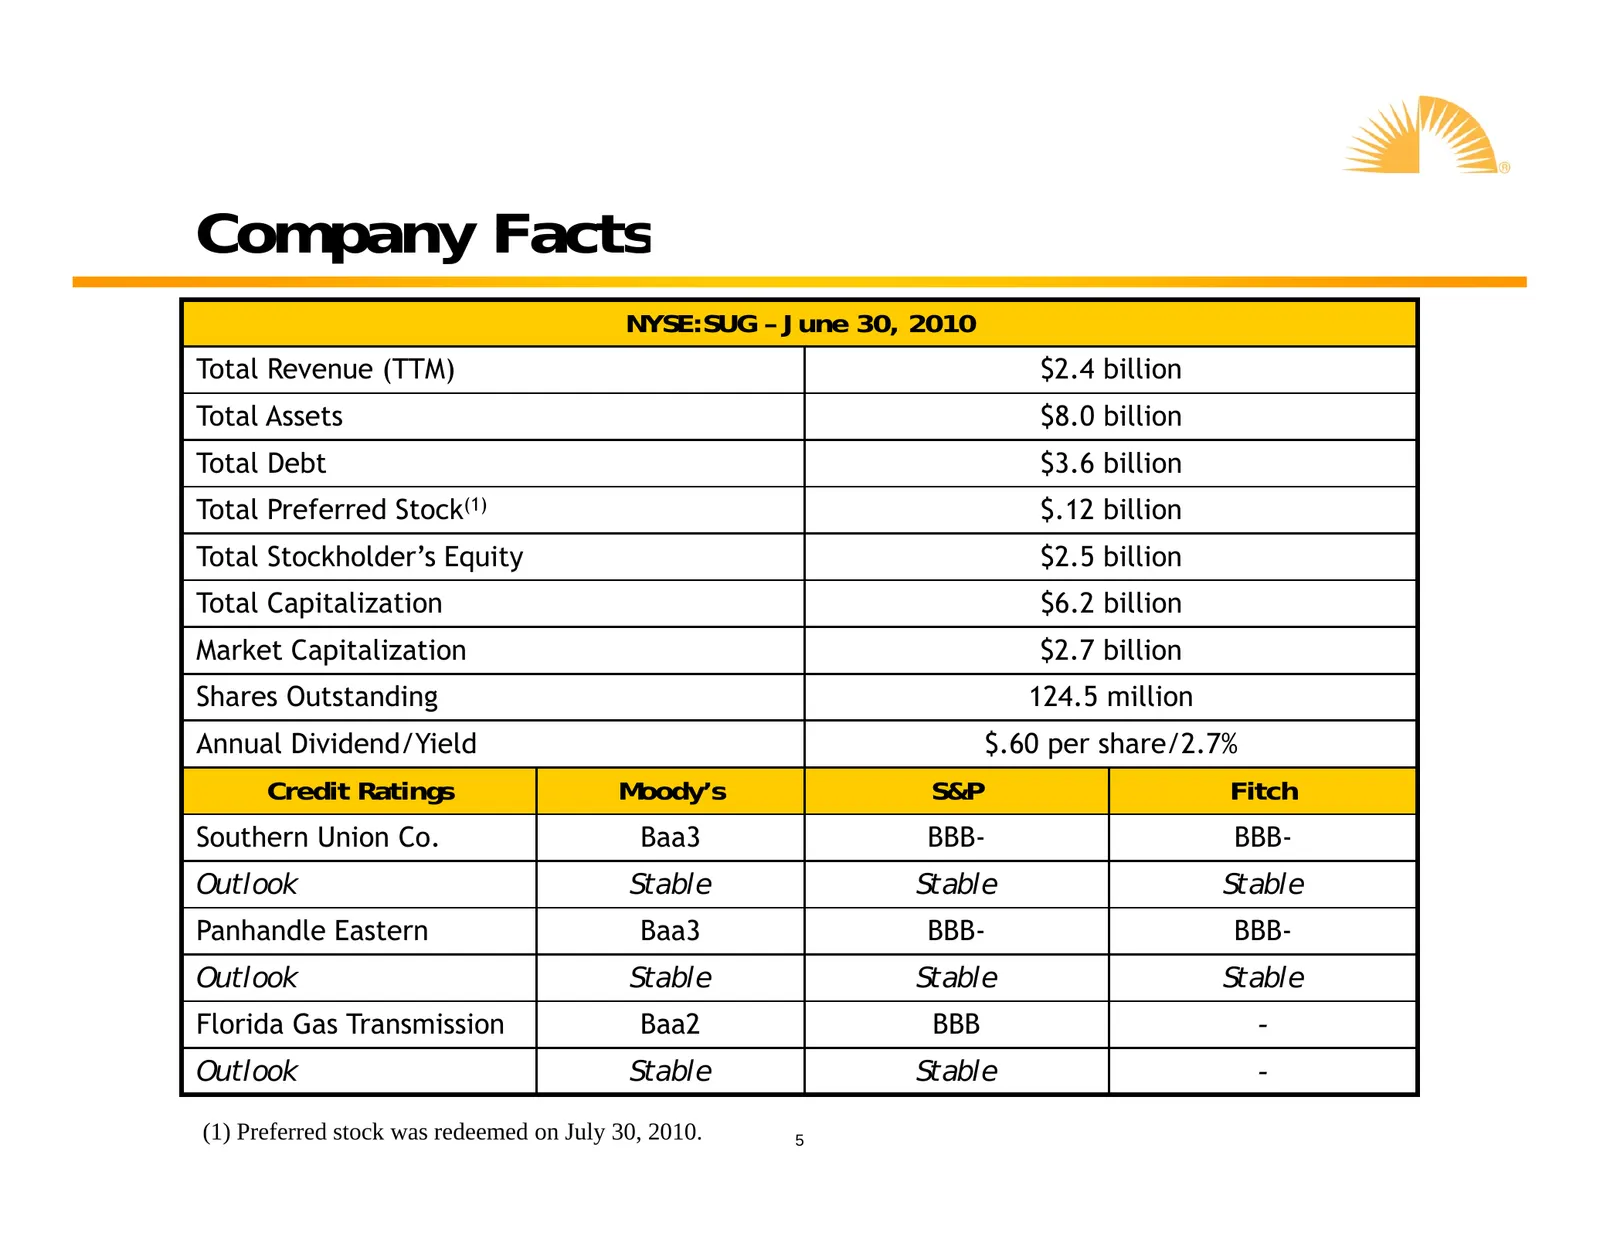
Company Facts NYSE:SUG – June 30, 2010 Total Revenue ((TTM)) $2.4 billion Total Assets $8.0 billion Total Debt $3.6 billion Total Preferred Stock(1) $.12 billion Total Stockholder’s Equity $2.5 billion Total Capitalization $6.2 billion Market Capitalization $2.7 billion Shares Outstanding 124 5 mill
Slide 6: Transportation & Storage
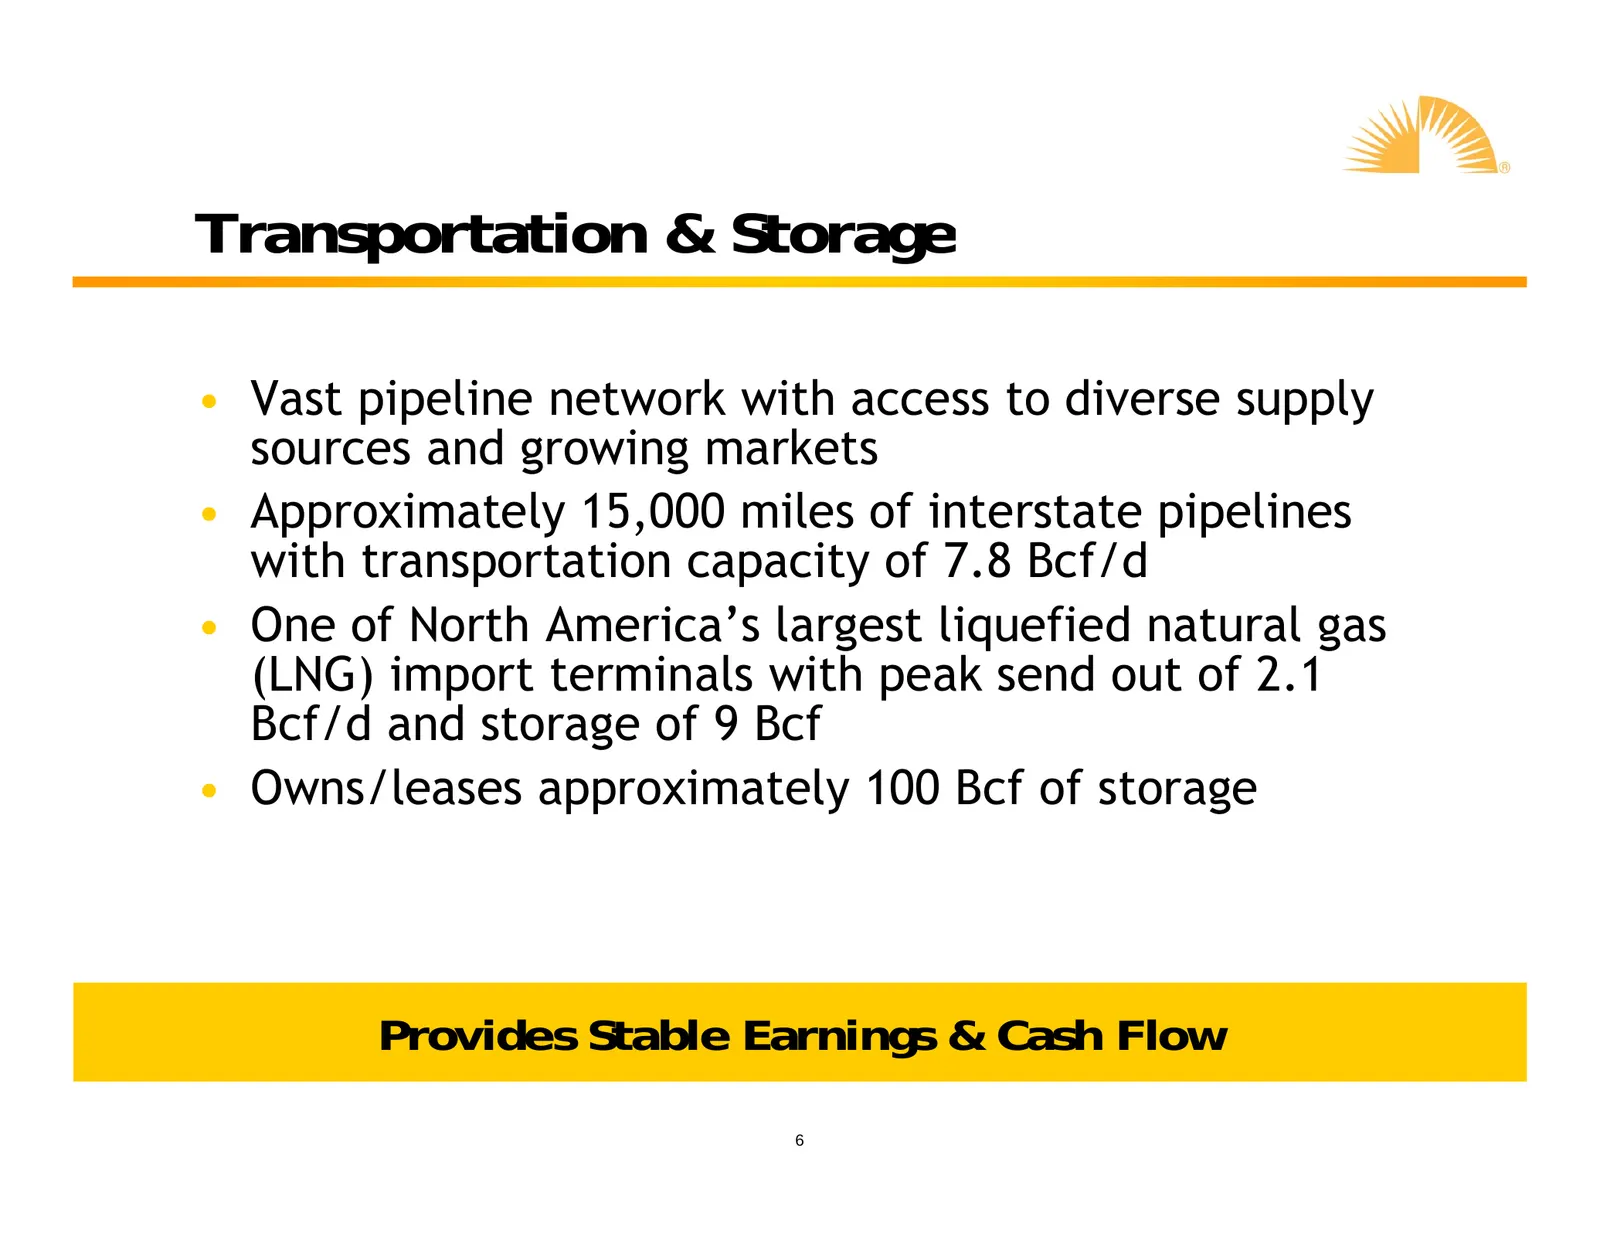
Transportation & Storage • Vast V t pipeline i li network t k with ith access tto di diverse supply l sources and growing markets • Approximately 15,000 miles of interstate pipelines with transportation capacity of 7.8 Bcf/d • One of North America’s largest liquefied natural gas ((LNG)) import p ter
Slide 7: Transportation & Storage Assets
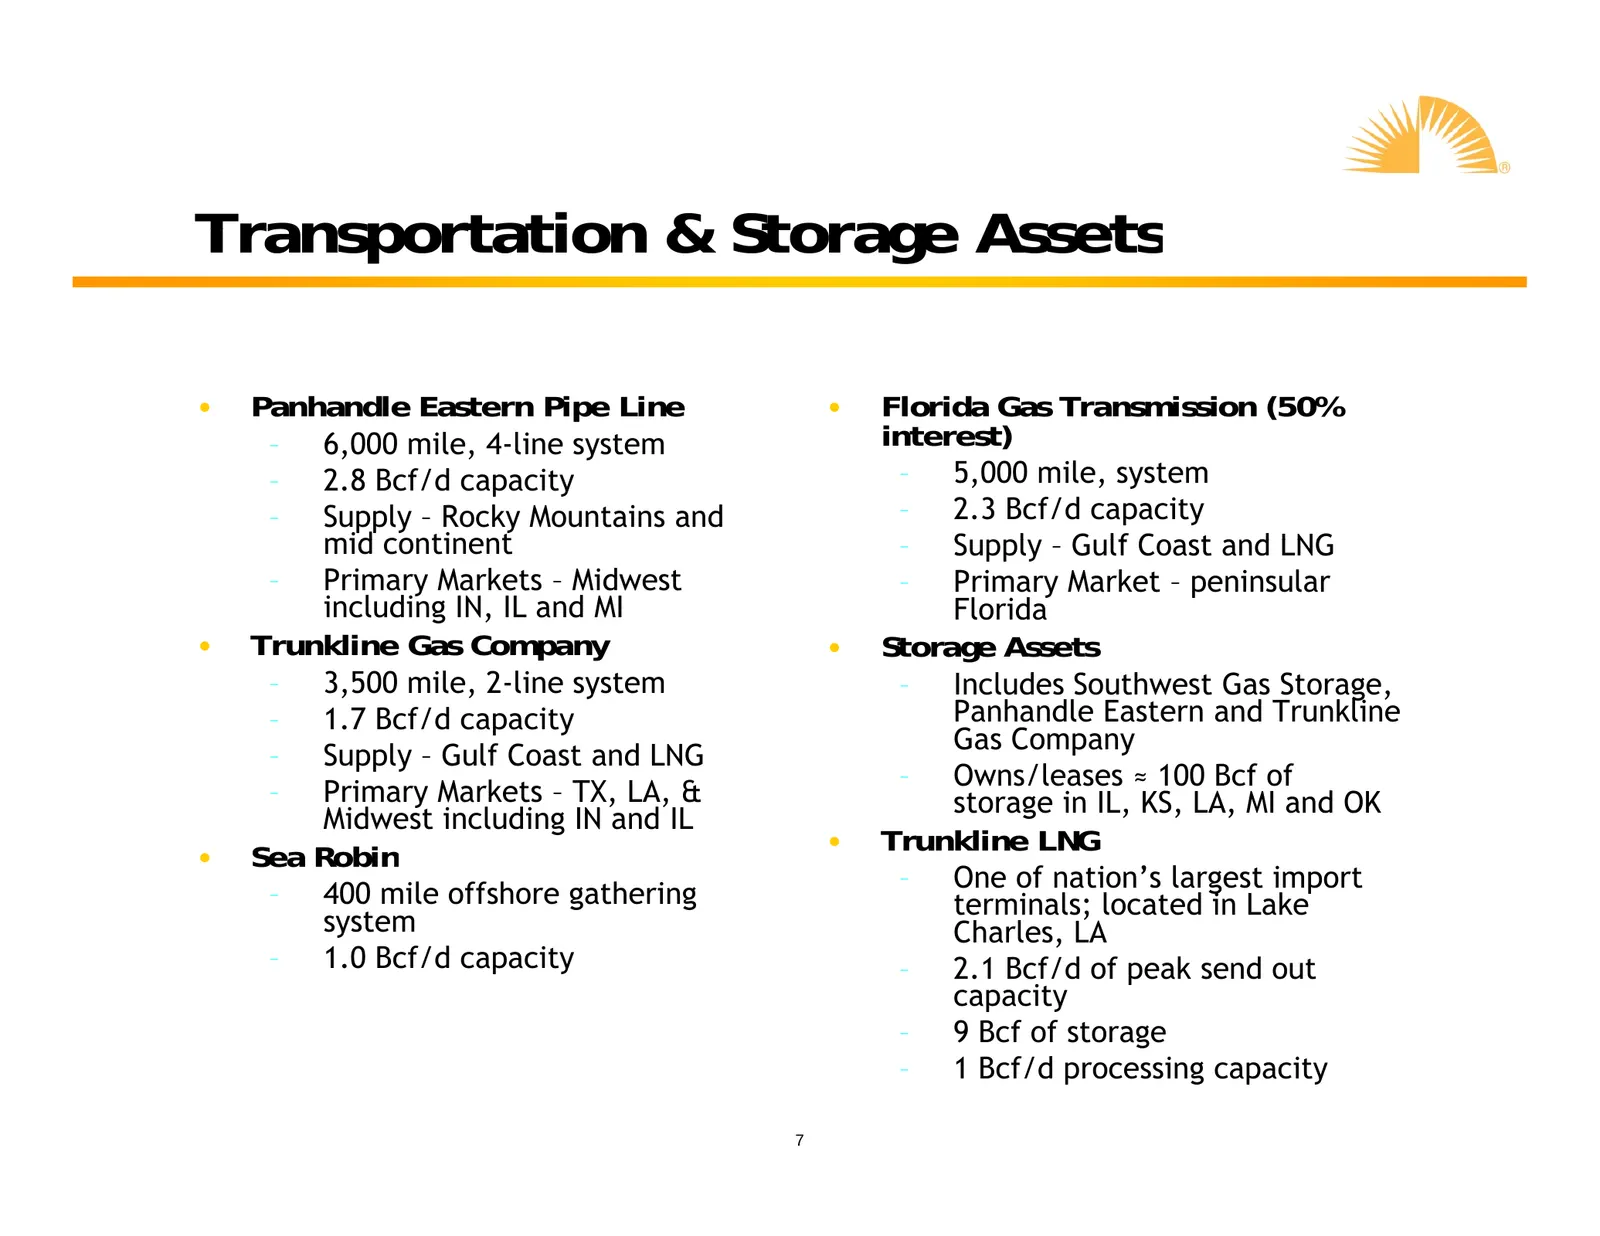
Transportation & Storage Assets • Panhandle Eastern Pipe Line • Florida Gas Transmission (50% – 6,000 mile, 4-line system interest) – 2.8 Bcf/d capacity – 5,000 mile, system – Supply – Rocky Mountains and – 2.3 Bcf/d capacity mid continent – S Supply l – Gulf G lf Coast C t andd LNG – Primary Market
Slide 8: Trunkline LNG: Infrastructure Enhancement Project
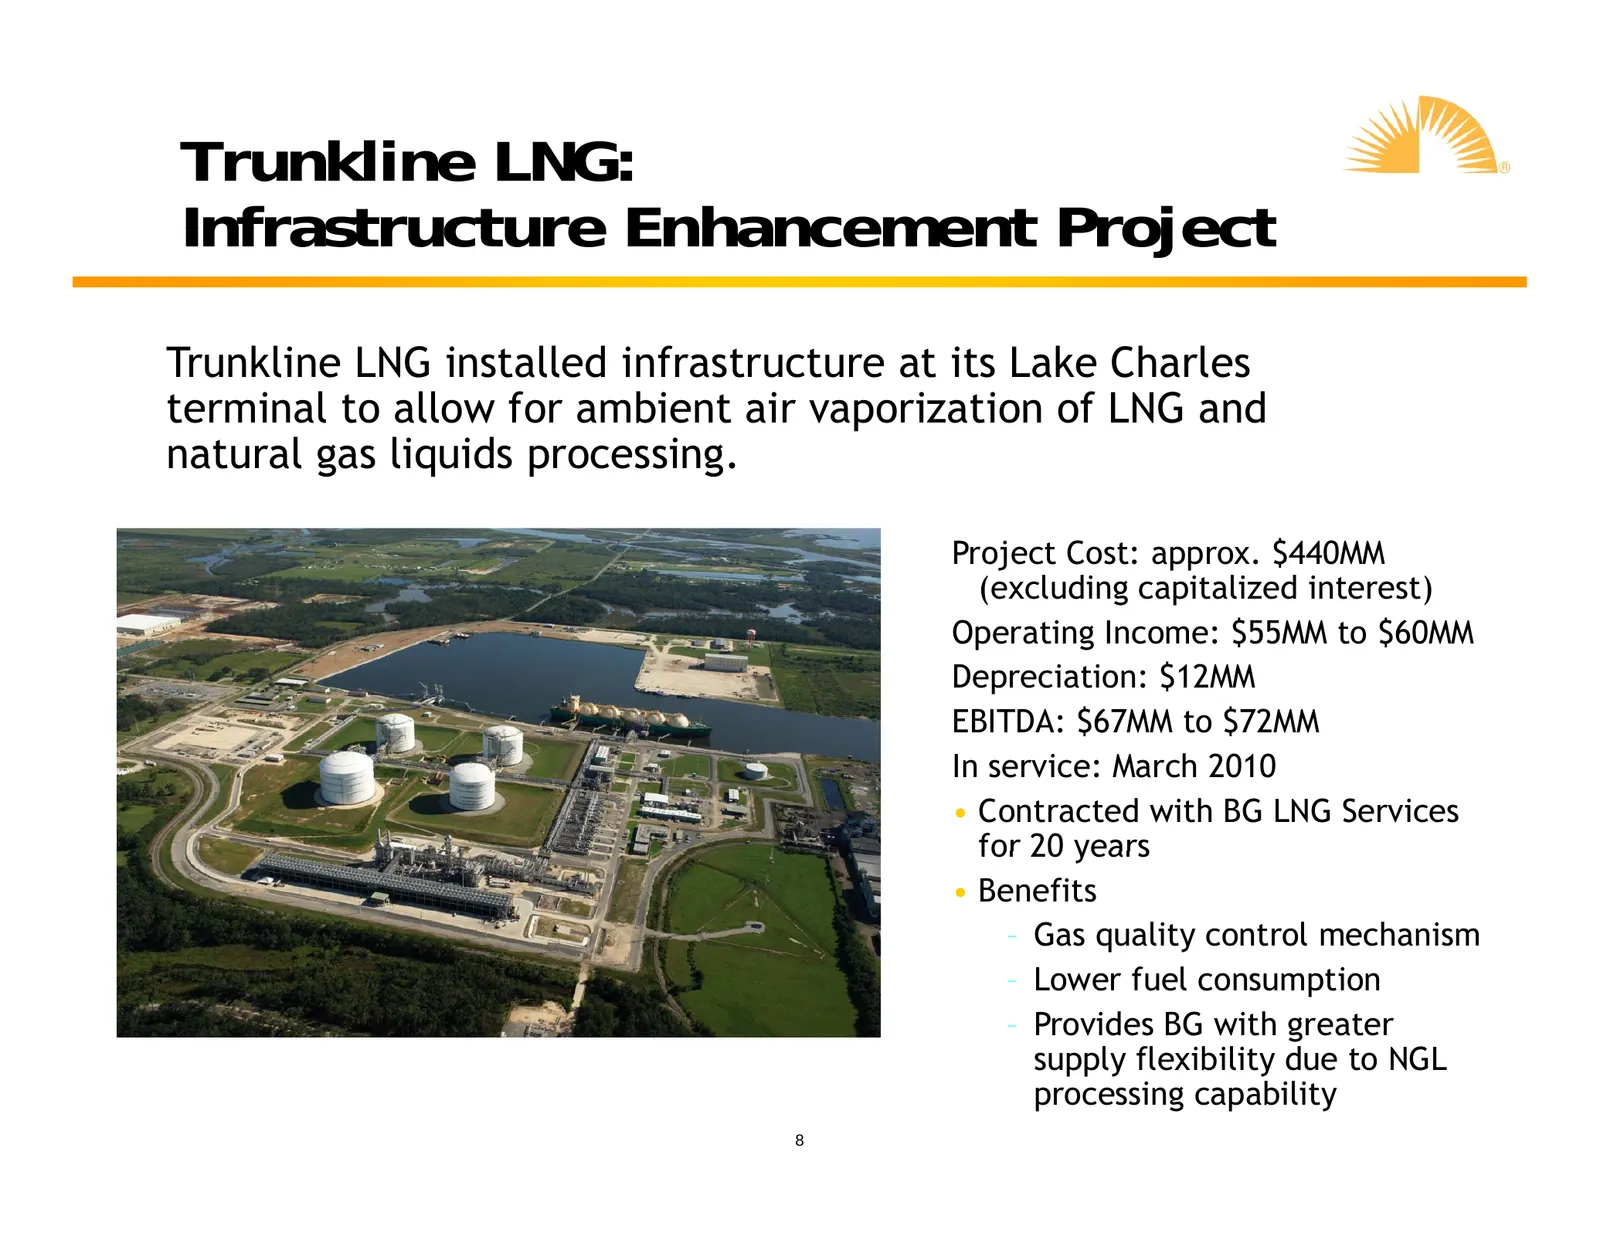
Trunkline LNG: Infrastructure Enhancement Project Trunkline LNG installed infrastructure at its Lake Charles terminal to allow for ambient air vaporization of LNG and natural gas liquids processing. Project Cost: approx. $440MM $ (excluding capitalized interest) Operating Income: $55MM to $60MM Depr
Slide 9: FGT Phase VIII Expansion
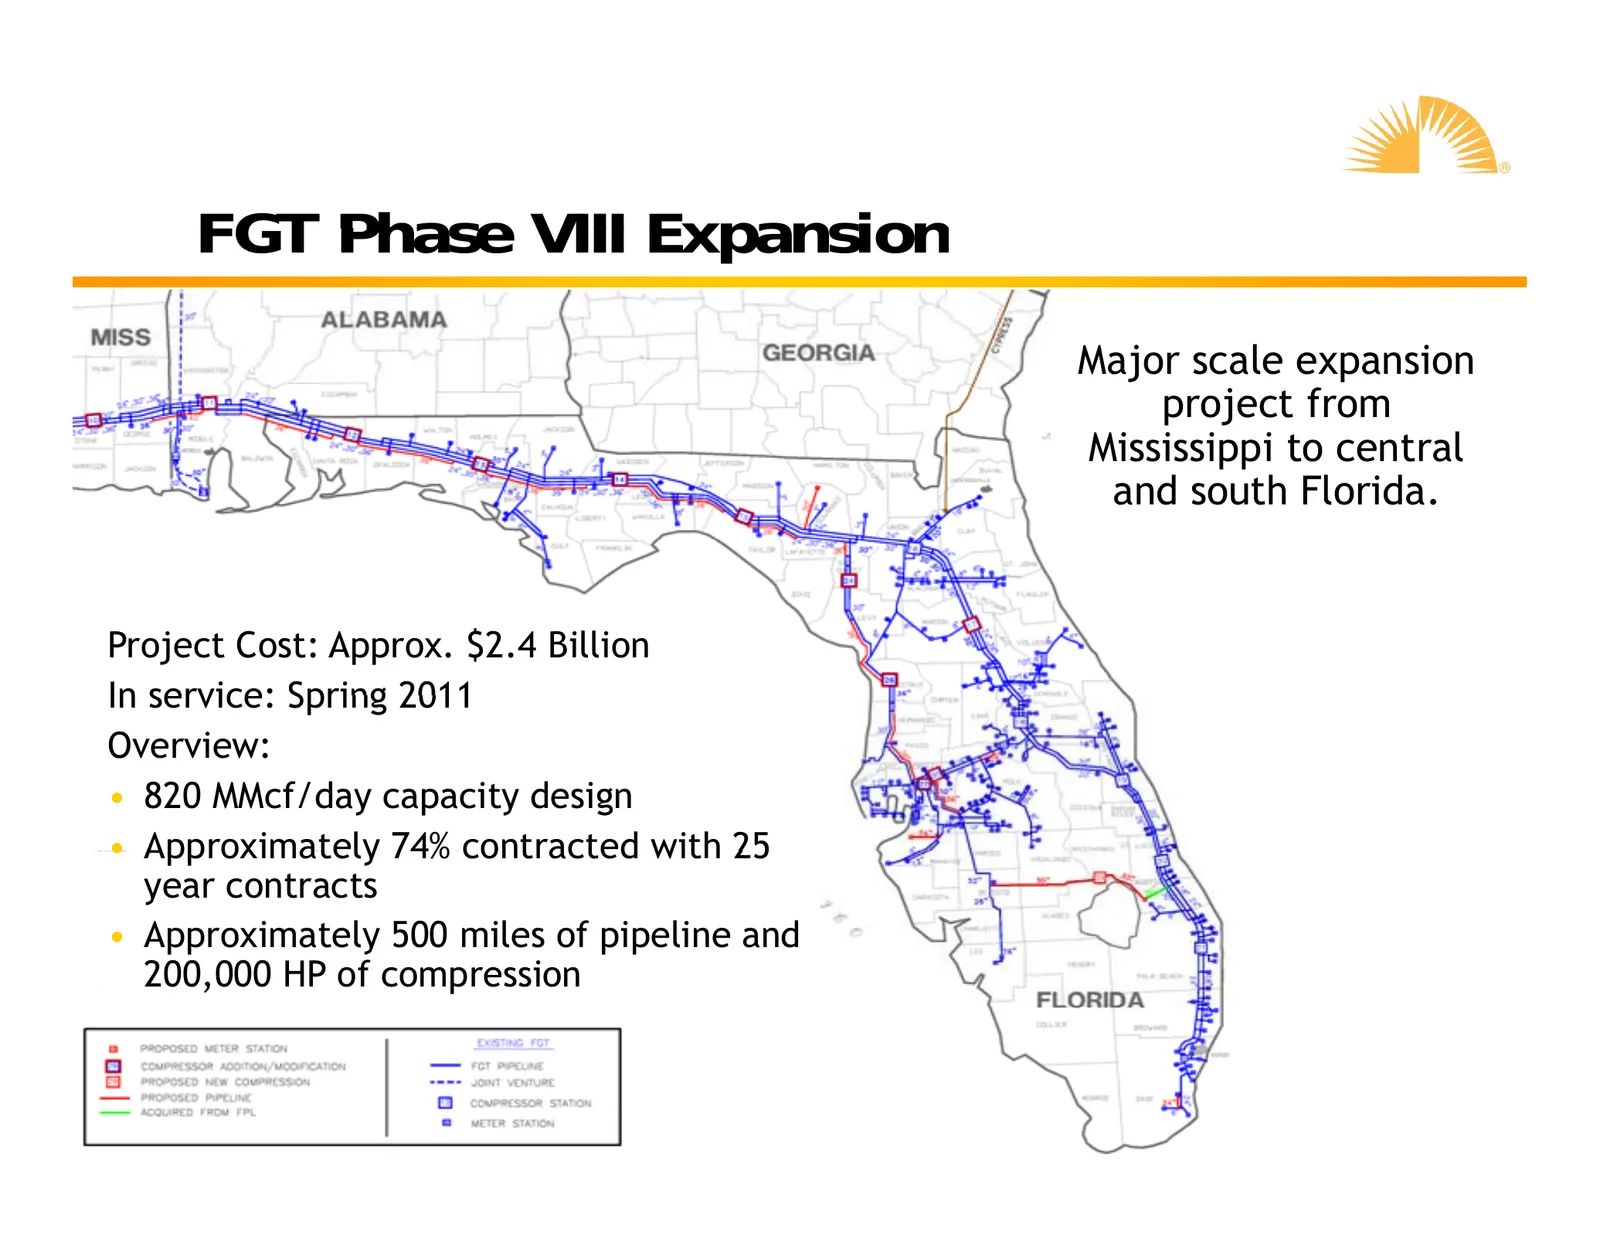
FGT Phase VIII Expansion Major scale expansion project from Mississippi to central and south Florida. Project Cost: Approx. $2.4 Billion In service: Spring 2011 Overview: • 820 MMcf/day capacity design • Approximately 74% contracted with 25 year contracts • Approximately 500 miles of pipeline and 20
Slide 10: FGT Phase VIII Expansion Timeline
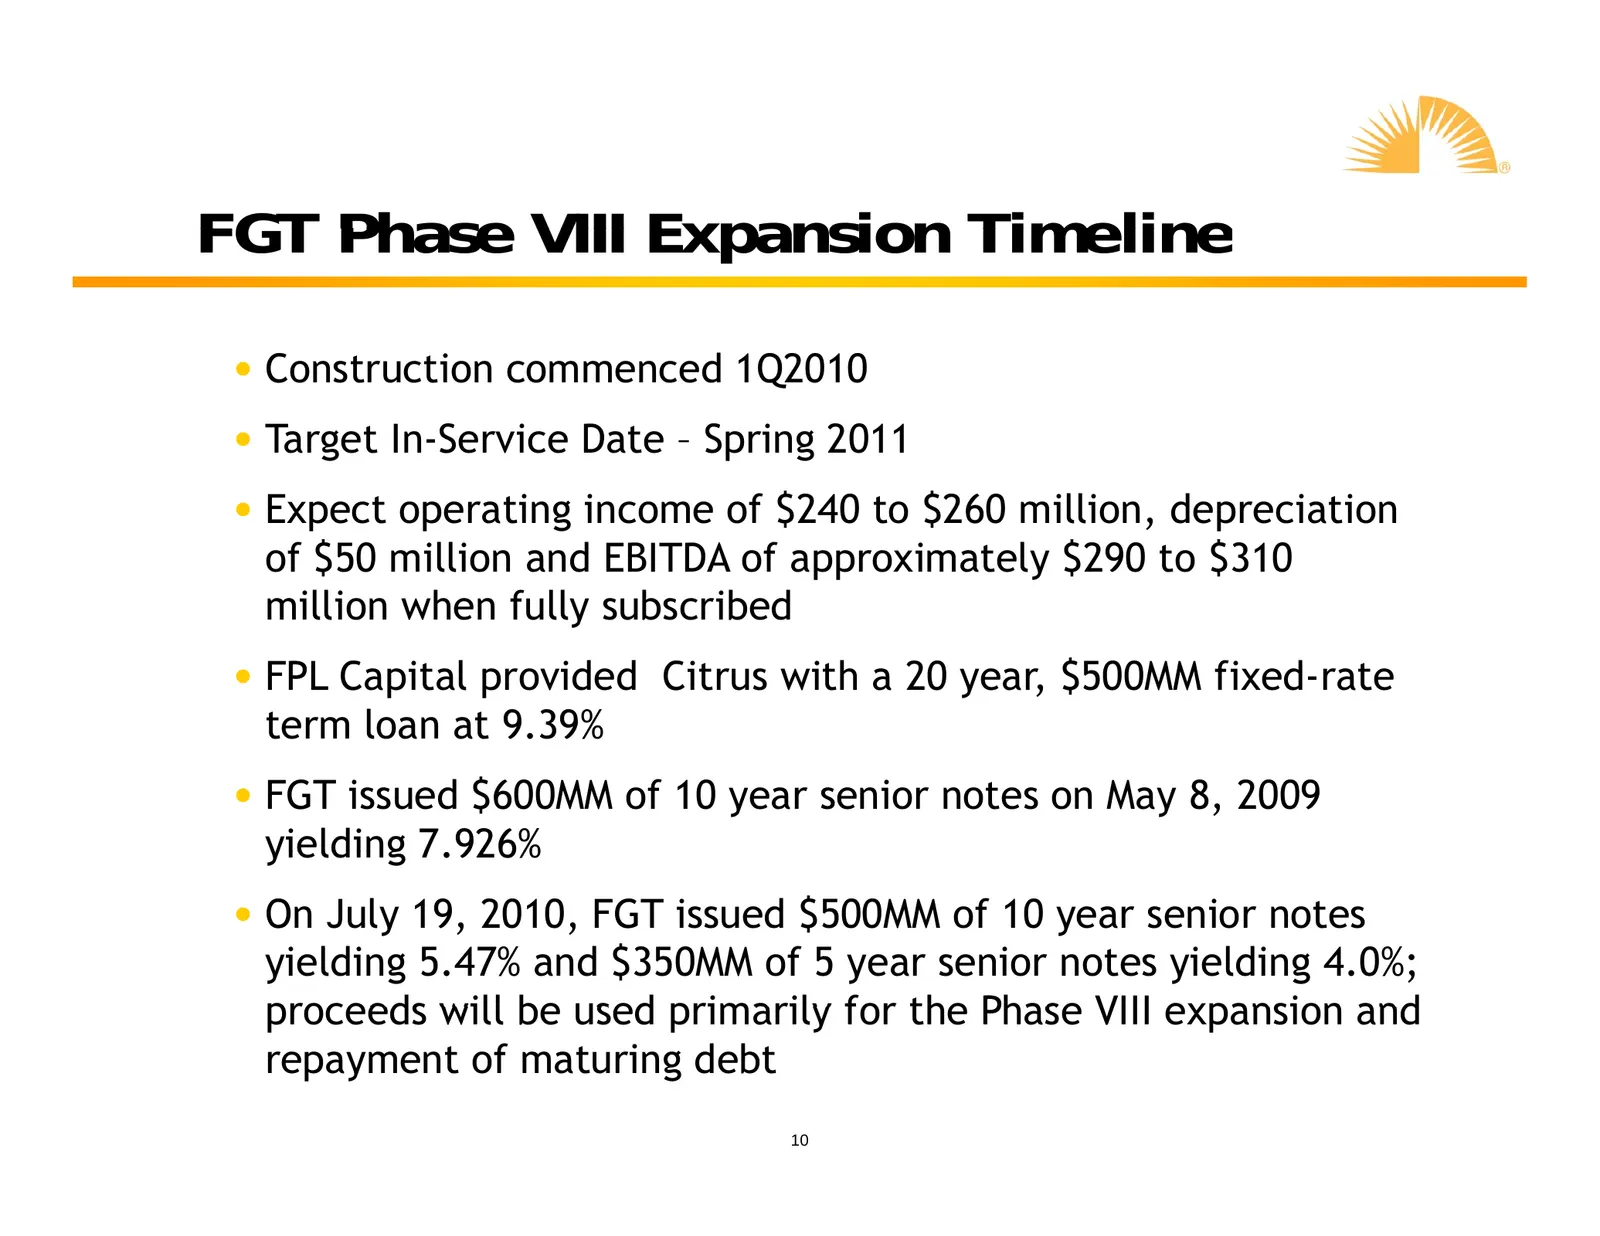
FGT Phase VIII Expansion Timeline • Construction commenced 1Q2010 Q • Target In-Service Date – Spring 2011 • Expect operating income of $240 to $260 million, depreciation of $50 $ million and EBITDA of approximately $ $290 to $ $310 million when fully subscribed • FPL Capital p provided Citrus with
Slide 11: FGT Pascagoula Lateral
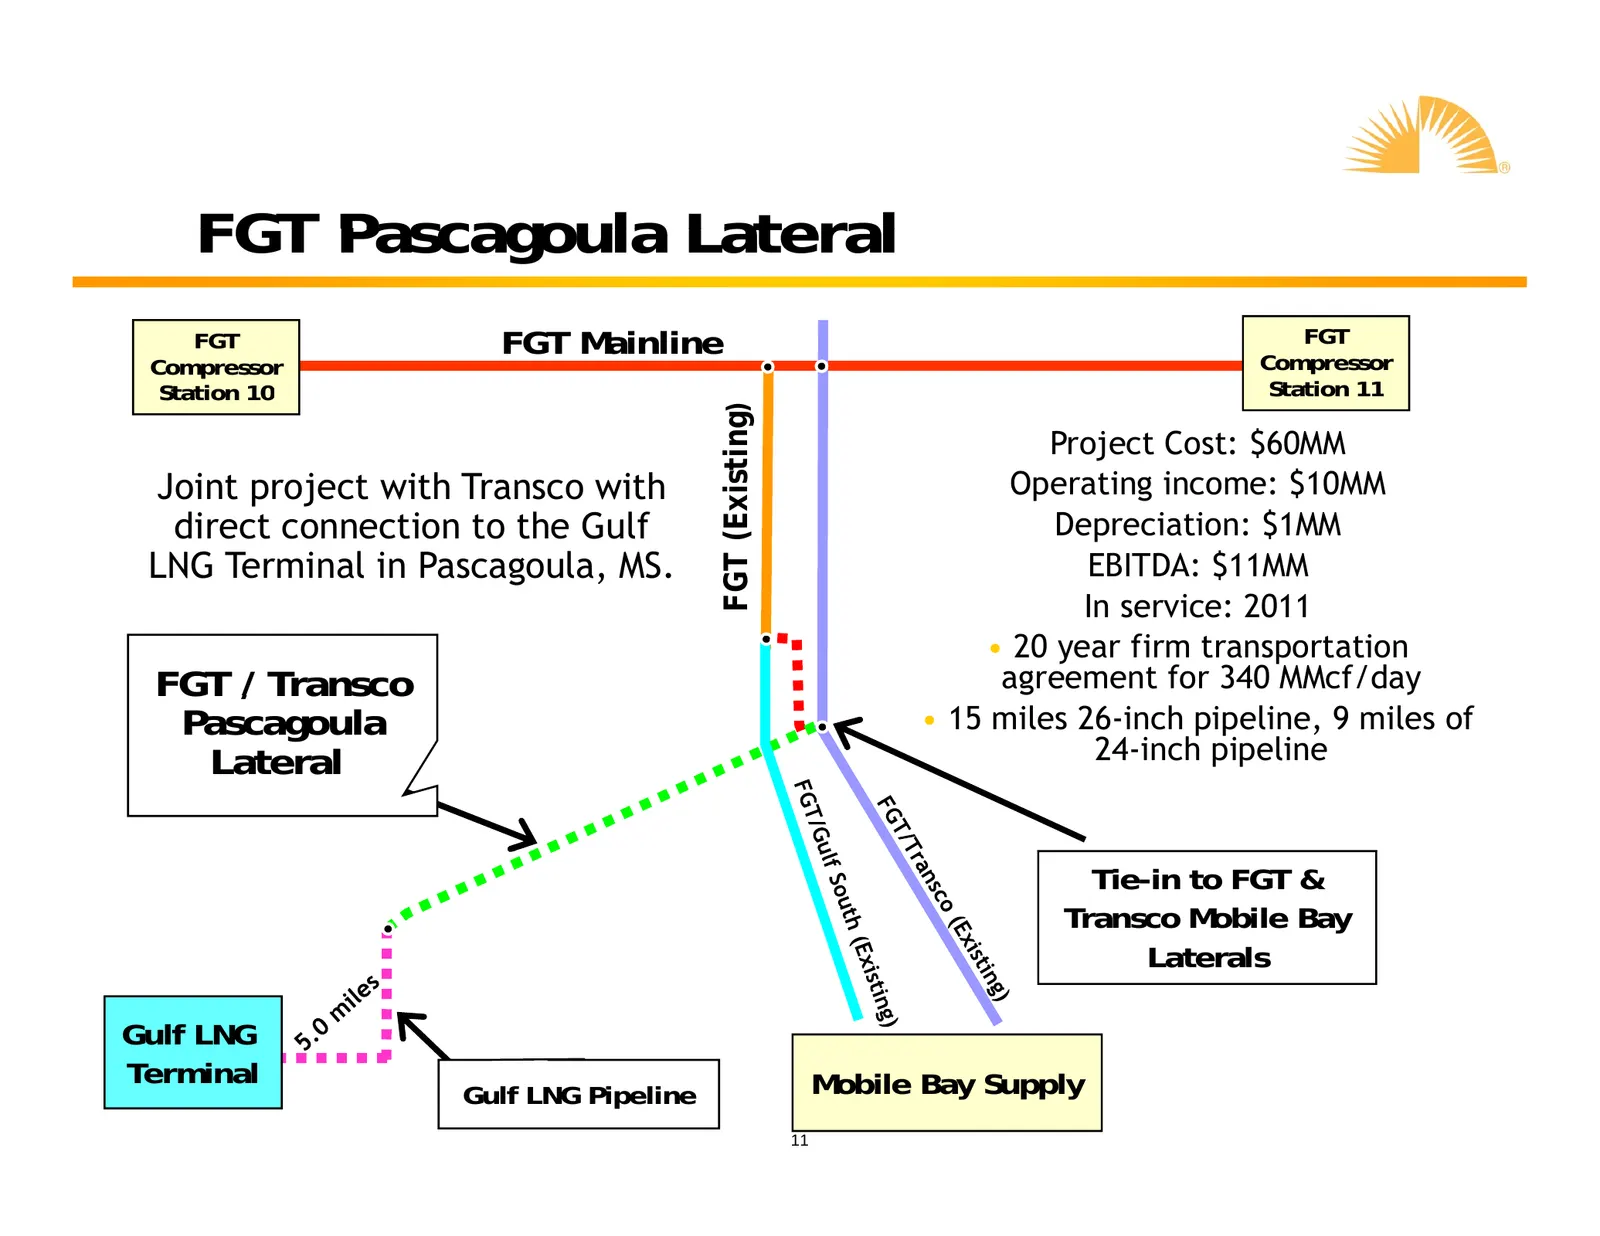
FGT Pascagoula Lateral FGT FGT Mainline FGT Compressor Compressor S i 10 Station Station 11 FGT (Existing) Project Cost: $60MM Joint project with Transco with Operating income: $10MM direct connection to the Gulf Depreciation: p $1MM LNG Terminal in Pascagoula, MS. EBITDA: $11MM In service: 2011 • 2
Slide 12: Gathering & Processing
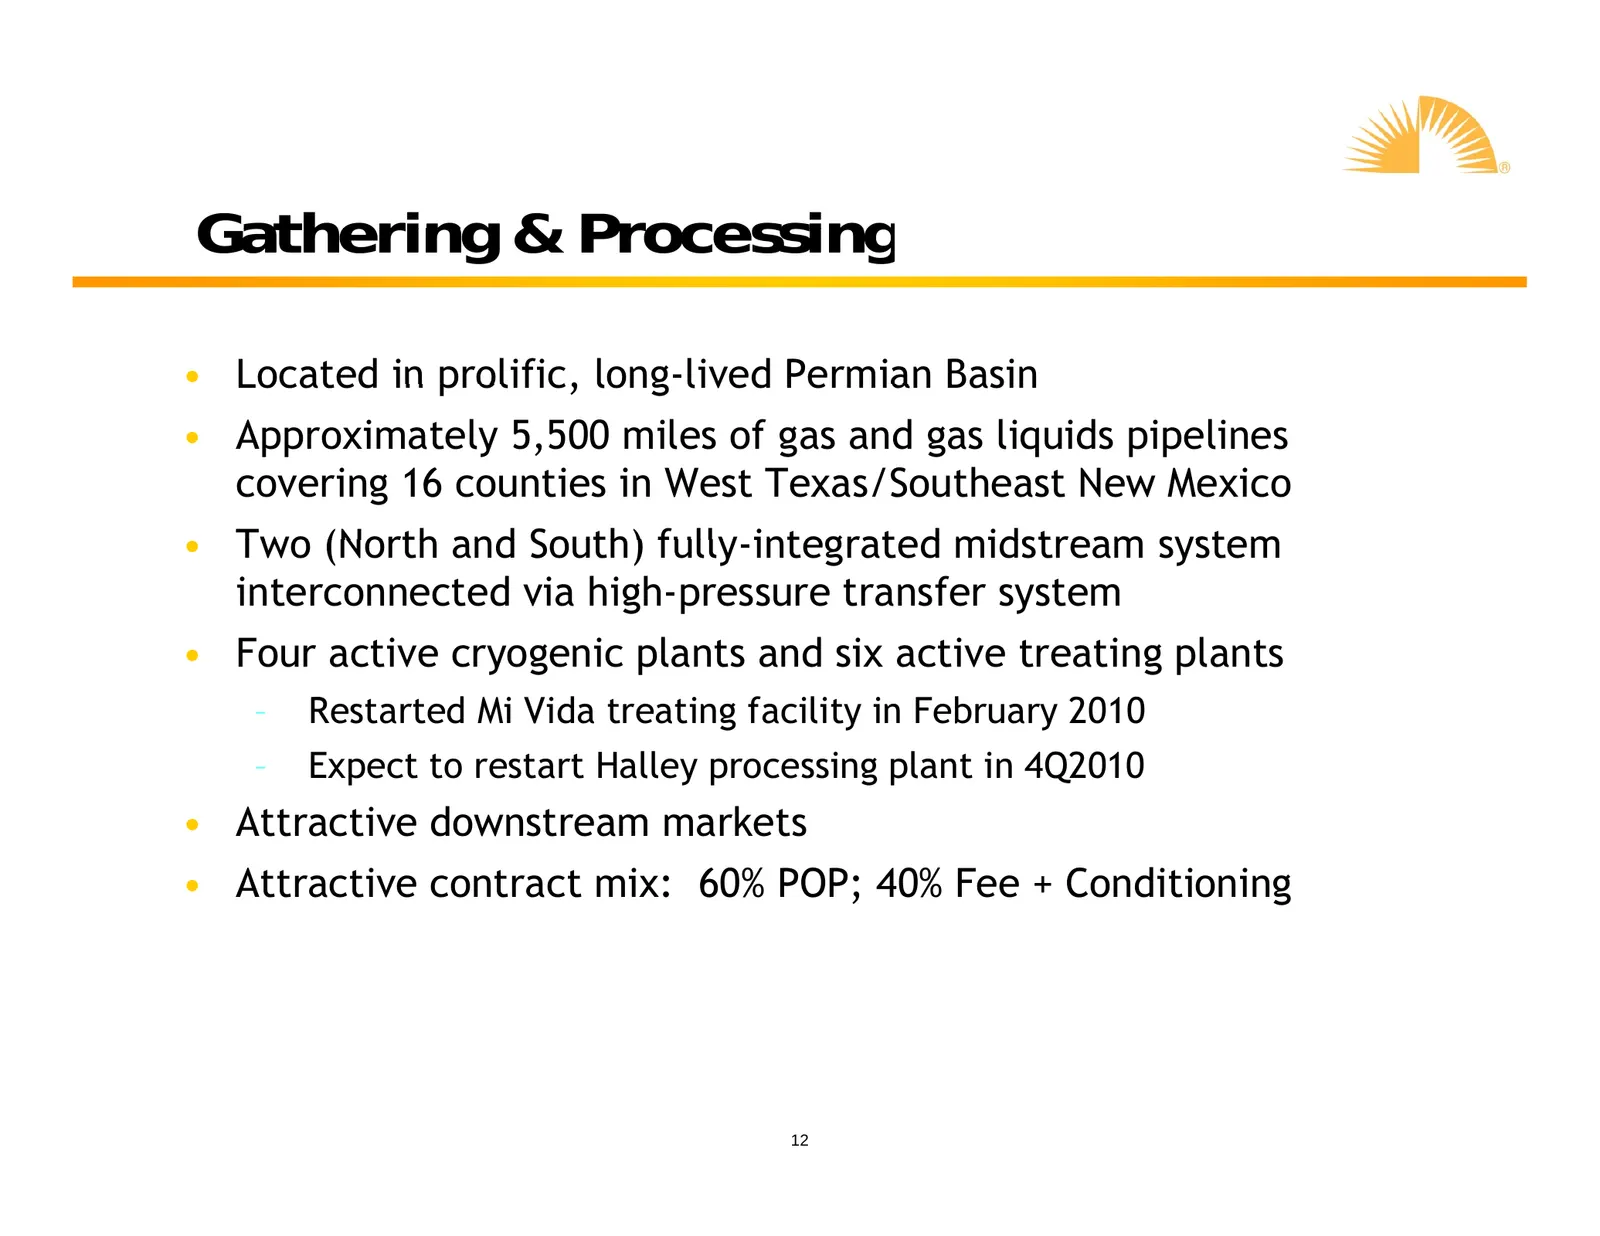
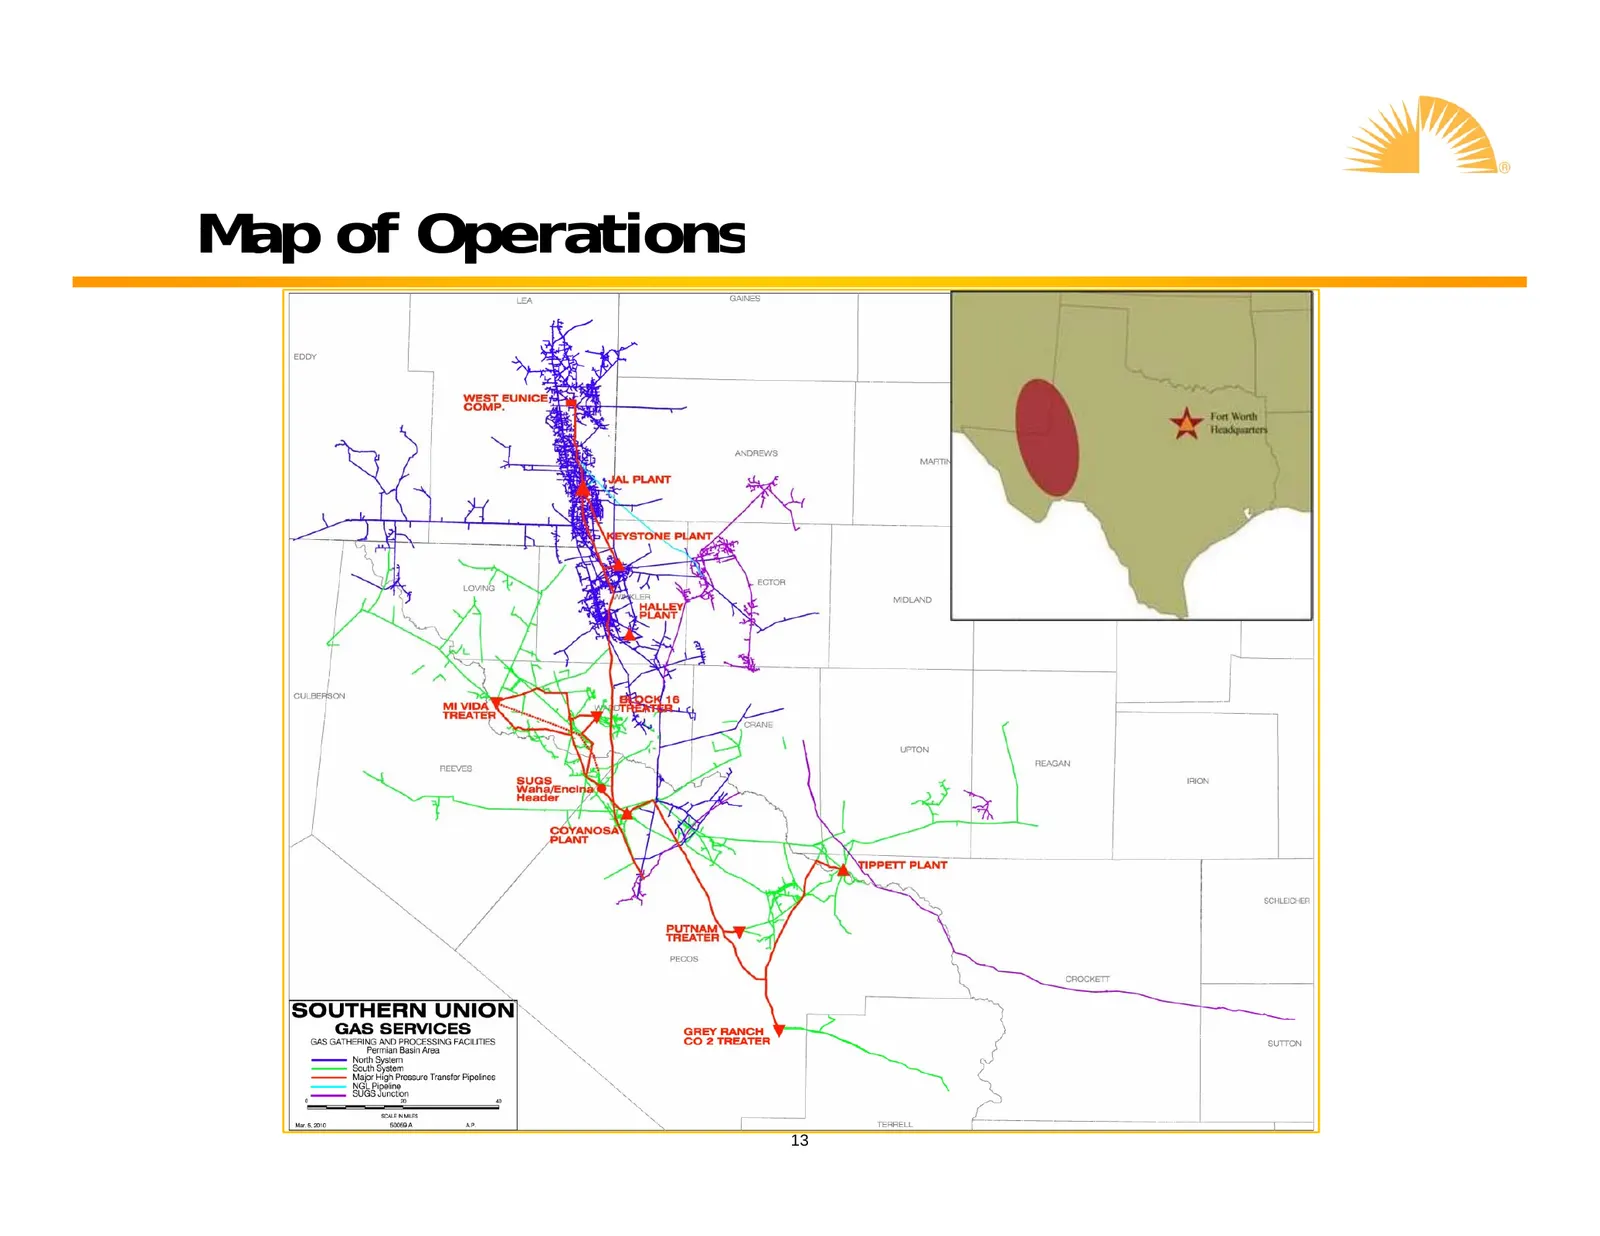
Gathering & Processing • Located in prolific, long-lived long lived Permian Basin • Approximately 5,500 miles of gas and gas liquids pipelines covering 16 counties in West Texas/Southeast New Mexico • Two (North and South) fully fully-integrated integrated midstream system interconnected via high-pr
Slide 13: Map of Operations
BK "Ae i gee 40: SOUTHERN UNION Map of Operations 13
Slide 14: North System
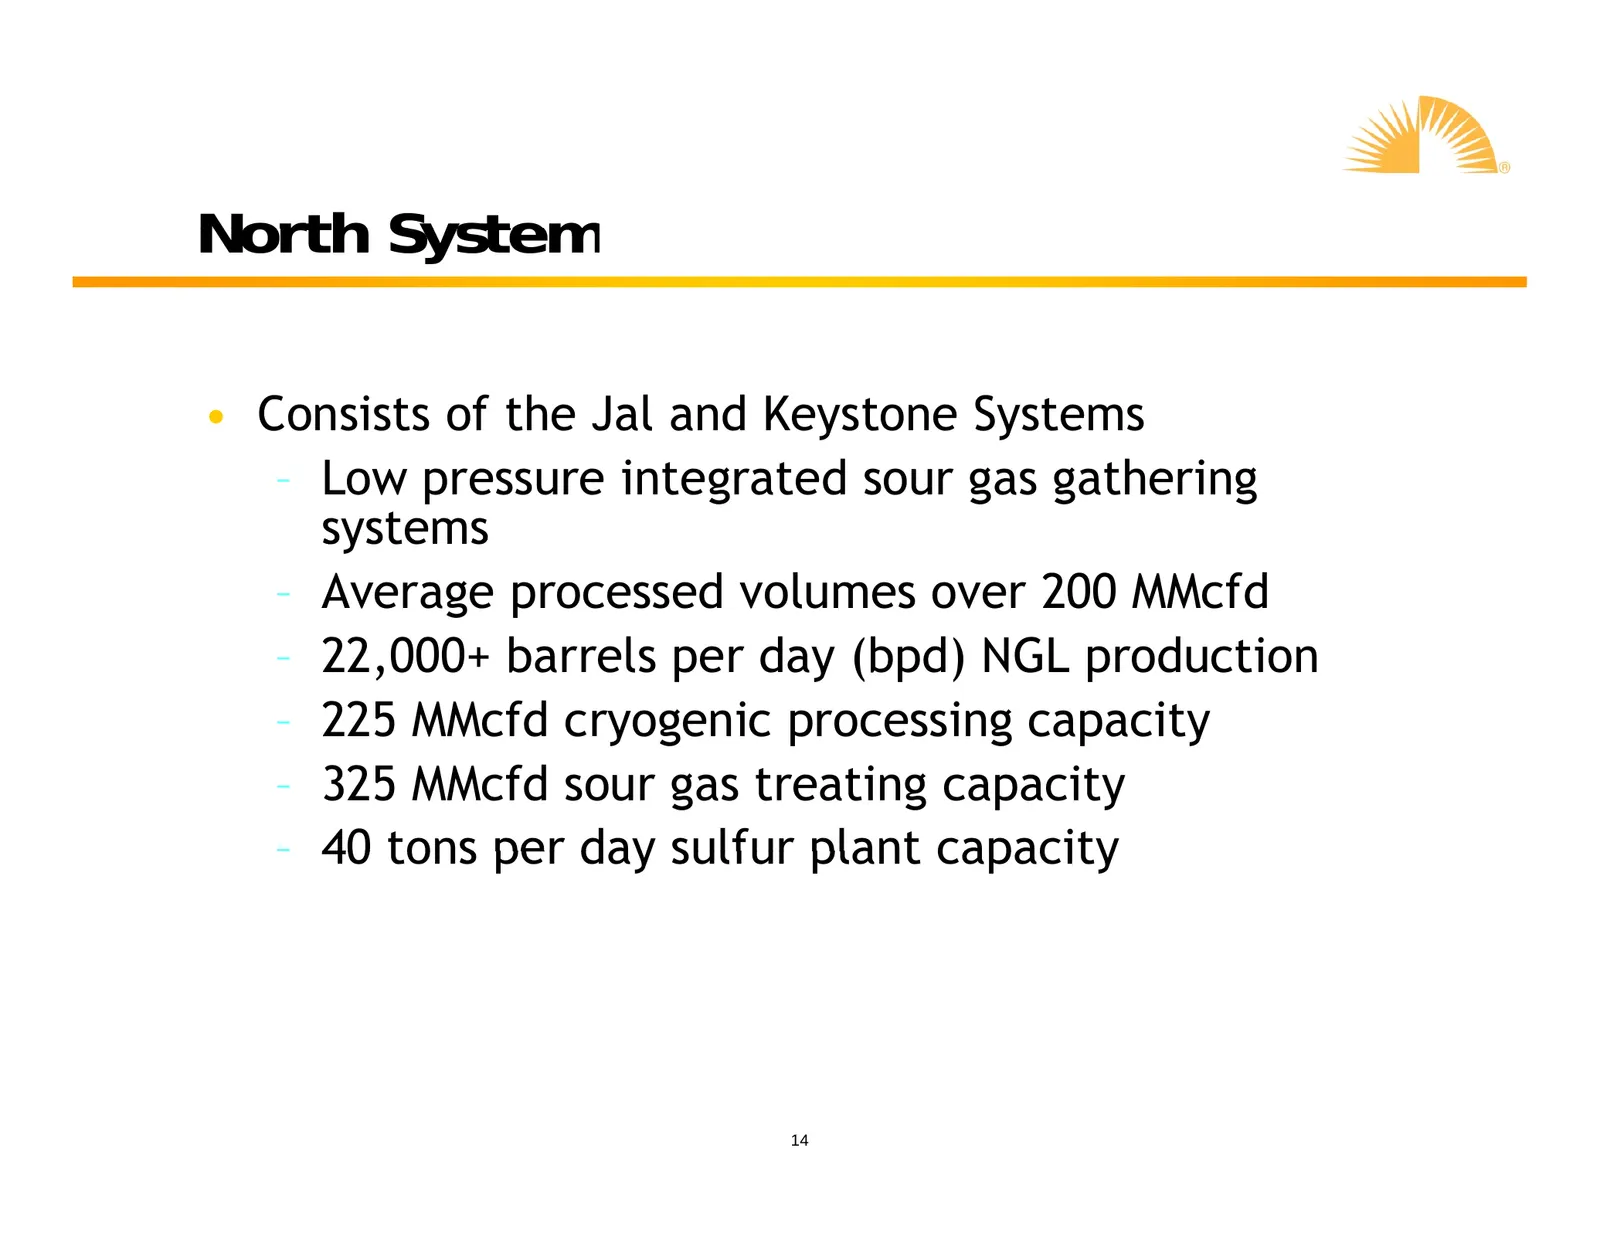
North System • Consists of the Jal and Keystone Systems – Low pressure integrated sour gas gathering systems – Average processed volumes over 200 MMcfd – 22,000+ barrels per day (bpd) NGL production – 225 MMcfd cryogenic processing capacity – 325 MMcfd sour gas treating capacity – 40 tons per day su
Slide 15: South System
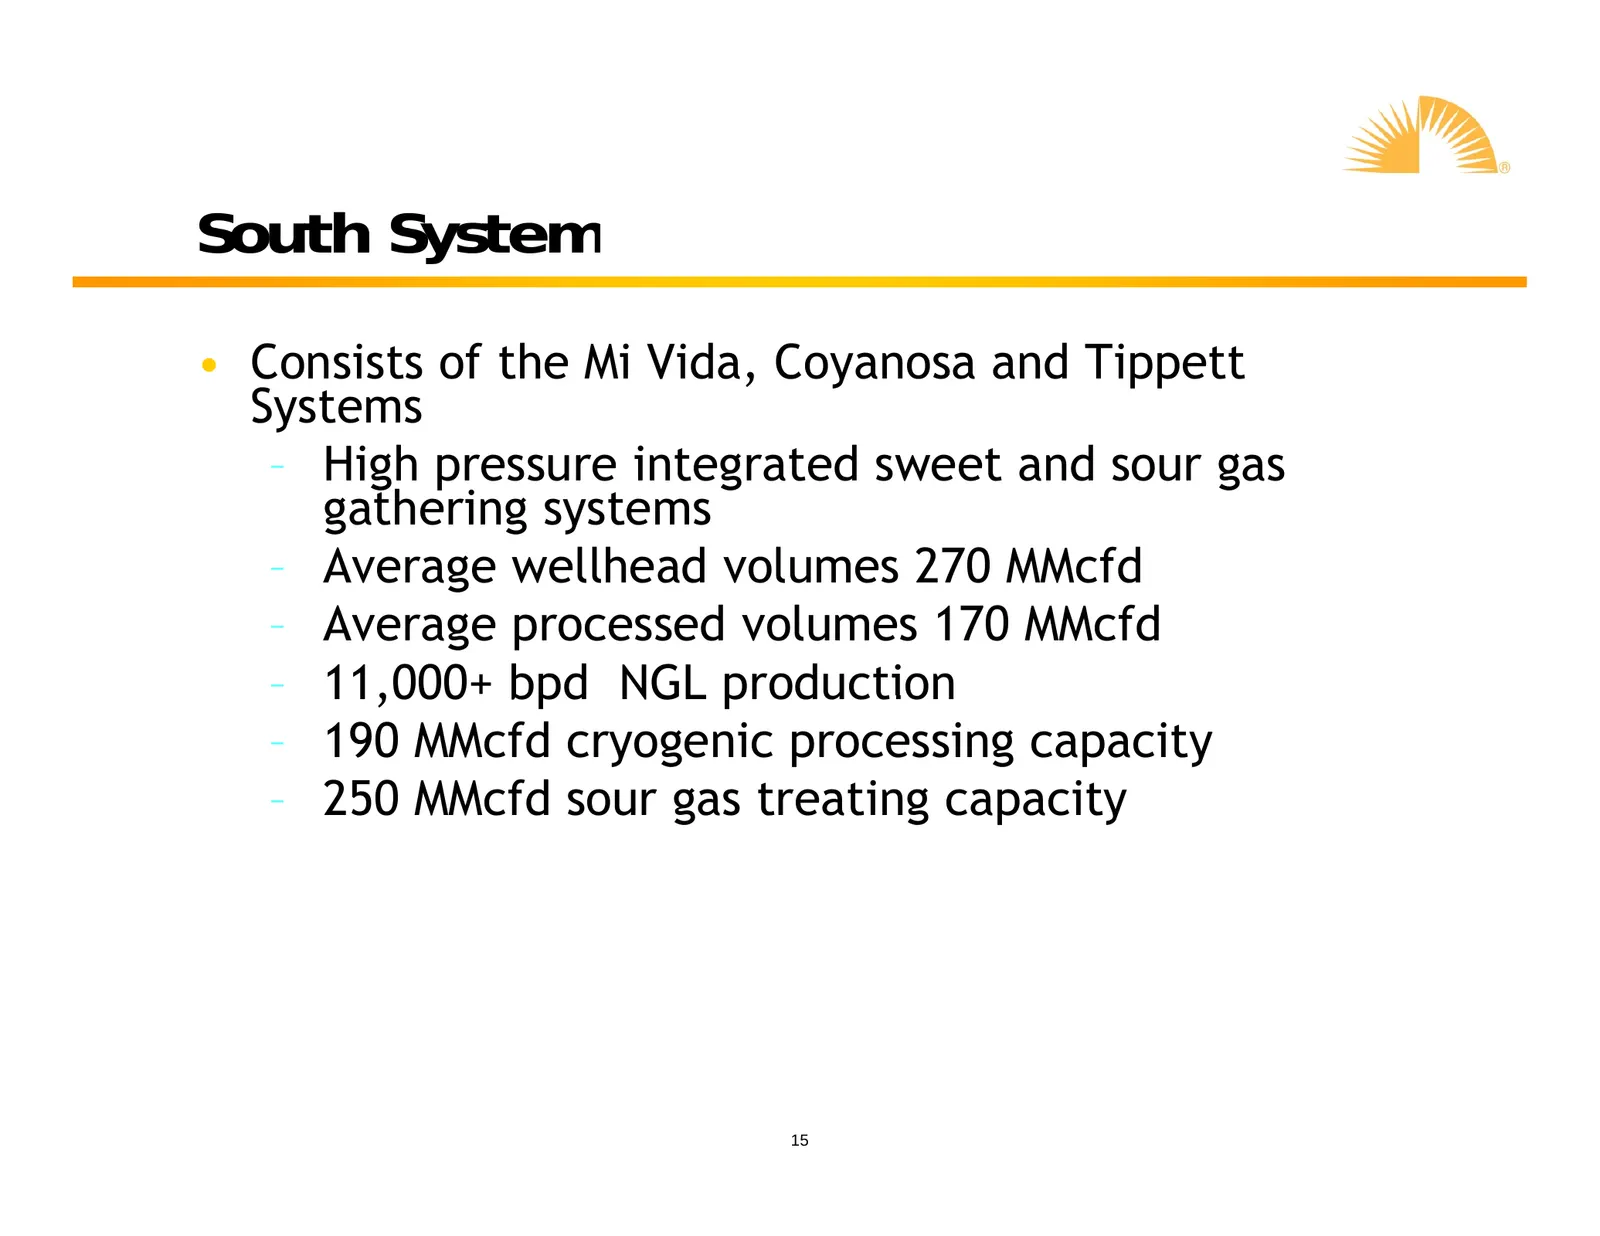
South System • Consists of the Mi Vida,, Coyanosa y and Tippett pp Systems – High pressure integrated sweet and sour gas gathering systems – Average wellhead volumes 270 MMcfd – Average processed volumes 170 MMcfd – 11,000 11,000+ bpd NGL production – 190 MMcfd cryogenic processing capacity – 250 MM
Slide 16: High Pressure Transfer System
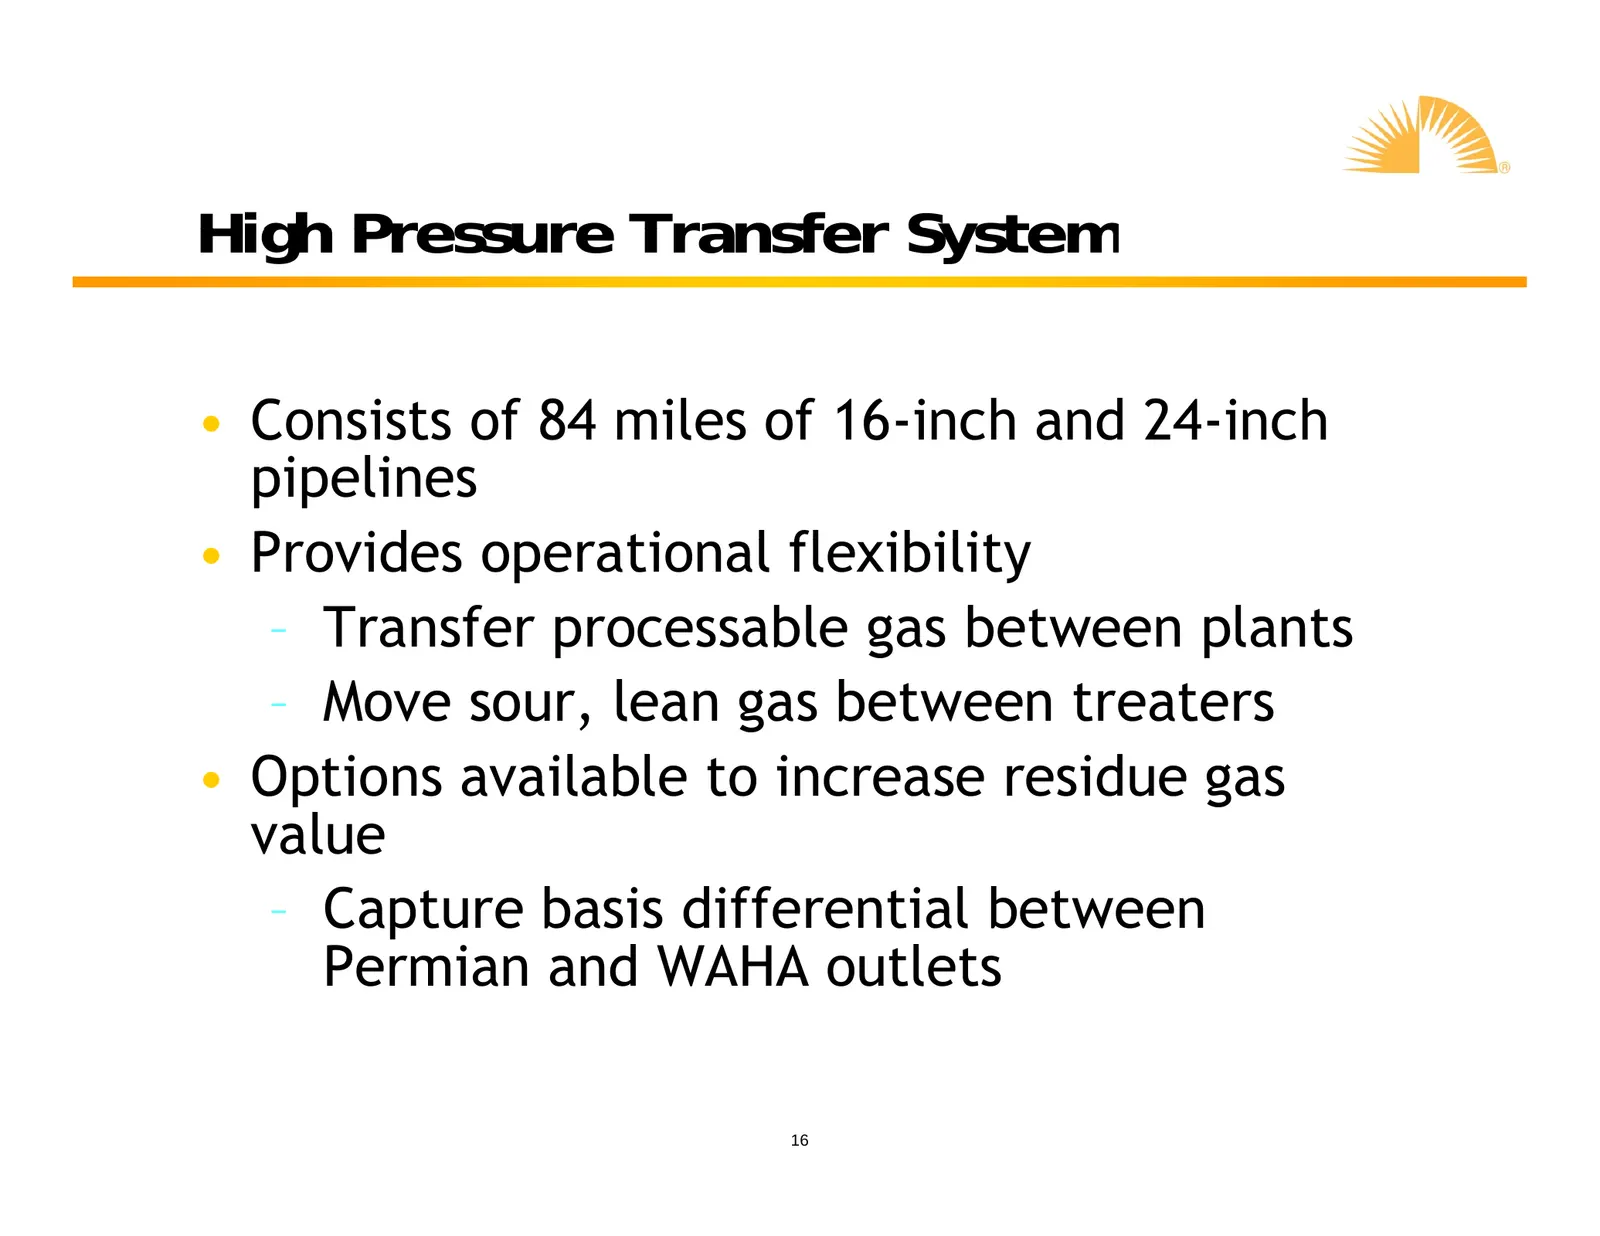
High Pressure Transfer System • Consists of 84 miles of 16-inch and 24-inch pipelines • Provides P id operationalti l fl flexibility ibilit – Transfer processable gas between plants – Move sour sour, lean gas between treaters • Options available to increase residue gas value – Capture basis differen
Slide 17: 2010/2011 Growth Opportunities
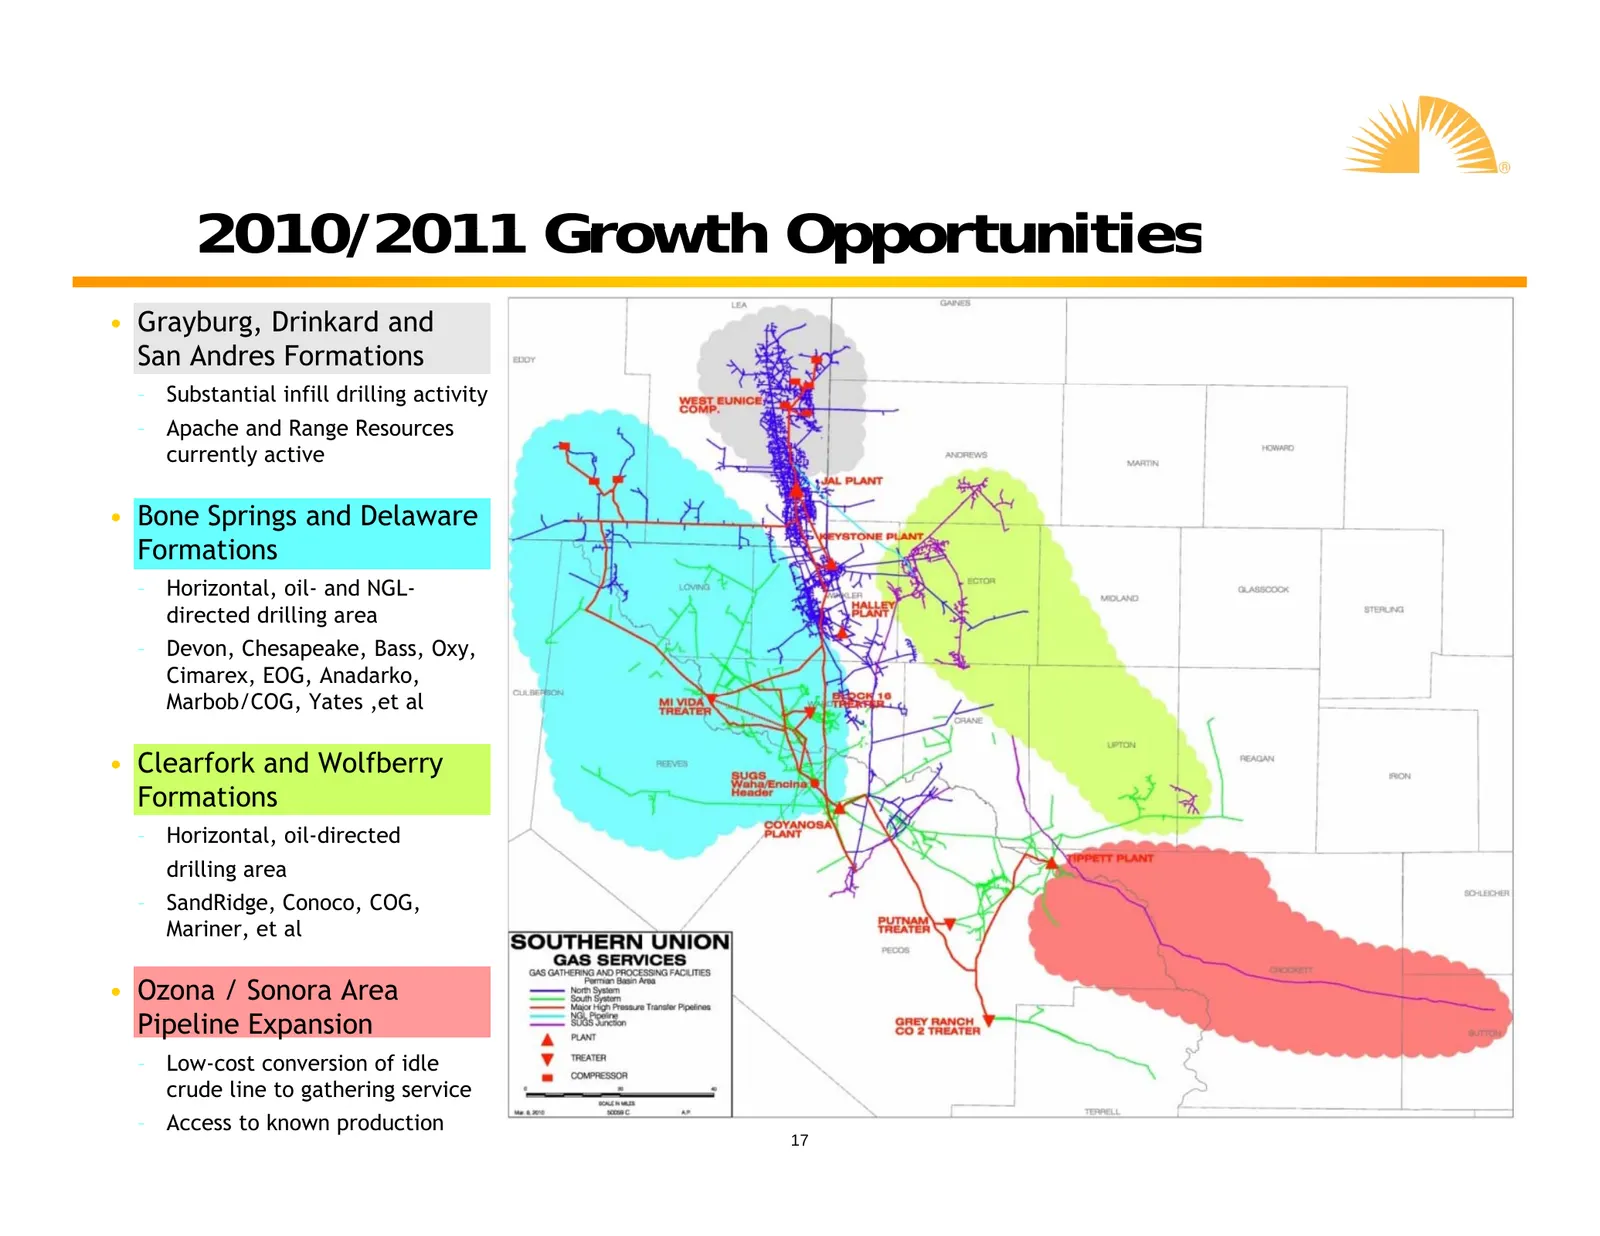
2010/2011 Growth Opportunities • Grayburg, Drinkard and San Andres Formations – Substantial infill drilling activity – Apache and Range Resources currently active • Bone Springs and Delaware F Formations i – Horizontal, oil- and NGL- directed drilling area – Devon, Chesapeake, Bass, Oxy, Cimarex, EO
Slide 18: Bone Springs Growth Opportunities
Bone Springs Growth Opportunities • Driven by Bone Springs shale development • Restarted Mi Vida treater during February 2010 – Added 110MMcf/d of treating capacity • Halley processing plant restart – Phase I • Adds 60MMcf/d of cryo processing capacity late 4Q10 – Phase II (if commercially necessary
Slide 19: Gathering & Processing Assumptions
Gathering & Processing Assumptions • Positive processing spread environment encourages optimal Naturall Gas G Liquid d recoveries; Normalized l d ffuel, l fl flare and d unaccounted-for volumes • 2010 projected equity volumes – Natural Gas Liquids equivalent of 35,000 to 40,000 MMBtu/d – Natural Gas
Slide 20: Distribution
Distribution • Missouri Gas Energy – Provides natural gas to over 500,000 customers – Nearly 13,000 miles of main and service lines – Received a $16.2MM annual base rate increase effective February 28, 2010 • New N rate t ddesign i eliminates li i t iimpactt off weather th or conservation on margin
Slide 21: Corporate & Other
Corporate & Other • Corporate segment provides administrative and support functions to business segments and d allocates ll t expenses as appropriate i t • Other segment primarily consists of PEI Power Corporation which owns interests in and operates 75 MW of generating assets in pp the PJM ISO and
Slide 22: Summary
Summary • Focus on natural gas related infrastructure • Organic growth projects with clear visibility towards earnings g and cash flow growth g • Actively managed hedging program helps mitigate volatility in NGL margins • Balance preservation of investment grade credit ratings and return of capital
Source: SEC EDGAR · 8-K filed Aug 18, 2010
More decks from Southern Union Co
 Barclays Capital Investment Grade Energy and Pipeline Conference 201232 slides · Mar 8, 2012
 Debt Investor Presentation (February 2012)33 slides · Feb 22, 2012
 Merger or Acquisition (July 2011)11 slides · Jul 5, 2011
 Merger or Acquisition (June 2011)22 slides · Jun 16, 2011
 Investor Presentation (February 2011)37 slides · Feb 25, 2011
 BMO Capital Markets 2010 Utilities and Pipelines Day23 slides · Nov 30, 2010