Silvergate Capital Corp. · OTC:SICP
Silvergate Capital — Q3 2020 Earnings Presentation
15 slides from Silvergate Capital's earnings presentation, Oct 26, 2020

Slide 1: Silvergate Capital Corporation 3Q20 Earnings Presentation
Exhibit 99.2 Silvergate Capital Corporation 3Q20 Earnings Presentation October 26, 2020
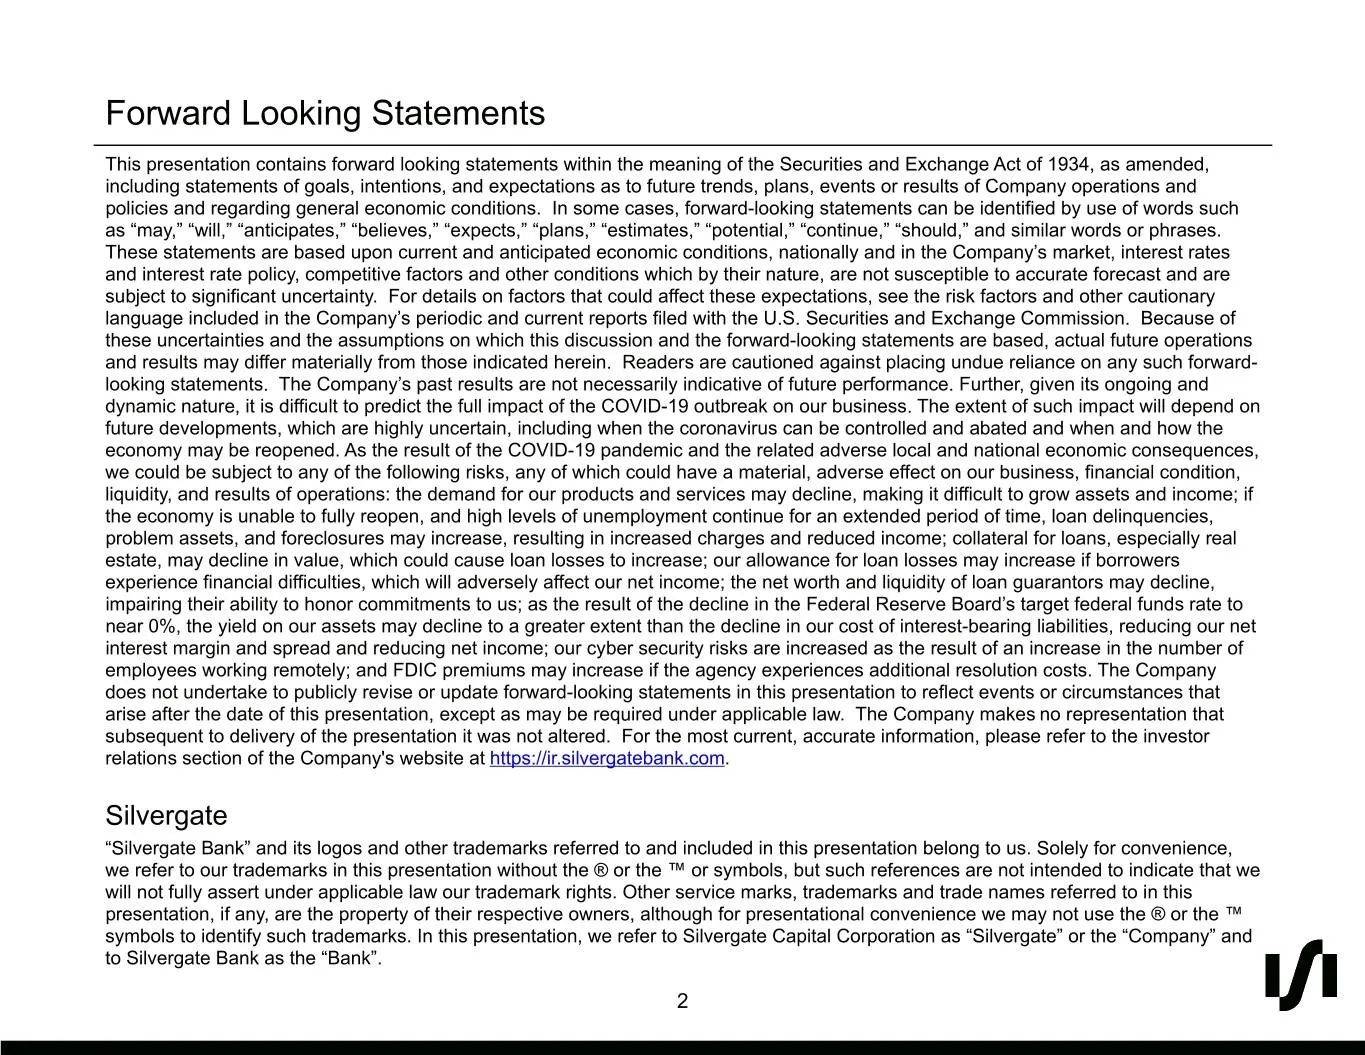
Slide 2: Forward Looking Statements
1 5 0 Forward Looking Statements #010500 This presentation contains forward looking statements within the meaning of the Securities and Exchange Act of 1934, as amended, including statements of goals, intentions, and expectations as to future trends, plans, events or results of Company operations an
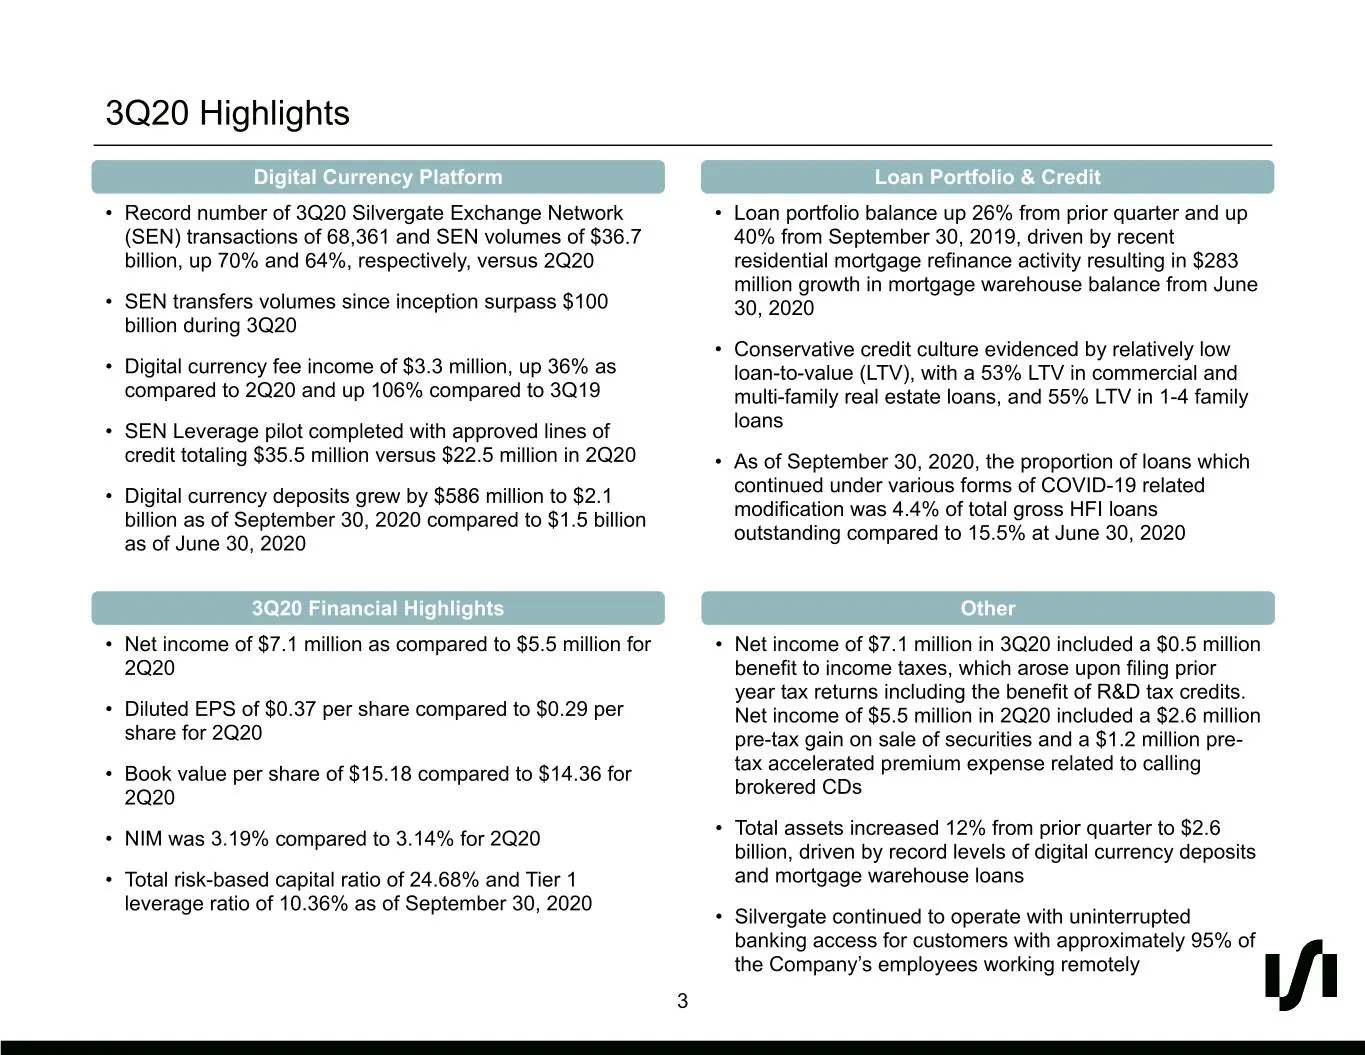
Slide 3: 3Q20 Highlights
1 5 0 3Q20 Highlights #010500 Digital Currency Platform Loan Portfolio & Credit • Record number of 3Q20 Silvergate Exchange Network • Loan portfolio balance up 26% from prior quarter and up 41 (SEN) transactions of 68,361 and SEN volumes of $36.7 40% from September 30, 2019, driven by recent 42 bill
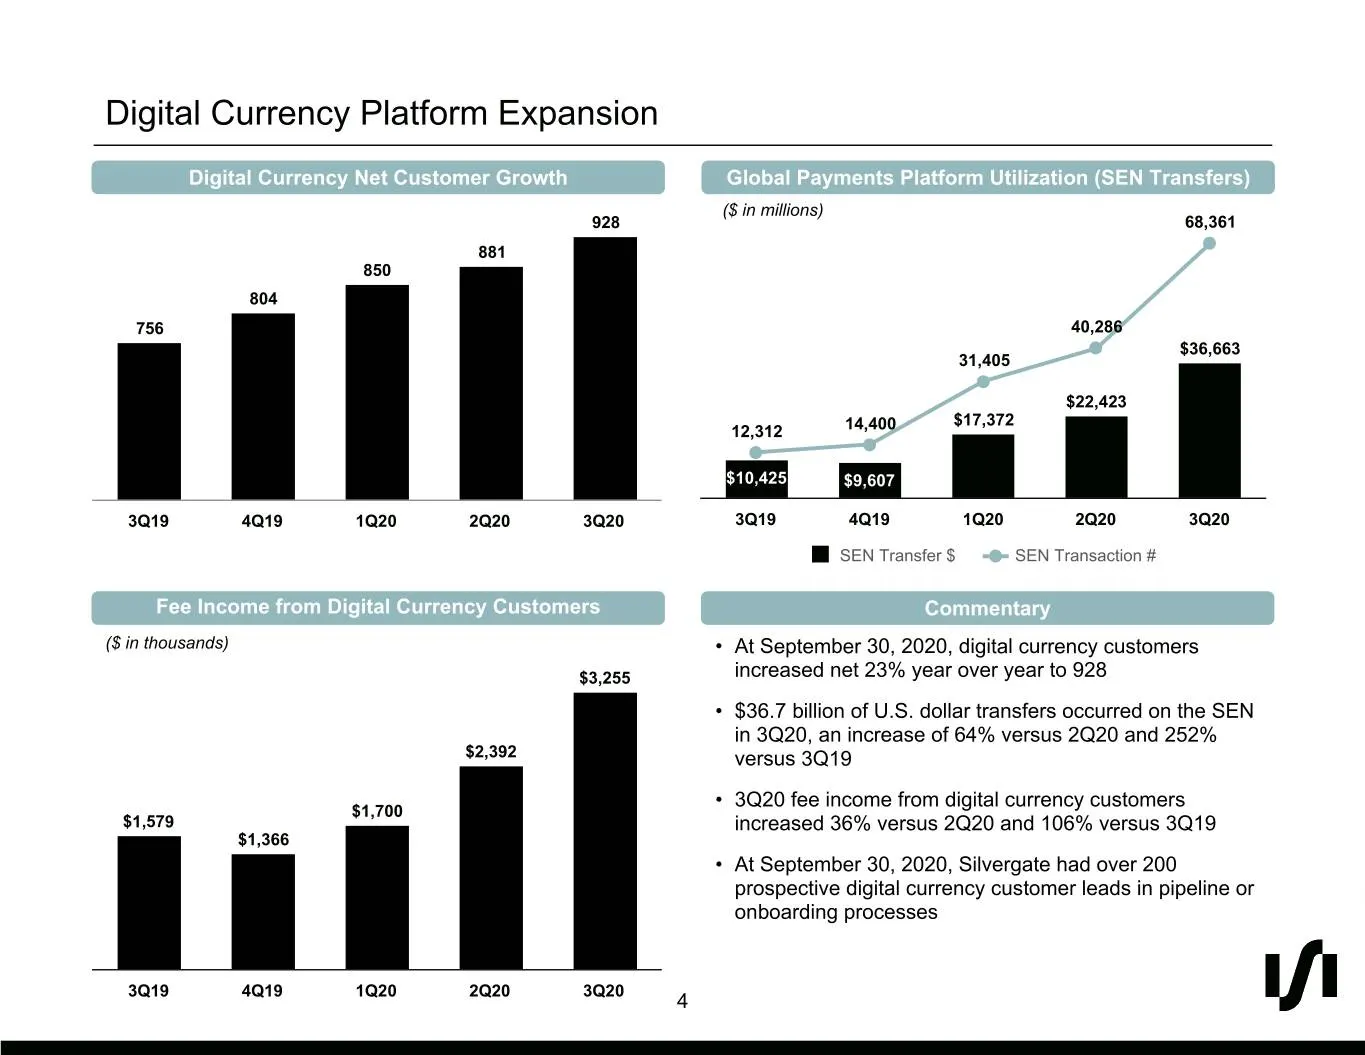
Slide 4: Digital Currency Platform Expansion
1 5 0 Digital Currency Platform Expansion #010500 Digital Currency Net Customer Growth Global Payments Platform Utilization (SEN Transfers) ($ in millions) 928 68,361 41 881 42 850 44 804 #292A2C 756 40,286 $36,663 31,405 221 $22,423 $17,372 228 12,312 14,400 231 #DDE4E7 $10,425 $9,607 #919498 3Q19
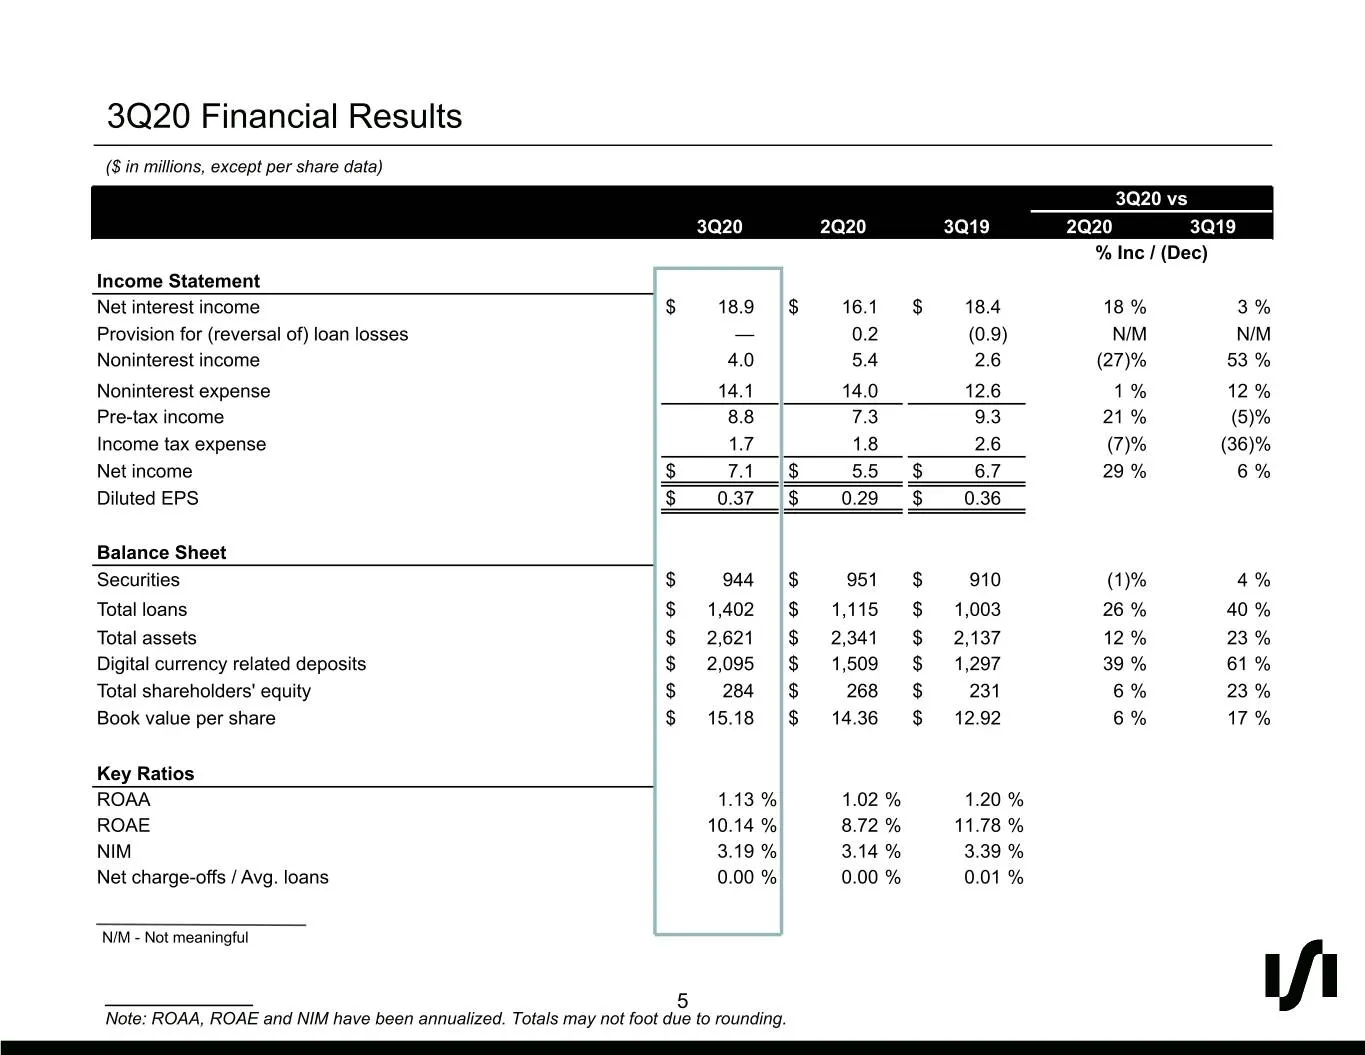
Slide 5: 3Q20 Financial Results
1 5 0 3Q20 Financial Results #010500 ($ in millions, except per share data) 3Q20 vs 41 3Q20 2Q20 3Q19 2Q20 3Q19 42 % Inc / (Dec) 44 Income Statement Net interest income $ 18.9 $ 16.1 $ 18.4 18 % 3 % #292A2C Provision for (reversal of) loan losses — 0.2 (0.9) N/M N/M Noninterest income 4.0 5.4 2.6 (2
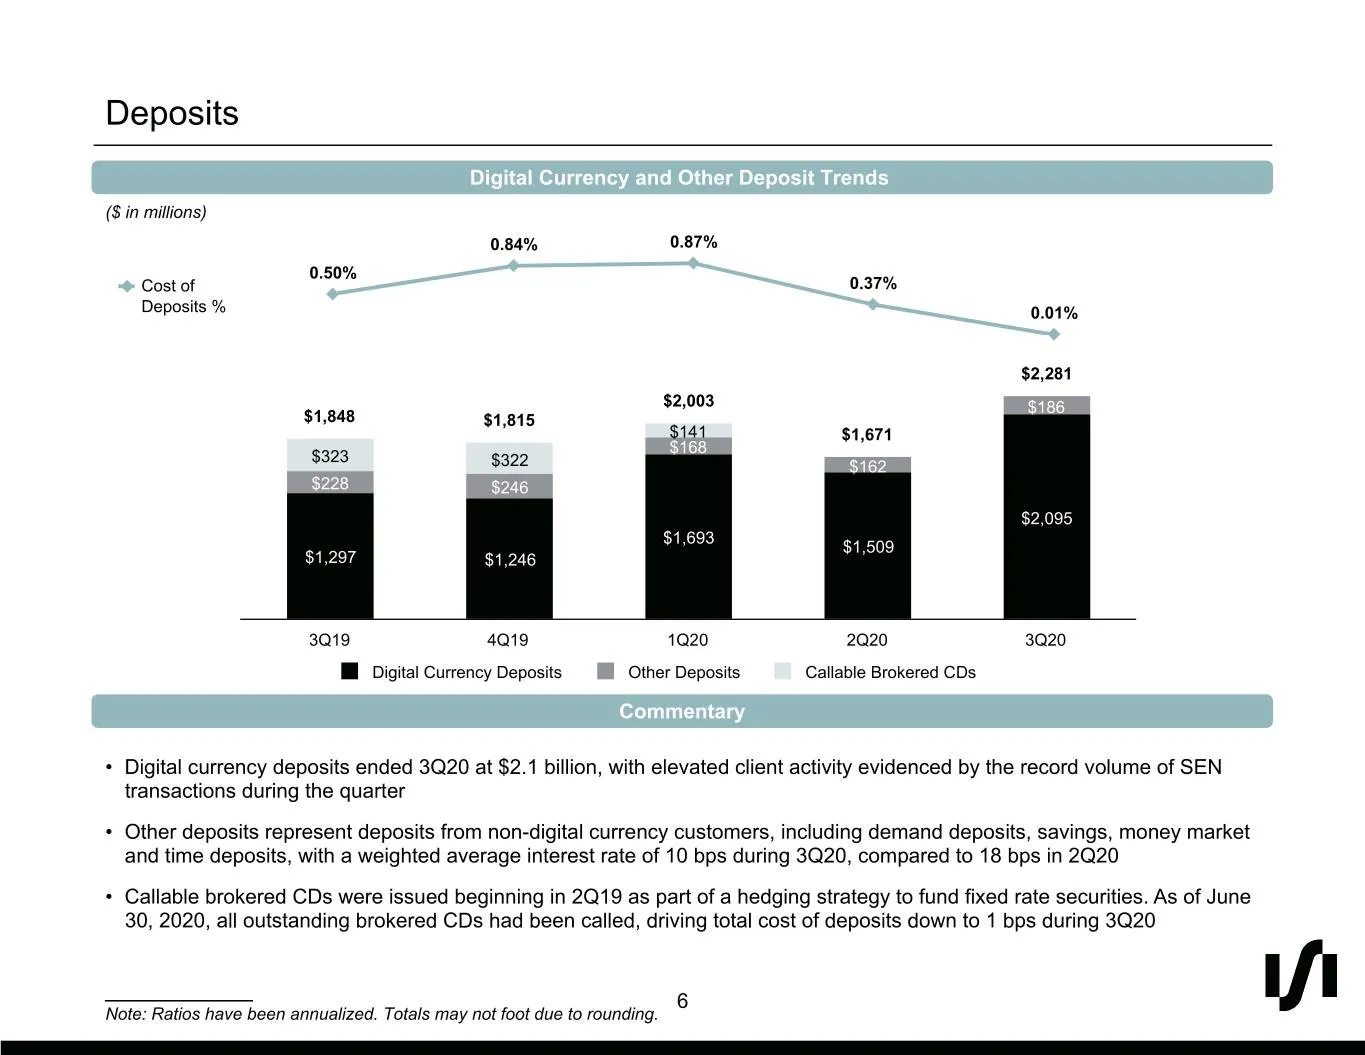
Slide 6: Deposits
1 5 0 Deposits #010500 Digital Currency and Other Deposit Trends ($ in millions) 41 0.84% 0.87% 42 0.50% 44 Cost of 0.37% Deposits % 0.01% #292A2C $2,281 221 $2,003 $186 $1,848 $1,815 228 $141 $1,671 $168 $323 231 $322 $162 #DDE4E7 $228 #919498 $246 $2,095 $1,693 $1,509 $1,297 $1,246 146 183 188 3Q1
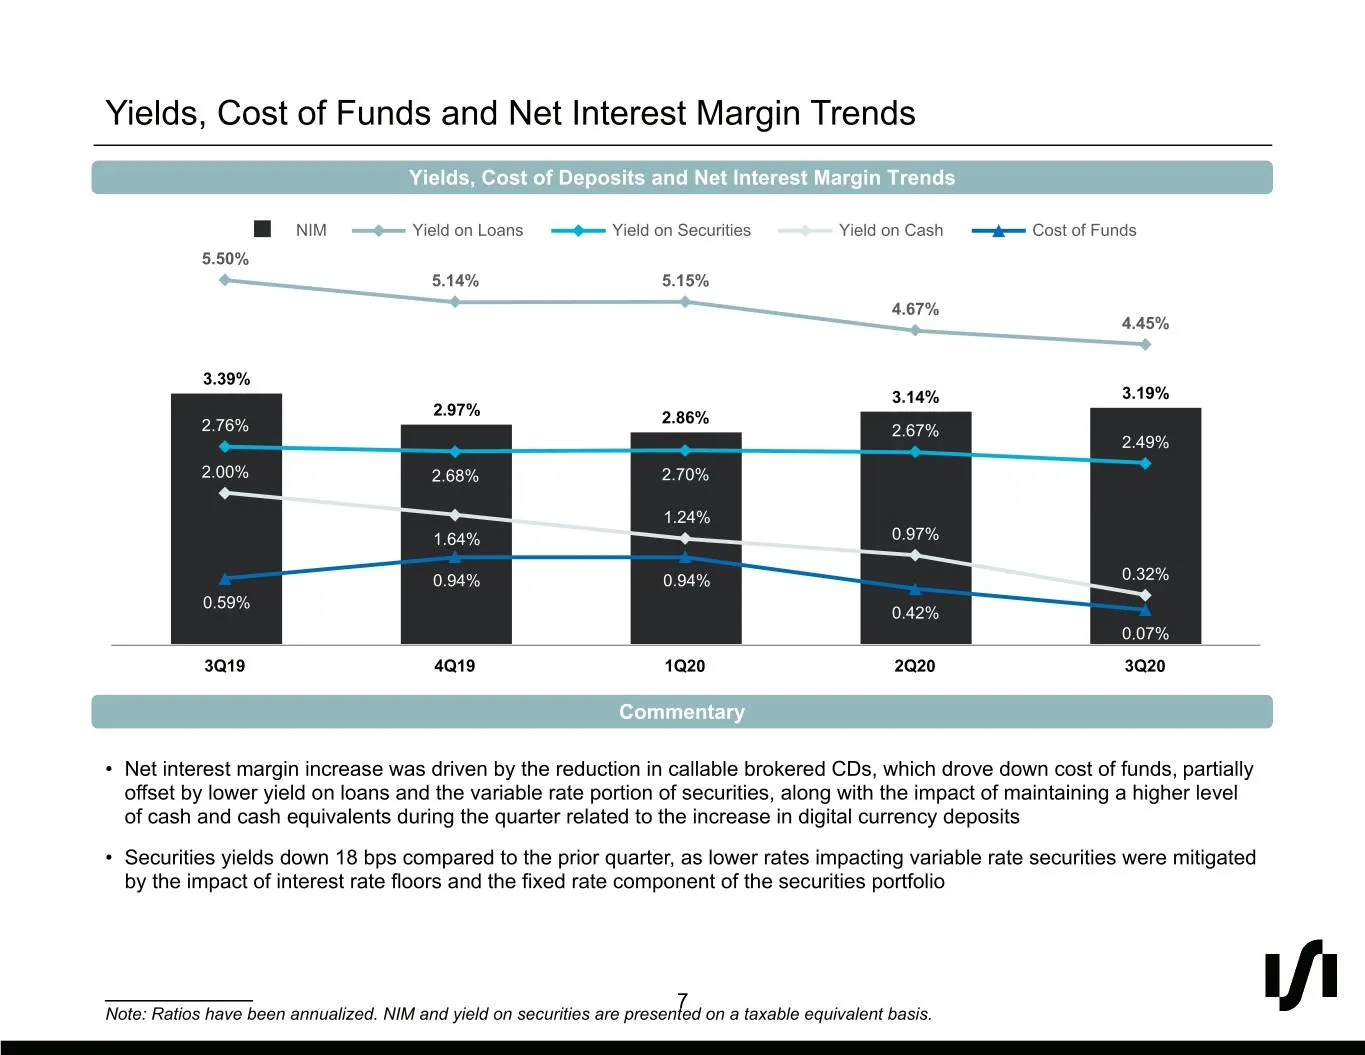
Slide 7: Yields, Cost of Funds and Net Interest Margin Trends
1 5 0 Yields, Cost of Funds and Net Interest Margin Trends #010500 Yields, Cost of Deposits and Net Interest Margin Trends 41 NIM Yield on Loans Yield on Securities Yield on Cash Cost of Funds 42 5.50% 44 5.14% 5.15% 4.67% #292A2C 4.45% 3.39% 3.14% 3.19% 221 2.97% 2.86% 2.76% 2.67% 228 2.49% 231 #DD
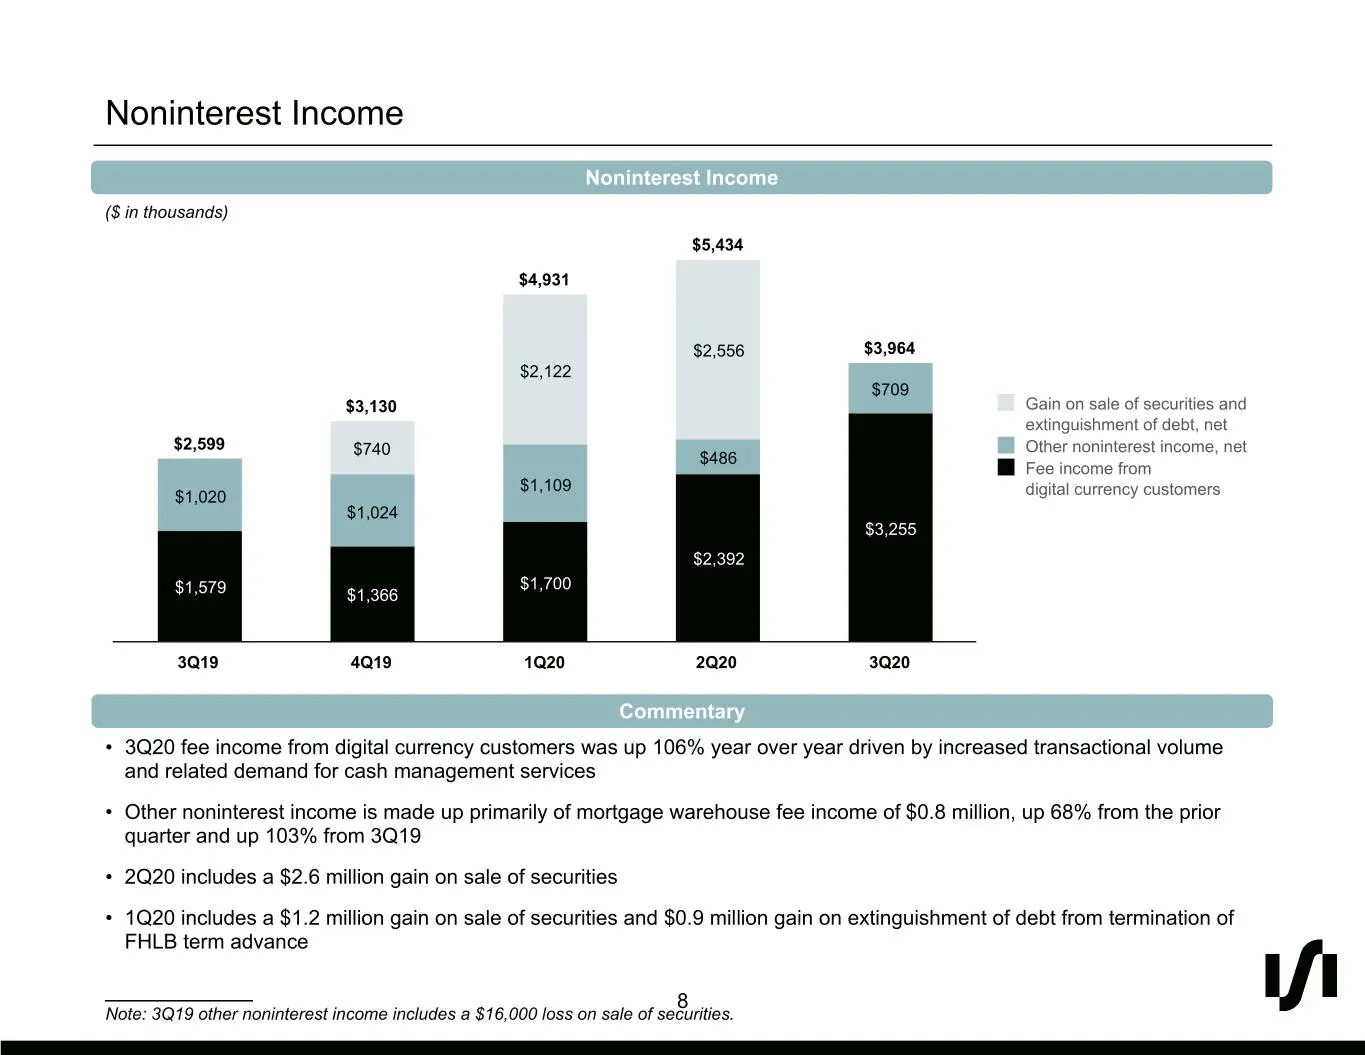
Slide 8: Noninterest Income
1 5 0 Noninterest Income #010500 Noninterest Income ($ in thousands) 41 $5,434 42 44 $4,931 #292A2C $2,556 $3,964 $2,122 $709 221 $3,130 Gain on sale of securities and 228 extinguishment of debt, net $2,599 $740 Other noninterest income, net $486 231 Fee income from #DDE4E7 $1,109 #919498 $1,020 dig
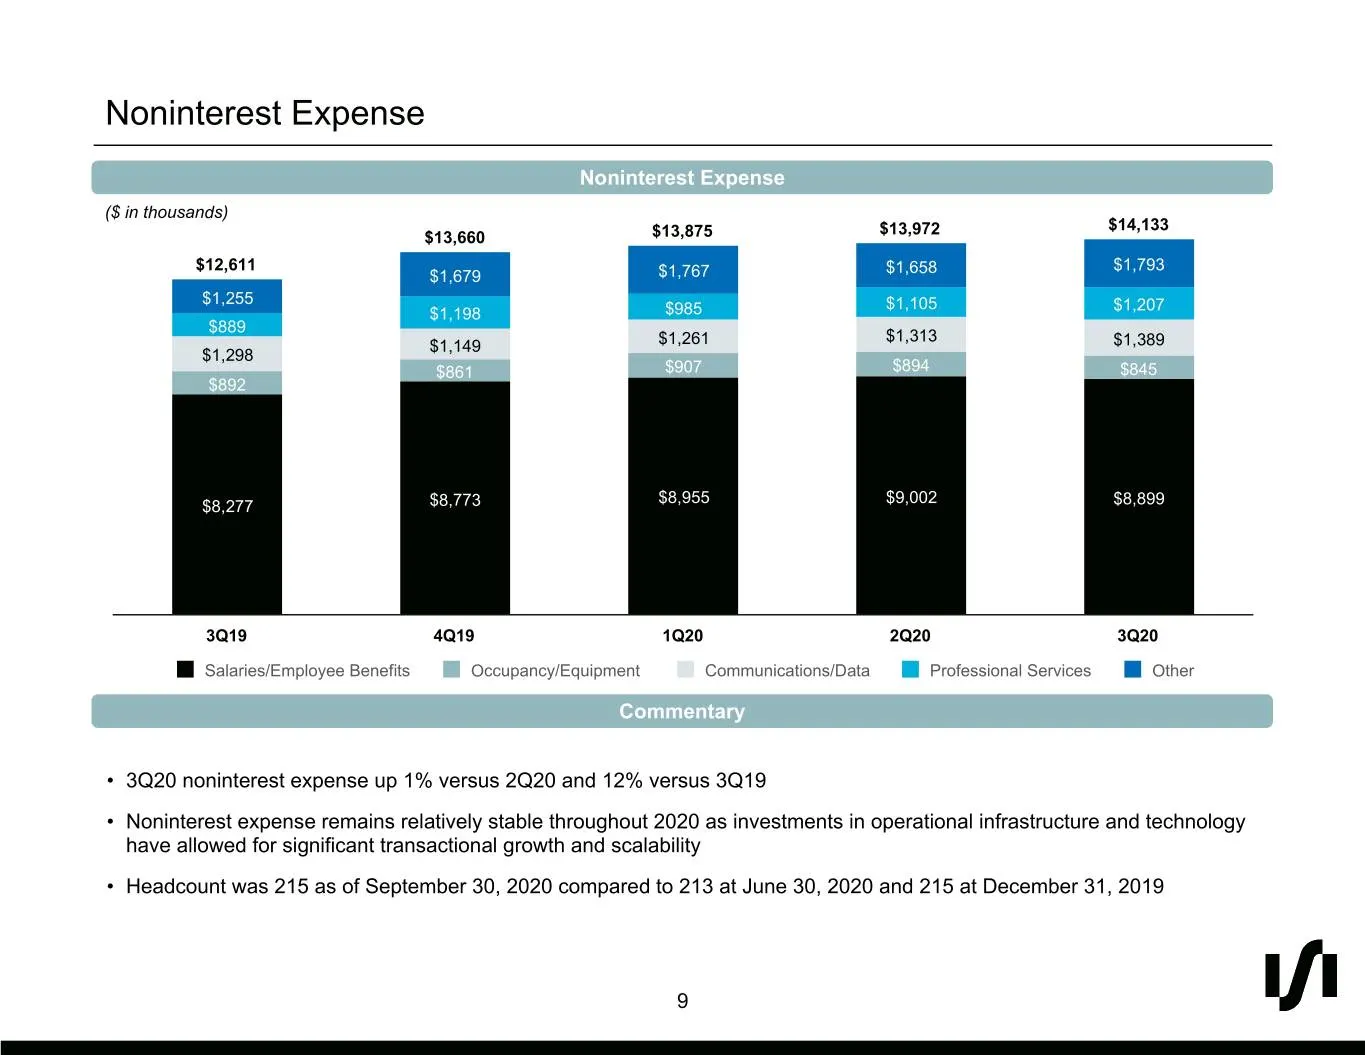
Slide 9: Noninterest Expense
1 5 0 Noninterest Expense #010500 Noninterest Expense ($ in thousands) $13,972 $14,133 41 $13,660 $13,875 42 $12,611 $1,658 $1,793 $1,679 $1,767 44 $1,255 $1,105 $1,207 $1,198 $985 #292A2C $889 $1,313 $1,149 $1,261 $1,389 $1,298 $861 $907 $894 $845 $892 221 228 231 #DDE4E7 #919498 $8,955 $9,002 $8,2
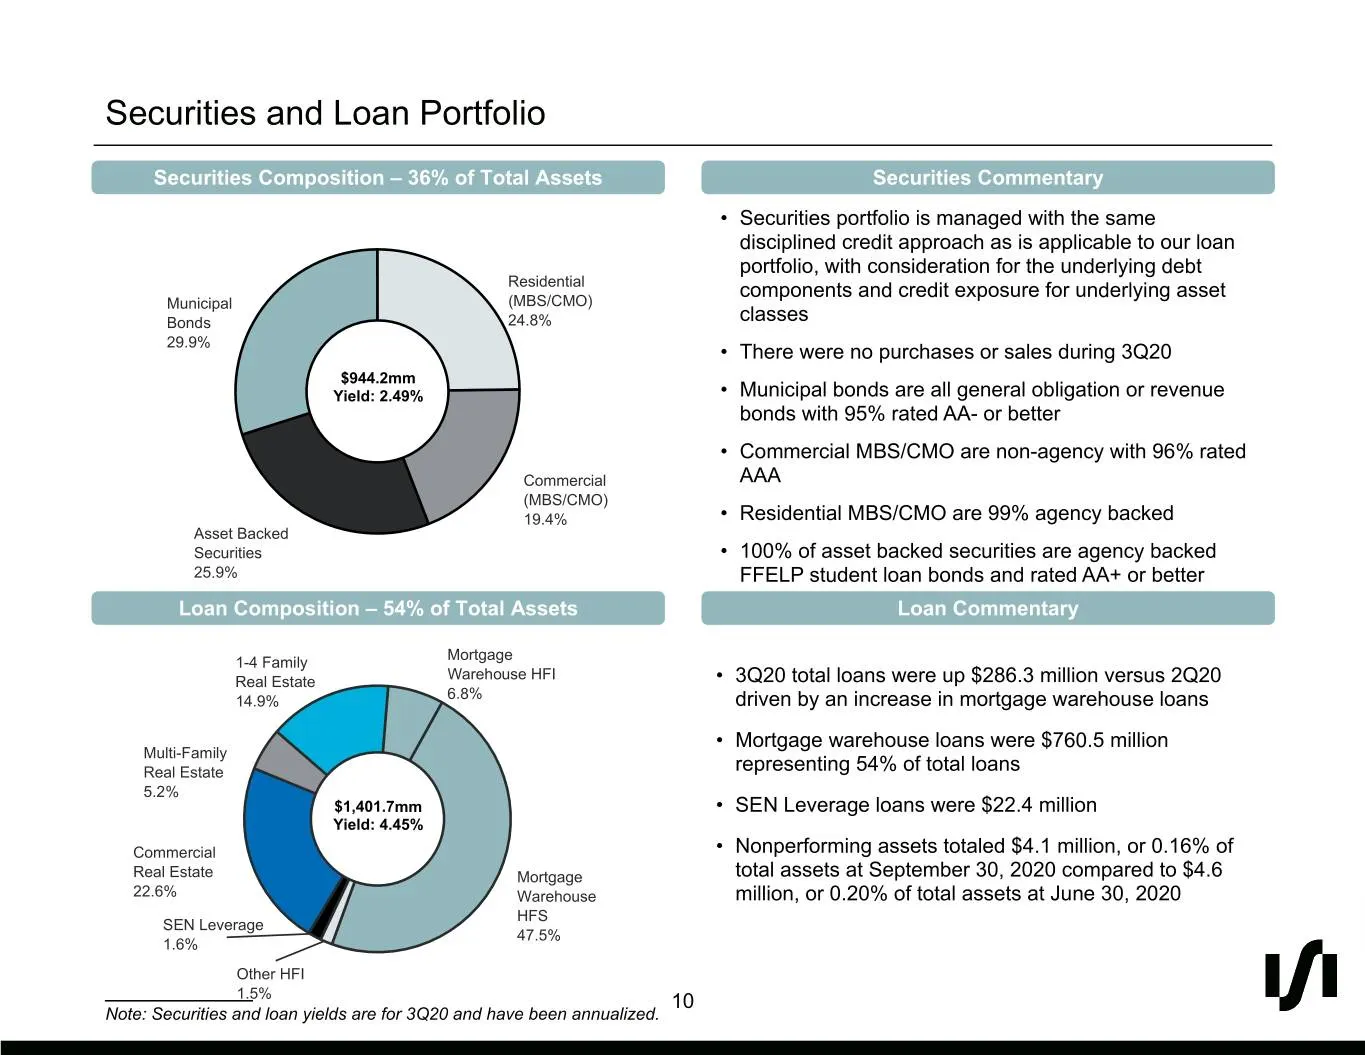
Slide 10: Securities and Loan Portfolio
1 5 0 Securities and Loan Portfolio #010500 Securities Composition – 36% of Total Assets Securities Commentary • Securities portfolio is managed with the same 41 disciplined credit approach as is applicable to our loan 42 portfolio, with consideration for the underlying debt Residential components a
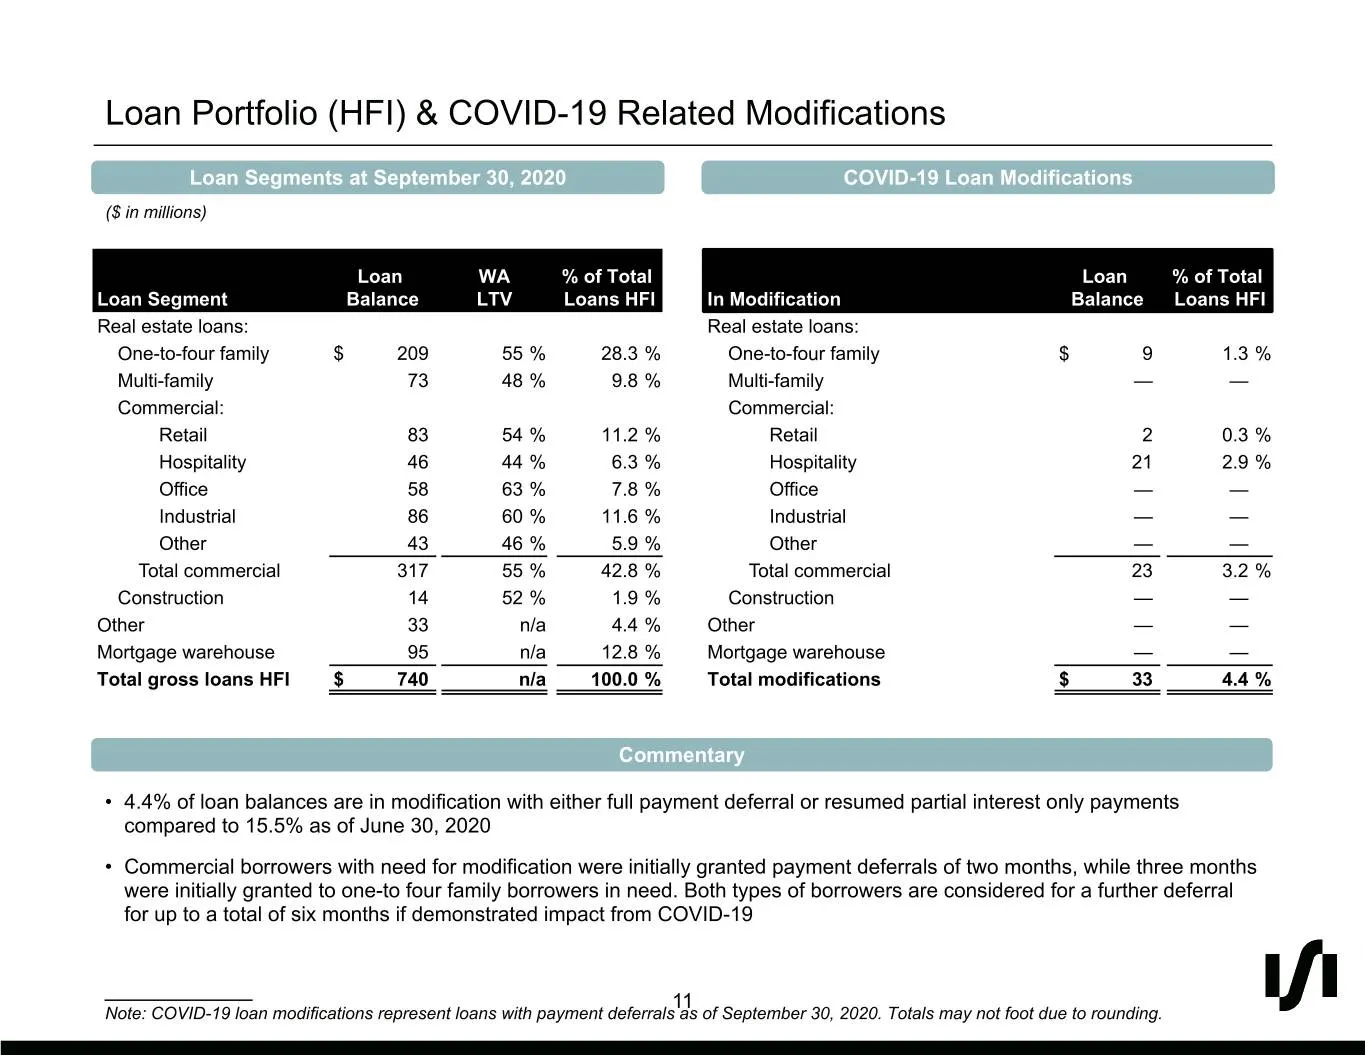
Slide 11: Loan Portfolio (HFI) & COVID-19 Related Modifications
1 5 0 Loan Portfolio (HFI) & COVID-19 Related Modifications #010500 Loan Segments at September 30, 2020 COVID-19 Loan Modifications ($ in millions) 41 42 Loan WA % of Total Loan % of Total 44 Loan Segment Balance LTV Loans HFI In Modification Balance Loans HFI #292A2C Real estate loans: Real estate
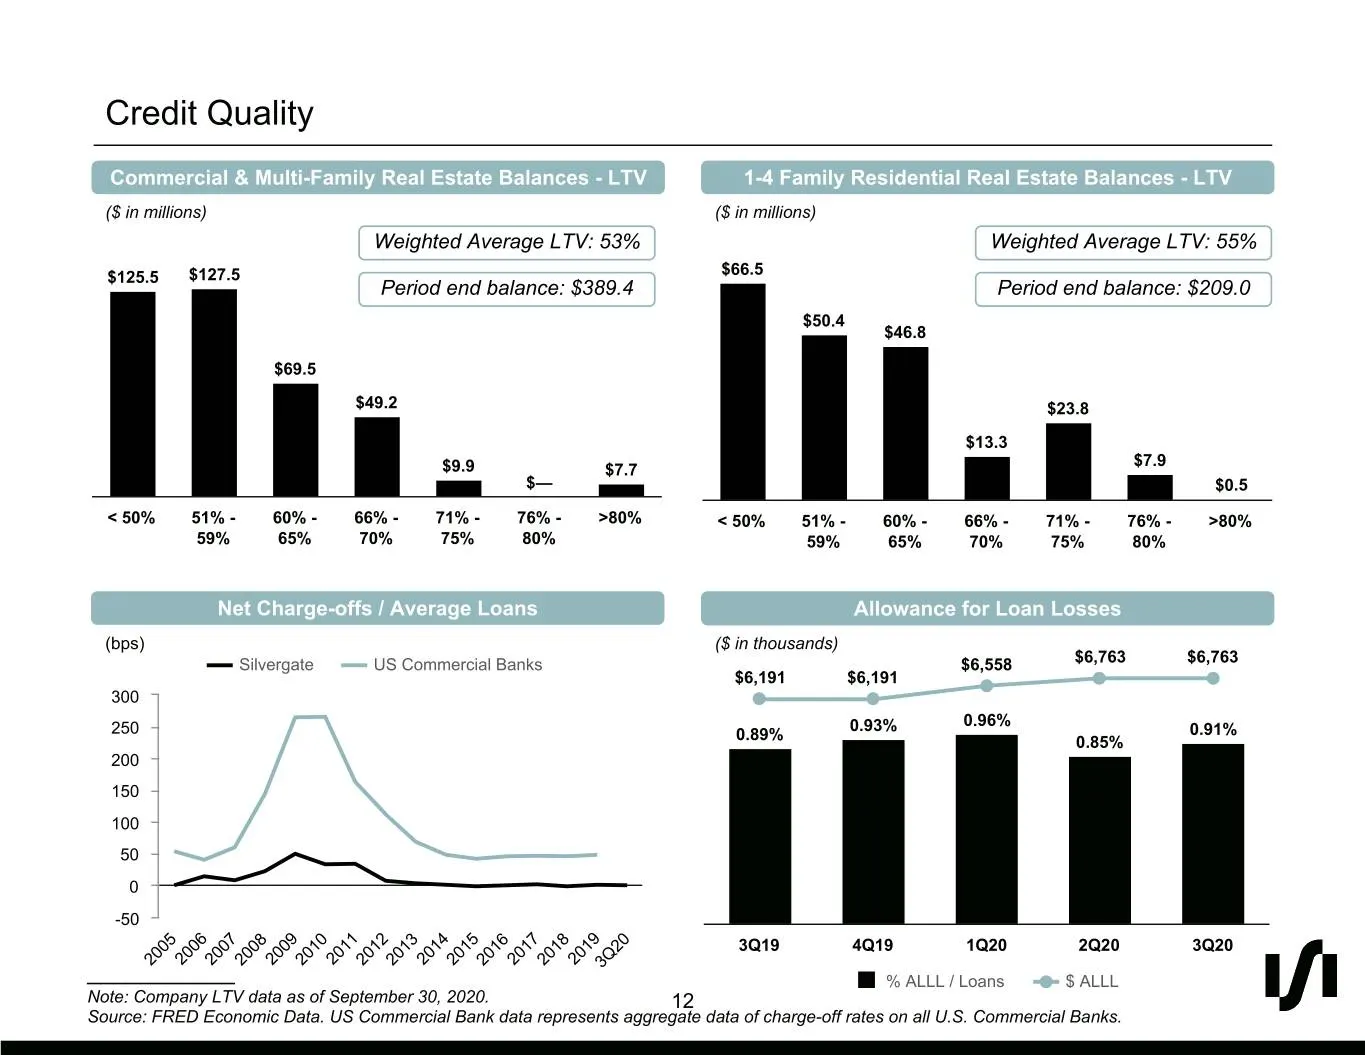
Slide 12: Credit Quality
1 5 0 Credit Quality #010500 Commercial & Multi-Family Real Estate Balances - LTV 1-4 Family Residential Real Estate Balances - LTV ($ in millions) ($ in millions) 41 Weighted Average LTV: 53% Weighted Average LTV: 55% 42 $125.5 $127.5 $66.5 44 Period end balance: $389.4 Period end balance: $209.0 $
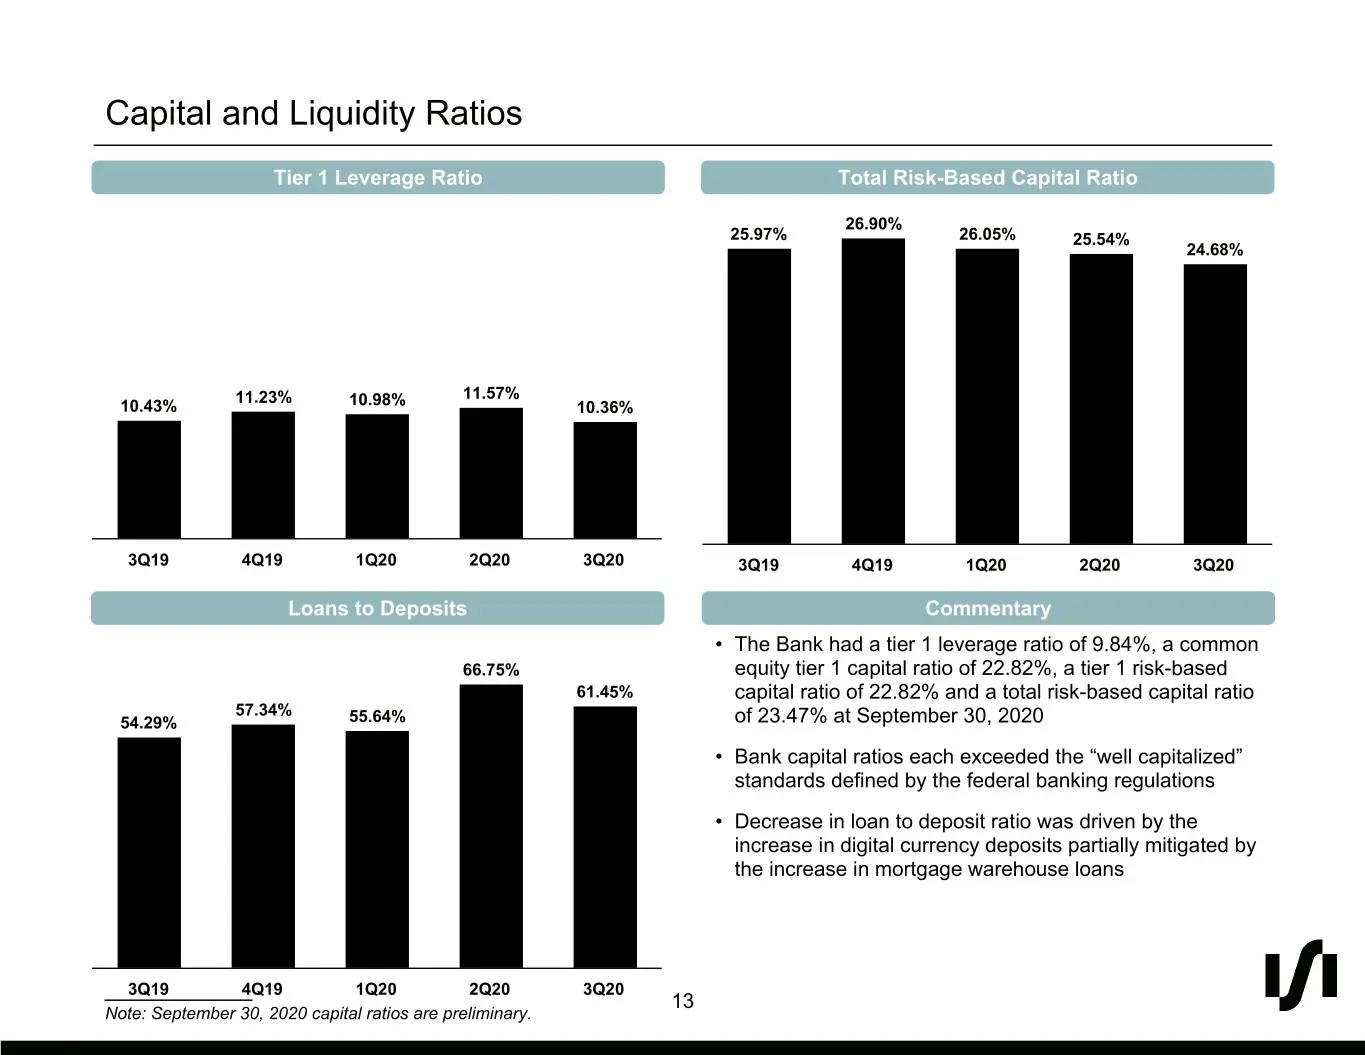
Slide 13: Capital and Liquidity Ratios
1 5 0 Capital and Liquidity Ratios #010500 Tier 1 Leverage Ratio Total Risk-Based Capital Ratio 26.90% 41 25.97% 26.05% 25.54% 24.68% 42 44 #292A2C 11.23% 11.57% 221 10.43% 10.98% 10.36% 228 231 #DDE4E7 #919498 3Q19 4Q19 1Q20 2Q20 3Q20 3Q19 4Q19 1Q20 2Q20 3Q20 146 183 Loans to Deposits Commentary 18

Slide 14: Appendix
Appendix
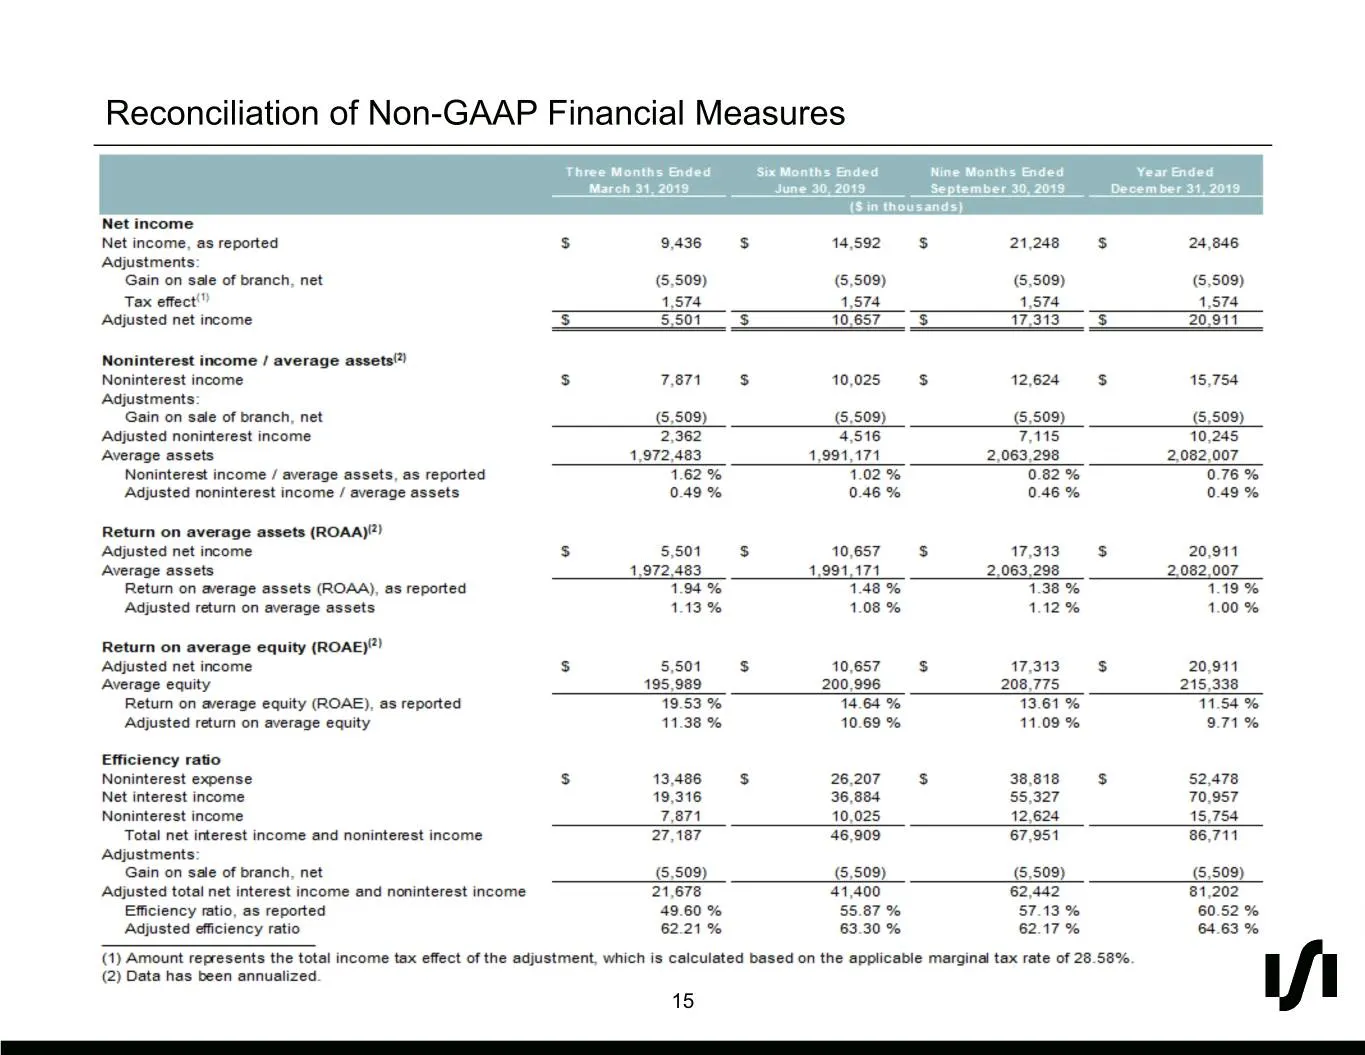
Slide 15: Reconciliation of Non-GAAP Financial Measures
1 5 0 Reconciliation of Non-GAAP Financial Measures #010500 41 42 44 #292A2C 221 228 231 #DDE4E7 #919498 146 183 188 #92B7BC 0 175 220 #00AFDC 0 107 183 #006BB7 15
Source: SEC EDGAR · 8-K filed Oct 26, 2020
More decks from Silvergate Capital Corp.
 Q4 2022 Earnings Presentation11 slides · Jan 17, 2023
 Investor Presentation (November 2022)13 slides · Nov 1, 2022
 Q3 2022 Earnings Presentation10 slides · Oct 18, 2022
 Investor Presentation (August 2022)14 slides · Aug 8, 2022
 Q2 2022 Earnings Presentation10 slides · Jul 19, 2022
 Investor Presentation (May 2022)15 slides · May 10, 2022