Scatec ASA · OSL:SCATC
Scatec ASA — Q3 2021 Earnings Presentation
26 slides from Scatec ASA's earnings presentation, 2021
Slide 1: Third quarter 2021: Strong operational performance
Third quarter 2021 Strong operational performance
Slide 2: Disclaimer
Disclaimer The following presentation is being made only to, and is only directed at, persons to whom such presentation may lawfully be communicated (’relevant persons’). Any person who is not a relevant person should not rely, act or make assessment on the basis of this presentation or anything inc
Slide 3: Agenda
Agenda • Project update and market outlook Raymond Carlsen, CEO • Financial review Mikkel Tørud, CFO • Summary Raymond Carlsen, CEO 3
Slide 4: Q3'21 Strong operational performance
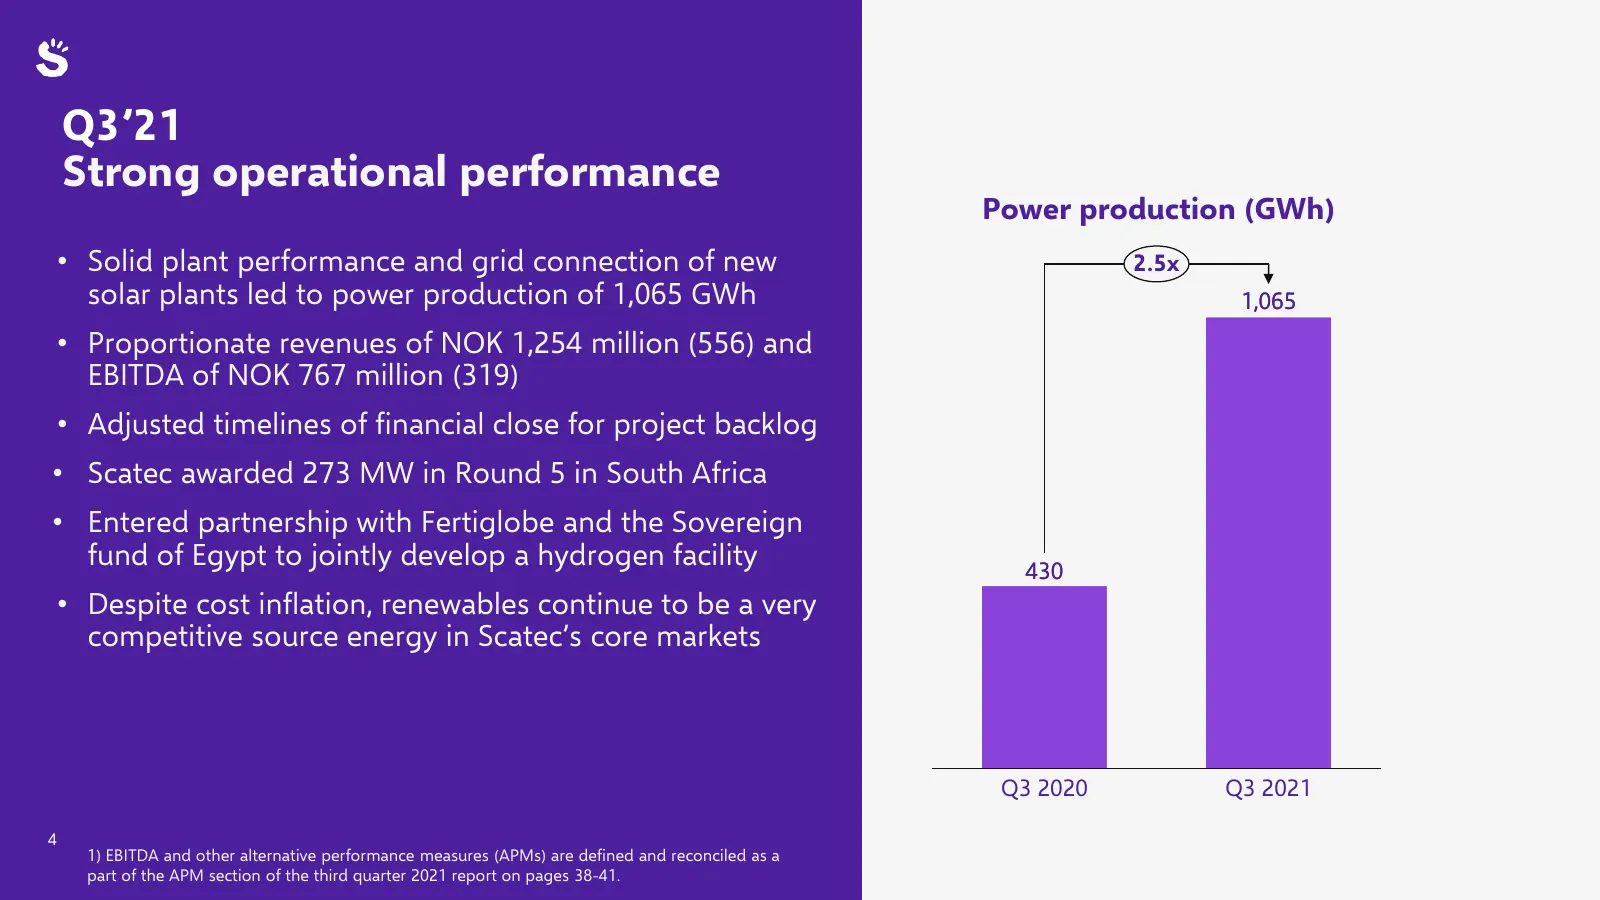
Q3’21 Strong operational performance Power production (GWh) • Solid plant performance and grid connection of new 2.5x solar plants led to power production of 1,065 GWh 1,065 • Proportionate revenues of NOK 1,254 million (556) and EBITDA of NOK 767 million (319) • Adjusted timelines of financial clos
Slide 5: Adjusted timelines of financial close for Scatec's project backlog
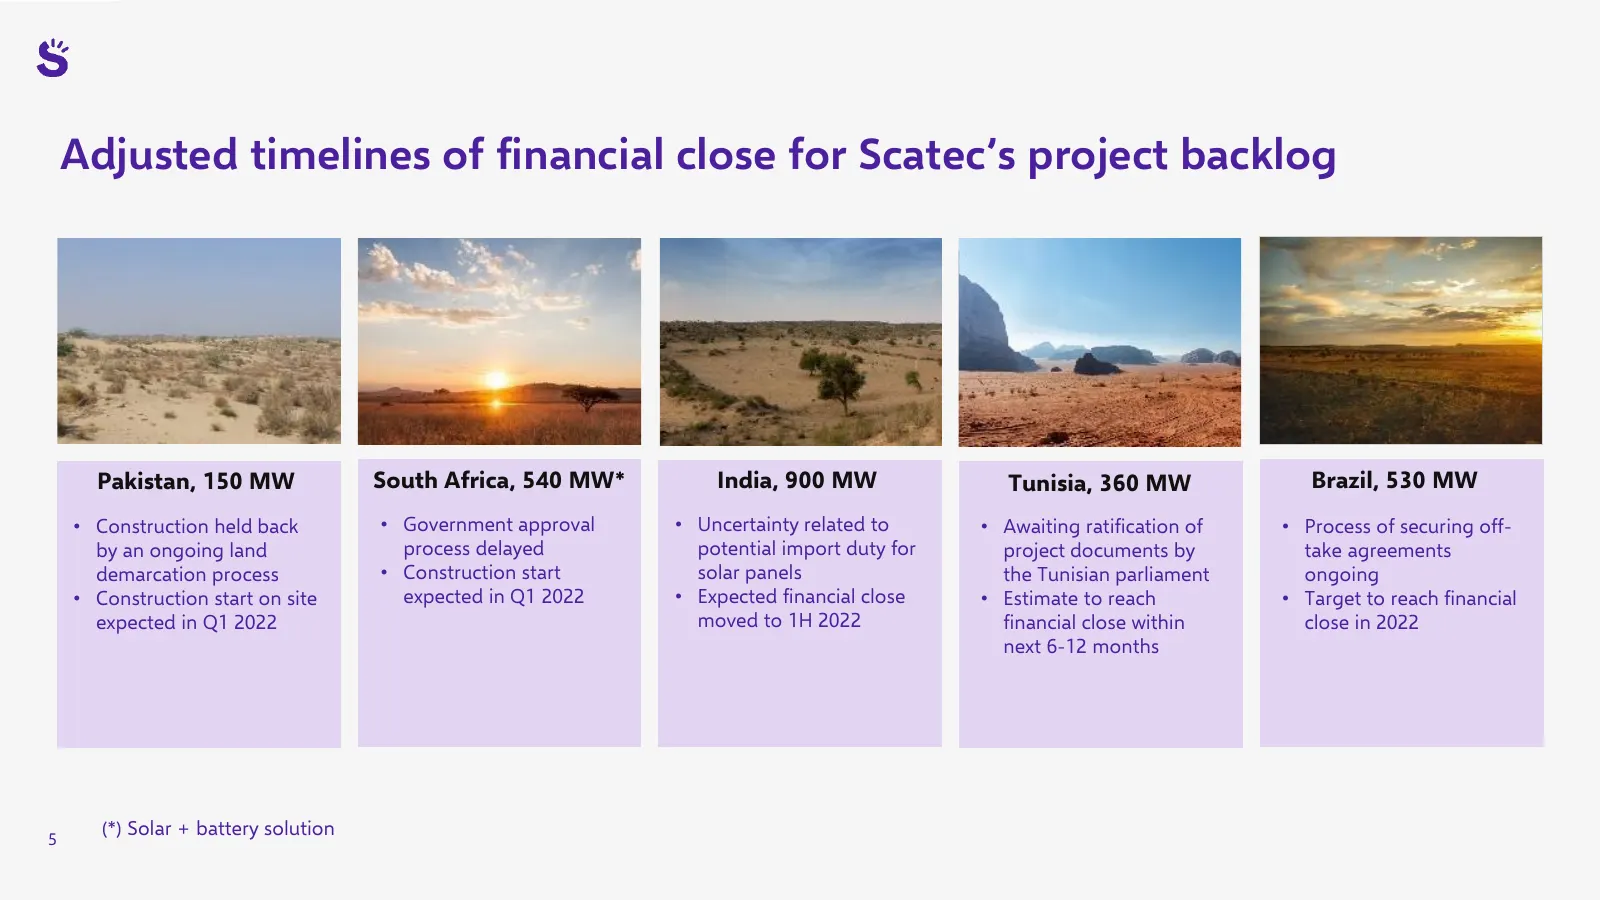
Adjusted timelines of financial close for Scatec’s project backlog Pakistan, 150 MW South Africa, 540 MW* India, 900 MW Tunisia, 360 MW Brazil, 530 MW • Construction held back • Government approval • Uncertainty related to • Awaiting ratification of • Process of securing off- by an ongoing land proc
Slide 6: Scatec is well positioned with a broad renewables offering, focus on high growth markets
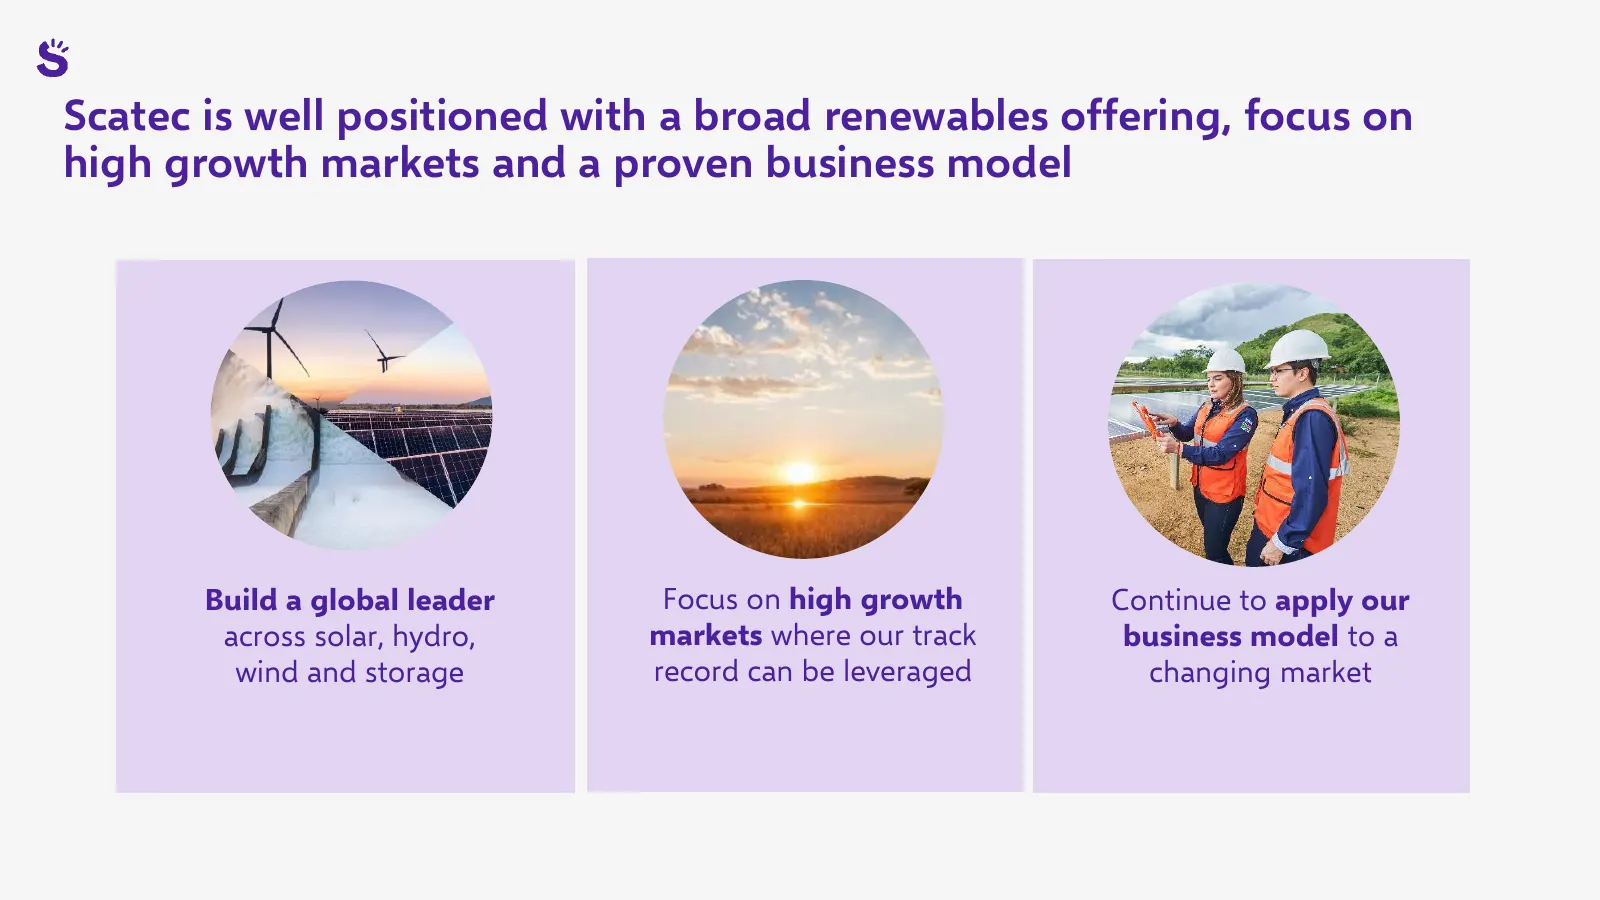
Scatec is well positioned with a broad renewables offering, focus on high growth markets and a proven business model Build a global leader Focus on high growth Continue to apply our across solar, hydro, markets where our track business model to a wind and storage record can be leveraged changing mar
Slide 7: Scatec holds a large project pipeline in several renewable technologies
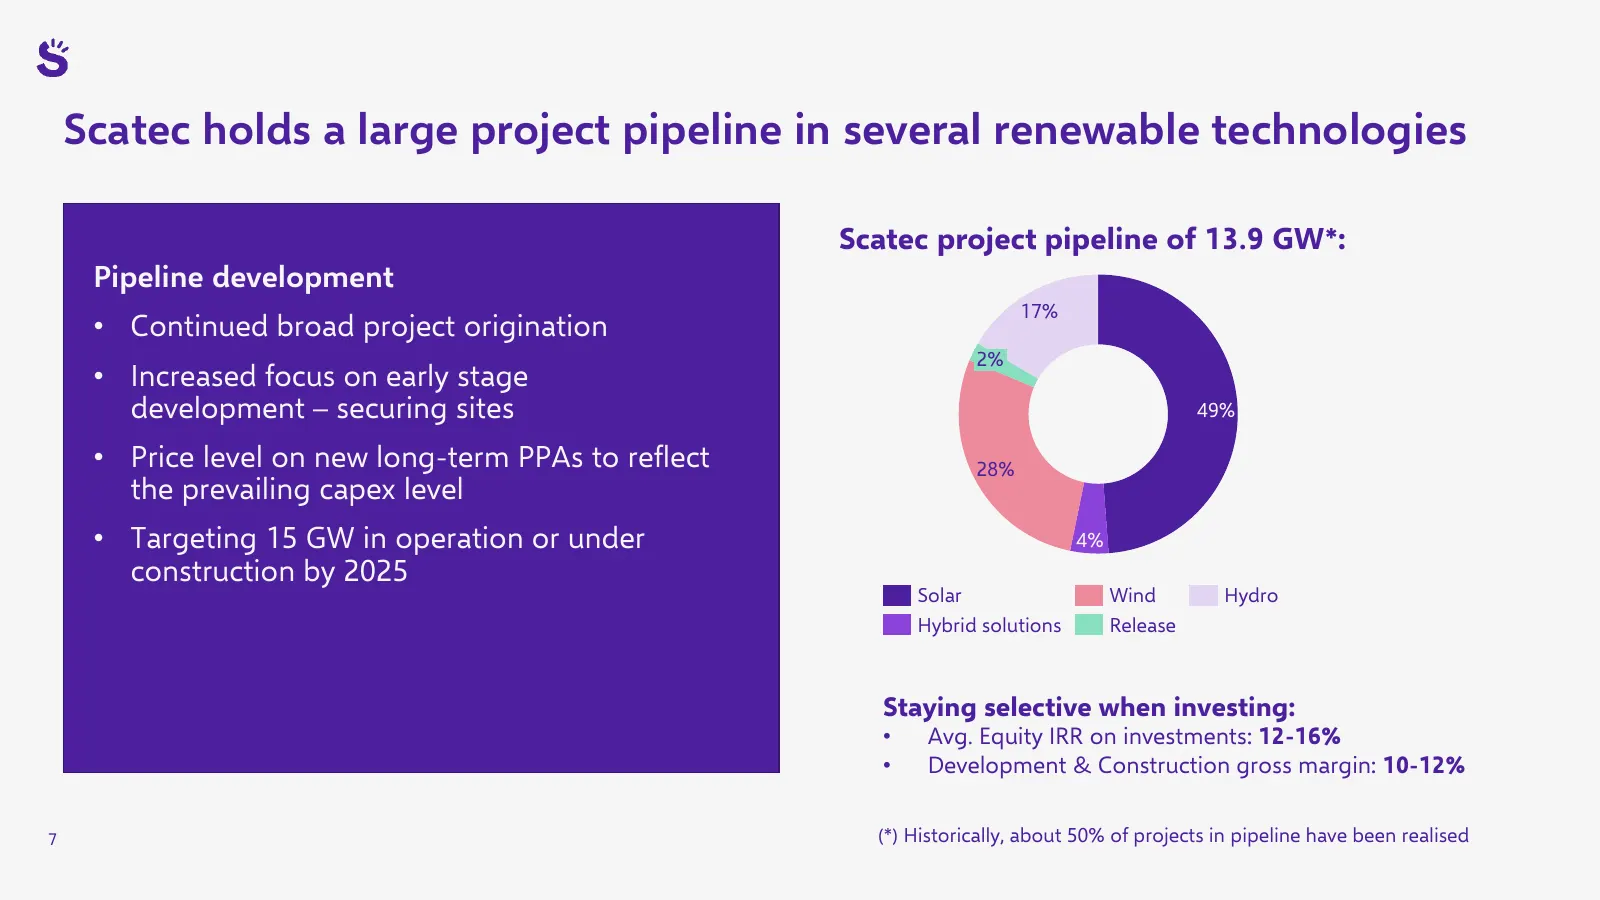
Scatec holds a large project pipeline in several renewable technologies Scatec project pipeline of 13.9 GW*: Pipeline development 17% • Continued broad project origination 2% • Increased focus on early stage development – securing sites 49% • Price level on new long-term PPAs to reflect 28% the prev
Slide 8: Scatec is focusing on markets with strong growth
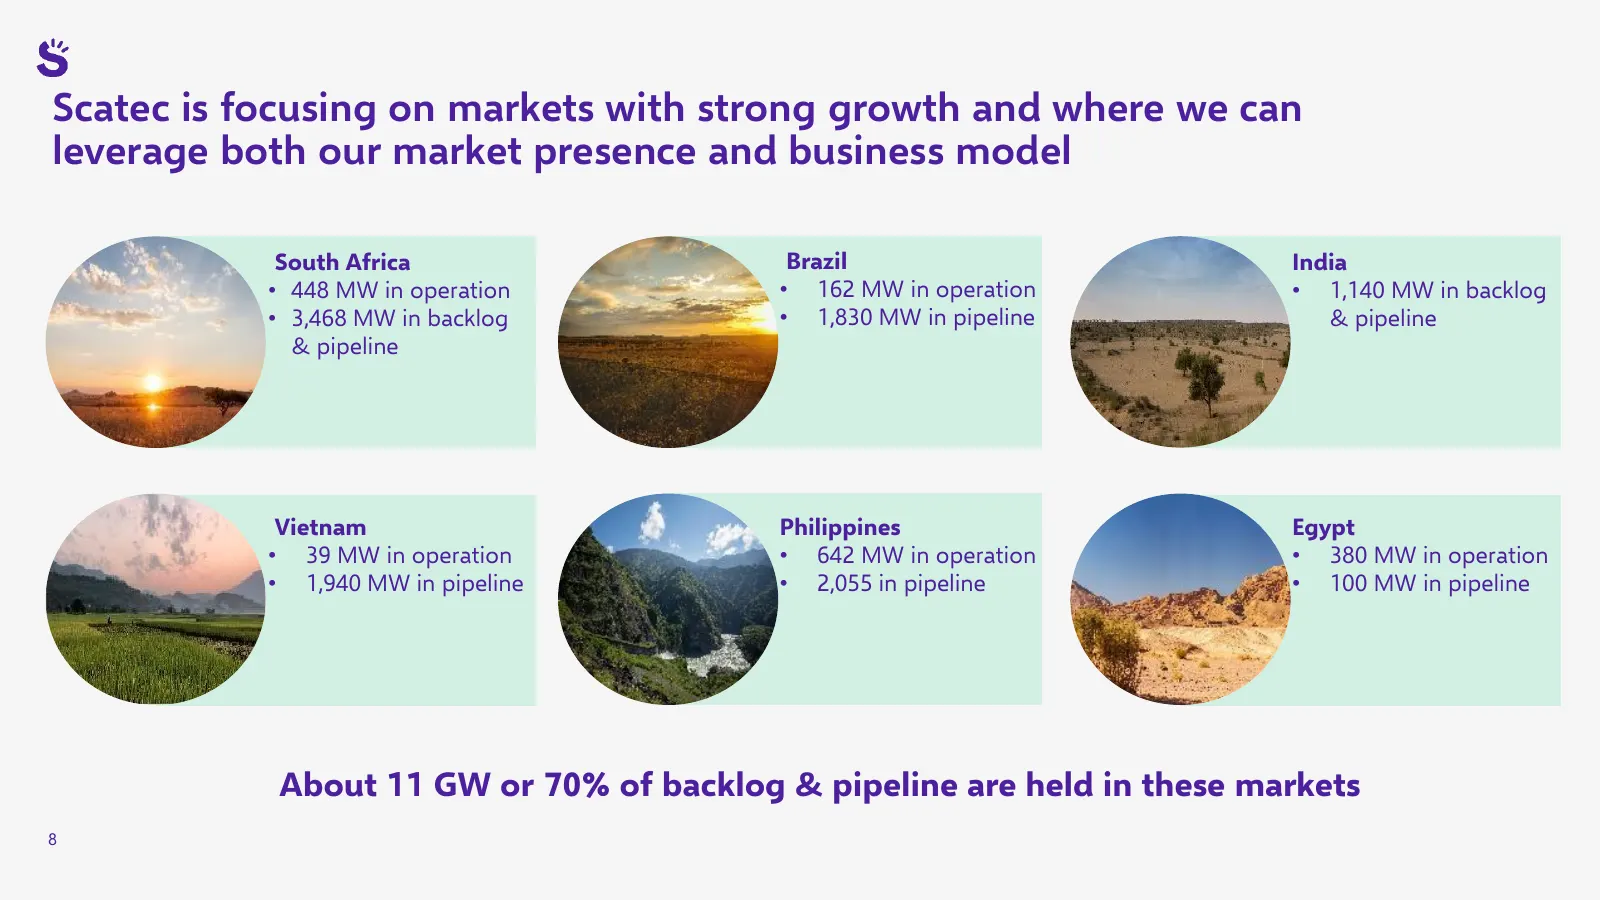
Scatec is focusing on markets with strong growth and where we can leverage both our market presence and business model South Africa Brazil India • 448 MW in operation • 162 MW in operation • 1,140 MW in backlog • 3,468 MW in backlog • 1,830 MW in pipeline & pipeline & pipeline Vietnam Philippines Eg
Slide 9: Awarded 273 MW of solar projects in South Africa
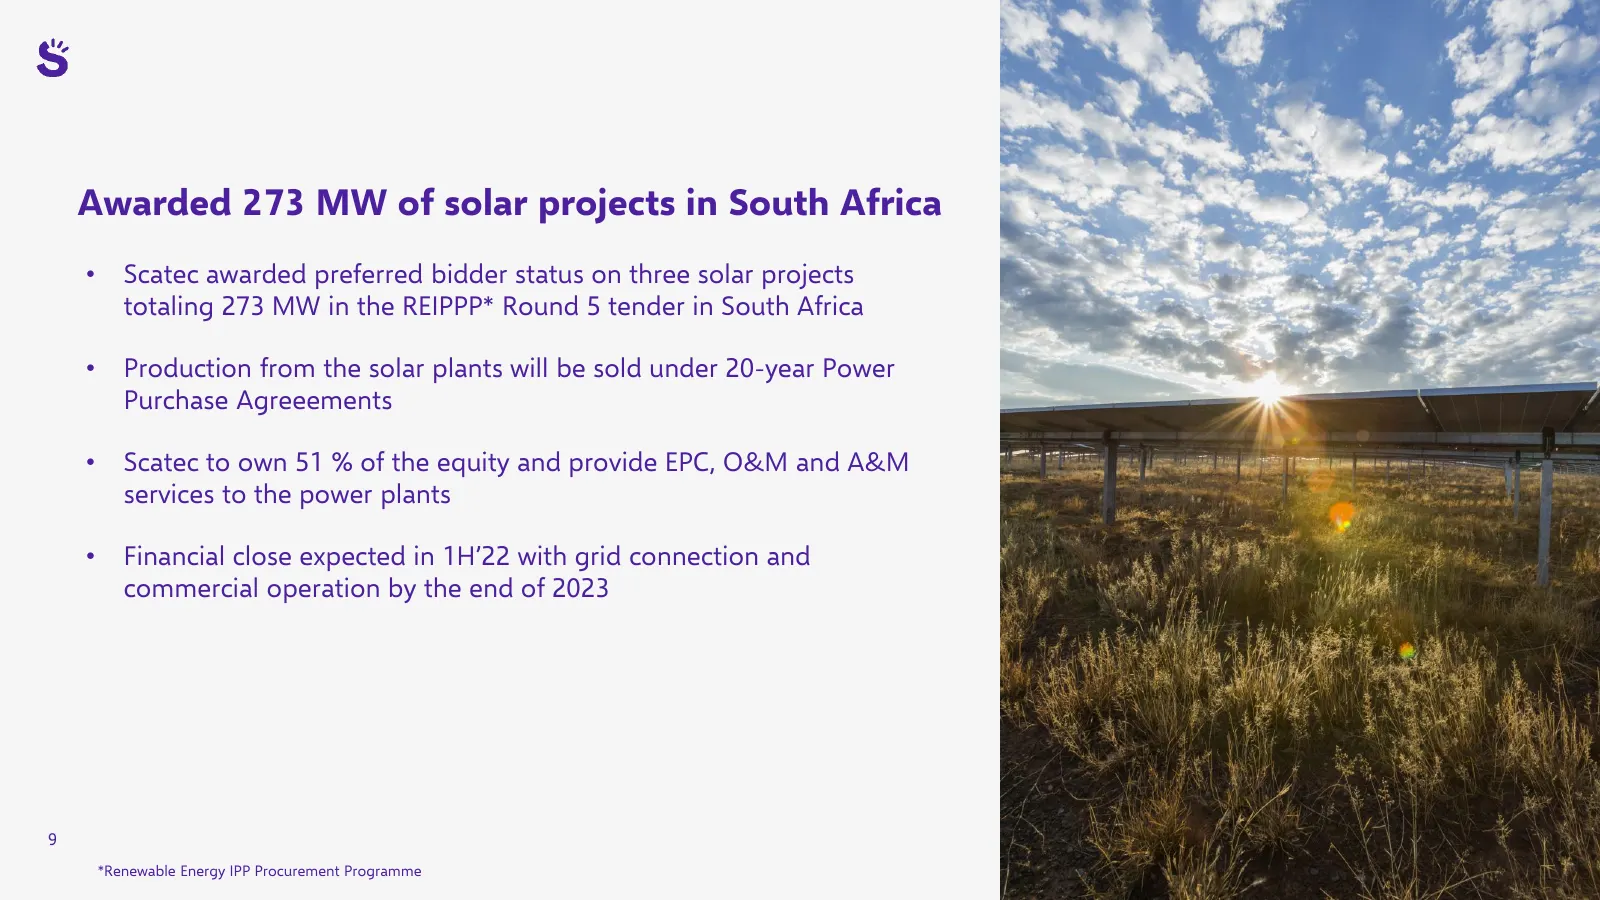
Awarded 273 MW of solar projects in South Africa • Scatec awarded preferred bidder status on three solar projects totaling 273 MW in the REIPPP* Round 5 tender in South Africa • Production from the solar plants will be sold under 20-year Power Purchase Agreeements • Scatec to own 51 % of the equity
Slide 10: The Philippines is developing into a core market for Scatec
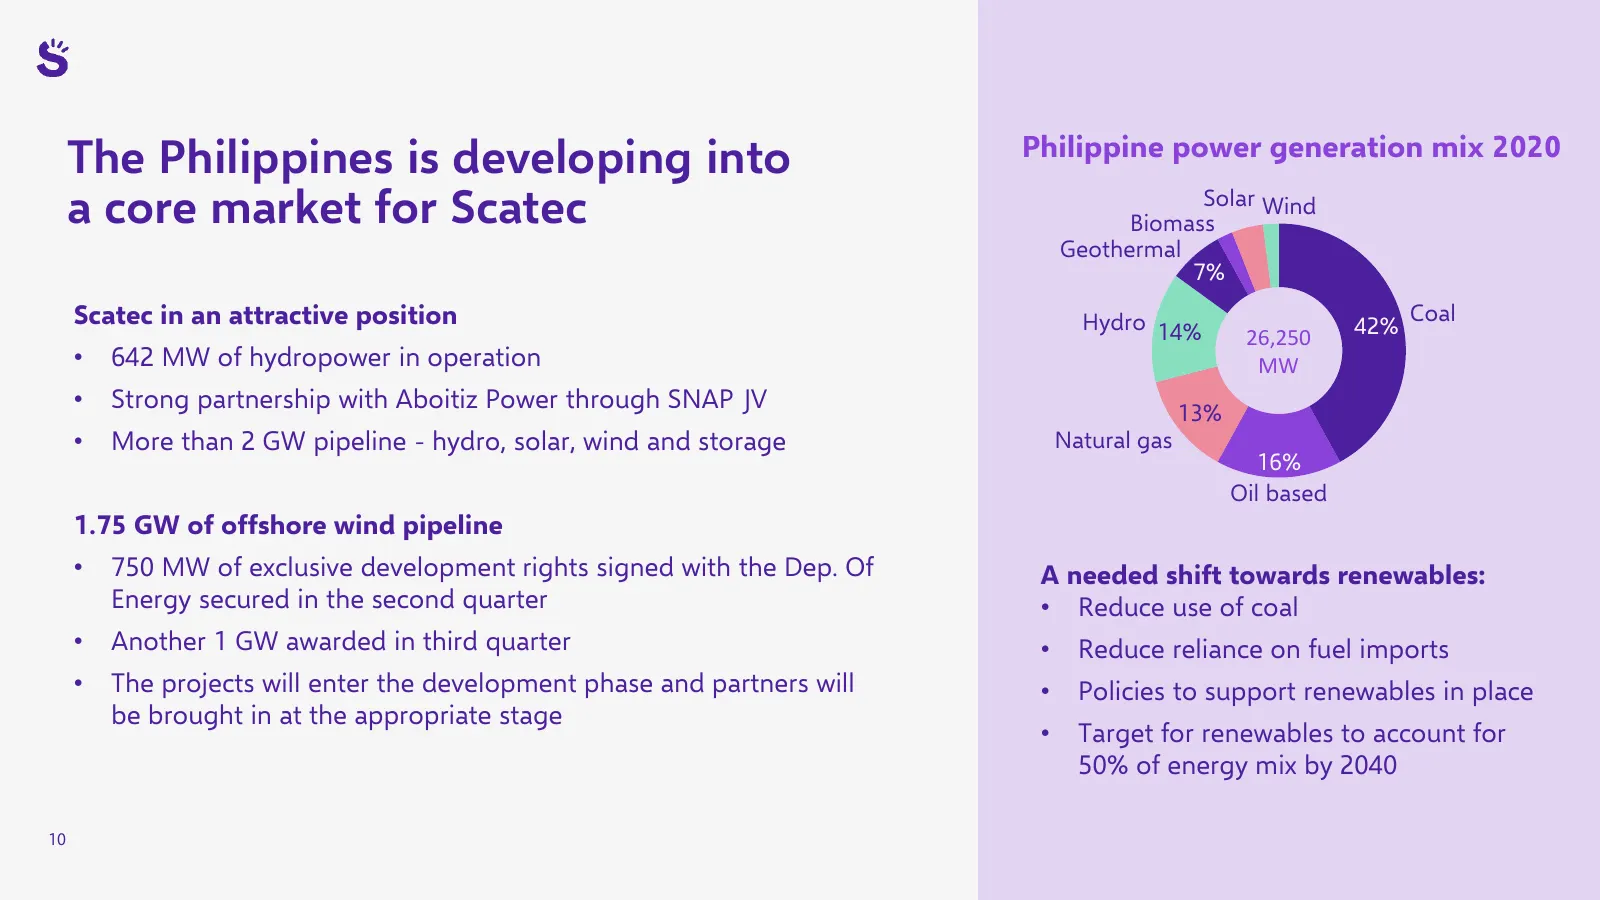
The Philippines is developing into Philippine power generation mix 2020 a core market for Scatec Solar Wind Biomass Geothermal 7% Scatec in an attractive position Hydro 14% 42% Coal 26,250 • 642 MW of hydropower in operation MW • Strong partnership with Aboitiz Power through SNAP JV 13% • More than
Slide 11: Technology integration is essential to address the future customer needs
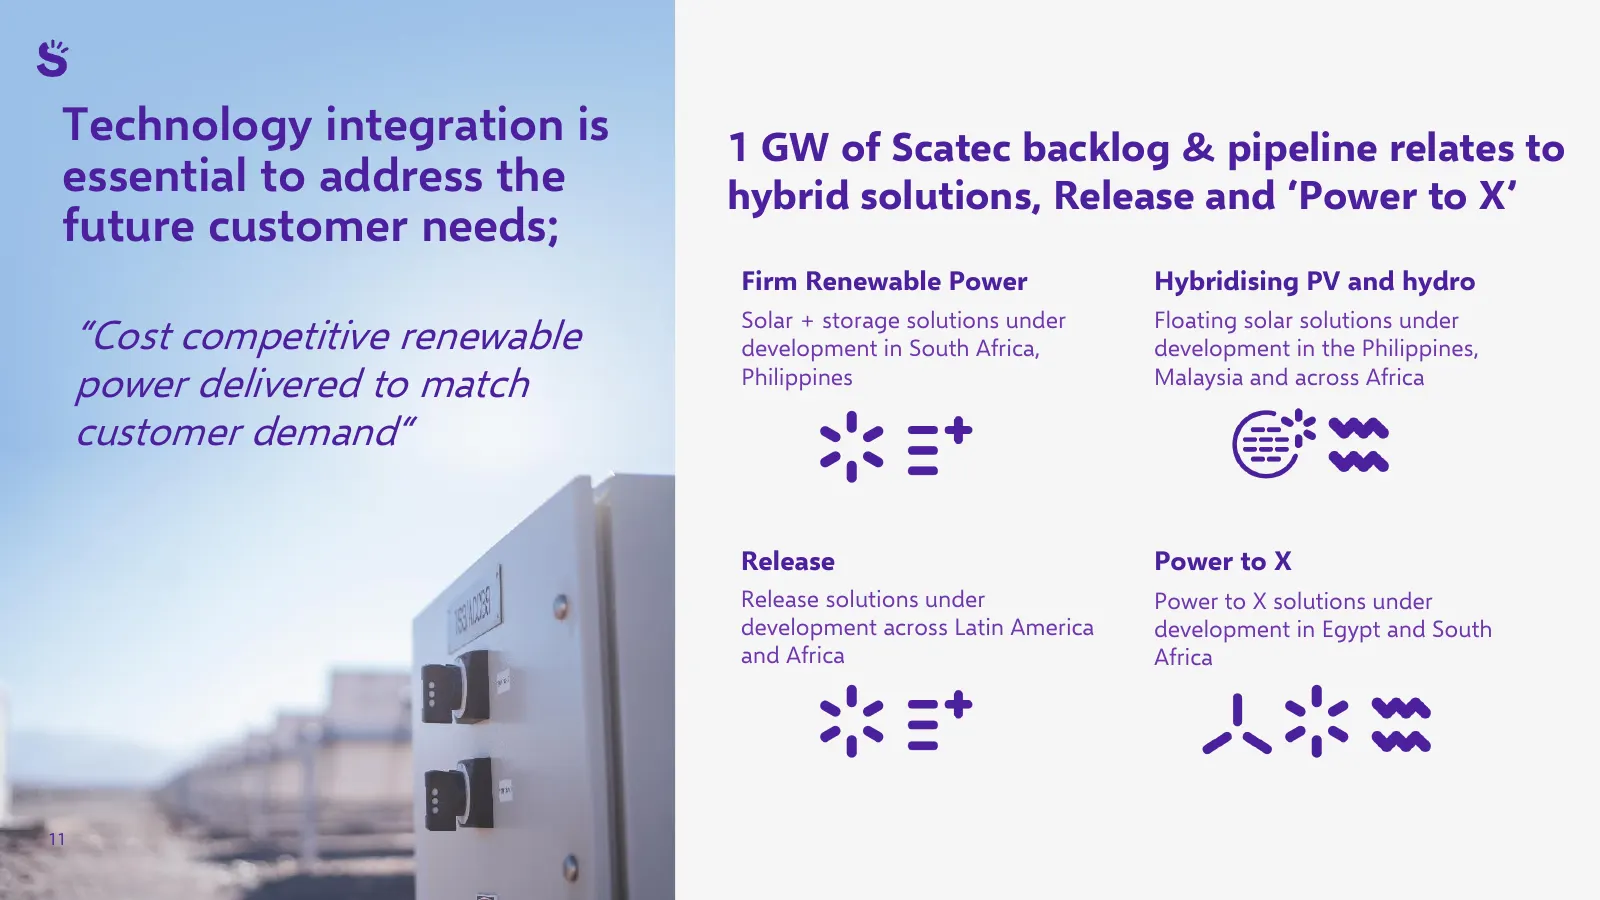
Technology integration is 1 GW of Scatec backlog & pipeline relates to essential to address the hybrid solutions, Release and ‘Power to X’ future customer needs; Firm Renewable Power Hybridising PV and hydro Solar + storage solutions under Floating solar solutions under “Cost competitive renewable d
Slide 12: Developing 50-100 MW green hydrogen facility in Egypt
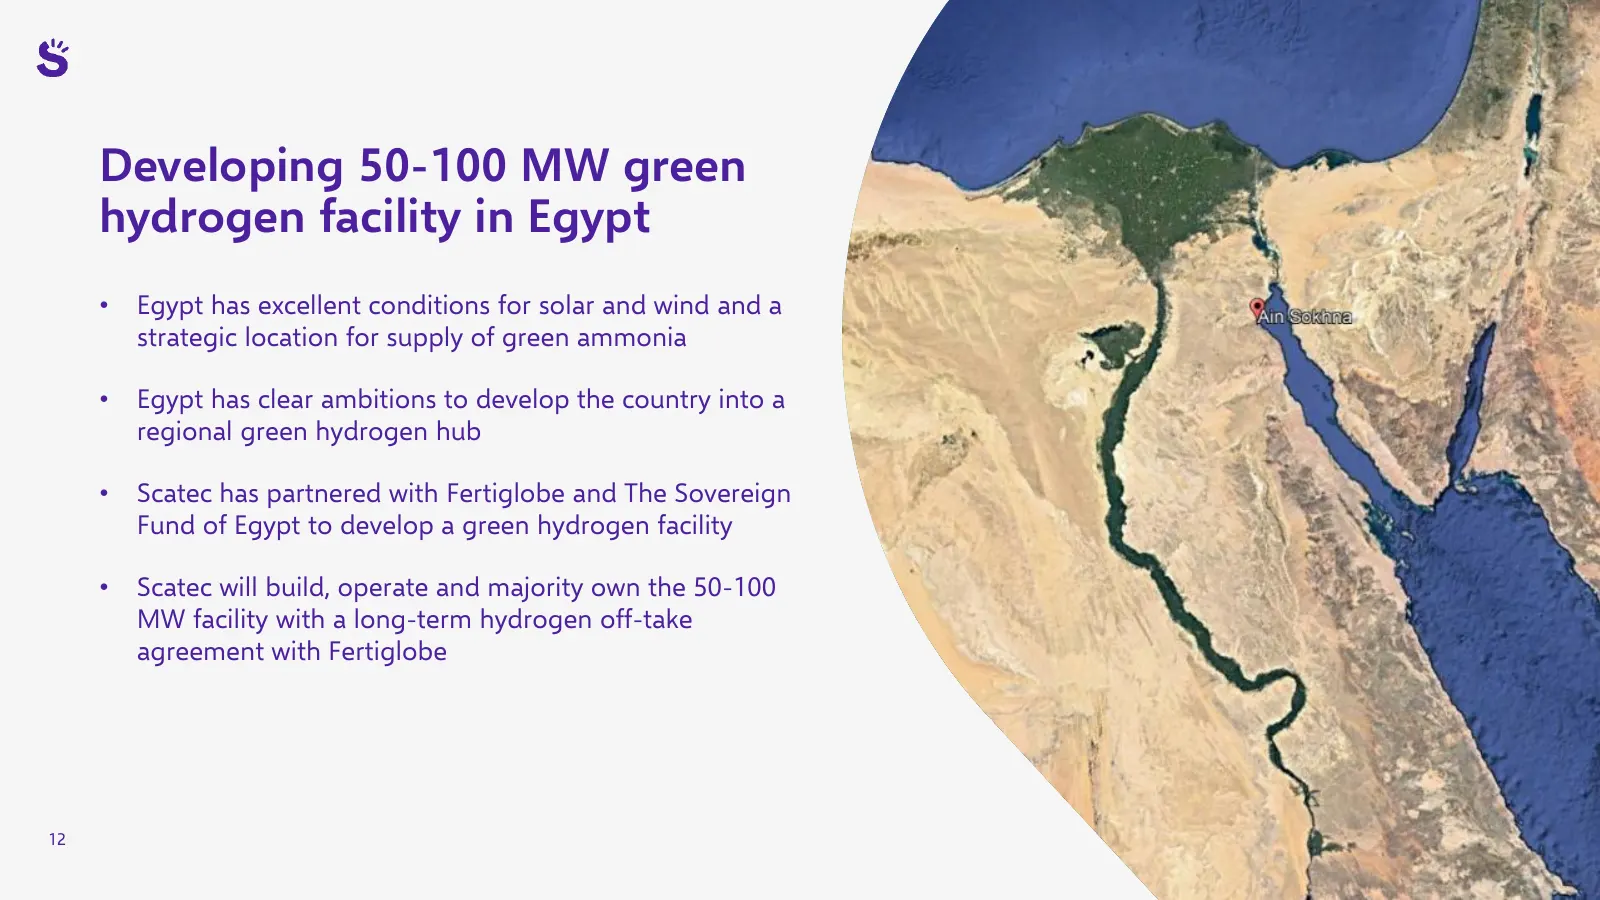
Developing 50-100 MW green hydrogen facility in Egypt • Egypt has excellent conditions for solar and wind and a strategic location for supply of green ammonia • Egypt has clear ambitions to develop the country into a regional green hydrogen hub • Scatec has partnered with Fertiglobe and The Sovereig

Slide 13: Financial review
Financial review Mikkel Tørud, CFO 13
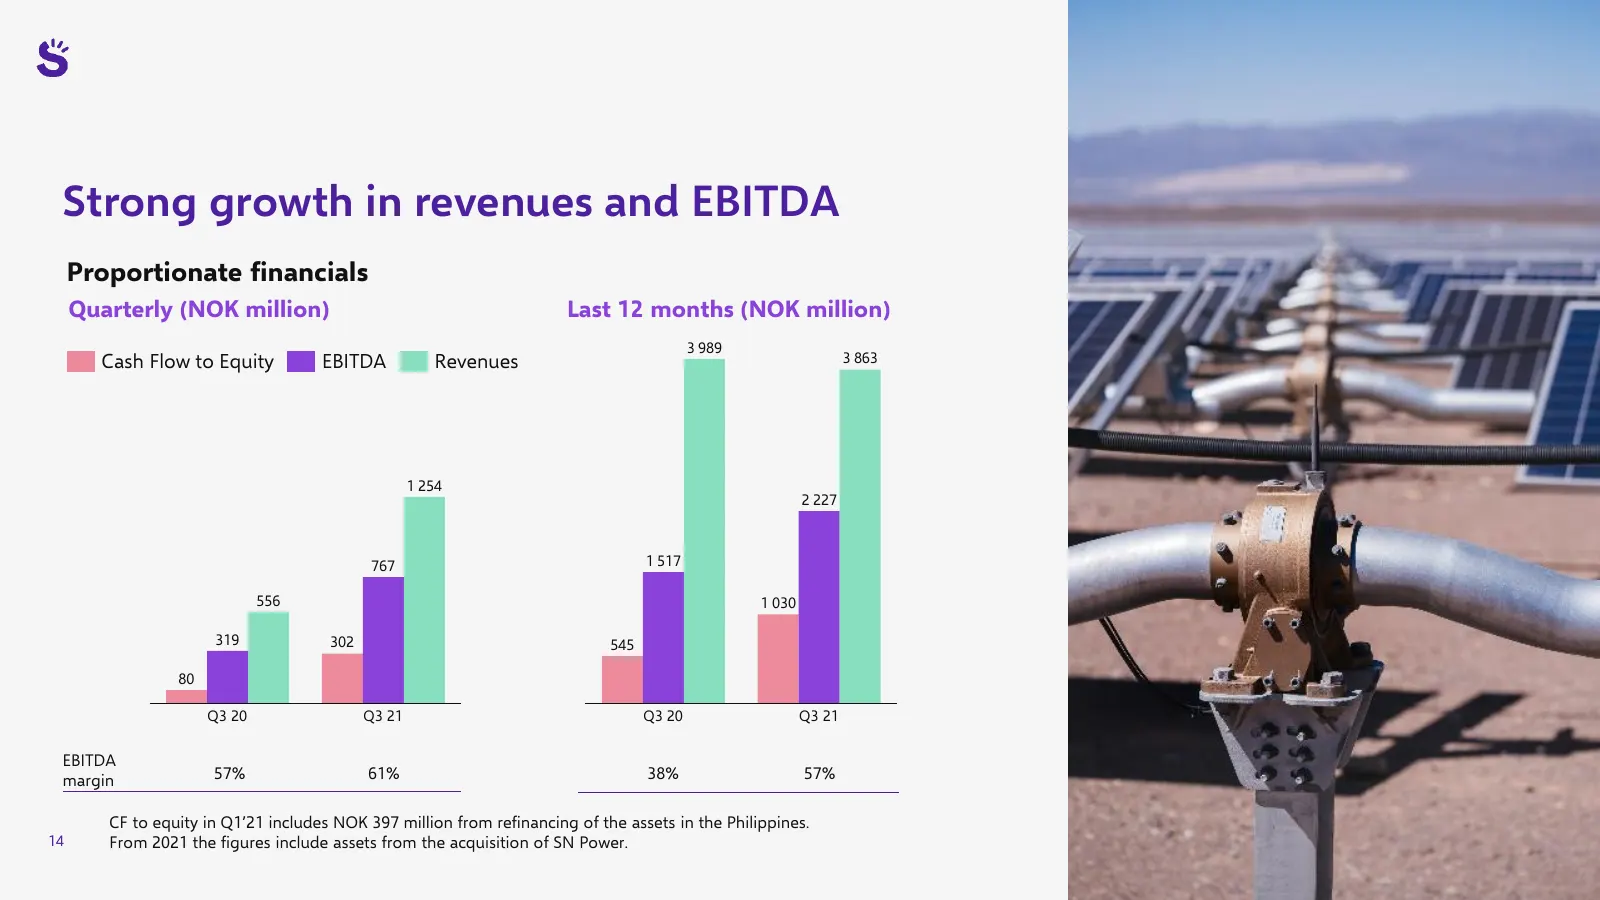
Slide 14: Strong growth in revenues and EBITDA
Strong growth in revenues and EBITDA Proportionate financials Quarterly (NOK million) Last 12 months (NOK million) 3 989 Cash Flow to Equity EBITDA Revenues 3 863 1 254 2 227 767 1 517 556 1 030 319 302 545 80 Q3 20 Q3 21 Q3 20 Q3 21 EBITDA margin 57% 61% 38% 57% CF to equity in Q1’21 includes NOK 3
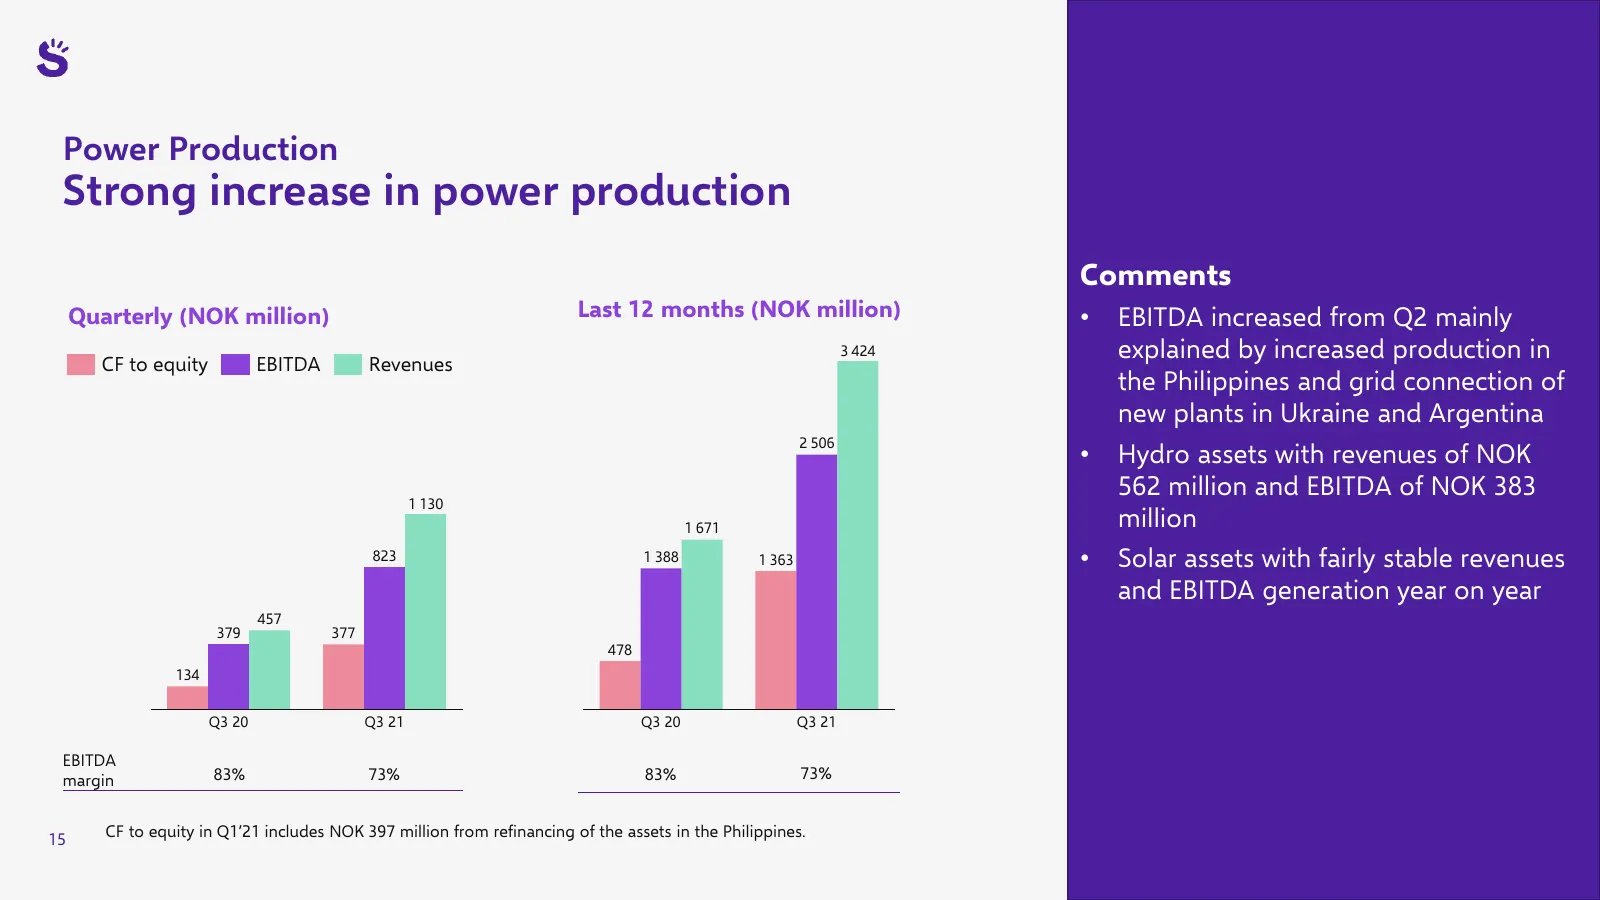
Slide 15: Power Production: Strong increase in power production
Power Production Strong increase in power production Comments Quarterly (NOK million) Last 12 months (NOK million) • EBITDA increased from Q2 mainly CF to equity EBITDA Revenues 3 424 explained by increased production in the Philippines and grid connection of new plants in Ukraine and Argentina 2 50
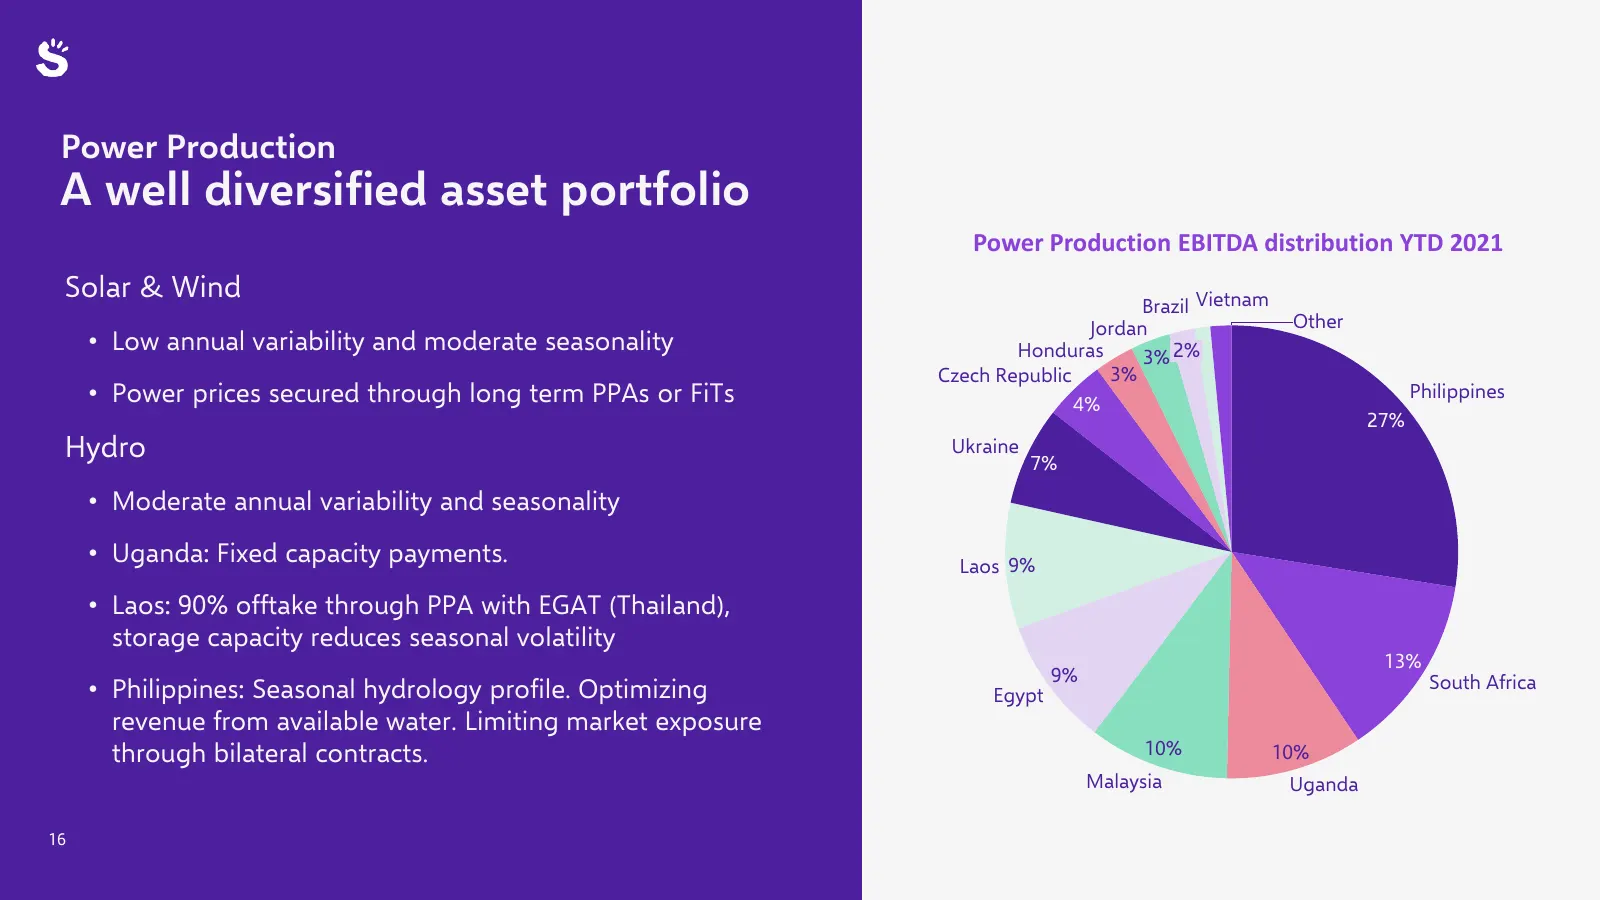
Slide 16: A well diversified asset portfolio
Power Production A well diversified asset portfolio Power Production EBITDA distribution YTD 2021 Solar & Wind EBI Brazil Vietnam Jordan Other • Low annual variability and moderate seasonality Honduras 3% 2% Czech Republic 3% • Power prices secured through long term PPAs or FiTs 4% Philippines 27% H
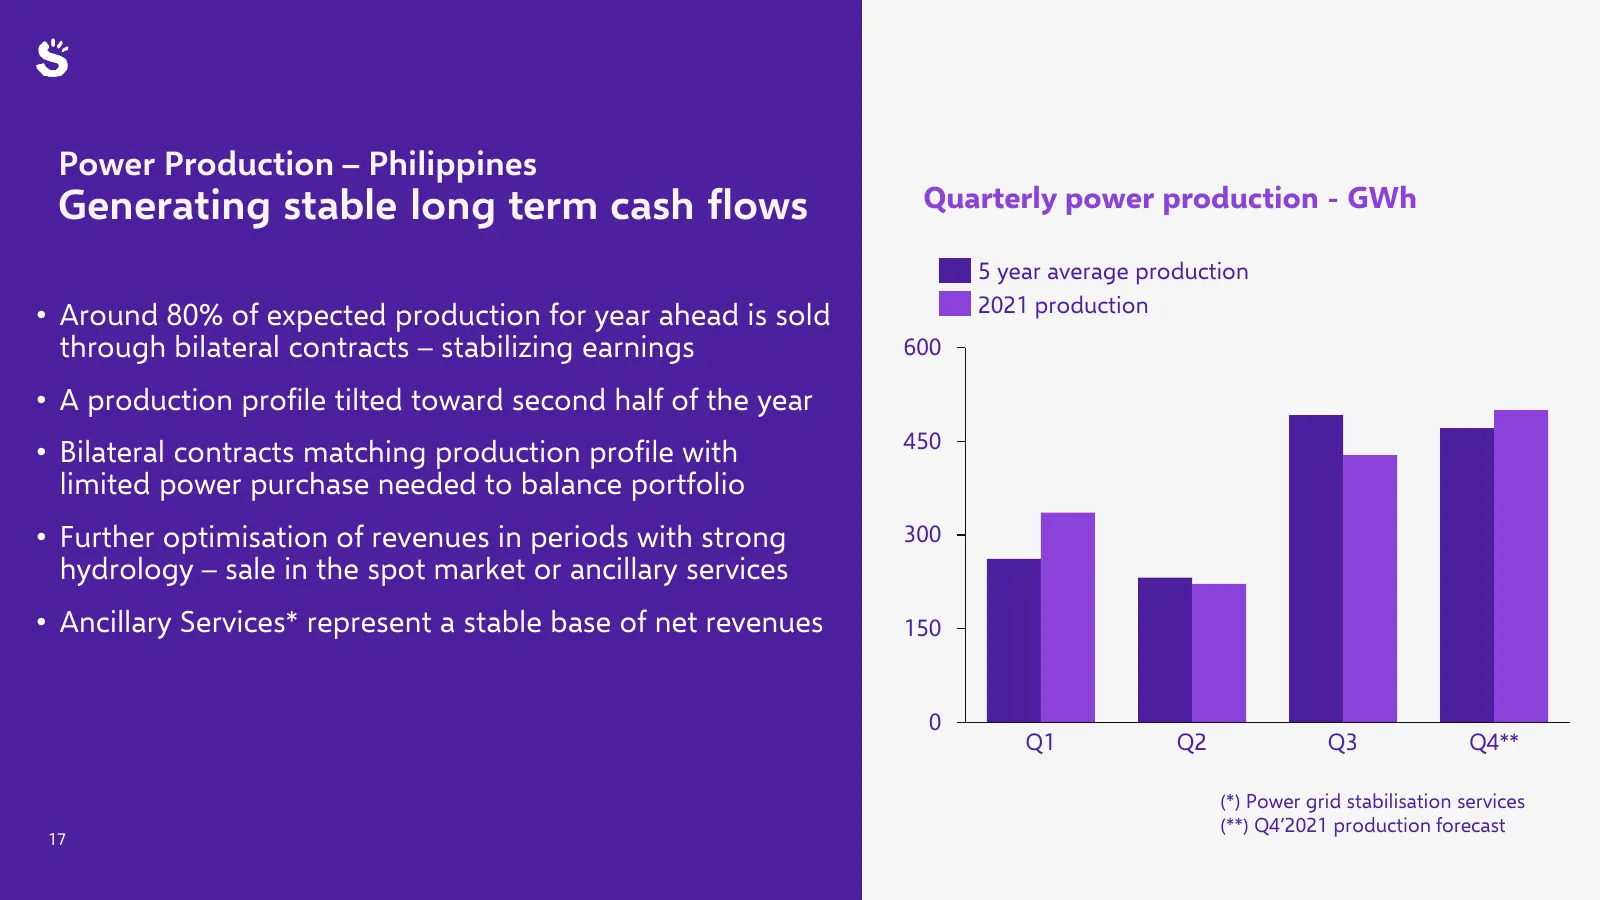
Slide 17: Power Production – Philippines: Generating stable long term cash flows
Power Production – Philippines Generating stable long term cash flows Quarterly power production - GWh 5 year average production 2021 production • Around 80% of expected production for year ahead is sold through bilateral contracts – stabilizing earnings 600 • A production profile tilted toward seco
Slide 18: Services: Stable financial performance
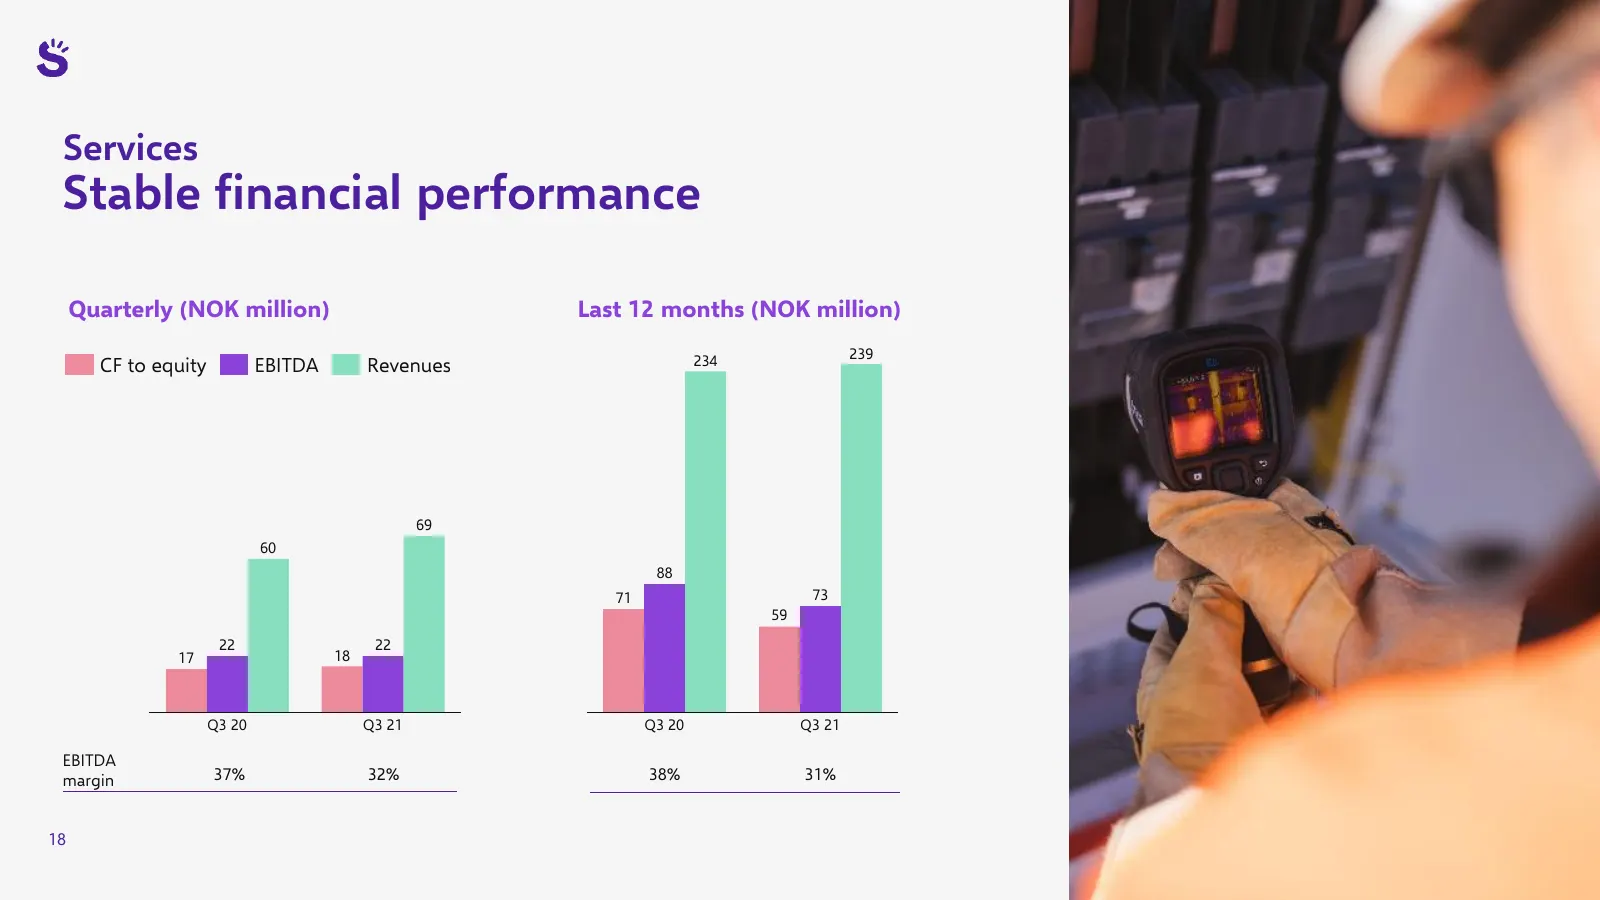
Services Stable financial performance Quarterly (NOK million) Last 12 months (NOK million) 234 239 CF to equity EBITDA Revenues 69 60 88 71 73 59 22 22 17 18 Q3 20 Q3 21 Q3 20 Q3 21 EBITDA margin 37% 32% 38% 31% 18
Slide 19: Short-term delays in Pakistan continued to impact construction revenues
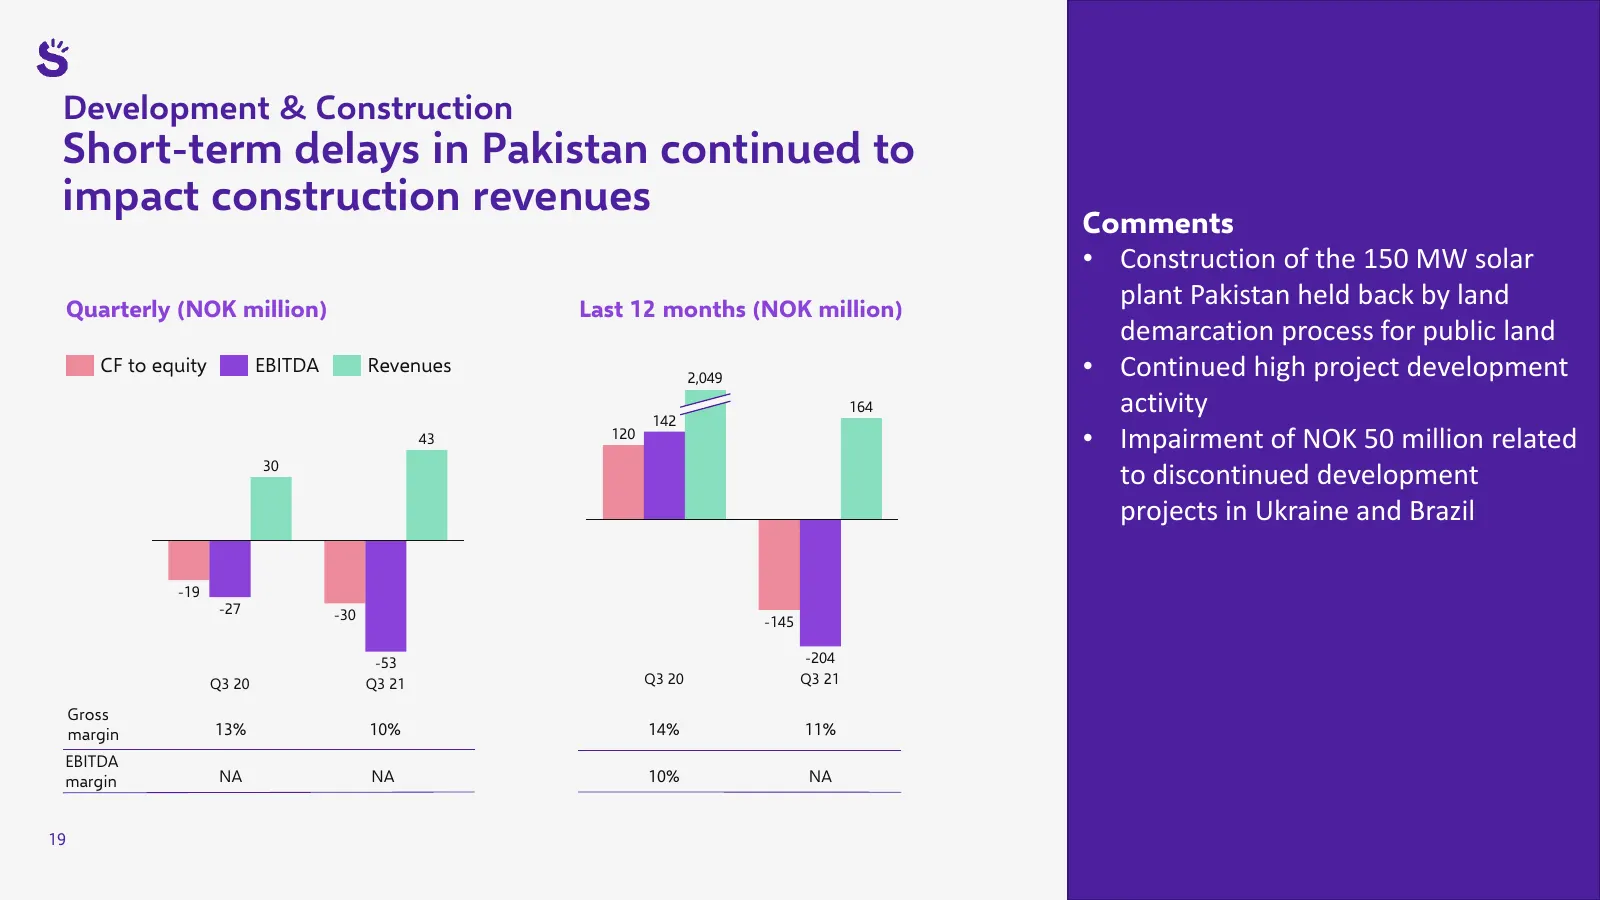
Development & Construction Short-term delays in Pakistan continued to impact construction revenues Comments • Construction of the 150 MW solar Quarterly (NOK million) Last 12 months (NOK million) plant Pakistan held back by land demarcation process for public land CF to equity EBITDA Revenues 2,049
Slide 20: A solid financial position
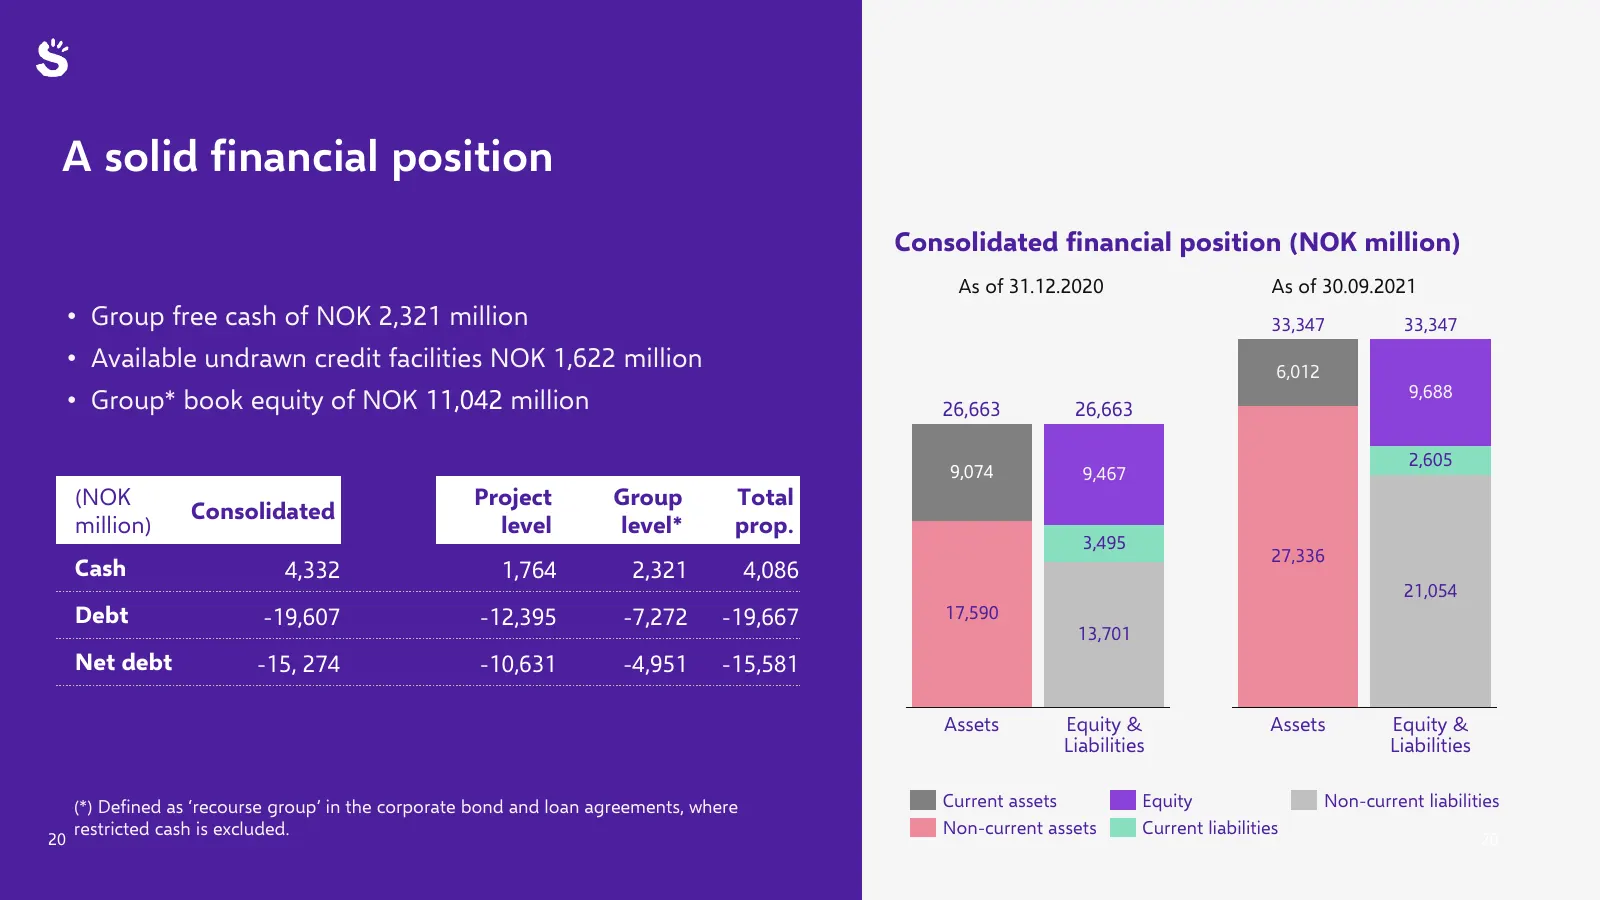
A solid financial position Consolidated financial position (NOK million) As of 31.12.2020 As of 30.09.2021 • Group free cash of NOK 2,321 million 33,347 33,347 • Available undrawn credit facilities NOK 1,622 million 6,012 9,688 • Group* book equity of NOK 11,042 million 26,663 26,663 2,605 9,074 9,4
Slide 21: Q3'21 movement of the Group's free cash
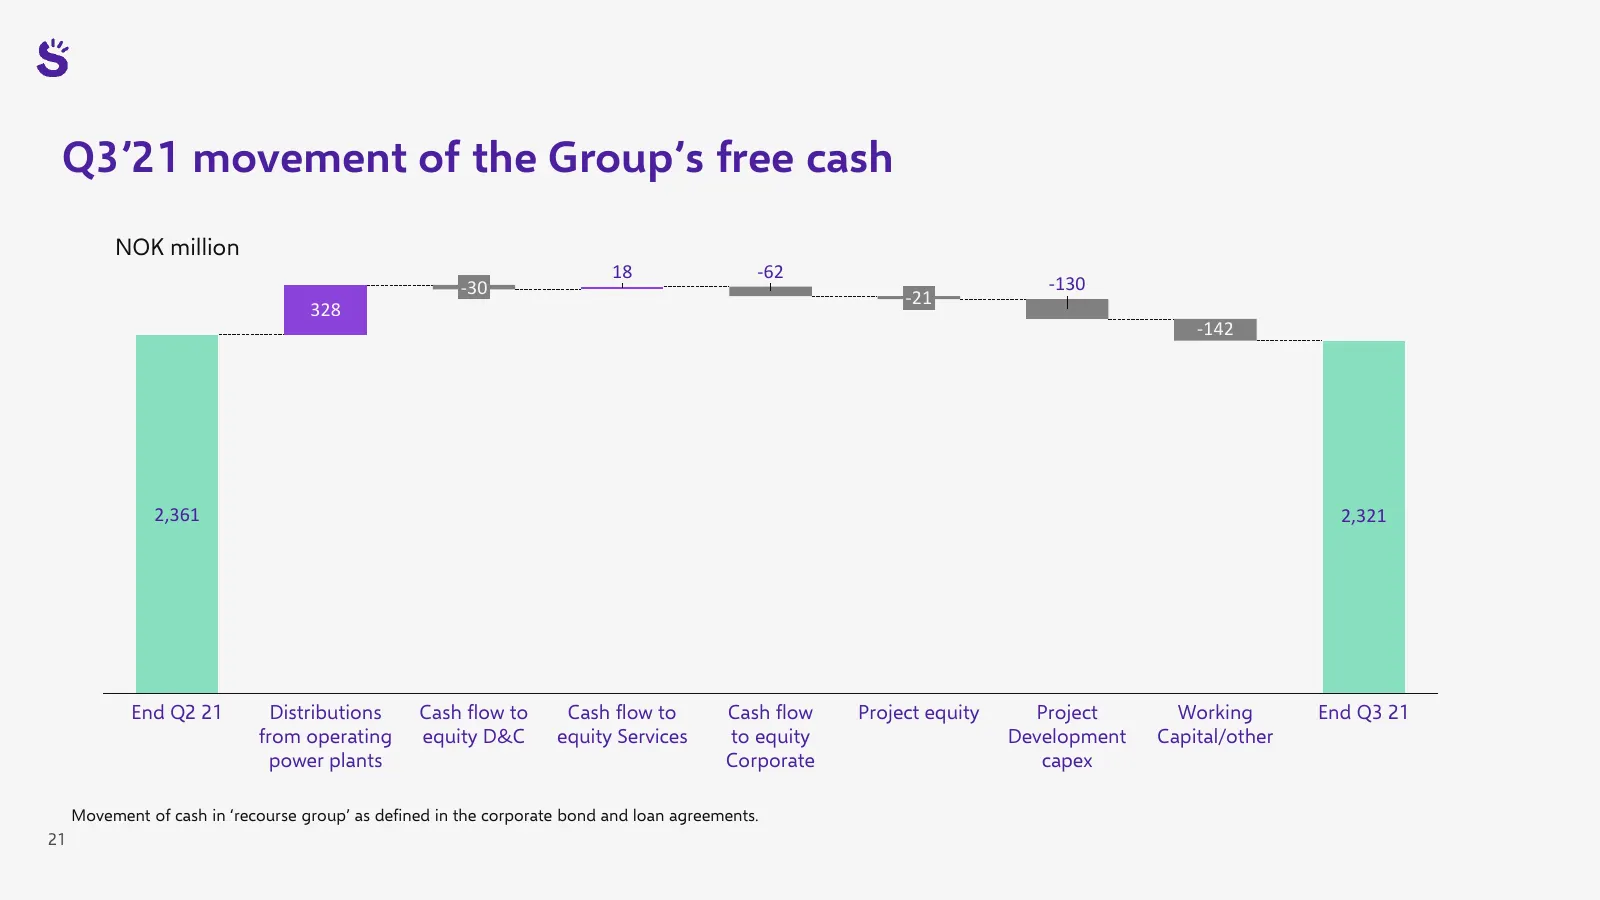
Q3’21 movement of the Group’s free cash NOK million 18 -62 -30 -130 -21 328 -142 2,361 2,321 End Q2 21 Distributions Cash flow to Cash flow to Cash flow Project equity Project Working End Q3 21 from operating equity D&C equity Services to equity Development Capital/other power plants Corporate capex
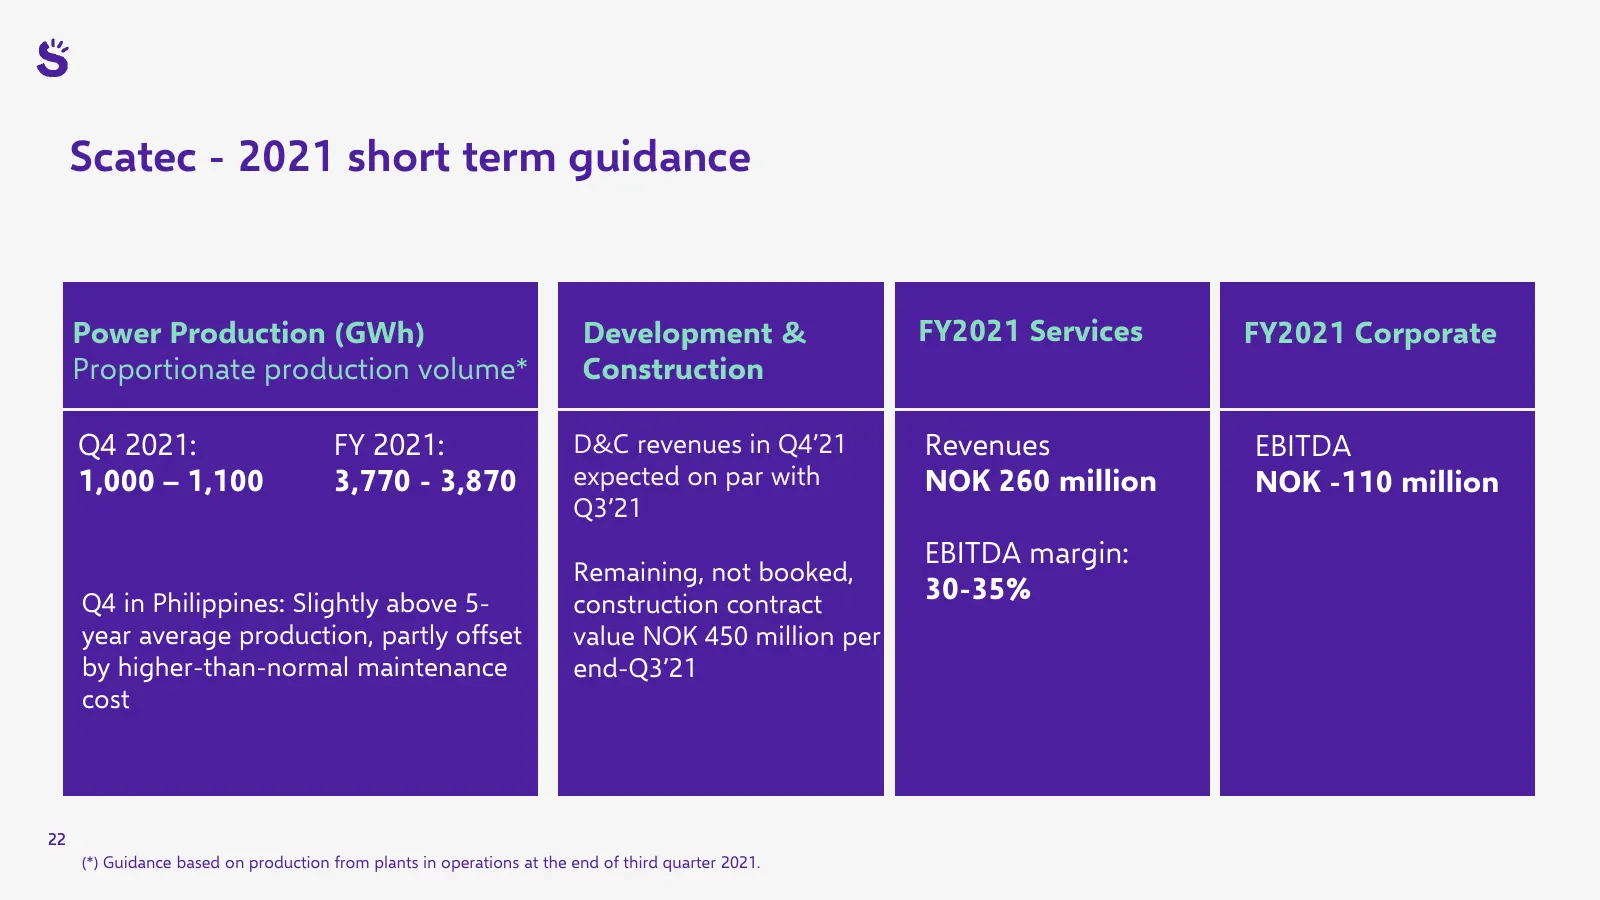
Slide 22: Scatec - 2021 short term guidance
Scatec - 2021 short term guidance Power Production (GWh) Development & FY2021 Services FY2021 Corporate Proportionate production volume* Construction Q4 2021: FY 2021: D&C revenues in Q4’21 Revenues EBITDA 1,000 – 1,100 3,770 - 3,870 expected on par with NOK 260 million NOK -110 million Q3’21 EBITDA

Slide 23: Summary
Summary Raymond Carlsen, CEO 23
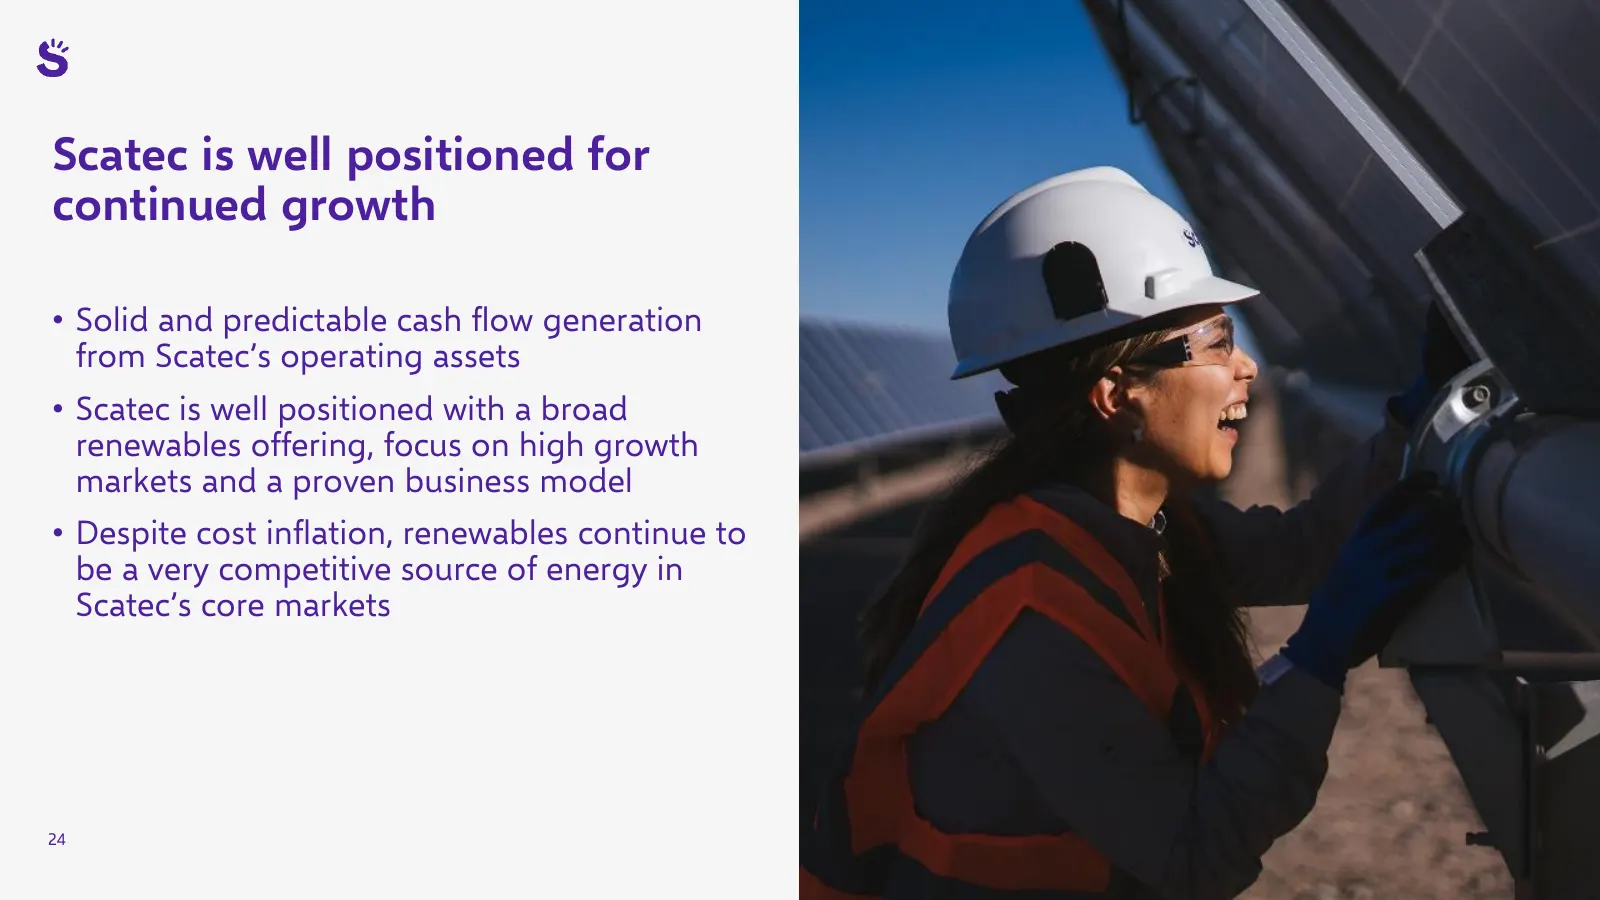
Slide 24: Scatec is well positioned for continued growth
Scatec is well positioned for continued growth • Solid and predictable cash flow generation from Scatec’s operating assets • Scatec is well positioned with a broad renewables offering, focus on high growth markets and a proven business model • Despite cost inflation, renewables continue to be a very
Slide 25: Scatec improving our future
Scate improving our future
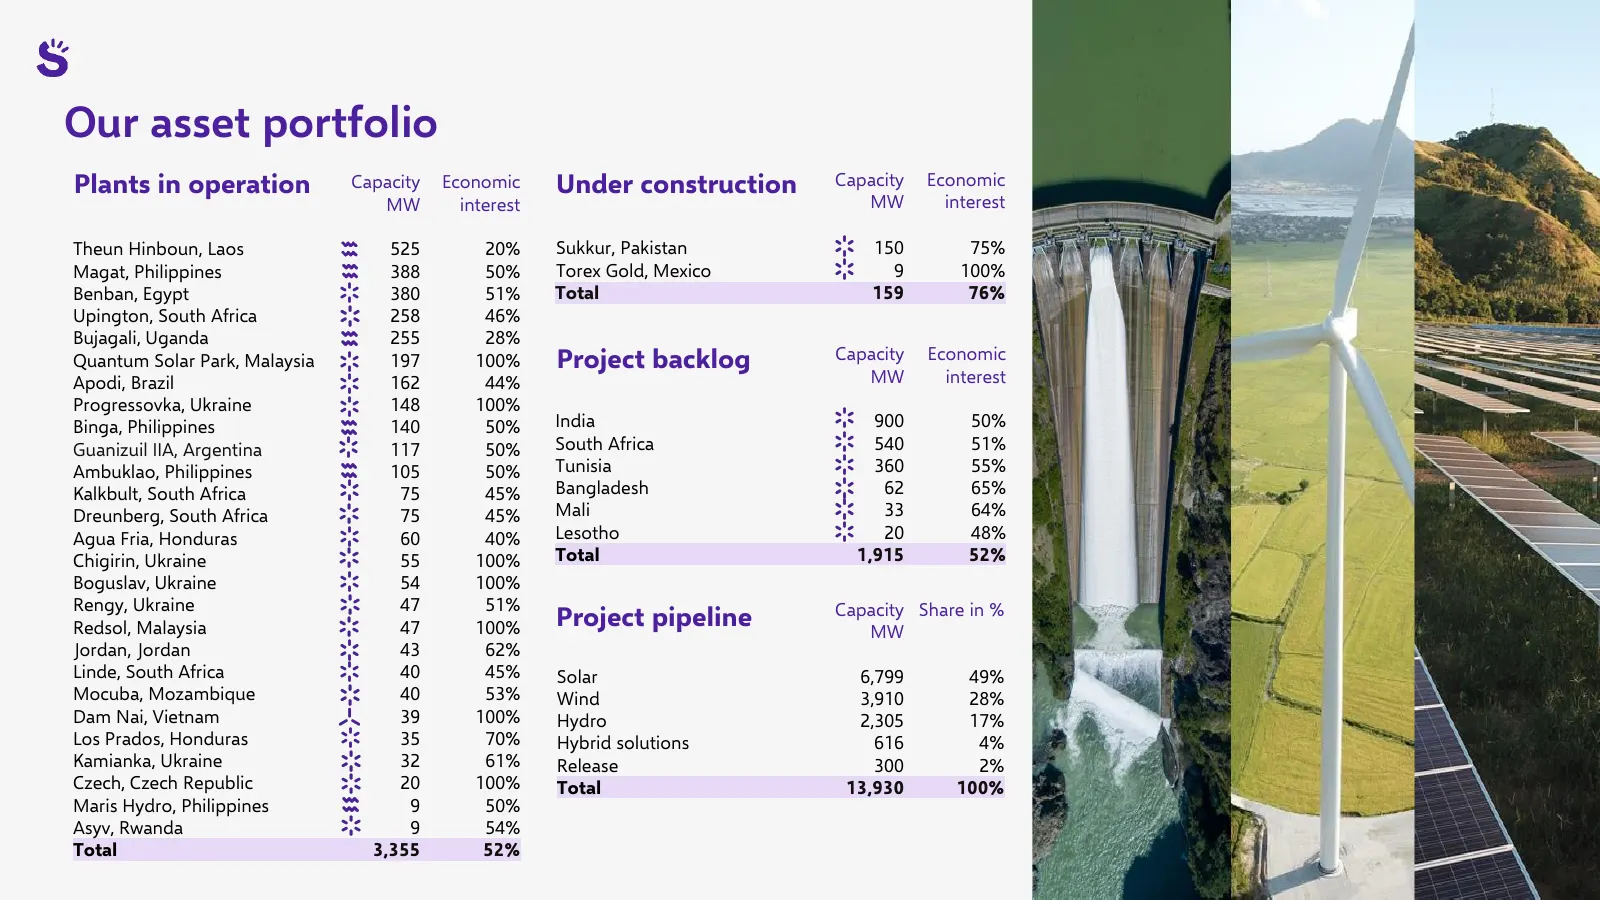
Slide 26: Our asset portfolio
Our asset portfolio Plants in operation Capacity Economic Under construction Capacity Economic MW interest MW interest Theun Hinboun, Laos 525 20% Sukkur, Pakistan 150 75% Magat, Philippines 388 50% Torex Gold, Mexico 9 100% Benban, Egypt 380 51% Total 159 76% Upington, South Africa 258 46% Bujagali
Source: Internet Archive copy of scatec.com
More decks from Scatec ASA
 Q3 2026 Earnings Presentation32 slides · Oct 30, 2026
 Q2 2026 Earnings Presentation23 slides · Aug 21, 2026
 Investor Presentation (August 2026)22 slides · August 2026
 Q1 2026 Earnings Presentation23 slides · May 6, 2026
 Investor Presentation (March 2026)22 slides · March 2026
 Q4 2025 Earnings Presentation24 slides · Jan 30, 2026