Pacific Mercantile Bancorp — Investor Presentation (August 2016)
24 slides from Pacific Mercantile Bancorp's investor presentation, Aug 1, 2016
Slide 1: Investor Presentation August 2016
INVESTOR PRESENTAT ION A U G U S T 2 0 1 6 1
Slide 2: Forward-looking statements
This presentation contains statements regarding our expectations, beliefs and views about our future financial performance and our business, trends and expectations regarding the markets in which we operate, and our future plans. Those statements constitute “forward-looking statements” within the me
Slide 3: Corporate Overview
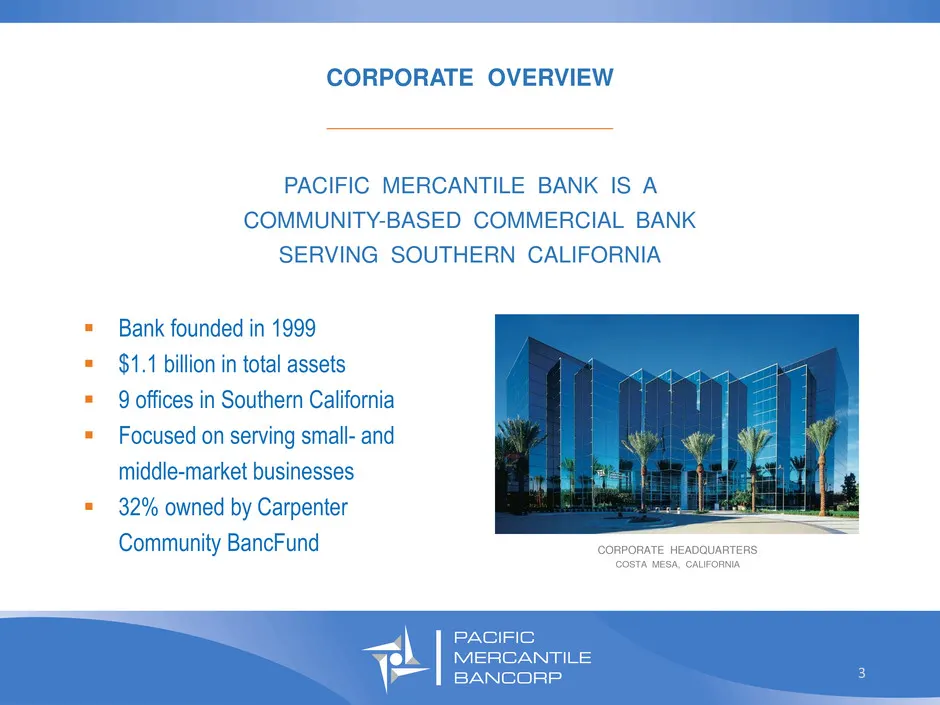
CORPORATE OVERVIEW _________________________________ PACIFIC MERCANTILE BANK IS A COMMUNITY-BASED COMMERCIAL BANK SERVING SOUTHERN CALIFORNIA Bank founded in 1999 $1.1 billion in total assets 9 offices in Southern California Focused on serving small- and middle-market businesses 32% owned
Slide 4: Office Locations
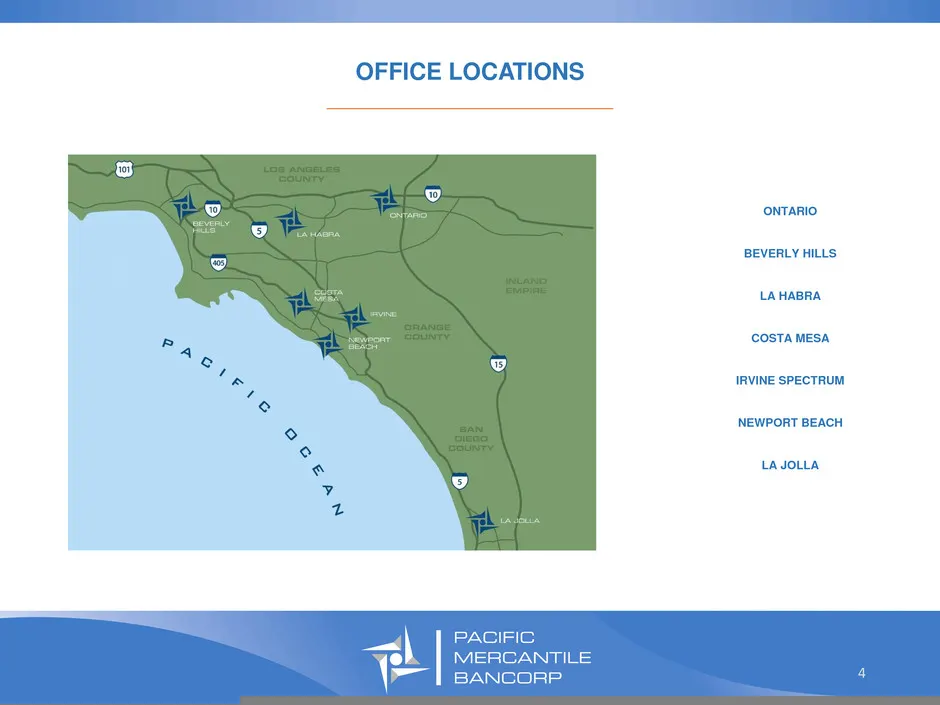
OFFICE LOCATIONS _________________________________ ONTARIO BEVERLY HILLS LA HABRA COSTA MESA IRVINE SPECTRUM NEWPORT BEACH LA JOLLA 4
Slide 5: Investor Highlights
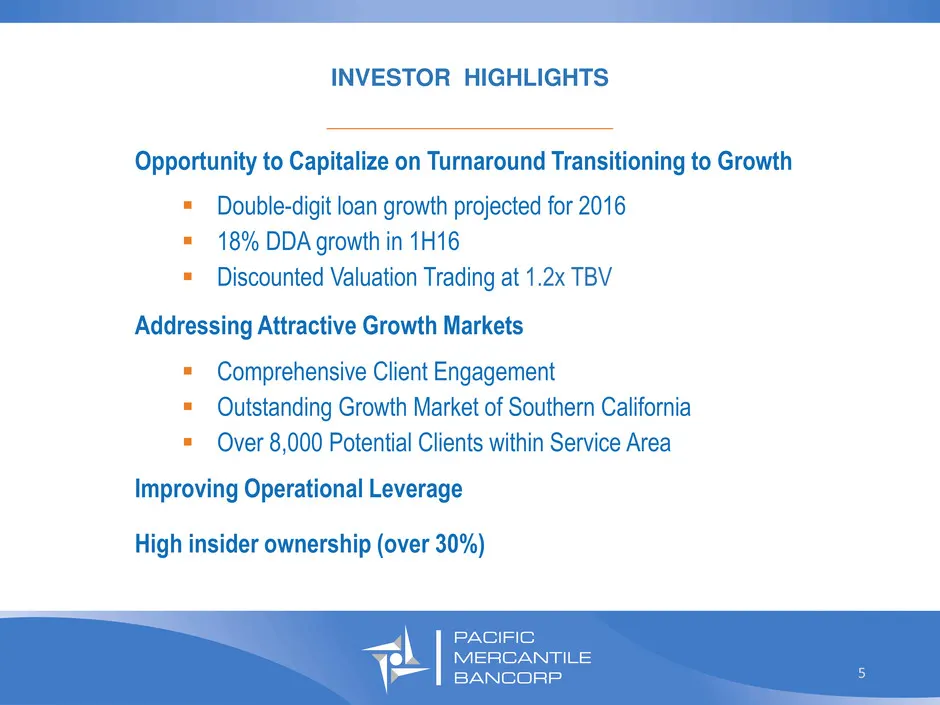
INVESTOR HIGHLIGHTS _________________________________ Opportunity to Capitalize on Turnaround Transitioning to Growth Double-digit loan growth projected for 2016 18% DDA growth in 1H16 Discounted Valuation Trading at 1.2x TBV Addressing Attractive Growth Markets Comprehensive Client Engageme
Slide 6: Core Market Overview: Southern California
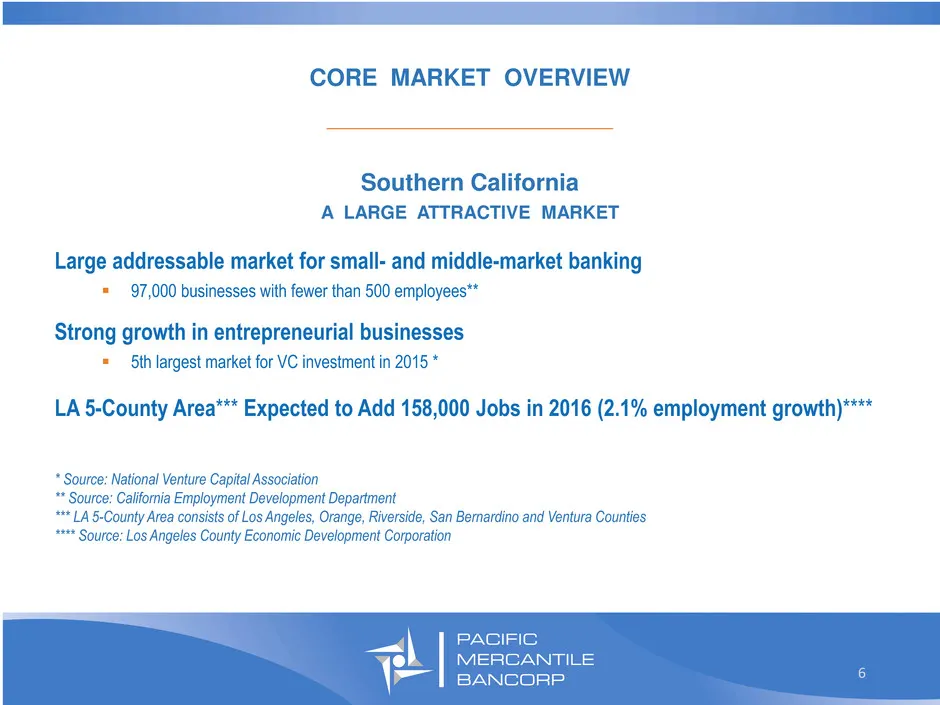
CORE MARKET OVERVIEW _________________________________ Southern California A LARGE ATTRACTIVE MARKET * Source: National Venture Capital Association ** Source: California Employment Development Department *** LA 5-County Area consists of Los Angeles, Orange, Riverside, San Bernardino and Ventura Coun
Slide 7: Strong Executive Team
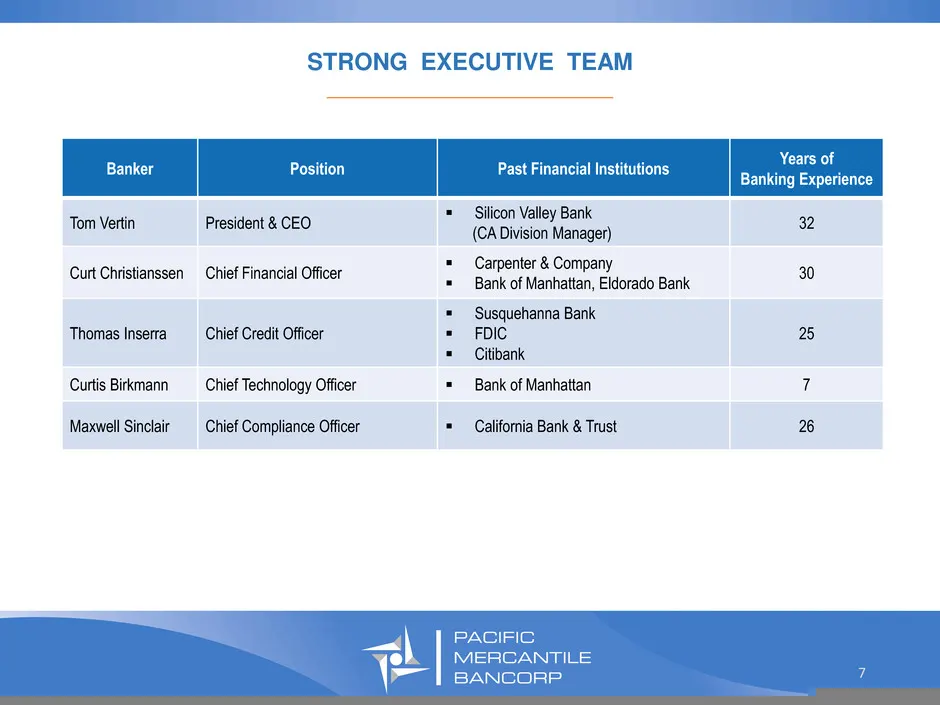
Banker Position Past Financial Institutions Years of Banking Experience Tom Vertin President & CEO Silicon Valley Bank (CA Division Manager) 32 Curt Christianssen Chief Financial Officer Carpenter & Company Bank of Manhattan, Eldorado Bank 30 Thomas Inserra Chief Credit Officer Susquehanna B
Slide 8: Strong Commercial Banking Team
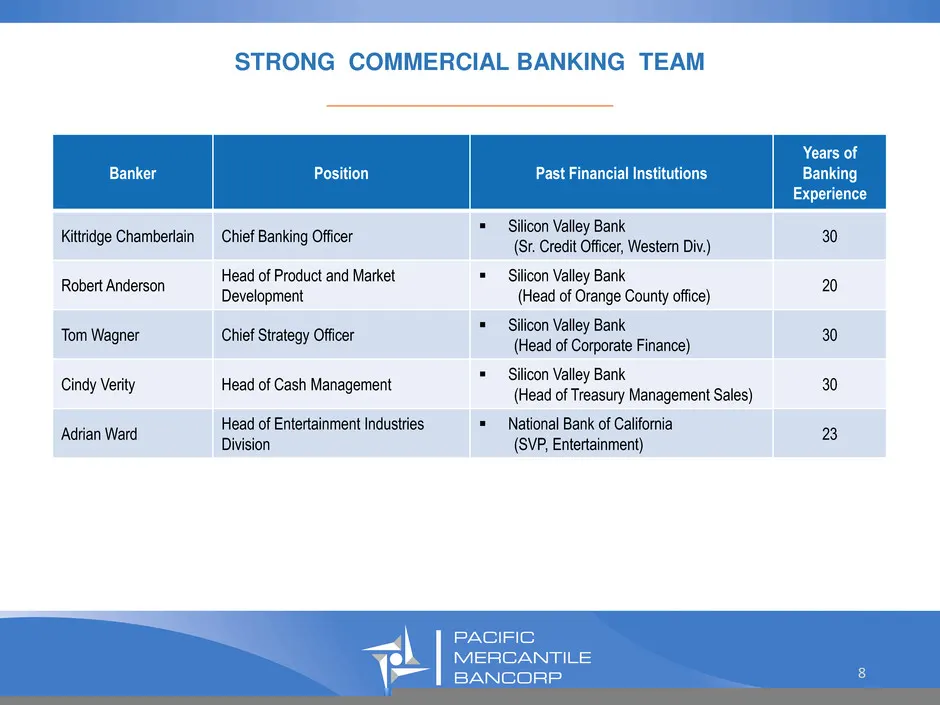
STRONG COMMERCIAL BANKING TEAM _________________________________ Banker Position Past Financial Institutions Years of Banking Experience Kittridge Chamberlain Chief Banking Officer Silicon Valley Bank (Sr. Credit Officer, Western Div.) 30 Robert Anderson Head of Product and Market Development Si
Slide 9: Market Positioning
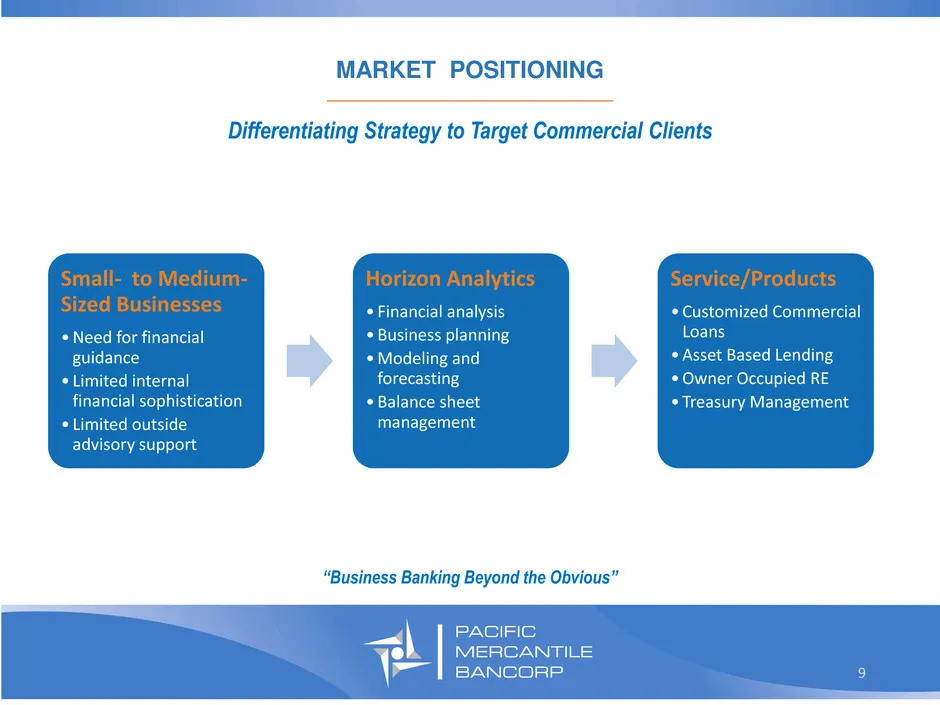
MARKET POSITIONING _________________________________ “Business Banking Beyond the Obvious” Differentiating Strategy to Target Commercial Clients 9 Small- to Medium- Sized Businesses •Need for financial guidance • Limited internal financial sophistication • Limited outside advisory support Horizon An
Slide 10: Balance Sheet Overview: Loans, Deposits, Asset Quality, Capital
BALANCE SHEET OVERVIEW: Loans, Deposits, Asset Quality, Capital 10
Slide 11: Loan Portfolio Focus on Relationship Lending
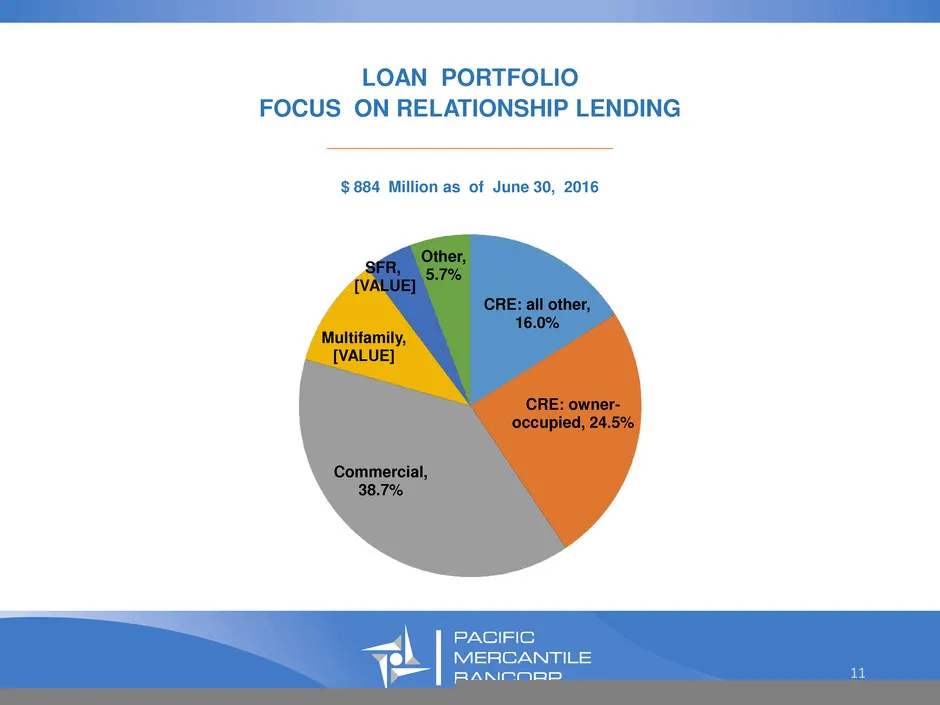
LOAN PORTFOLIO FOCUS ON RELATIONSHIP LENDING _________________________________ CRE: all other, 16.0% CRE: owner- occupied, 24.5% Commercial, 38.7% Multifamily, [VALUE] SFR, [VALUE] Other, 5.7% $ 884 Million as of June 30, 2016 11
Slide 12: Significant Shift to Relationship Loans
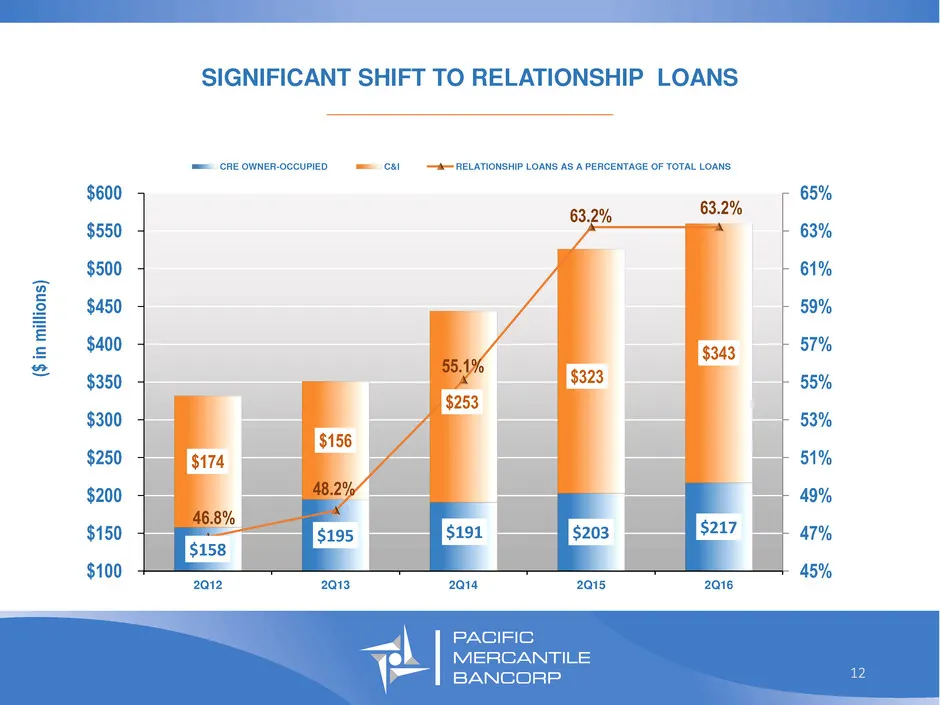
SIGNIFICANT SHIFT TO RELATIONSHIP LOANS _________________________________ $158 $195 $191 $203 $217 $174 $156 $253 $323 $343 46.8% 48.2% 55.1% 63.2% 63.2% 45% 47% 49% 51% 53% 55% 57% 59% 61% 63% 65% $100 $150 $200 $250 $300 $350 $400 $450 $500 $550 $600 2Q12 2Q13 2Q14 2Q15 2Q16 CRE OWNER-OCCUPIED C&I
Slide 13: Commercial Loans Total Commitments and Line Utilization Trends
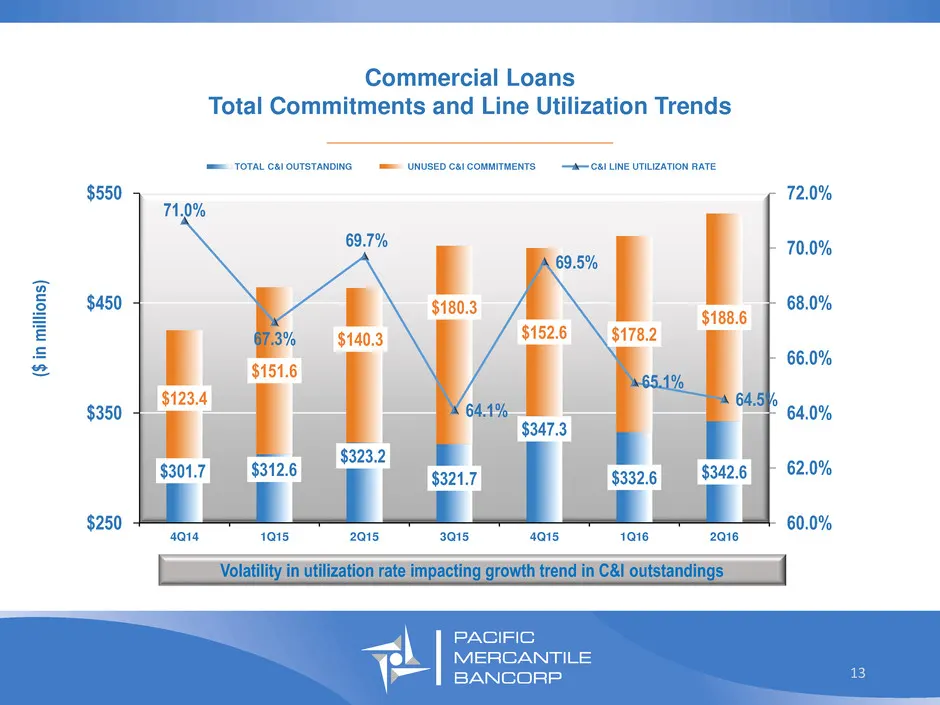
Commercial Loans Total Commitments and Line Utilization Trends _________________________________ $301.7 $312.6 $323.2 $321.7 $347.3 $332.6 $342.6 $123.4 $151.6 $140.3 $180.3 $152.6 $178.2 $188.6 71.0% 67.3% 69.7% 64.1% 69.5% 65.1% 64.5% 60.0% 62.0% 64.0% 66.0% 68.0% 70.0% 72.0% $250 $350 $450 $550 4
Slide 14: Deposit Composition Focused on Core Deposits
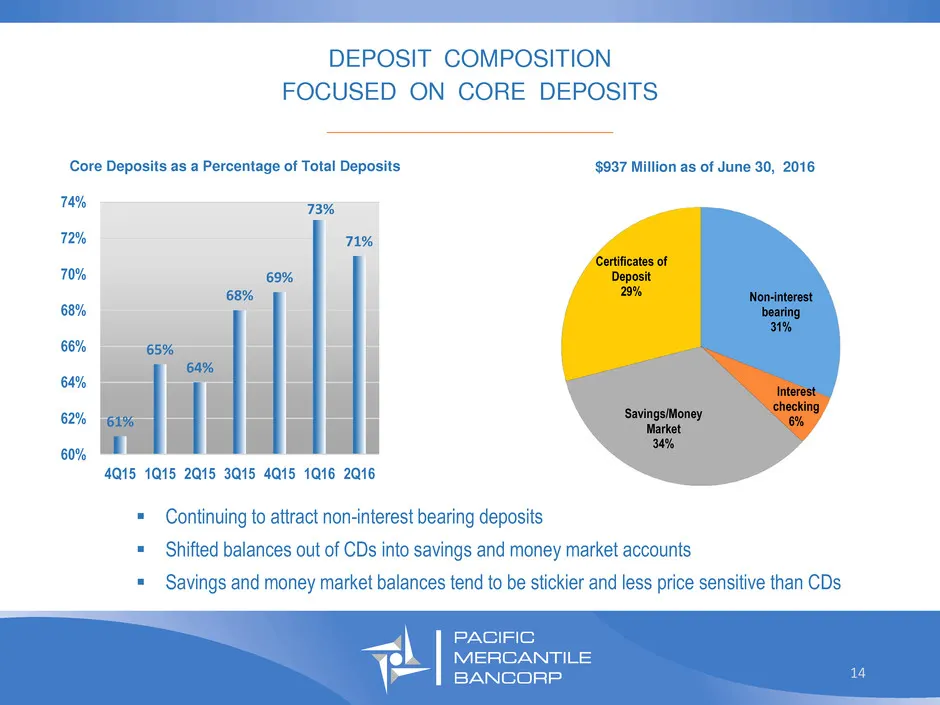
DEPOSIT COMPOSITION FOCUSED ON CORE DEPOSITS _________________________________ $937 Million as of June 30, 2016 Continuing to attract non-interest bearing deposits Shifted balances out of CDs into savings and money market accounts Savings and money market balances tend to be stickier and less
Slide 15: Asset Quality Trends
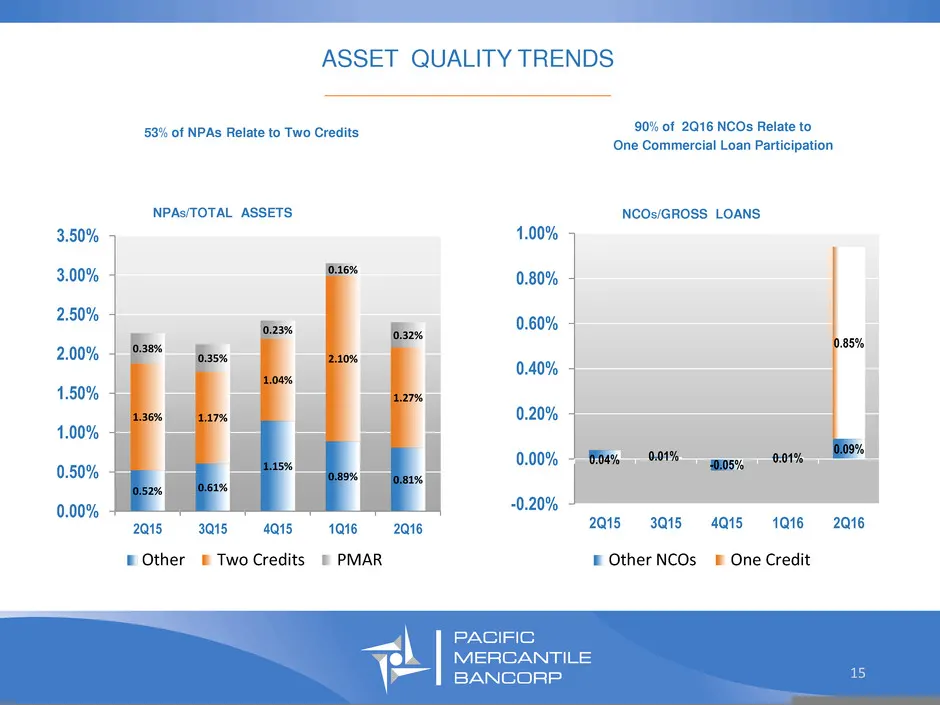
ASSET QUALITY TRENDS _________________________________ 53% of NPAs Relate to Two Credits 0.52% 0.61% 1.15% 0.89% 0.81% 1.36% 1.17% 1.04% 2.10% 1.27% 0.38% 0.35% 0.23% 0.16% 0.32% 0.00% 0.50% 1.00% 1.50% 2.00% 2.50% 3.00% 3.50% 2Q15 3Q15 4Q15 1Q16 2Q16 NPAS/TOTAL ASSETS Other Two Credits PMAR 0.04% 0
Slide 16: Strong Capital Position
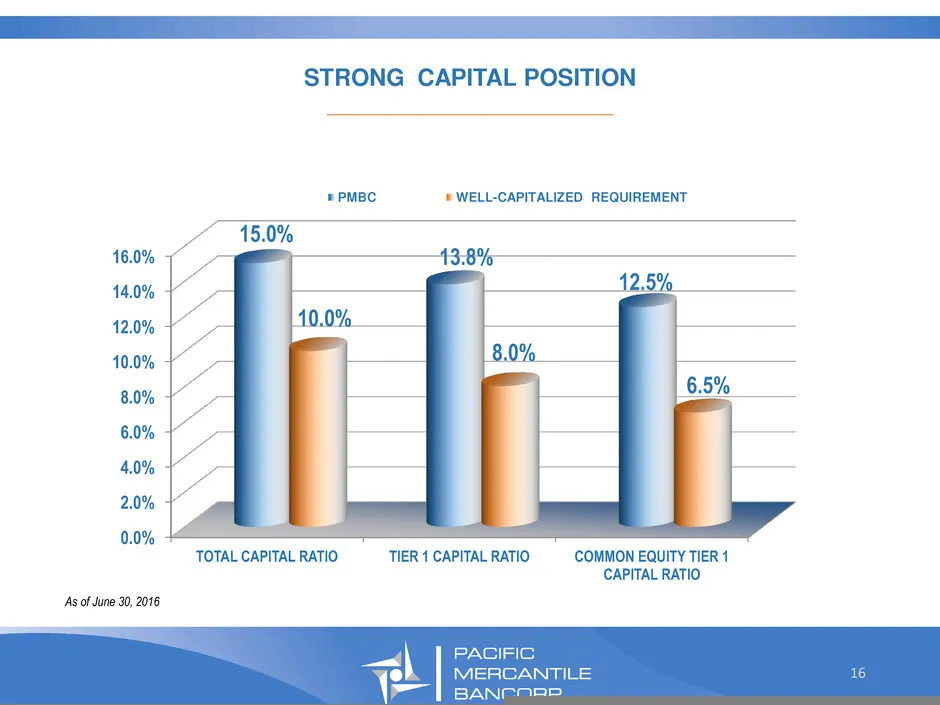
STRONG CAPITAL POSITION _________________________________ 0.0% 2.0% 4.0% 6.0% 8.0% 10.0% 12.0% 14.0% 16.0% TOTAL CAPITAL RATIO TIER 1 CAPITAL RATIO COMMON EQUITY TIER 1 CAPITAL RATIO 15.0% 13.8% 12.5% 10.0% 8.0% 6.5% PMBC WELL-CAPITALIZED REQUIREMENT 16 As of June 30, 2016
Slide 17: Pacific Mercantile Bancorp
\ PACIFIC MERCANTI iP | BANCORP.
Slide 18: Disruption in the California Landscape
DISRUPTION IN THE CALIFORNIA LANDSCAPE _________________________________ RBC acquisition of City National Bank Western Alliance acquisition of Bridge Bank PacWest Bancorp acquisition of Square 1 Bank Key opportunities to add clients and banking teams 18
Slide 19: Outlook
OUTLOOK _________________________________ Double-digit loan growth in 2016 and beyond Continued focus on growing commercial banking relationships Expanded production staff will accelerate growth in core markets Improving sales effectiveness and process throughput Improving net interest margin
Slide 20: Strategic Change to More Effective Delivery Model
Strategic Change to More Effective Delivery Model _________________________________ Transitioning from retail branches to smaller commercial banking offices Cash management products used by commercial client base reduce need for retail style branches Cost savings from transition will be redepl
Slide 21: Investor Relations
I n v e s t o r R e l a t i o n s : C u r t C h r i s t i a n s s e n ( 7 1 4 ) 4 3 8 - 2 5 3 1 C u r t . c h r i s t i a n s s e n @ p m b a n k . c o m 21
Slide 22: Appendix: 2Q16 Financial Statements
APPENDIX 2Q16 Financial Statements 22
Slide 23: 2Q16 Consolidated Statements of Income
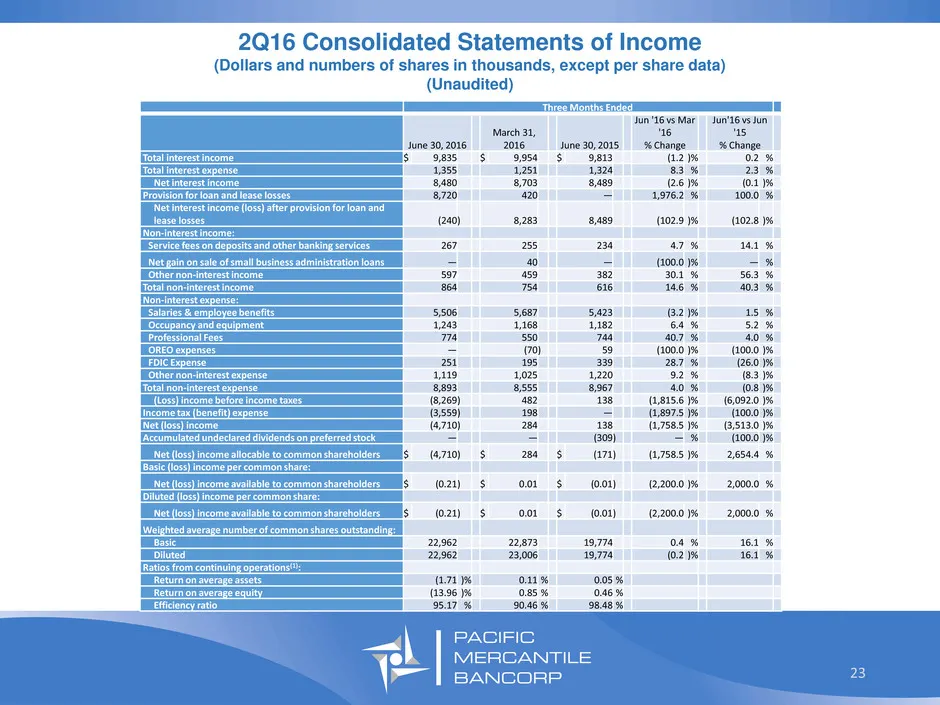
2Q16 Consolidated Statements of Income (Dollars and numbers of shares in thousands, except per share data) (Unaudited) _______________________________ 23 Three Months Ended June 30, 2016 March 31, 2016 June 30, 2015 Jun '16 vs Mar '16 % Change Jun'16 vs Jun '15 % Change Total interest income $ 9,835
Slide 24: 2Q16 Consolidated Statements of Financial Condition
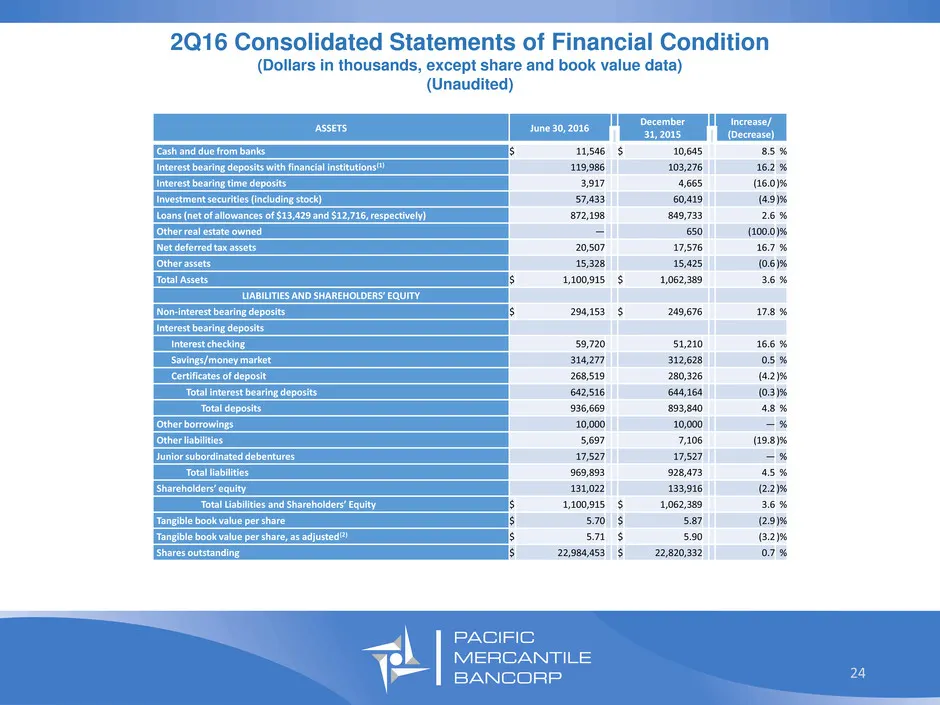
2Q16 Consolidated Statements of Financial Condition (Dollars in thousands, except share and book value data) (Unaudited) _______________________________ 24 ASSETS June 30, 2016 December 31, 2015 Increase/ (Decrease) Cash and due from banks $ 11,546 $ 10,645 8.5 % Interest bearing deposits with finan
Source: SEC EDGAR · 8-K filed Aug 1, 2016
More decks from Pacific Mercantile Bancorp
 Q1 2021 Earnings Presentation18 slides · Apr 26, 2021
 Merger or Acquisition (March 2021)9 slides · Mar 23, 2021
 Q4 2020 Earnings Presentation22 slides · Jan 25, 2021
 Q3 2020 Earnings Presentation23 slides · Nov 2, 2020
 Corporate Update (September 2020)25 slides · Sep 8, 2020
 Corporate Update (August 2020)25 slides · Aug 5, 2020