Lagardere SA · EURONEXT:MMB
Lagardere SA — Lagardère SCA — FY2018 Earnings Presentation
72 slides from Lagardere SA's earnings presentation, Mar 13, 2019
Slide 1: Full-Year 2018 Results
FULL-YEAR 2018 RESULTS 13 MARCH 2019
Slide 2: Disclaimer
Full-year 2018 results / 13 March 2019 DISCLAIMER Certain statements contained in this document are forward-looking statements (including objectives and trends), which address our vision of the financial condition, results of operations, strategy, expected future business and financial performance o
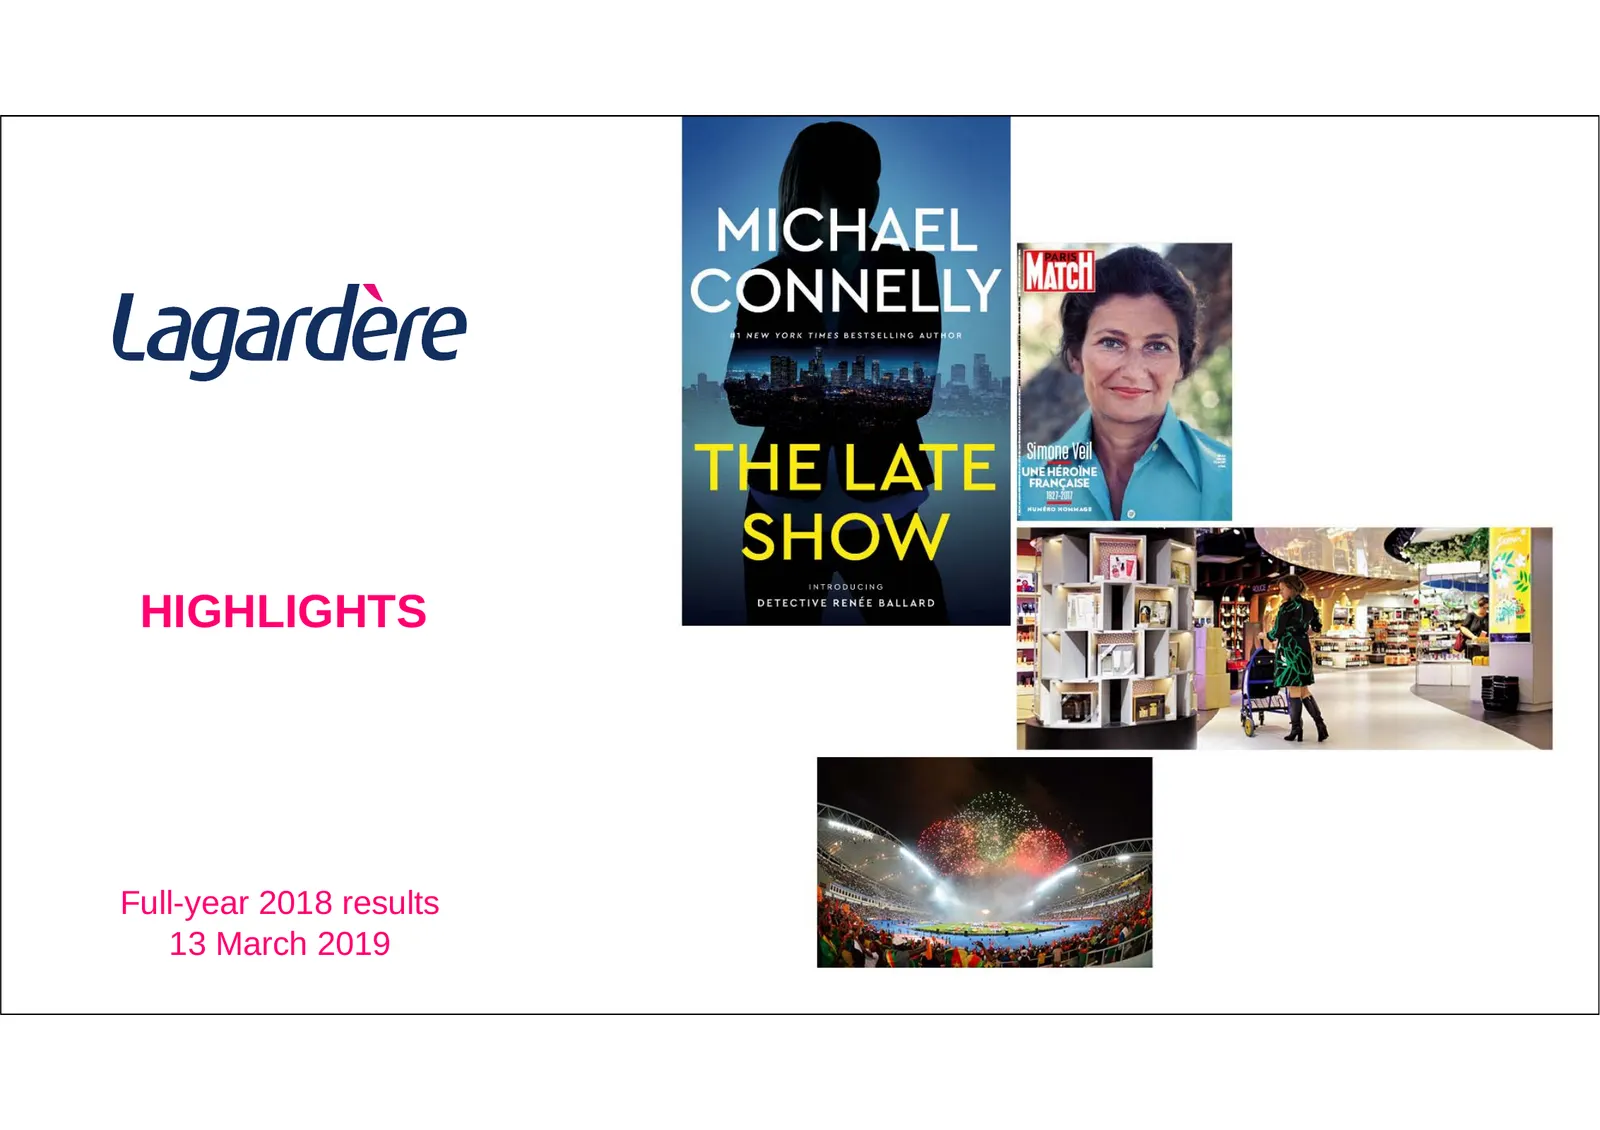
Slide 3: Highlights
HIGHLIGHTS Full-year 2018 results 13 March 2019
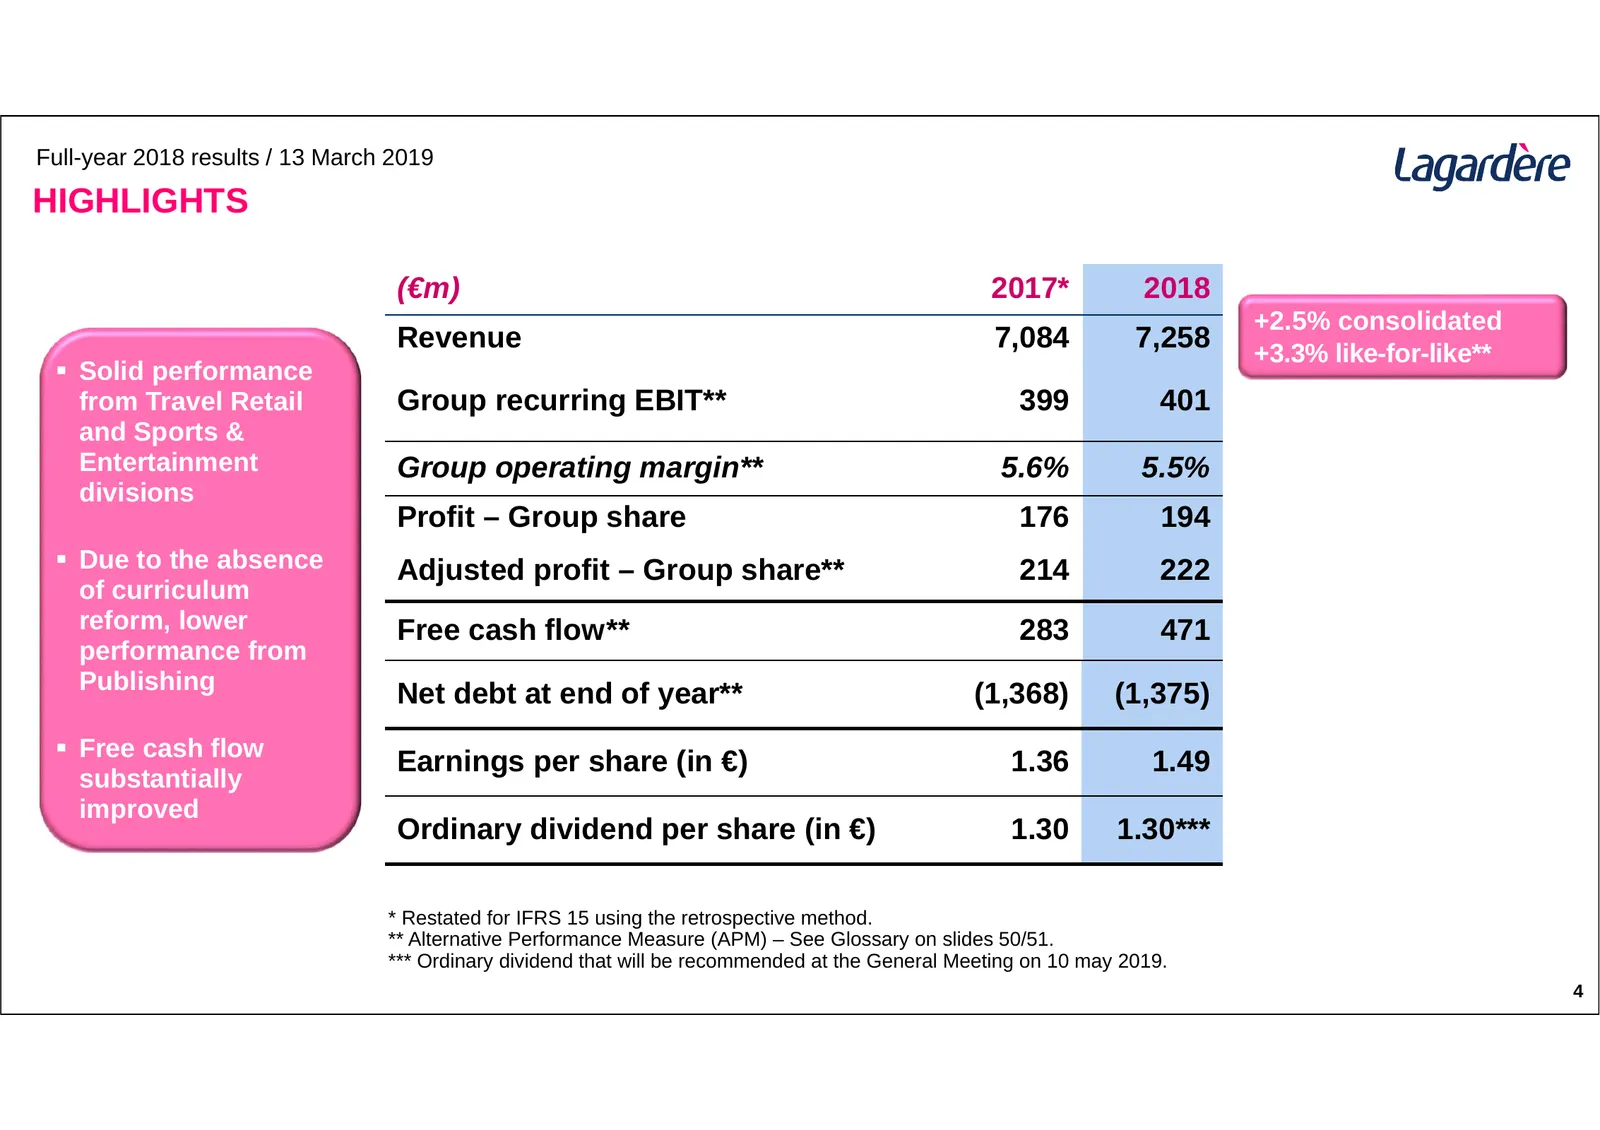
Slide 4: Highlights
Full-year 2018 results / 13 March 2019 HIGHLIGHTS (€m) 2017* 2018 +2.5% consolidated Revenue 7,084 7,258 +3.3% like-for-like** Solid performance from Travel Retail Group recurring EBIT** 399 401 and Sports & Entertainment Group operating margin** 5.6% 5.5% divisions Profit – Group share 176 194
Slide 5: Group Recurring EBIT
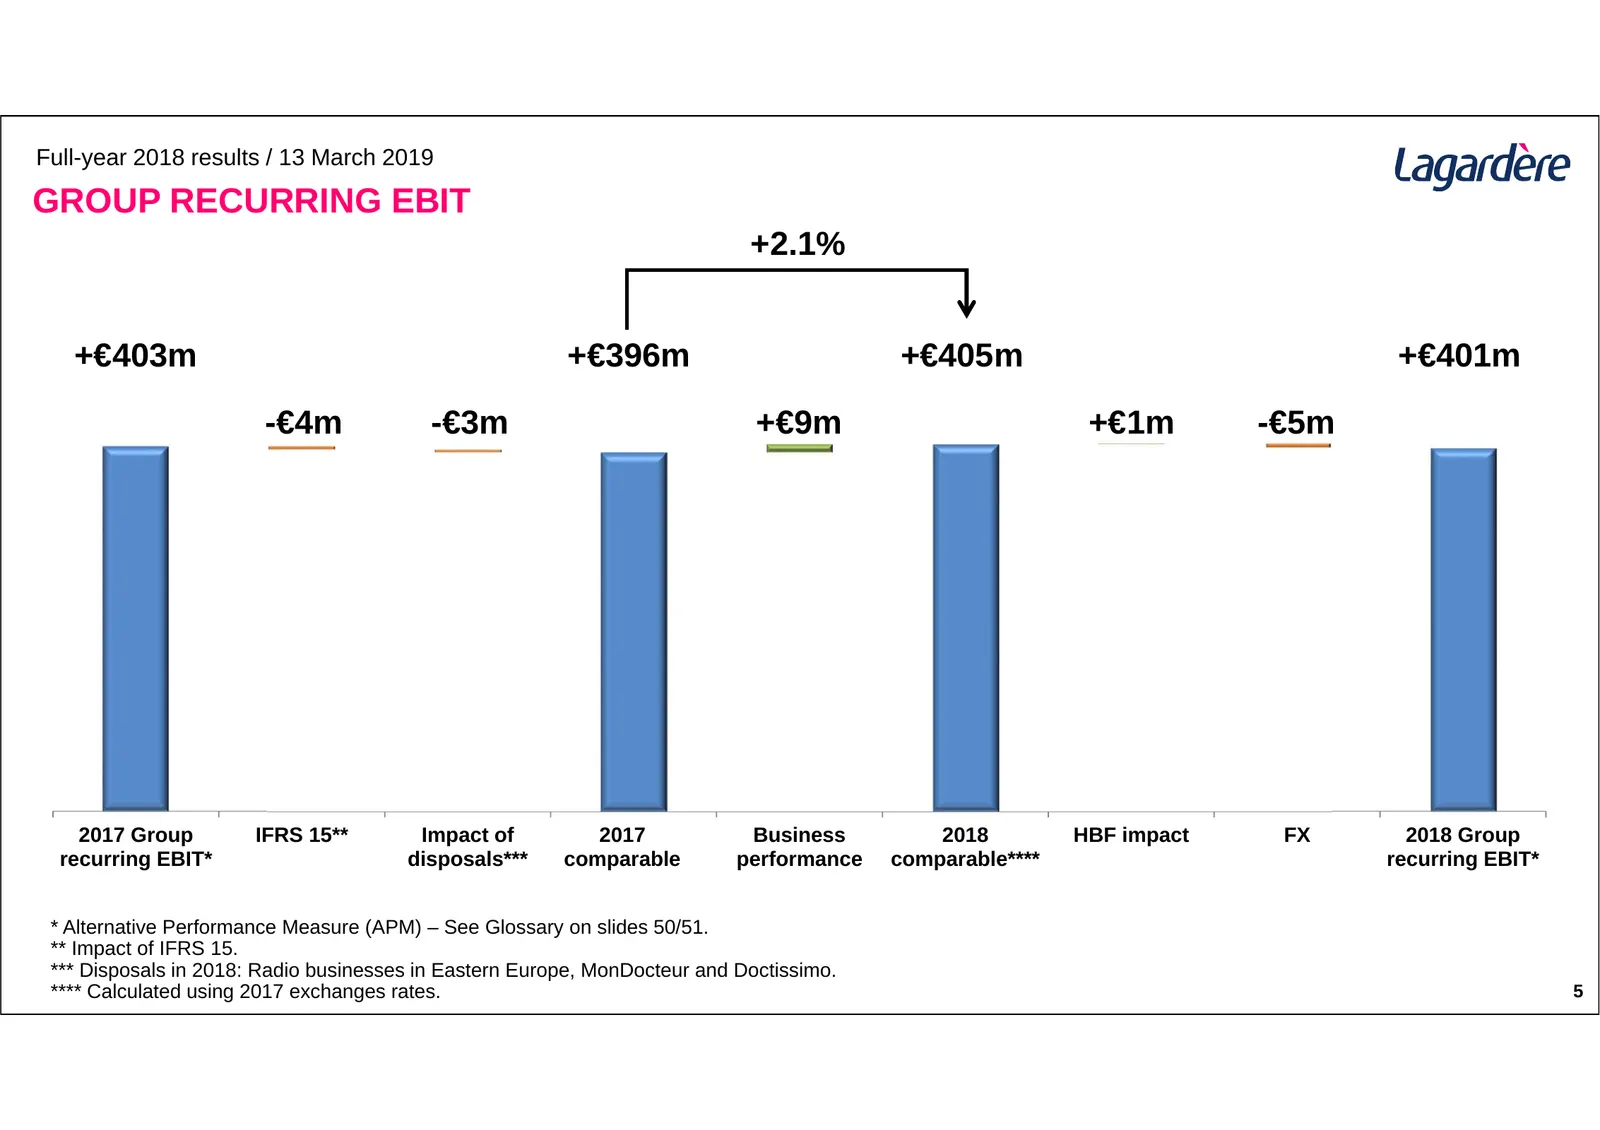
Full-year 2018 results / 13 March 2019 GROUP RECURRING EBIT +2.1% +€403m +€396m +€405m +€401m -€4m -€3m +€9m +€1m -€5m 2017 Group IFRS 15** Impact of 2017 Business 2018 HBF impact FX 2018 Group recurring EBIT* disposals*** comparable performance comparable**** recurring EBIT* * Alternative Performan
Slide 6: Performance by Division
PERFORMANCE BY DIVISION Full-year 2018 results 13 March 2019
Slide 7: Lagardère Publishing: Activity
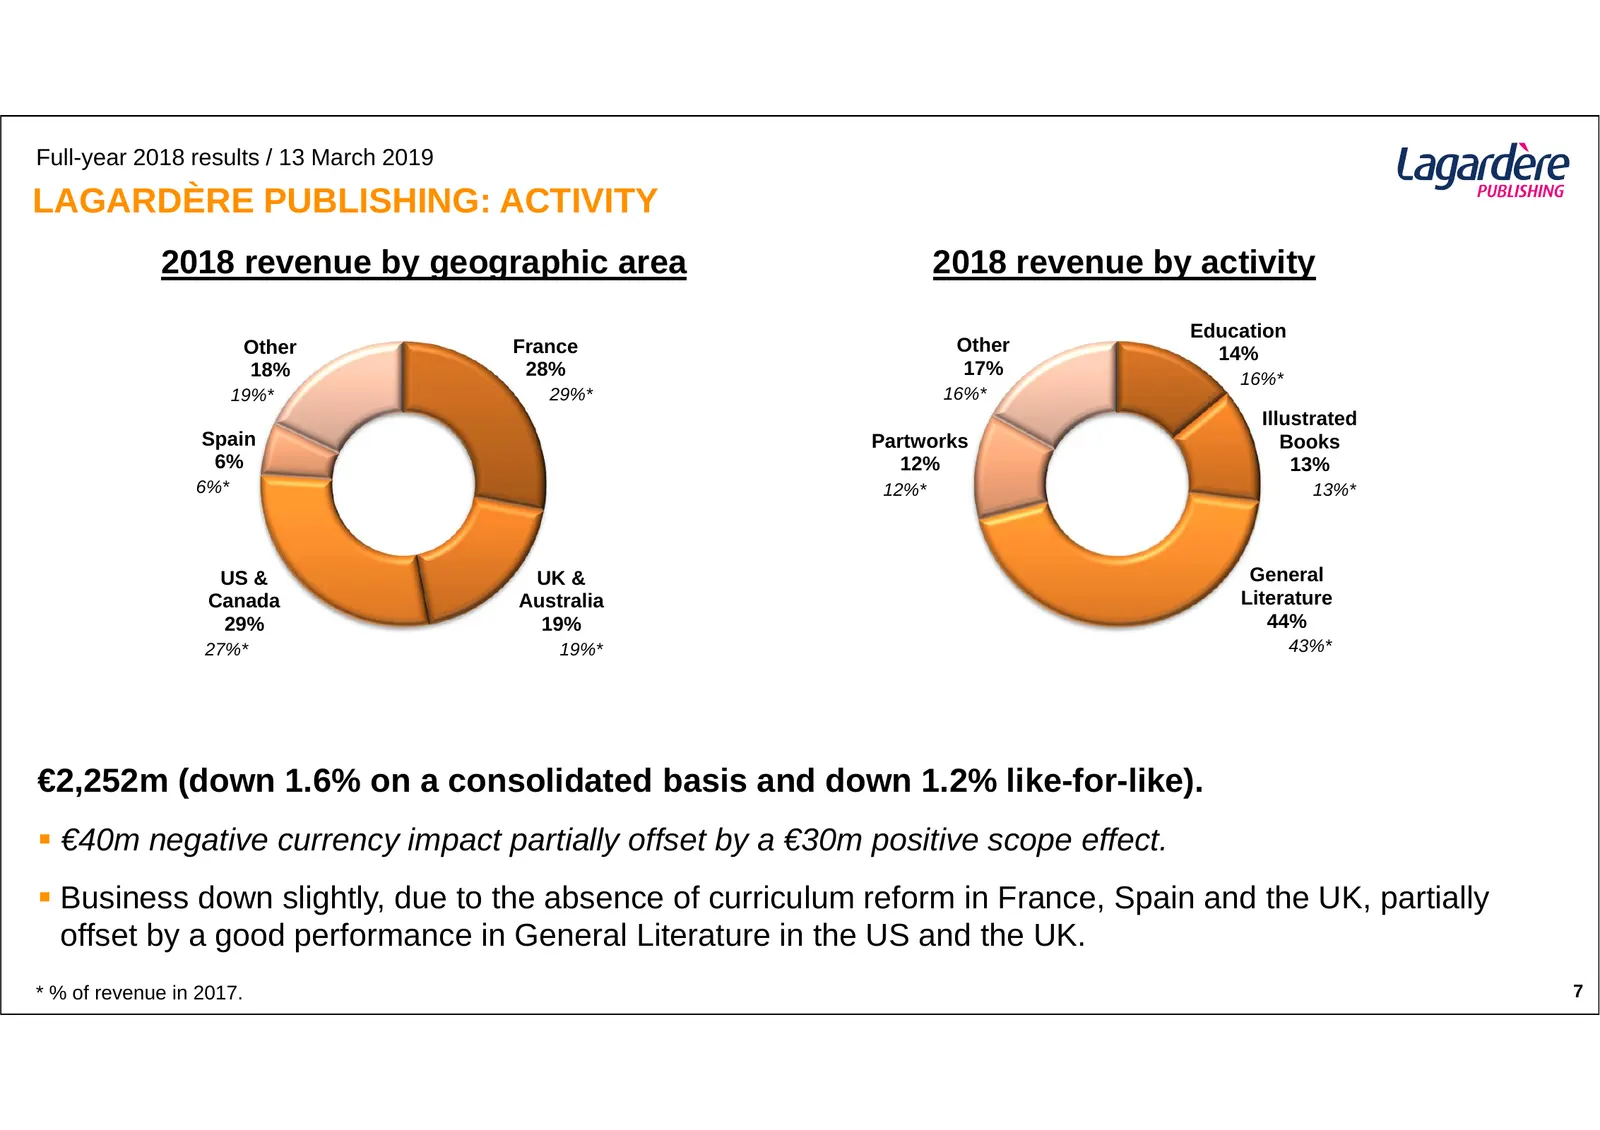
Full-year 2018 results / 13 March 2019 LAGARDÈRE PUBLISHING: ACTIVITY 2018 revenue by geographic area 2018 revenue by activity Education Other France Other 14% 18% 28% 17% 16%* 19%* 29%* 16%* Illustrated Spain Partworks Books 6% 12% 13% 6%* 12%* 13%* US & UK & General Canada Australia Literature 29%
Slide 8: Lagardère Publishing: Profitability
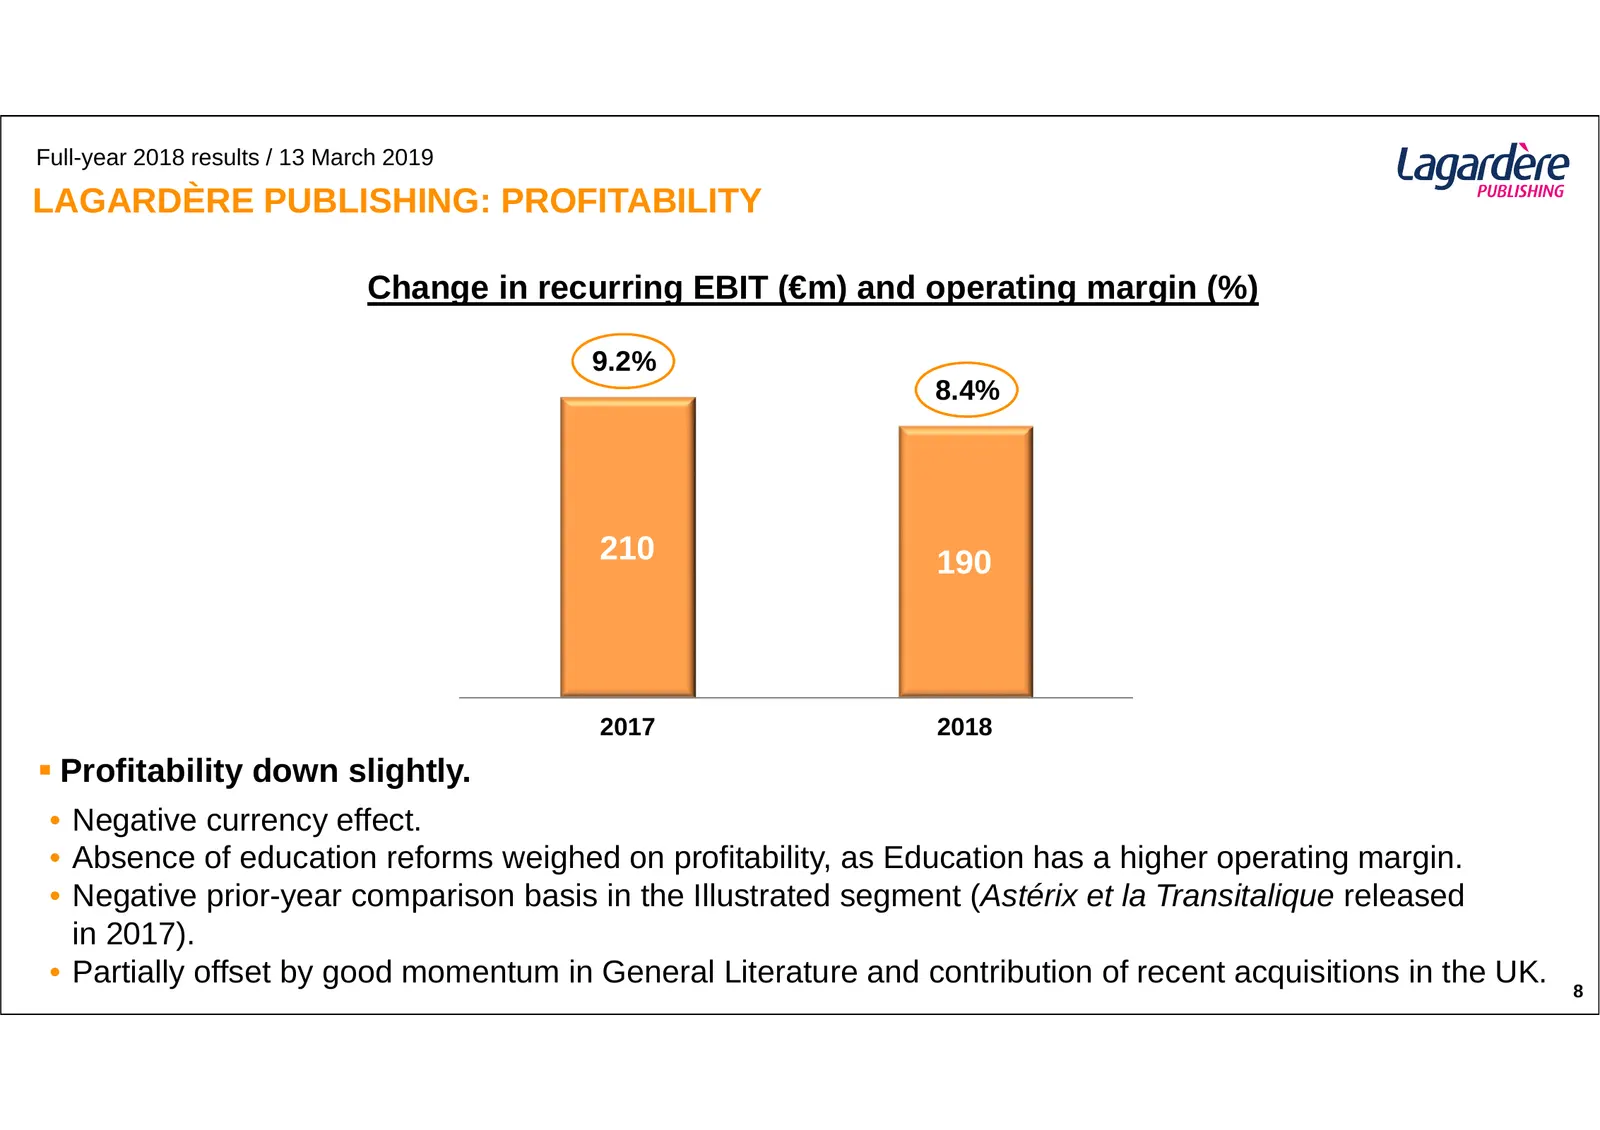
Full-year 2018 results / 13 March 2019 LAGARDÈRE PUBLISHING: PROFITABILITY Change in recurring EBIT (€m) and operating margin (%) 9.2% 8.4% 210 190 2017 2018 Profitability down slightly. • Negative currency effect. • Absence of education reforms weighed on profitability, as Education has a higher
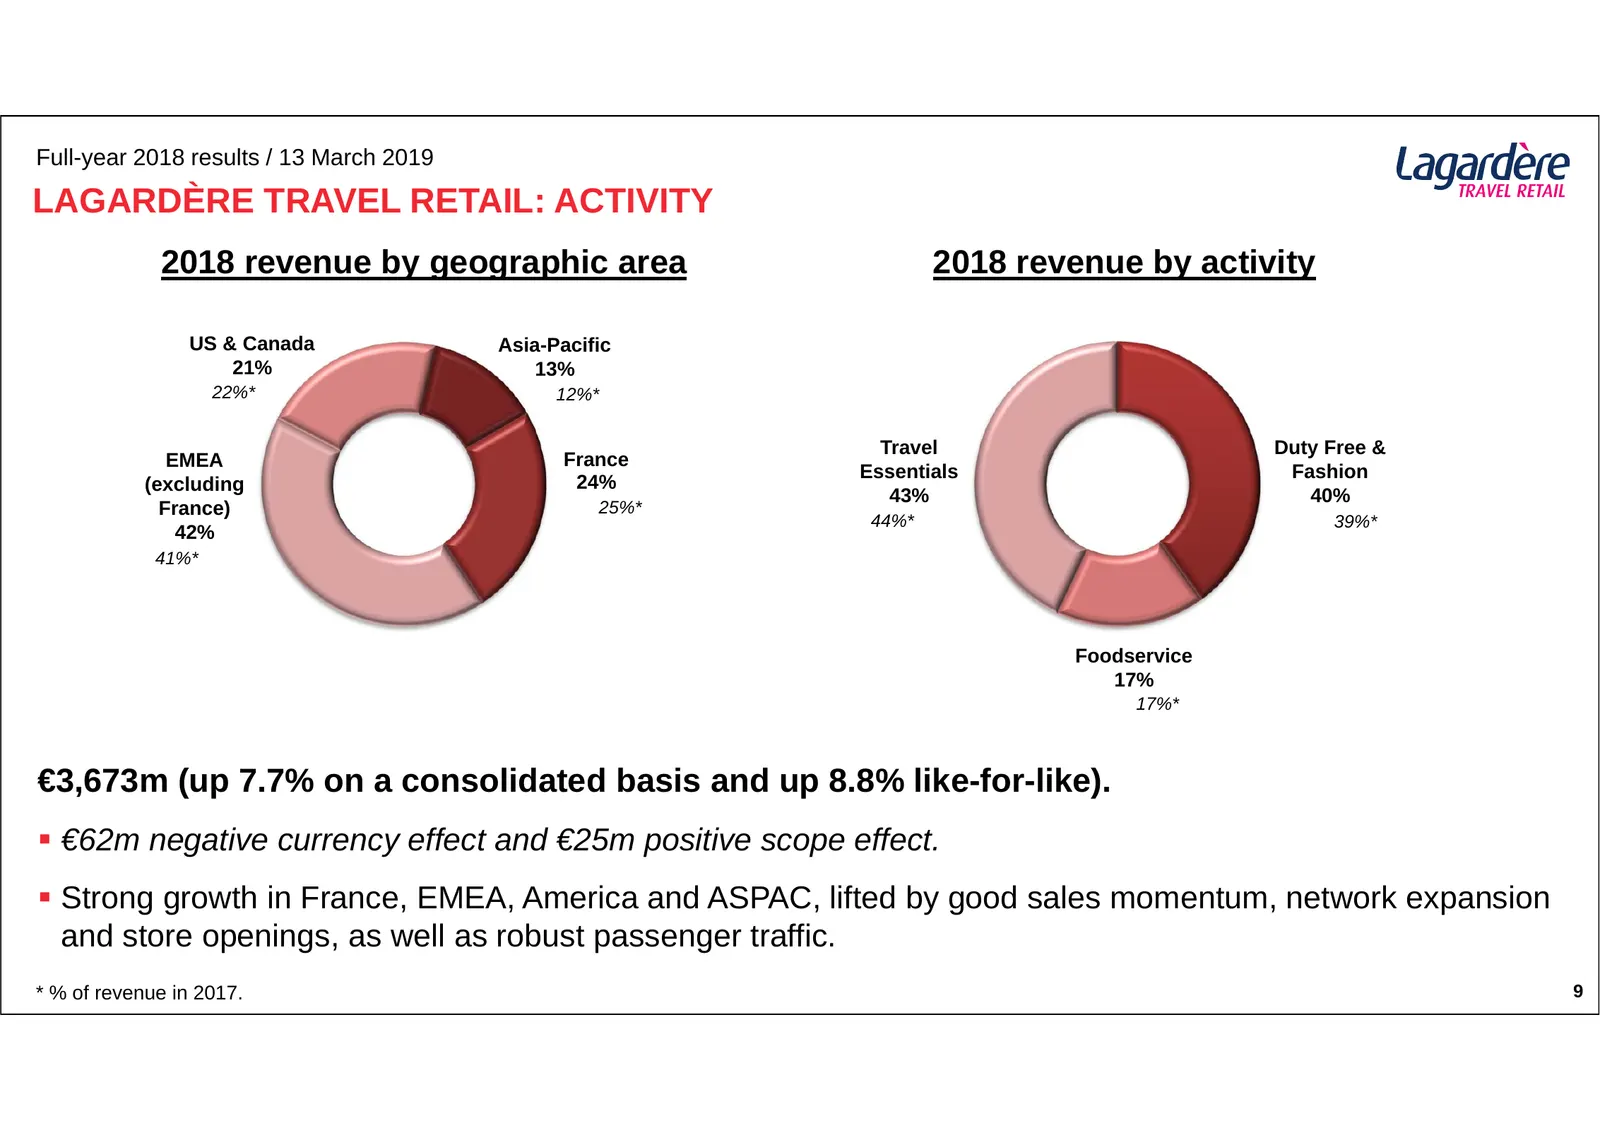
Slide 9: Lagardère Travel Retail: Activity
Full-year 2018 results / 13 March 2019 LAGARDÈRE TRAVEL RETAIL: ACTIVITY 2018 revenue by geographic area 2018 revenue by activity US & Canada Asia-Pacific 21% 13% 22%* 12%* Travel Duty Free & EMEA France Essentials Fashion (excluding 24% 43% 40% France) 25%* 44%* 39%* 42% 41%* Foodservice 17% 17%* €
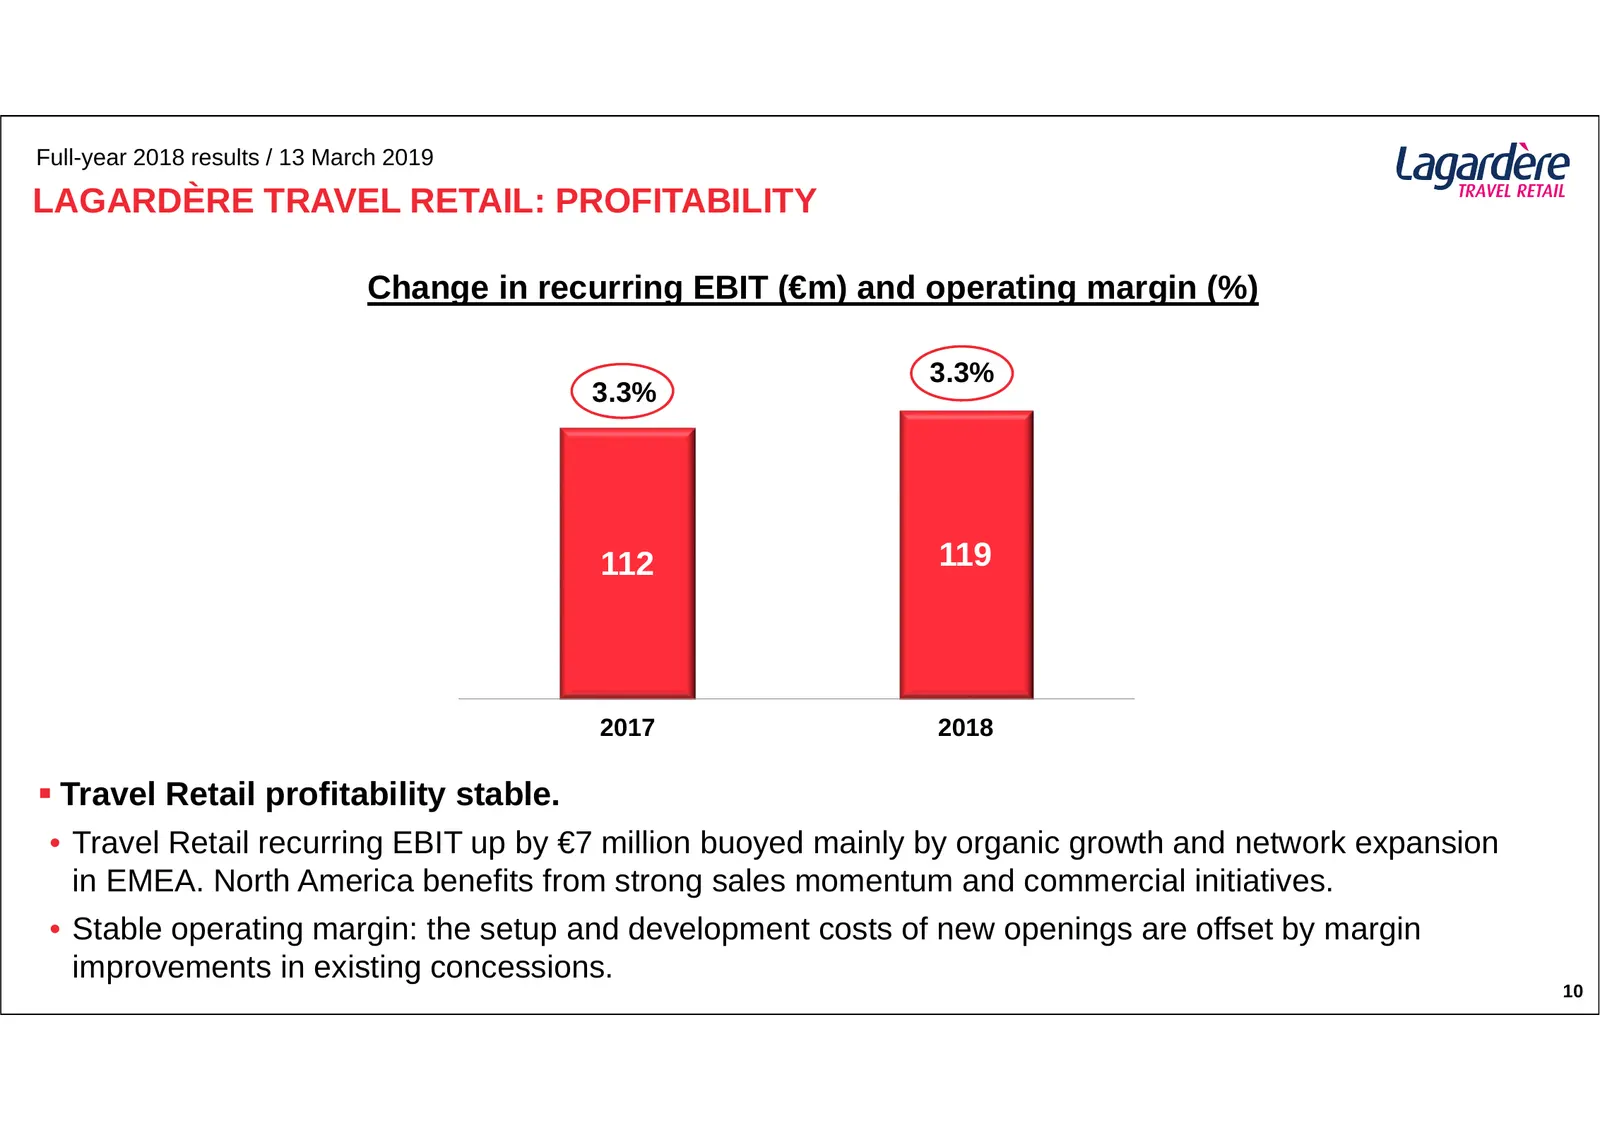
Slide 10: Lagardère Travel Retail: Profitability
Full-year 2018 results / 13 March 2019 LAGARDÈRE TRAVEL RETAIL: PROFITABILITY Change in recurring EBIT (€m) and operating margin (%) 3.3% 3.3% 112 119 2017 2018 Travel Retail profitability stable. • Travel Retail recurring EBIT up by €7 million buoyed mainly by organic growth and network expansion
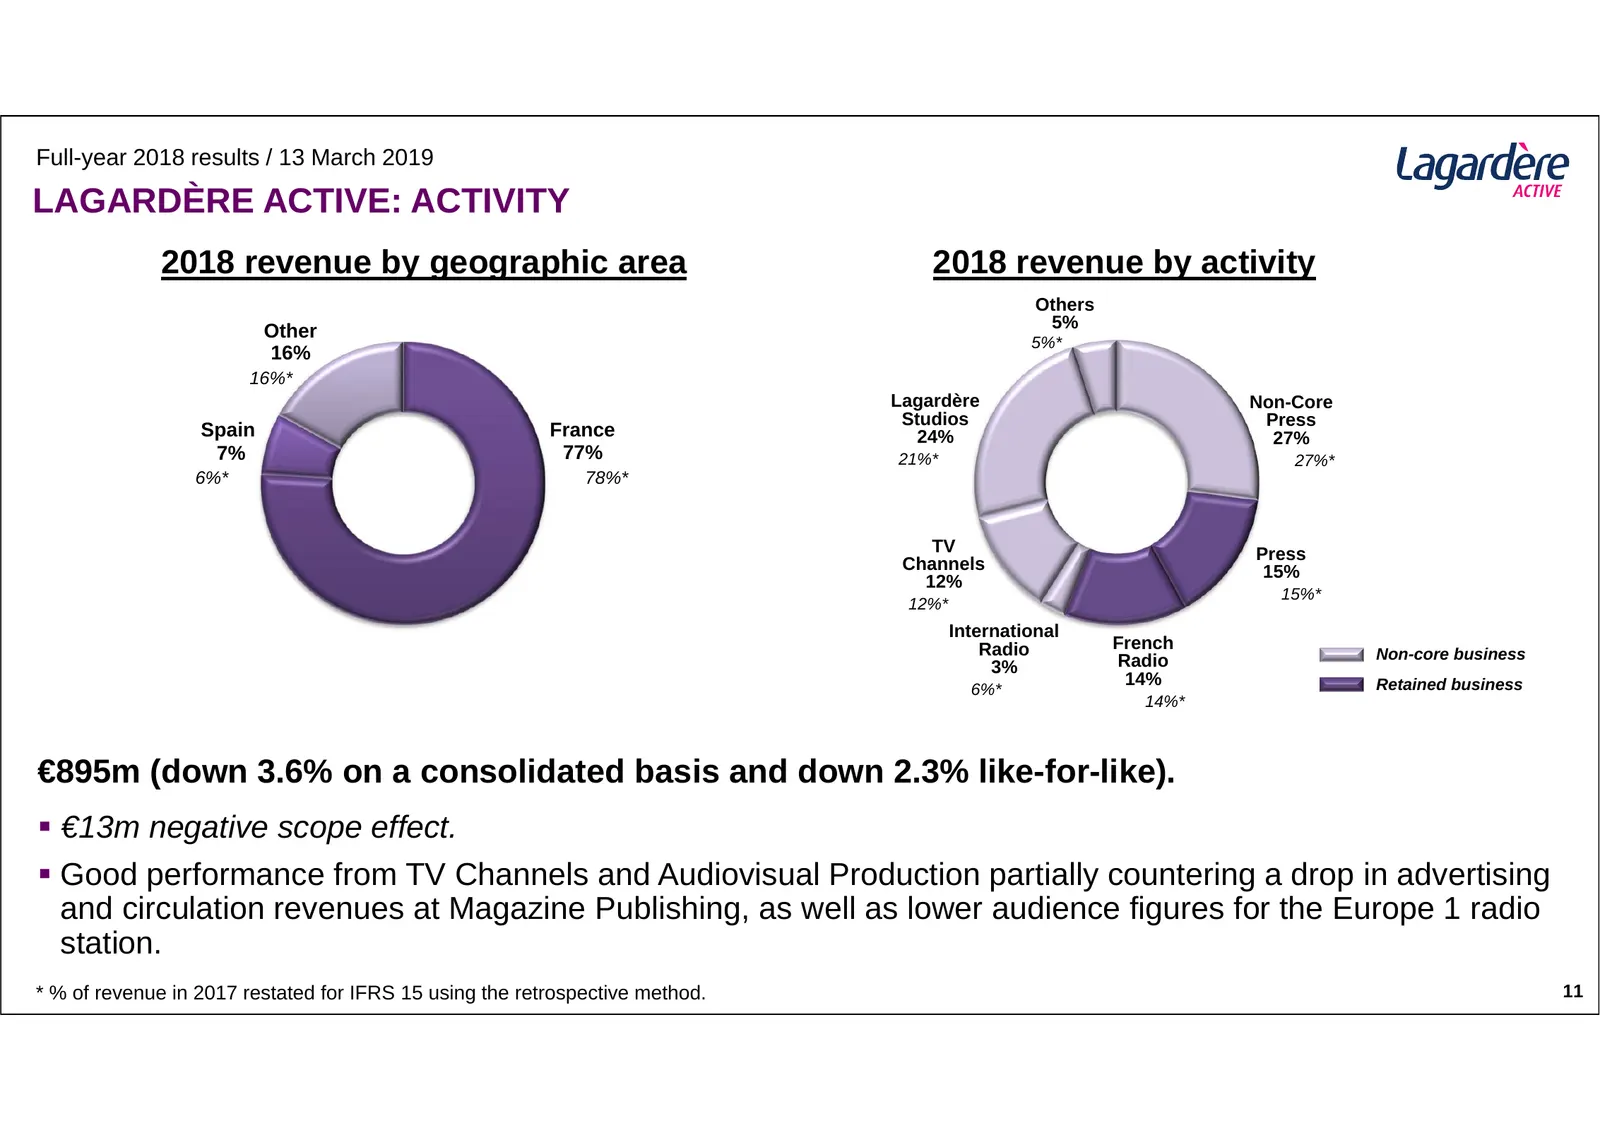
Slide 11: Lagardère Active: Activity
Full-year 2018 results / 13 March 2019 LAGARDÈRE ACTIVE: ACTIVITY 2018 revenue by geographic area 2018 revenue by activity Others Other 5% 5%* 16% 16%* Lagardère Non-Core Studios Press Spain France 24% 27% 7% 77% 21%* 27%* 6%* 78%* TV Press Channels 15% 12% 15%* 12%* International Radio French Radio
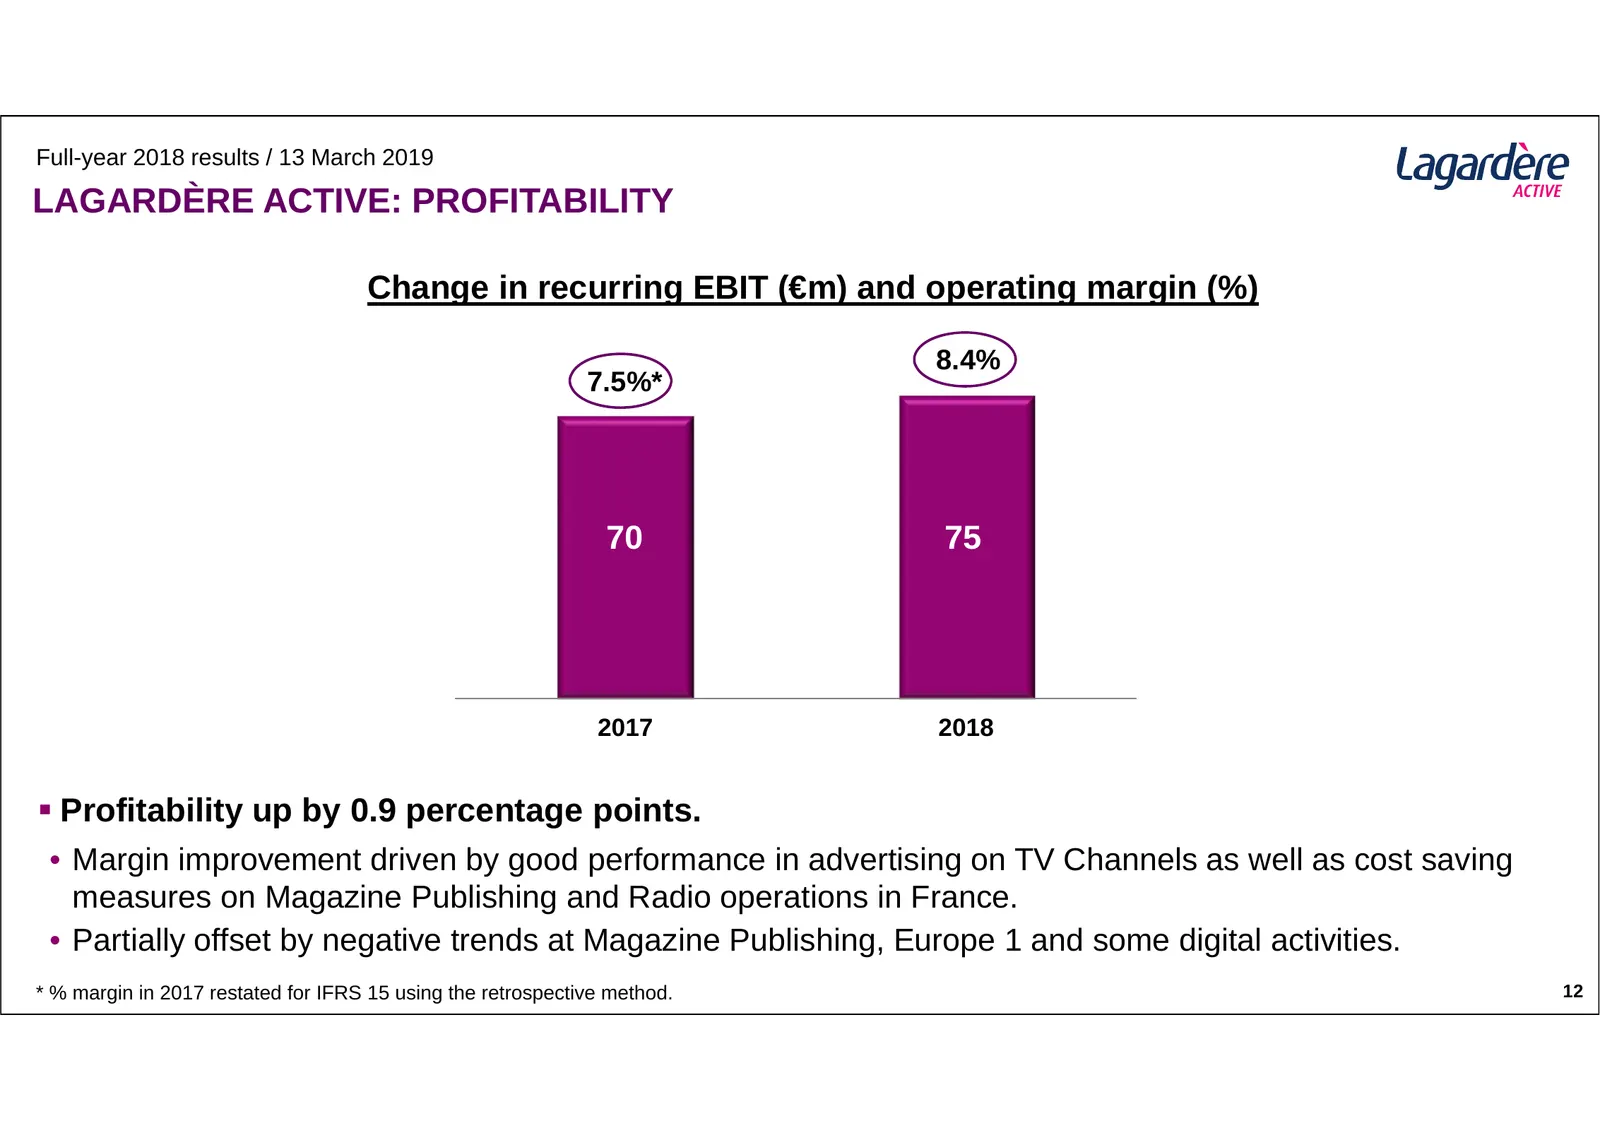
Slide 12: Lagardère Active: Profitability
Full-year 2018 results / 13 March 2019 LAGARDÈRE ACTIVE: PROFITABILITY Change in recurring EBIT (€m) and operating margin (%) 8.4% 7.5%* 70 75 2017 2018 Profitability up by 0.9 percentage points. • Margin improvement driven by good performance in advertising on TV Channels as well as cost saving m
Slide 13: Lagardère Sports and Entertainment: Activity
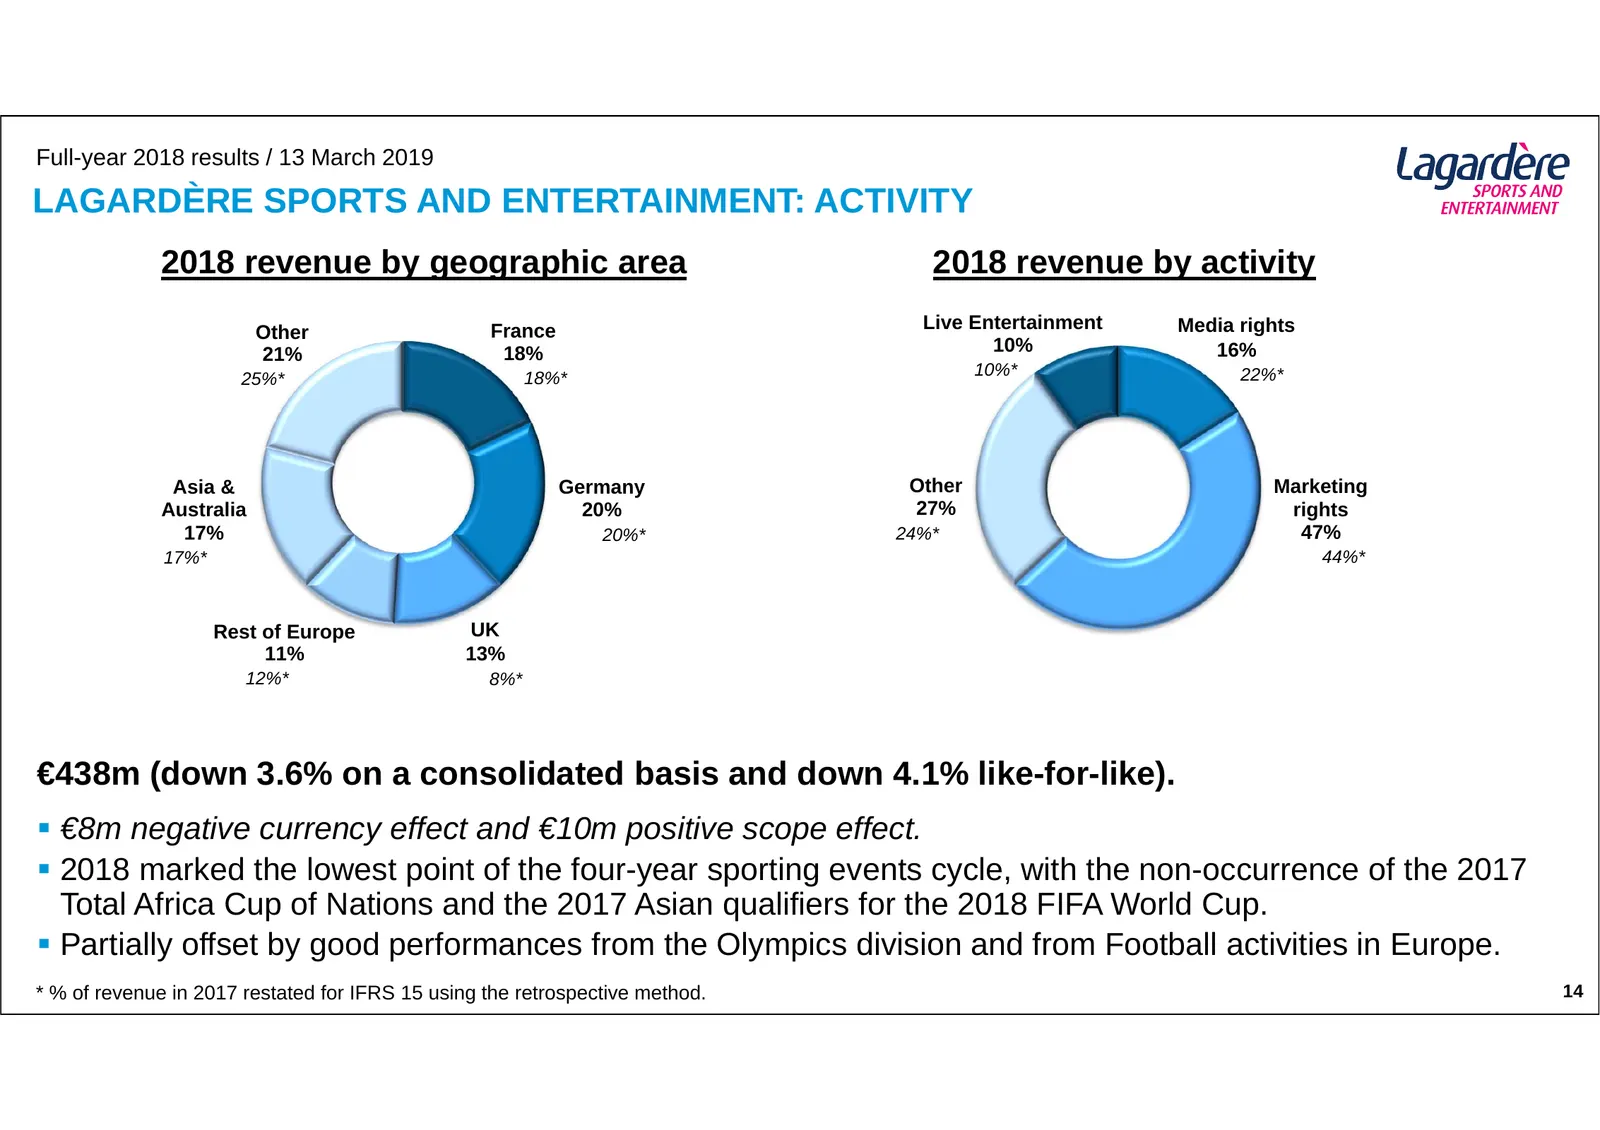
Full-year 2018 results / 13 March 2019 LAGARDÈRE SPORTS AND ENTERTAINMENT: ACTIVITY 2018 revenue by geographic area 2018 revenue by activity France Live Entertainment Media rights Other 21% 18% 10% 16% 25%* 18%* 10%* 22%* Asia & Germany Other Marketing Australia 20% 27% rights 17% 20%* 24%* 47% 17%*
Slide 14: Lagardère Sports and Entertainment: Profitability
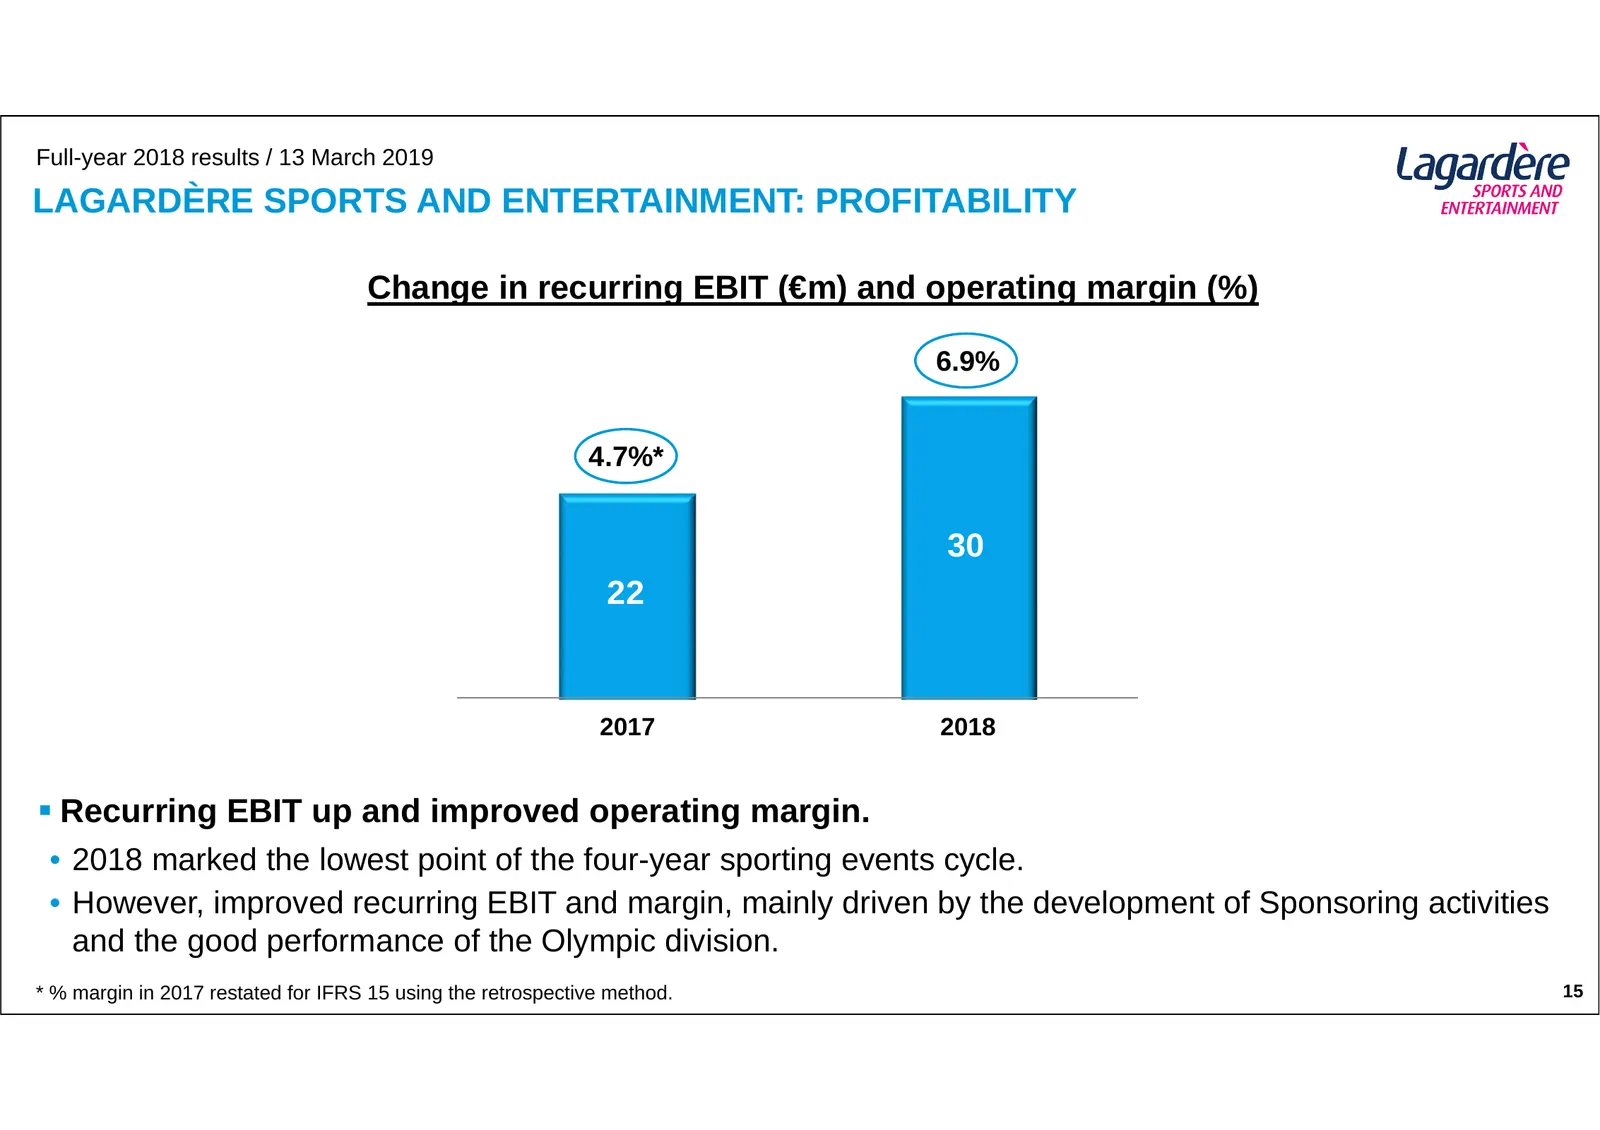
Full-year 2018 results / 13 March 2019 LAGARDÈRE SPORTS AND ENTERTAINMENT: PROFITABILITY Change in recurring EBIT (€m) and operating margin (%) 6.9% 4.7%* 30 22 2017 2018 Recurring EBIT up and improved operating margin. • 2018 marked the lowest point of the four-year sporting events cycle. • Howev

Slide 15: Group Results
GROUP RESULTS Full-year 2018 results 13 March 2019
Slide 16: Changes in Revenue – 2018
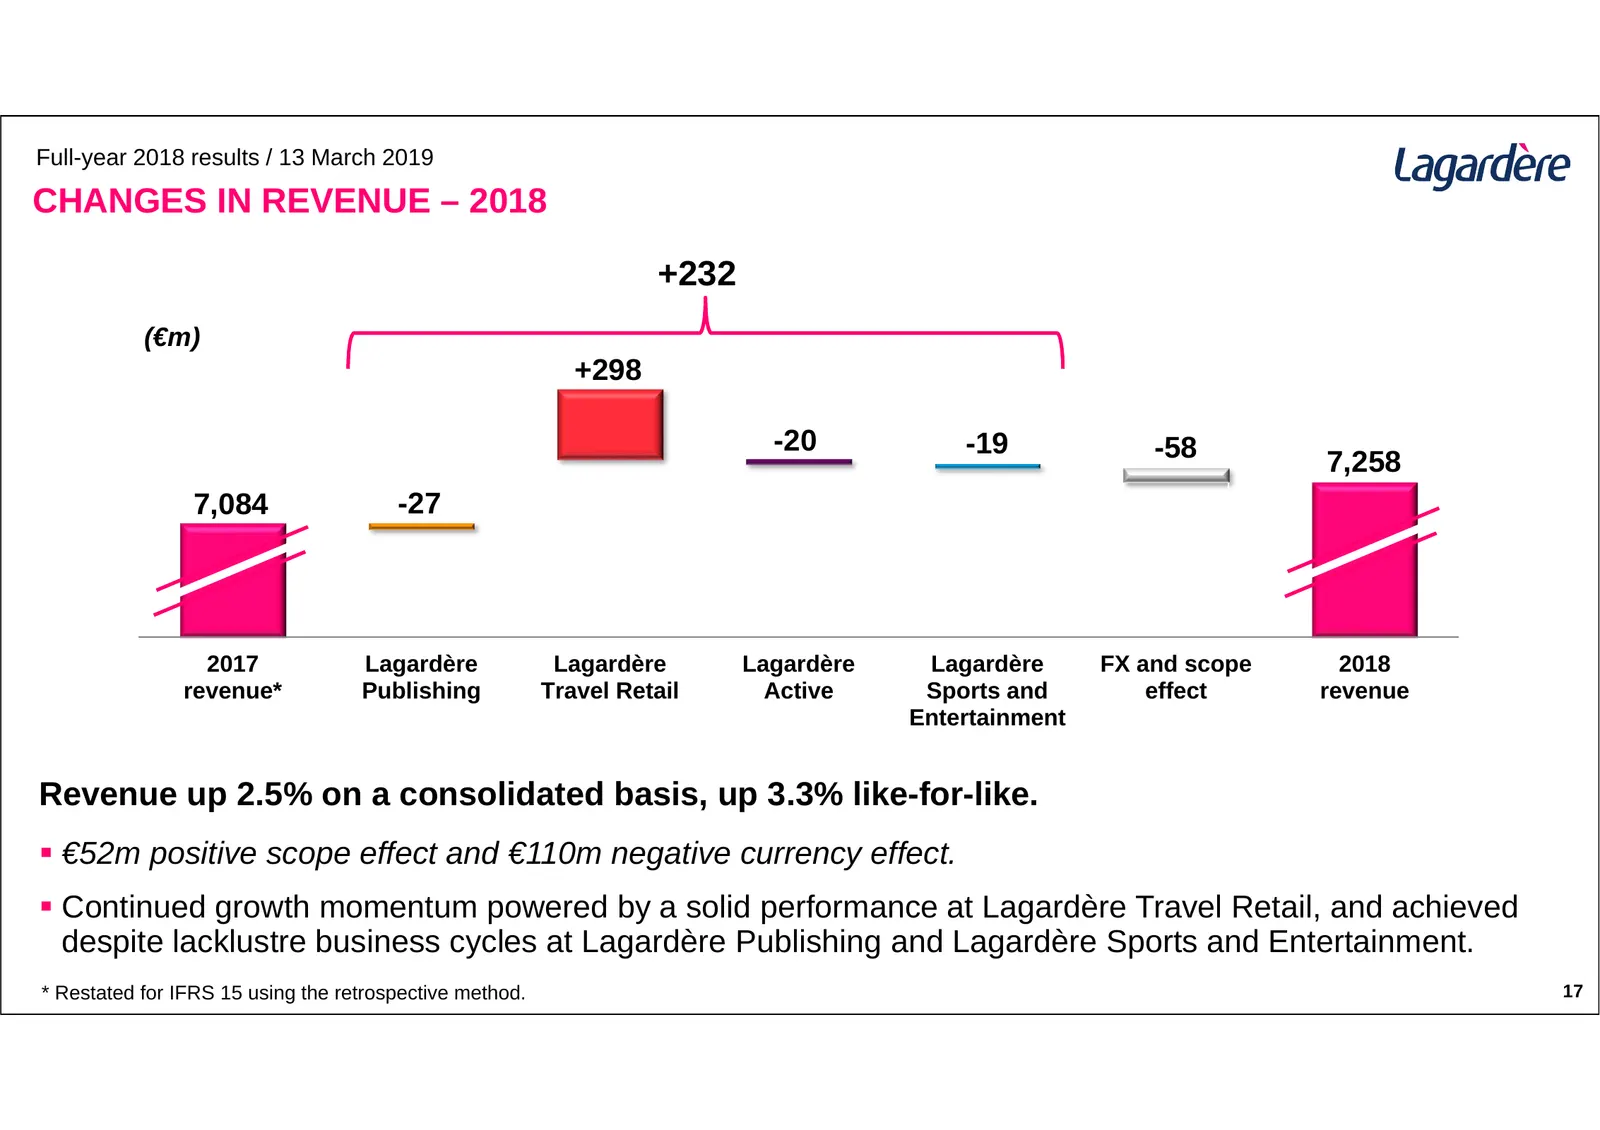
Full-year 2018 results / 13 March 2019 CHANGES IN REVENUE – 2018 +232 (€m) +298 -20 -19 -58 7,258 7,084 -27 2017 Lagardère Lagardère Lagardère Lagardère FX and scope 2018 revenue* Publishing Travel Retail Active Sports and effect revenue Entertainment Revenue up 2.5% on a consolidated basis, up 3.3%
Slide 17: Group Recurring EBIT to EBIT
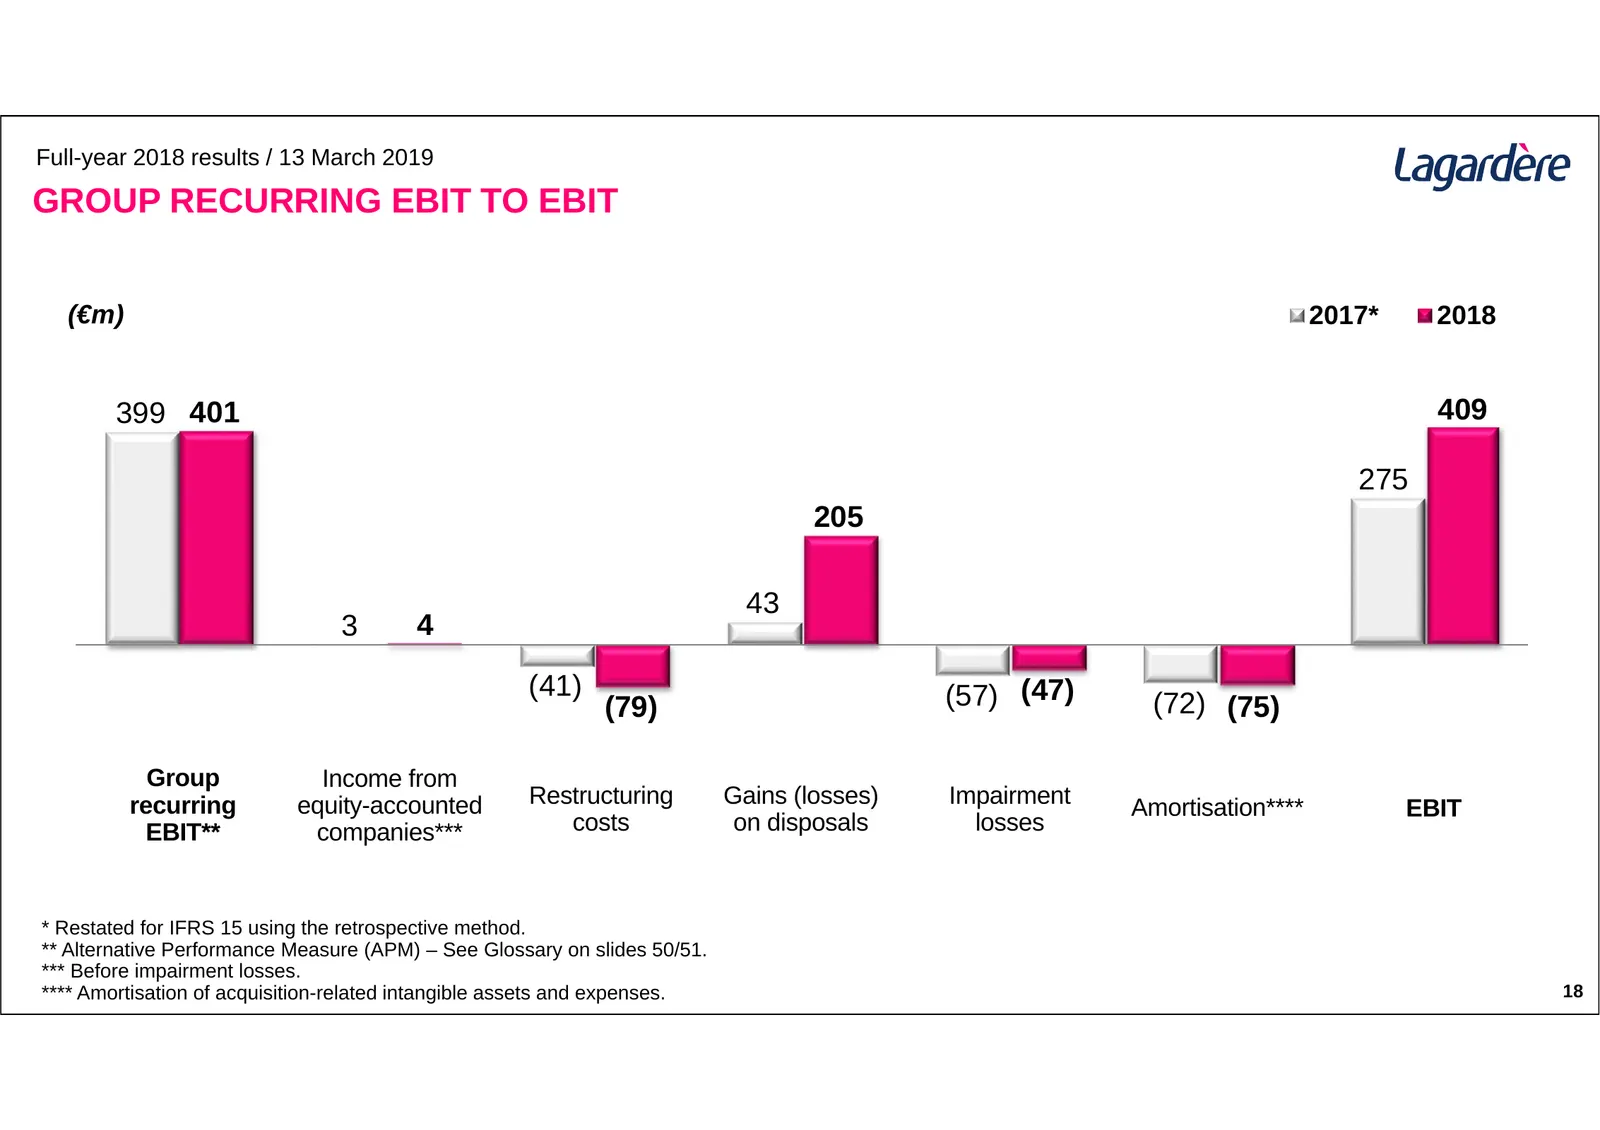
Full-year 2018 results / 13 March 2019 GROUP RECURRING EBIT TO EBIT (€m) 2017* 2018 399 401 409 275 205 43 3 4 (41) (57) (47) (79) (72) (75) Group Income from recurring equity-accounted Restructuring Gains (losses) Impairment Amortisation**** EBIT EBIT** companies*** costs on disposals losses * Rest
Slide 18: EBIT to Profit – Group Share
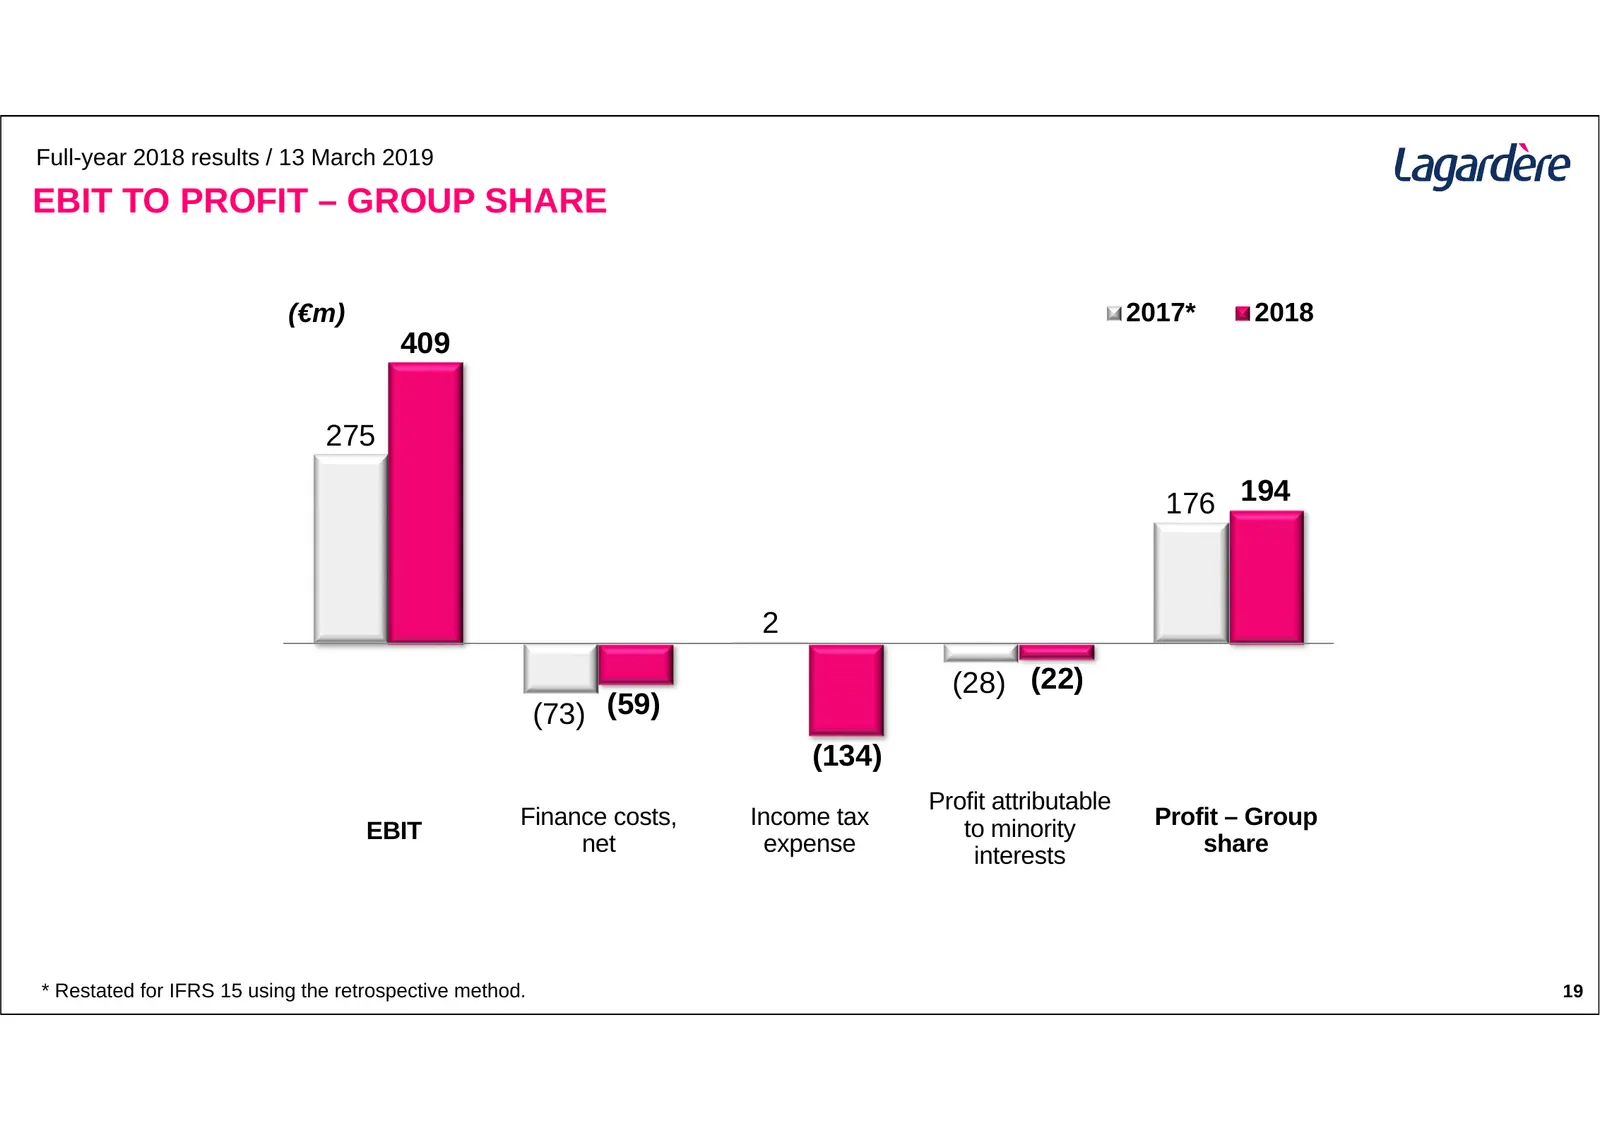
Full-year 2018 results / 13 March 2019 EBIT TO PROFIT – GROUP SHARE (€m) 2017* 2018 409 275 176 194 2 (28) (22) (73) (59) (134) Profit attributable Finance costs, Income tax to minority Profit – Group EBIT net expense interests share * Restated for IFRS 15 using the retrospective method. 19
Slide 19: Group Recurring EBIT to Adjusted Profit – Group Share
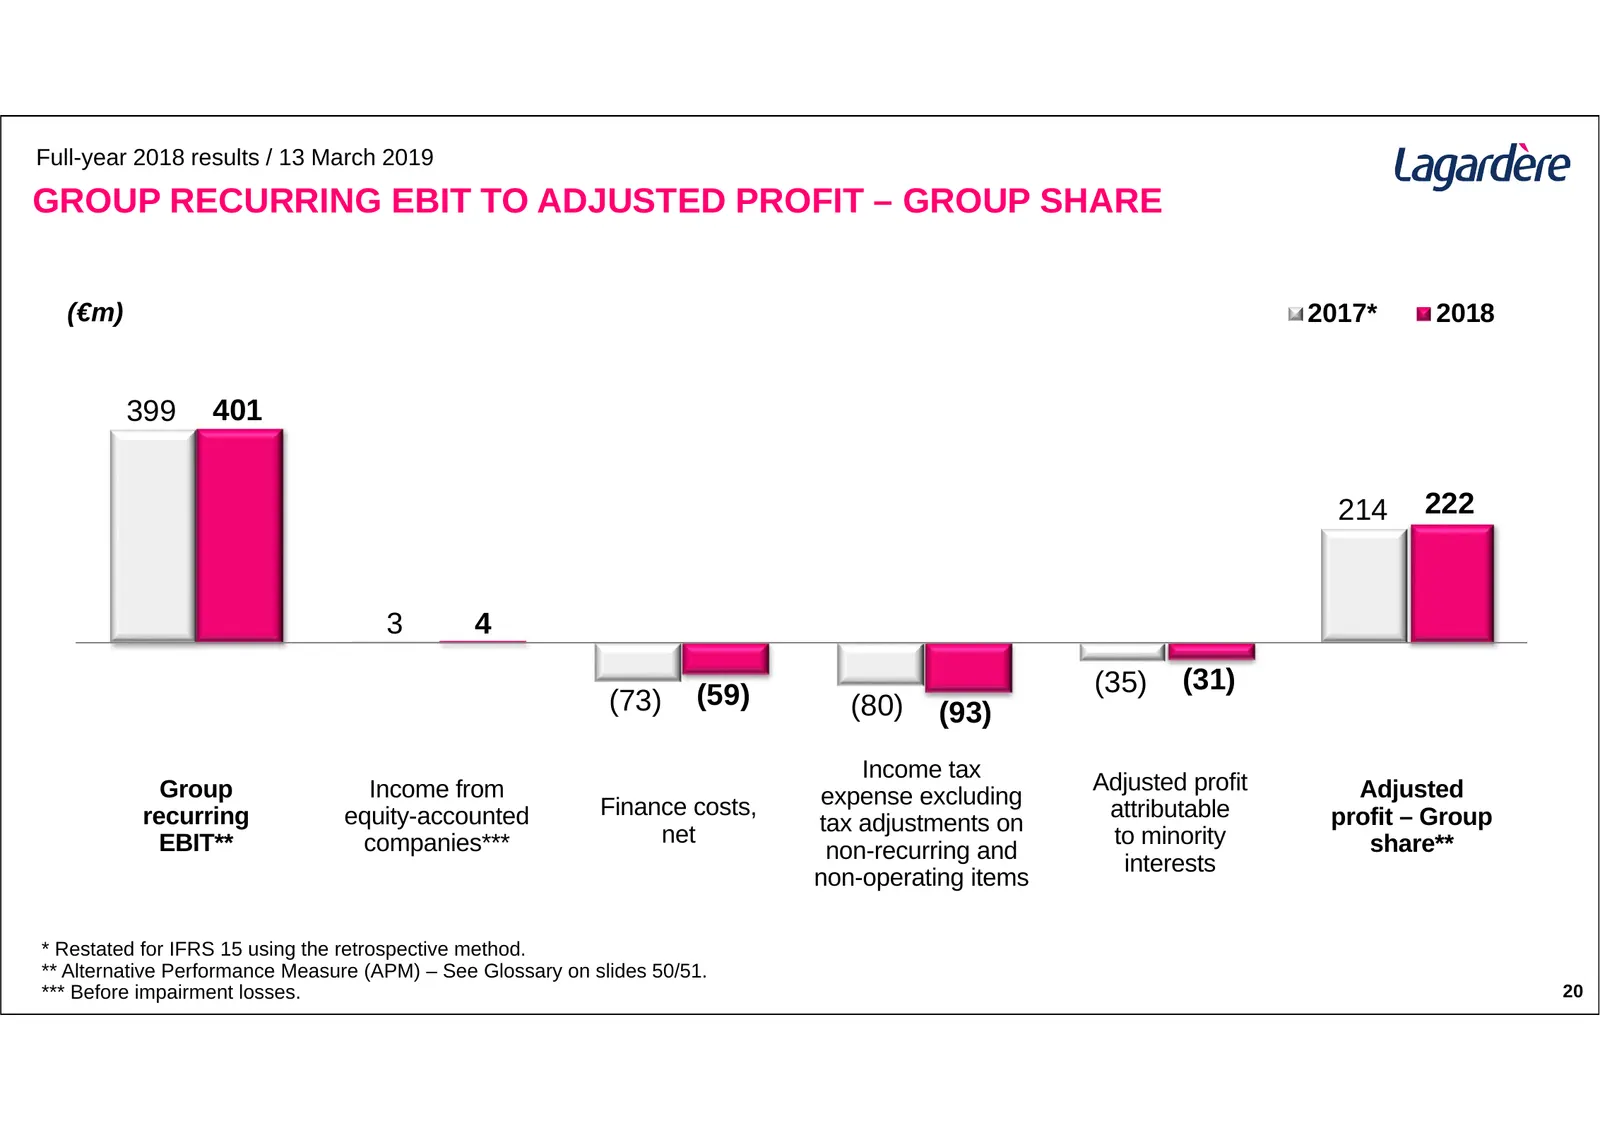
Full-year 2018 results / 13 March 2019 GROUP RECURRING EBIT TO ADJUSTED PROFIT – GROUP SHARE (€m) 2017* 2018 399 401 214 222 3 4 (59) (35) (31) (73) (80) (93) Income tax Group Income from Adjusted profit Adjusted Finance costs, expense excluding recurring equity-accounted attributable profit – Group
Slide 20: Consolidated Statement of Cash Flows
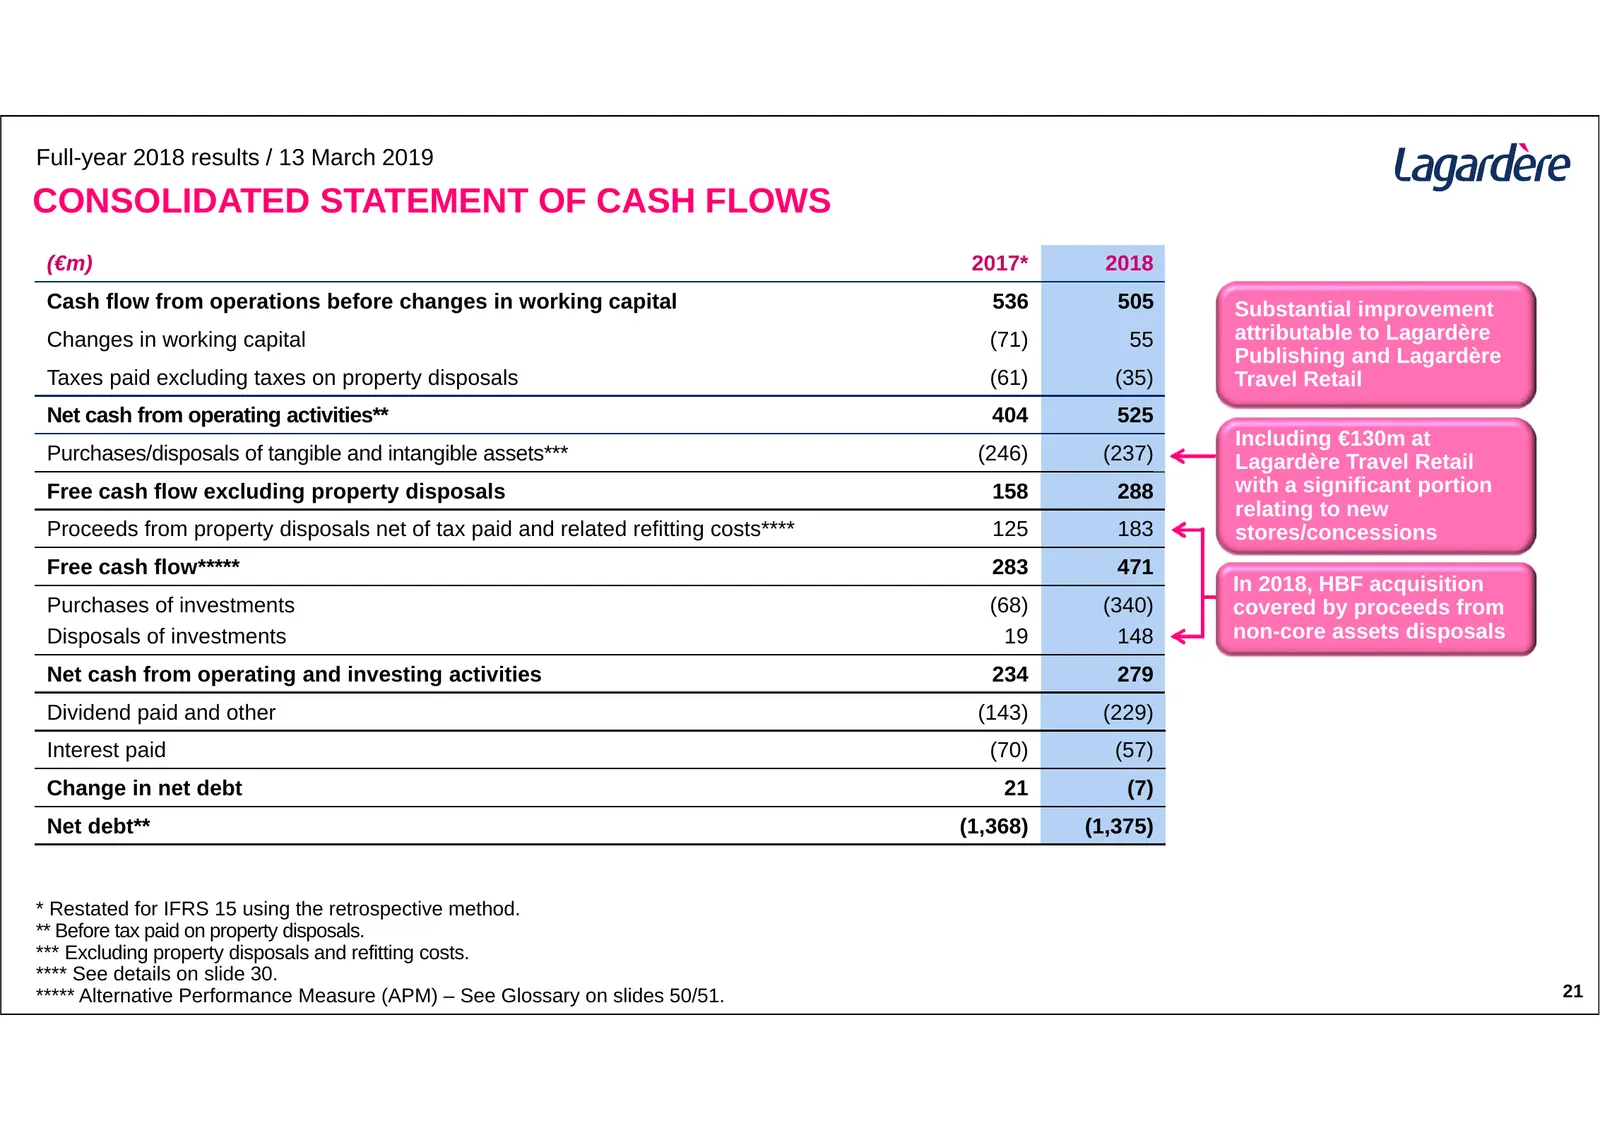
Full-year 2018 results / 13 March 2019 CONSOLIDATED STATEMENT OF CASH FLOWS (€m) 2017* 2018 Cash flow from operations before changes in working capital 536 505 Substantial improvement Changes in working capital (71) 55 attributable to Lagardère Publishing and Lagardère Taxes paid excluding taxes on
Slide 21: Consolidated Balance Sheet
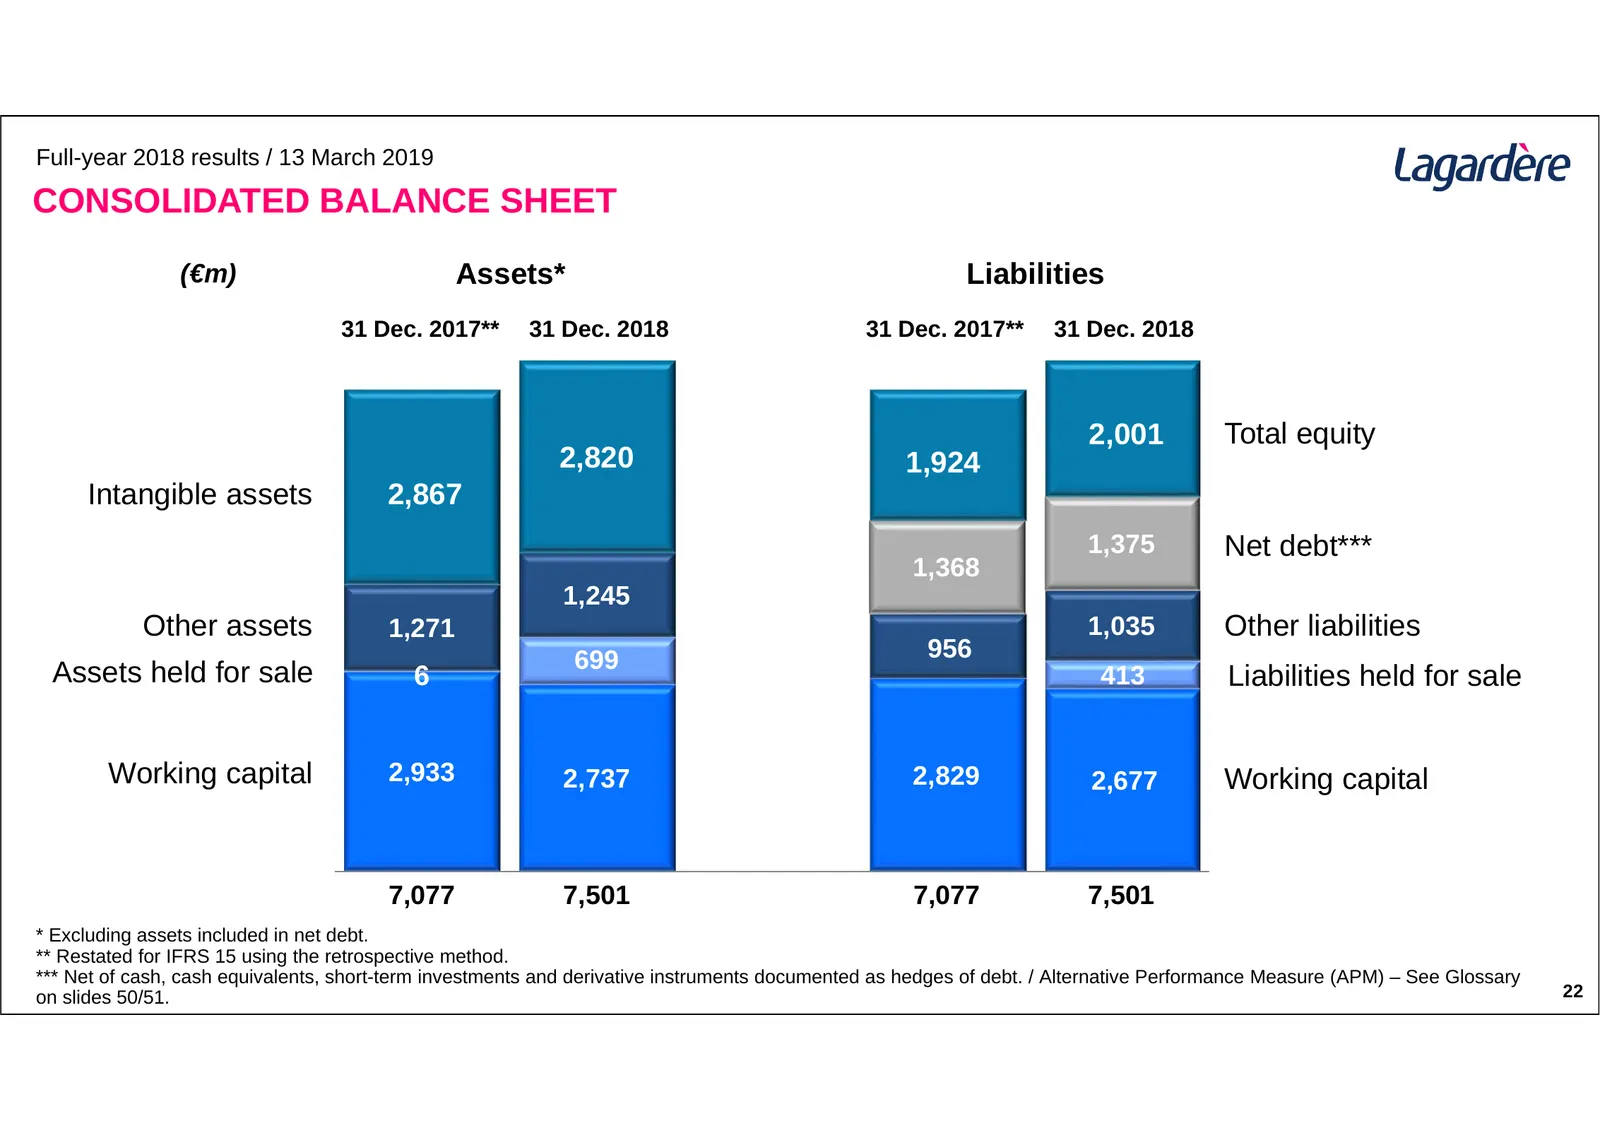
Full-year 2018 results / 13 March 2019 CONSOLIDATED BALANCE SHEET (€m) Assets* Liabilities 31 Dec. 2017** 31 Dec. 2018 31 Dec. 2017** 31 Dec. 2018 2,001 Total equity 2,820 1,924 Intangible assets 2,867 1,375 Net debt*** 1,368 1,245 Other assets 1,271 1,035 Other liabilities 699 956 Assets held for s
Slide 22: Financing Policy
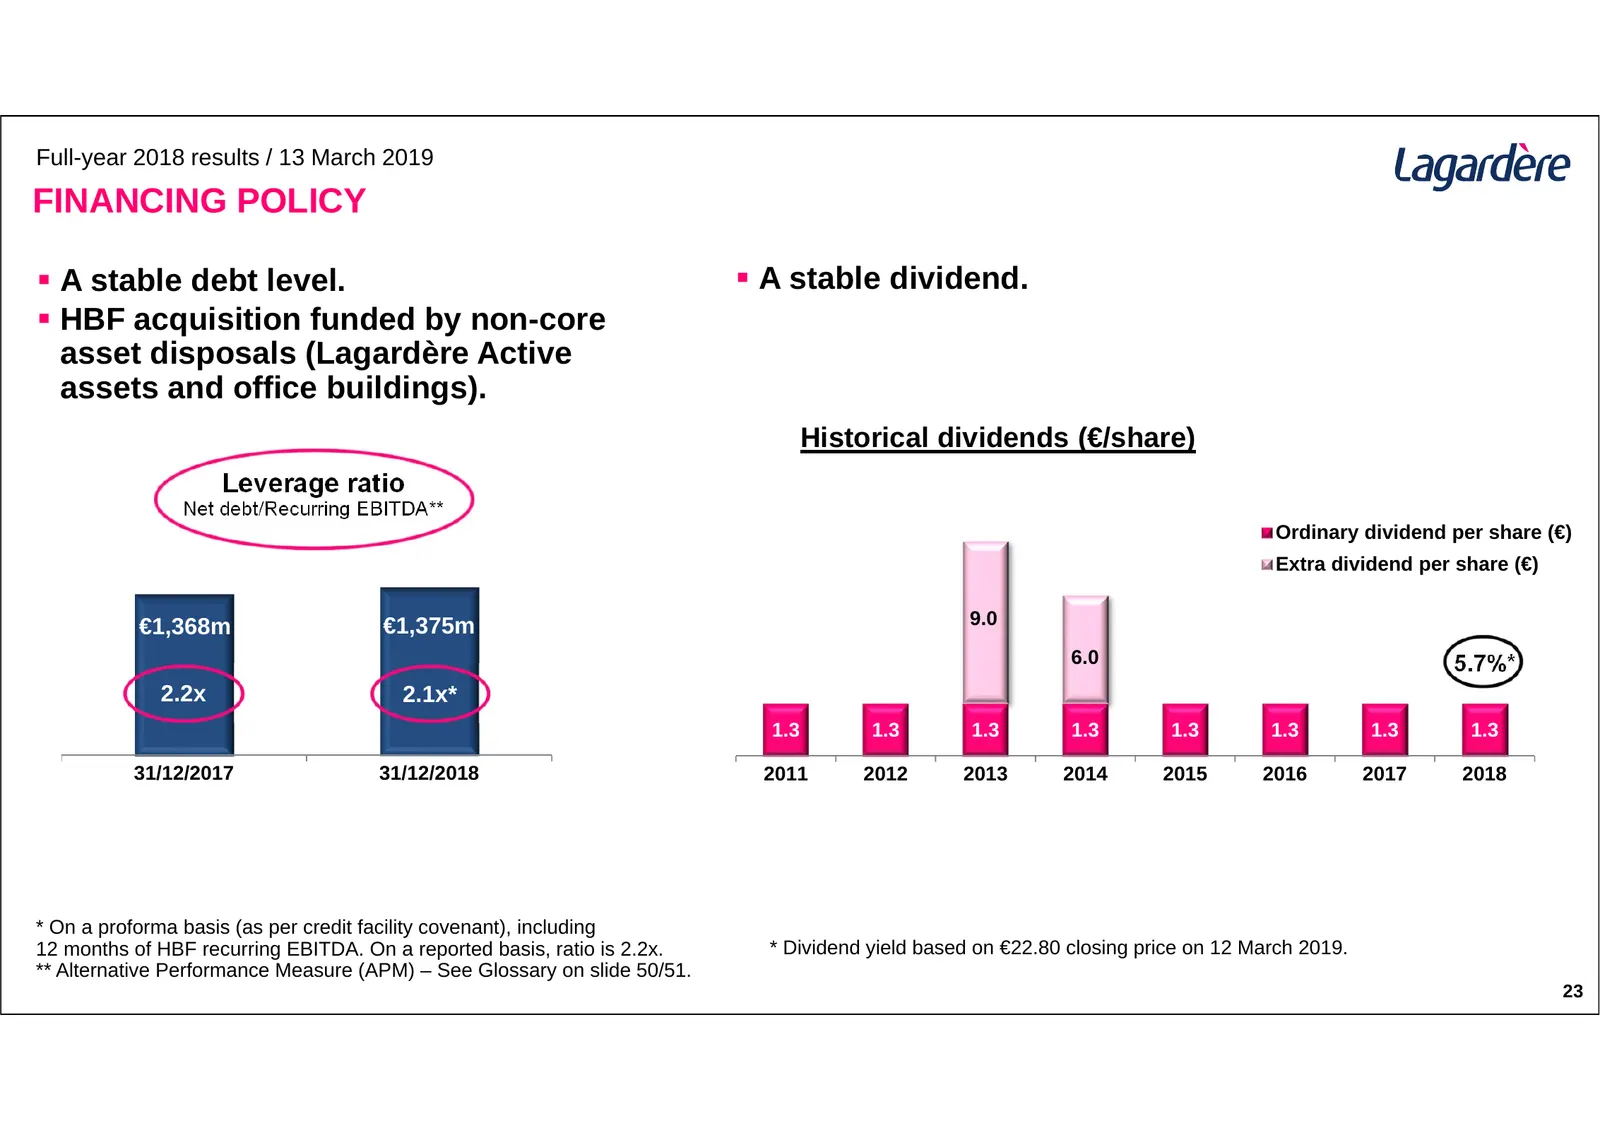
Full-year 2018 results / 13 March 2019 FINANCING POLICY A stable debt level. A stable dividend. HBF acquisition funded by non-core asset disposals (Lagardère Active assets and office buildings). Historical dividends (€/share) Leverage ratio Net debt/Recurring EBITDA** Ordinary dividend per sha
Slide 23: Group Target Scope
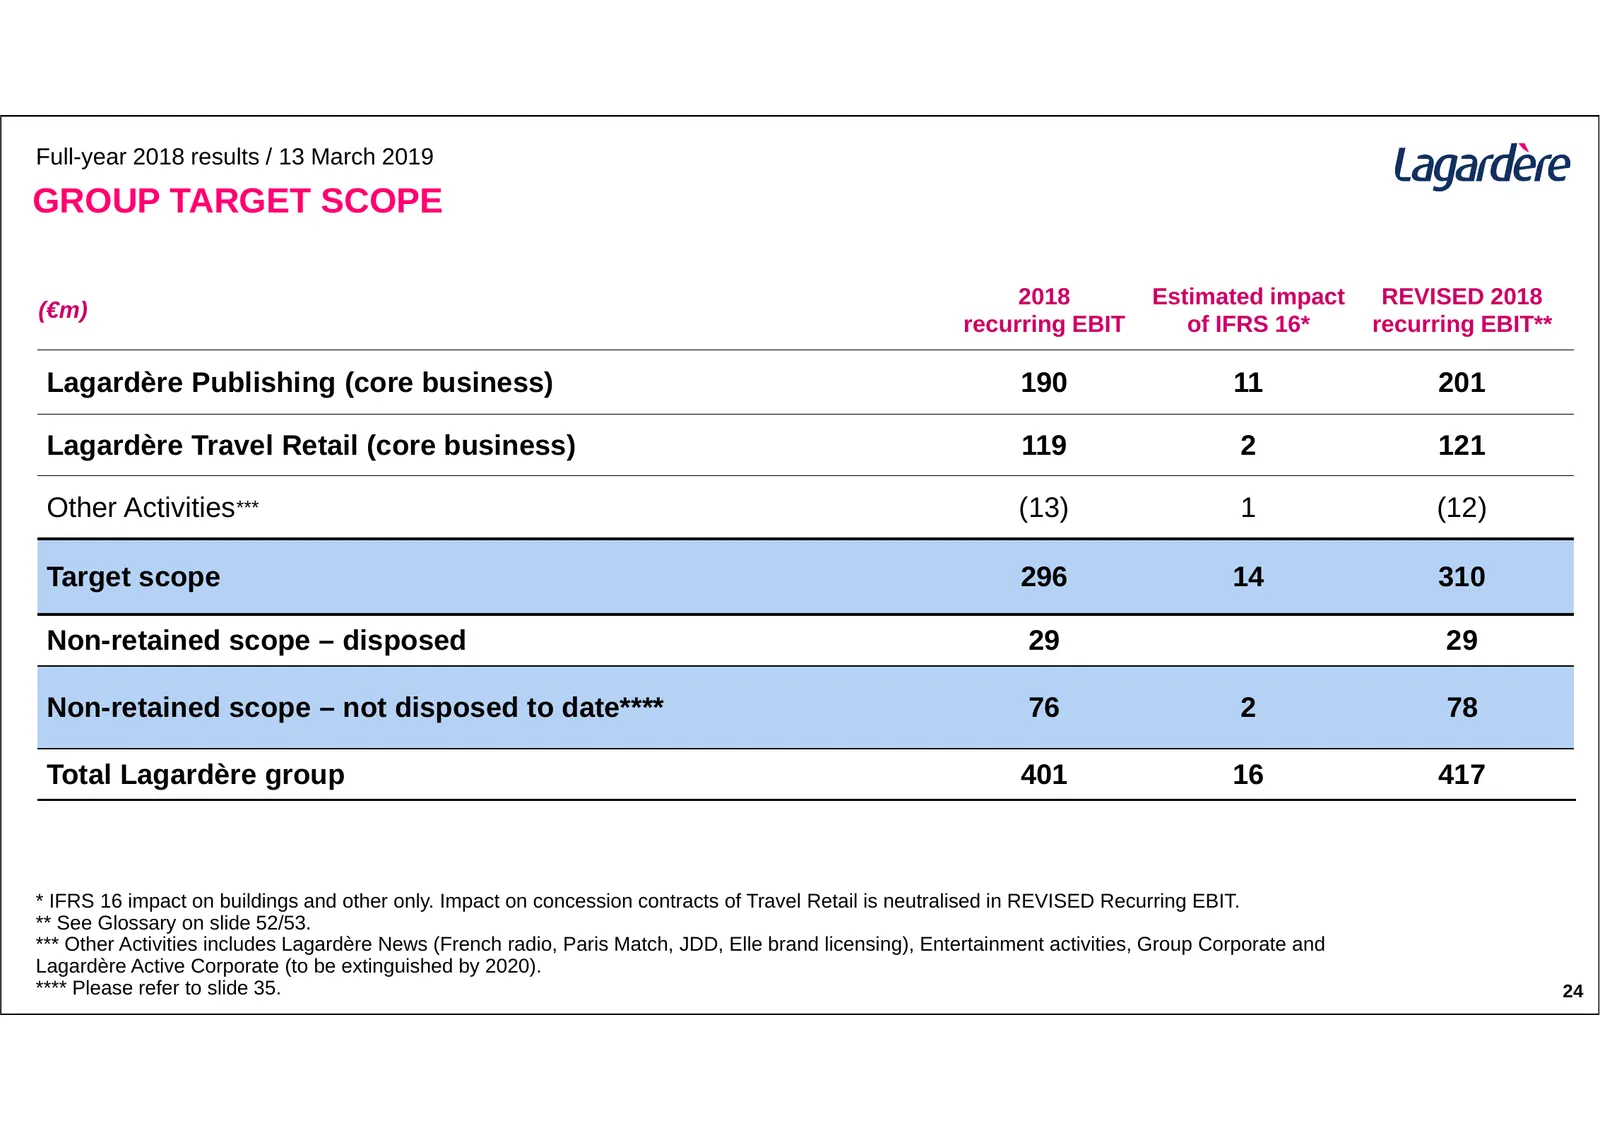
Full-year 2018 results / 13 March 2019 GROUP TARGET SCOPE 2018 Estimated impact REVISED 2018 (€m) recurring EBIT of IFRS 16* recurring EBIT** Lagardère Publishing (core business) 190 11 201 Lagardère Travel Retail (core business) 119 2 121 Other Activities*** (13) 1 (12) Target scope 296 14 310 Non-
Slide 24: Outlook
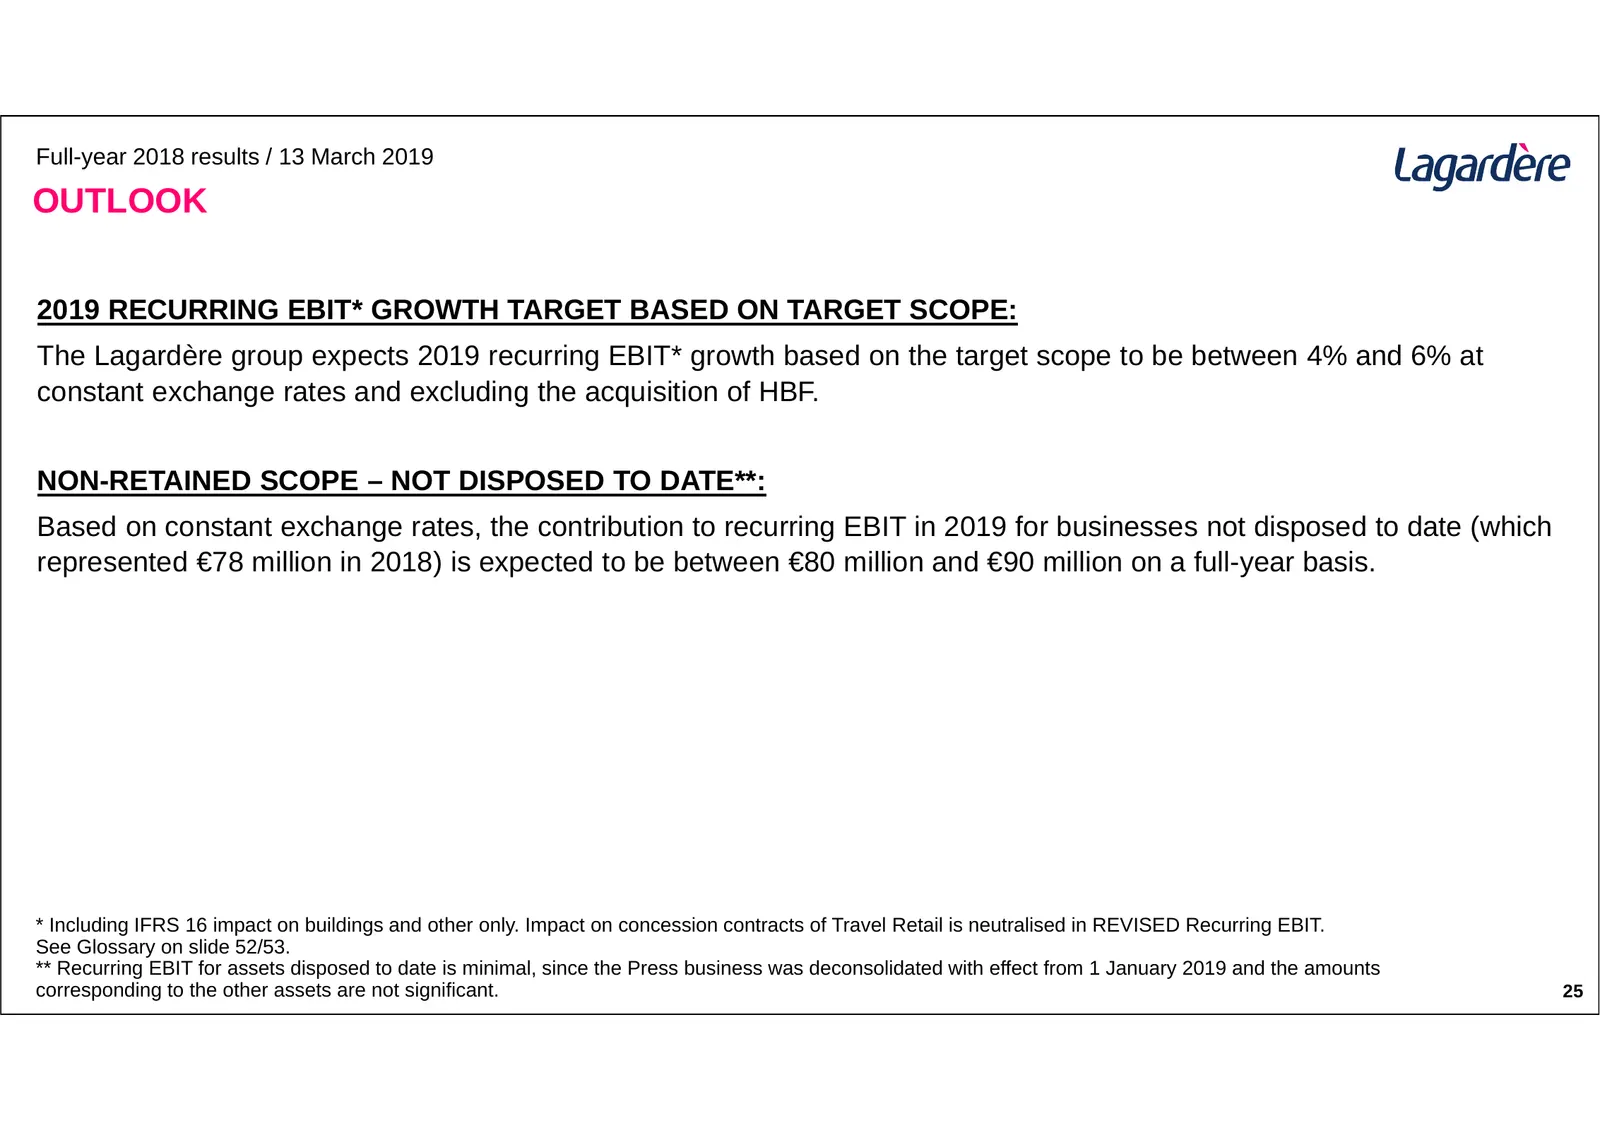
Full-year 2018 results / 13 March 2019 OUTLOOK 2019 RECURRING EBIT* GROWTH TARGET BASED ON TARGET SCOPE: The Lagardère group expects 2019 recurring EBIT* growth based on the target scope to be between 4% and 6% at constant exchange rates and excluding the acquisition of HBF. NON-RETAINED SCOPE – NOT

Slide 25: Appendices to the Consolidated Accounts
APPENDICES TO THE CONSOLIDATED ACCOUNTS Full-year 2018 results 13 March 2019
Slide 26: Changes of Scope: Main Items
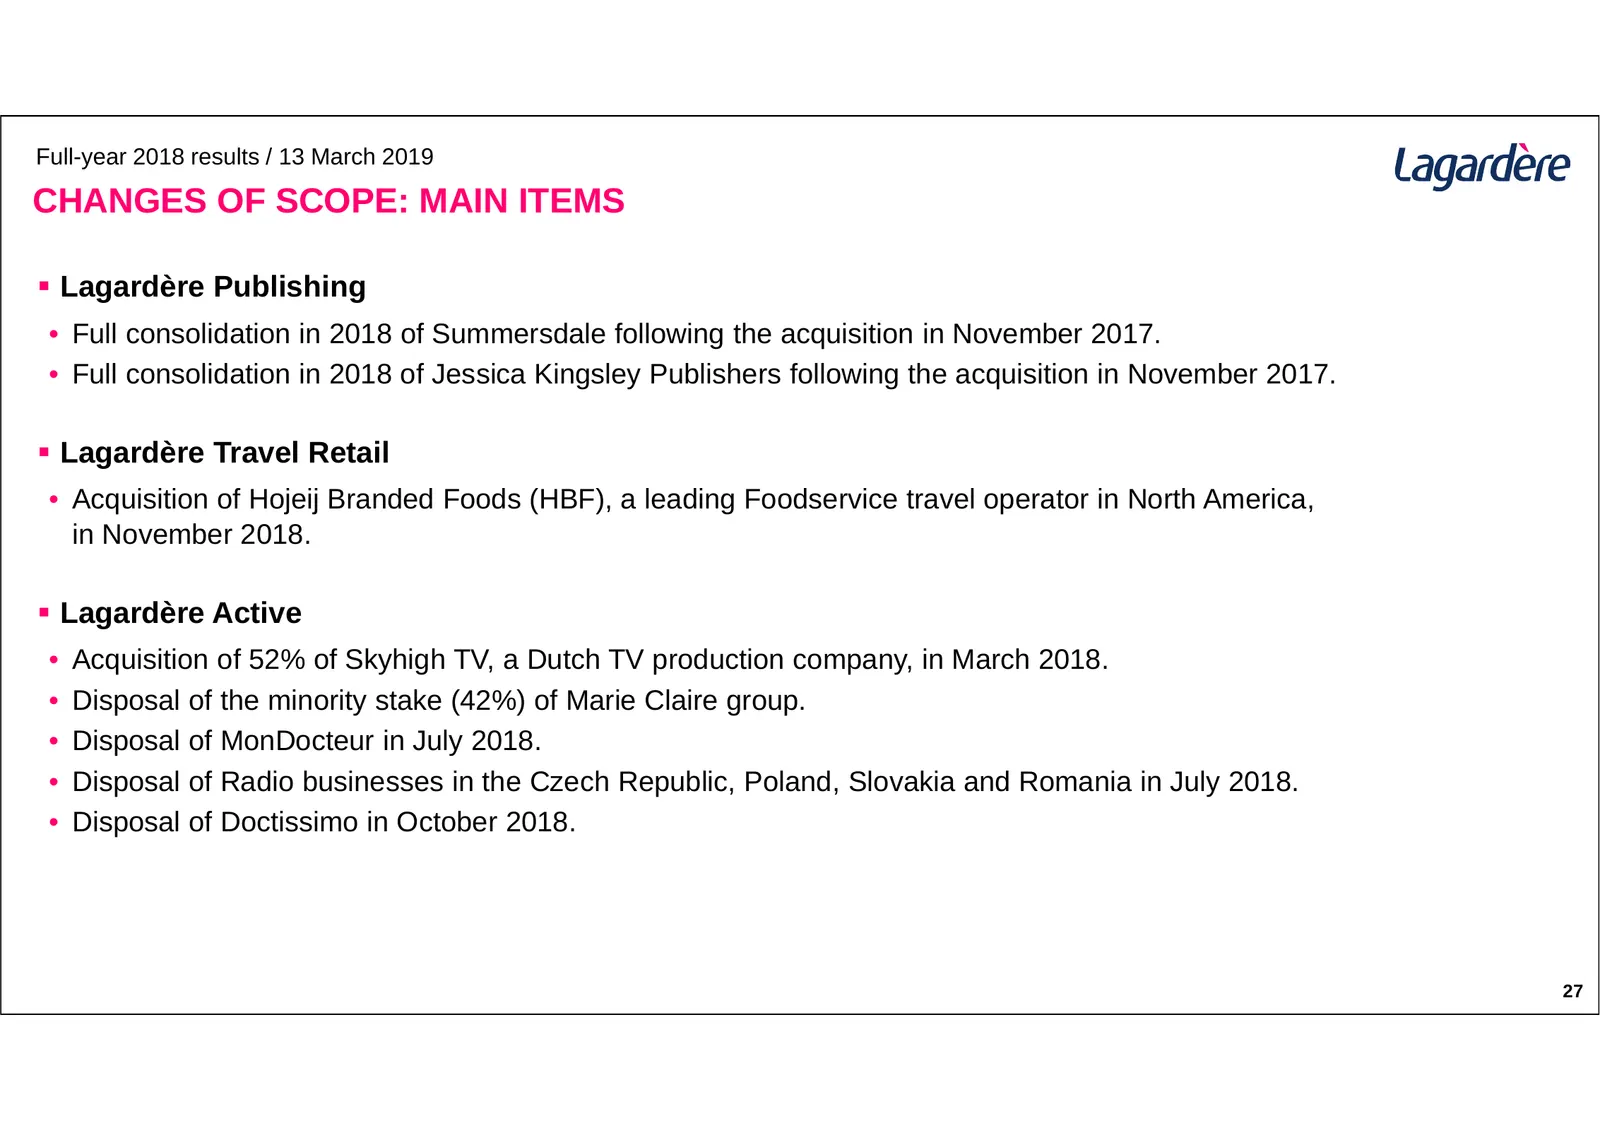
Full-year 2018 results / 13 March 2019 CHANGES OF SCOPE: MAIN ITEMS Lagardère Publishing • Full consolidation in 2018 of Summersdale following the acquisition in November 2017. • Full consolidation in 2018 of Jessica Kingsley Publishers following the acquisition in November 2017. Lagardère Trave
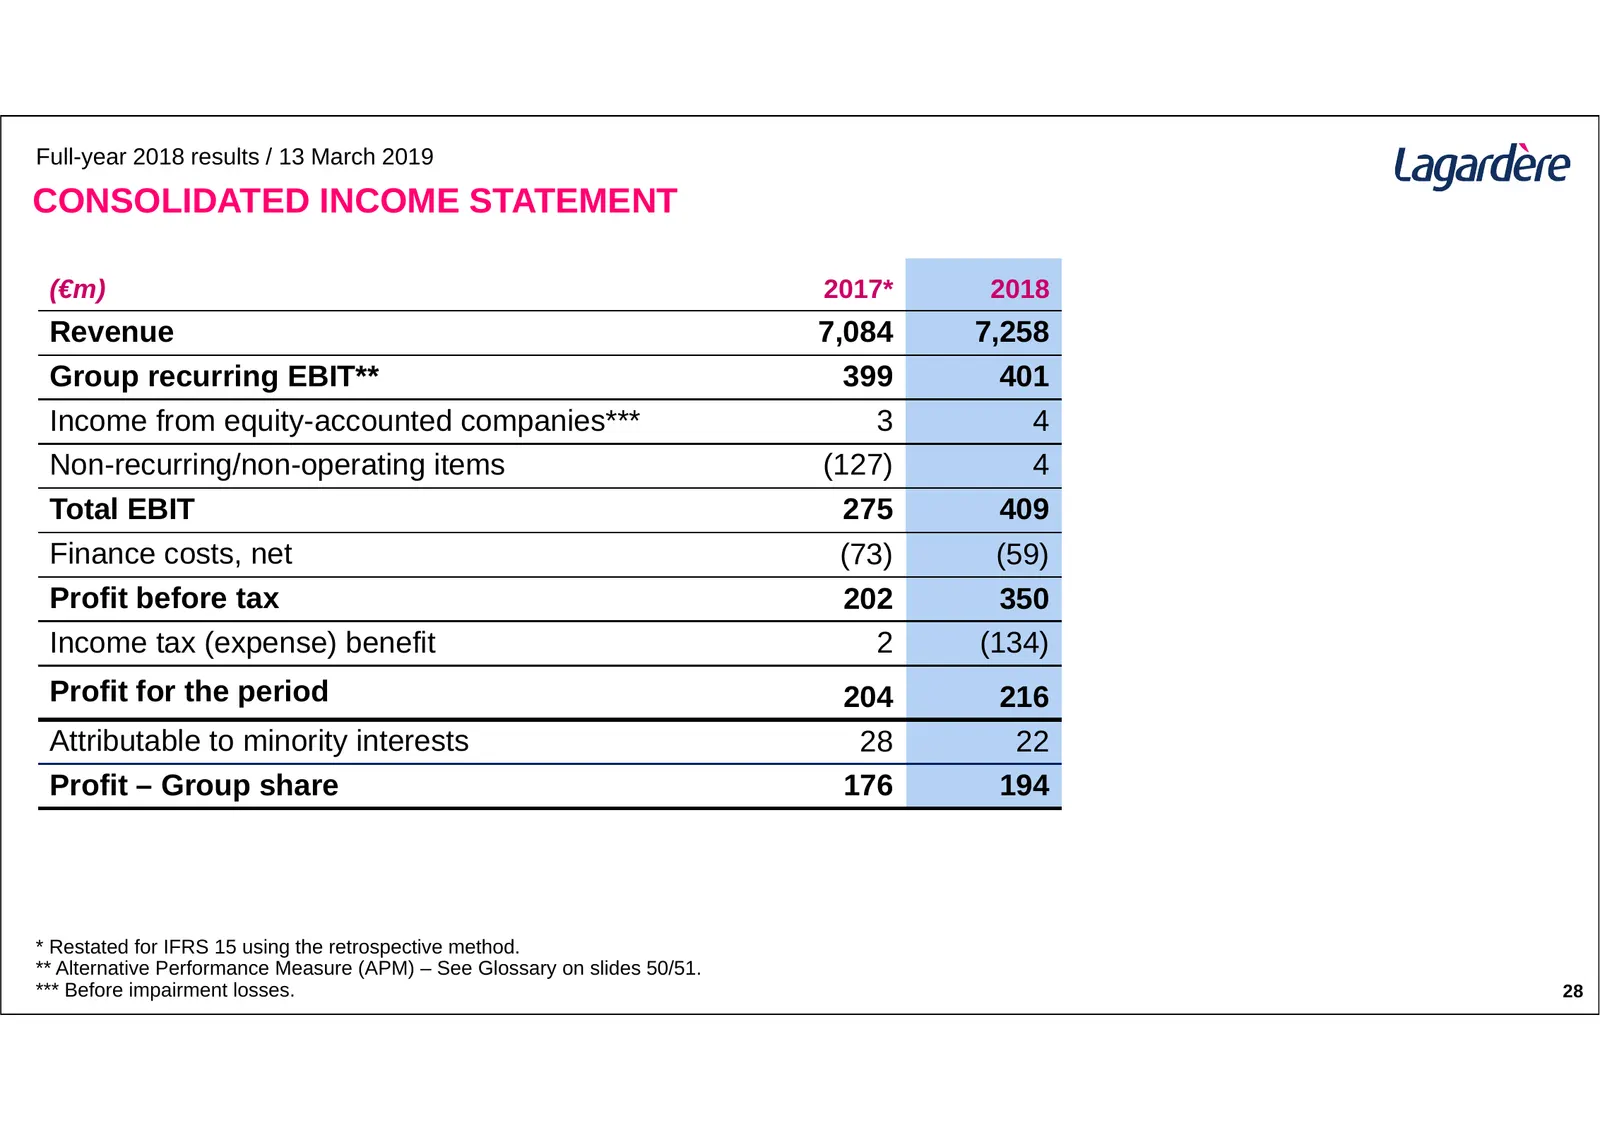
Slide 27: Consolidated Income Statement
Full-year 2018 results / 13 March 2019 CONSOLIDATED INCOME STATEMENT (€m) 2017* 2018 Revenue 7,084 7,258 Group recurring EBIT** 399 401 Income from equity-accounted companies*** 3 4 Non-recurring/non-operating items (127) 4 Total EBIT 275 409 Finance costs, net (73) (59) Profit before tax 202 350 In
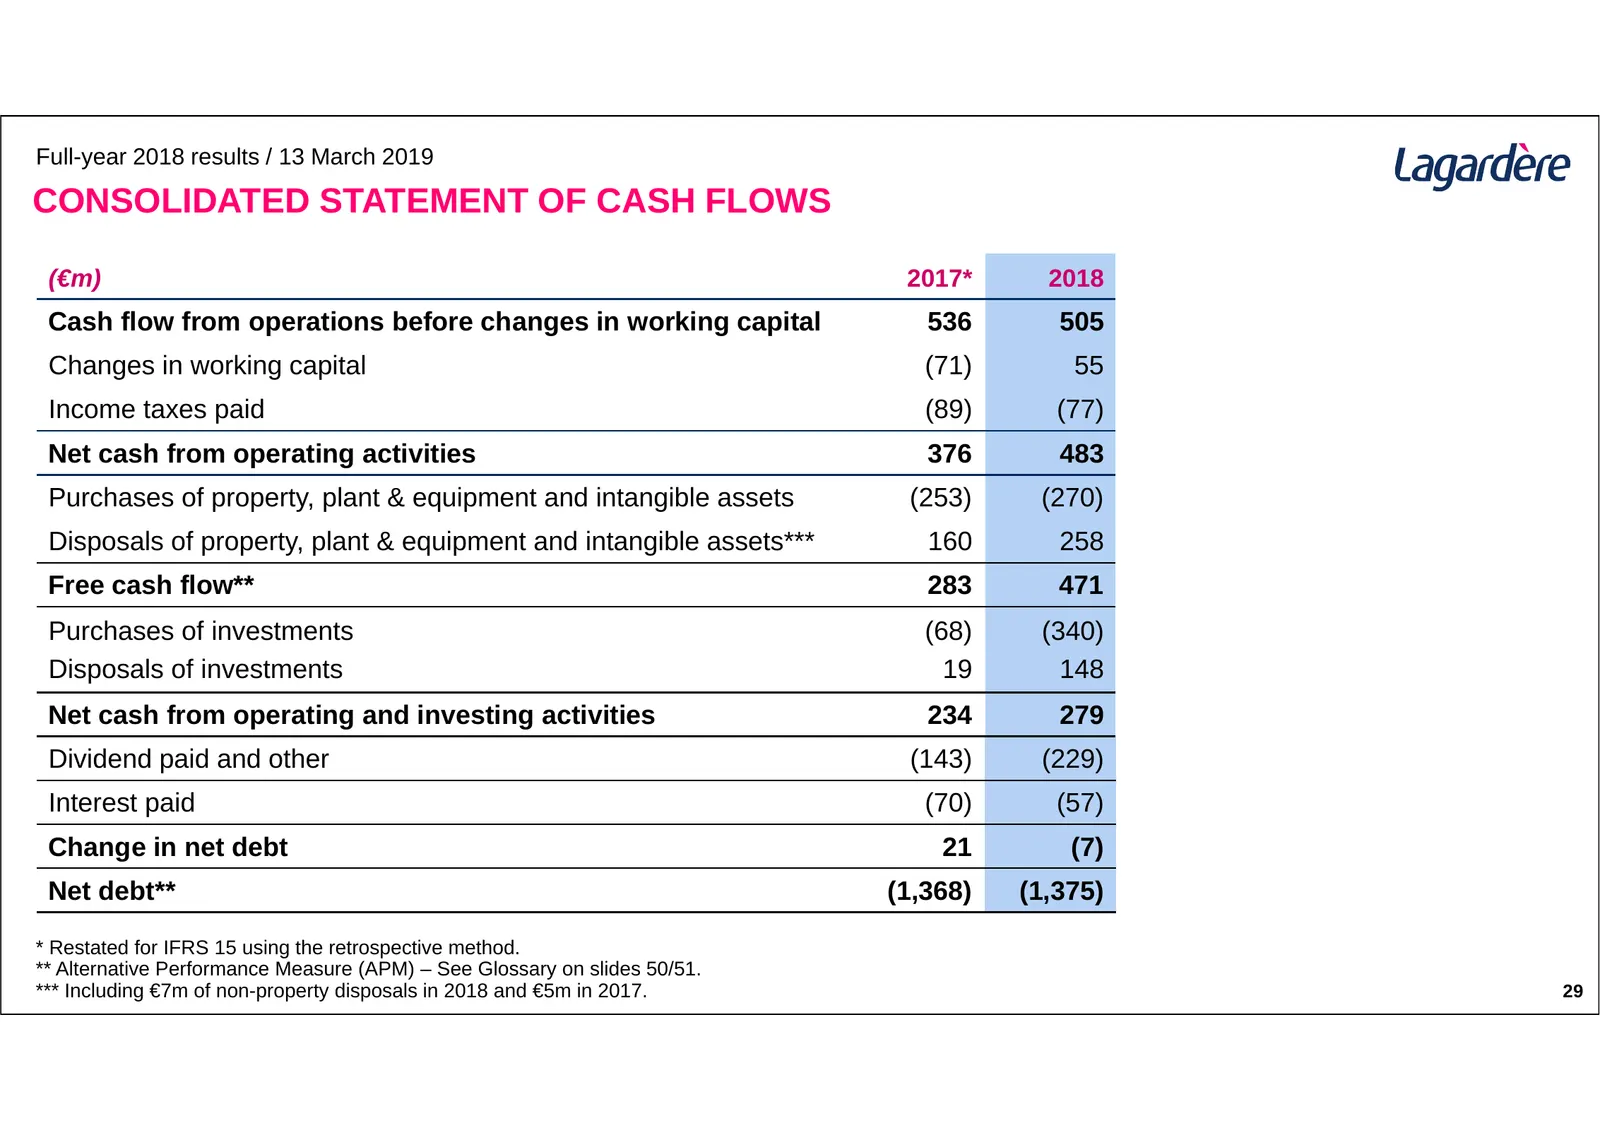
Slide 28: Consolidated Statement of Cash Flows
Full-year 2018 results / 13 March 2019 CONSOLIDATED STATEMENT OF CASH FLOWS (€m) 2017* 2018 Cash flow from operations before changes in working capital 536 505 Changes in working capital (71) 55 Income taxes paid (89) (77) Net cash from operating activities 376 483 Purchases of property, plant & equ
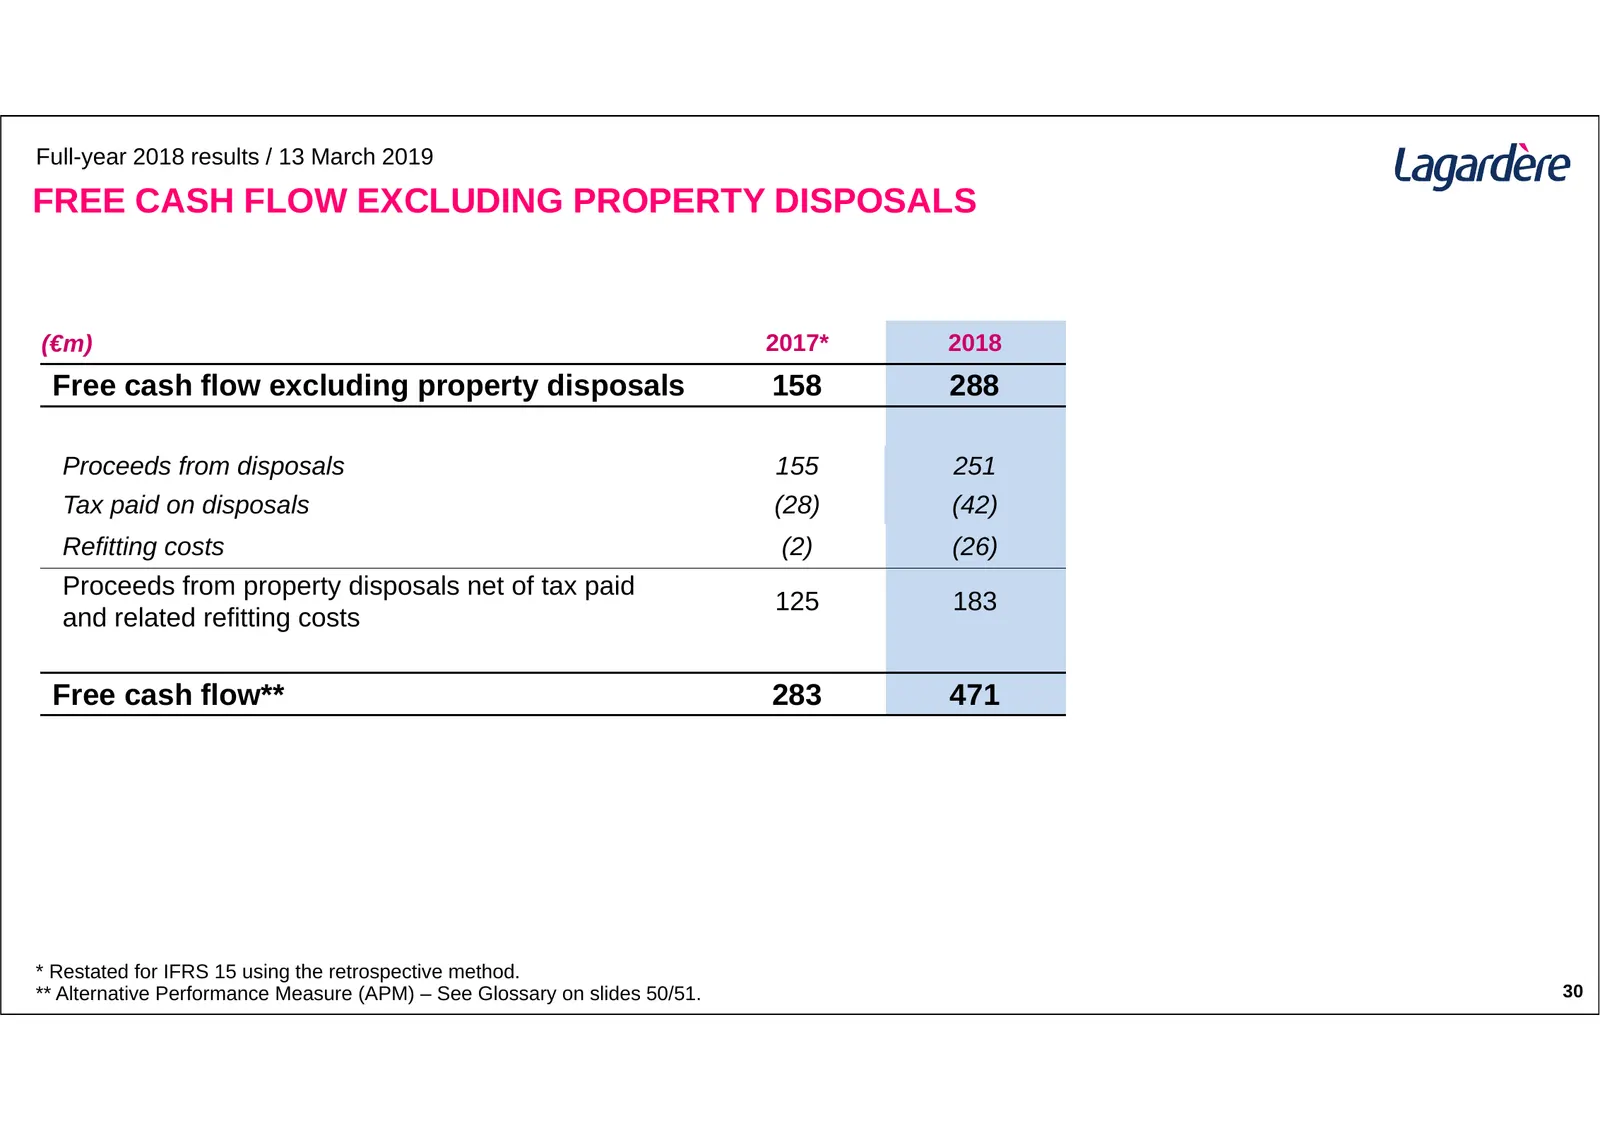
Slide 29: Free Cash Flow Excluding Property Disposals
Full-year 2018 results / 13 March 2019 FREE CASH FLOW EXCLUDING PROPERTY DISPOSALS (€m) 2017* 2018 Free cash flow excluding property disposals 158 288 Proceeds from disposals 155 251 Tax paid on disposals (28) (42) Refitting costs (2) (26) Proceeds from property disposals net of tax paid 125 183 and
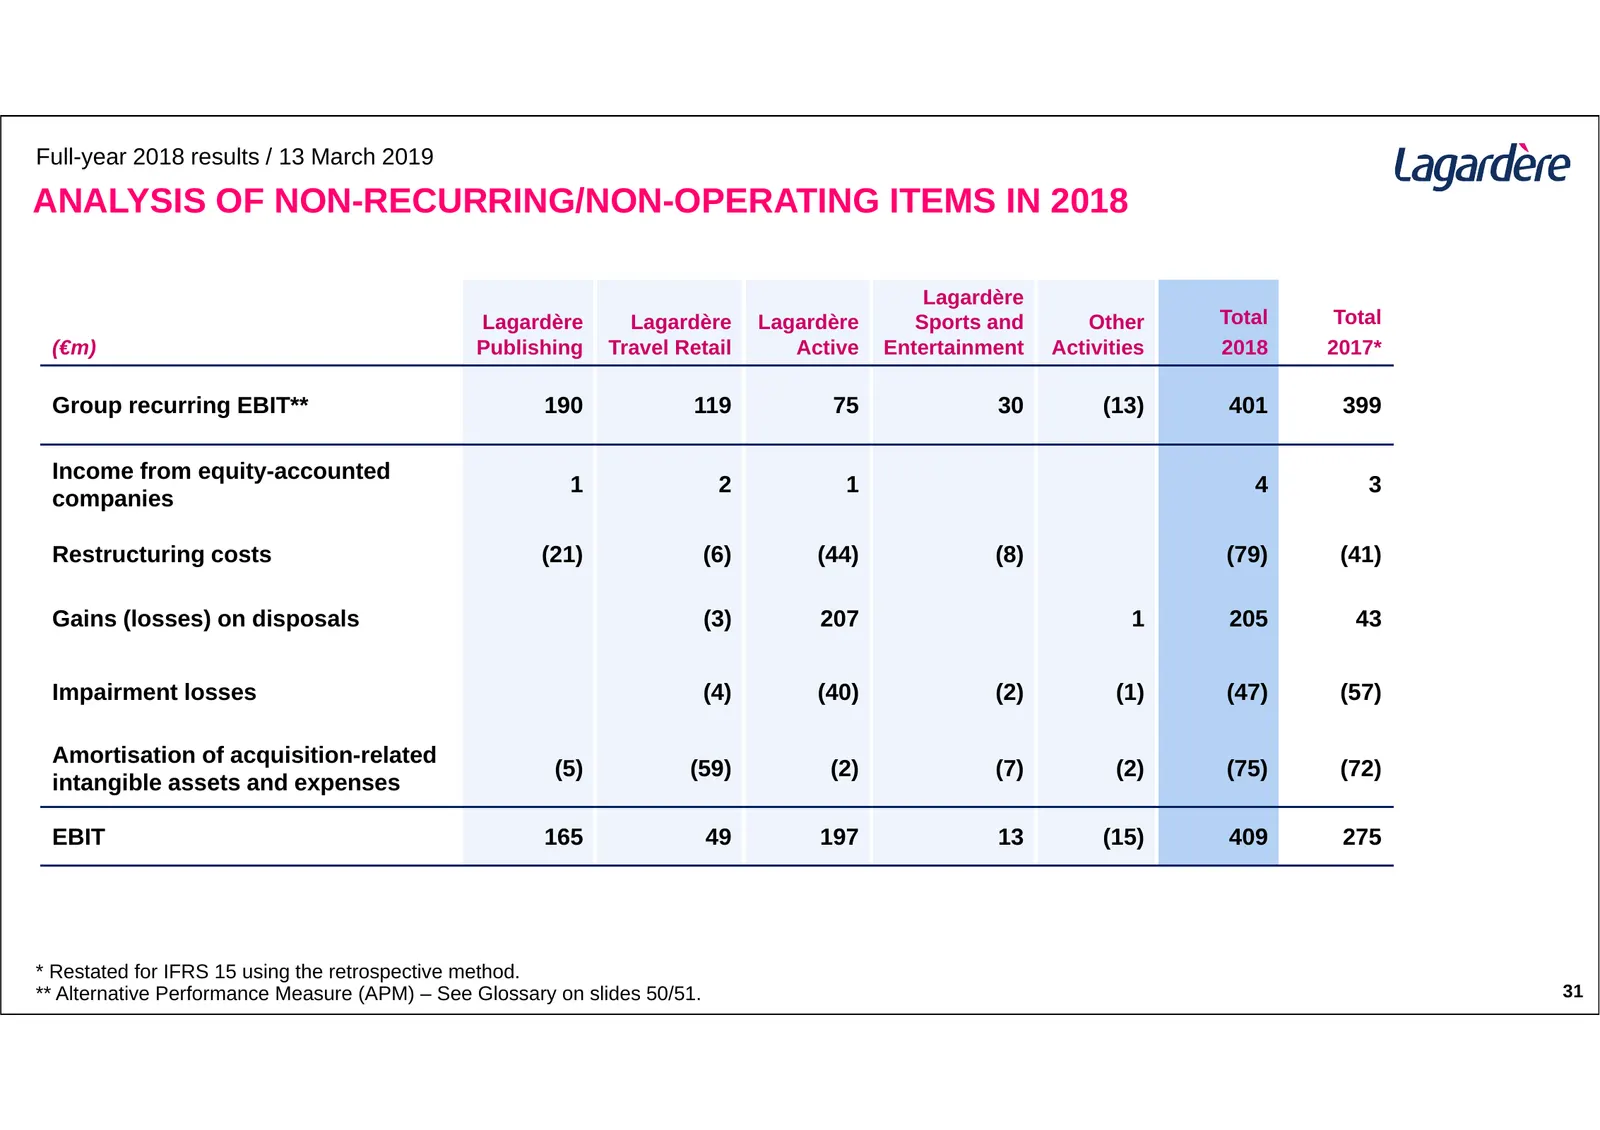
Slide 30: Analysis of Non-Recurring/Non-Operating Items in 2018
Full-year 2018 results / 13 March 2019 ANALYSIS OF NON-RECURRING/NON-OPERATING ITEMS IN 2018 Lagardère Lagardère Lagardère Lagardère Sports and Other Total Total (€m) Publishing Travel Retail Active Entertainment Activities 2018 2017* Group recurring EBIT** 190 119 75 30 (13) 401 399 Income from equ
Slide 31: Adjusted Profit – Group Share
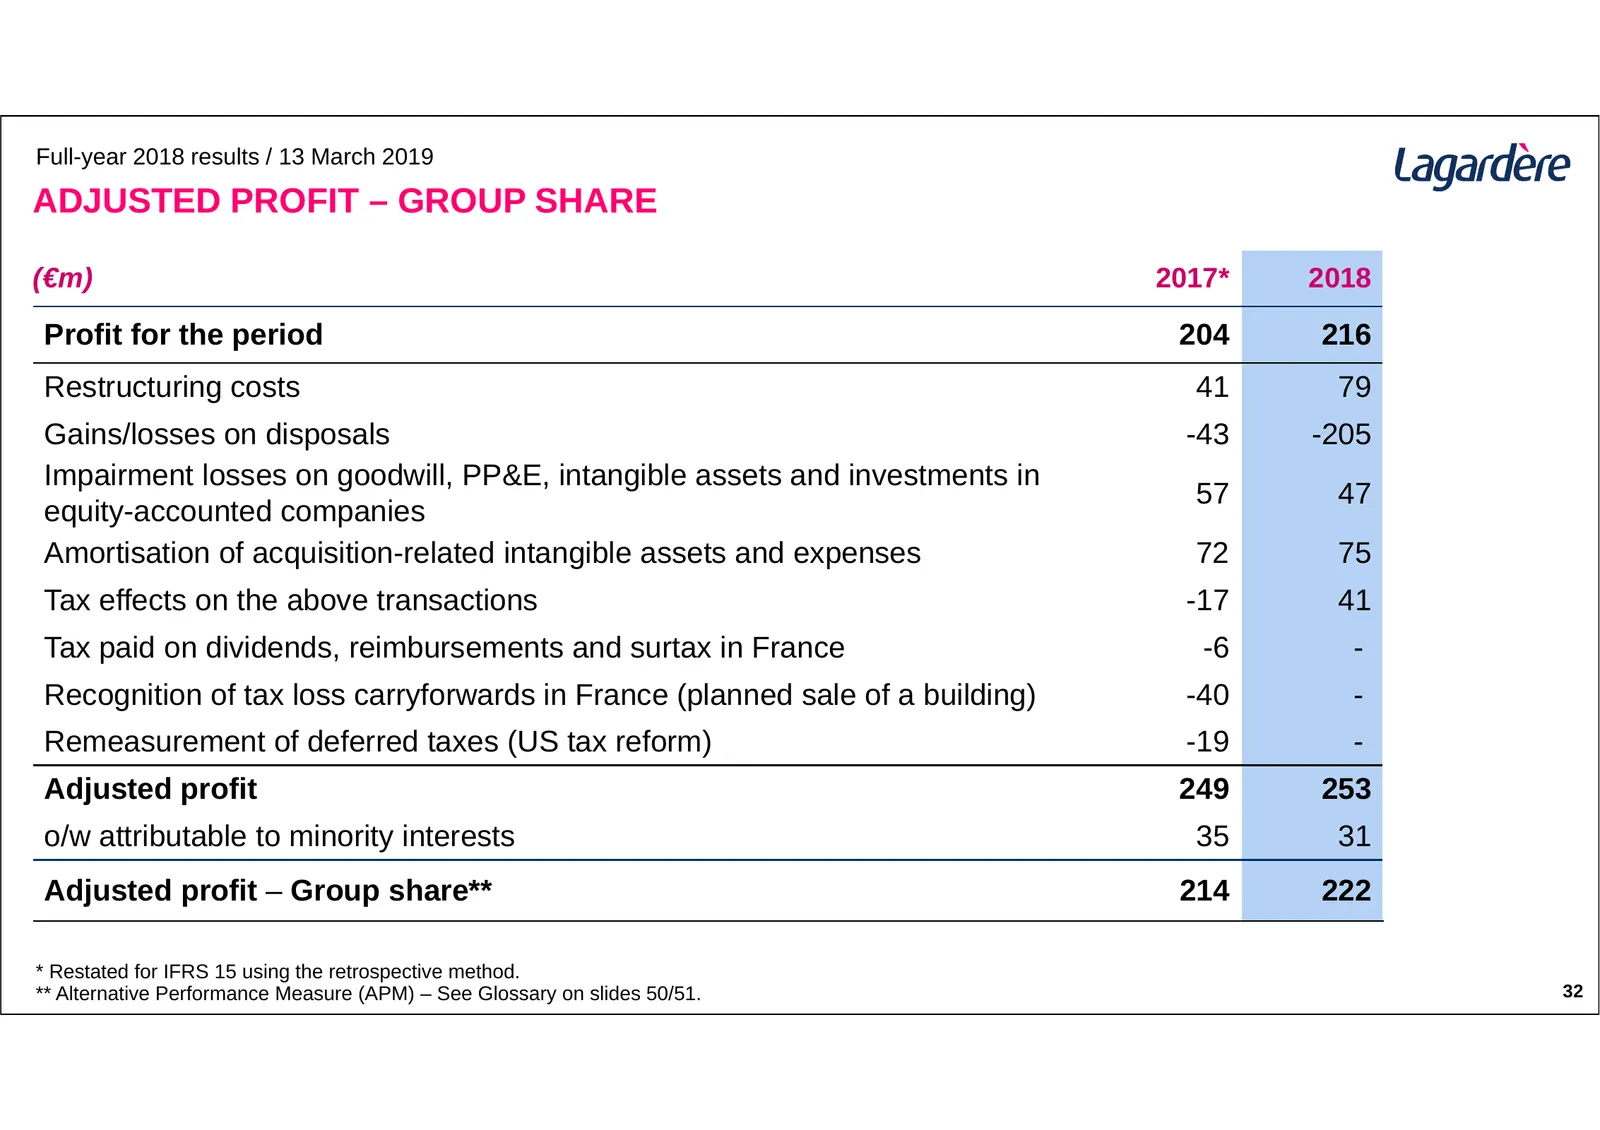
Full-year 2018 results / 13 March 2019 ADJUSTED PROFIT – GROUP SHARE (€m) 2017* 2018 Profit for the period 204 216 Restructuring costs 41 79 Gains/losses on disposals -43 -205 Impairment losses on goodwill, PP&E, intangible assets and investments in 57 47 equity-accounted companies Amortisation of a
Slide 32: Group Profile – 2018
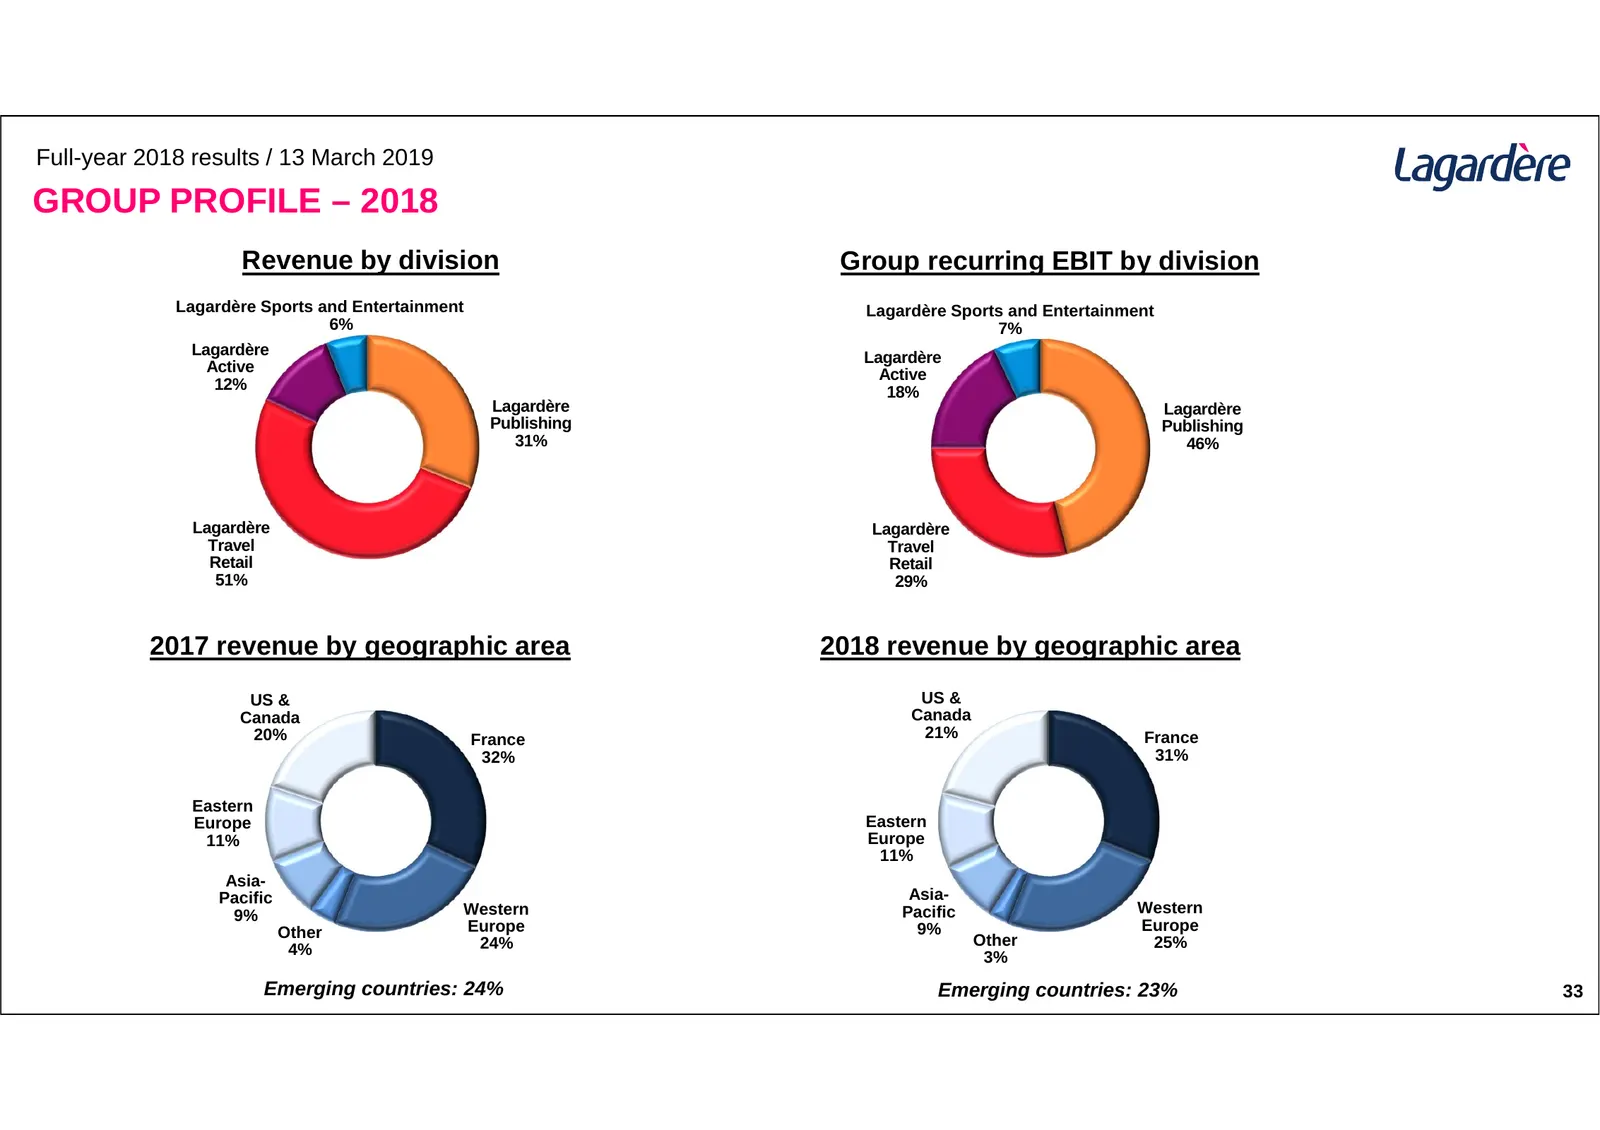
Full-year 2018 results / 13 March 2019 GROUP PROFILE – 2018 Revenue by division Group recurring EBIT by division Lagardère Sports and Entertainment Lagardère Sports and Entertainment 6% 7% Lagardère Lagardère Active Active 12% 18% Lagardère Lagardère Publishing Publishing 31% 46% Lagardère Lagardère
Slide 33: Recap of Performance by Division – 2018
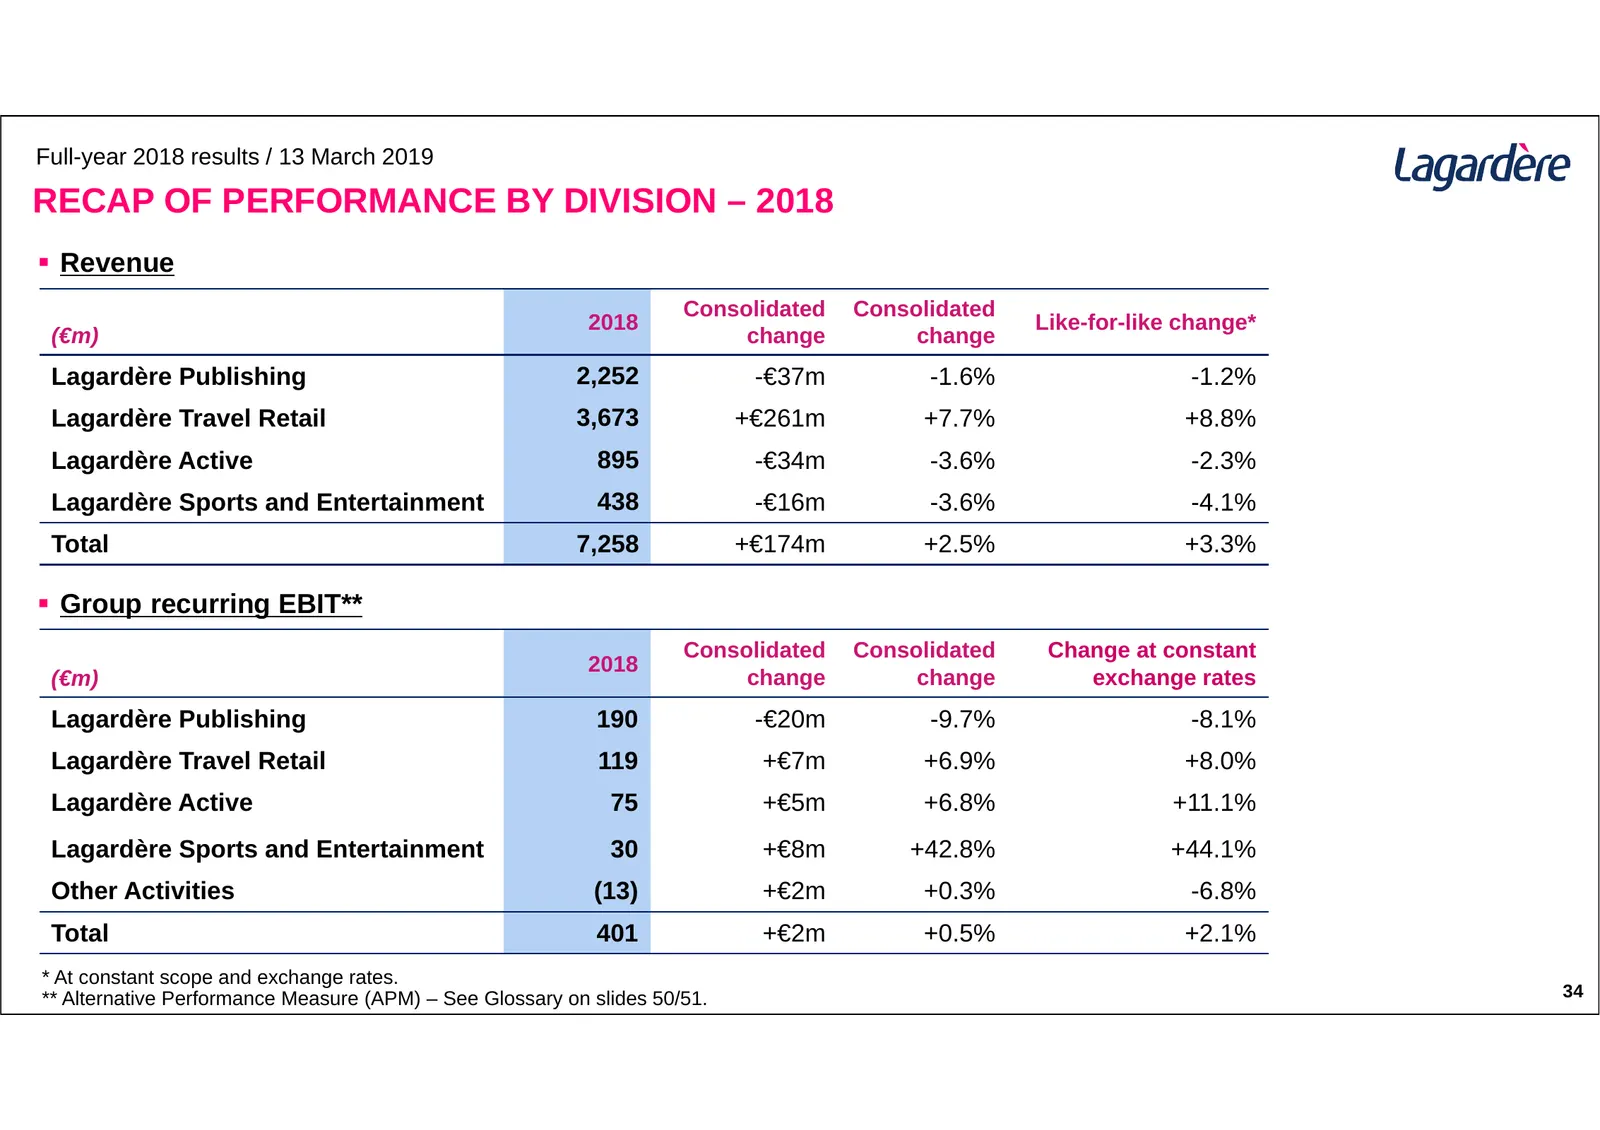
Full-year 2018 results / 13 March 2019 RECAP OF PERFORMANCE BY DIVISION – 2018 Revenue Consolidated Consolidated 2018 Like-for-like change* (€m) change change Lagardère Publishing 2,252 -€37m -1.6% -1.2% Lagardère Travel Retail 3,673 +€261m +7.7% +8.8% Lagardère Active 895 -€34m -3.6% -2.3% Lagard
Slide 34: Non-Retained Scope Recurring EBIT
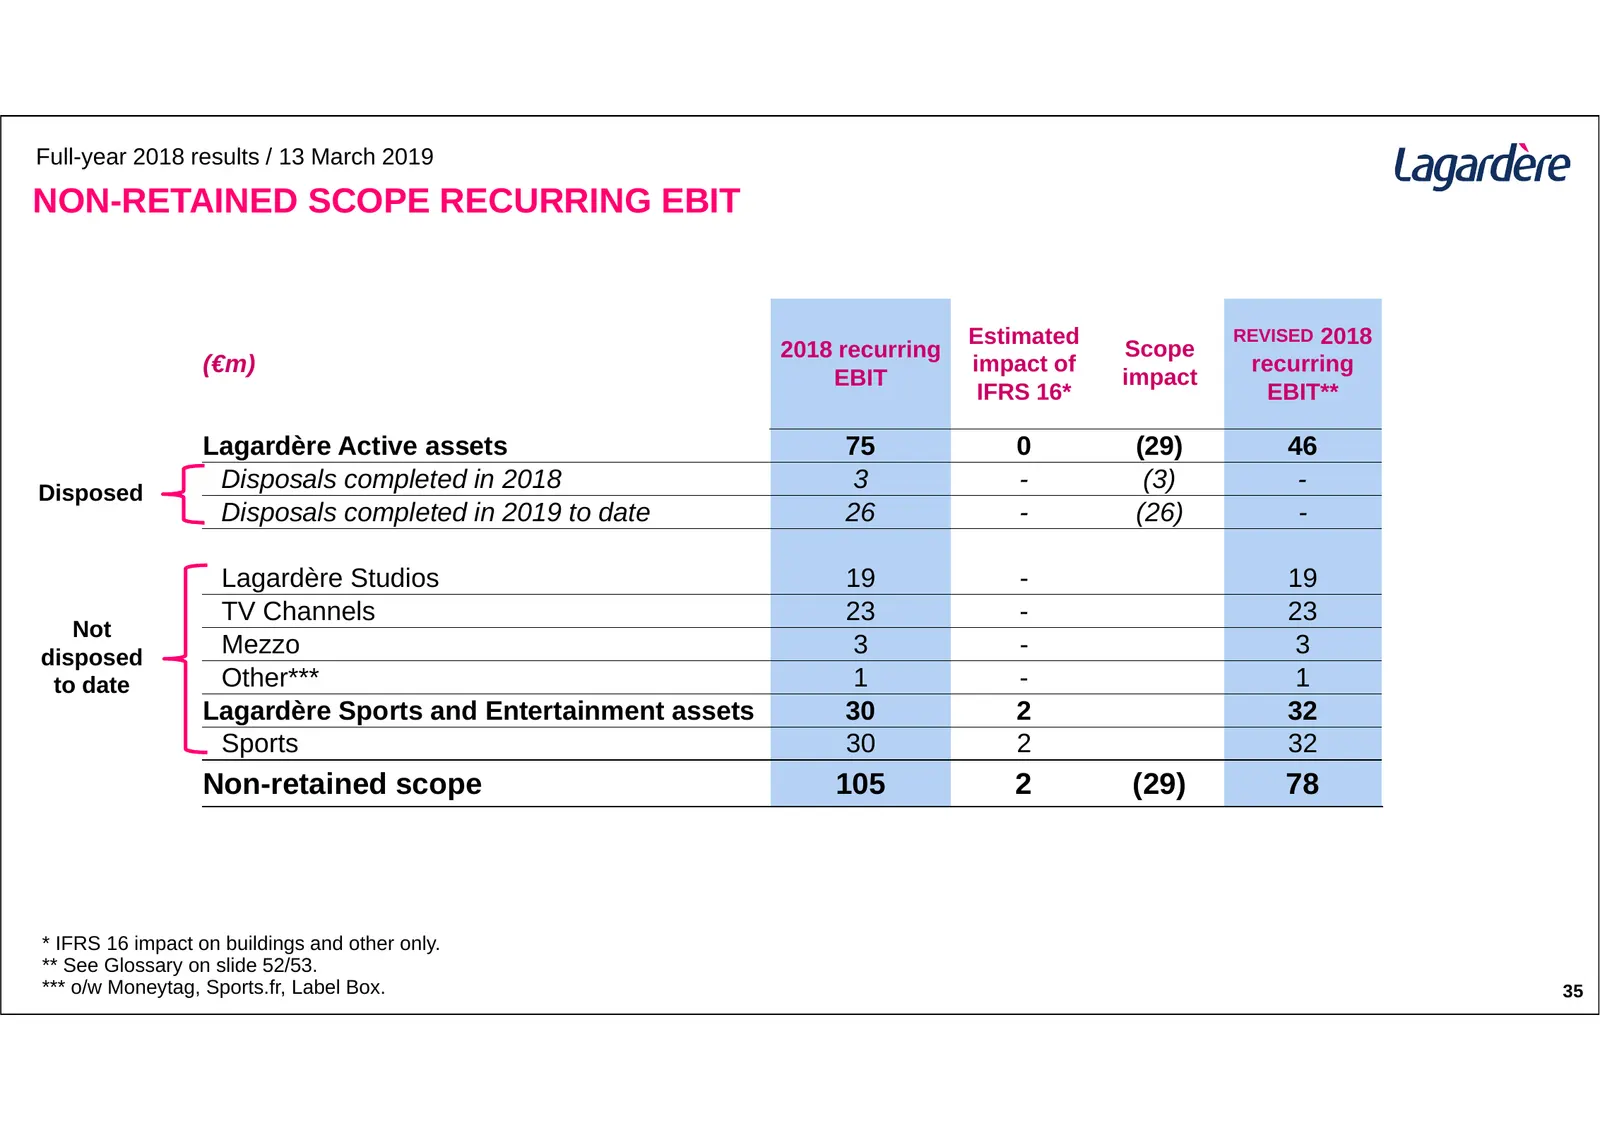
Full-year 2018 results / 13 March 2019 NON-RETAINED SCOPE RECURRING EBIT Estimated REVISED 2018 2018 recurring Scope (€m) impact of impact recurring EBIT IFRS 16* EBIT** Lagardère Active assets 75 0 (29) 46 Disposed Disposals completed in 2018 3 - (3) - Disposals completed in 2019 to date 26 - (26)
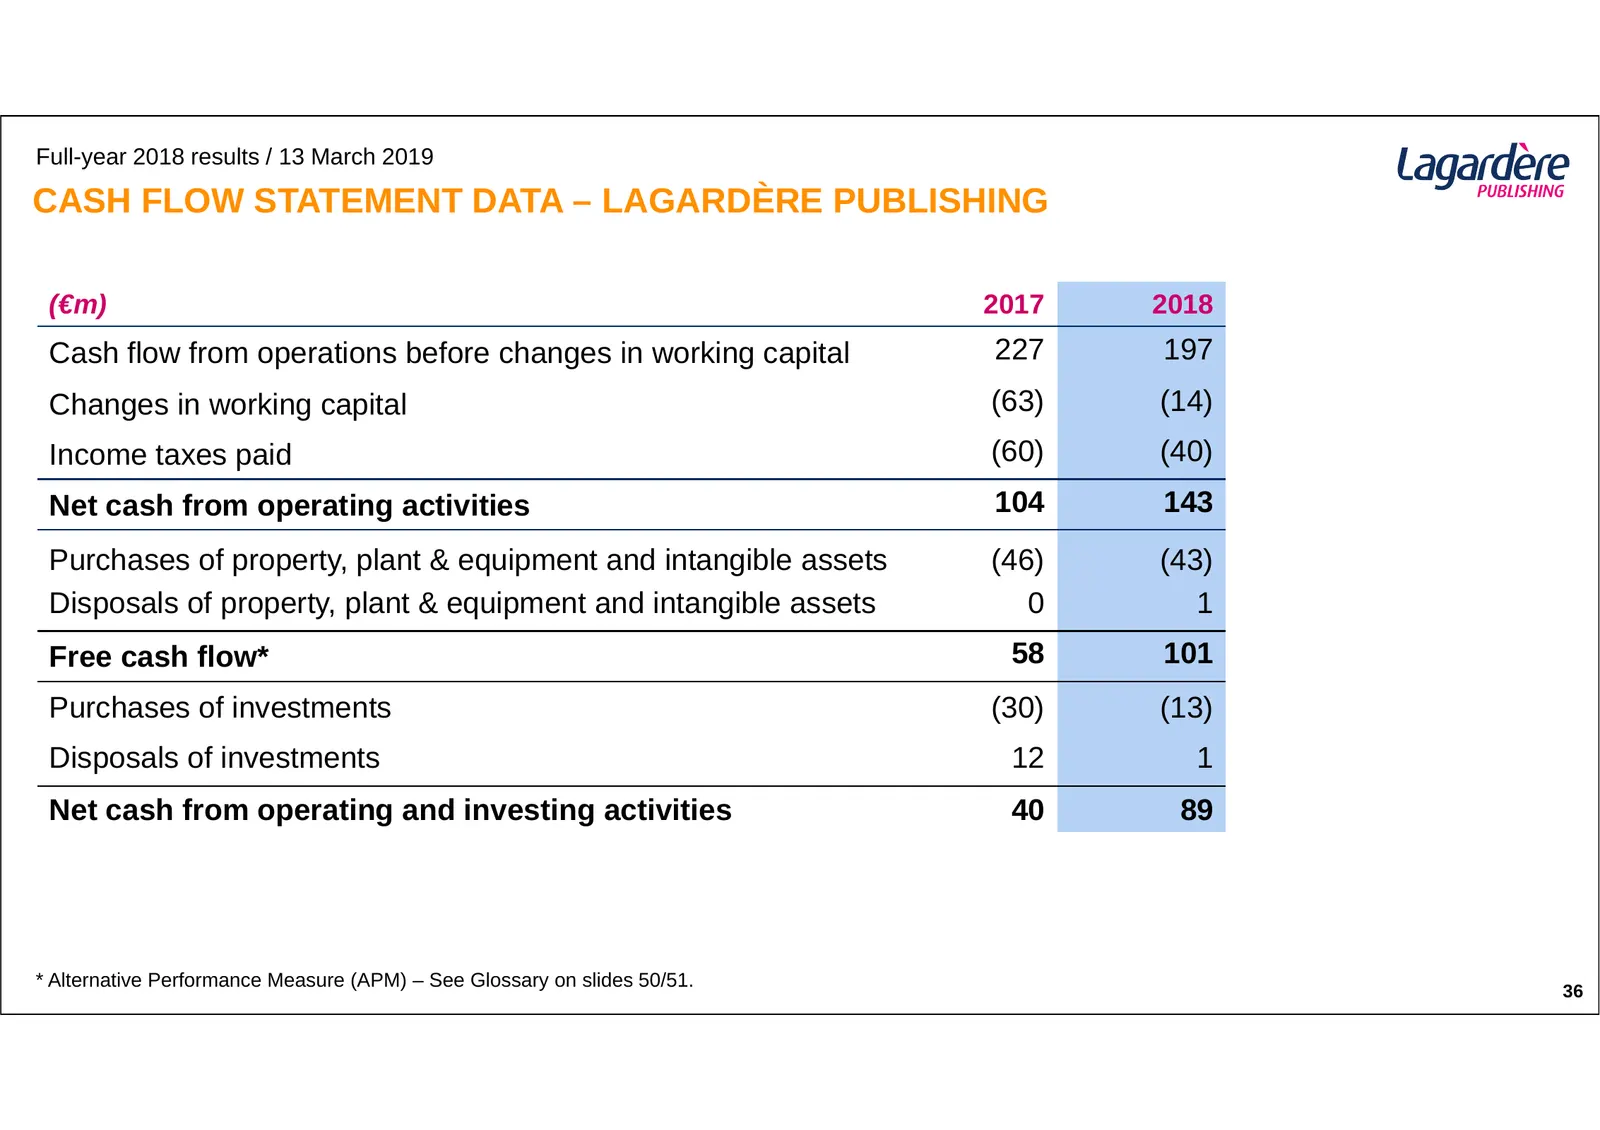
Slide 35: Cash Flow Statement Data – Lagardère Publishing
Full-year 2018 results / 13 March 2019 CASH FLOW STATEMENT DATA – LAGARDÈRE PUBLISHING (€m) 2017 2018 Cash flow from operations before changes in working capital 227 197 Changes in working capital (63) (14) Income taxes paid (60) (40) Net cash from operating activities 104 143 Purchases of property,
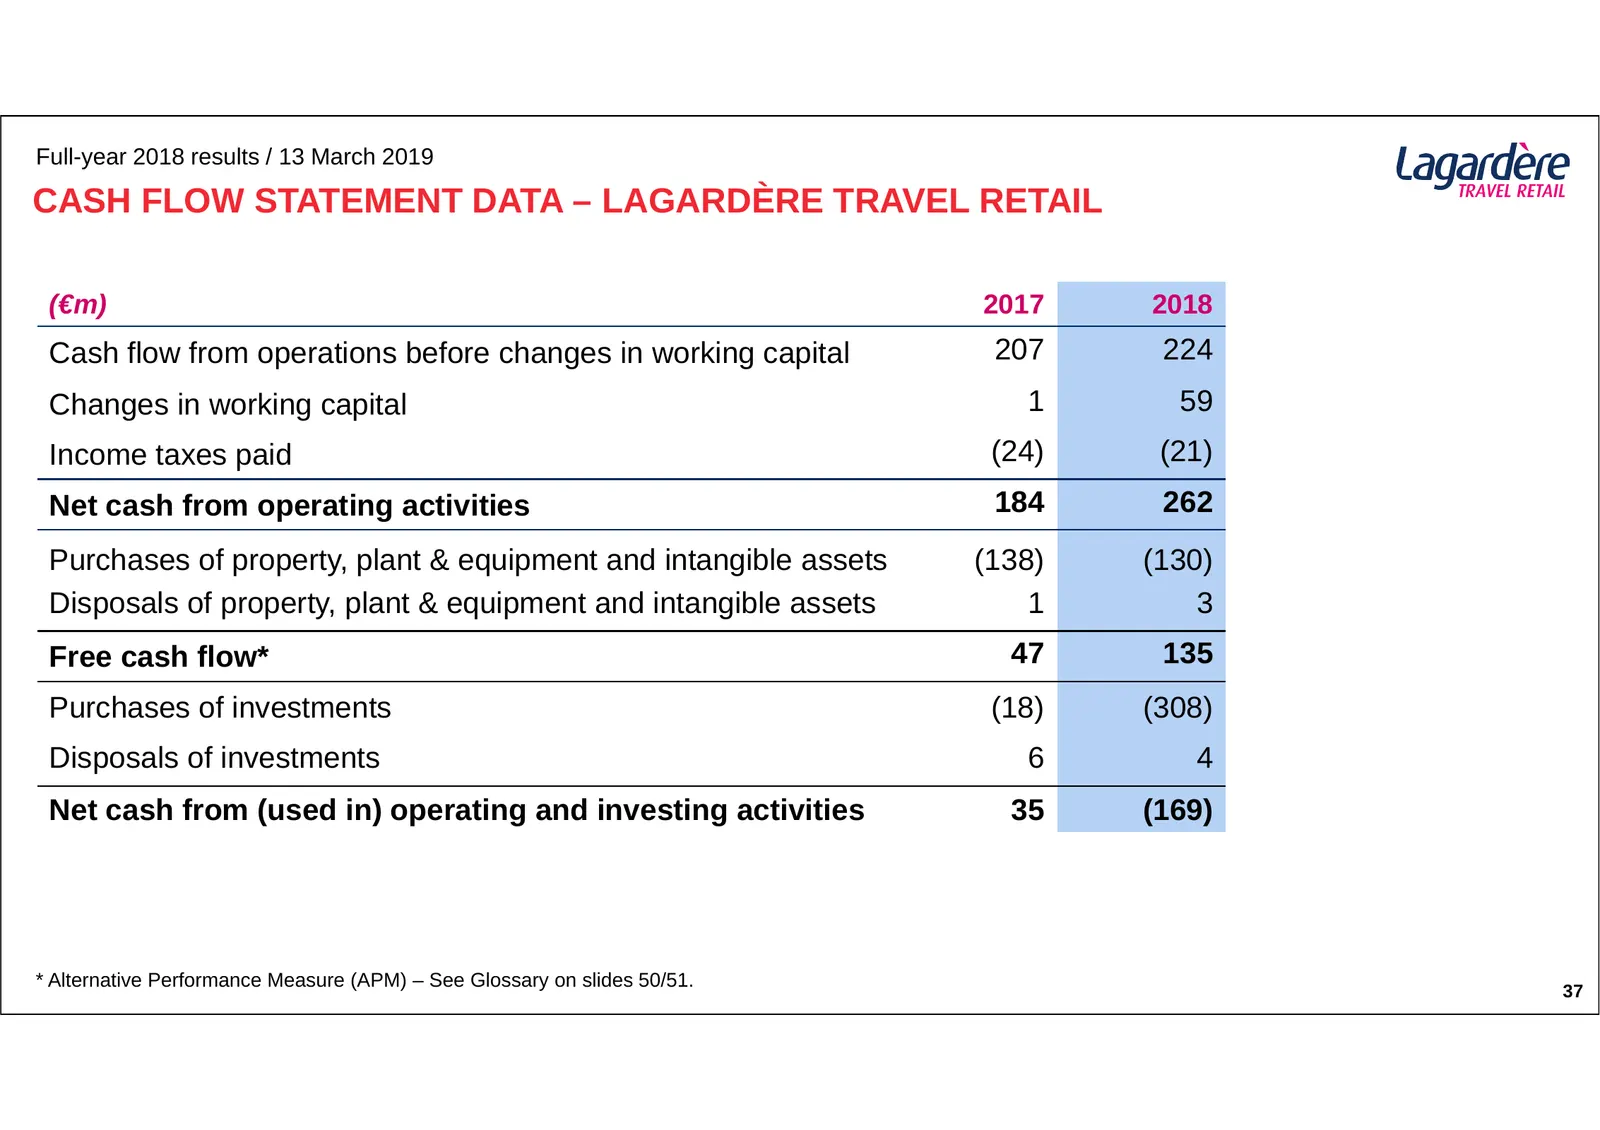
Slide 36: Cash Flow Statement Data – Lagardère Travel Retail
Full-year 2018 results / 13 March 2019 CASH FLOW STATEMENT DATA – LAGARDÈRE TRAVEL RETAIL (€m) 2017 2018 Cash flow from operations before changes in working capital 207 224 Changes in working capital 1 59 Income taxes paid (24) (21) Net cash from operating activities 184 262 Purchases of property, p
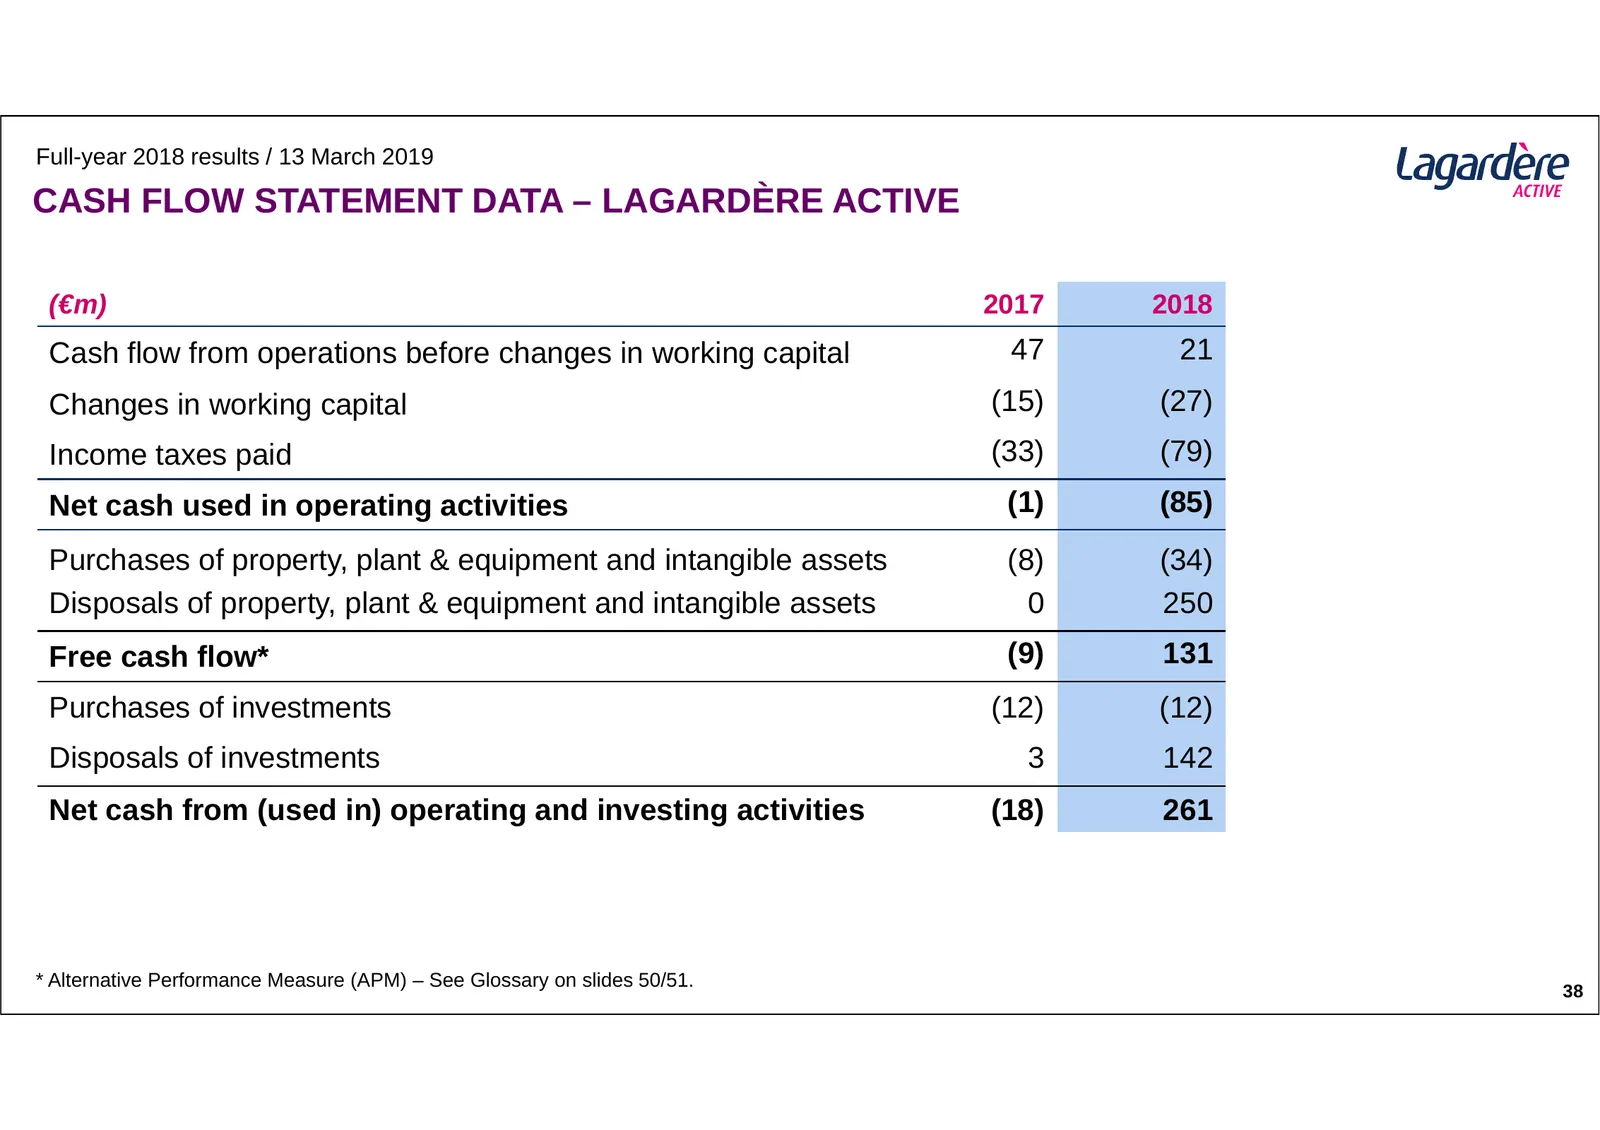
Slide 37: Cash Flow Statement Data – Lagardère Active
Full-year 2018 results / 13 March 2019 CASH FLOW STATEMENT DATA – LAGARDÈRE ACTIVE (€m) 2017 2018 Cash flow from operations before changes in working capital 47 21 Changes in working capital (15) (27) Income taxes paid (33) (79) Net cash used in operating activities (1) (85) Purchases of property, p
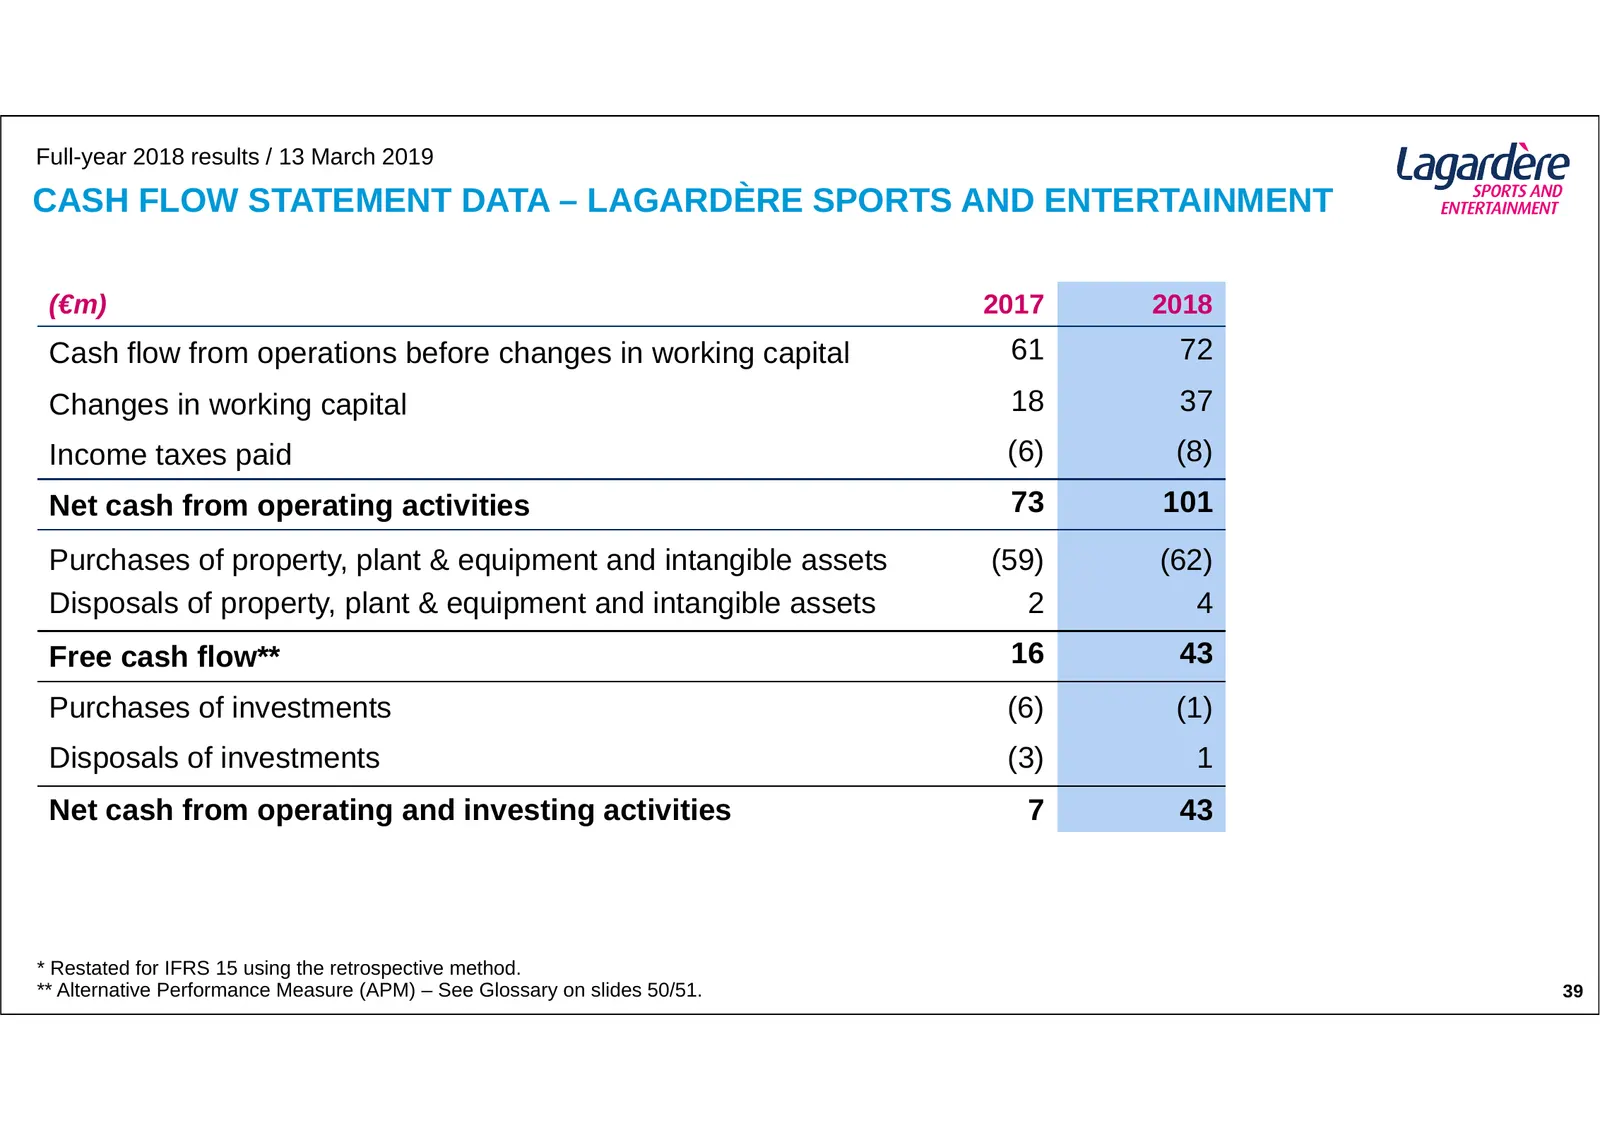
Slide 38: Cash Flow Statement Data – Lagardère Sports and Entertainment
Full-year 2018 results / 13 March 2019 CASH FLOW STATEMENT DATA – LAGARDÈRE SPORTS AND ENTERTAINMENT (€m) 2017 2018 Cash flow from operations before changes in working capital 61 72 Changes in working capital 18 37 Income taxes paid (6) (8) Net cash from operating activities 73 101 Purchases of prop
Slide 39: Consolidated Balance Sheet
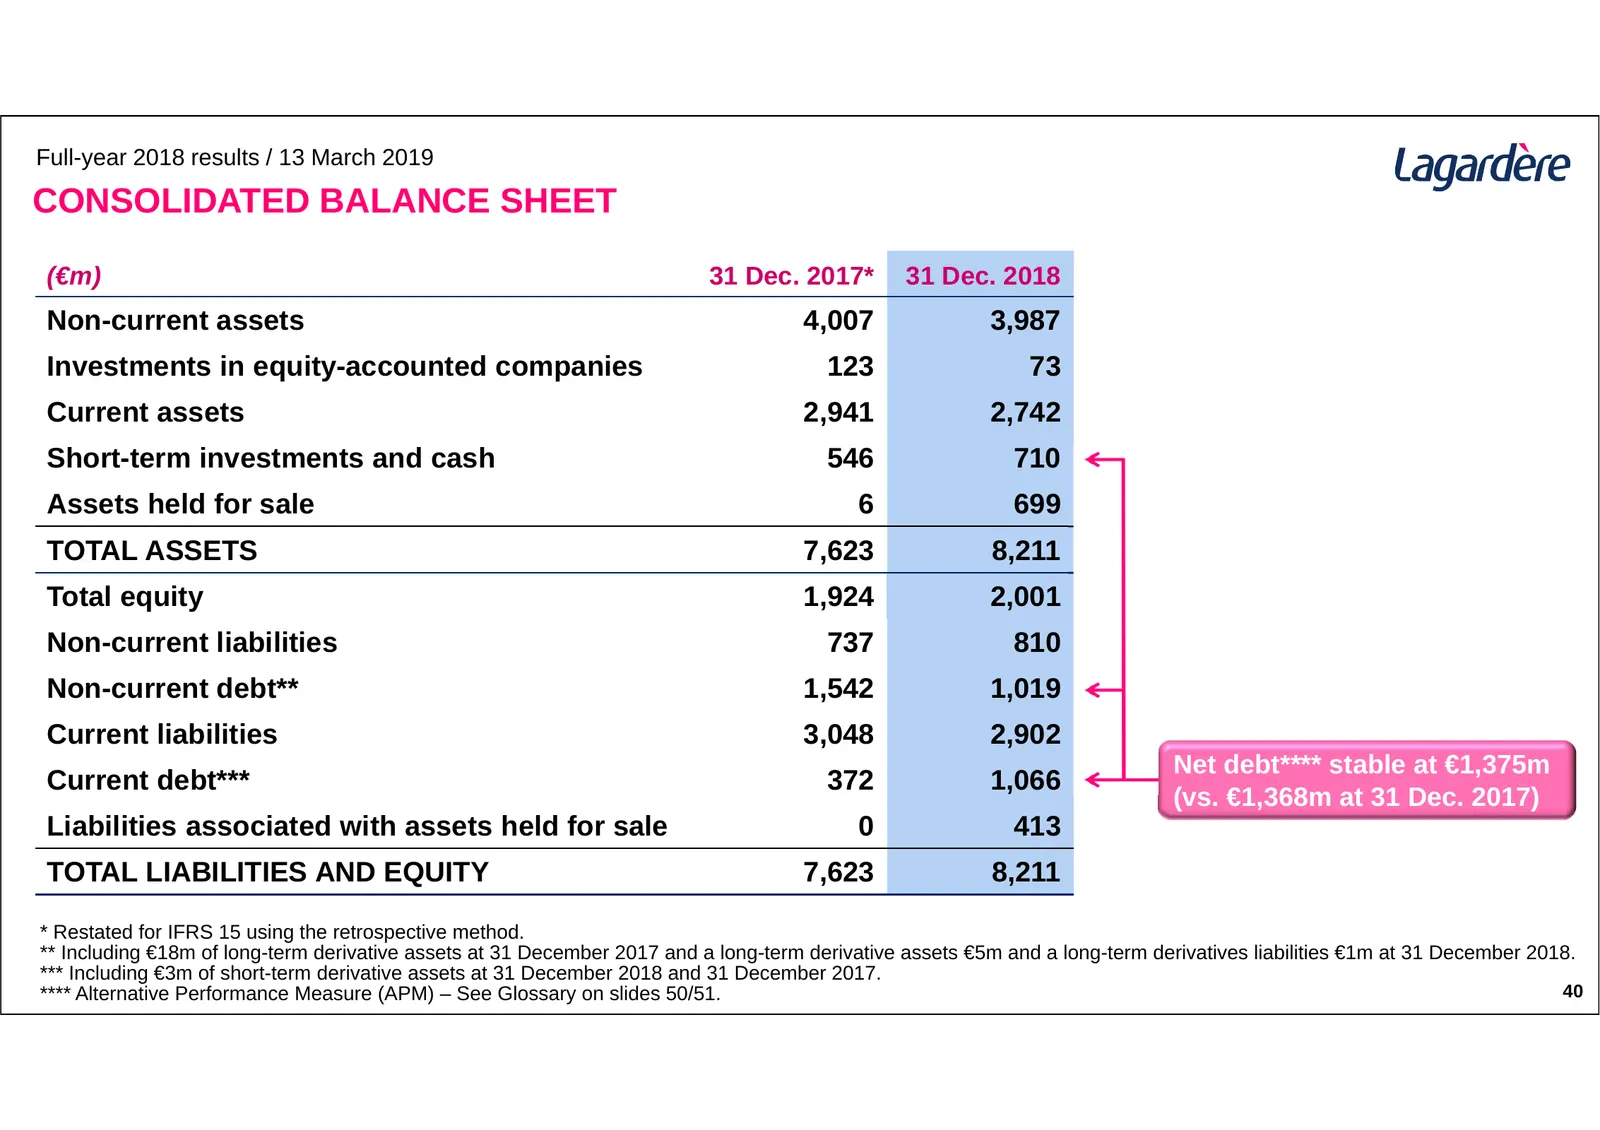
Full-year 2018 results / 13 March 2019 CONSOLIDATED BALANCE SHEET (€m) 31 Dec. 2017* 31 Dec. 2018 Non-current assets 4,007 3,987 Investments in equity-accounted companies 123 73 Current assets 2,941 2,742 Short-term investments and cash 546 710 Assets held for sale 6 699 TOTAL ASSETS 7,623 8,211 Tot
Slide 40: Off-Balance Sheet Commitments
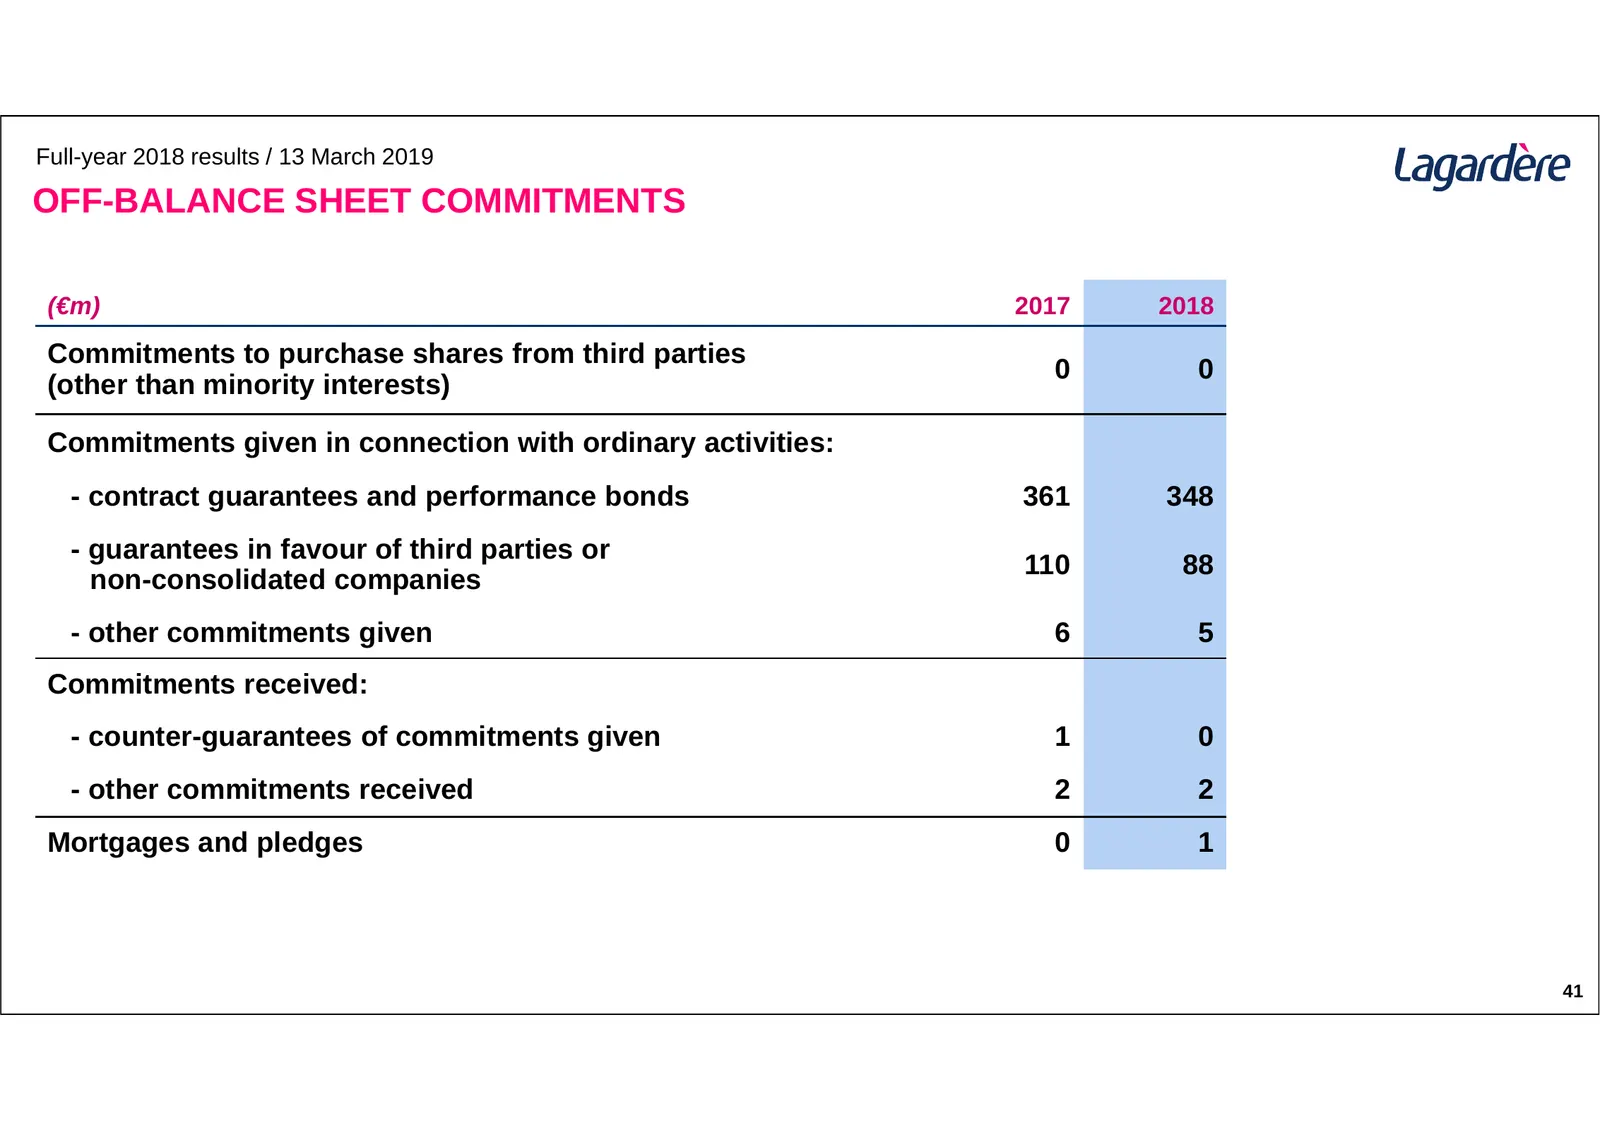
Full-year 2018 results / 13 March 2019 OFF-BALANCE SHEET COMMITMENTS (€m) 2017 2018 Commitments to purchase shares from third parties 0 0 (other than minority interests) Commitments given in connection with ordinary activities: - contract guarantees and performance bonds 361 348 - guarantees in favo
Slide 41: Lagardère Travel Retail Guaranteed Minimum Payments
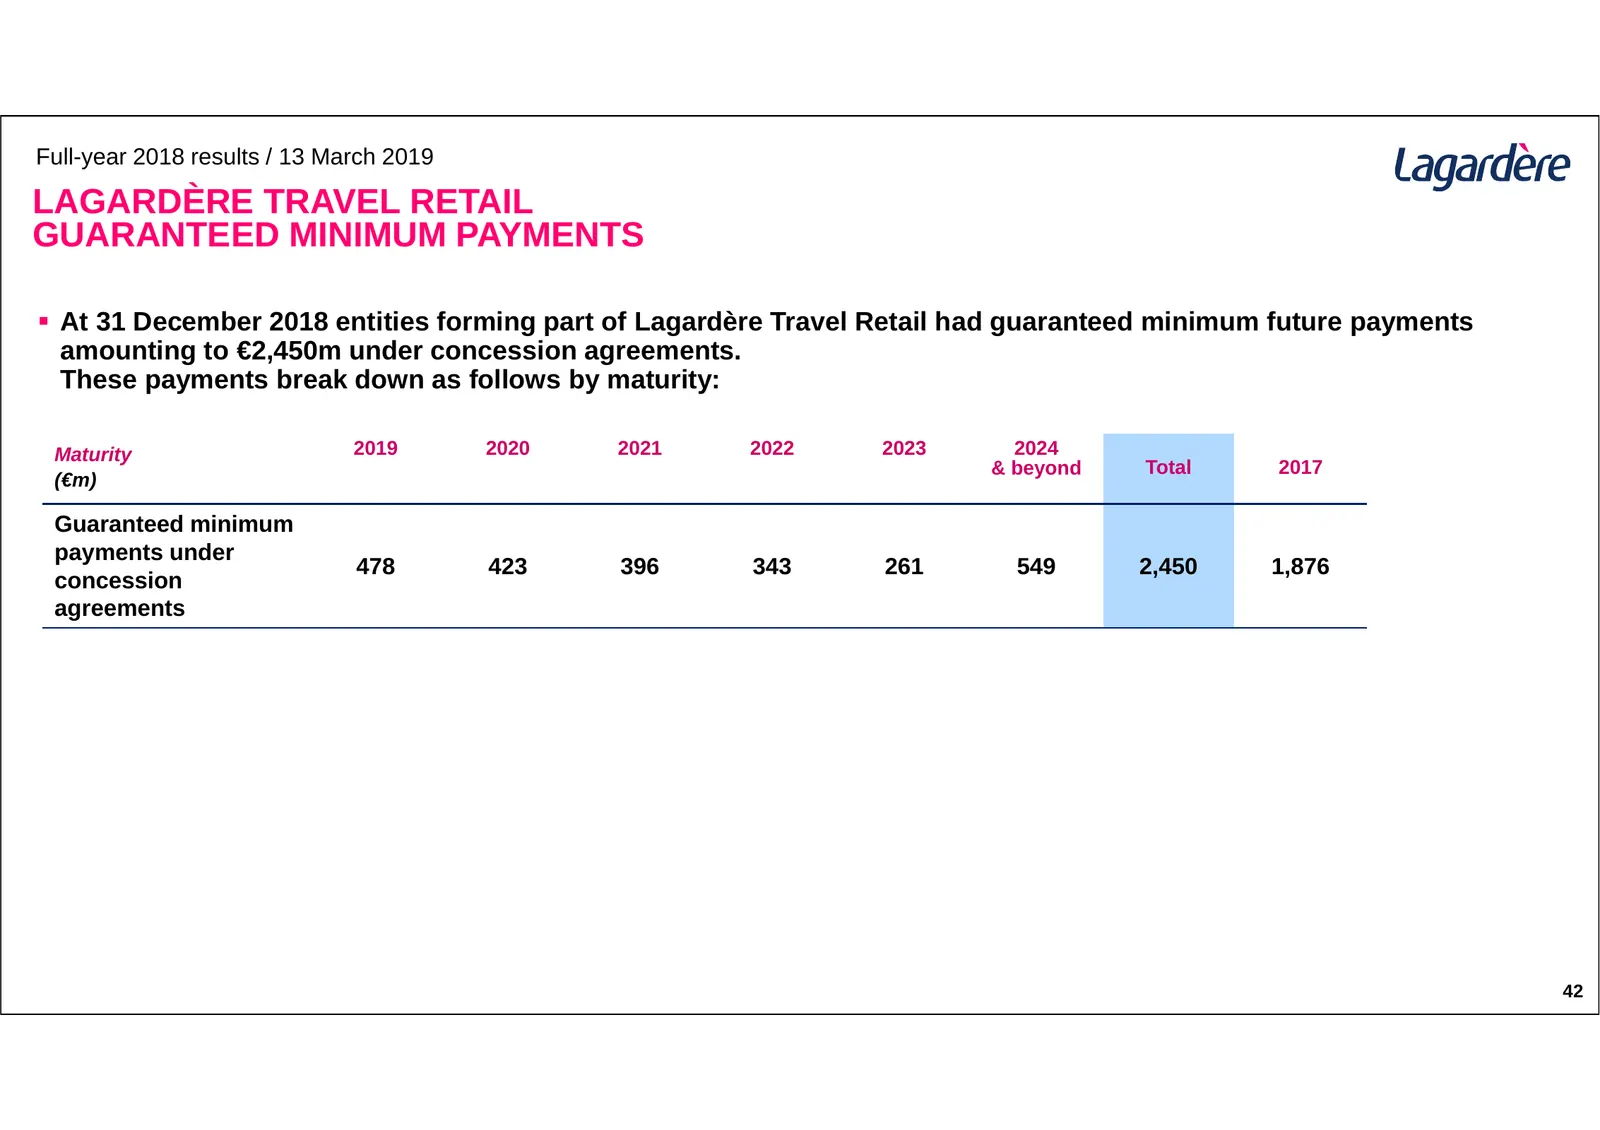
Full-year 2018 results / 13 March 2019 LAGARDÈRE TRAVEL RETAIL GUARANTEED MINIMUM PAYMENTS At 31 December 2018 entities forming part of Lagardère Travel Retail had guaranteed minimum future payments amounting to €2,450m under concession agreements. These payments break down as follows by maturity:
Slide 42: Lagardère Sports and Entertainment Guaranteed Minimum Payments
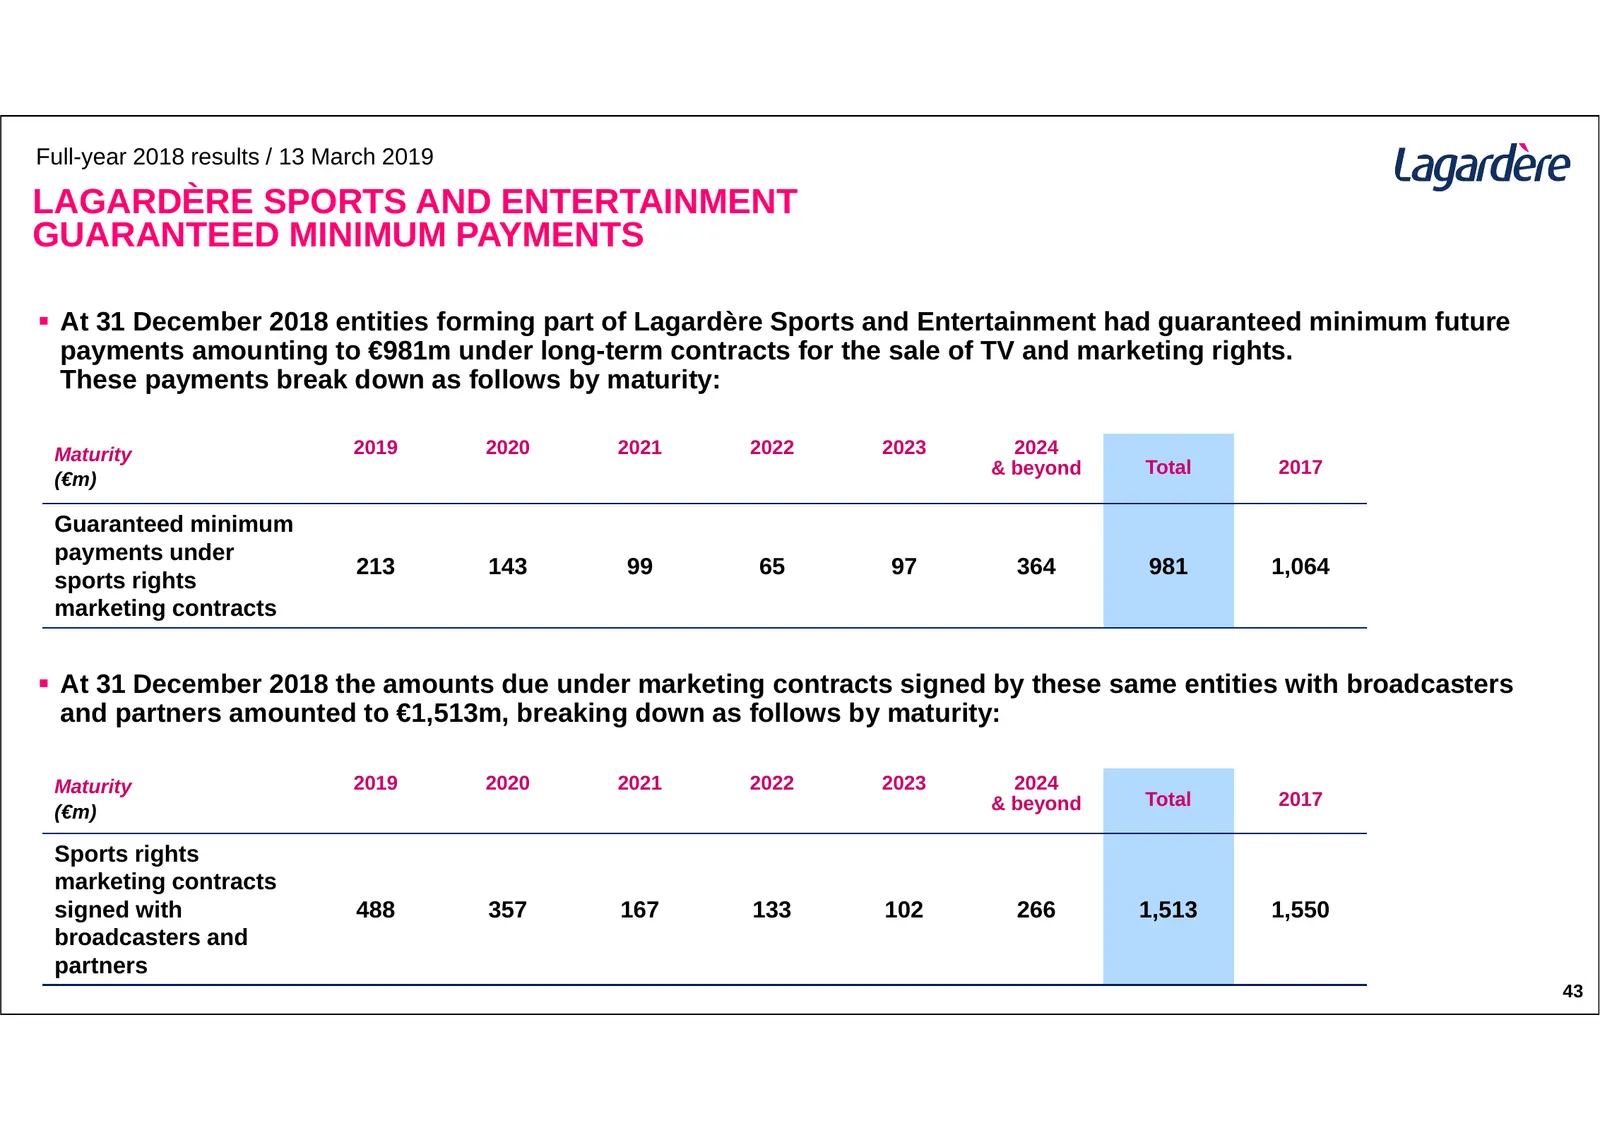
Full-year 2018 results / 13 March 2019 LAGARDÈRE SPORTS AND ENTERTAINMENT GUARANTEED MINIMUM PAYMENTS At 31 December 2018 entities forming part of Lagardère Sports and Entertainment had guaranteed minimum future payments amounting to €981m under long-term contracts for the sale of TV and marketing
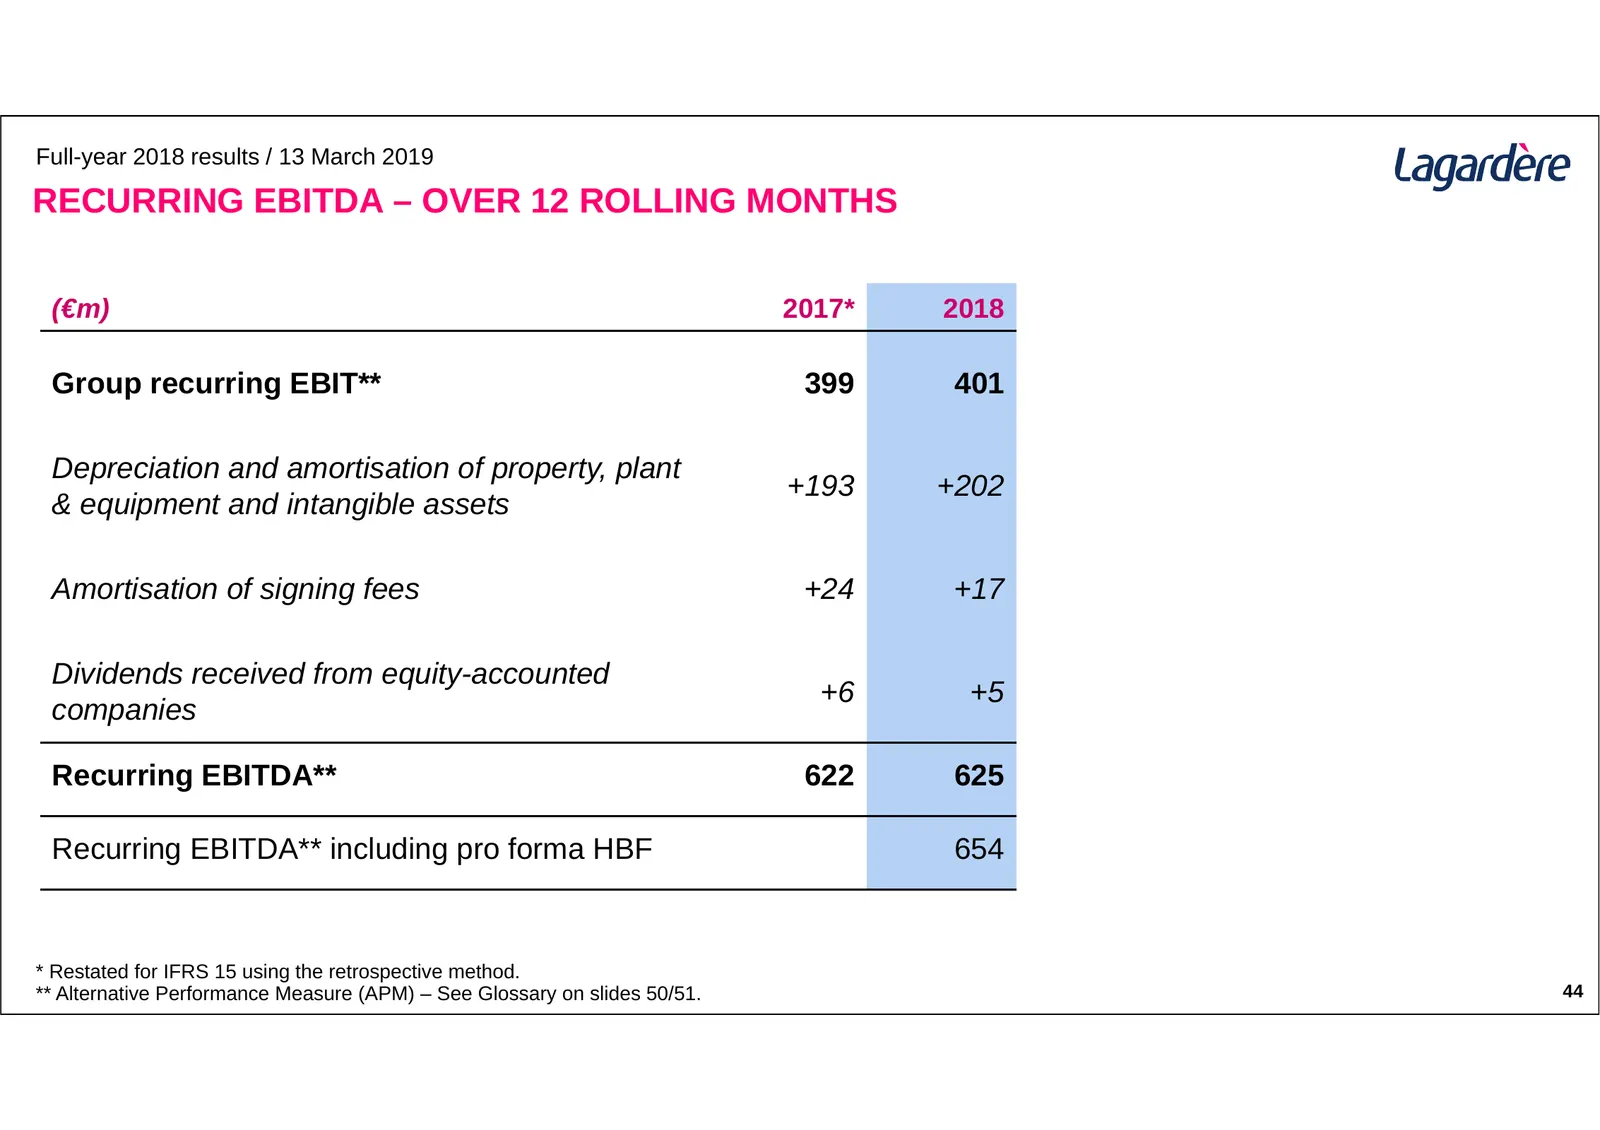
Slide 43: Recurring EBITDA – Over 12 Rolling Months
Full-year 2018 results / 13 March 2019 RECURRING EBITDA – OVER 12 ROLLING MONTHS (€m) 2017* 2018 Group recurring EBIT** 399 401 Depreciation and amortisation of property, plant +193 +202 & equipment and intangible assets Amortisation of signing fees +24 +17 Dividends received from equity-accounted +
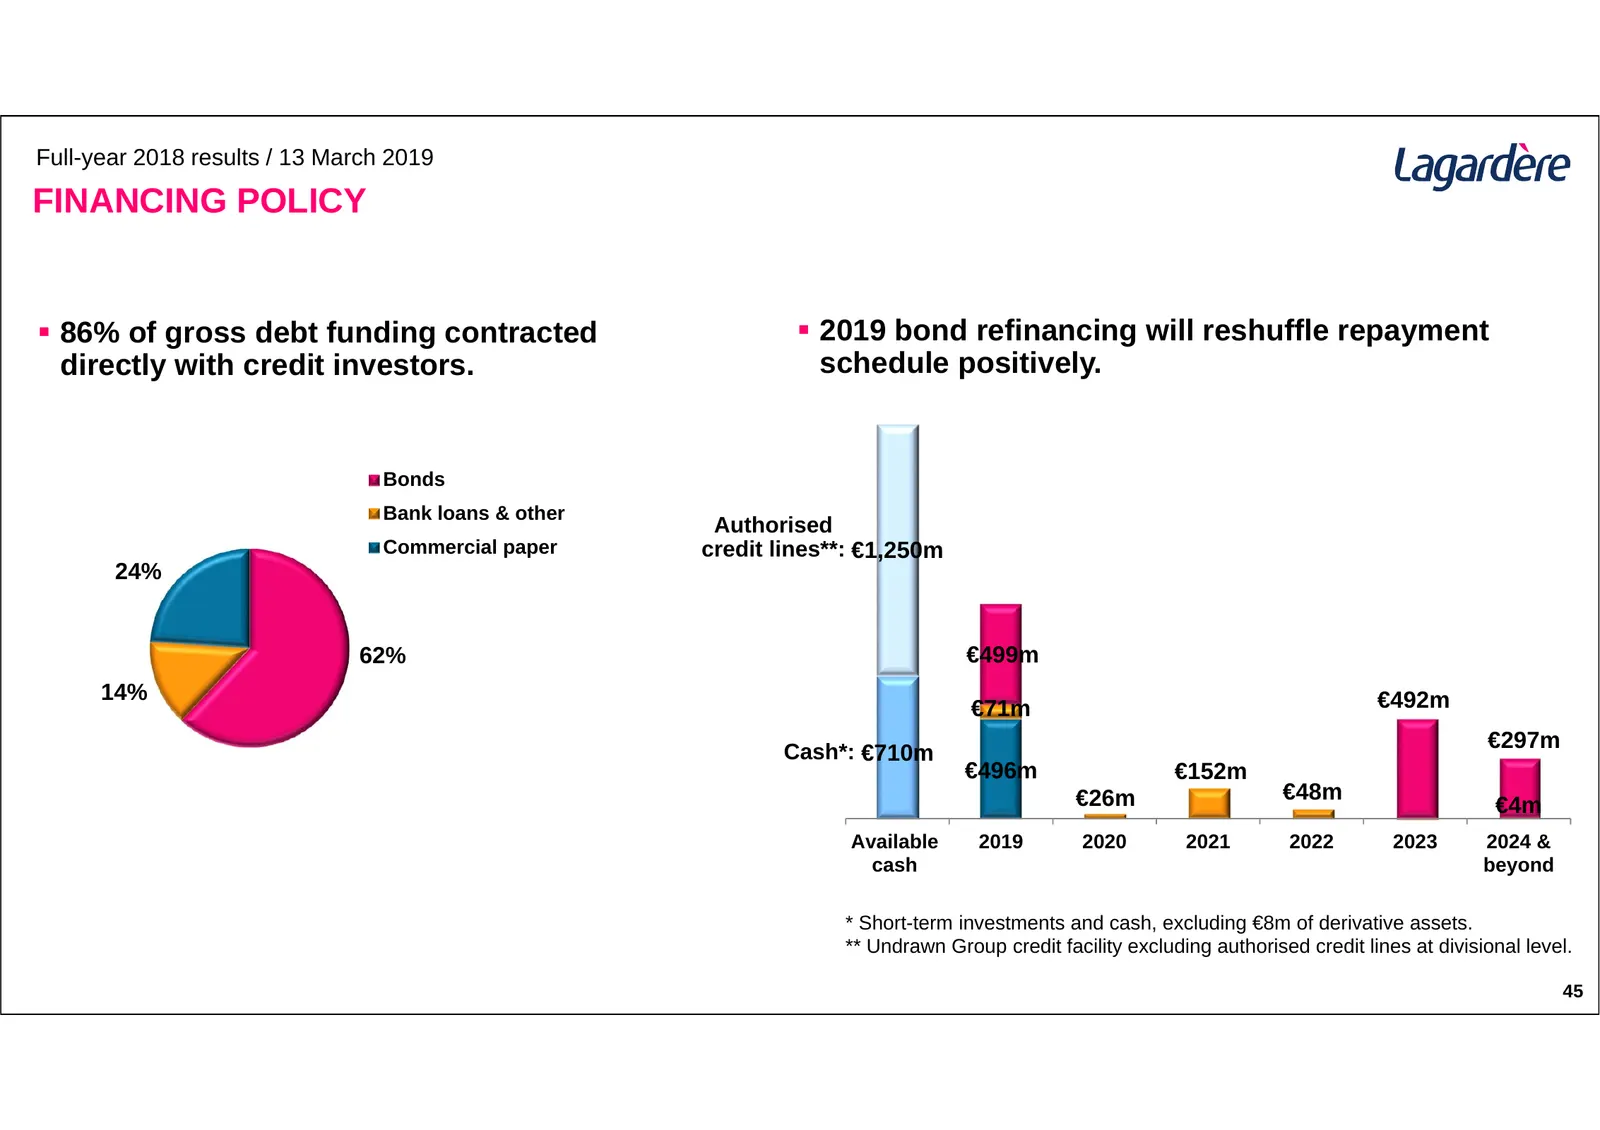
Slide 44: Financing Policy
Full-year 2018 results / 13 March 2019 FINANCING POLICY 86% of gross debt funding contracted 2019 bond refinancing will reshuffle repayment directly with credit investors. schedule positively. Bonds Bank loans & other Authorised Commercial paper credit lines**: €1,250m 24% 62% €499m 14% €492m €7
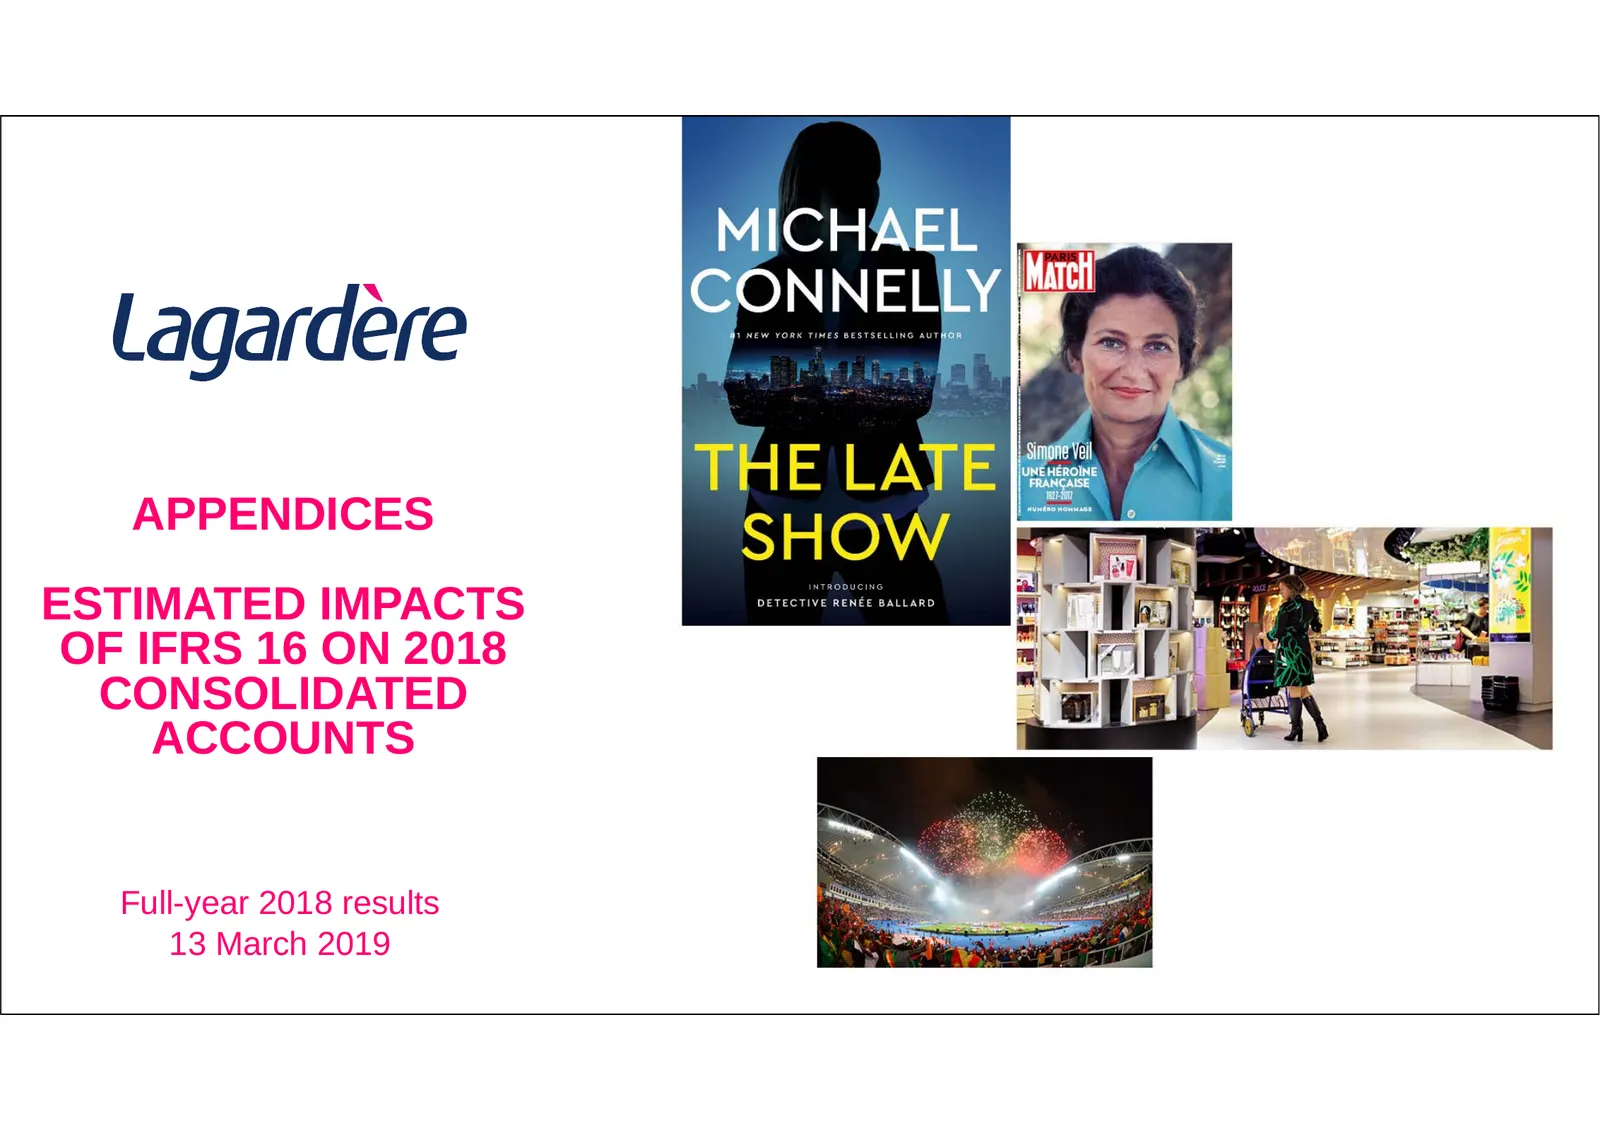
Slide 45: Appendices: Estimated Impacts of IFRS 16 on 2018
APPENDICES ESTIMATED IMPACTS OF IFRS 16 ON 2018 CONSOLIDATED ACCOUNTS Full-year 2018 results 13 March 2019
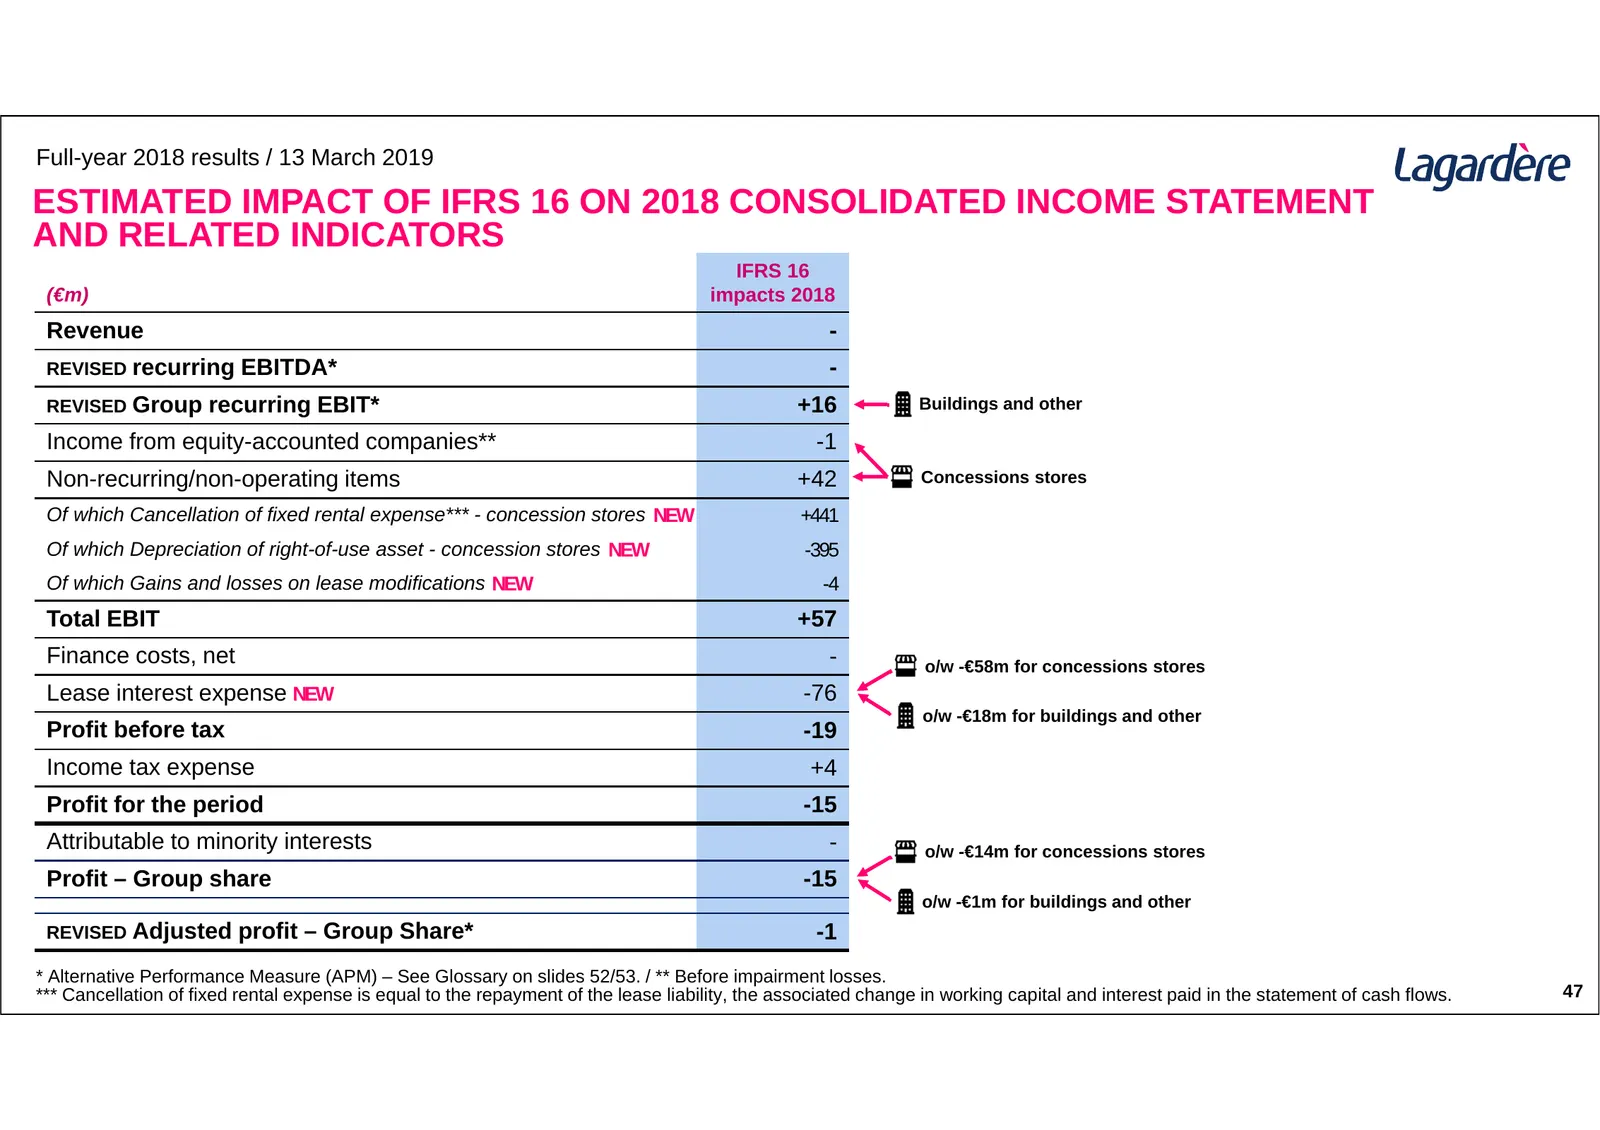
Slide 46: Estimated Impact of IFRS 16 on 2018 Consolidated Income Statement
Full-year 2018 results / 13 March 2019 ESTIMATED IMPACT OF IFRS 16 ON 2018 CONSOLIDATED INCOME STATEMENT AND RELATED INDICATORS IFRS 16 (€m) impacts 2018 Revenue - REVISED recurring EBITDA* - REVISED Group recurring EBIT* +16 Buildings and other Income from equity-accounted companies** -1 Non-recurr
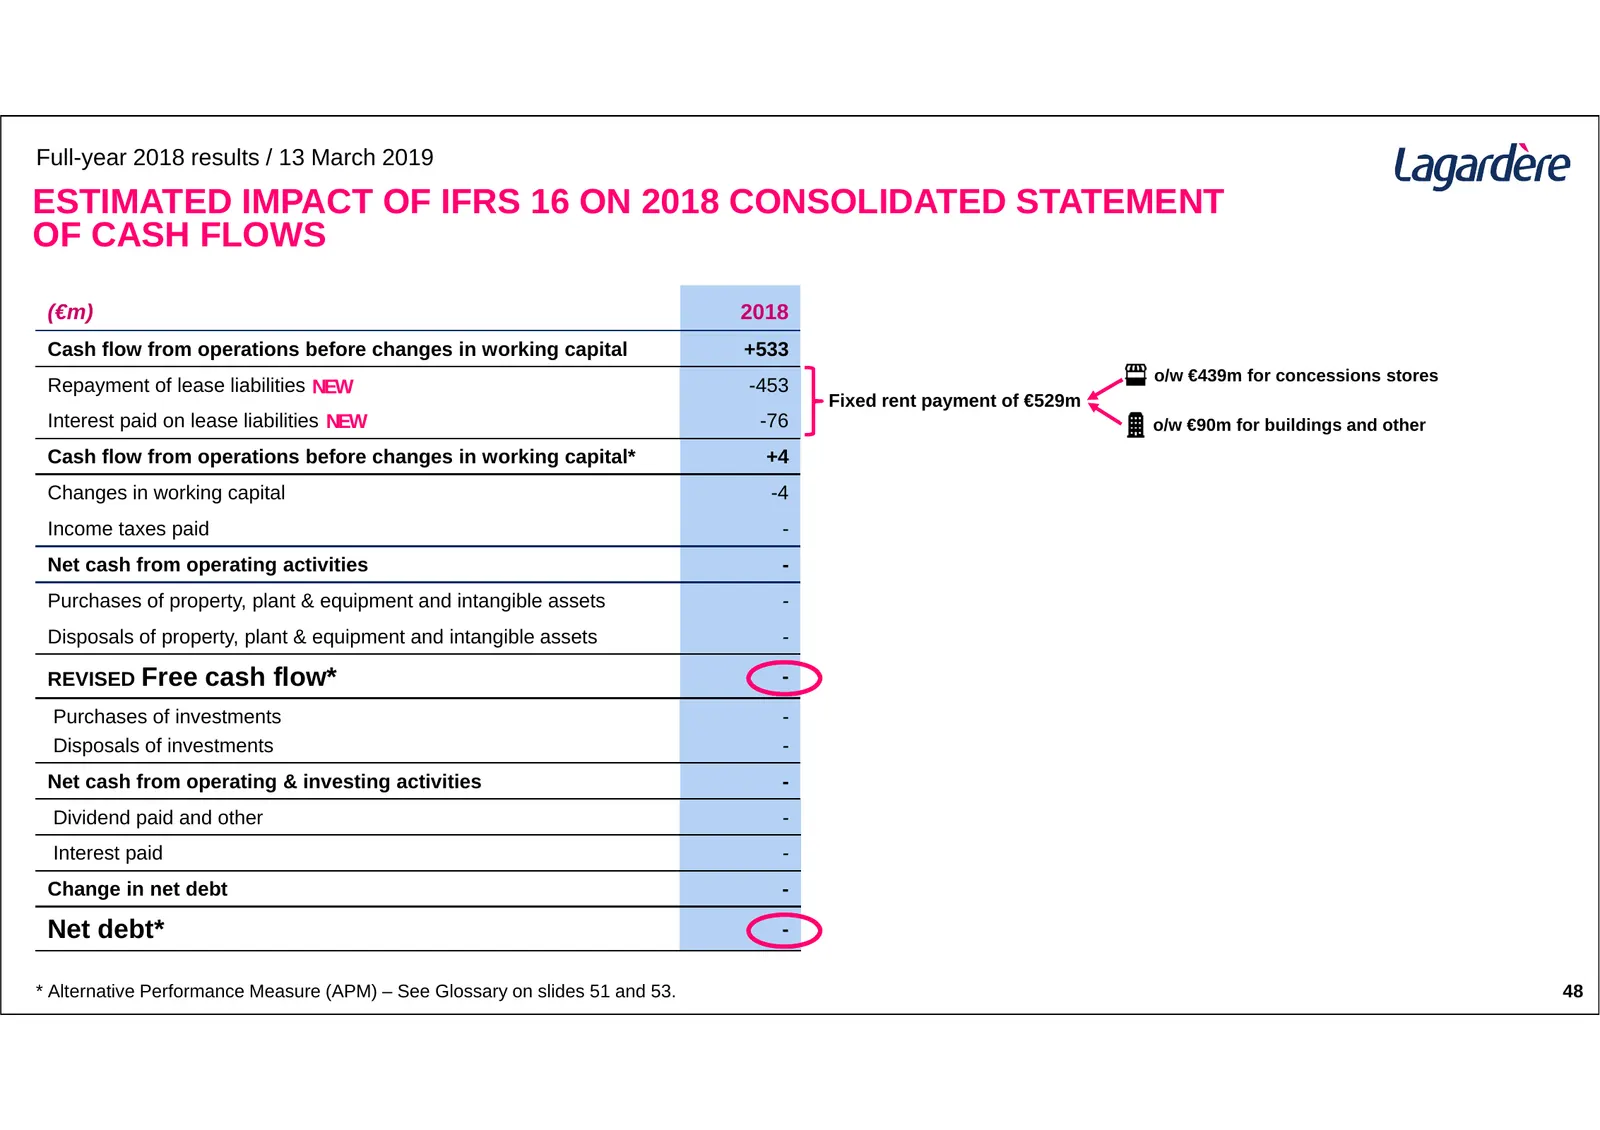
Slide 47: Estimated Impact of IFRS 16 on 2018 Consolidated Statement of Cash Flows
Full-year 2018 results / 13 March 2019 ESTIMATED IMPACT OF IFRS 16 ON 2018 CONSOLIDATED STATEMENT OF CASH FLOWS (€m) 2018 Cash flow from operations before changes in working capital +533 o/w €439m for concessions stores Repayment of lease liabilities NEW -453 Fixed rent payment of €529m Interest pai
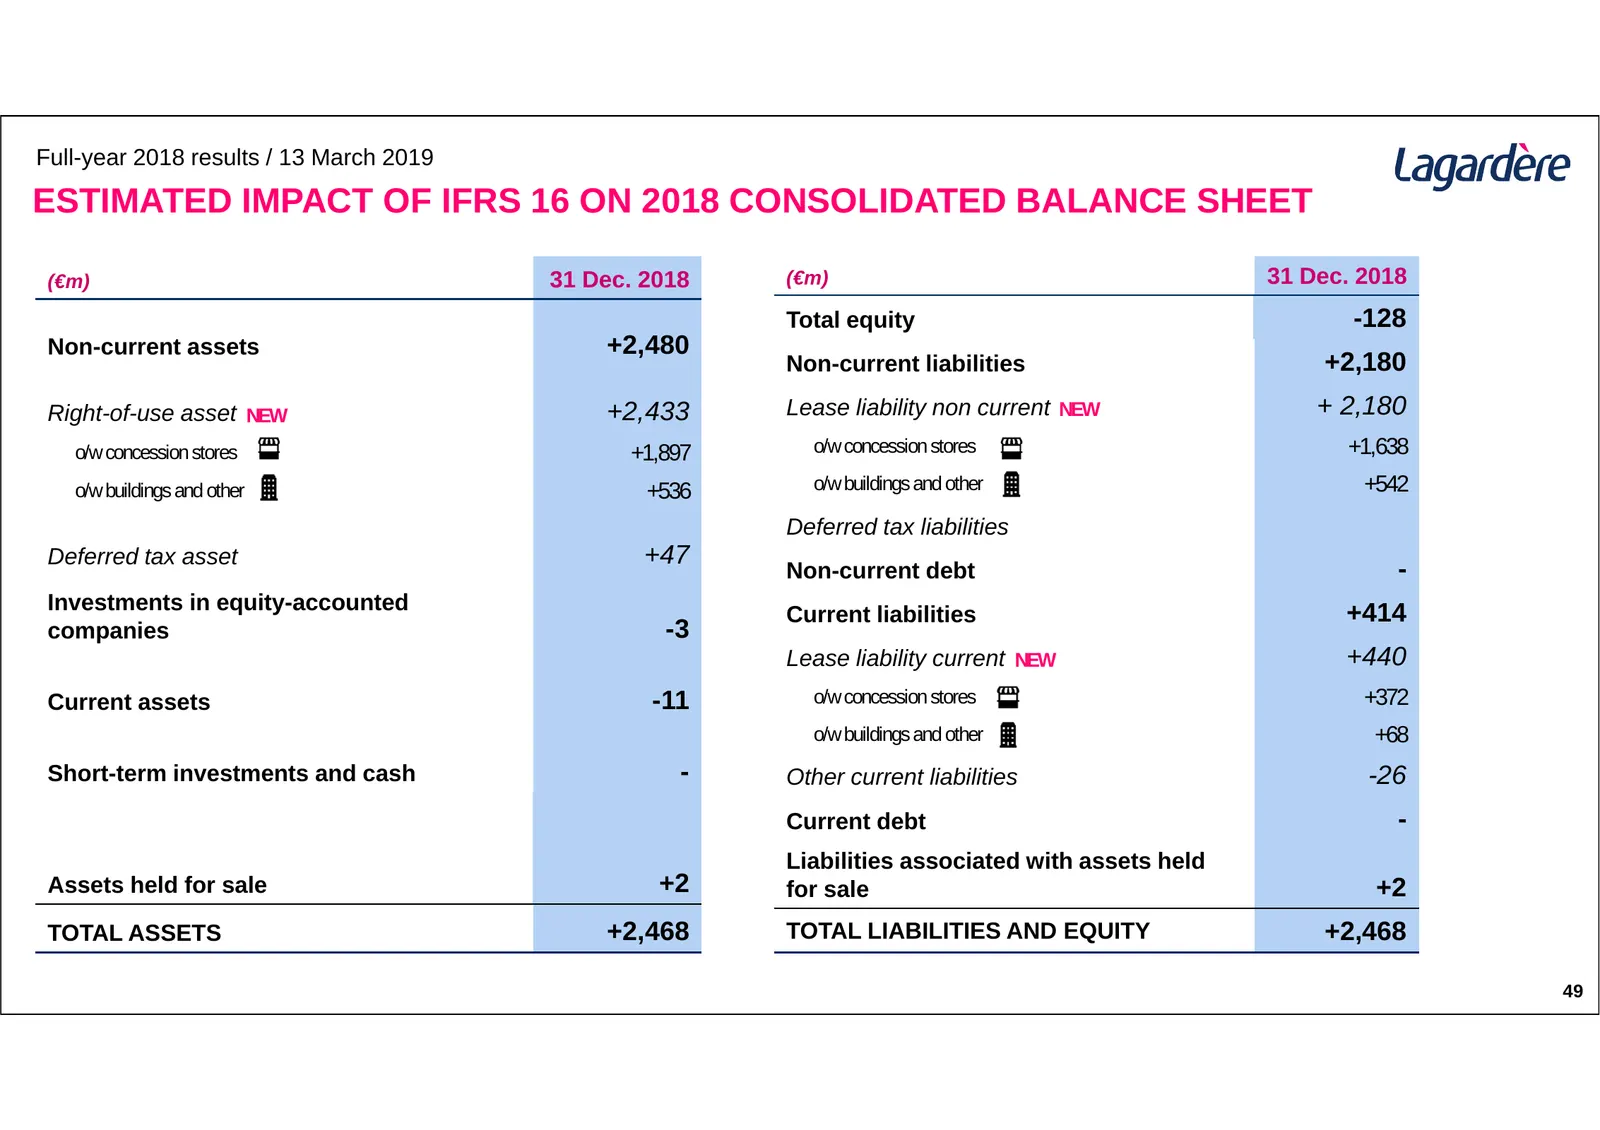
Slide 48: Estimated Impact of IFRS 16 on 2018 Consolidated Balance Sheet
Full-year 2018 results / 13 March 2019 ESTIMATED IMPACT OF IFRS 16 ON 2018 CONSOLIDATED BALANCE SHEET (€m) 31 Dec. 2018 (€m) 31 Dec. 2018 Total equity -128 Non-current assets +2,480 Non-current liabilities +2,180 Right-of-use asset NEW +2,433 Lease liability non current NEW + 2,180 o/w concession st
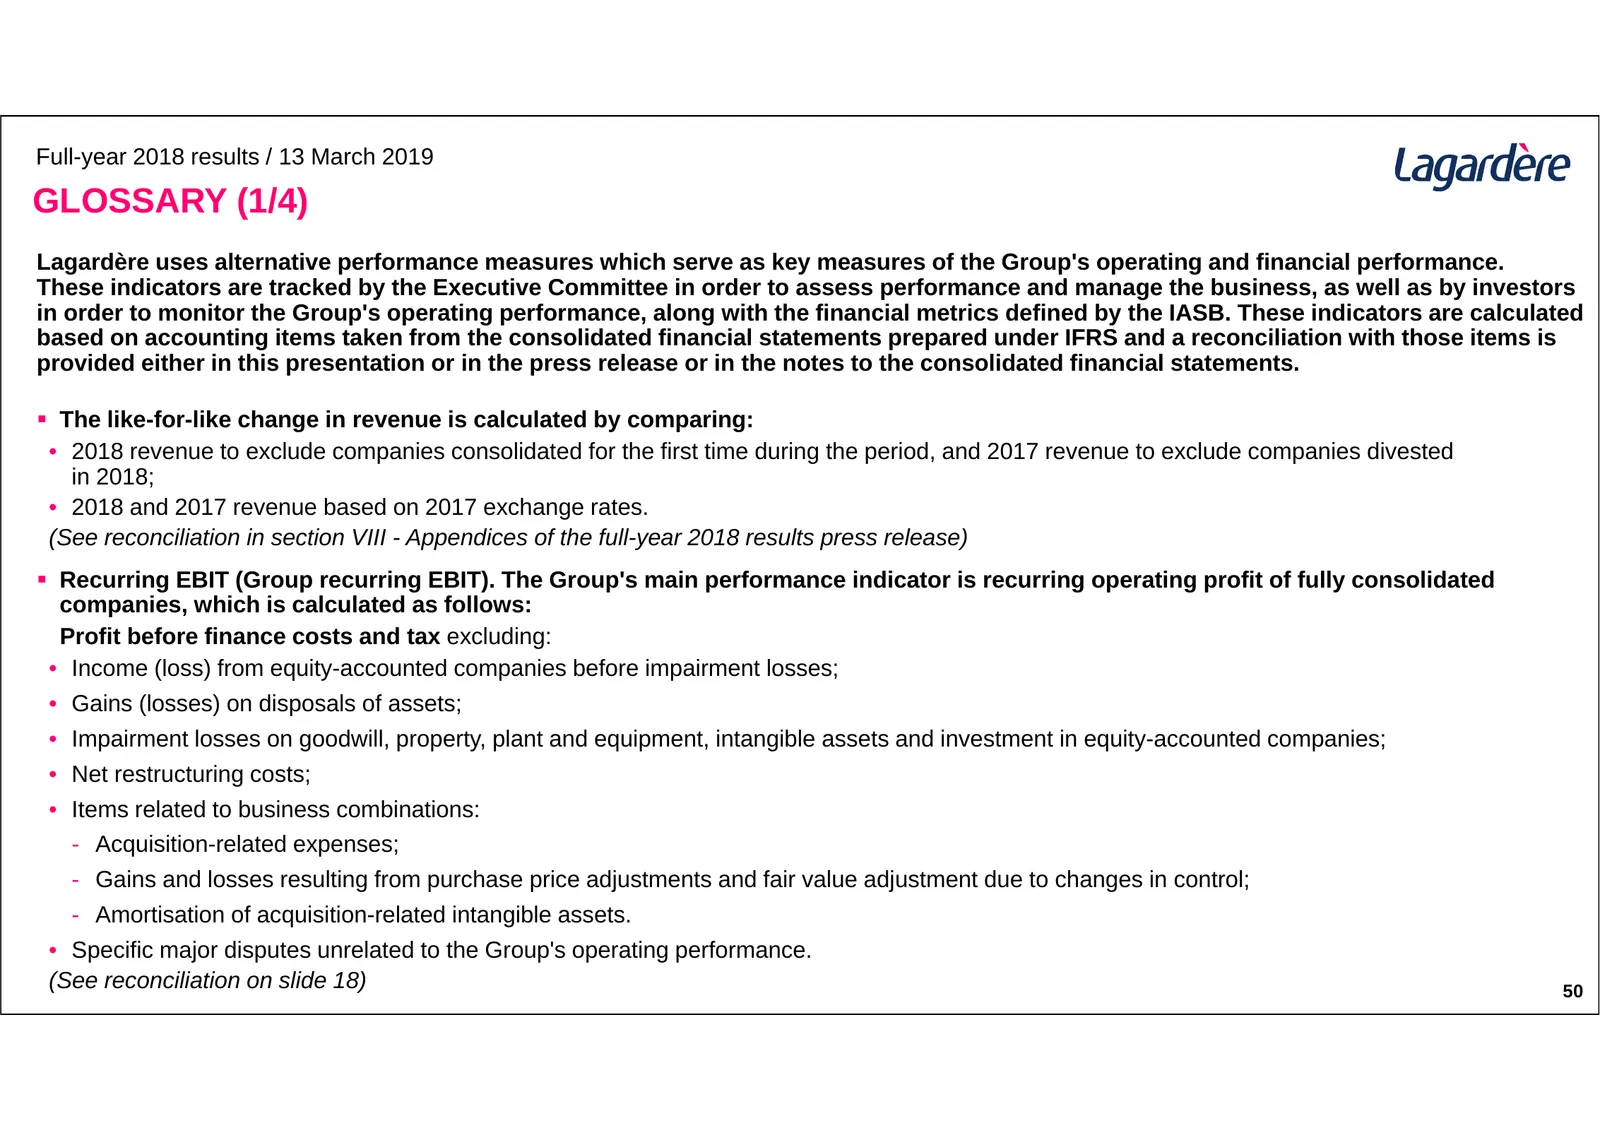
Slide 49: Glossary (1/4)
Full-year 2018 results / 13 March 2019 GLOSSARY (1/4) Lagardère uses alternative performance measures which serve as key measures of the Group's operating and financial performance. These indicators are tracked by the Executive Committee in order to assess performance and manage the business, as wel
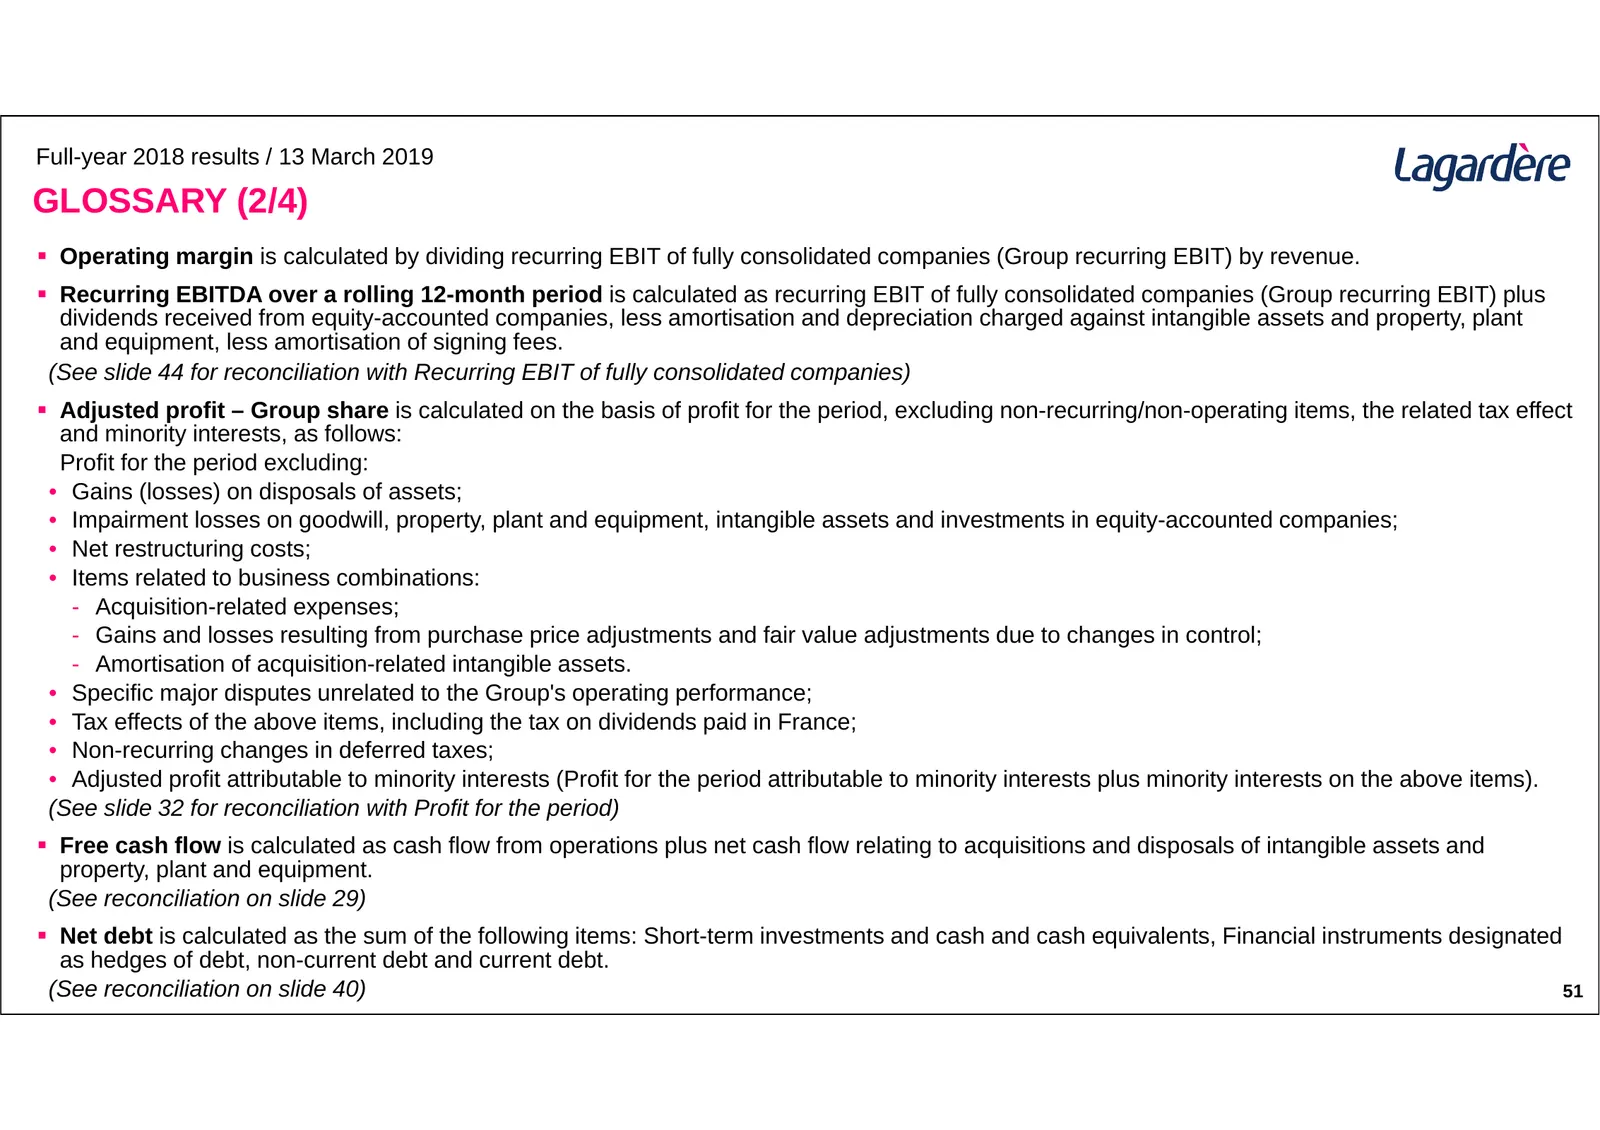
Slide 50: Glossary (2/4)
Full-year 2018 results / 13 March 2019 GLOSSARY (2/4) Operating margin is calculated by dividing recurring EBIT of fully consolidated companies (Group recurring EBIT) by revenue. Recurring EBITDA over a rolling 12-month period is calculated as recurring EBIT of fully consolidated companies (Grou
Slide 51: Glossary (3/4)
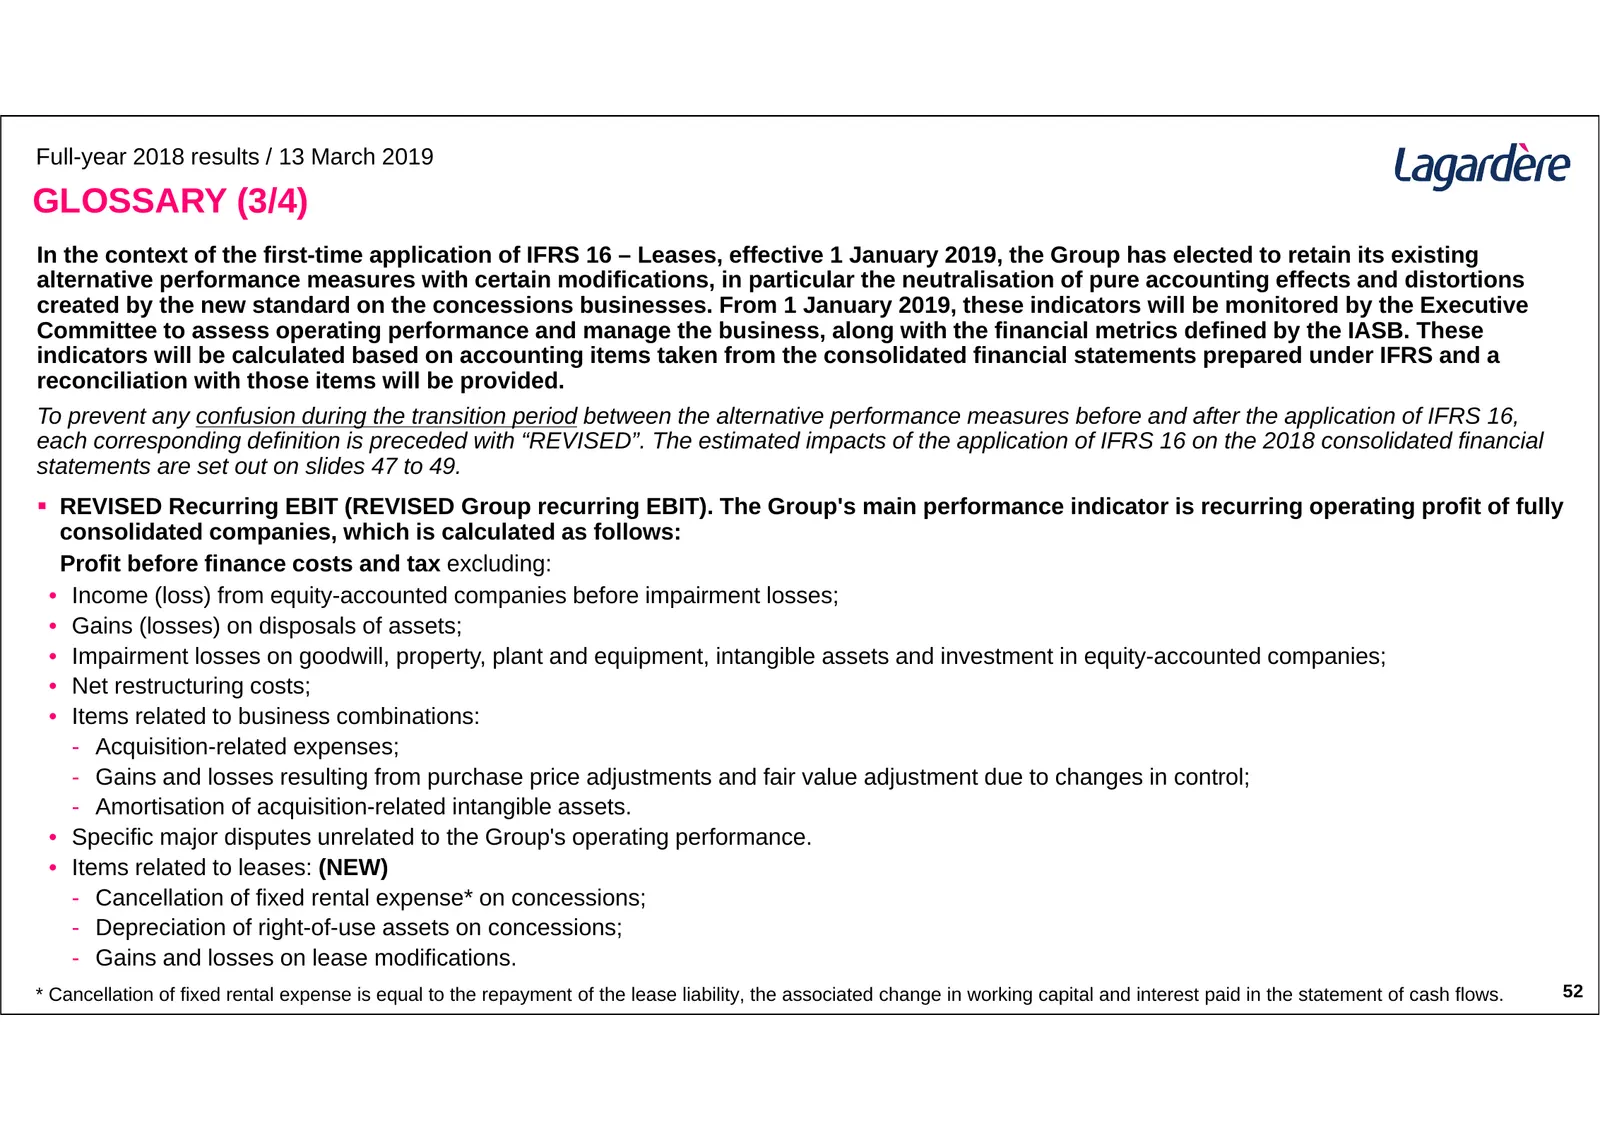
Full-year 2018 results / 13 March 2019 GLOSSARY (3/4) In the context of the first-time application of IFRS 16 – Leases, effective 1 January 2019, the Group has elected to retain its existing alternative performance measures with certain modifications, in particular the neutralisation of pure account
Slide 52: Glossary (4/4)
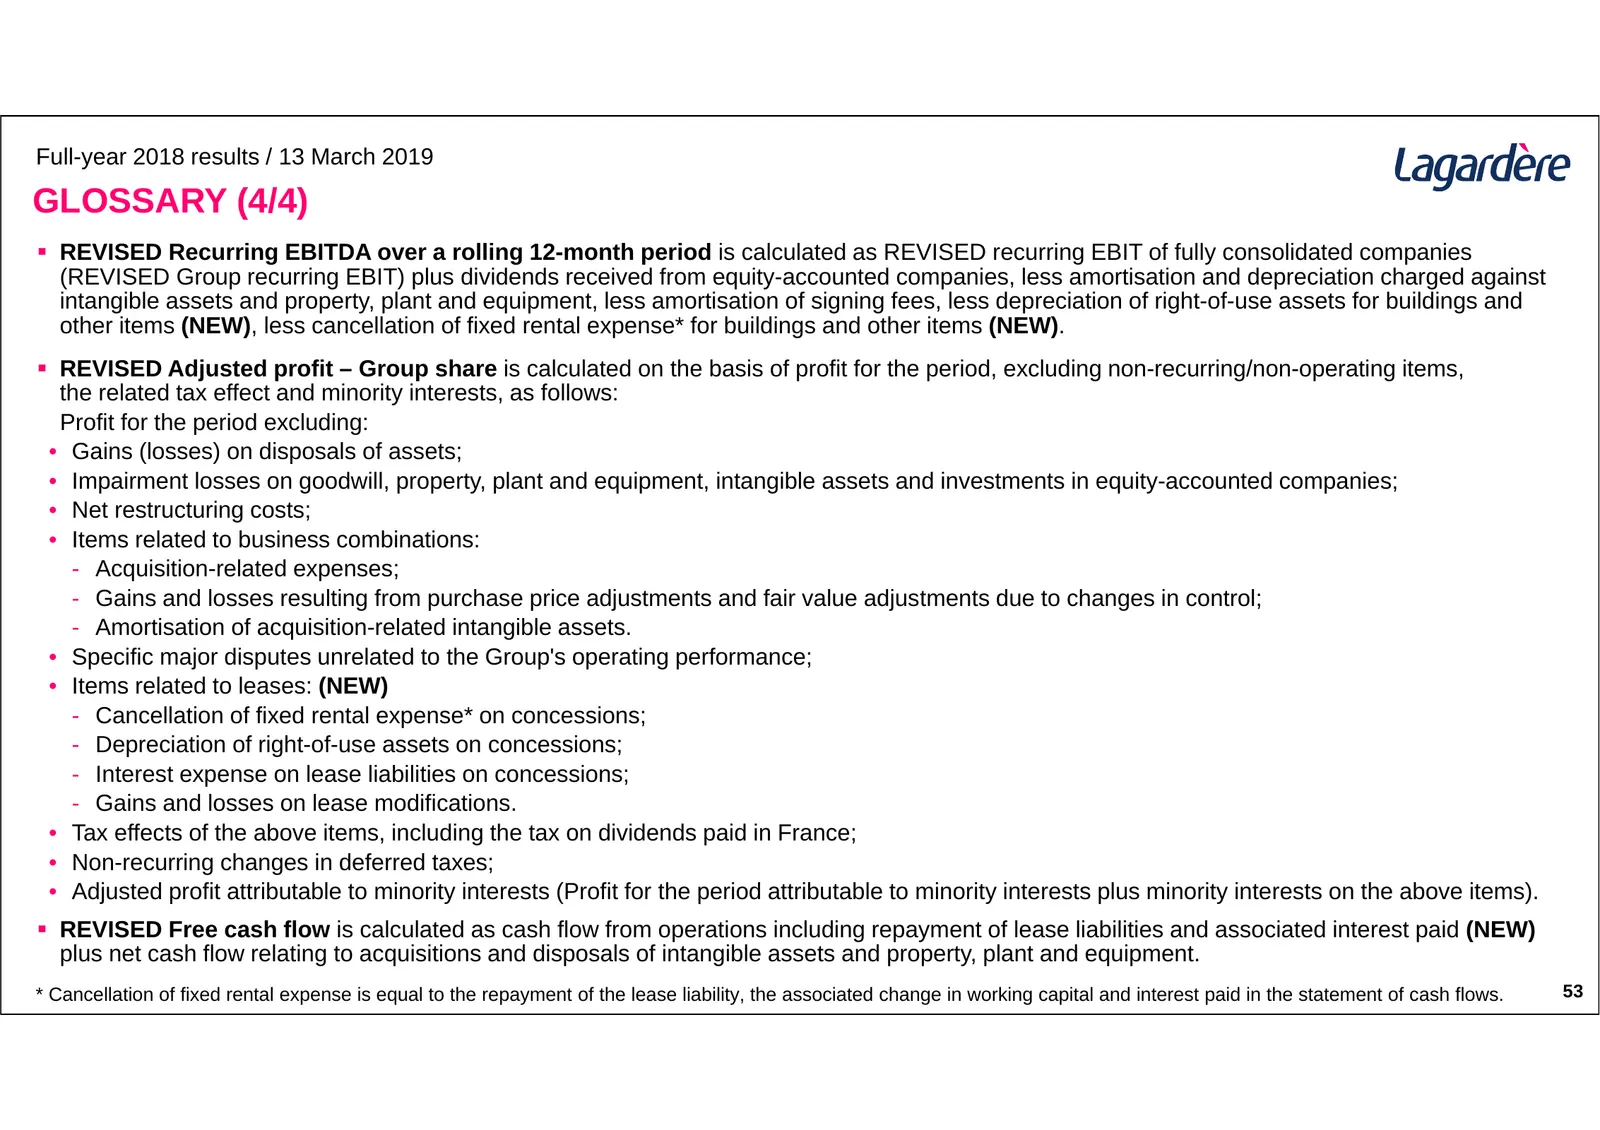
Full-year 2018 results / 13 March 2019 GLOSSARY (4/4) REVISED Recurring EBITDA over a rolling 12-month period is calculated as REVISED recurring EBIT of fully consolidated companies (REVISED Group recurring EBIT) plus dividends received from equity-accounted companies, less amortisation and deprec

Slide 53: Significant Events
SIGNIFICANT EVENTS Full-year 2018 results 13 March 2019
Slide 54: Background and Overall Performance
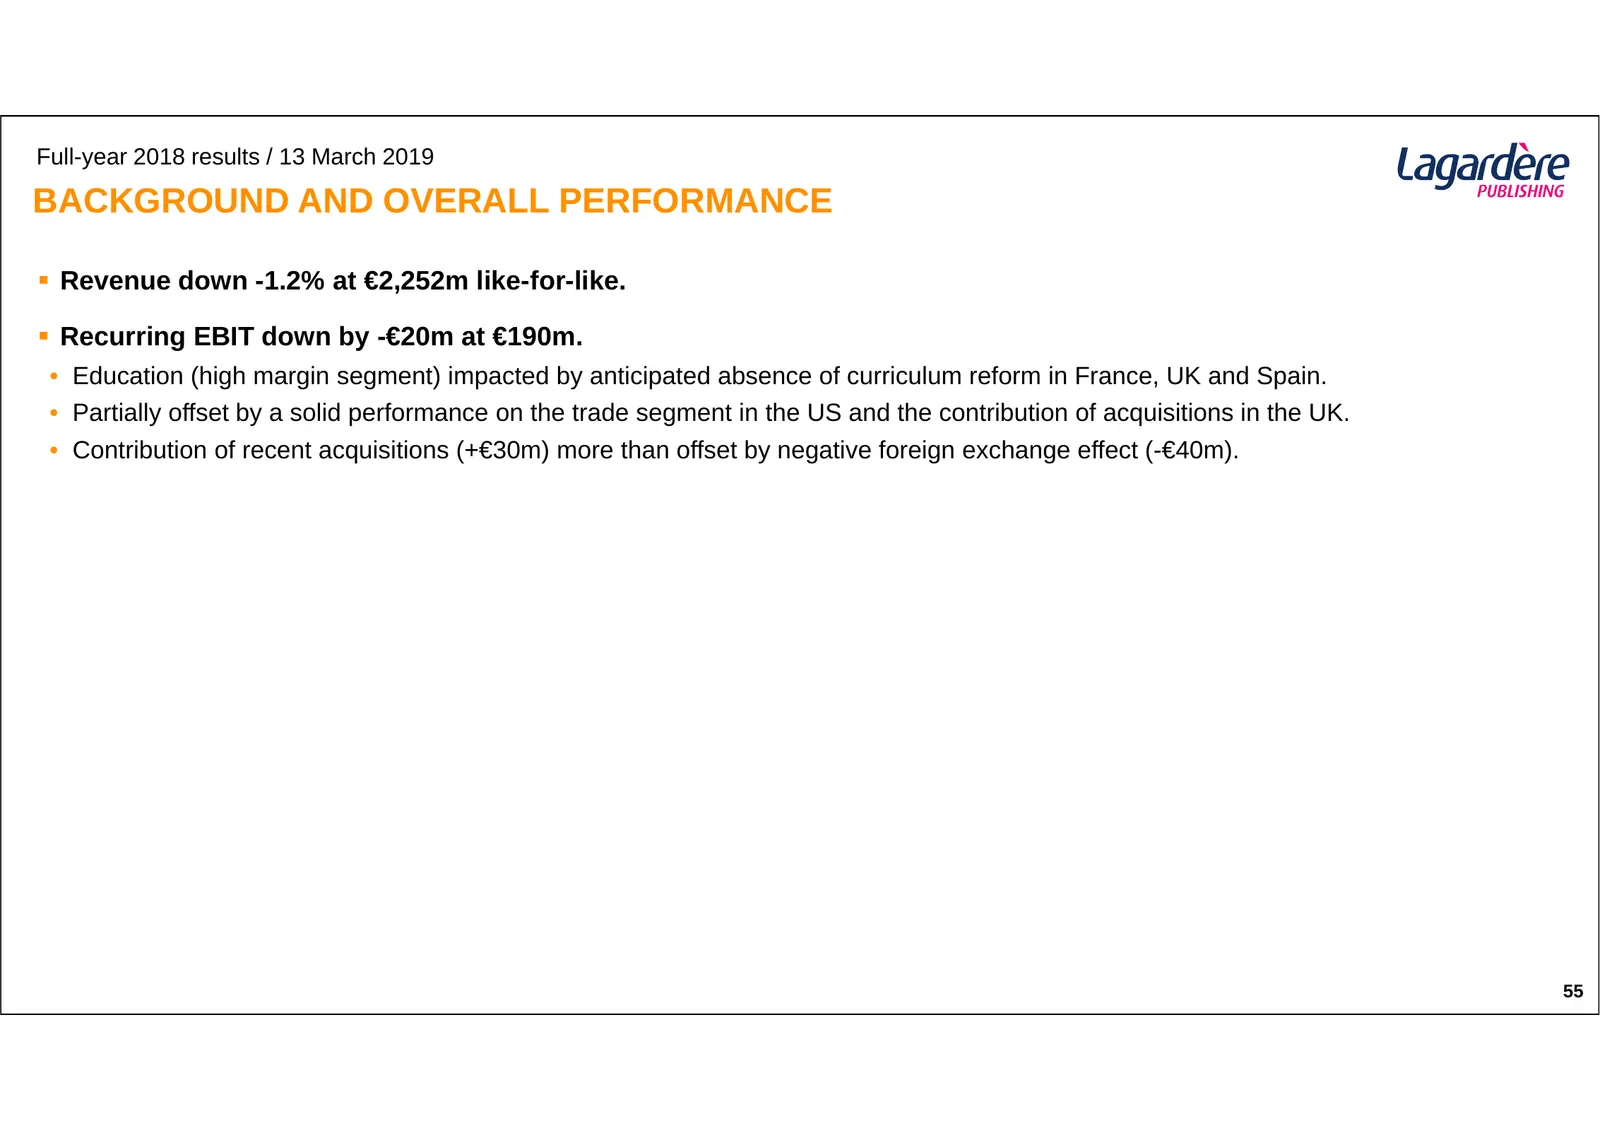
Full-year 2018 results / 13 March 2019 BACKGROUND AND OVERALL PERFORMANCE Revenue down -1.2% at €2,252m like-for-like. Recurring EBIT down by -€20m at €190m. • Education (high margin segment) impacted by anticipated absence of curriculum reform in France, UK and Spain. • Partially offset by a so
Slide 55: France
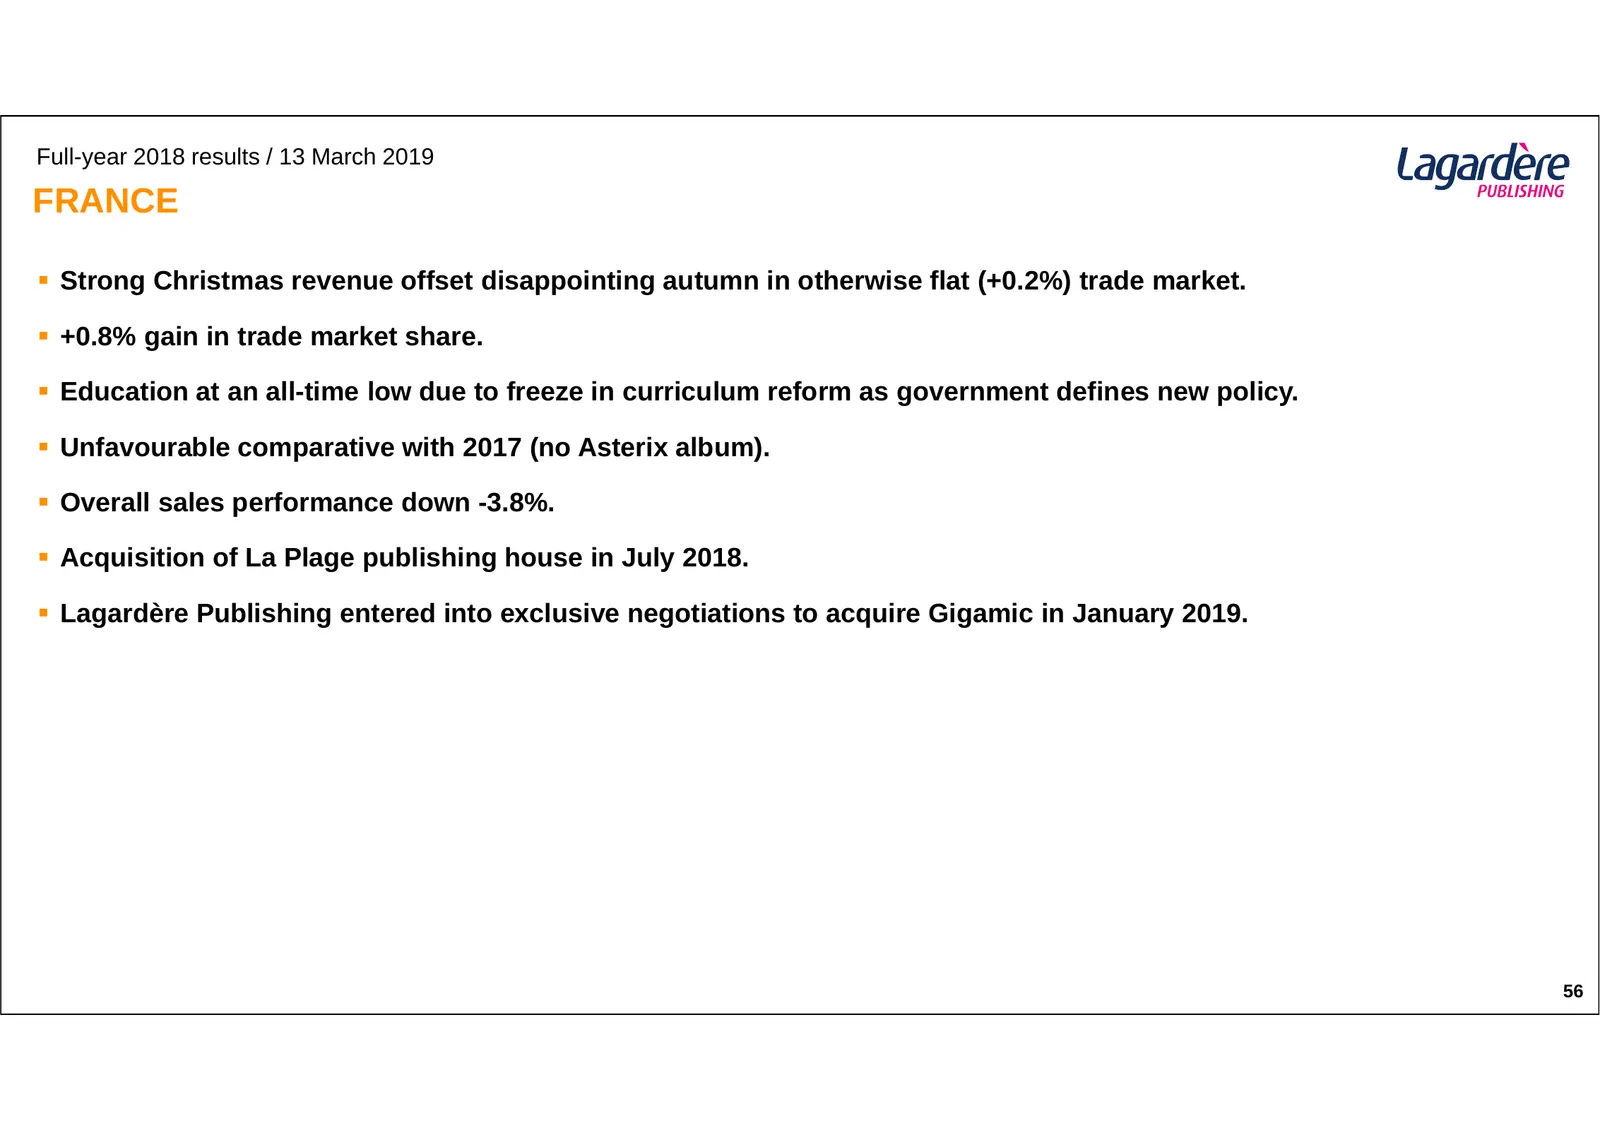
Full-year 2018 results / 13 March 2019 FRANCE Strong Christmas revenue offset disappointing autumn in otherwise flat (+0.2%) trade market. +0.8% gain in trade market share. Education at an all-time low due to freeze in curriculum reform as government defines new policy. Unfavourable comparat
Slide 56: International Markets
Full-year 2018 results / 13 March 2019 INTERNATIONAL MARKETS UK: record-setting revenue and recurring EBIT in adult trade and children’s segments thanks to numerous bestsellers. • Education lagging due to absence of substantial curriculum reform in primary and secondary. • Stellar performance of r
Slide 57: Digital
Full-year 2018 results / 13 March 2019 DIGITAL e-Book decline in the US and the UK compensated by spectacular growth of audiobooks (+30% per year) for fourth year in a row. e-Books accounted for 7.9% of total Lagardère Publishing revenue in 2018, with the proportion remaining stable versus 2017,
Slide 58: Significant Events
SIGNIFICANT EVENTS Full-year 2018 results 13 March 2019
Slide 59: Background and Overall Performance
Full-year 2018 results / 13 March 2019 BACKGROUND AND OVERALL PERFORMANCE Acquisition of HBF successfully completed and integration plan launched. Solid like-for-like revenue growth (up 8.8%) driven by a combination of traffic growth, success of new concepts and commercial initiatives, as well a
Slide 60: France
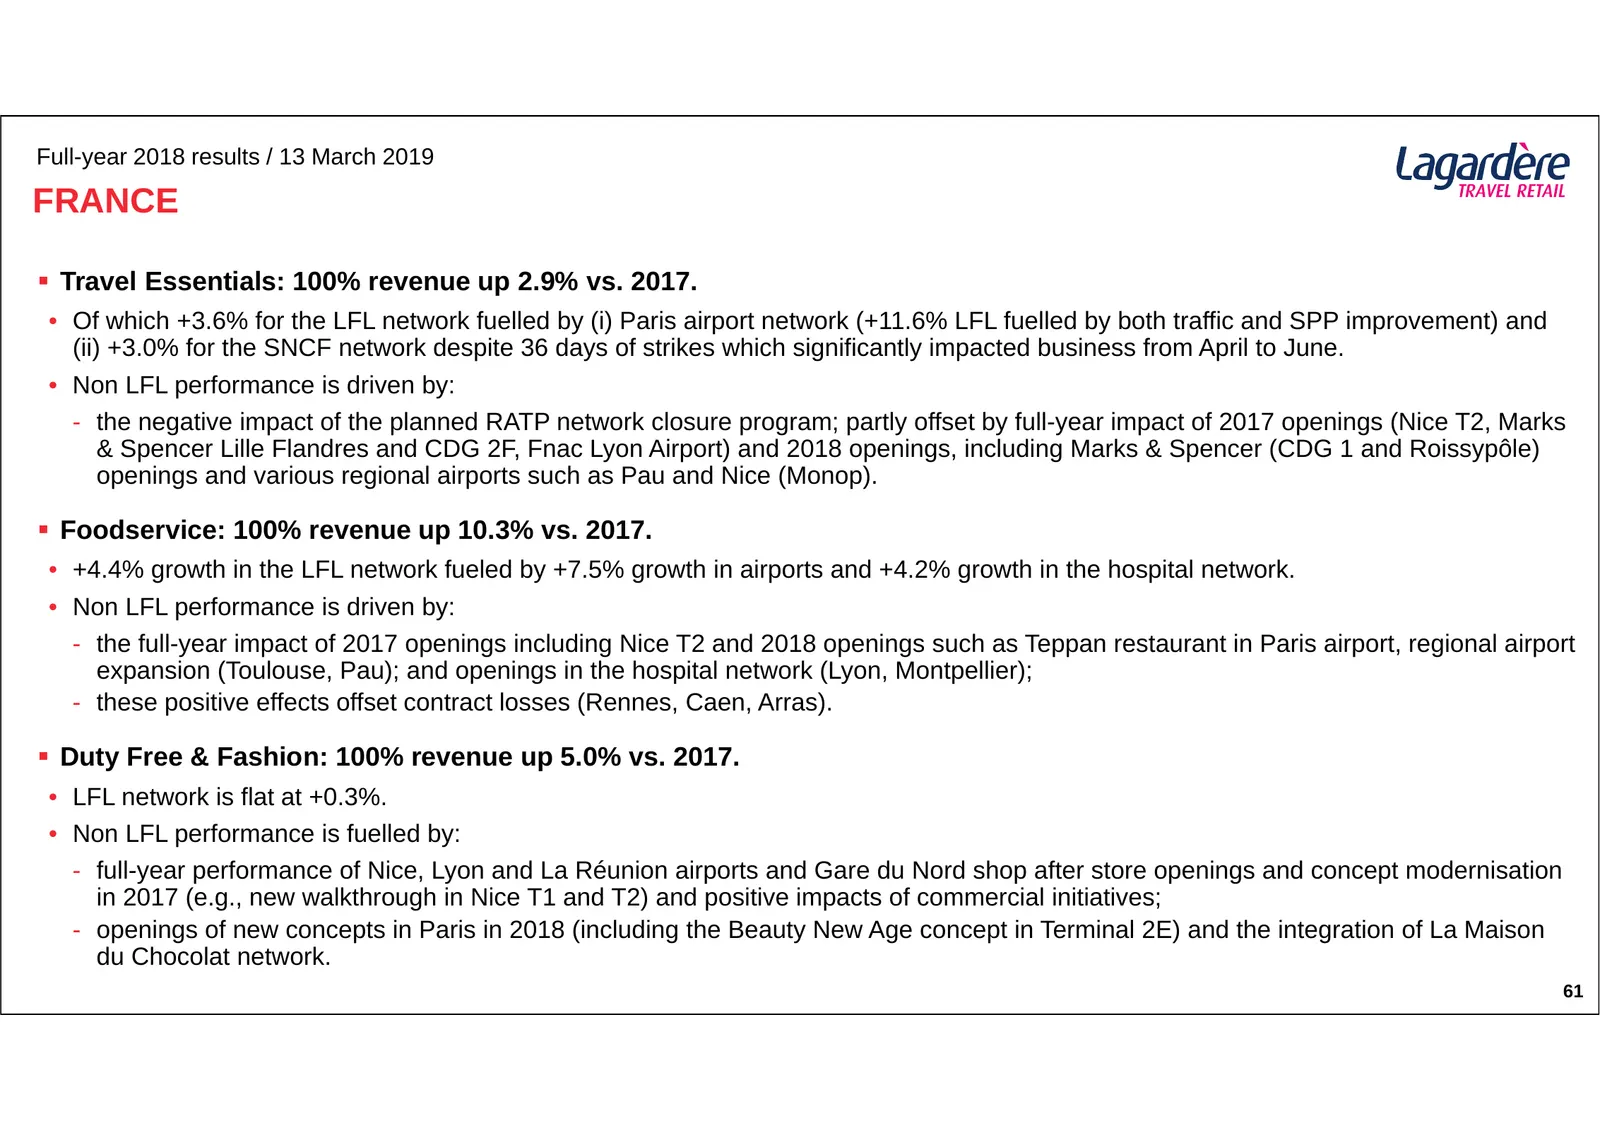
Full-year 2018 results / 13 March 2019 FRANCE Travel Essentials: 100% revenue up 2.9% vs. 2017. • Of which +3.6% for the LFL network fuelled by (i) Paris airport network (+11.6% LFL fuelled by both traffic and SPP improvement) and (ii) +3.0% for the SNCF network despite 36 days of strikes which si
Slide 61: EMEA
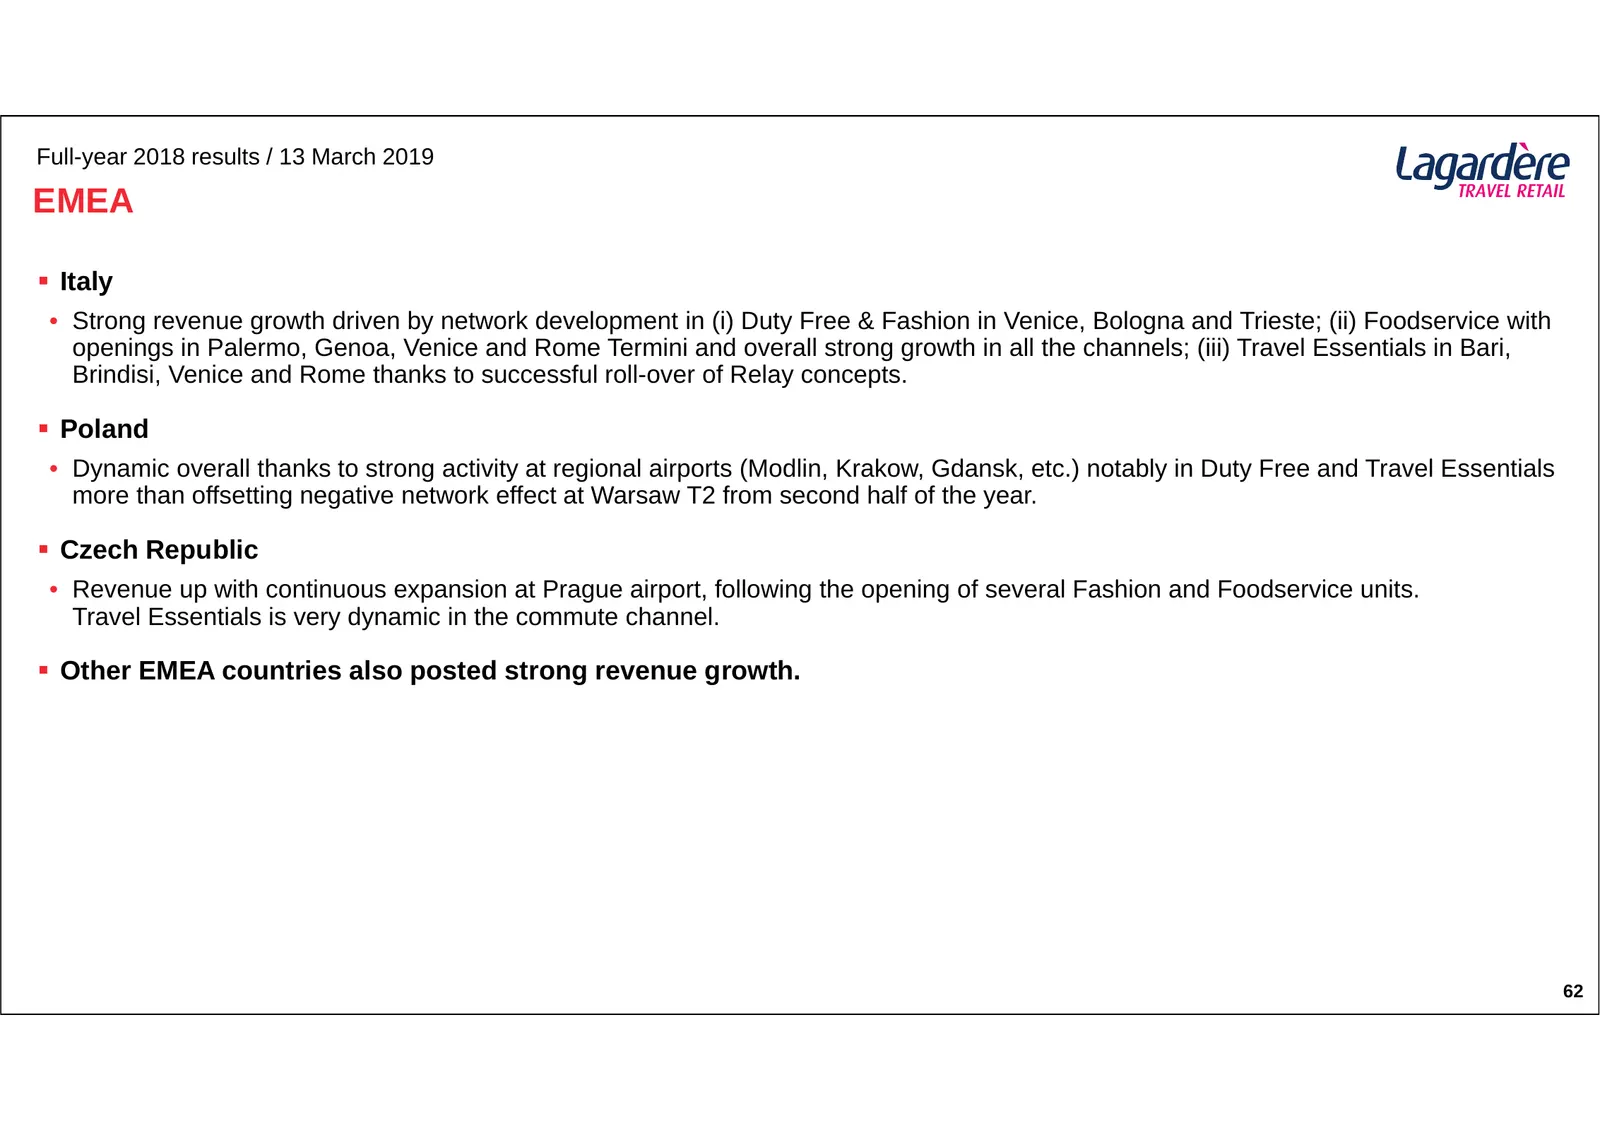
Full-year 2018 results / 13 March 2019 EMEA Italy • Strong revenue growth driven by network development in (i) Duty Free & Fashion in Venice, Bologna and Trieste; (ii) Foodservice with openings in Palermo, Genoa, Venice and Rome Termini and overall strong growth in all the channels; (iii) Travel E
Slide 62: North America, Asia and Pacific
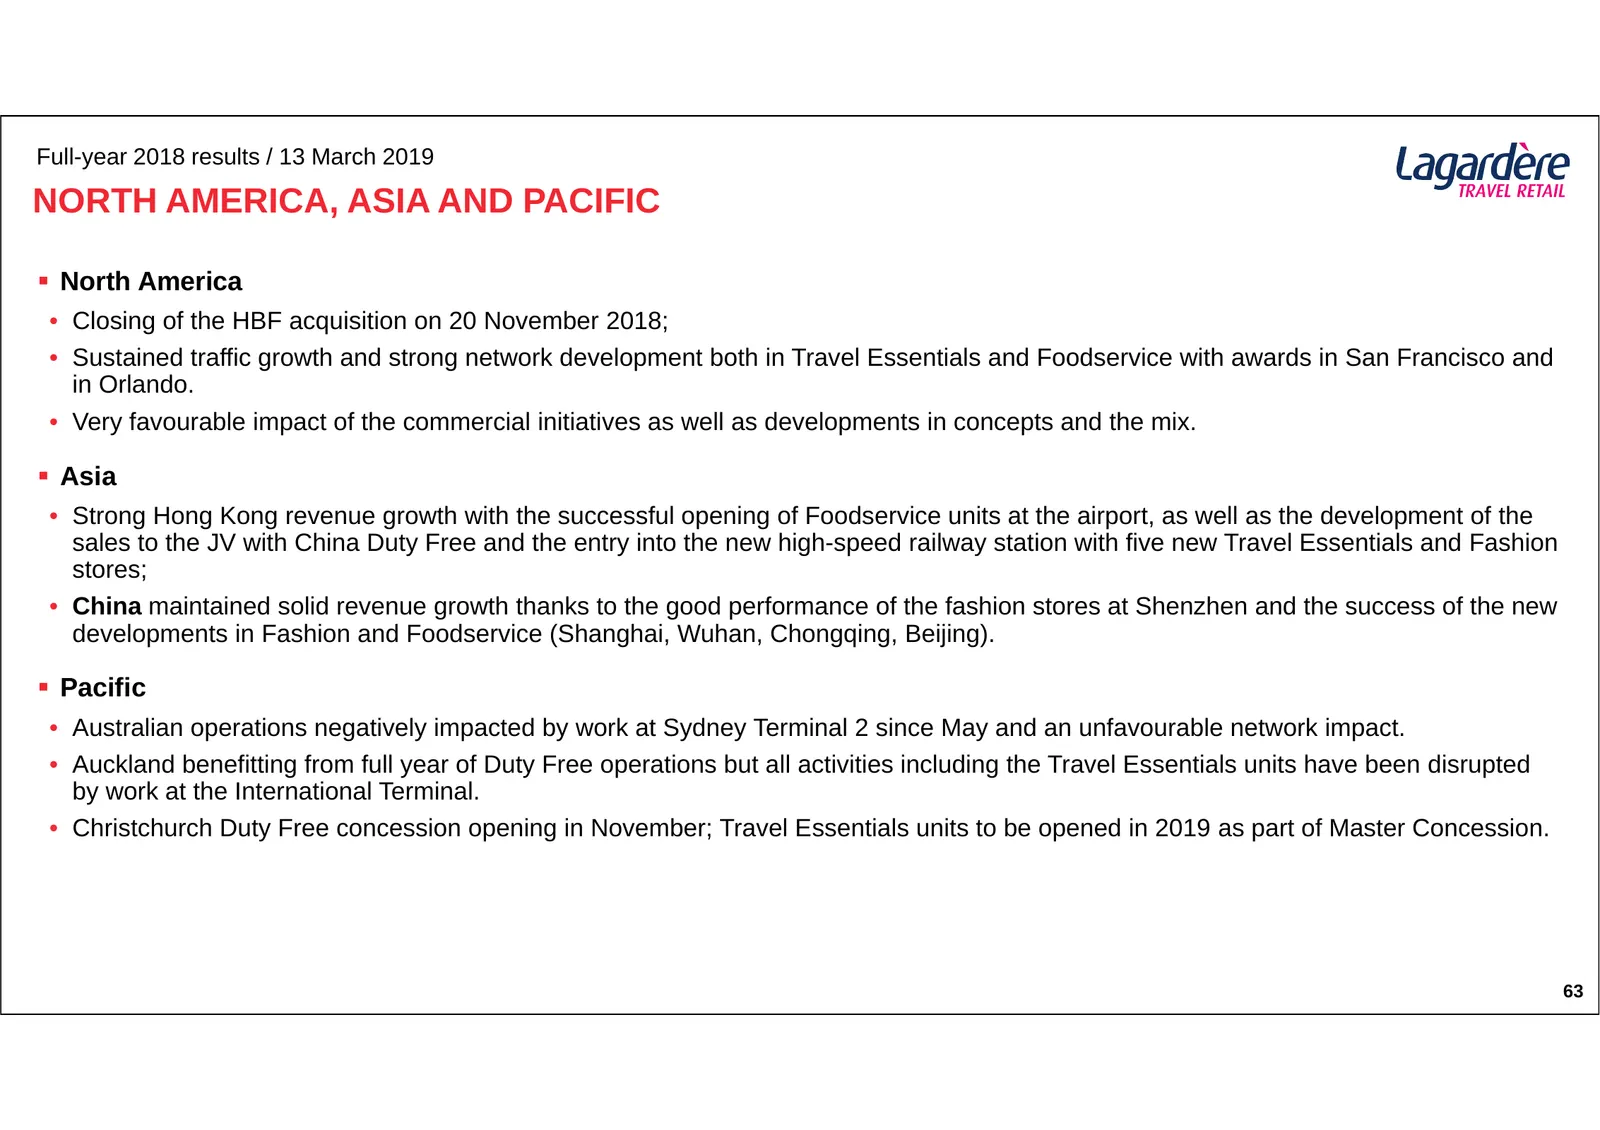
Full-year 2018 results / 13 March 2019 NORTH AMERICA, ASIA AND PACIFIC North America • Closing of the HBF acquisition on 20 November 2018; • Sustained traffic growth and strong network development both in Travel Essentials and Foodservice with awards in San Francisco and in Orlando. • Very favoura
Slide 63: Significant Events
SIGNIFICANT EVENTS Full-year 2018 results 13 March 2019
Slide 64: Strategic Refocusing and Reorganisation
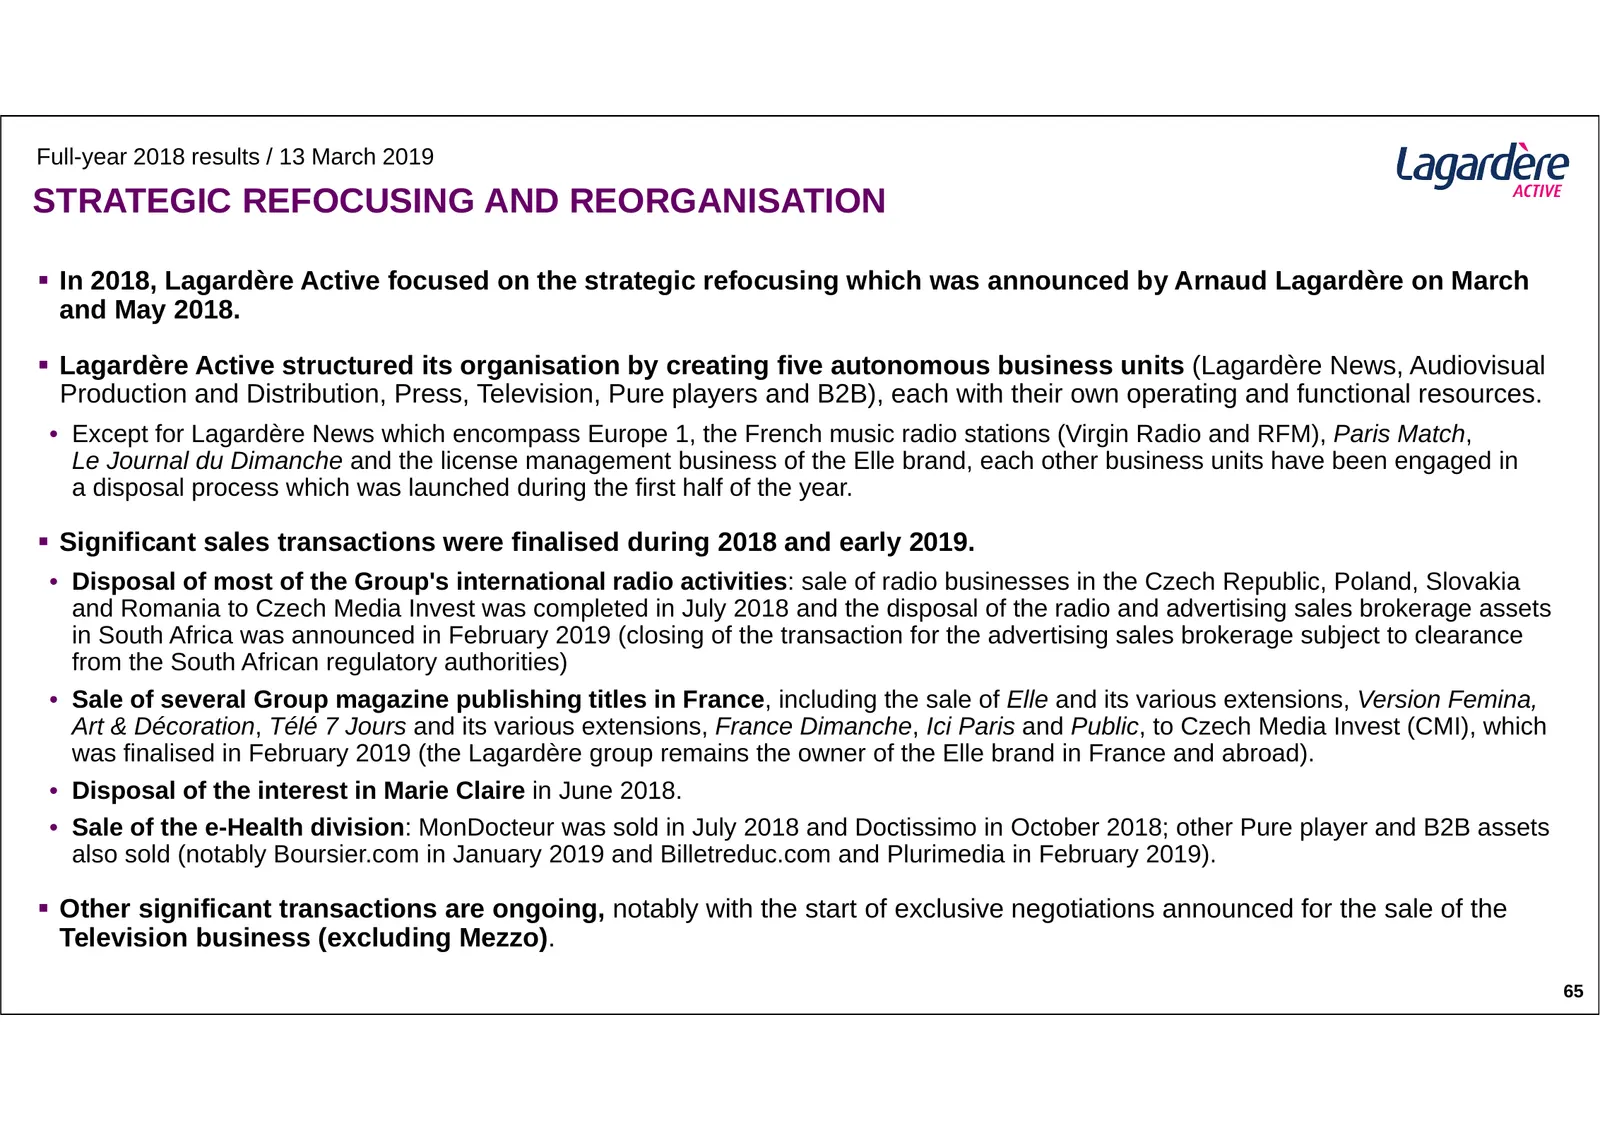
Full-year 2018 results / 13 March 2019 STRATEGIC REFOCUSING AND REORGANISATION In 2018, Lagardère Active focused on the strategic refocusing which was announced by Arnaud Lagardère on March and May 2018. Lagardère Active structured its organisation by creating five autonomous business units (Lag
Slide 65: Magazine Publishing
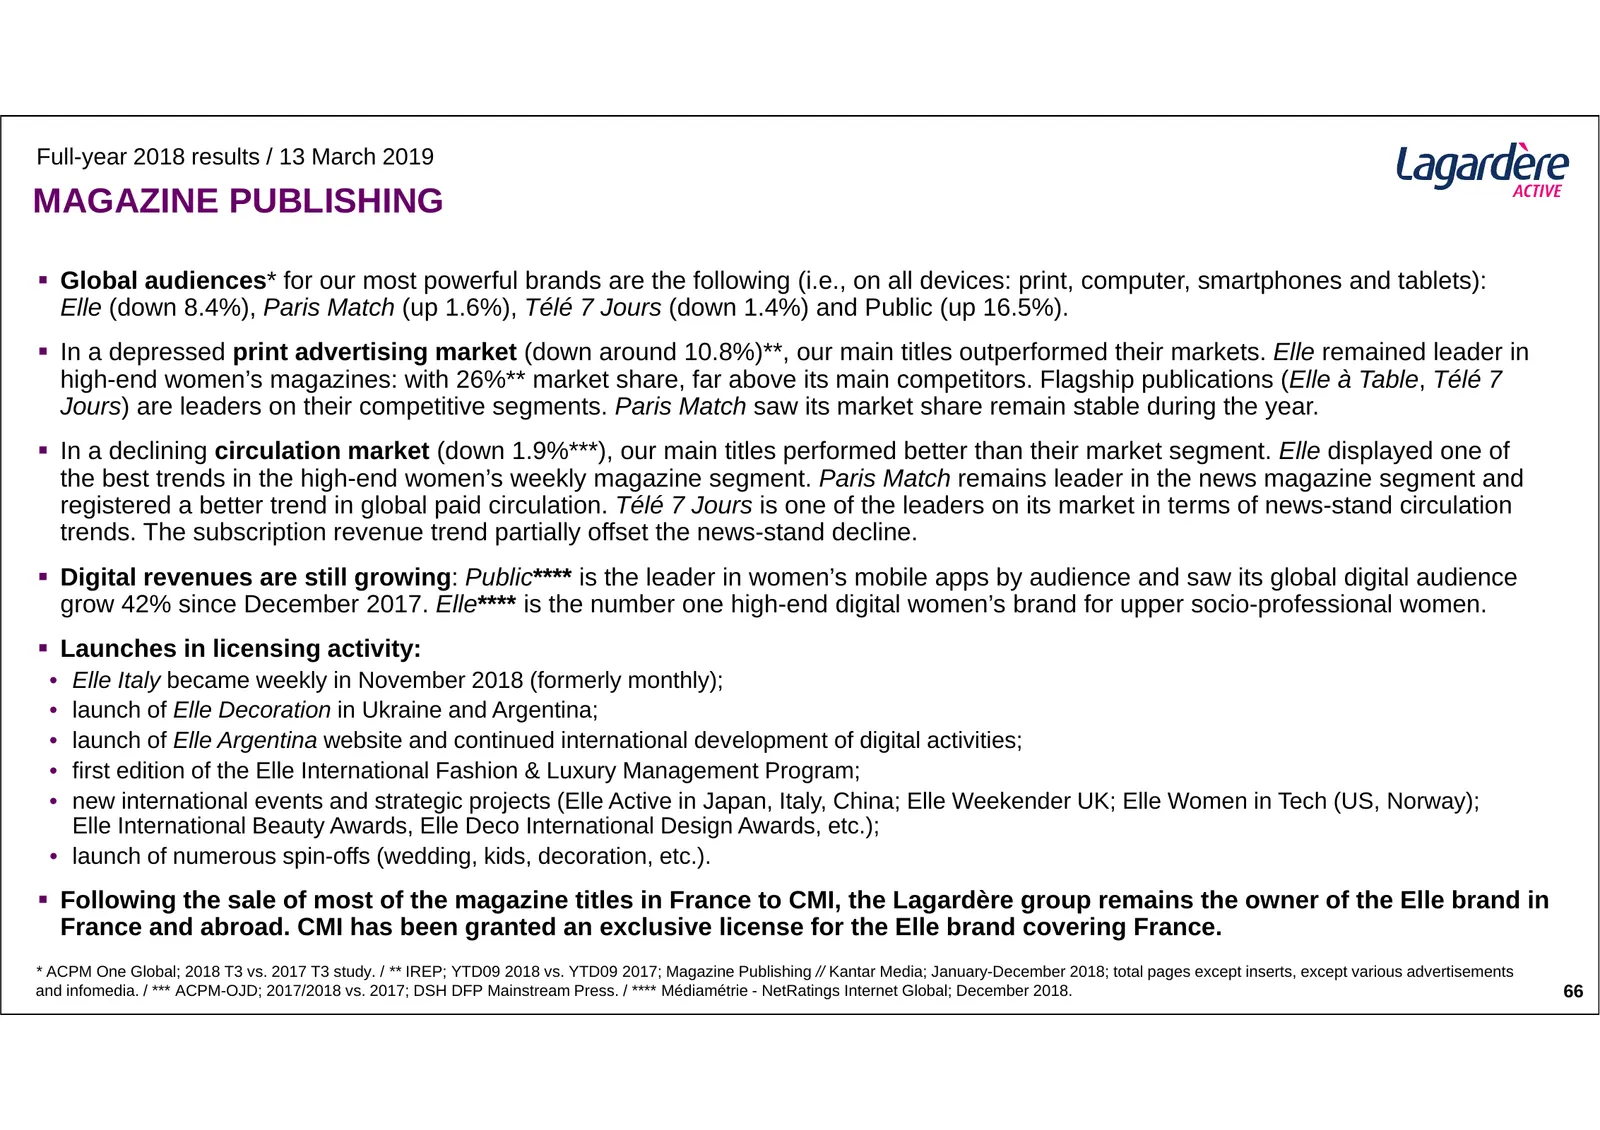
Full-year 2018 results / 13 March 2019 MAGAZINE PUBLISHING Global audiences* for our most powerful brands are the following (i.e., on all devices: print, computer, smartphones and tablets): Elle (down 8.4%), Paris Match (up 1.6%), Télé 7 Jours (down 1.4%) and Public (up 16.5%). In a depressed pr
Slide 66: Radio in France
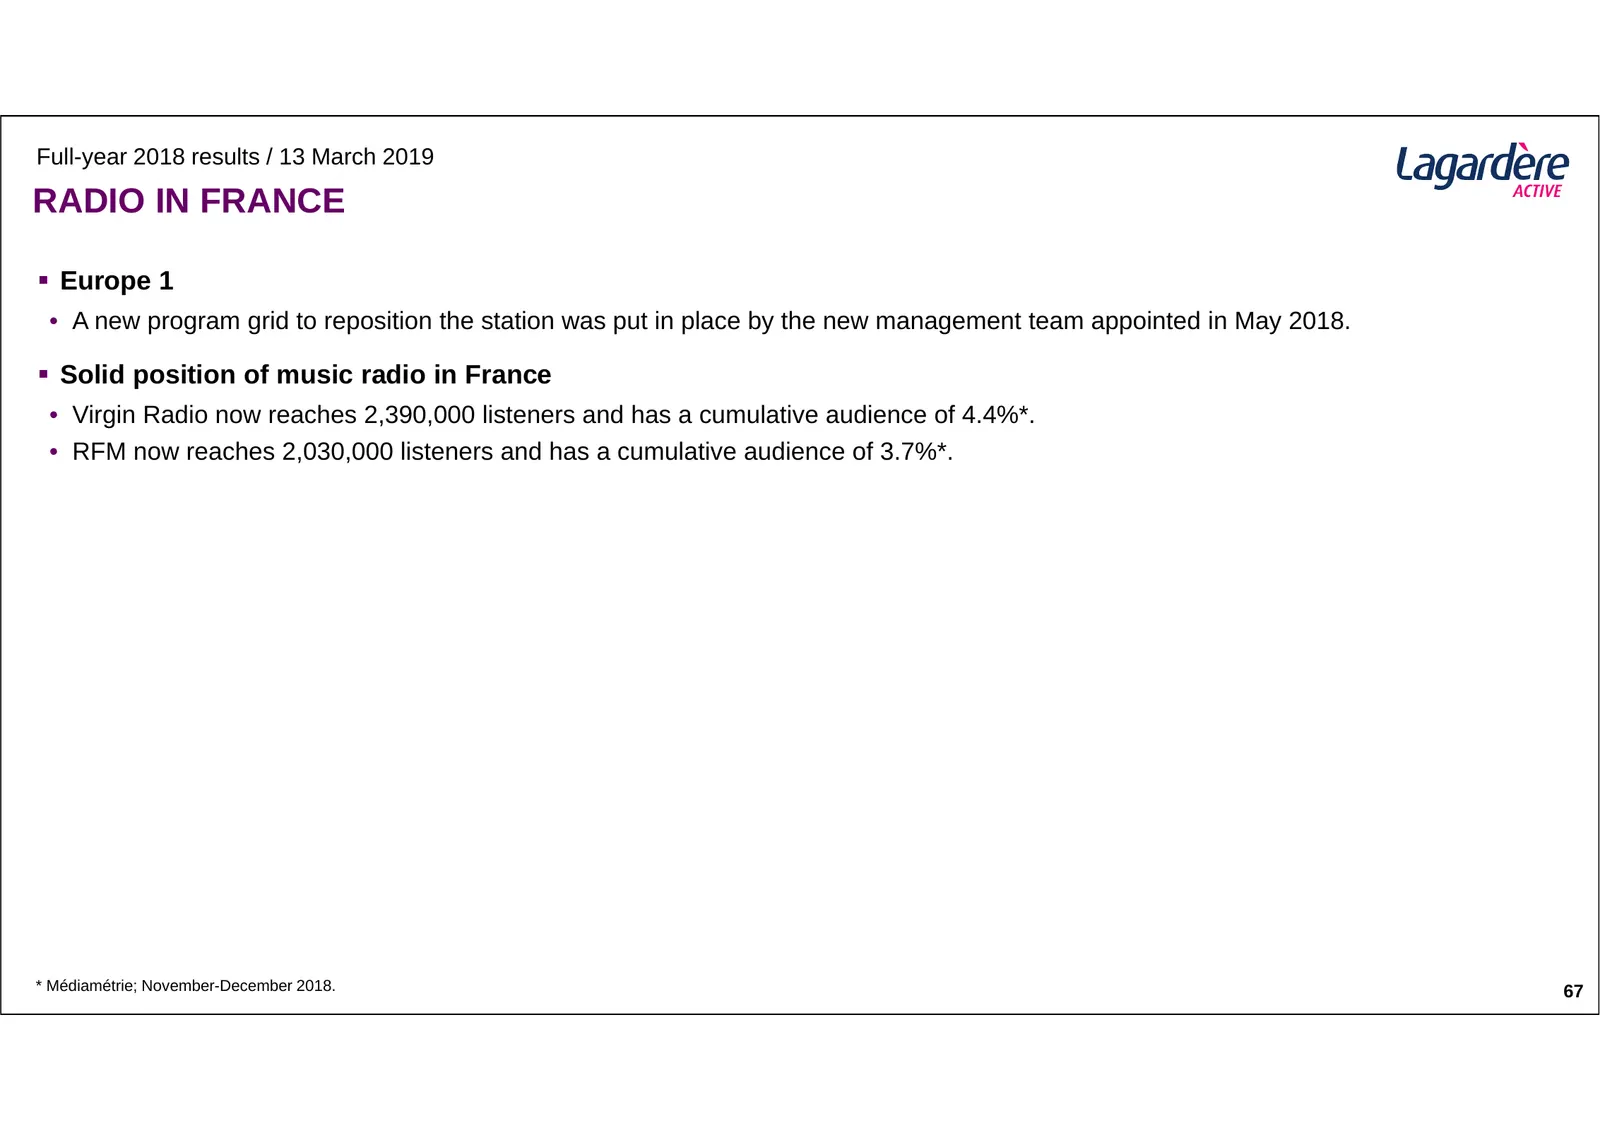
Full-year 2018 results / 13 March 2019 RADIO IN FRANCE Europe 1 • A new program grid to reposition the station was put in place by the new management team appointed in May 2018. Solid position of music radio in France • Virgin Radio now reaches 2,390,000 listeners and has a cumulative audience o
Slide 67: Television Activities – TV Channels
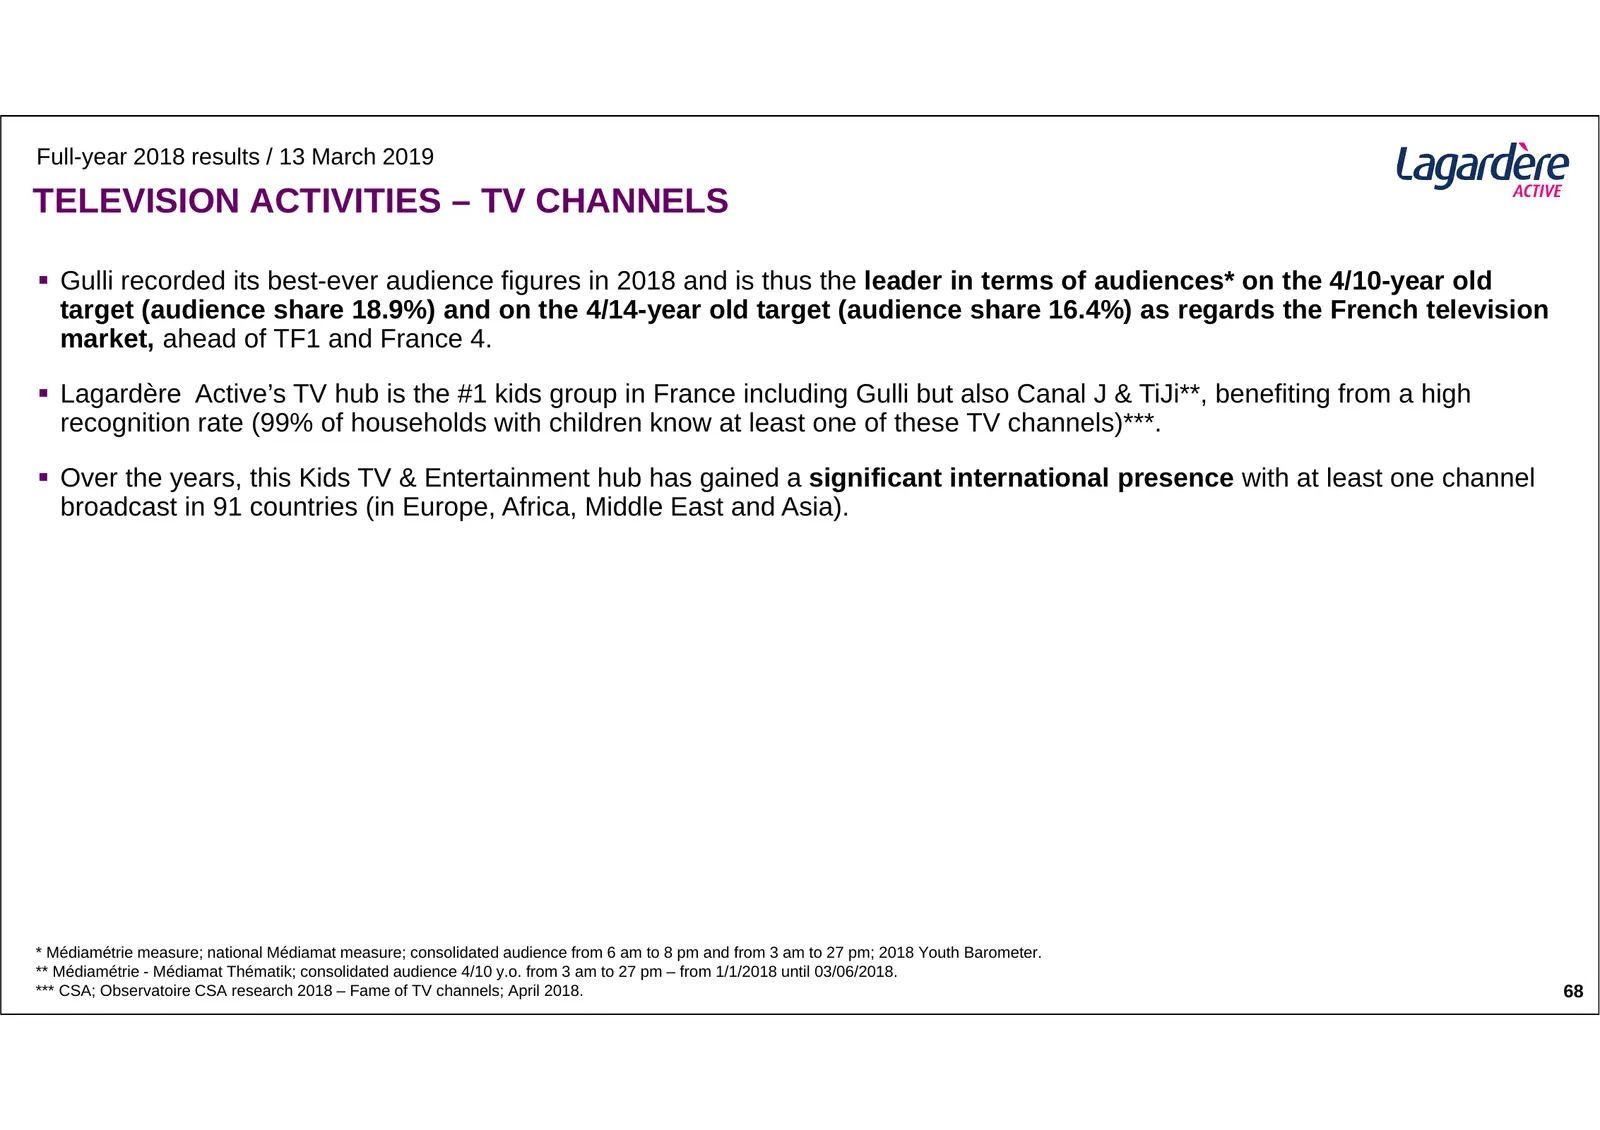
Full-year 2018 results / 13 March 2019 TELEVISION ACTIVITIES – TV CHANNELS Gulli recorded its best-ever audience figures in 2018 and is thus the leader in terms of audiences* on the 4/10-year old target (audience share 18.9%) and on the 4/14-year old target (audience share 16.4%) as regards the Fr
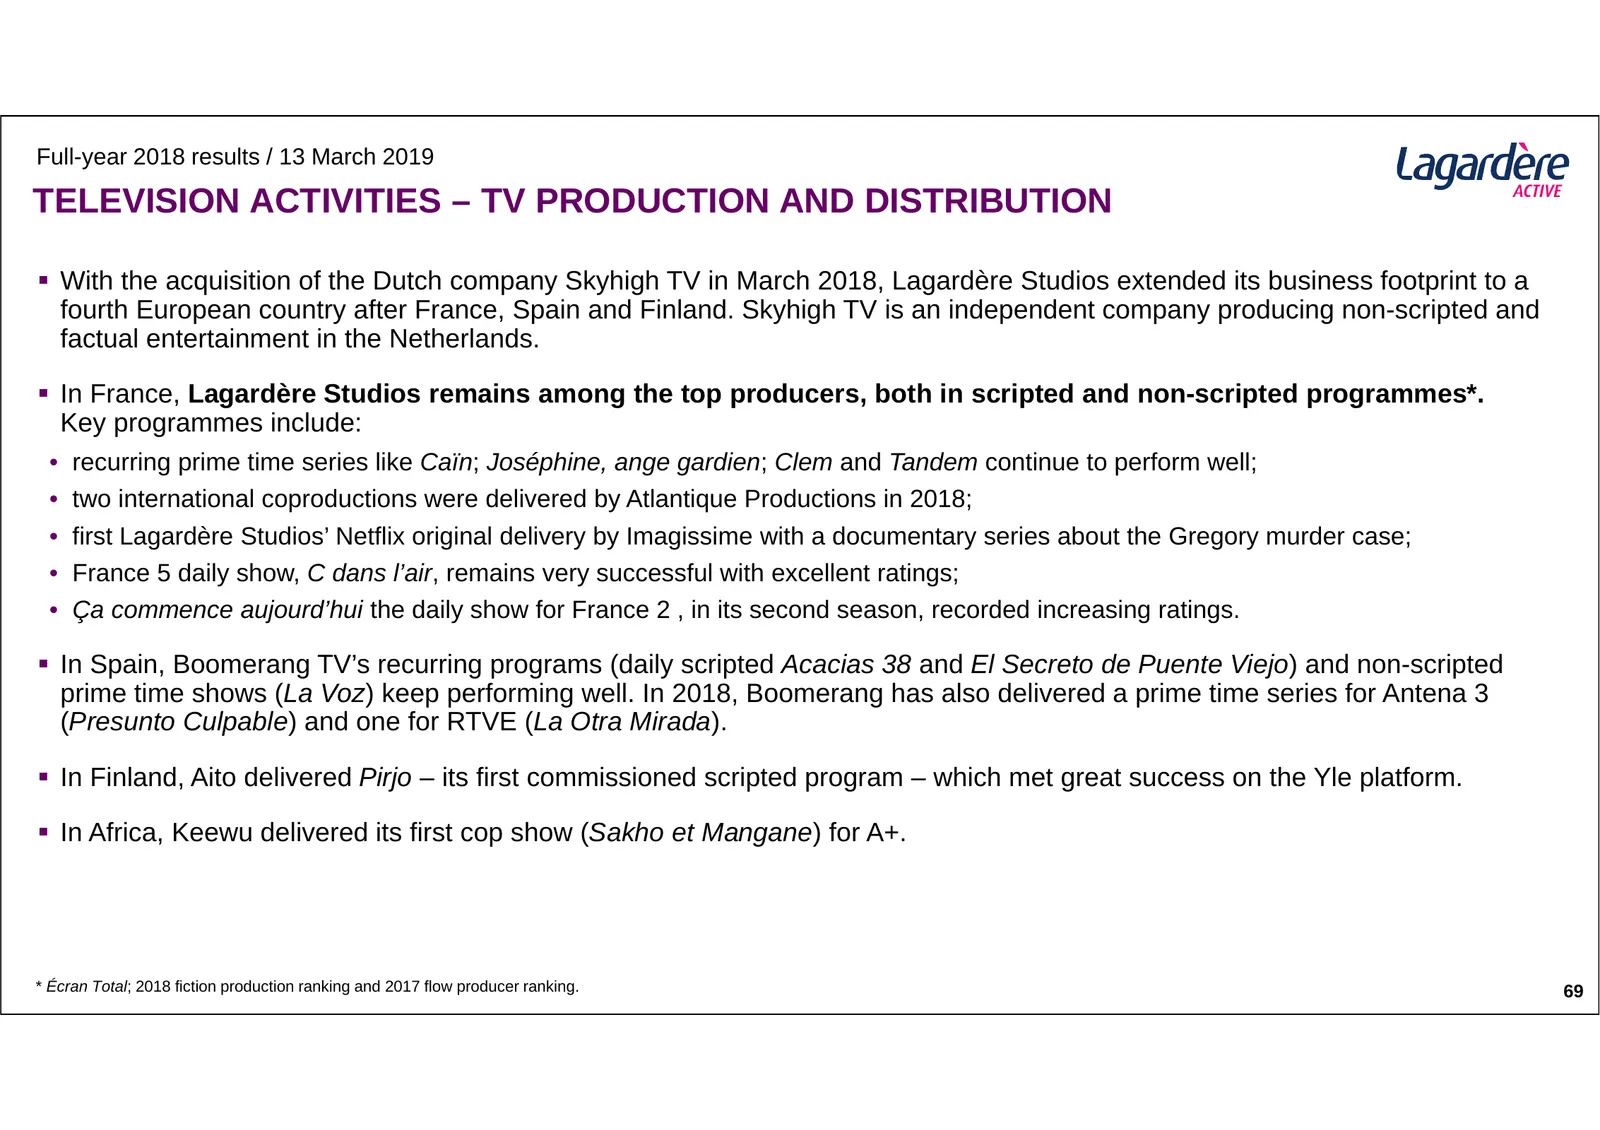
Slide 68: Television Activities – TV Production and Distribution
Full-year 2018 results / 13 March 2019 TELEVISION ACTIVITIES – TV PRODUCTION AND DISTRIBUTION With the acquisition of the Dutch company Skyhigh TV in March 2018, Lagardère Studios extended its business footprint to a fourth European country after France, Spain and Finland. Skyhigh TV is an indepen
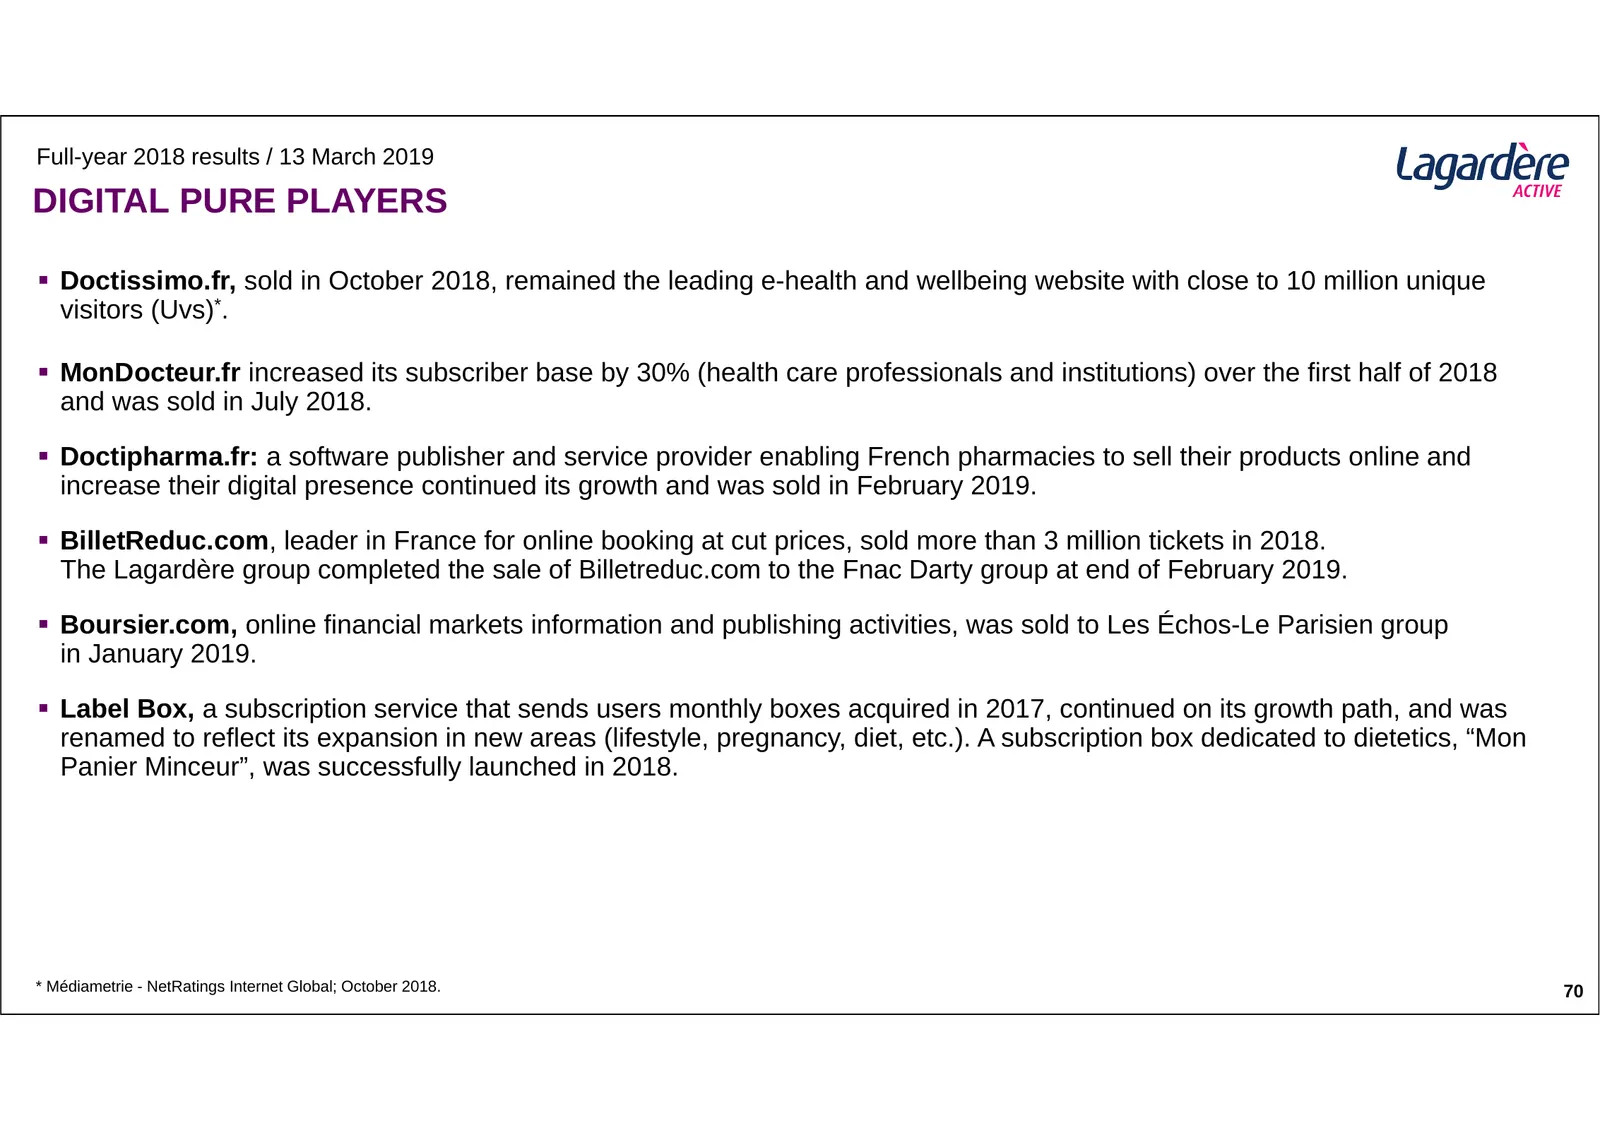
Slide 69: Digital Pure Players
Full-year 2018 results / 13 March 2019 DIGITAL PURE PLAYERS Doctissimo.fr, sold in October 2018, remained the leading e-health and wellbeing website with close to 10 million unique visitors (Uvs)*. MonDocteur.fr increased its subscriber base by 30% (health care professionals and institutions) ov
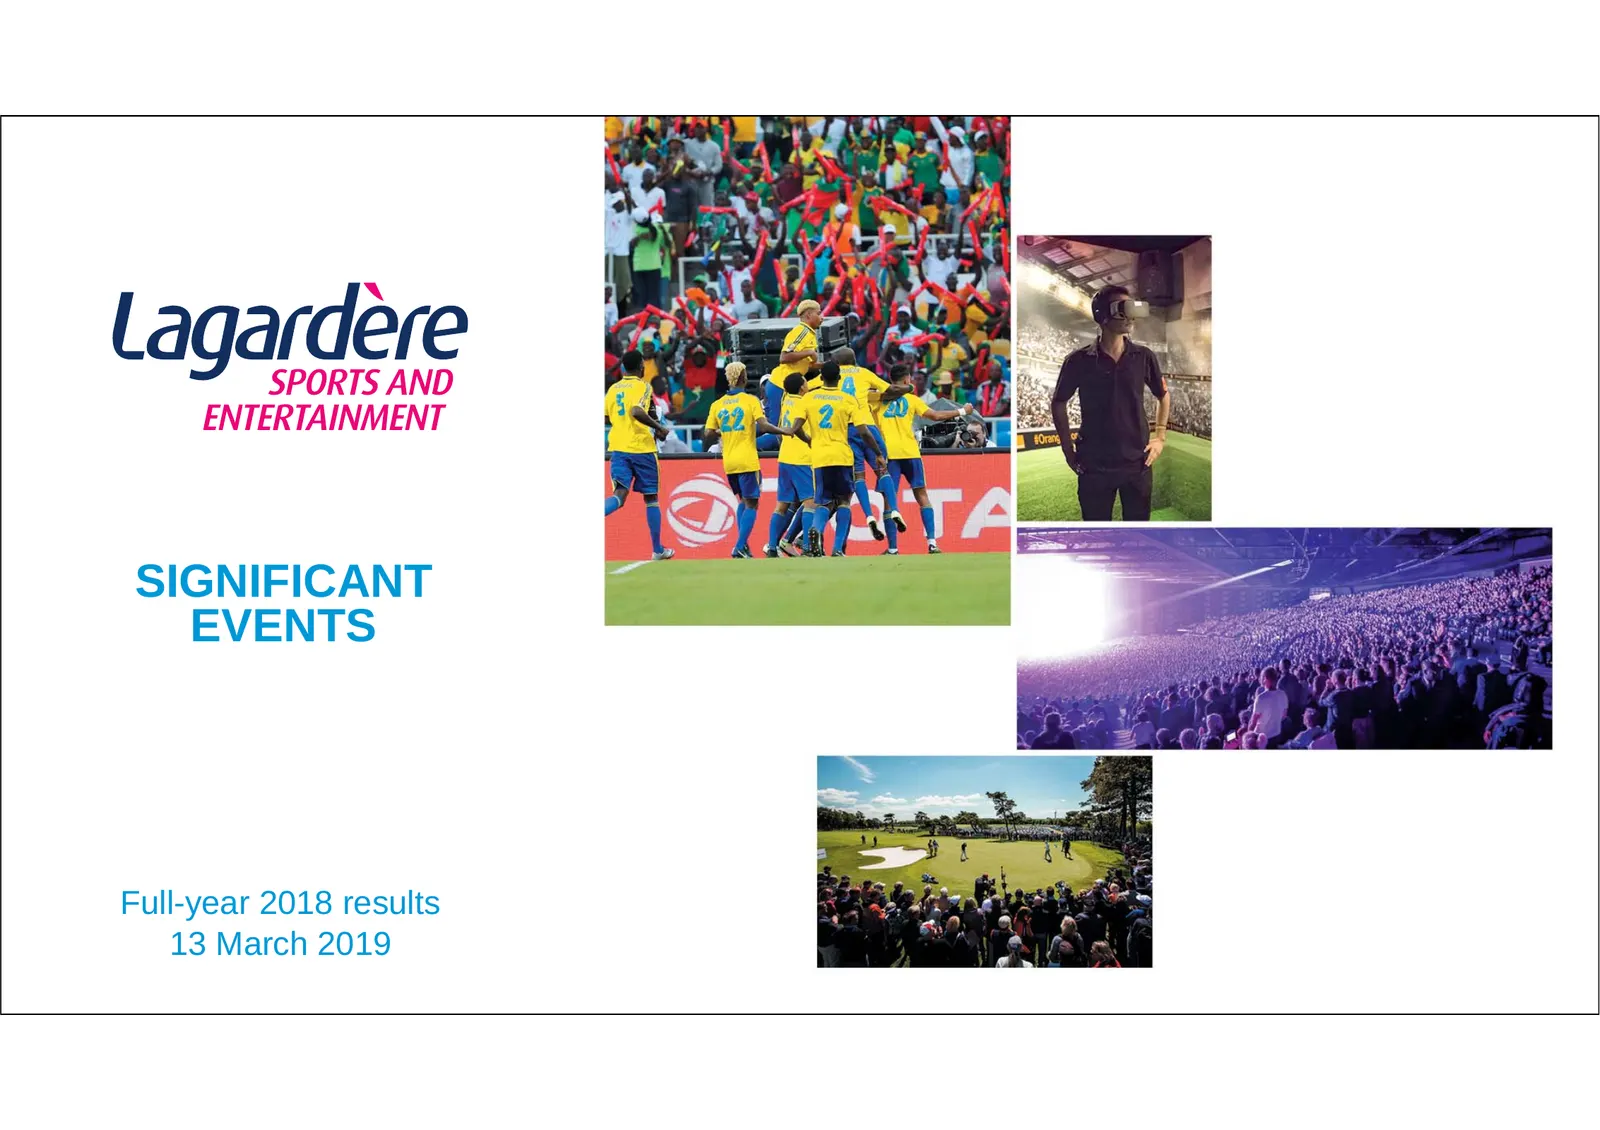
Slide 70: Significant Events
SIGNIFICANT EVENTS Full-year 2018 results 13 March 2019
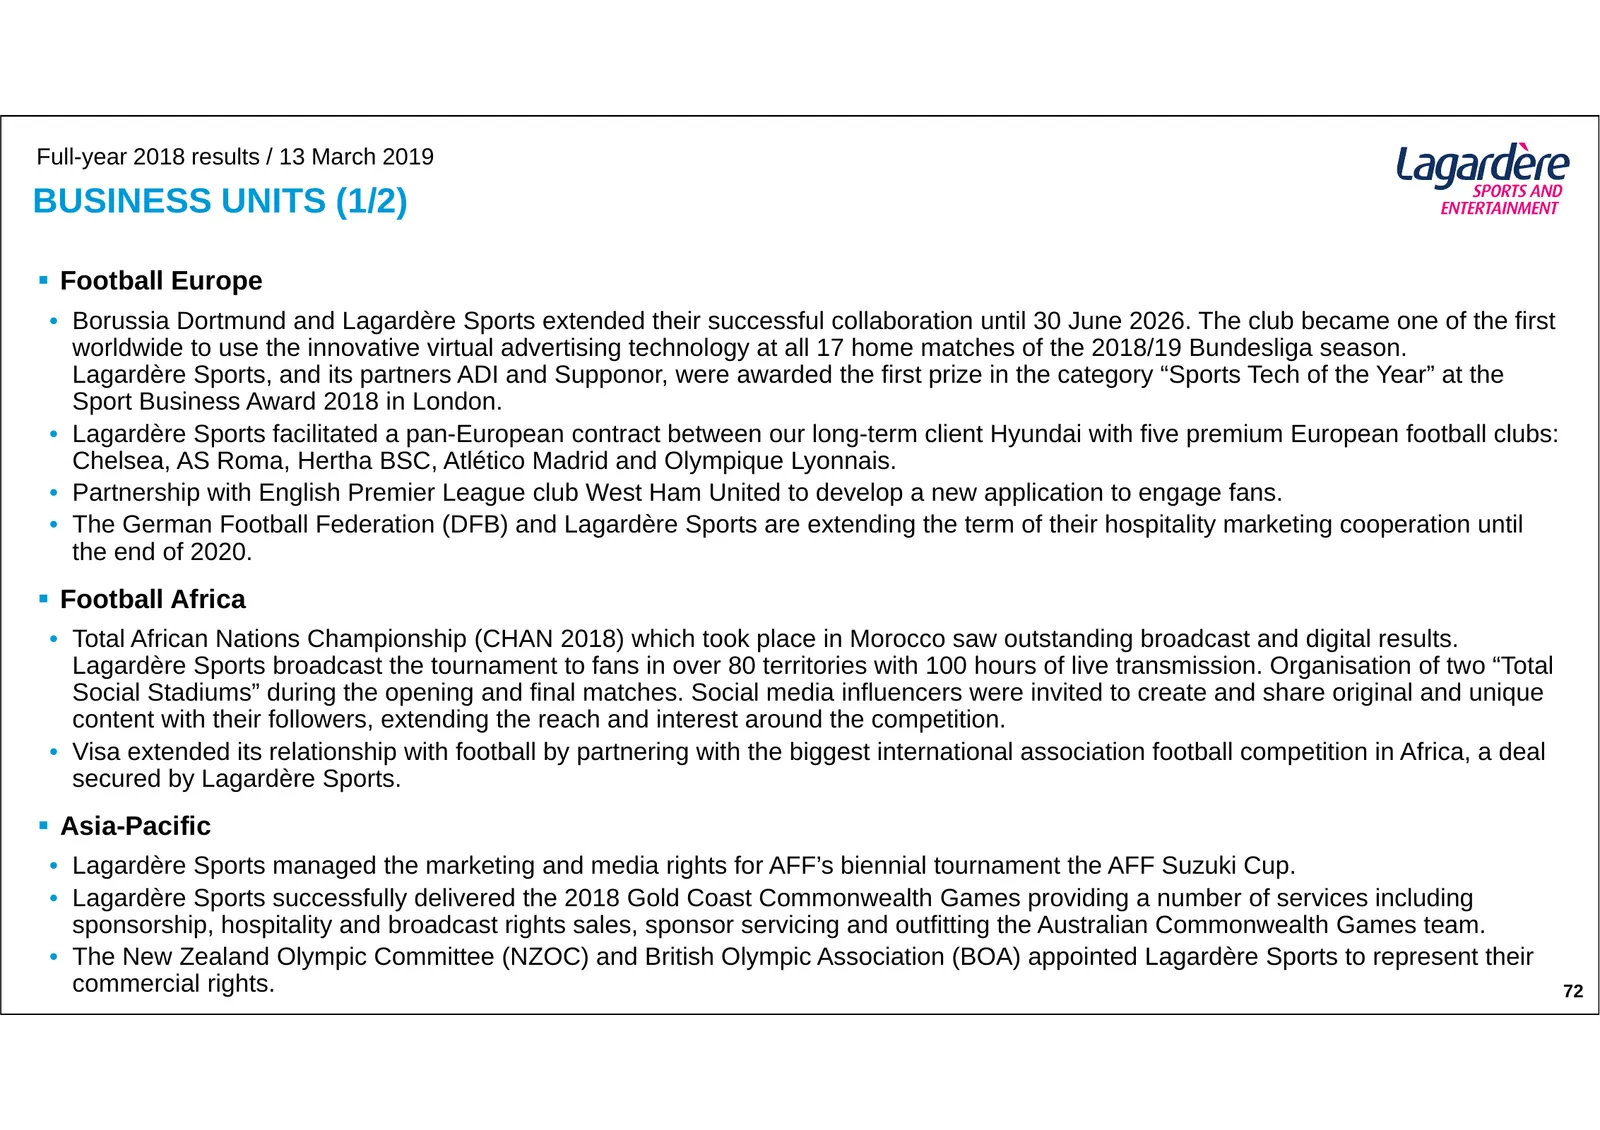
Slide 71: Business Units (1/2)
Full-year 2018 results / 13 March 2019 BUSINESS UNITS (1/2) Football Europe • Borussia Dortmund and Lagardère Sports extended their successful collaboration until 30 June 2026. The club became one of the first worldwide to use the innovative virtual advertising technology at all 17 home matches of
Slide 72: Business Units (2/2)
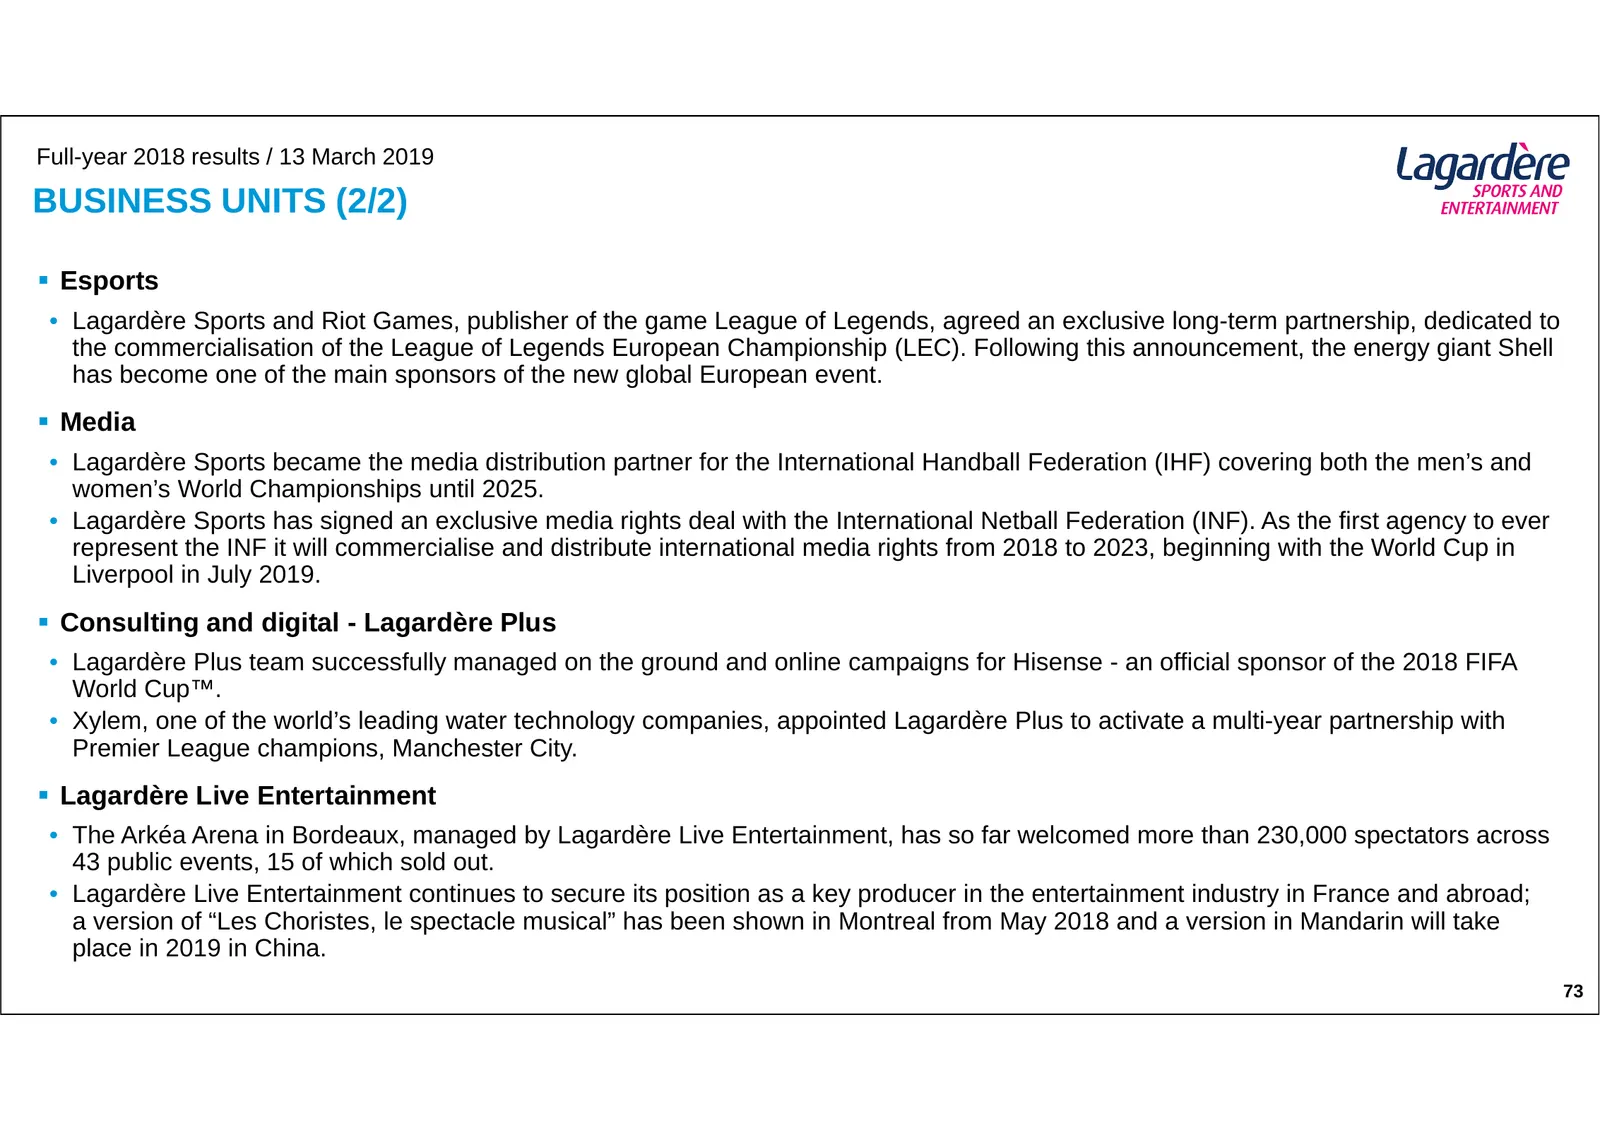
Full-year 2018 results / 13 March 2019 BUSINESS UNITS (2/2) Esports • Lagardère Sports and Riot Games, publisher of the game League of Legends, agreed an exclusive long-term partnership, dedicated to the commercialisation of the League of Legends European Championship (LEC). Following this announc
Source: Internet Archive copy of lagardere.com
More decks from Lagardere SA
 Debt Investor Presentation (September 2026)47 slides · September 2026
 H1 2026 Earnings Presentation36 slides · Jul 28, 2026
 Shareholder Meeting (May 2026)101 slides · May 5, 2026
 Shareholder Meeting (May 2026)101 slides · May 5, 2026
 Q1 2026 Earnings Presentation14 slides · Apr 16, 2026
 FY2025 Earnings Presentation44 slides · Feb 19, 2026