Durr AG · XETR:DUE
Durr — H1 2008 Earnings Presentation
22 slides from Durr's earnings presentation, Aug 7, 2008
Slide 1: Welcome to the conference call
Welcome to the conference call Dürr AG Results January - June 2008 Dürr Group Stuttgart, August 7, 2008
Slide 2: Disclaimer
Disclaimer This presentation has been prepared independently by Dürr AG (“Dürr”). The presentation contains statements which address such key issues as Dürr´s strategy, future financial results, market positions, product development, and the effects of continuous improvement processes. Such statemen
Slide 3: Double digit sales growth in H1
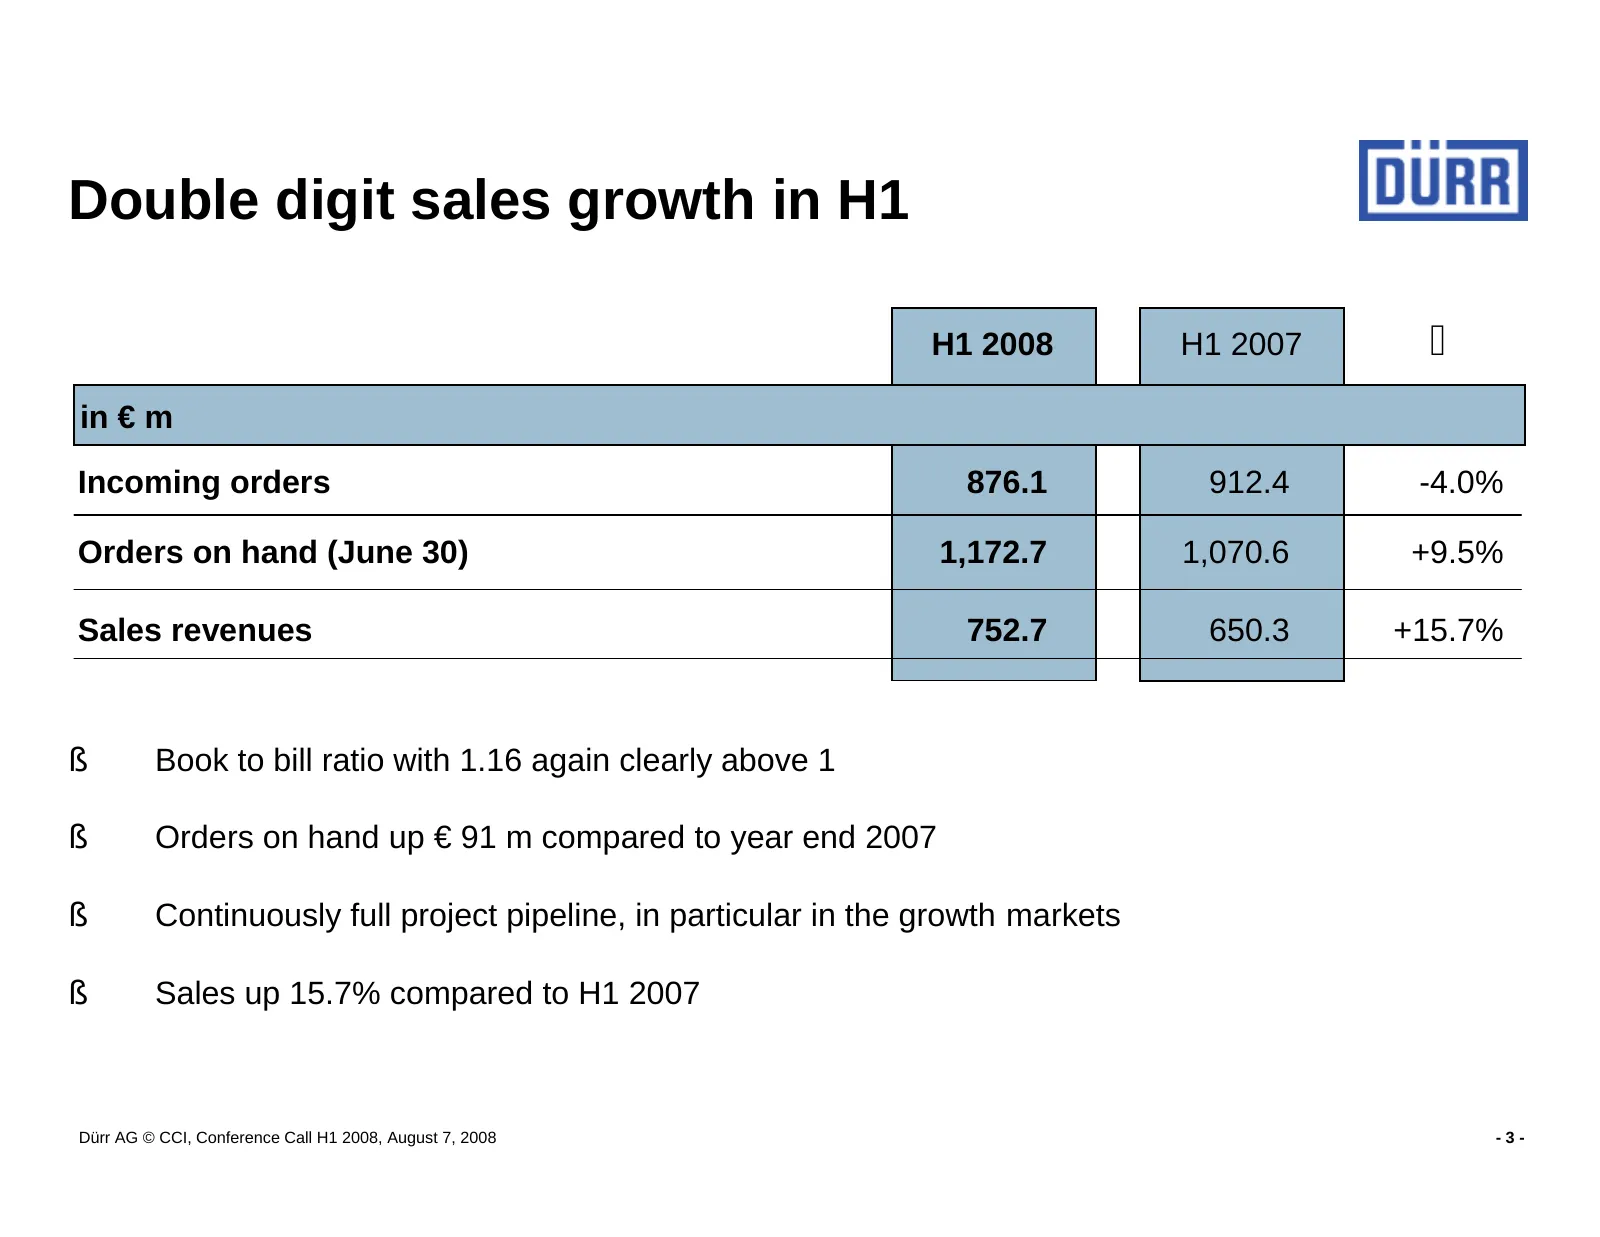
Double digit sales growth in H1 H1 2008 H1 2007 ∆ in € m Incoming orders 876.1 912.4 -4.0% Orders on hand (June 30) 1,172.7 1,070.6 +9.5% Sales revenues 752.7 650.3 +15.7% § Book to bill ratio with 1.16 again clearly above 1 § Orders on hand up € 91 m compared to year end 2007 § Continuously full pr
Slide 4: Well balanced incoming orders and sales structure H1 2008
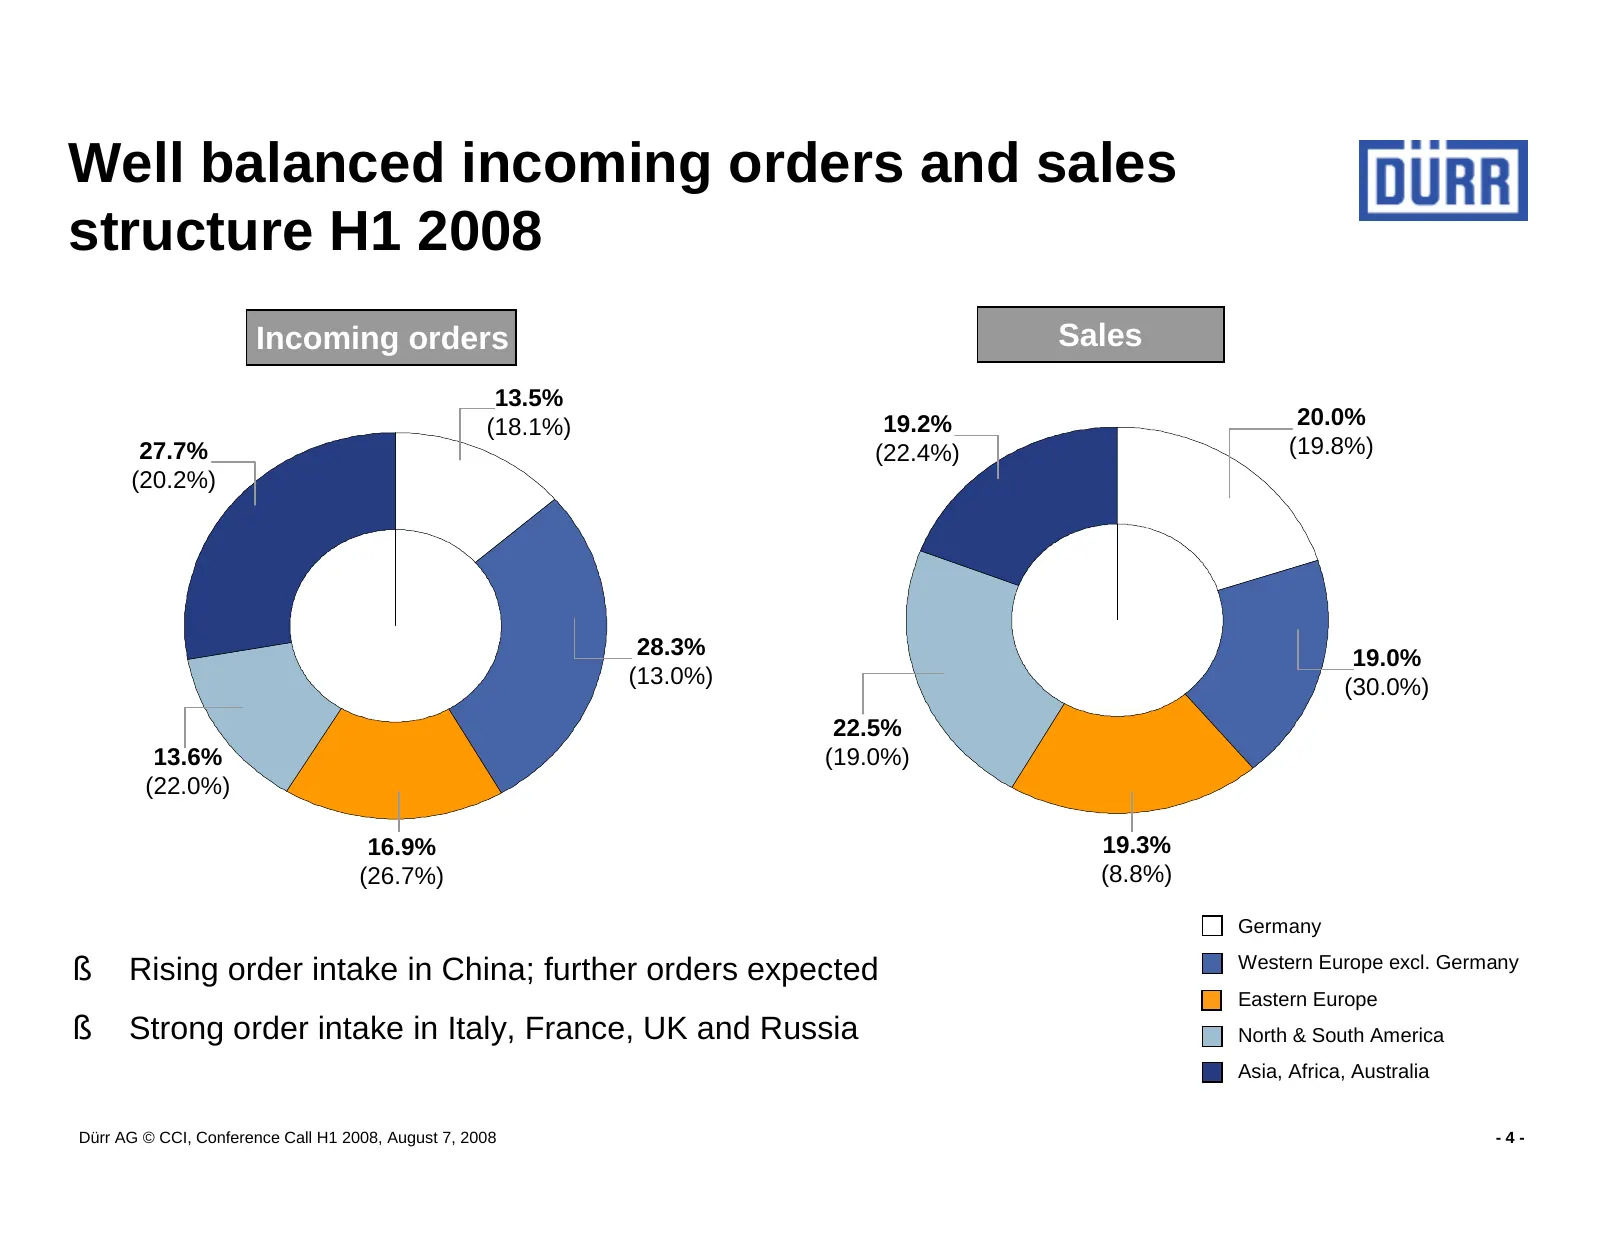
Well balanced incoming orders and sales structure H1 2008 Incoming orders Sales 13.5% (18.1%) 19.2% 20.0% 27.7% (22.4%) (19.8%) (20.2%) 28.3% 19.0% (13.0%) (30.0%) 22.5% 13.6% (19.0%) (22.0%) 16.9% 19.3% (26.7%) (8.8%) Germany § Rising order intake in China; further orders expected Western Europe ex
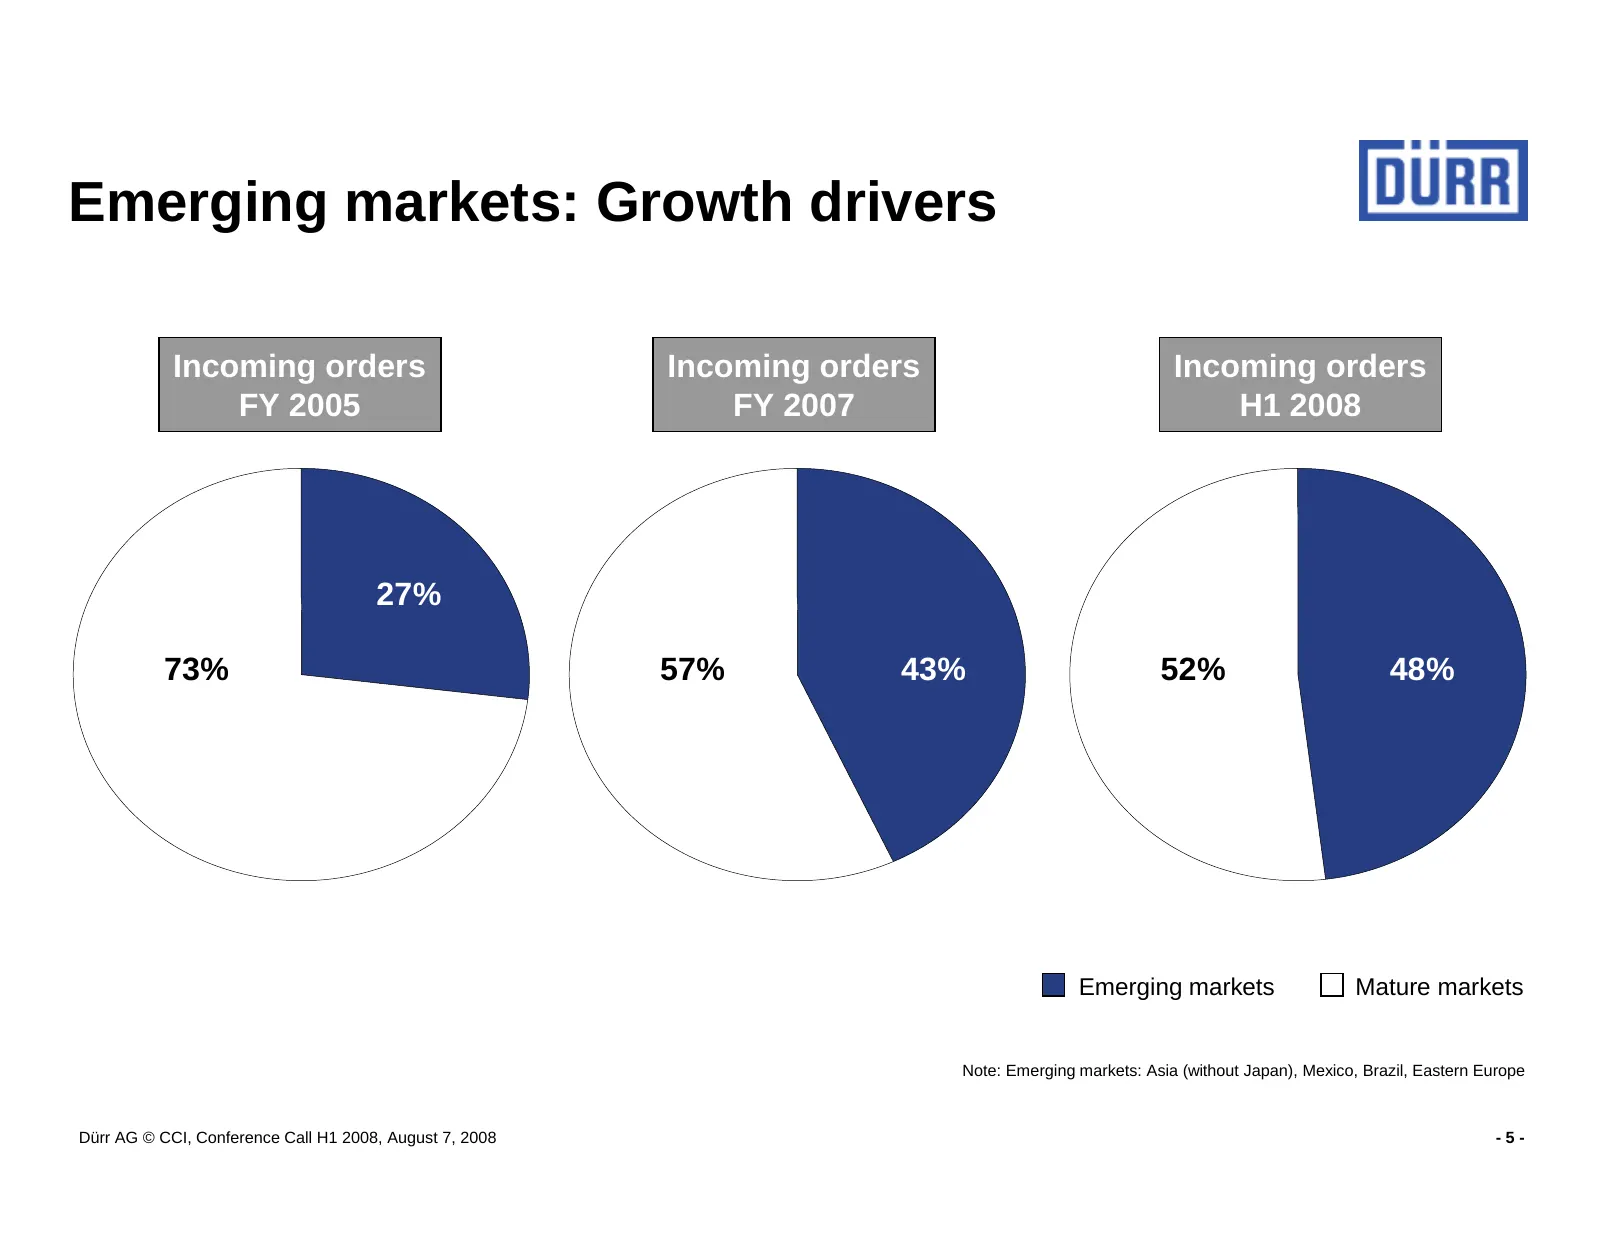
Slide 5: Emerging markets: Growth drivers
Emerging markets: Growth drivers Incoming orders Incoming orders Incoming orders FY 2005 FY 2007 H1 2008 27% 73% 57% 43% 52% 48% Emerging markets Mature markets Note: Emerging markets: Asia (without Japan), Mexico, Brazil, Eastern Europe Dürr AG © CCI, Conference Call H1 2008, August 7, 2008 -5-
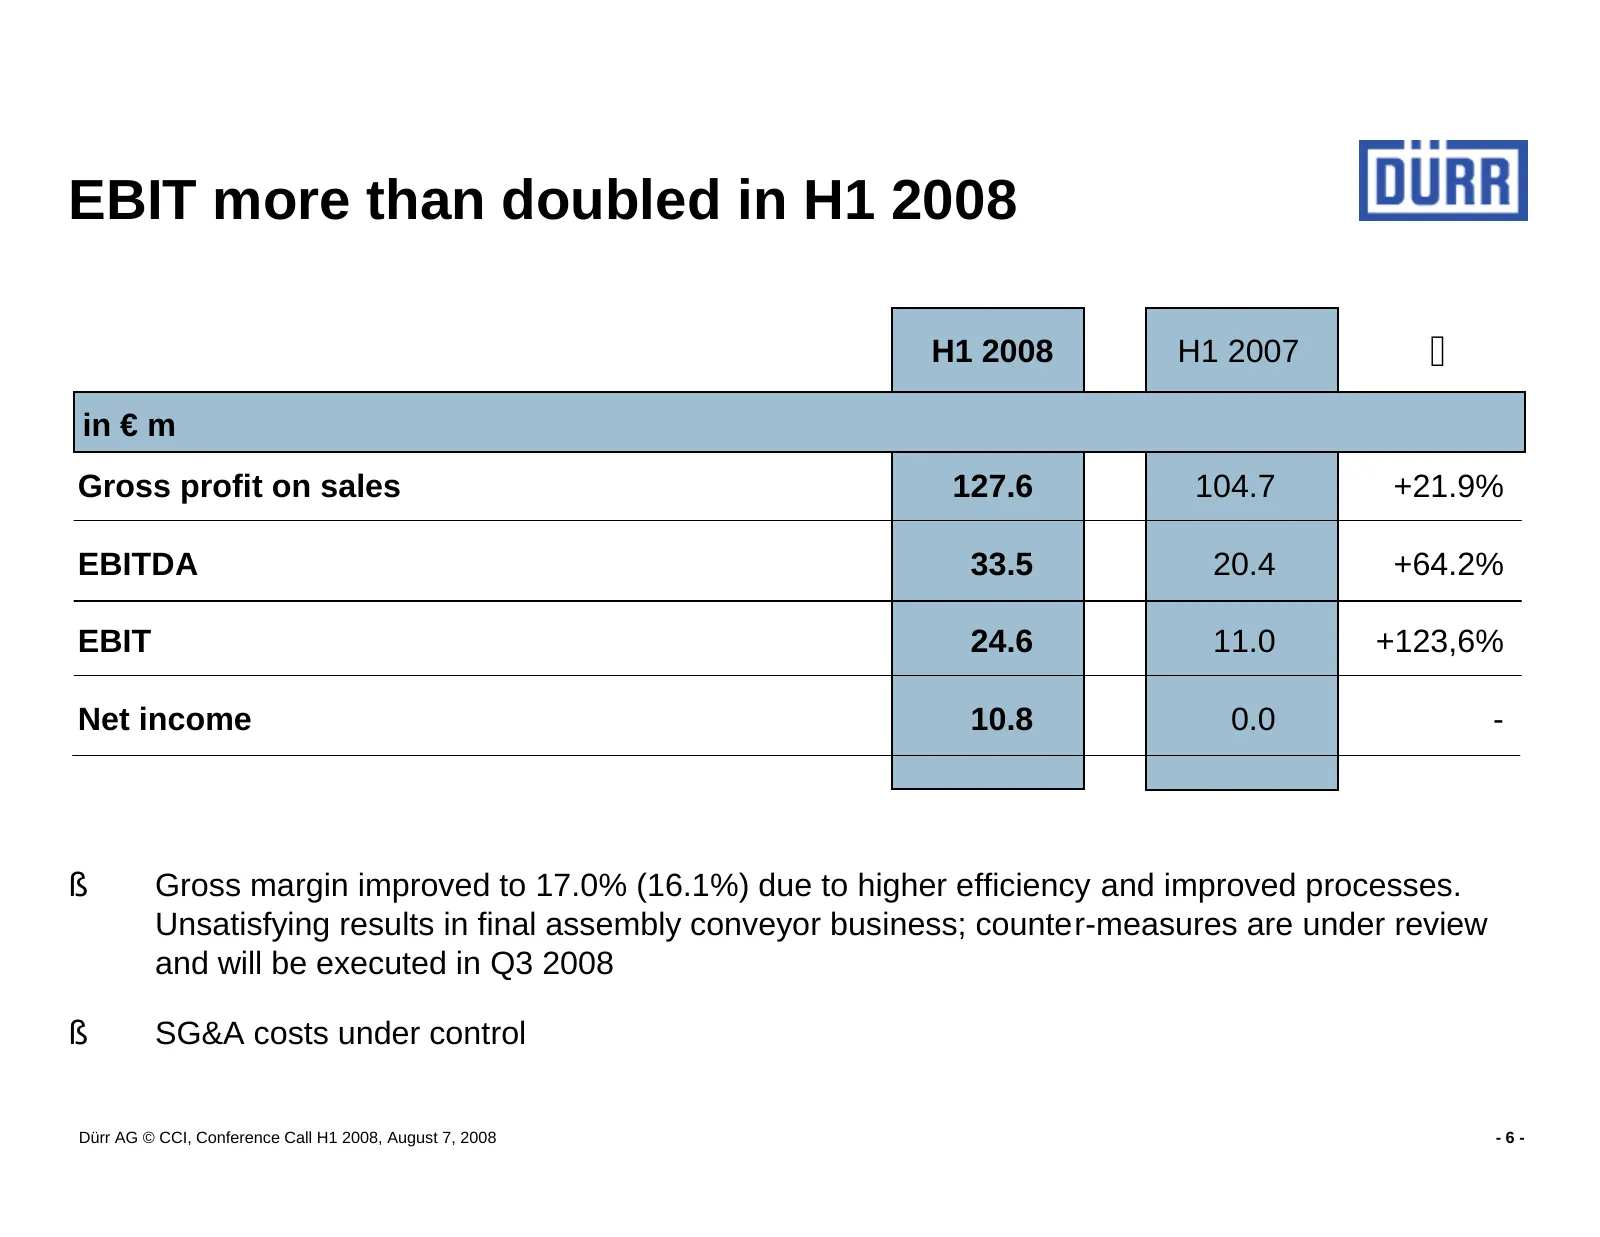
Slide 6: EBIT more than doubled in H1 2008
EBIT more than doubled in H1 2008 H1 2008 H1 2007 ∆ in € m Gross profit on sales 127.6 104.7 +21.9% EBITDA 33.5 20.4 +64.2% EBIT 24.6 11.0 +123,6% Net income 10.8 0.0 - § Gross margin improved to 17.0% (16.1%) due to higher efficiency and improved processes. Unsatisfying results in final assembly co
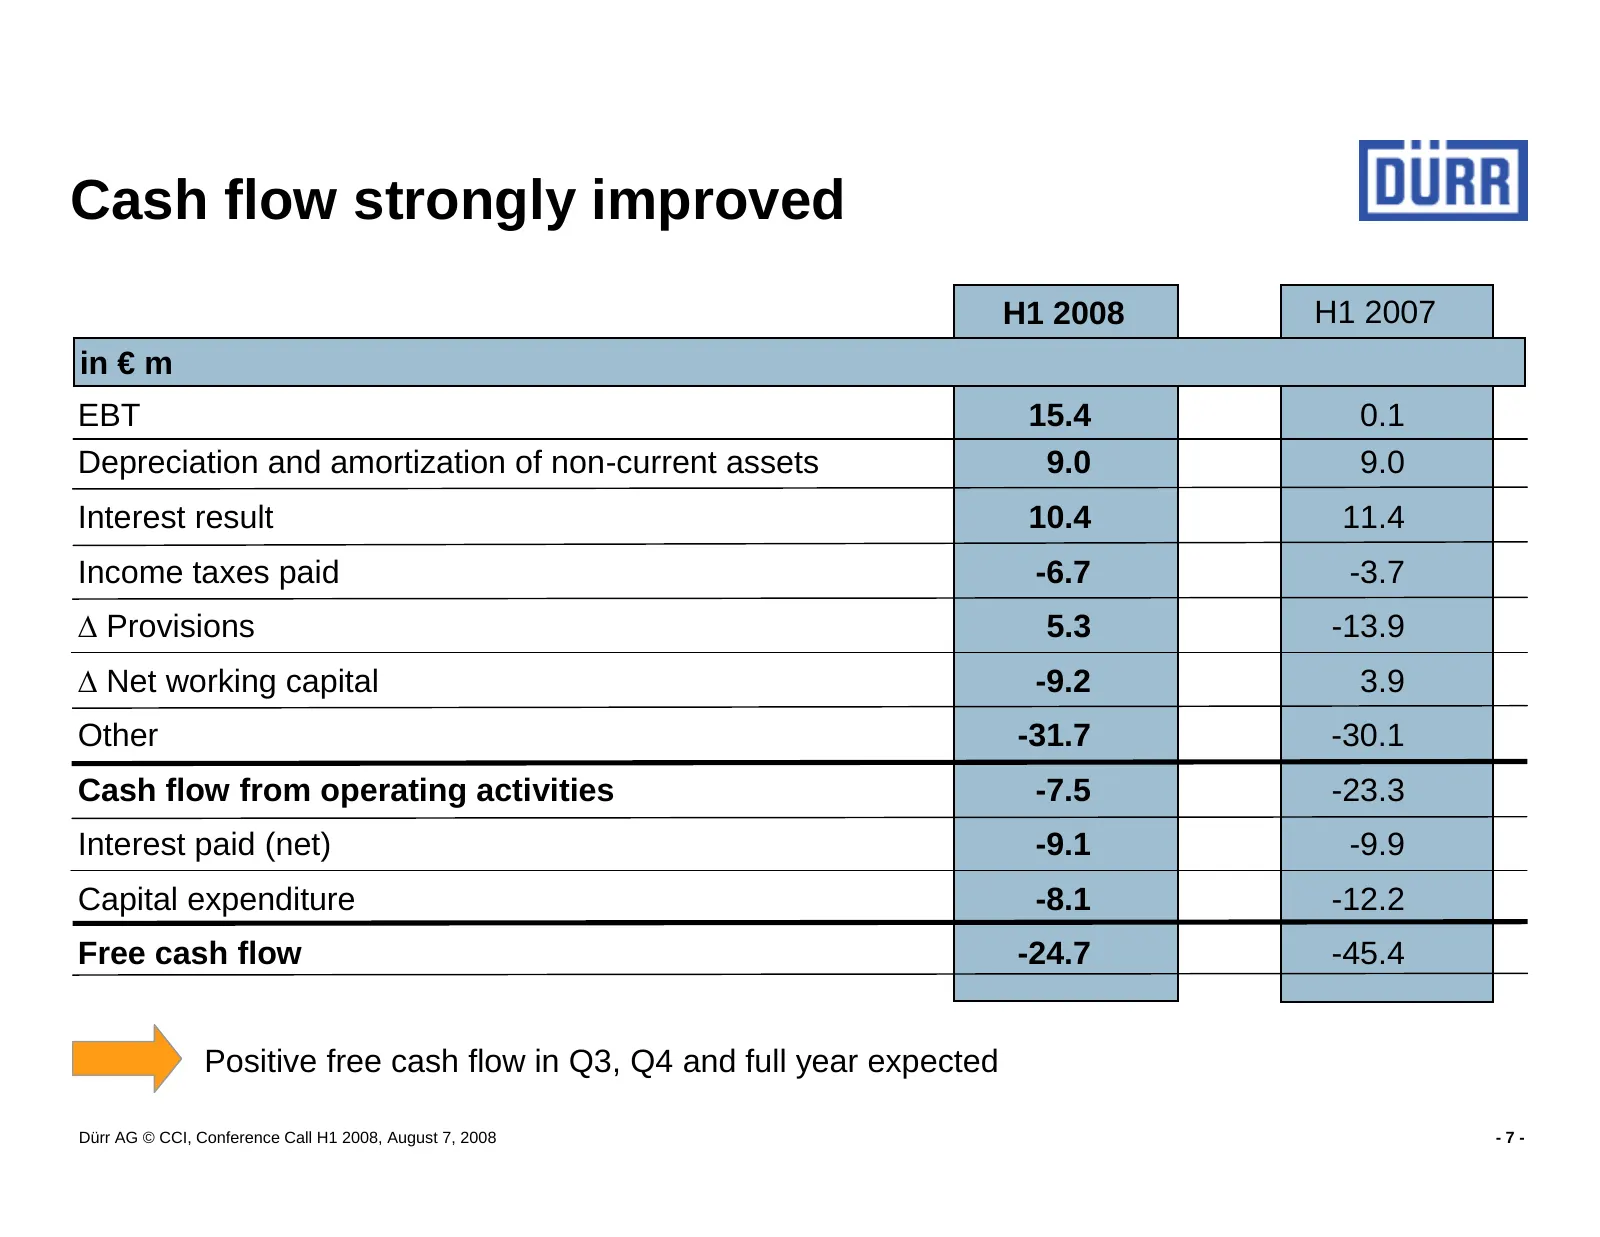
Slide 7: Cash flow strongly improved
Cash flow strongly improved H1 2008 H1 2007 in € m EBT 15.4 0.1 Depreciation and amortization of non-current assets 9.0 9.0 Interest result 10.4 11.4 Income taxes paid -6.7 -3.7 ∆ Provisions 5.3 -13.9 ∆ Net working capital -9.2 3.9 Other -31.7 -30.1 Cash flow from operating activities -7.5 -23.3 Int
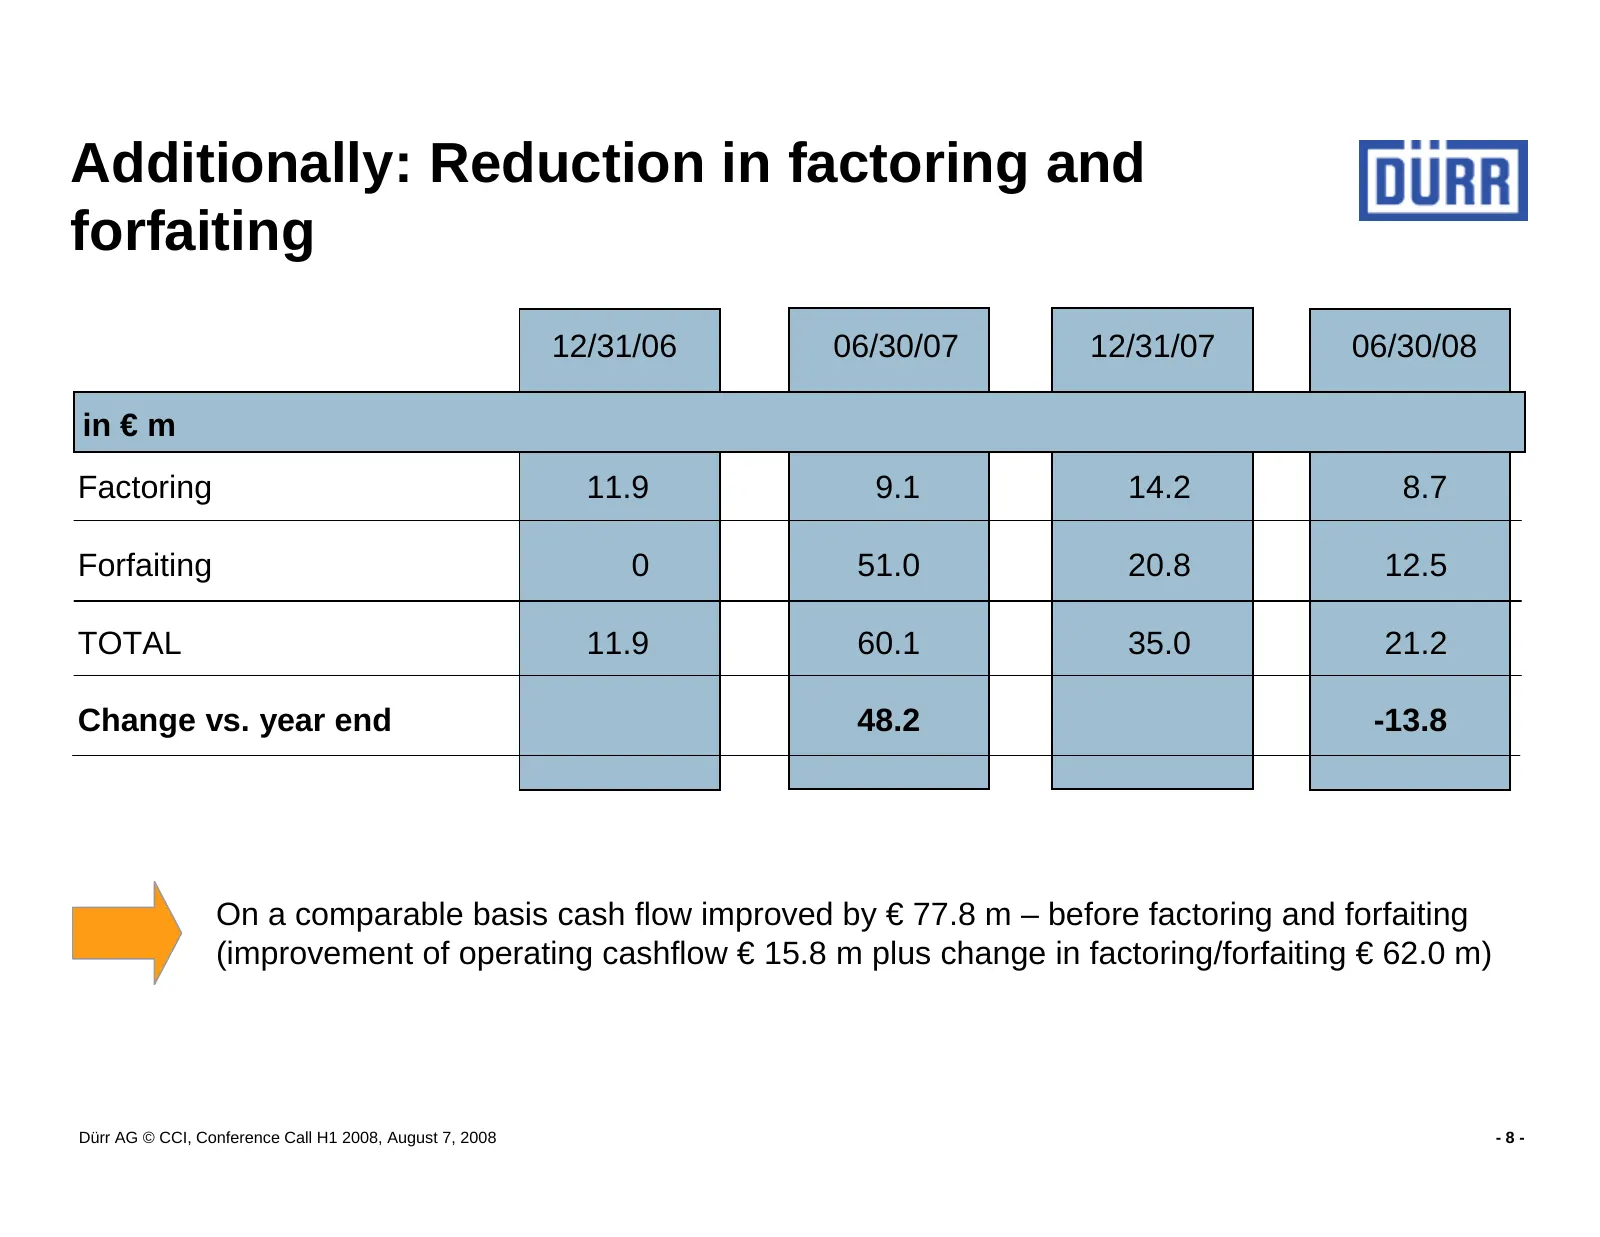
Slide 8: Additionally: Reduction in factoring and forfaiting
Additionally: Reduction in factoring and forfaiting 12/31/06 06/30/07 12/31/07 06/30/08 in € m Factoring 11.9 9.1 14.2 8.7 Forfaiting 0 51.0 20.8 12.5 TOTAL 11.9 60.1 35.0 21.2 Change vs. year end 48.2 -13.8 On a comparable basis cash flow improved by € 77.8 m – before factoring and forfaiting (impr
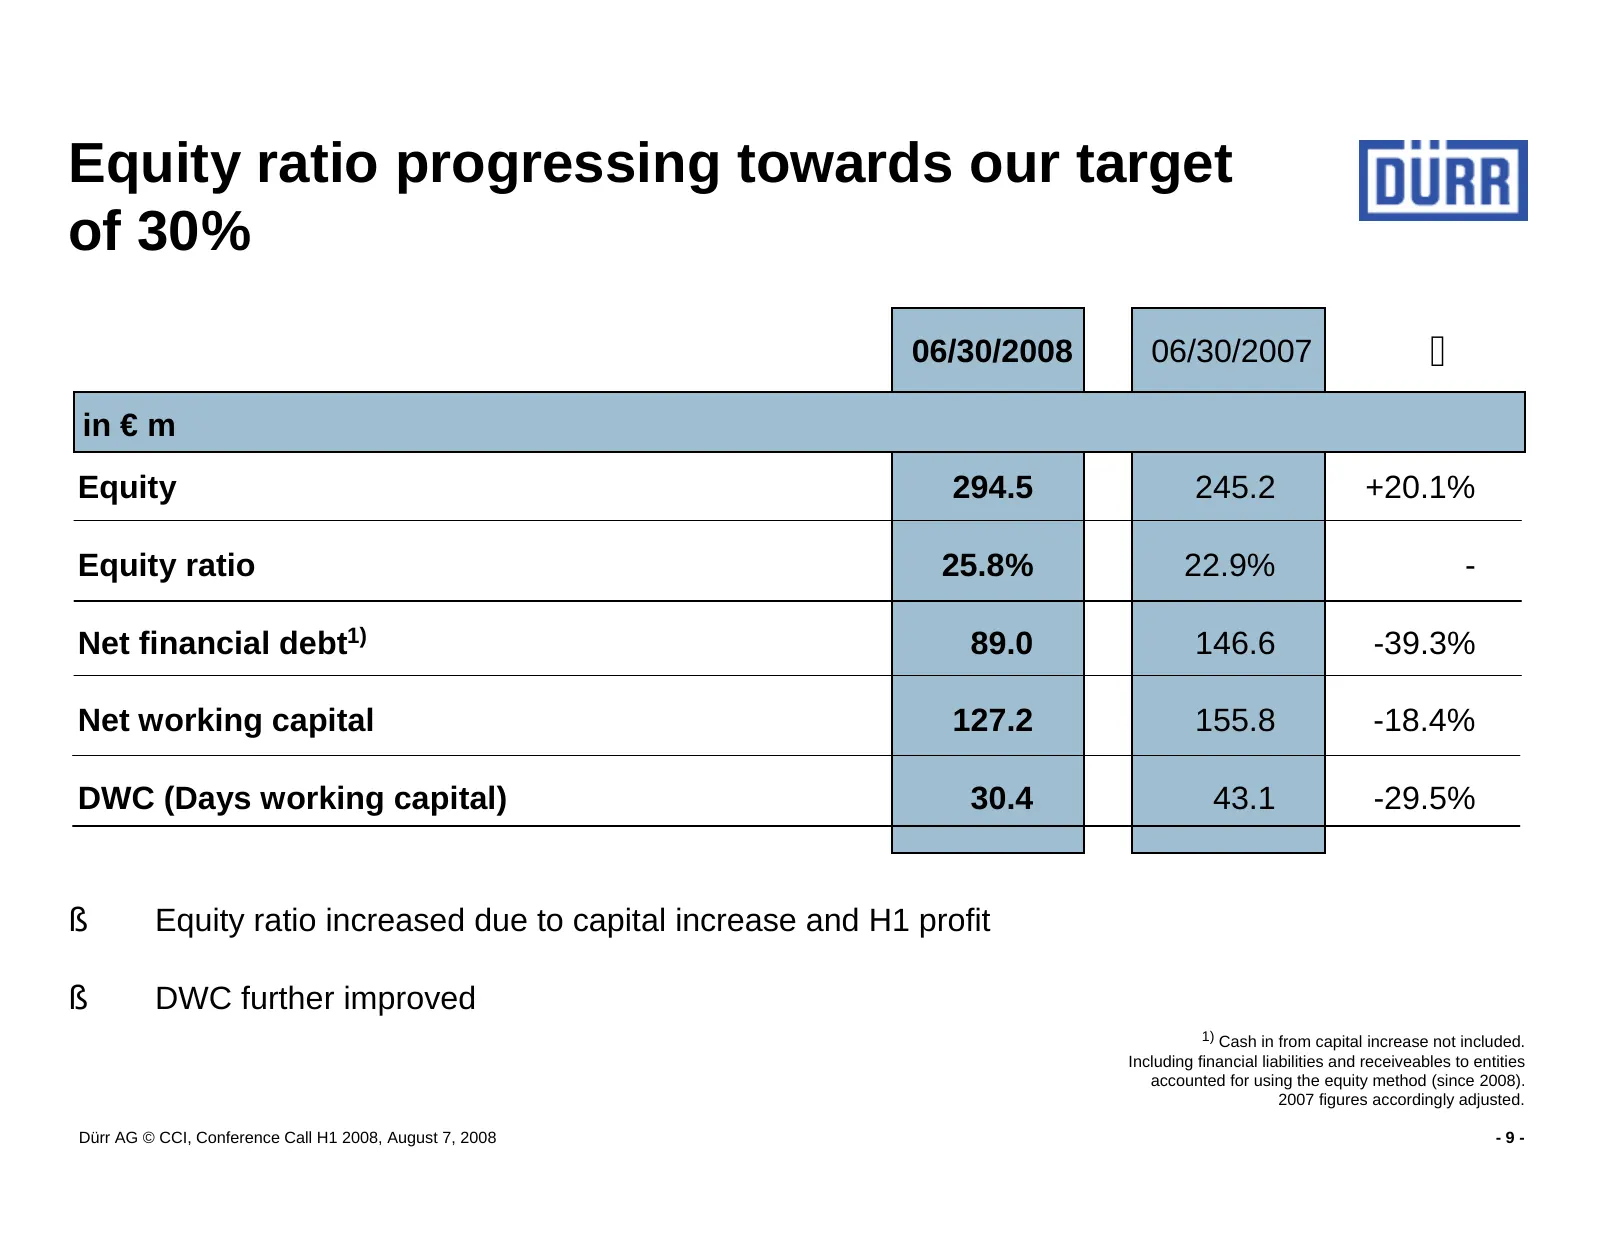
Slide 9: Equity ratio progressing towards our target of 30%
Equity ratio progressing towards our target of 30% 06/30/2008 06/30/2007 ∆ in € m Equity 294.5 245.2 +20.1% Equity ratio 25.8% 22.9% - Net financial debt1) 89.0 146.6 -39.3% Net working capital 127.2 155.8 -18.4% DWC (Days working capital) 30.4 43.1 -29.5% § Equity ratio increased due to capital inc
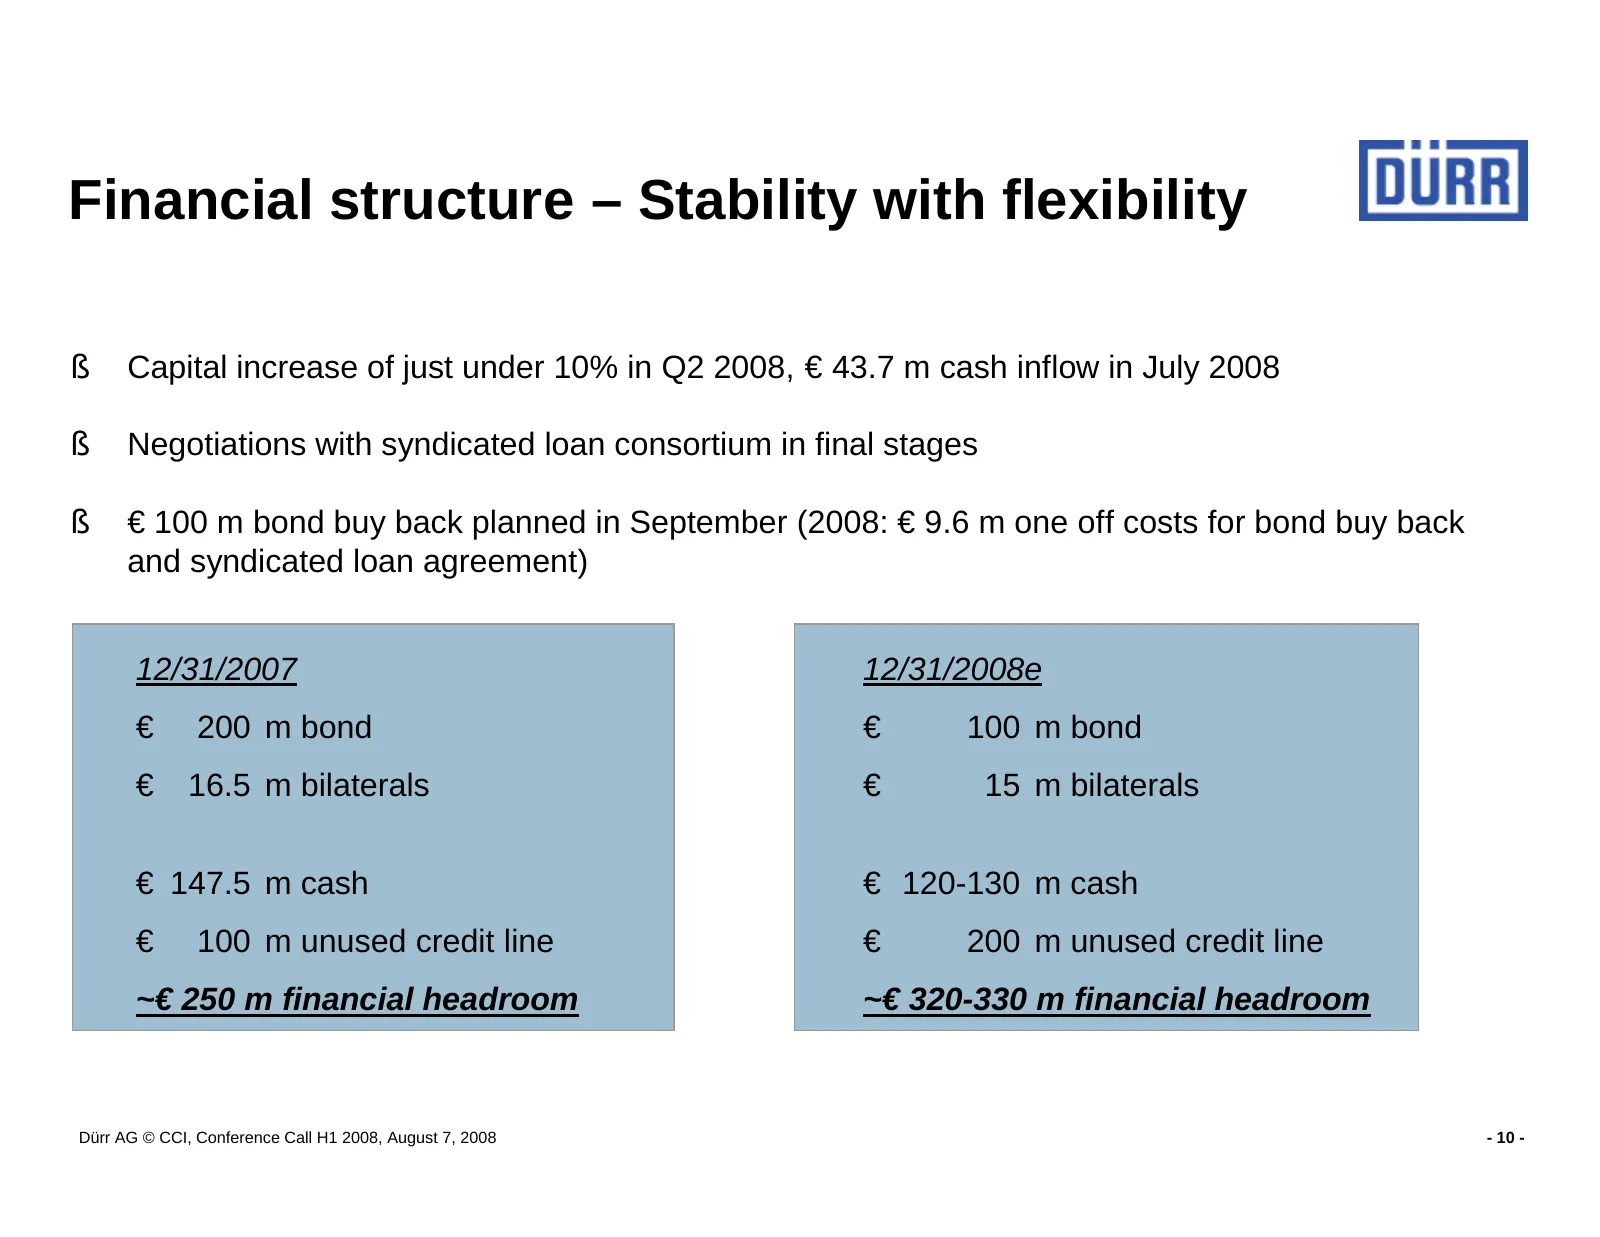
Slide 10: Financial structure – Stability with flexibility
Financial structure – Stability with flexibility § Capital increase of just under 10% in Q2 2008, € 43.7 m cash inflow in July 2008 § Negotiations with syndicated loan consortium in final stages § € 100 m bond buy back planned in September (2008: € 9.6 m one off costs for bond buy back and syndicate
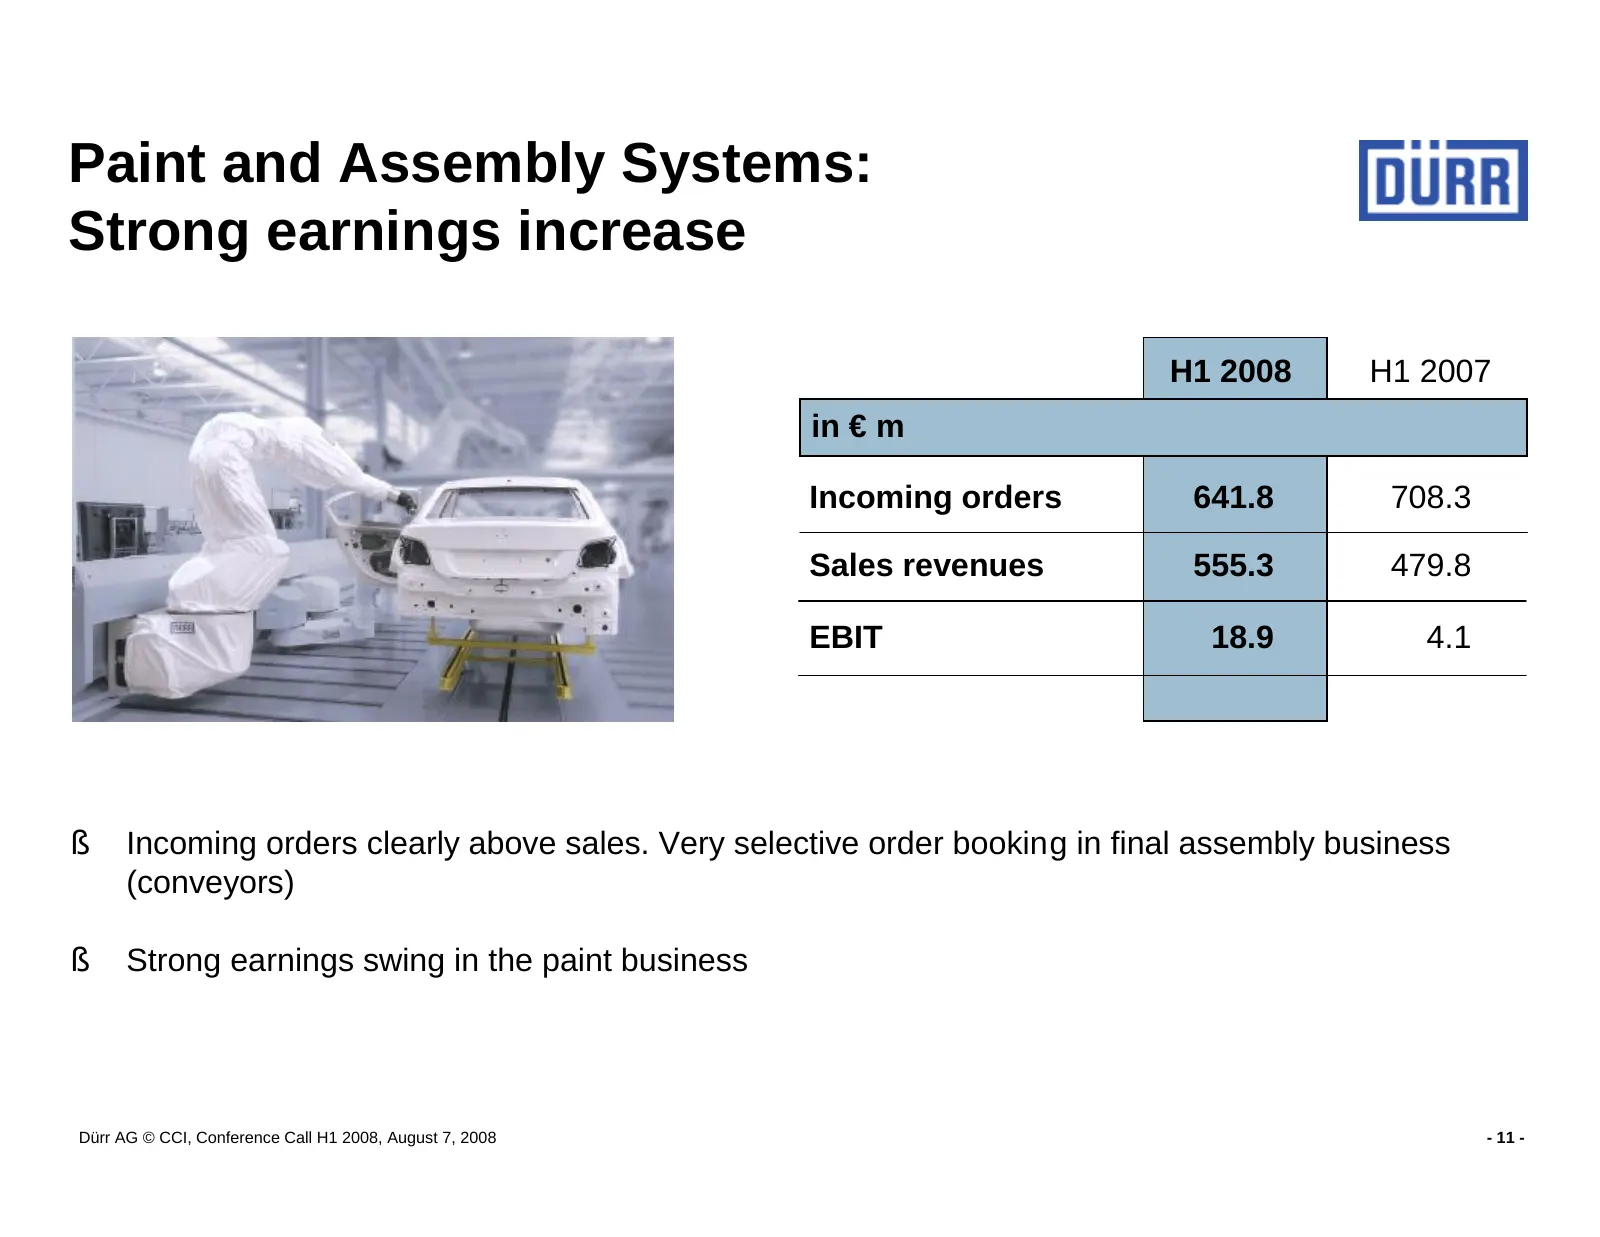
Slide 11: Paint and Assembly Systems: Strong earnings increase
Paint and Assembly Systems: Strong earnings increase H1 2008 H1 2007 in € m Incoming orders 641.8 708.3 Sales revenues 555.3 479.8 EBIT 18.9 4.1 § Incoming orders clearly above sales. Very selective order booking in final assembly business (conveyors) § Strong earnings swing in the paint business Dü
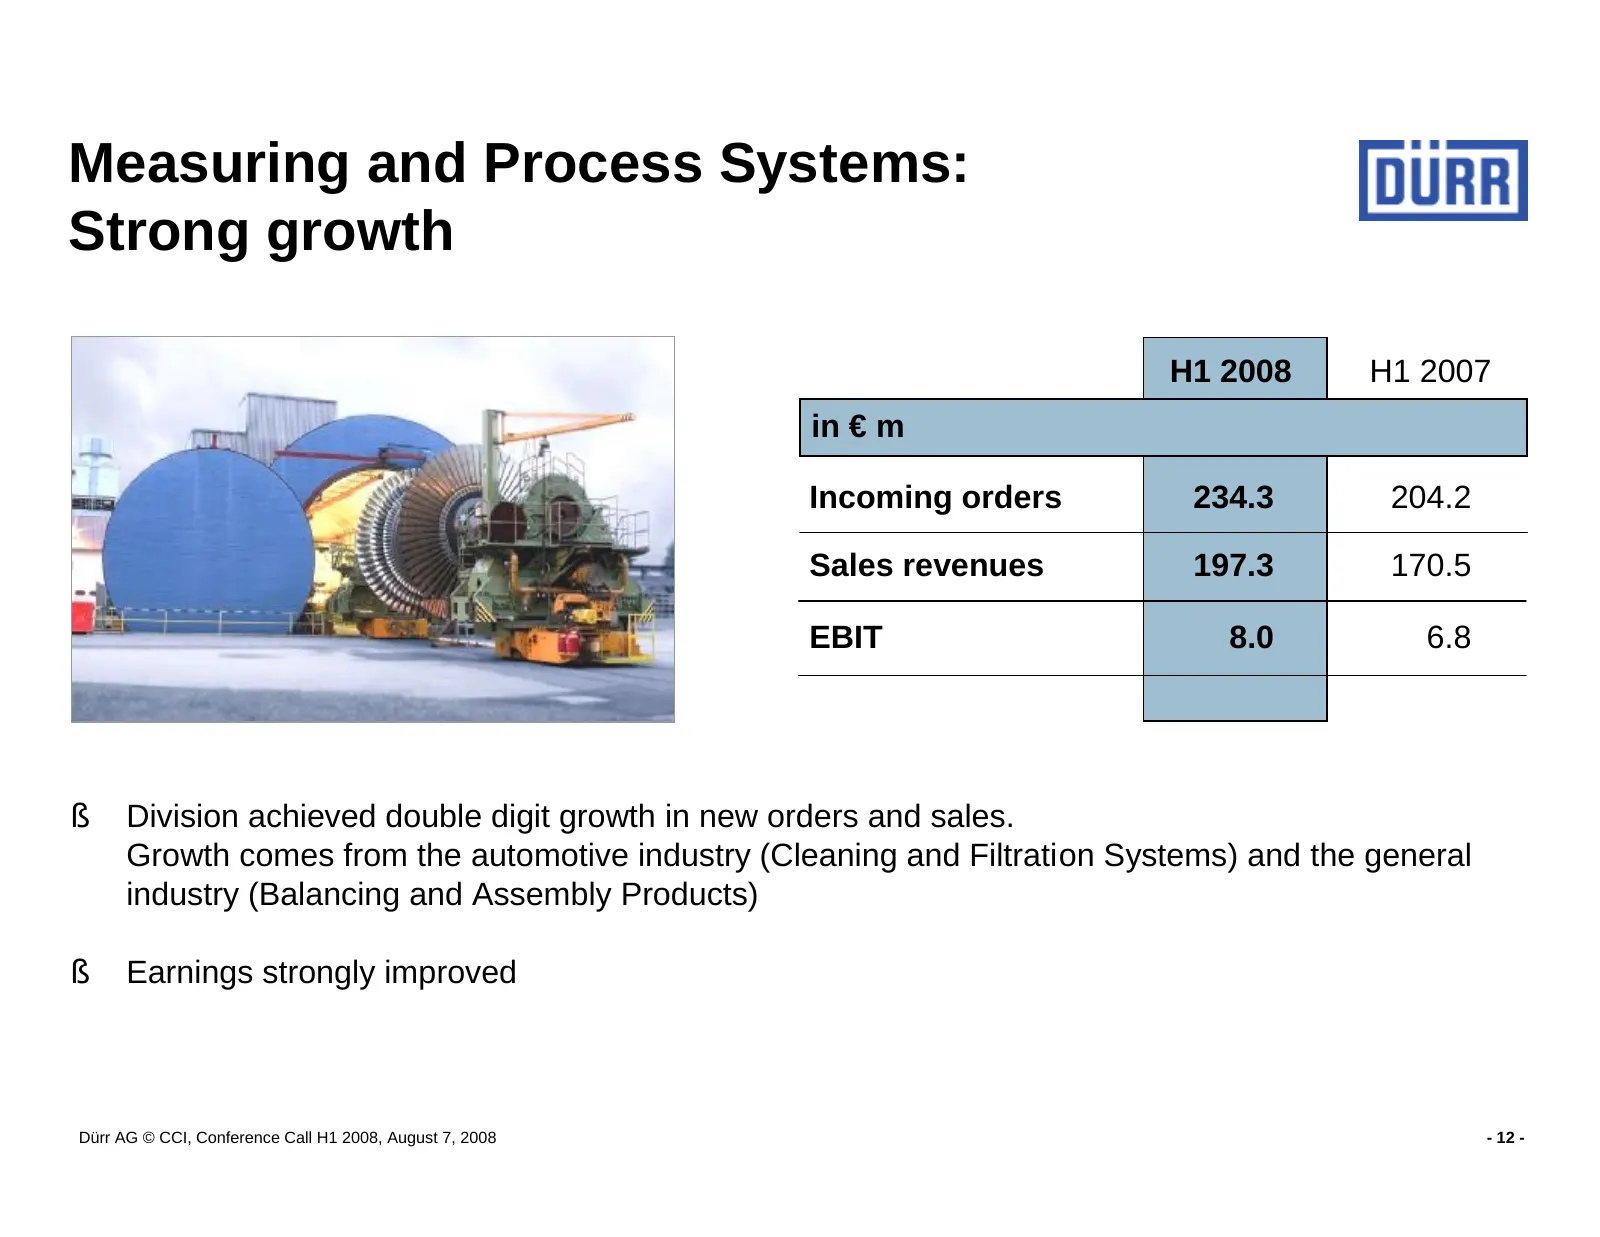
Slide 12: Measuring and Process Systems: Strong growth
Measuring and Process Systems: Strong growth H1 2008 H1 2007 in € m Incoming orders 234.3 204.2 Sales revenues 197.3 170.5 EBIT 8.0 6.8 § Division achieved double digit growth in new orders and sales. Growth comes from the automotive industry (Cleaning and Filtration Systems) and the general industr
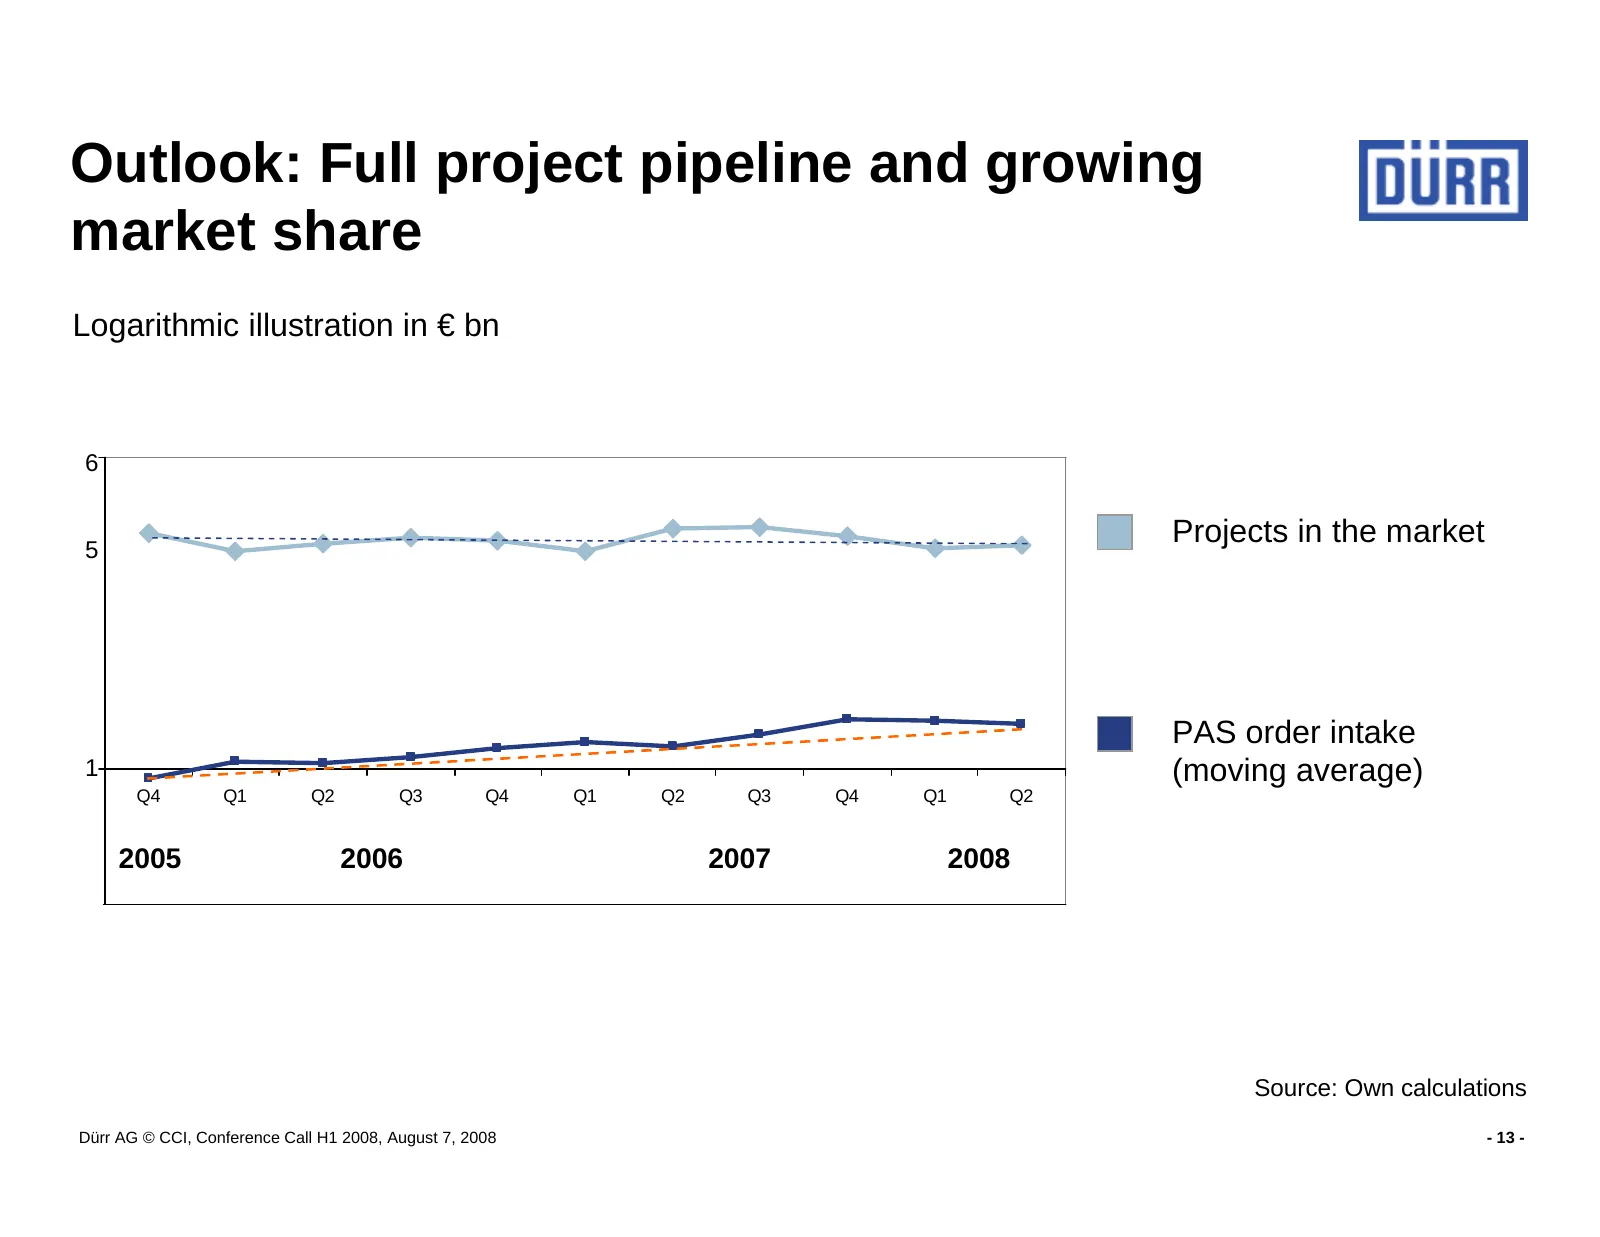
Slide 13: Outlook: Full project pipeline and growing market share
Outlook: Full project pipeline and growing market share Logarithmic illustration in € bn 10 6 5 Projects in the market PAS order intake 11 (moving average) Q4 Q1 Q2 Q3 Q4 Q1 Q2 Q3 Q4 Q1 Q2 2005 2006 2007 2008 Source: Own calculations Dürr AG © CCI, Conference Call H1 2008, August 7, 2008 - 13 -
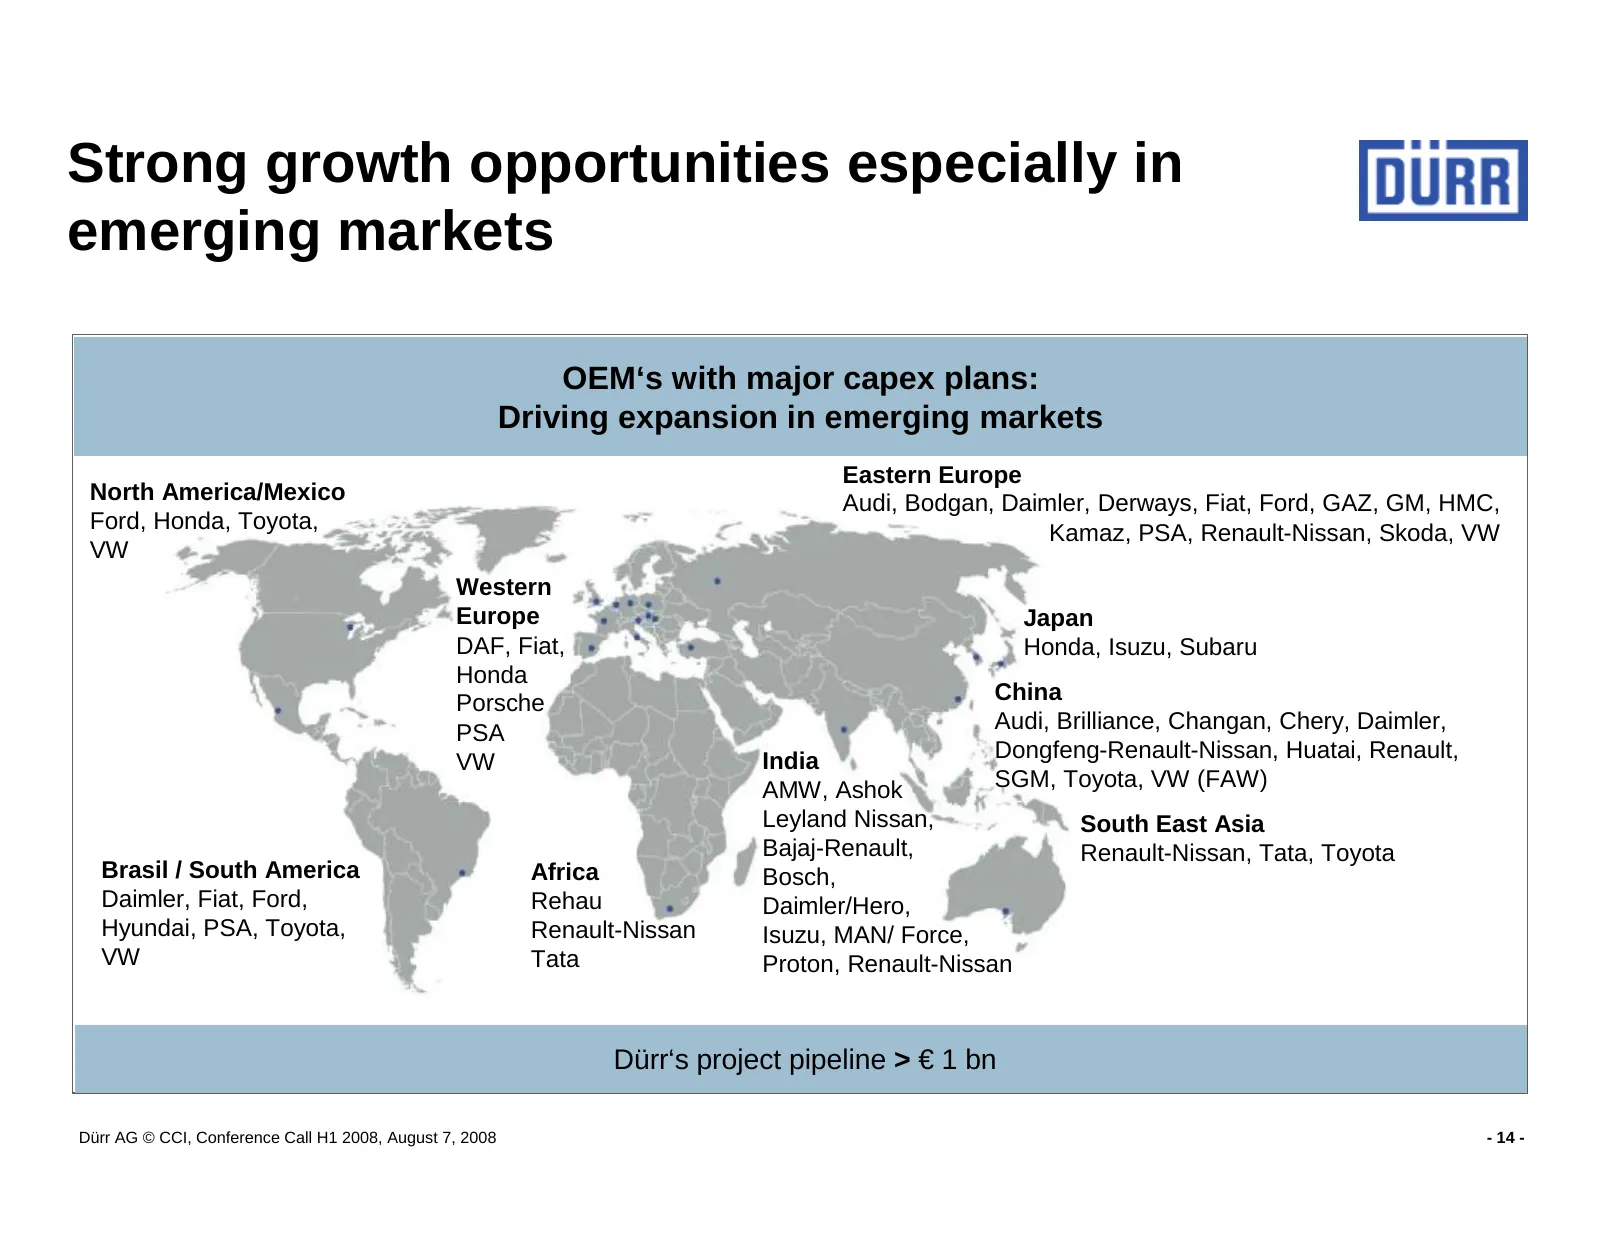
Slide 14: Strong growth opportunities especially in emerging markets
Strong growth opportunities especially in emerging markets OEM‘s with major capex plans: Driving expansion in emerging markets Eastern Europe North America/Mexico Audi, Bodgan, Daimler, Derways, Fiat, Ford, GAZ, GM, HMC, Ford, Honda, Toyota, Kamaz, PSA, Renault-Nissan, Skoda, VW VW Western Europe Ja
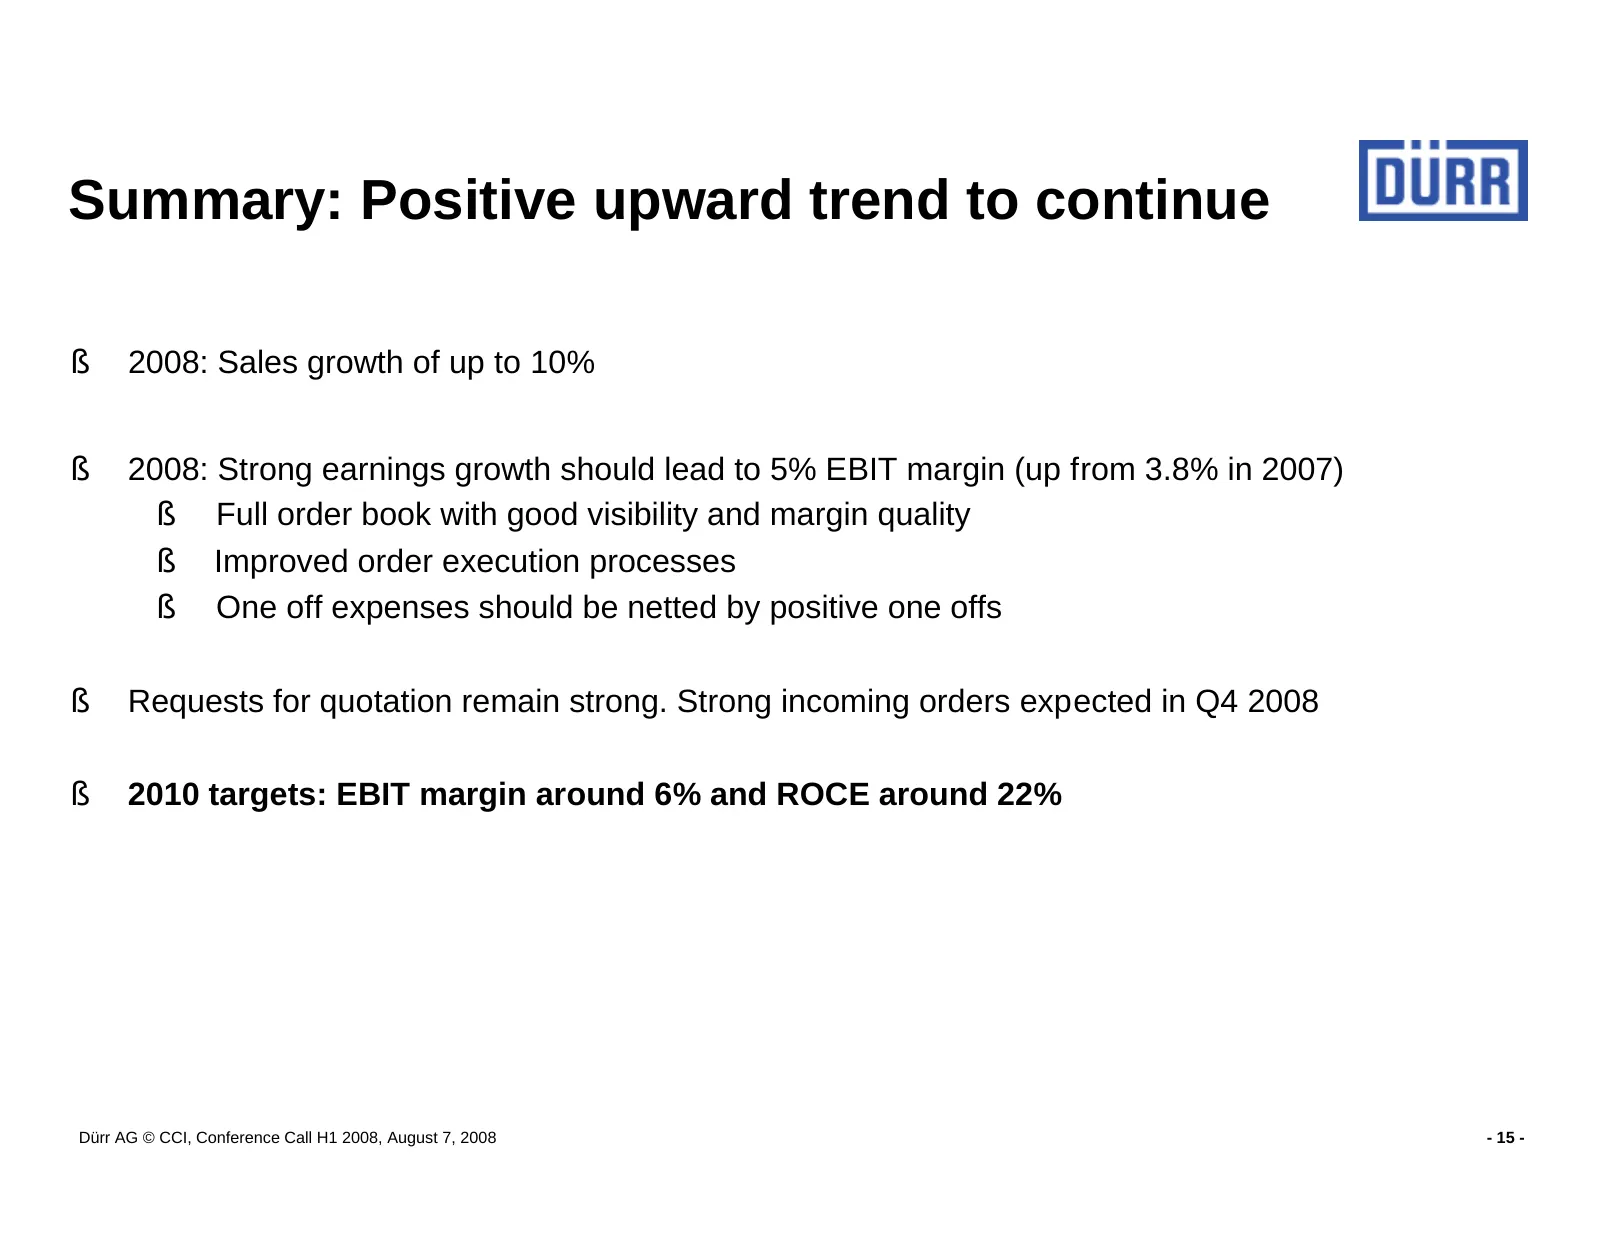
Slide 15: Summary: Positive upward trend to continue
Summary: Positive upward trend to continue § 2008: Sales growth of up to 10% § 2008: Strong earnings growth should lead to 5% EBIT margin (up from 3.8% in 2007) § Full order book with good visibility and margin quality § Improved order execution processes § One off expenses should be netted by posit
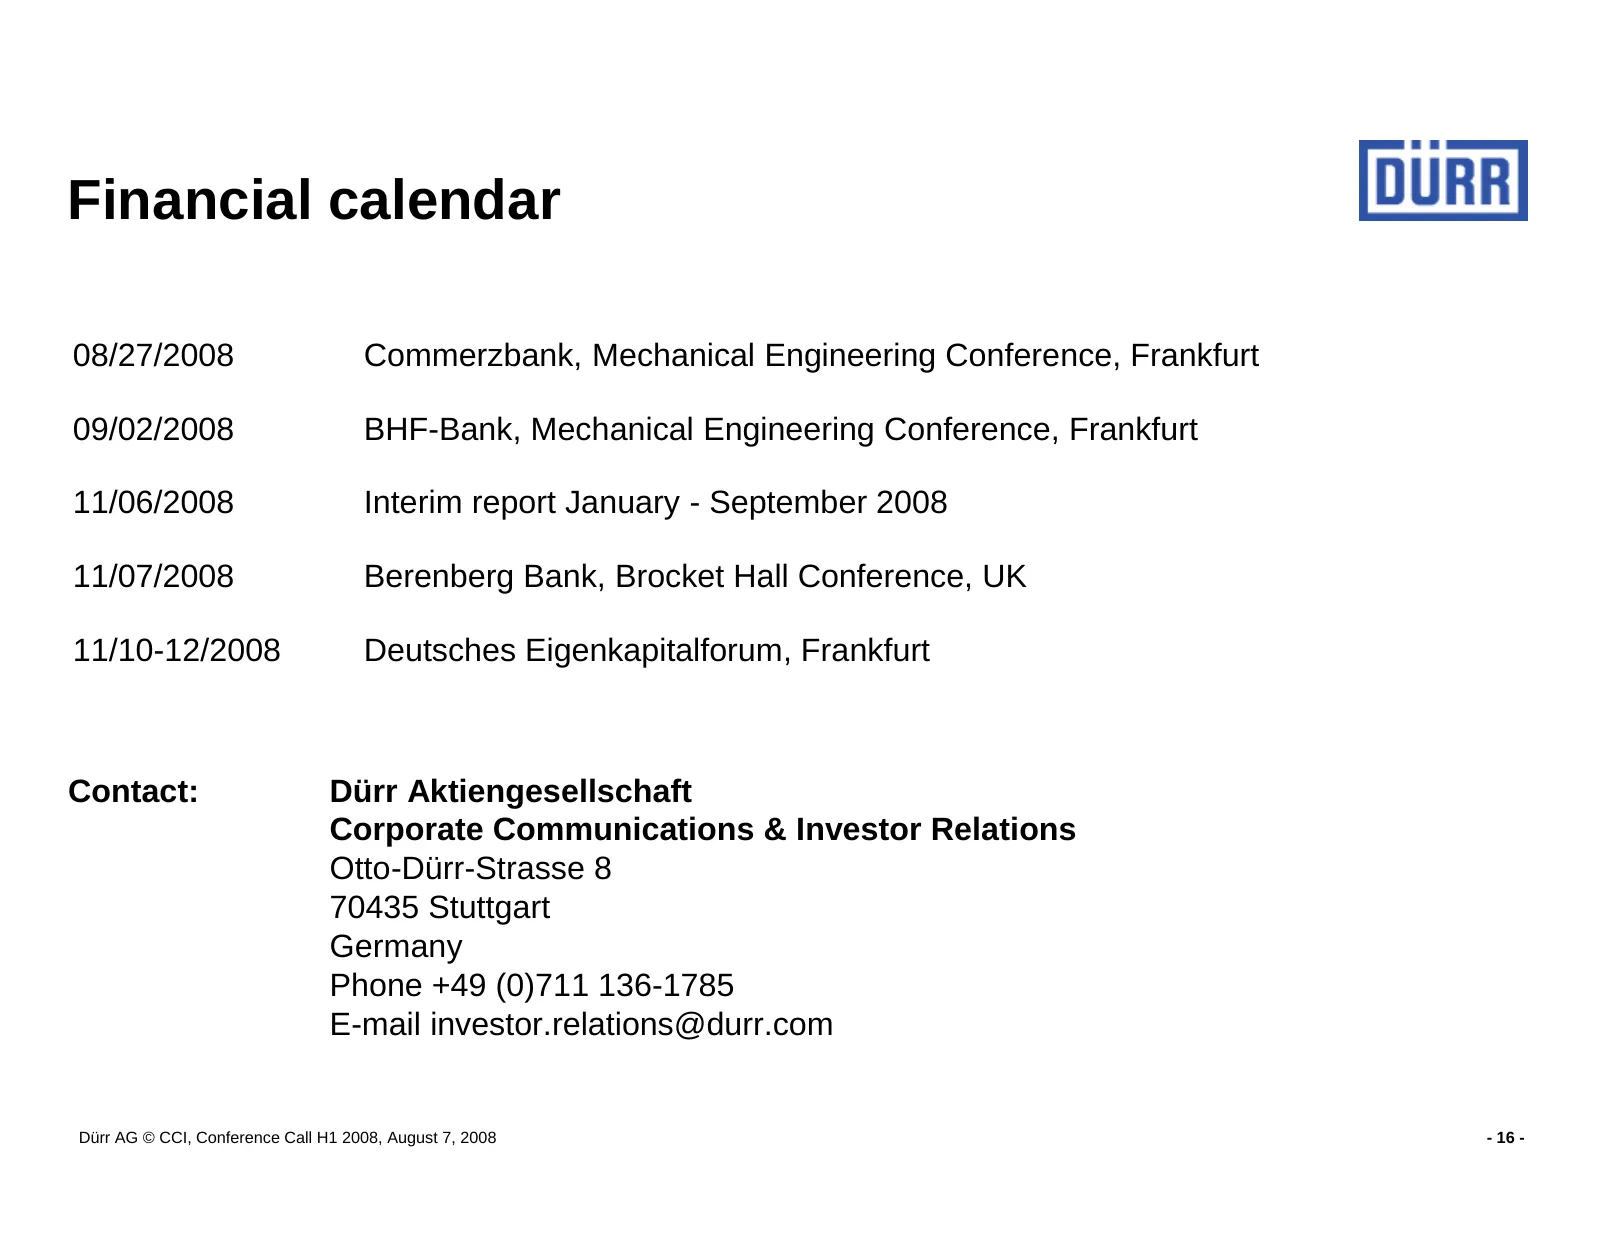
Slide 16: Financial calendar
Financial calendar 08/27/2008 Commerzbank, Mechanical Engineering Conference, Frankfurt 09/02/2008 BHF-Bank, Mechanical Engineering Conference, Frankfurt 11/06/2008 Interim report January - September 2008 11/07/2008 Berenberg Bank, Brocket Hall Conference, UK 11/10-12/2008 Deutsches Eigenkapitalforu
Slide 17: Dürr AG © CCI, Conference Call H1 2008, August 7, 2008
Dürr AG © CCI, Conference Call H1 2008, August 7, 2008 - 17 -
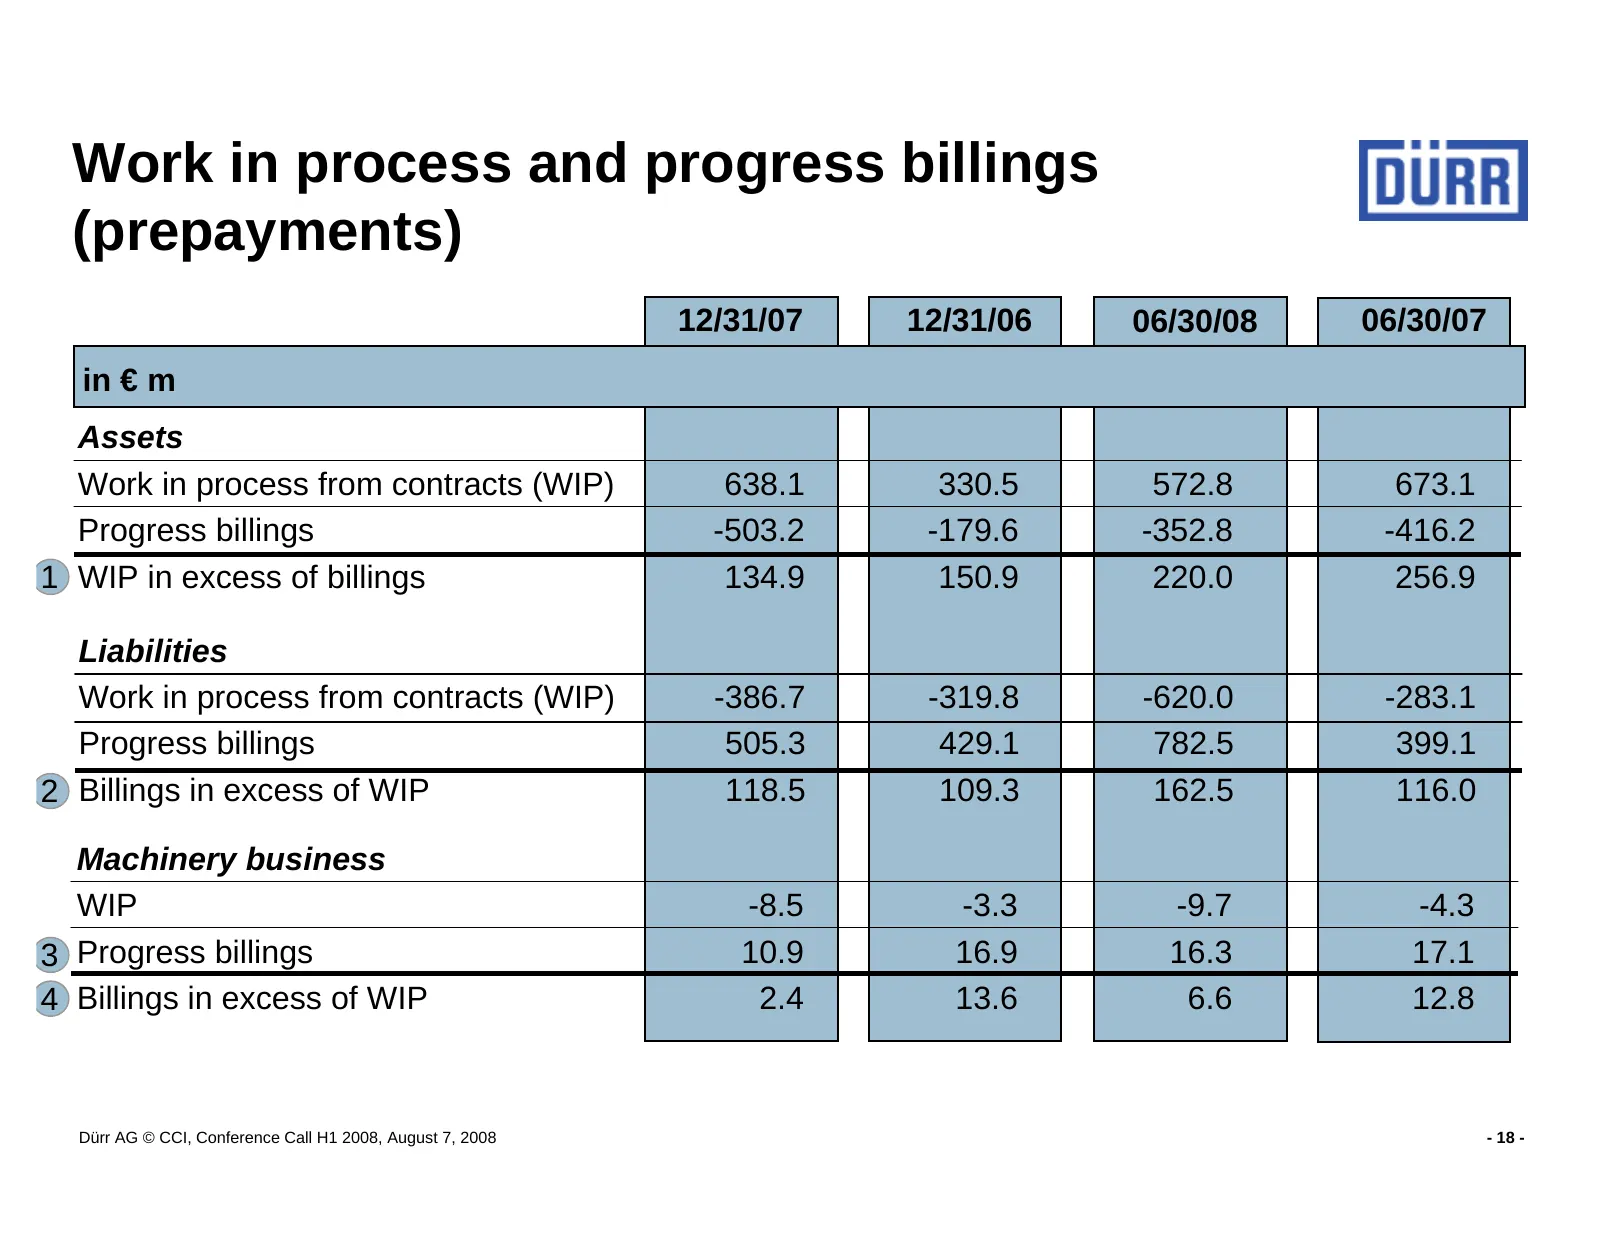
Slide 18: Work in process and progress billings (prepayments)
Work in process and progress billings (prepayments) 12/31/07 12/31/06 06/30/08 06/30/07 in € m Assets Work in process from contracts (WIP) 638.1 330.5 572.8 673.1 Progress billings -503.2 -179.6 -352.8 -416.2 1 WIP in excess of billings 134.9 150.9 220.0 256.9 Liabilities Work in process from contra
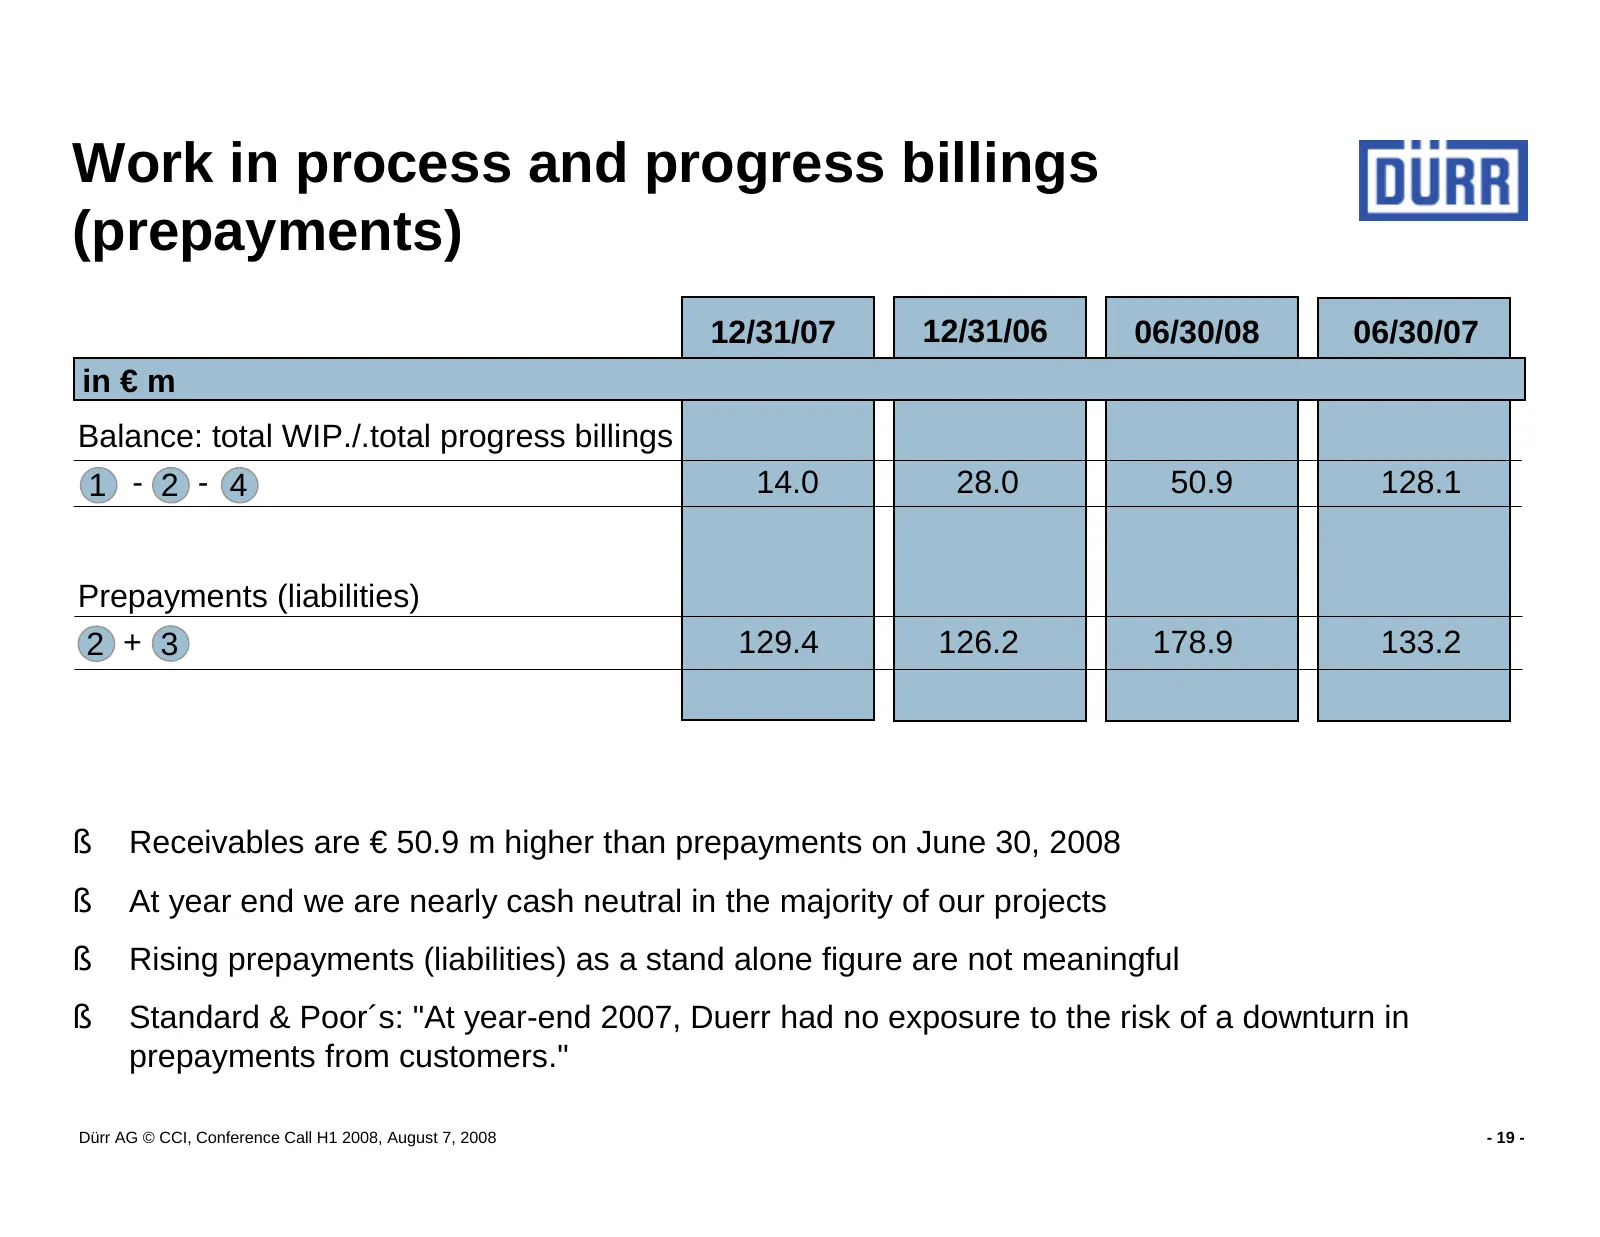
Slide 19: Work in process and progress billings (prepayments)
Work in process and progress billings (prepayments) 12/31/07 12/31/06 06/30/08 06/30/07 in € m Balance: total WIP./.total progress billings 1 - 2 - 4 14.0 28.0 50.9 128.1 Prepayments (liabilities) 2 + 3 129.4 126.2 178.9 133.2 § Receivables are € 50.9 m higher than prepayments on June 30, 2008 § At
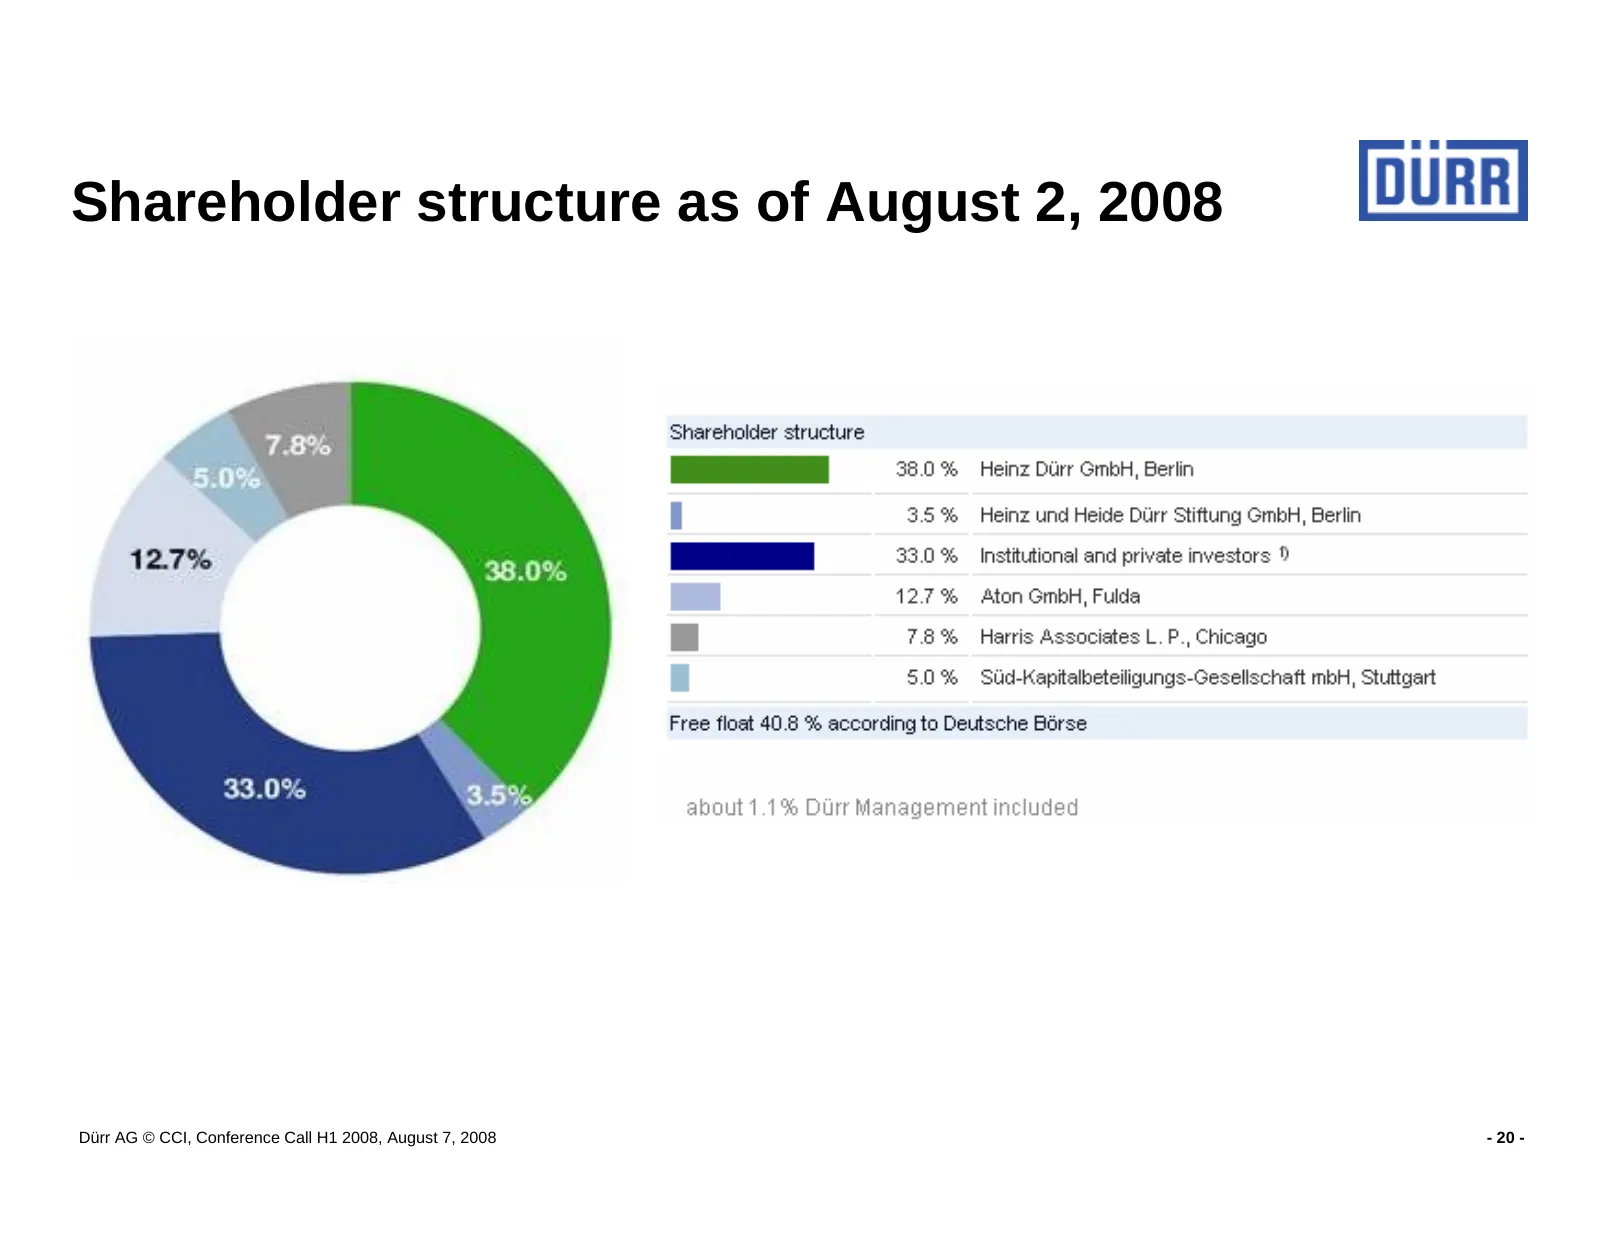
Slide 20: Shareholder structure as of August 2, 2008
Shareholder structure as of August 2, 2008 Dürr AG © CCI, Conference Call H1 2008, August 7, 2008 - 20 -
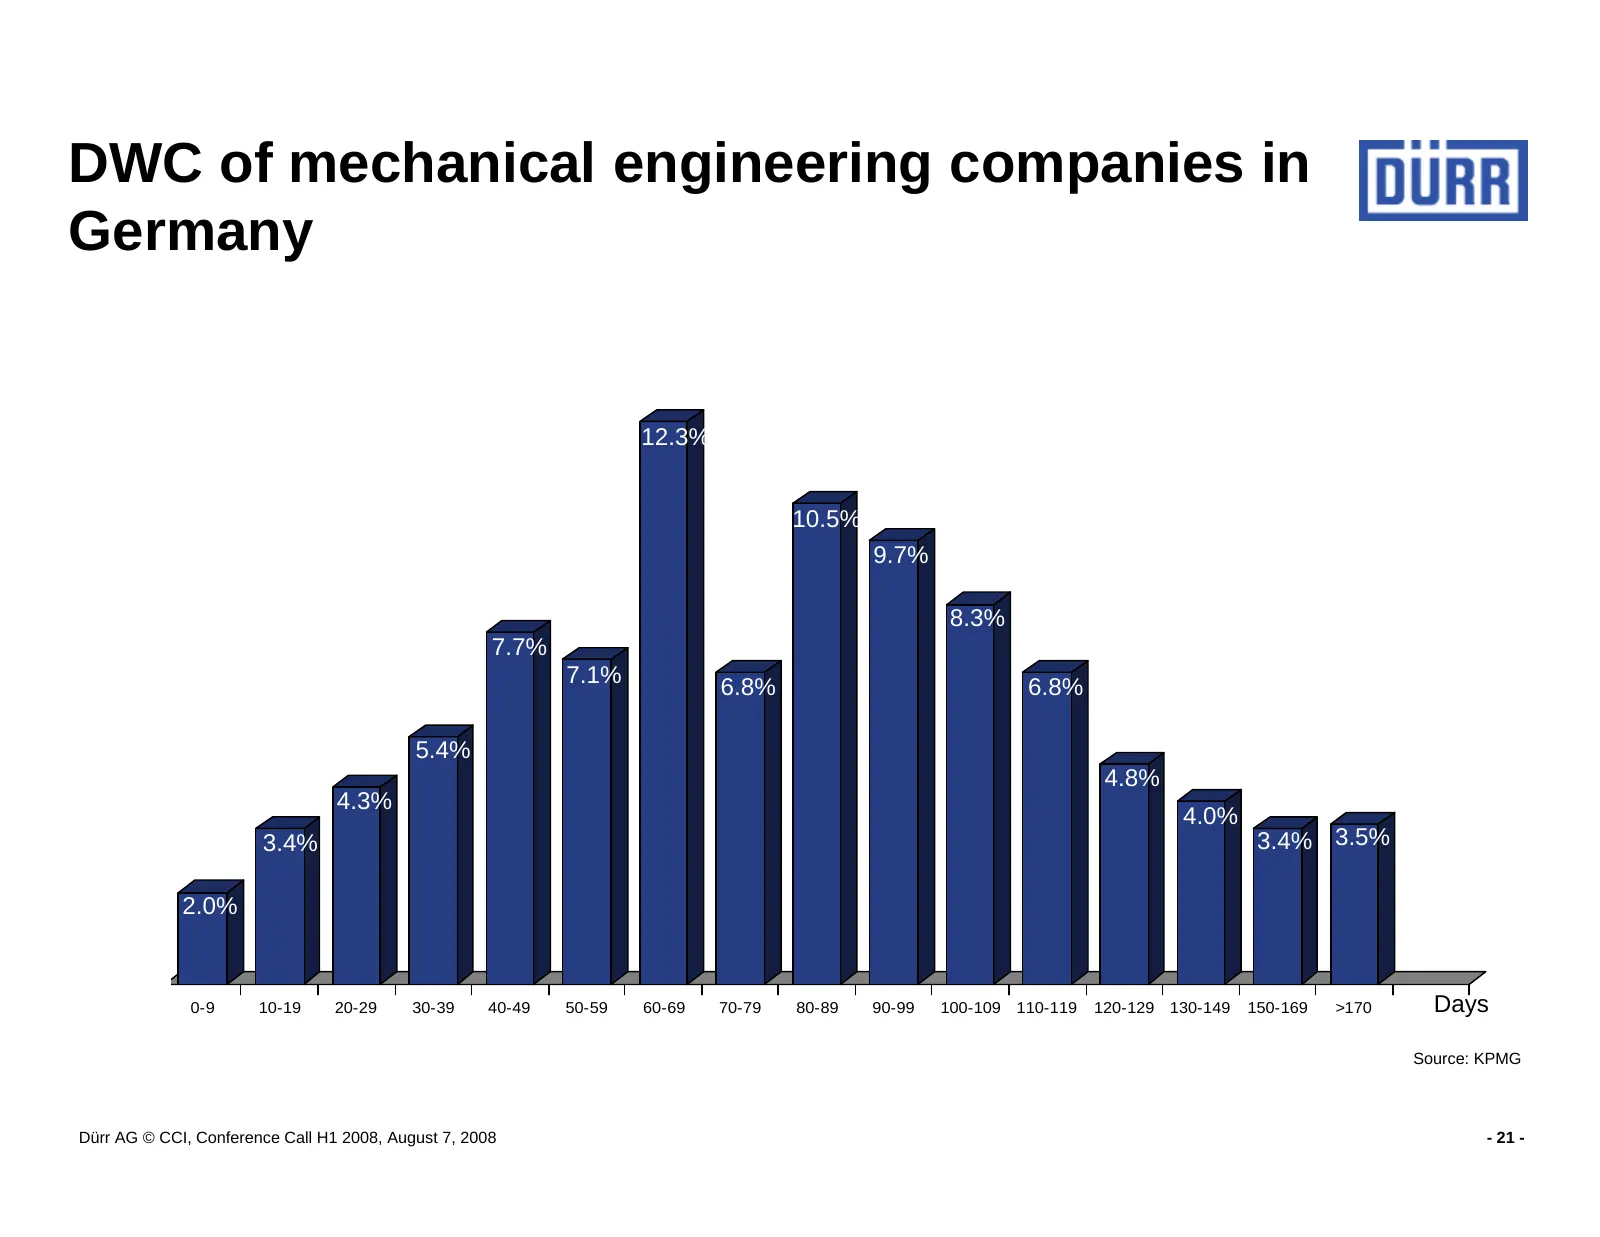
Slide 21: DWC of mechanical engineering companies in Germany
DWC of mechanical engineering companies in Germany 14,0% 12,0% 12.3% 10,0% 10.5% 9.7% 8,0% 8.3% 7.7% 7.1% 6.8% 6.8% 6,0% 5.4% 4.8% 4,0% 4.3% 4.0% 3.4% 3.4% 3.5% 2,0% 2.0% 0,0% 0-9 10-19 20-29 30-39 40-49 50-59 60-69 70-79 80-89 90-99 100-109 110-119 120-129 130-149 150-169 >170 Days Source: KPMG Dür
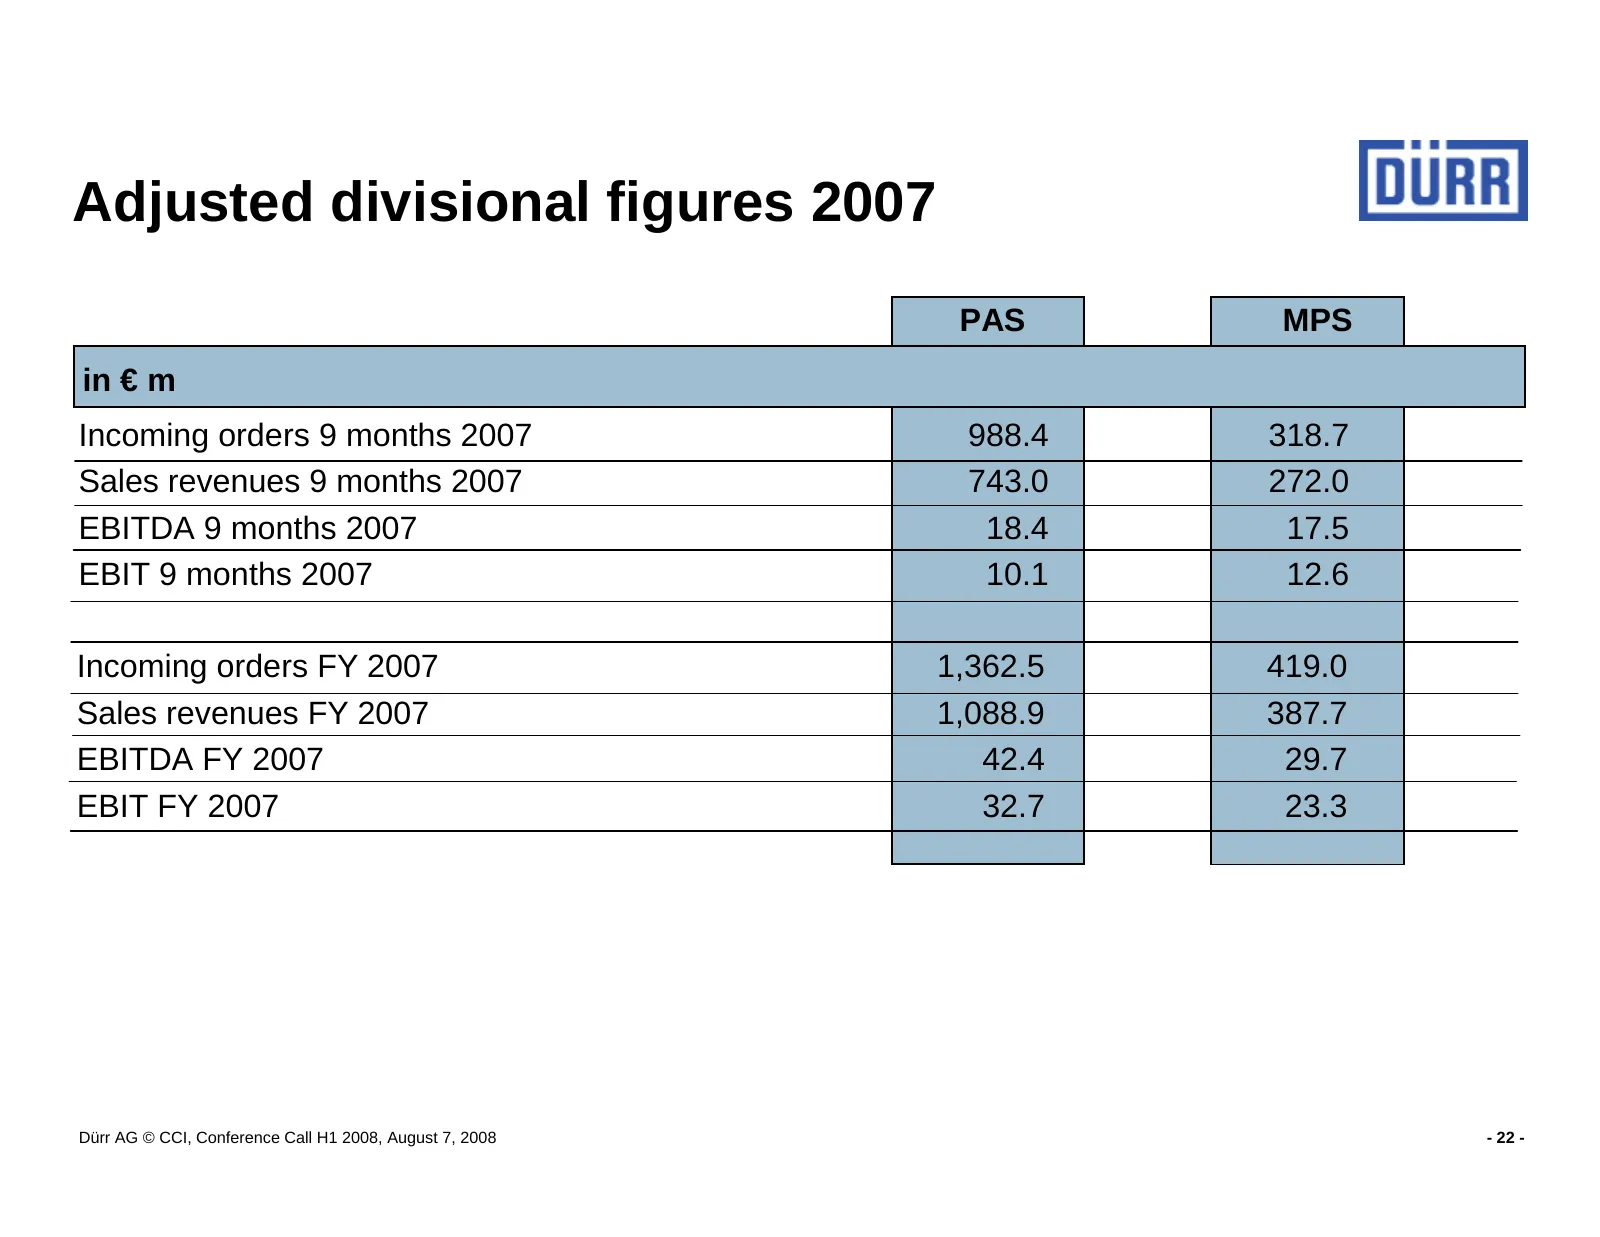
Slide 22: Adjusted divisional figures 2007
Adjusted divisional figures 2007 PAS MPS in € m Incoming orders 9 months 2007 988.4 318.7 Sales revenues 9 months 2007 743.0 272.0 EBITDA 9 months 2007 18.4 17.5 EBIT 9 months 2007 10.1 12.6 Incoming orders FY 2007 1,362.5 419.0 Sales revenues FY 2007 1,088.9 387.7 EBITDA FY 2007 42.4 29.7 EBIT FY 2
Source: Internet Archive copy of durr.com
More decks from Durr AG
 Q3 2026 Earnings Presentation33 slides · Nov 12, 2026
 Q2 2026 Earnings Presentation39 slides · Aug 6, 2026
 Q1 2026 Earnings Presentation35 slides · May 12, 2026
 Fact Sheet (2025)2 slides · Dec 2, 2025
 Q3 2025 Earnings Presentation46 slides · Nov 13, 2025
 Q2 2025 Earnings Presentation31 slides · Jul 24, 2025