Componenta Oyj · OMXHEX:CTH1V
Componenta Oyj — Q1 2002 Earnings Presentation
20 slides from Componenta Oyj's earnings presentation, Mar 31, 2002
Slide 1: Componenta Corporation Interim report 1 January - 31 March 2002
Componenta Corporation Interim report 1 January - 31 March 2002
Slide 2: Income statement
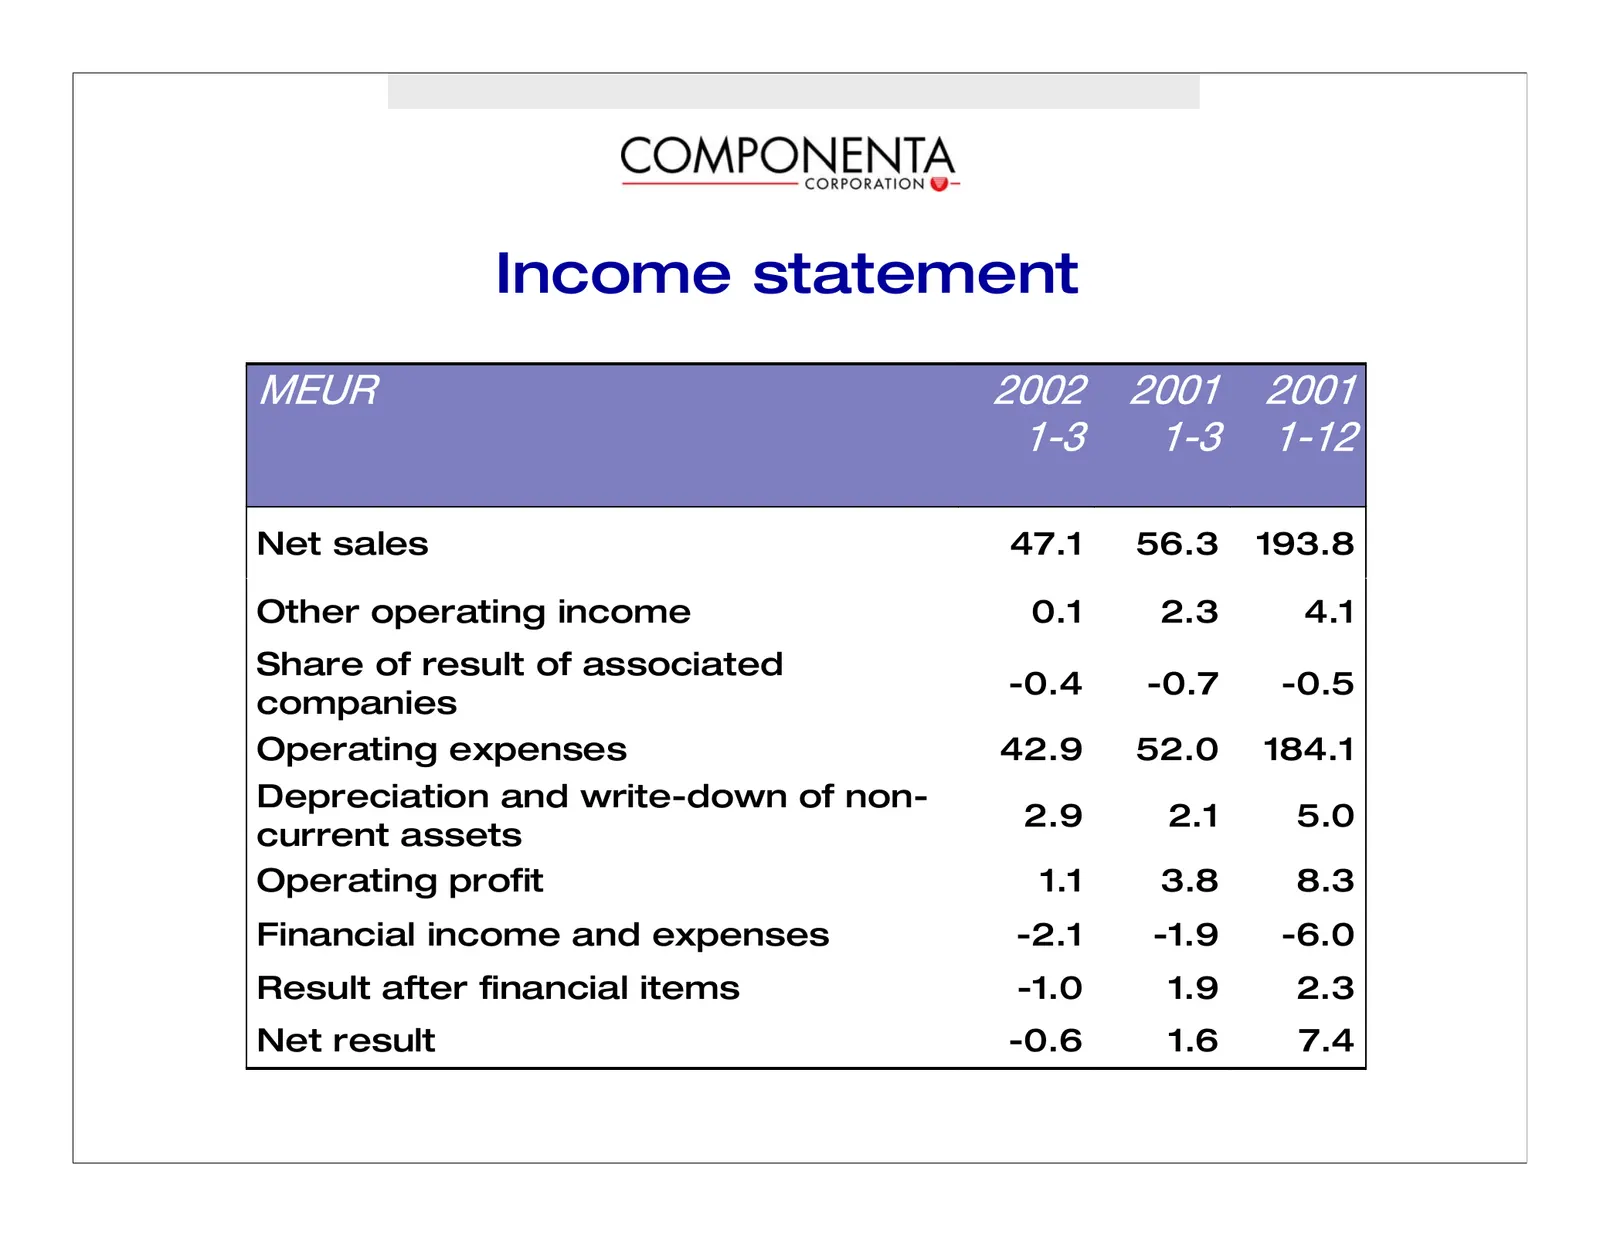
Income statement jbro OMMO OMMN OMMN NJP NJP NJNO Net sales 47.1 56.3 193.8 Other operating income 0.1 2.3 4.1 Share of result of associated -0.4 -0.7 -0.5 companies Operating expenses 42.9 52.0 184.1 Depreciation and write-down of non- 2.9 2.1 5.0 current assets Operating profit 1.1 3.8 8.3 Financi
Slide 3: Operating profit
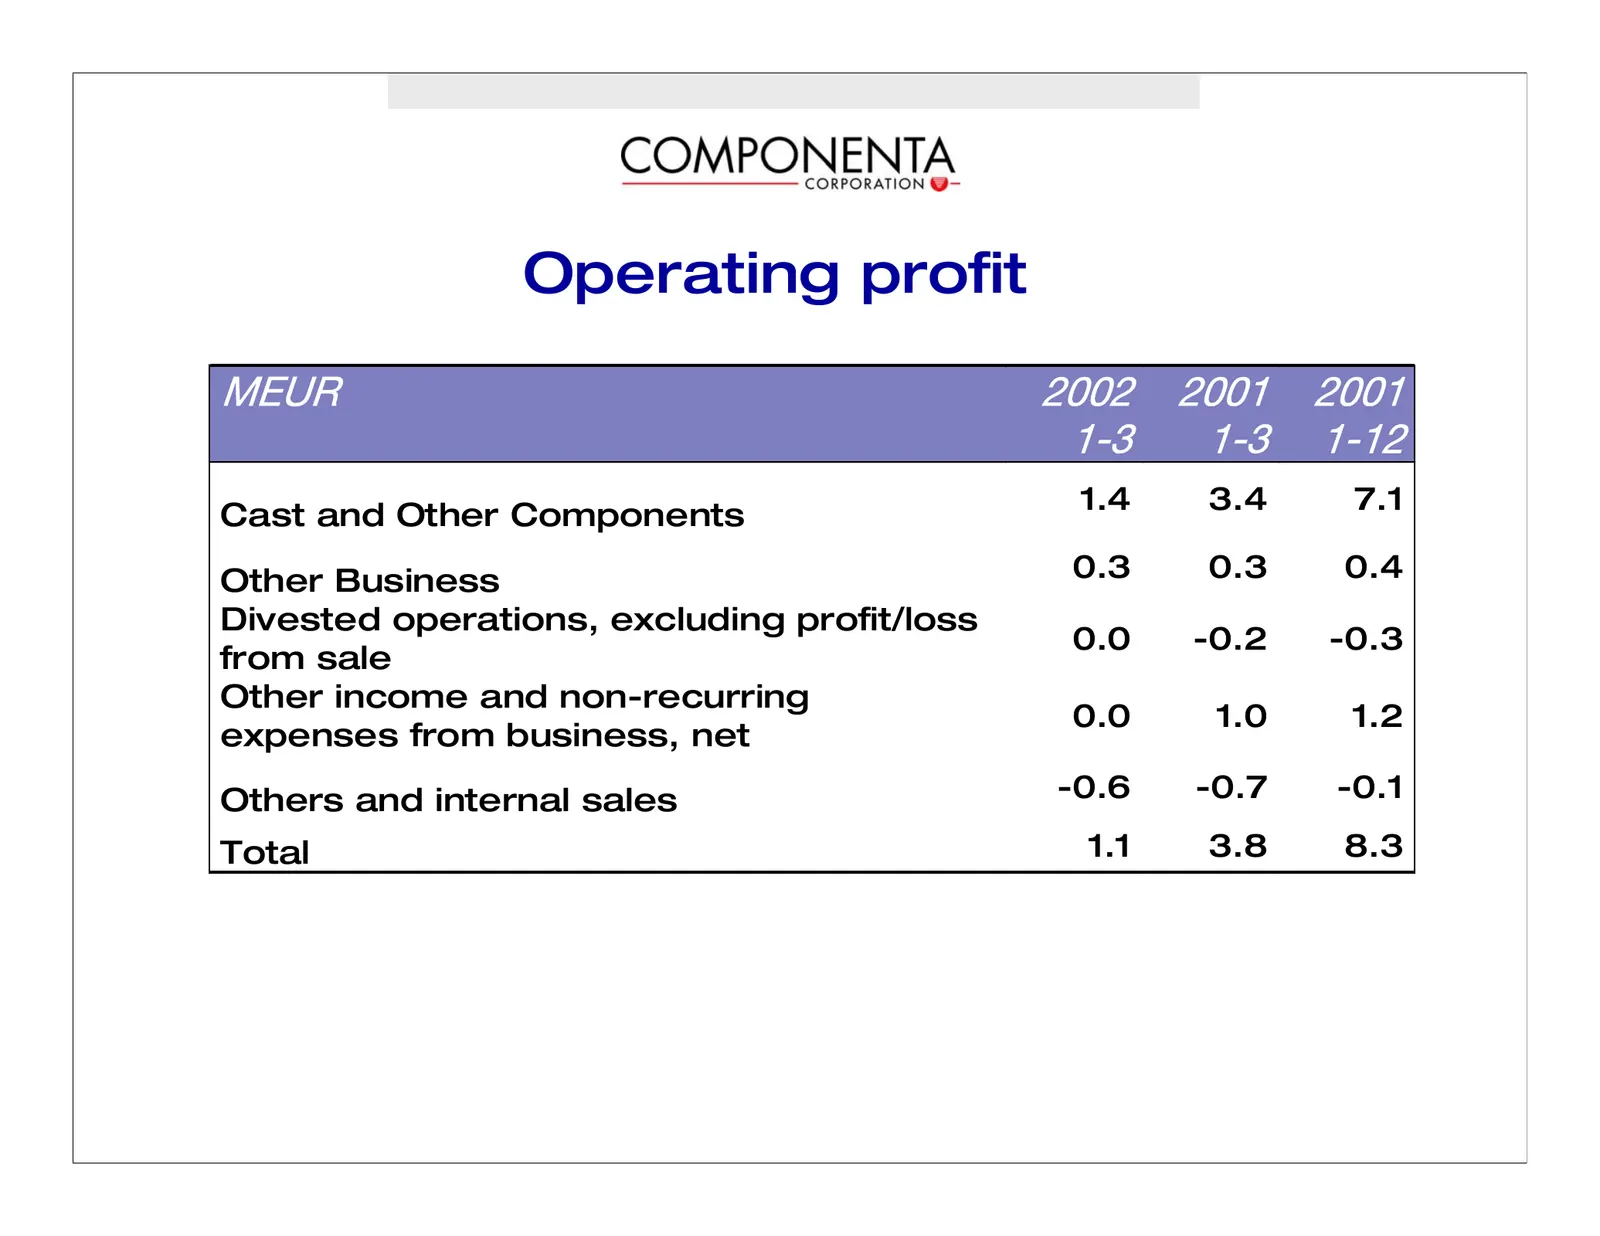
Operating profit jbro OMMO OMMN OMMN NJP NJP NJNO Cast and Other Components 1.4 3.4 7.1 Other Business 0.3 0.3 0.4 Divested operations, excluding profit/loss 0.0 -0.2 -0.3 from sale Other income and non-recurring 0.0 1.0 1.2 expenses from business, net Others and internal sales -0.6 -0.7 -0.1 Total
Slide 4: Review period in a nutshell
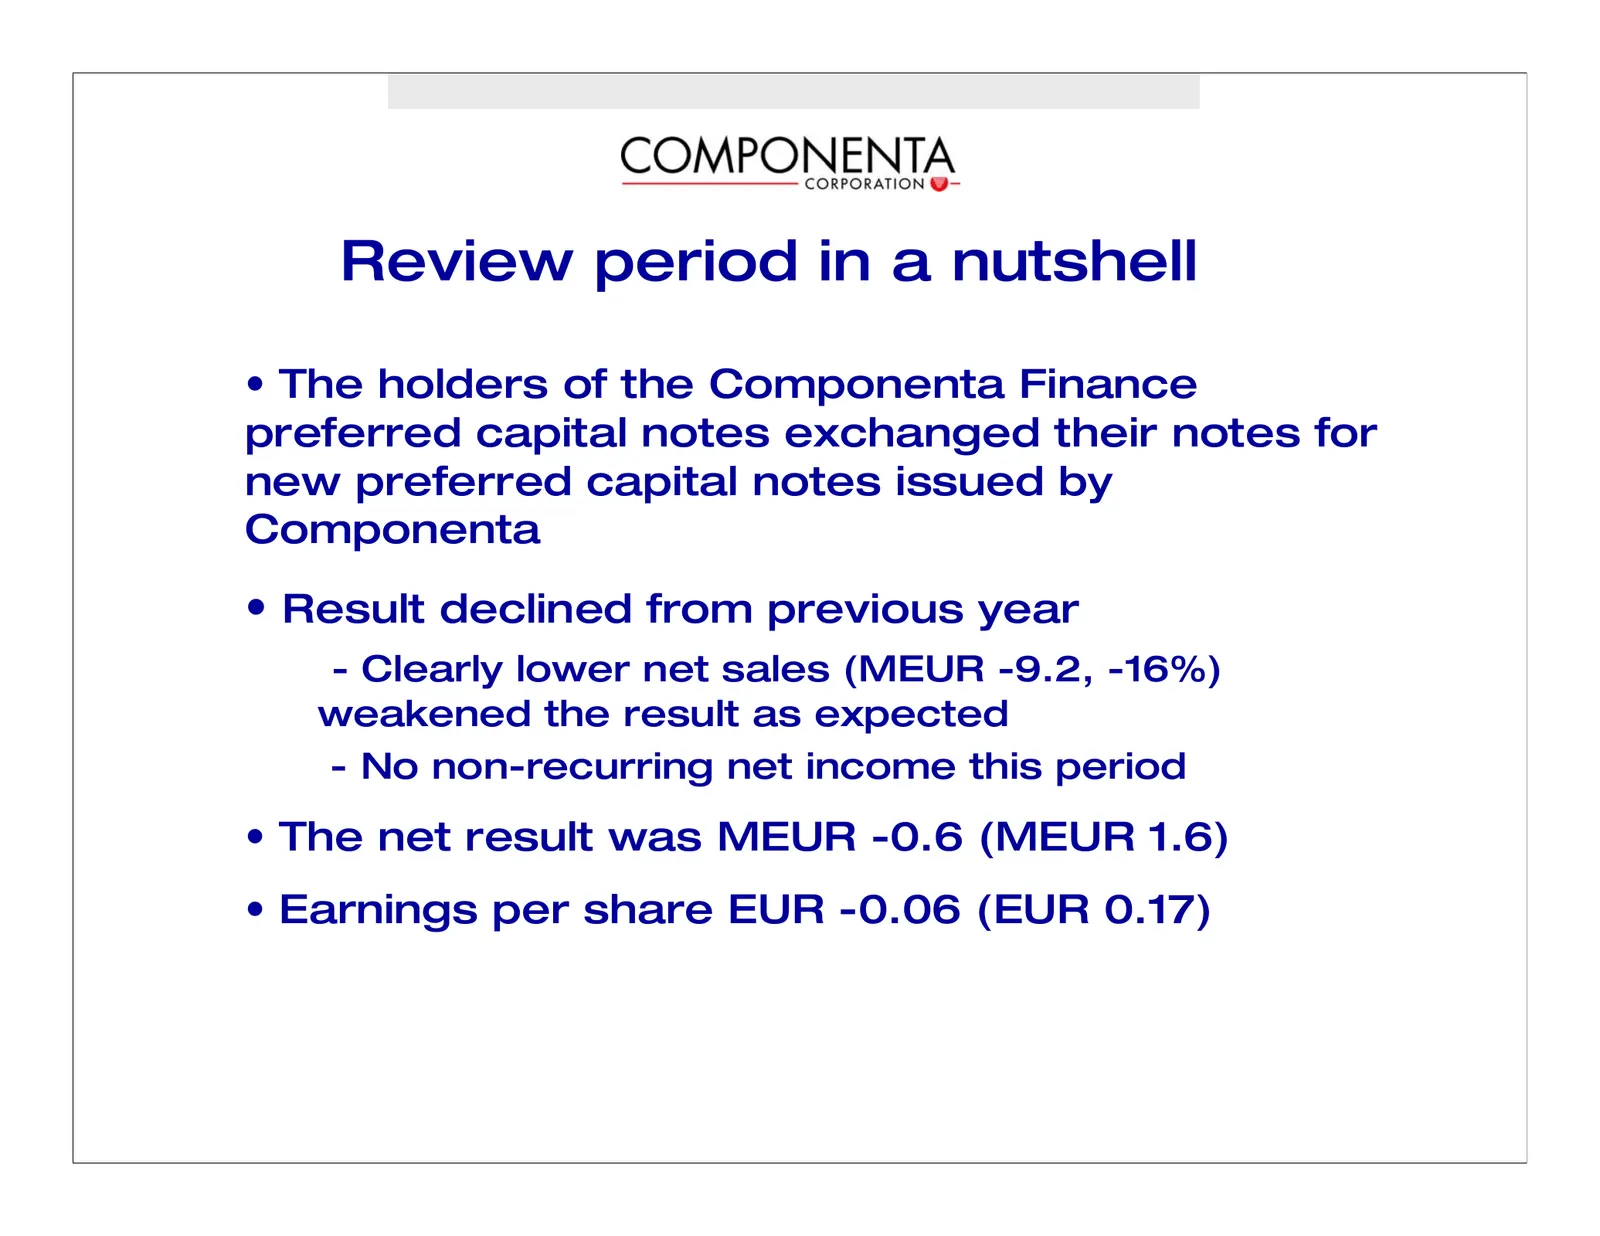
Review period in a nutshell • The holders of the Componenta Finance preferred capital notes exchanged their notes for new preferred capital notes issued by Componenta • Result declined from previous year - Clearly lower net sales (MEUR -9.2, -16%) weakened the result as expected - No non-recurring n
Slide 5: Review period in a nutshell
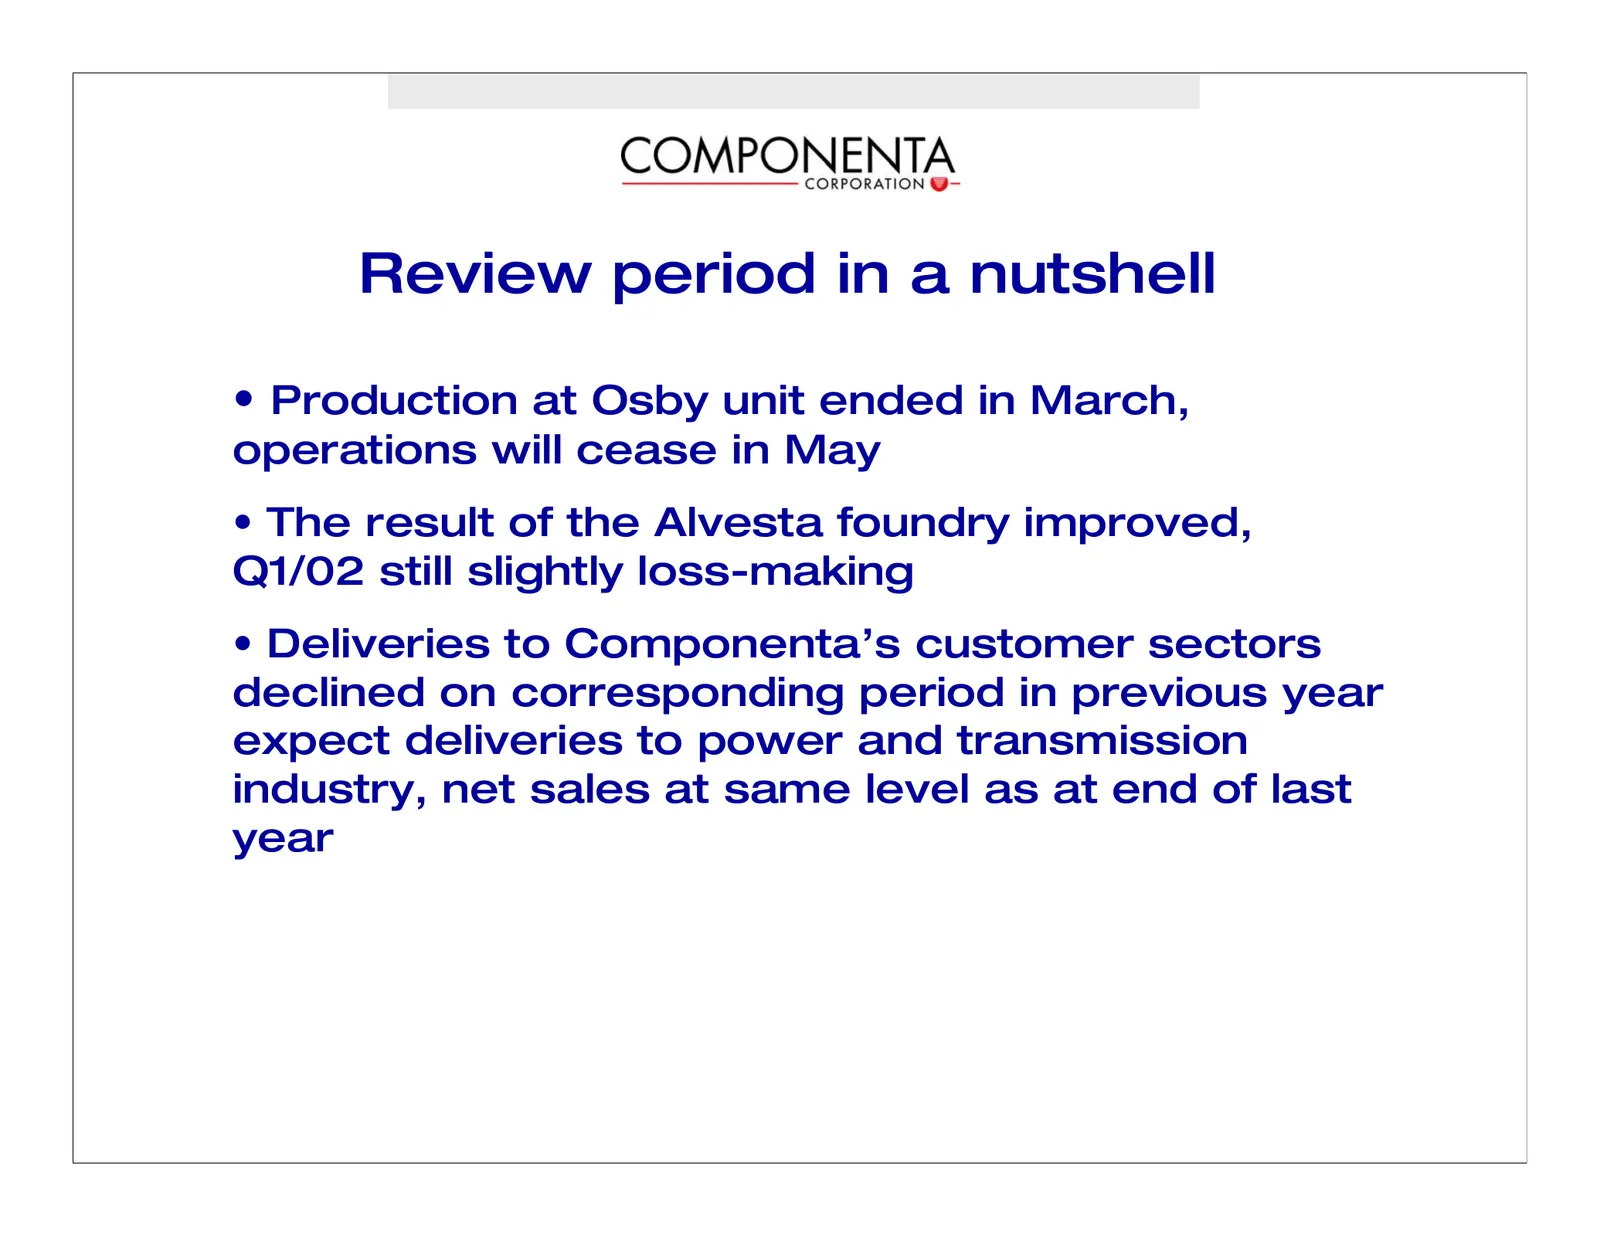
Review period in a nutshell • Production at Osby unit ended in March, operations will cease in May • The result of the Alvesta foundry improved, Q1/02 still slightly loss-making • Deliveries to Componenta’s customer sectors declined on corresponding period in previous year expect deliveries to power
Slide 6: Net sales and order book
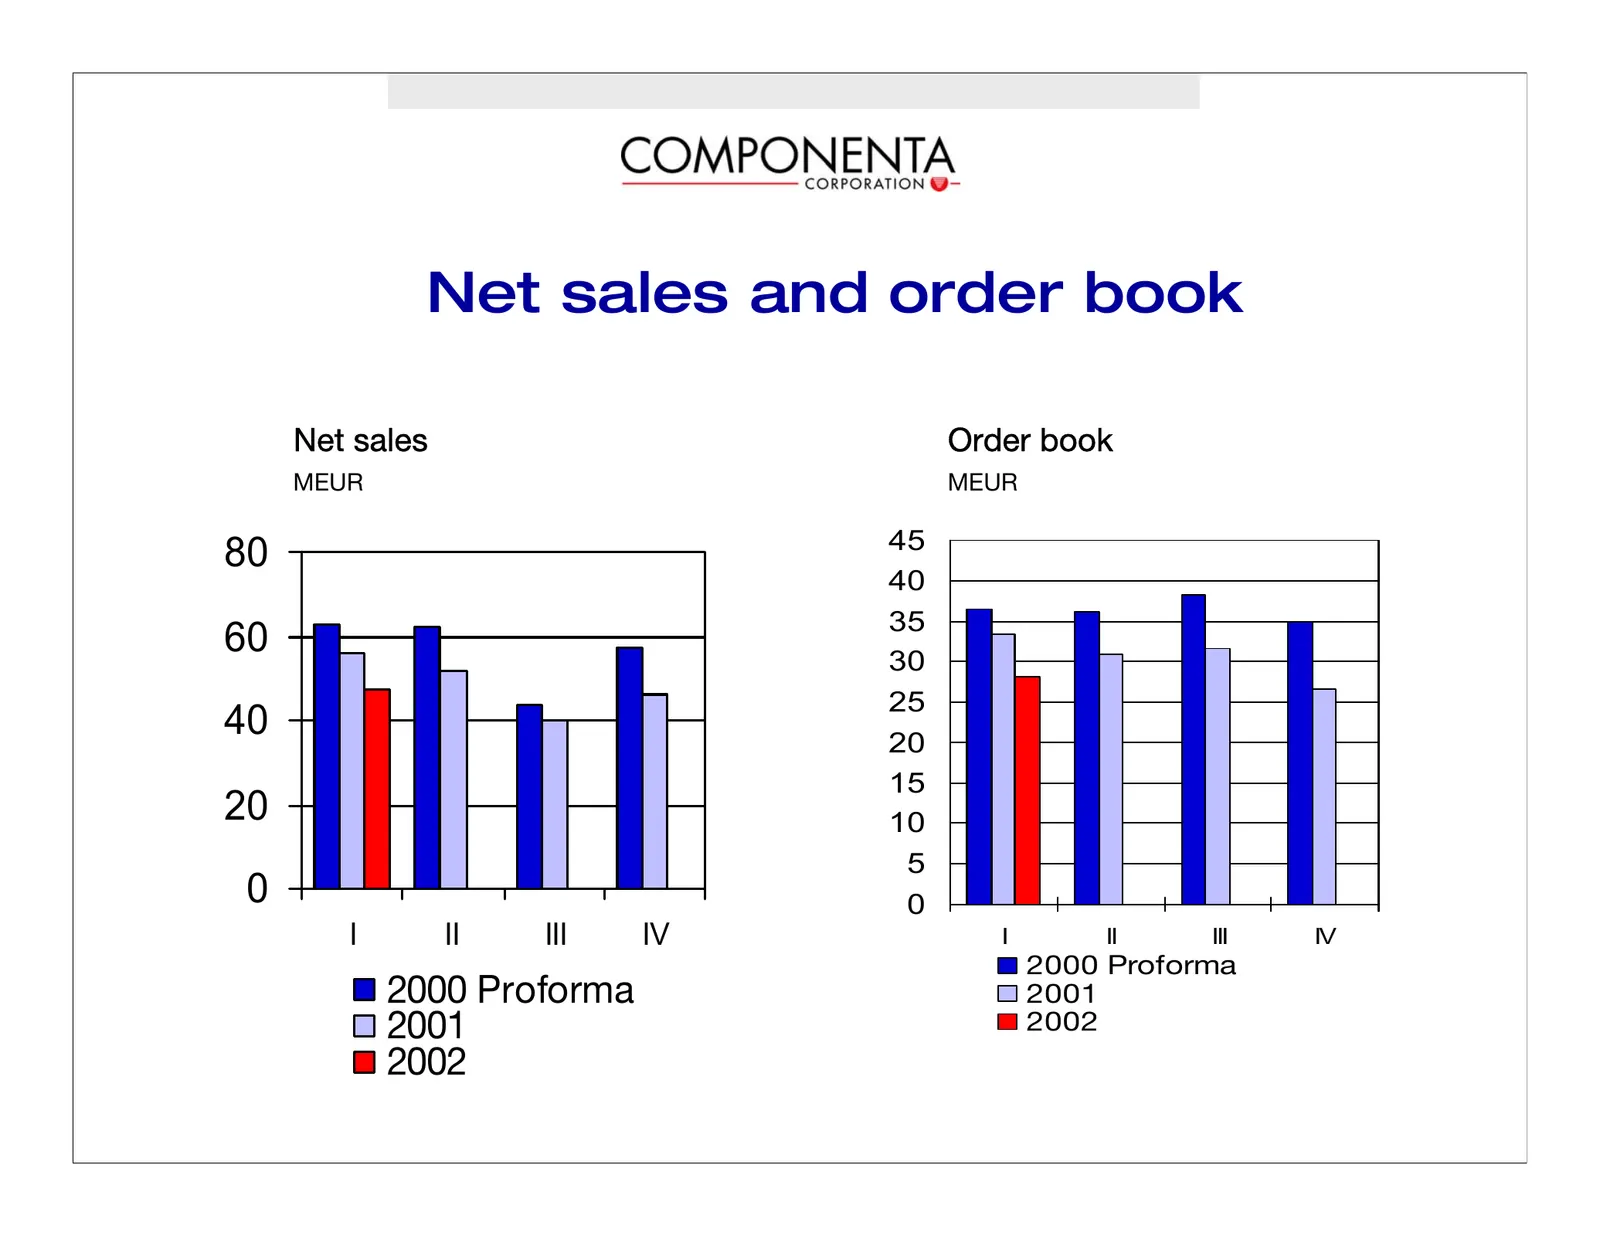
Net sales and order book kÉí=ë~äÉë lêÇÉê=Äççâ jbro jbro 45 80 40 35 60 30 25 40 20 15 20 10 5 0 0 I II III IV I II III IV OMMM=mêçÑçêã~== OMMM=mêçÑçêã~ OMMN OMMN OMMO OMMO
Slide 7: Operating profit and result after financial items
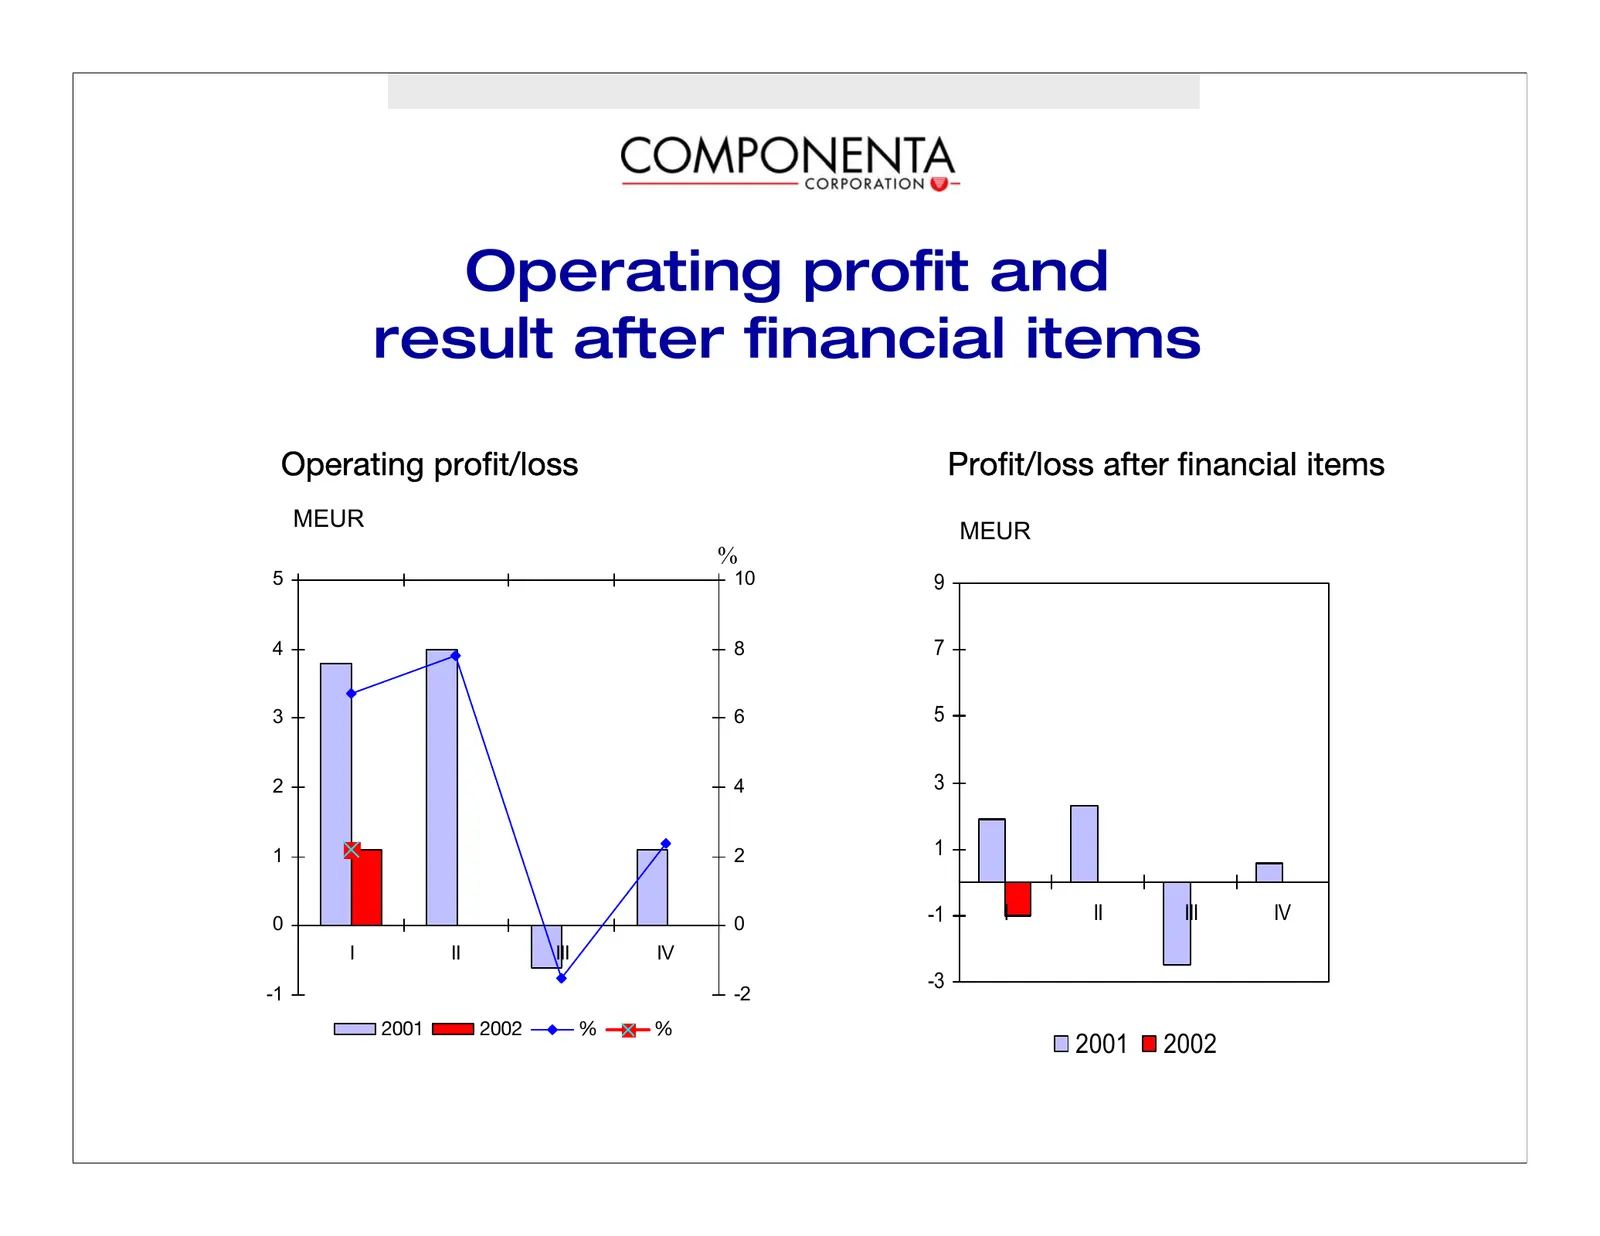
Operating profit and result after financial items léÉê~íáåÖ=éêçÑáíLäçëë mêçÑáíLäçëë=~ÑíÉê=Ñáå~åÅá~ä=áíÉãë MEUR MEUR I II III IV % 5 10 9 4 8 7 3 6 5 2 4 3 1 2 1 0 0 -1 I II III IV I II III IV -3 -1 -2 OMMN OMMO B B 2001 2002
Slide 8: Equity ratio, %
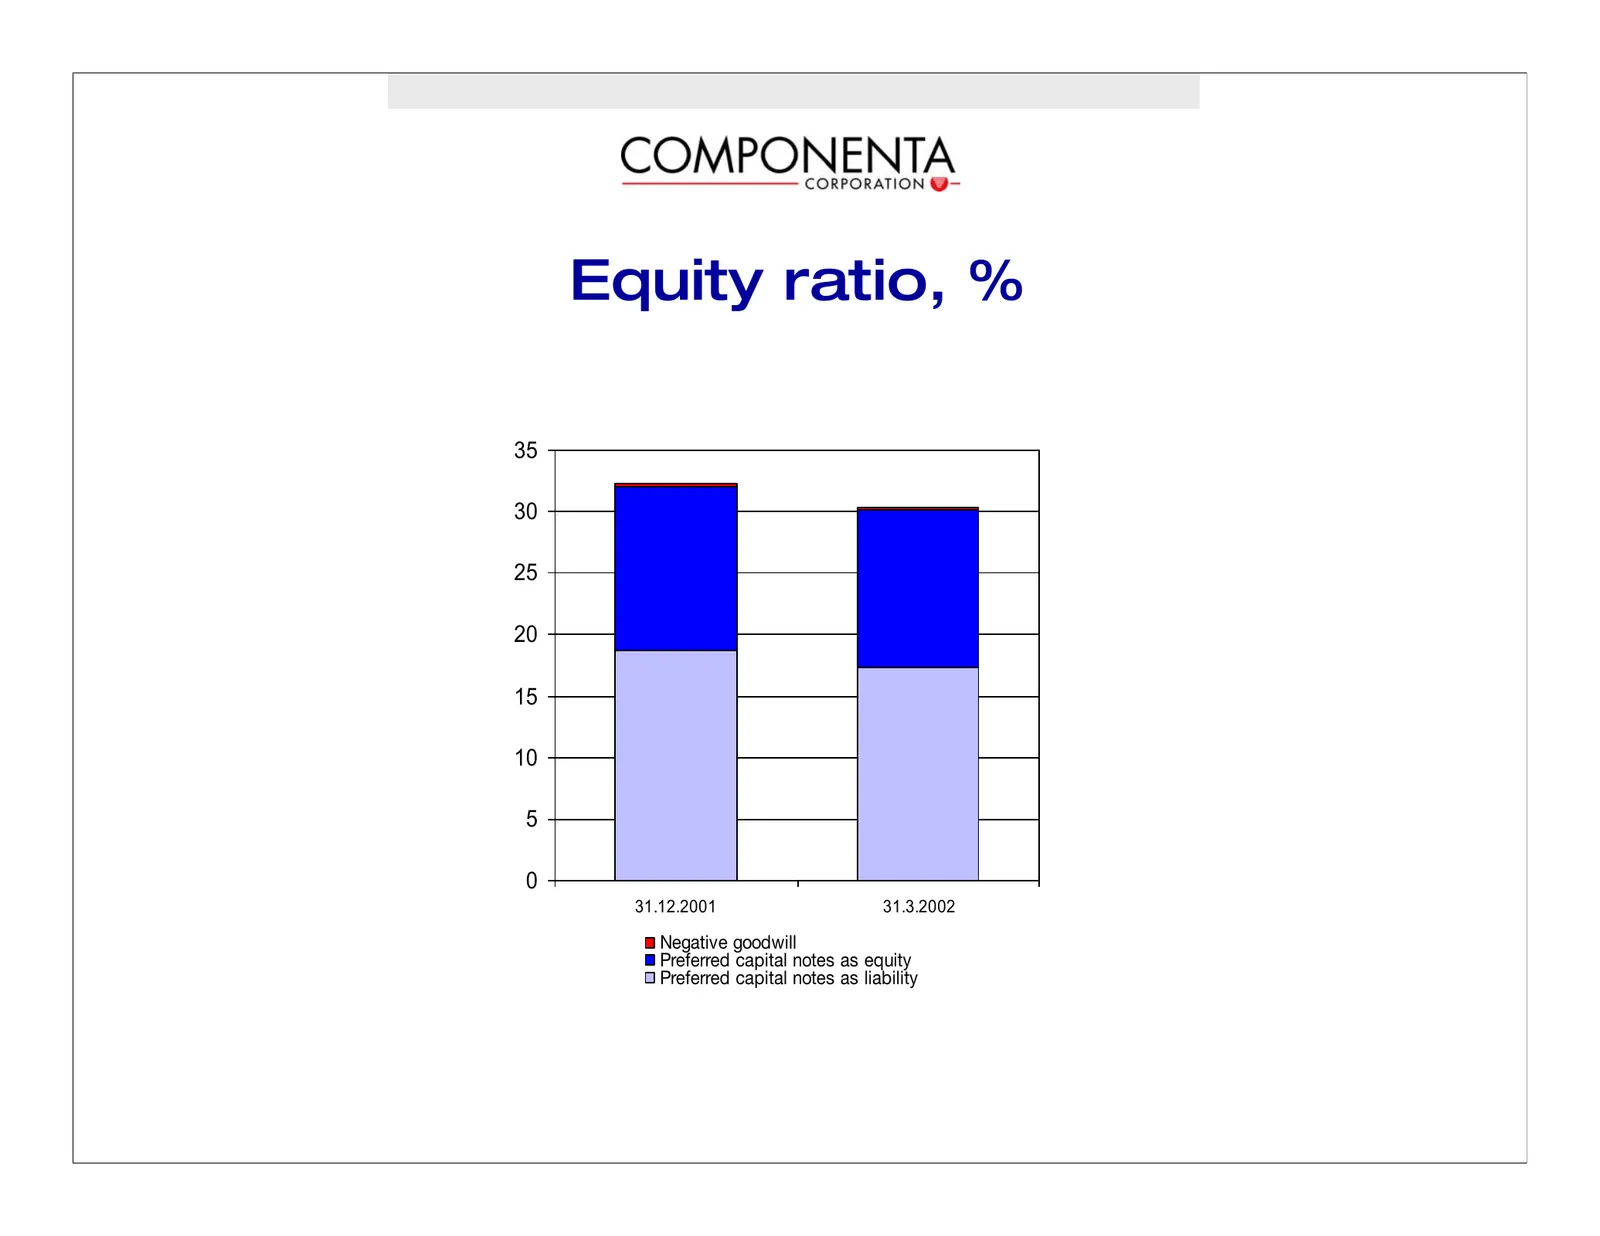
Equity ratio, % 35 30 25 20 15 10 5 0 31.12.2001 31.3.2002 kÉÖ~íáîÉ=ÖççÇïáää mêÉÑÉêêÉÇ=Å~éáí~ä=åçíÉë=~ë=Éèìáíó mêÉÑÉêêÉÇ=Å~éáí~ä=åçíÉë=~ë=äá~Äáäáíó
Slide 9: Division of sales
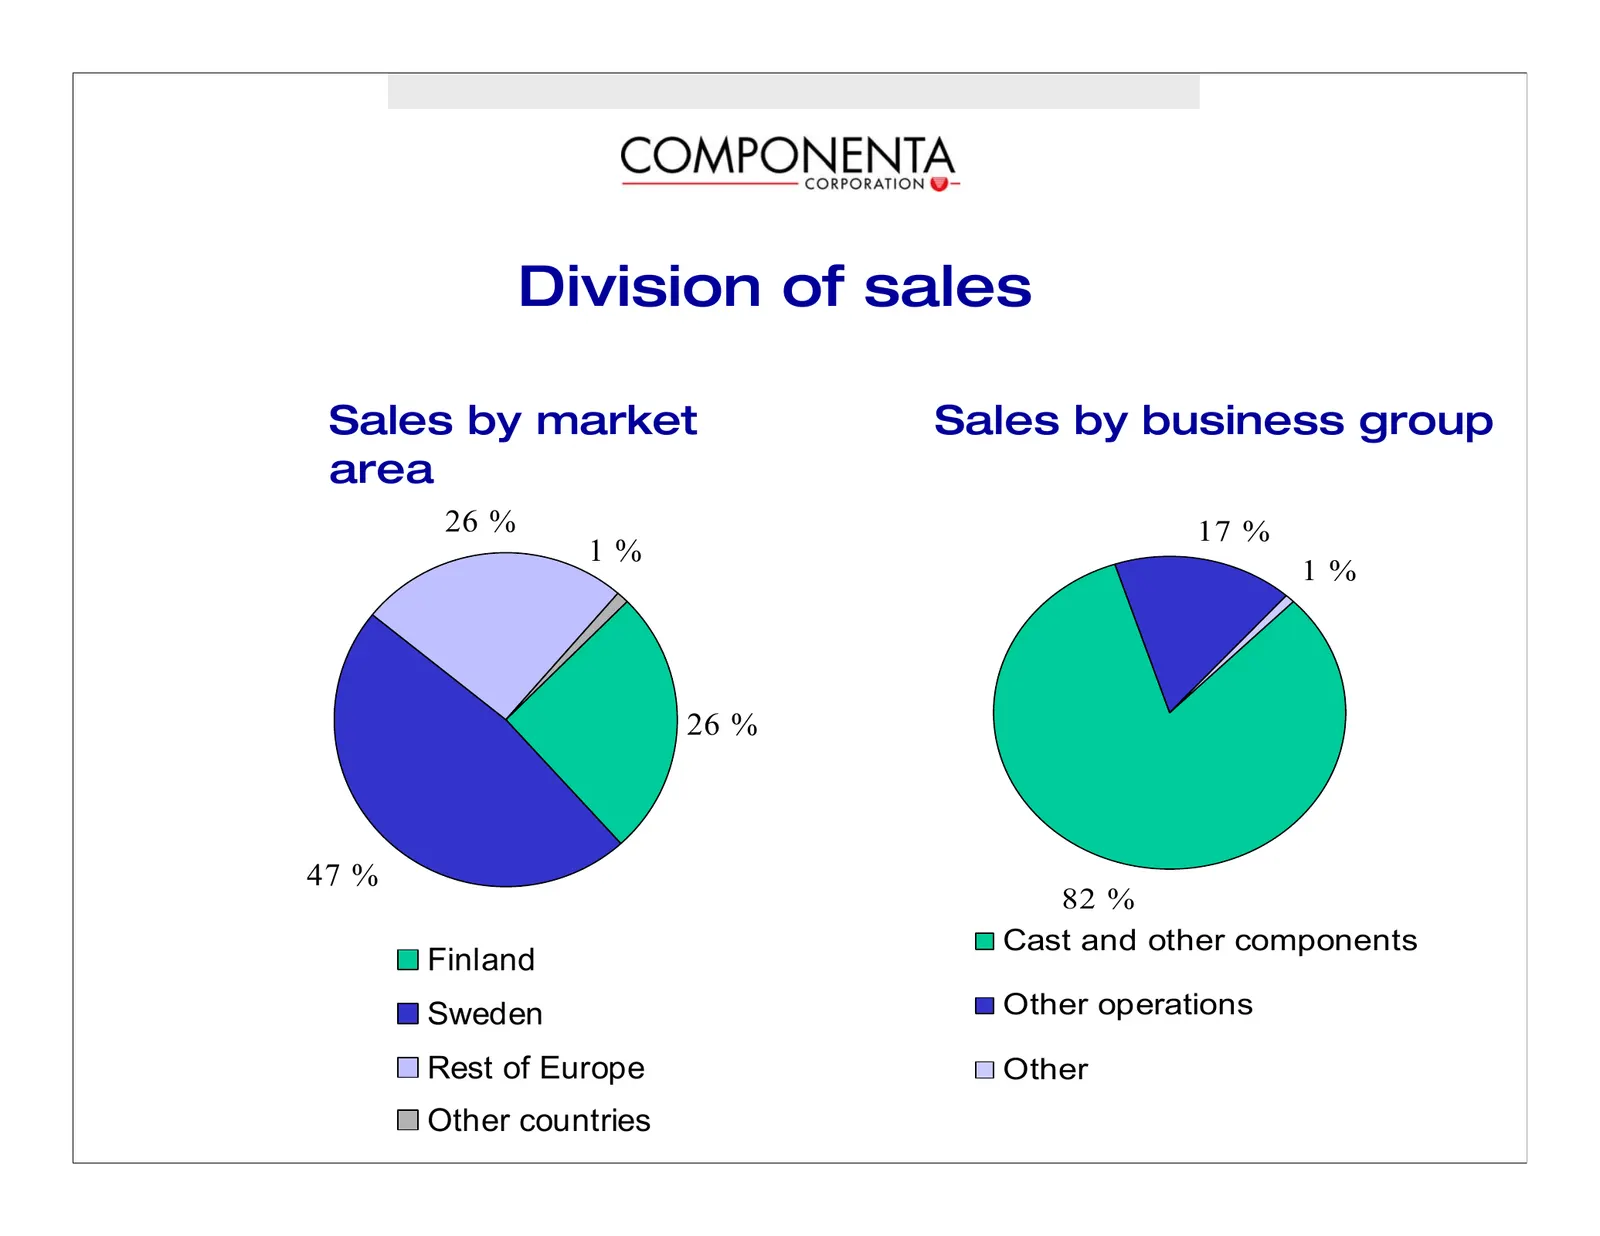
Division of sales Sales by market Sales by business group area 26 % 17 % 1% 1% 26 % 47 % 82 % Cast and other components Finland Sweden Other operations Rest of Europe Other Other countries
Slide 10: Sales to customer industries
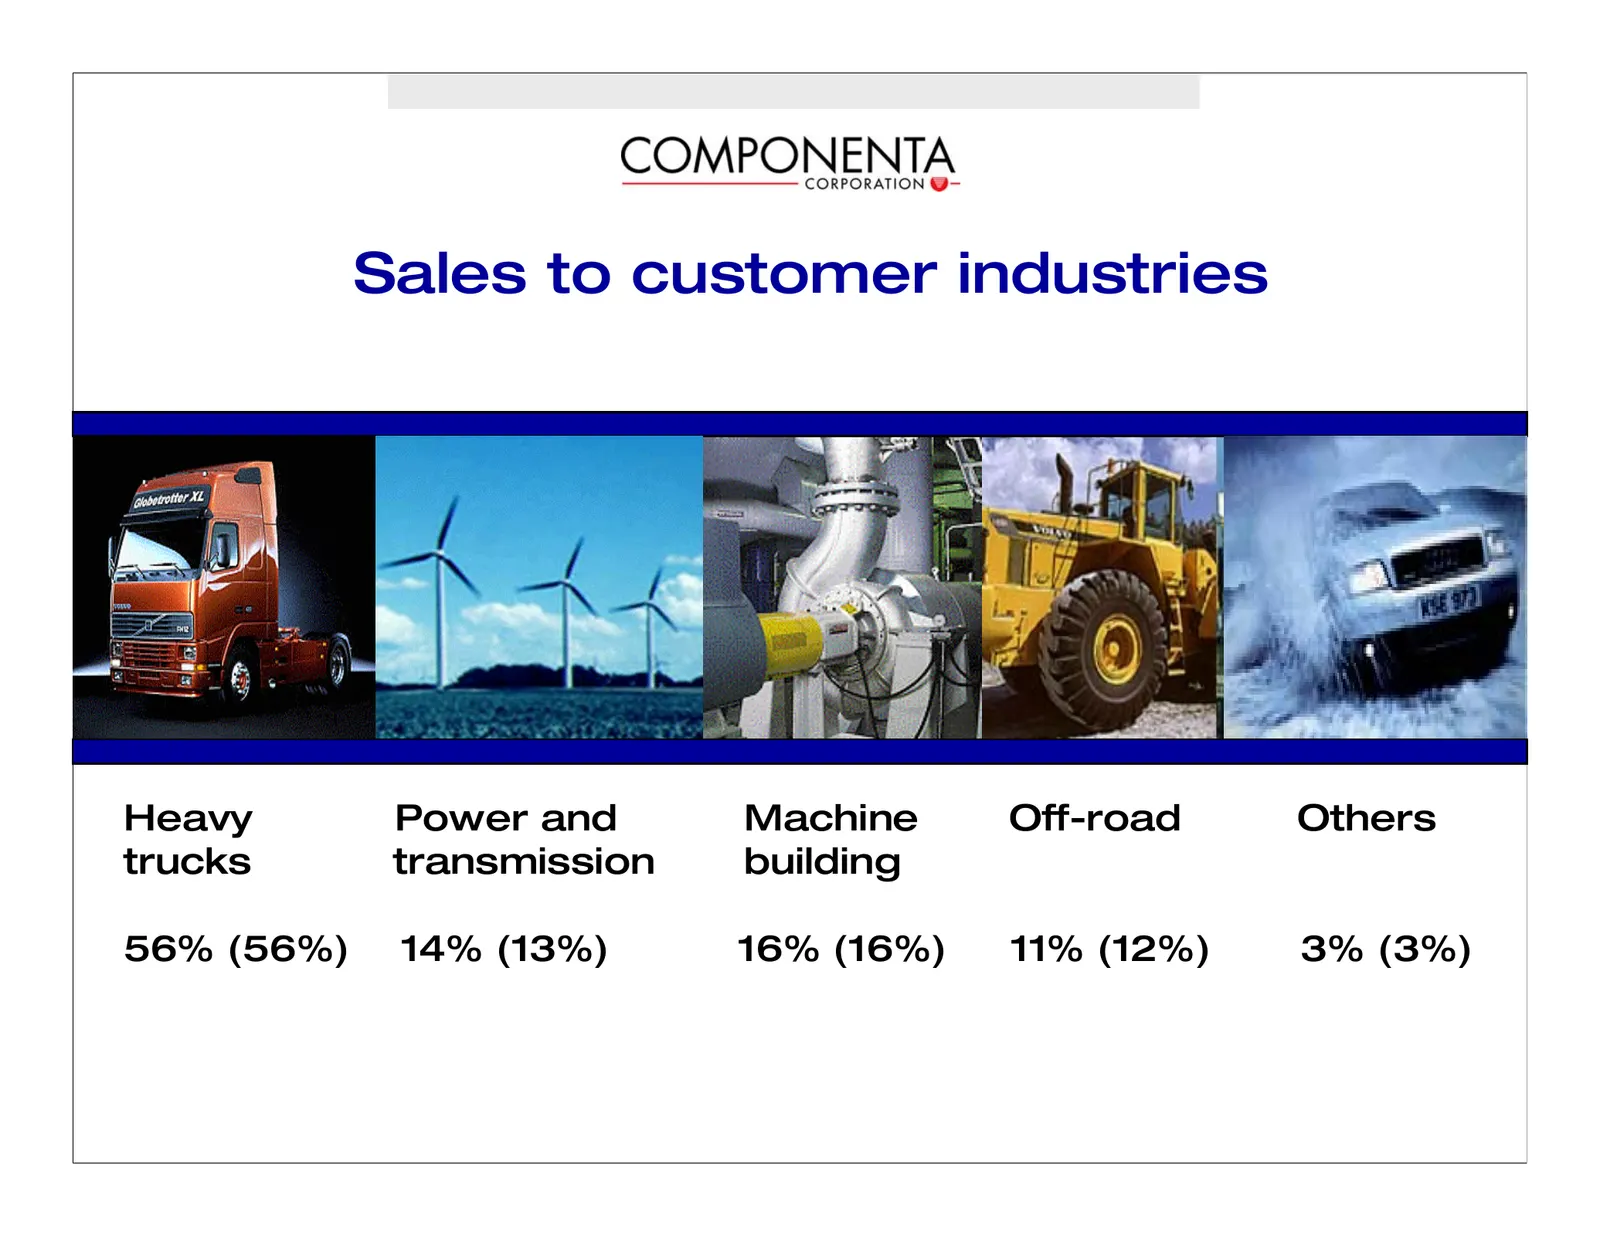
Sales to customer industries Heavy Power and Machine Off-road Others trucks transmission building 56% (56%) 14% (13%) 16% (16%) 11% (12%) 3% (3%)
Slide 11: Cast and Other Components
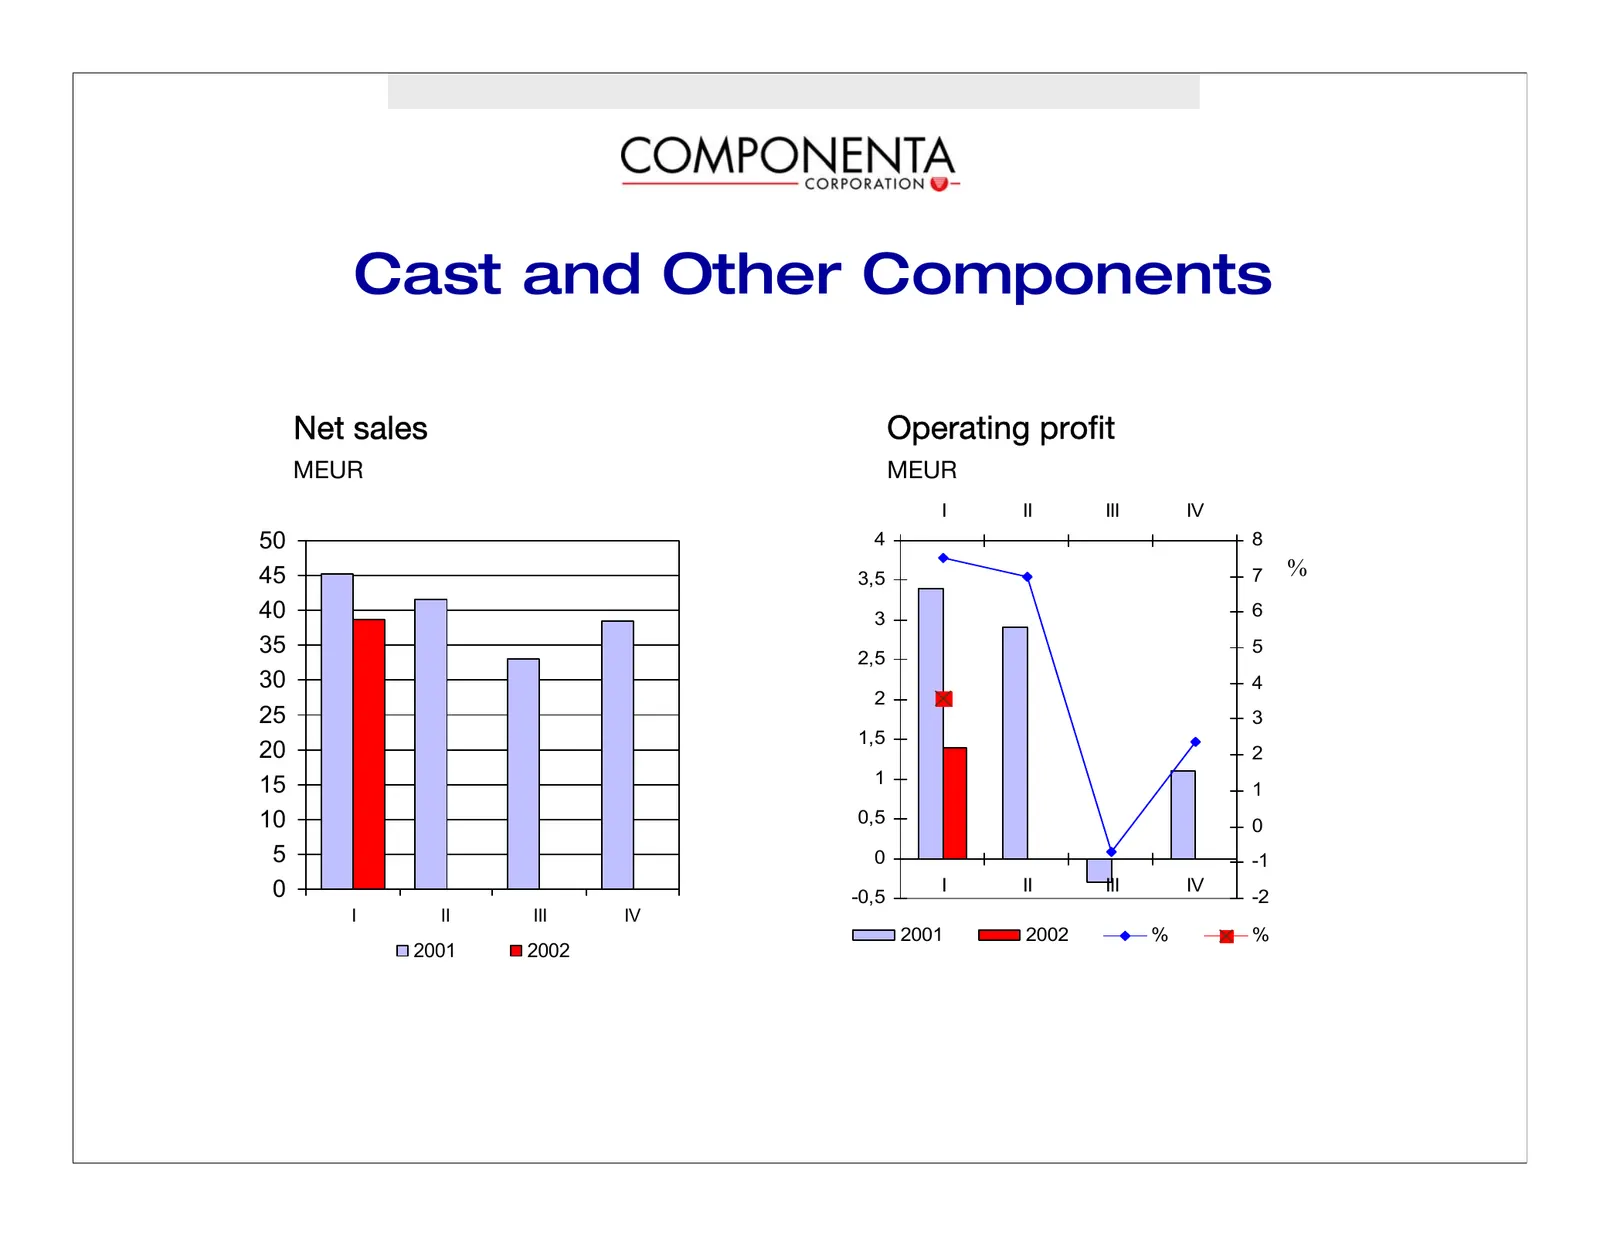
Cast and Other Components kÉí=ë~äÉë léÉê~íáåÖ=éêçÑáí jbro jbro I II III IV 50 4 8 45 3,5 7 % 40 3 6 35 2,5 5 30 4 2 25 3 1,5 20 2 15 1 1 10 0,5 0 5 0 -1 0 I II III IV -0,5 -2 I II III IV 2001 2002 % % 2001 2002
Slide 12: Cast and Other Components
Cast and Other Components • Net sales fell from previous year, despite the new units in Business Group (MEUR -6.4, -14%) • Production at Osby unit ended in March, transfers of products to other units took place as planned • Remedial programme completed at Alvesta and unit’s result improved
Slide 13: Cast and Other Components
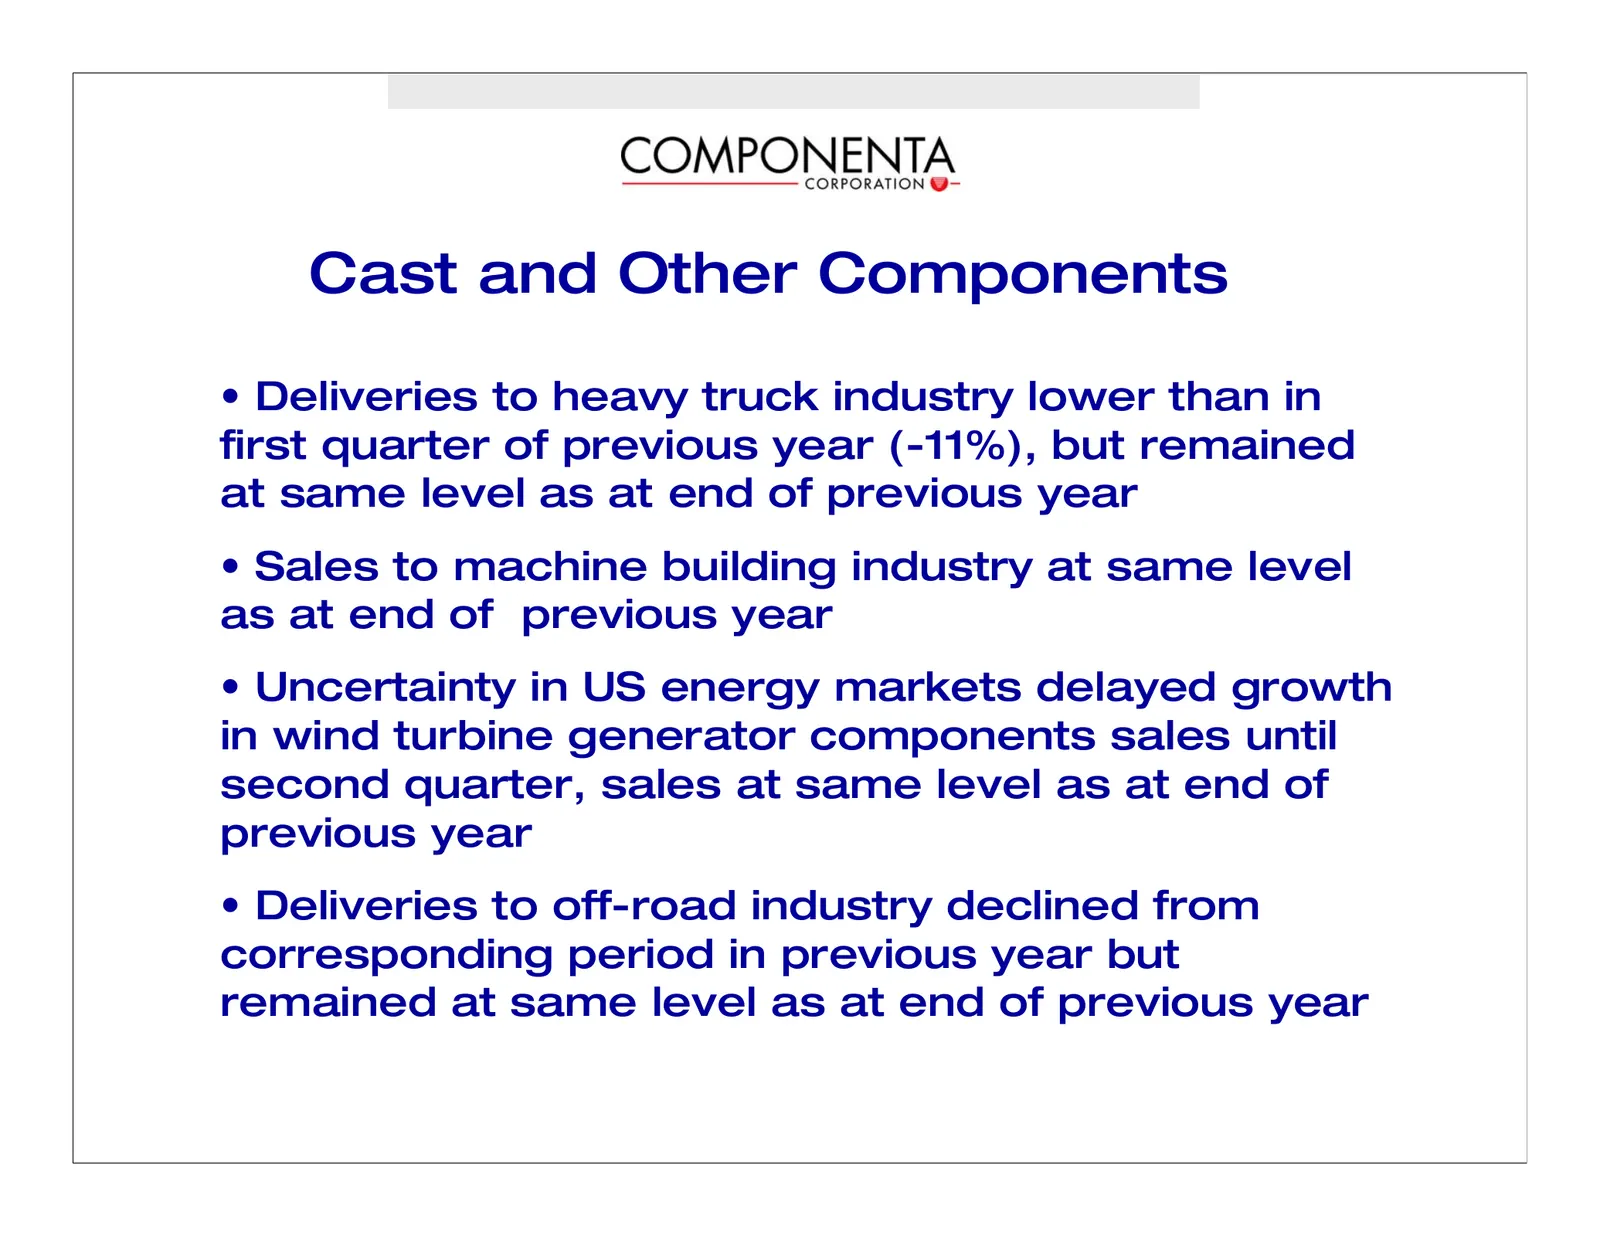
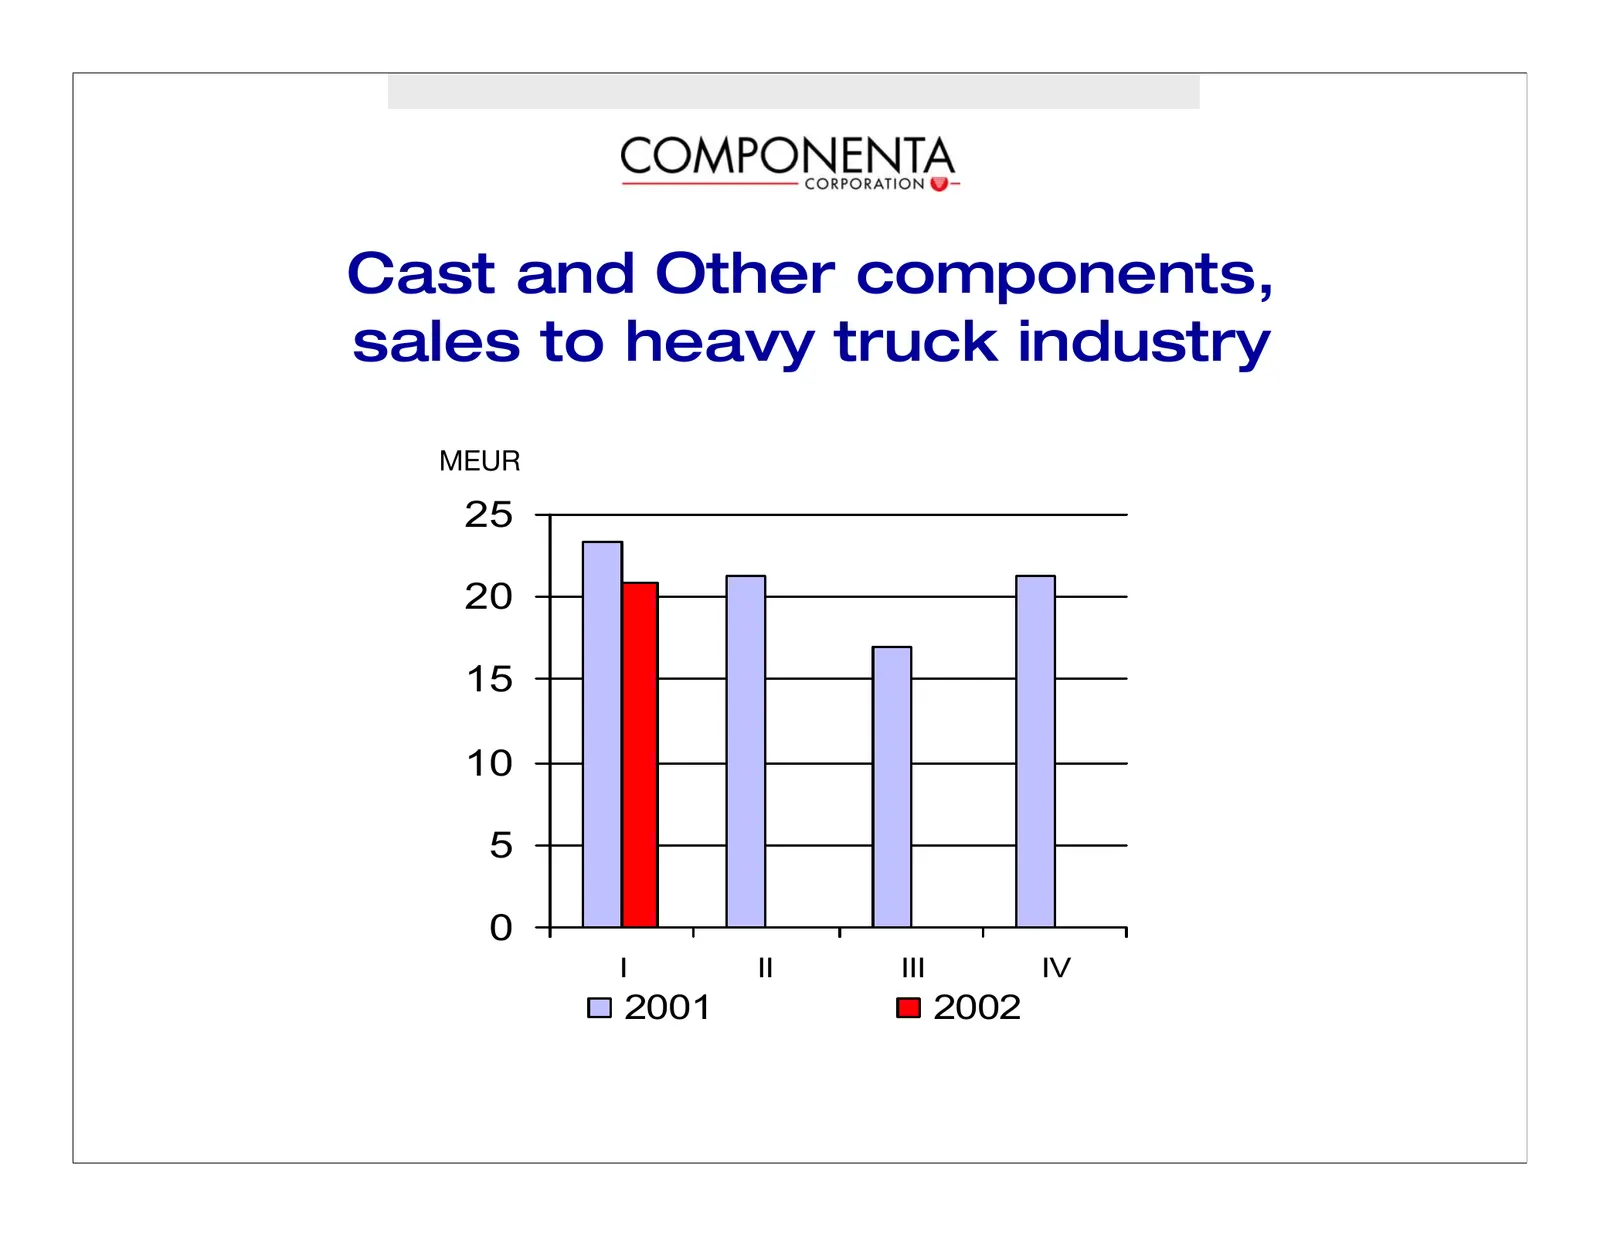
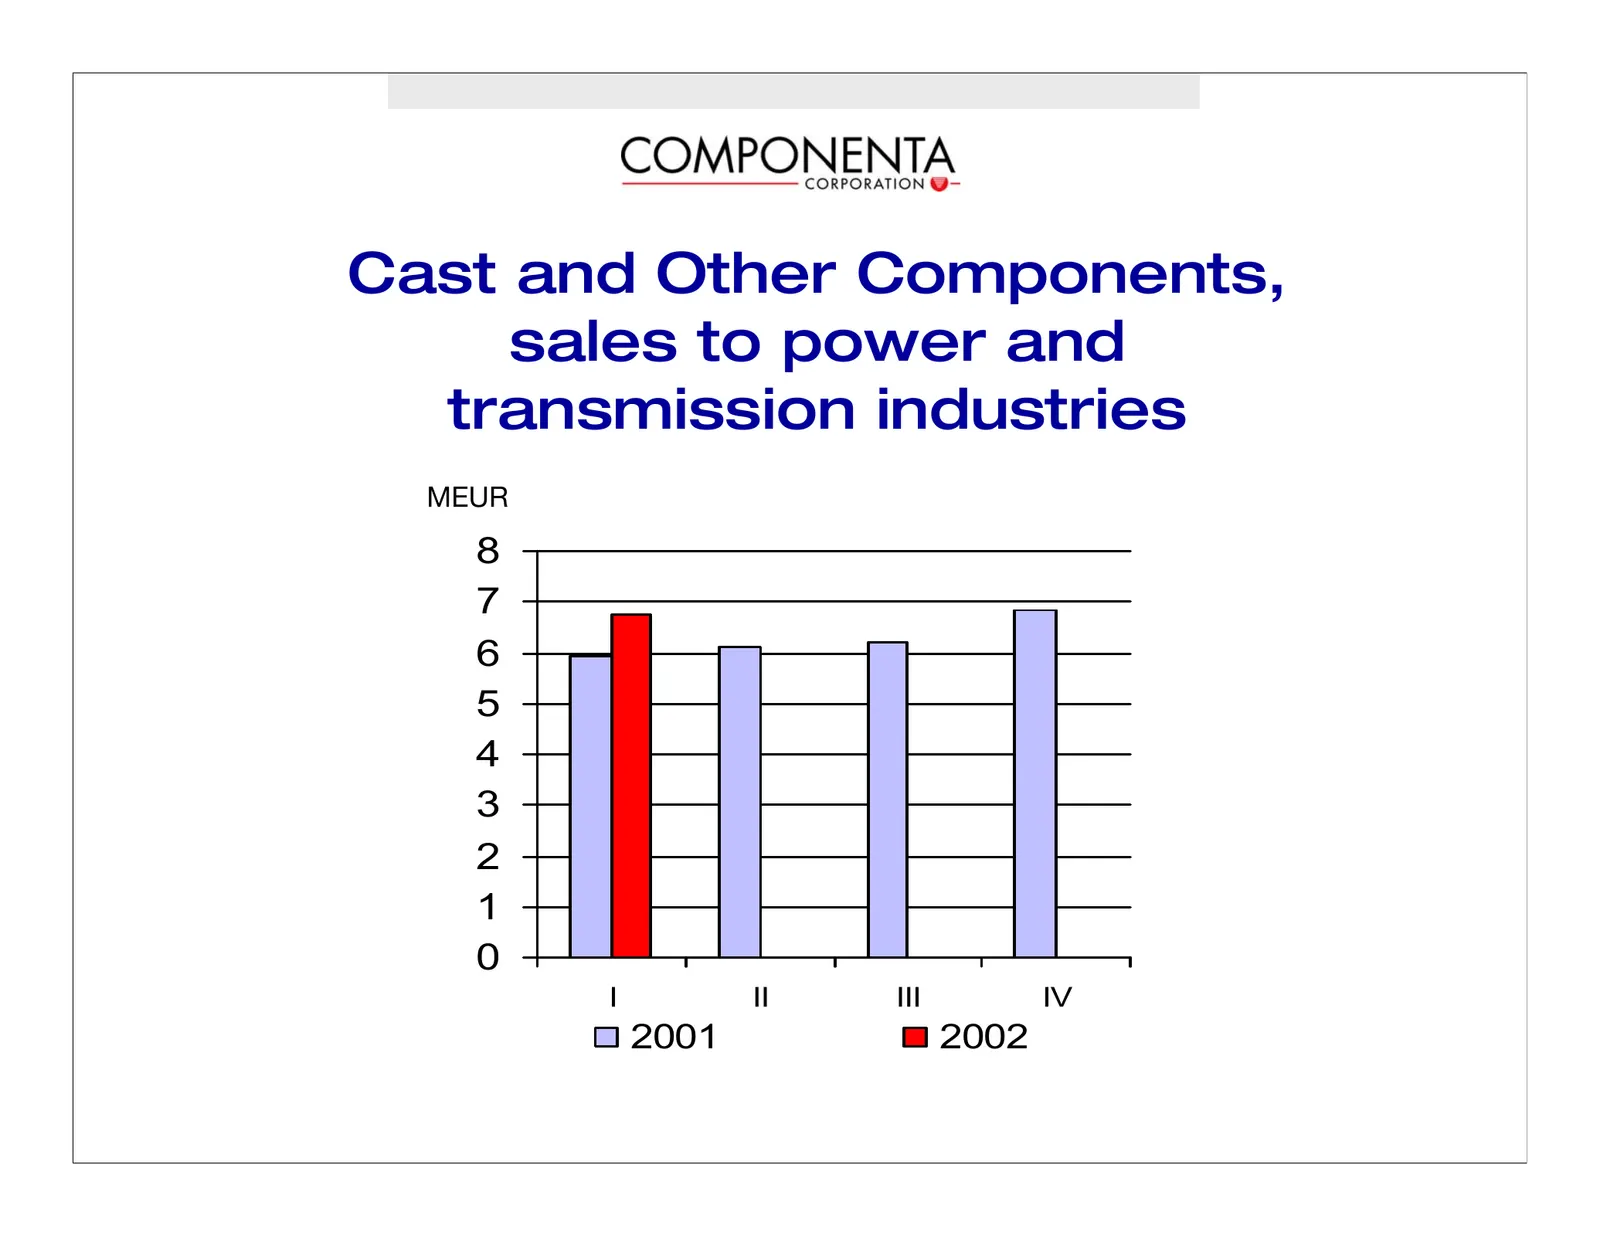
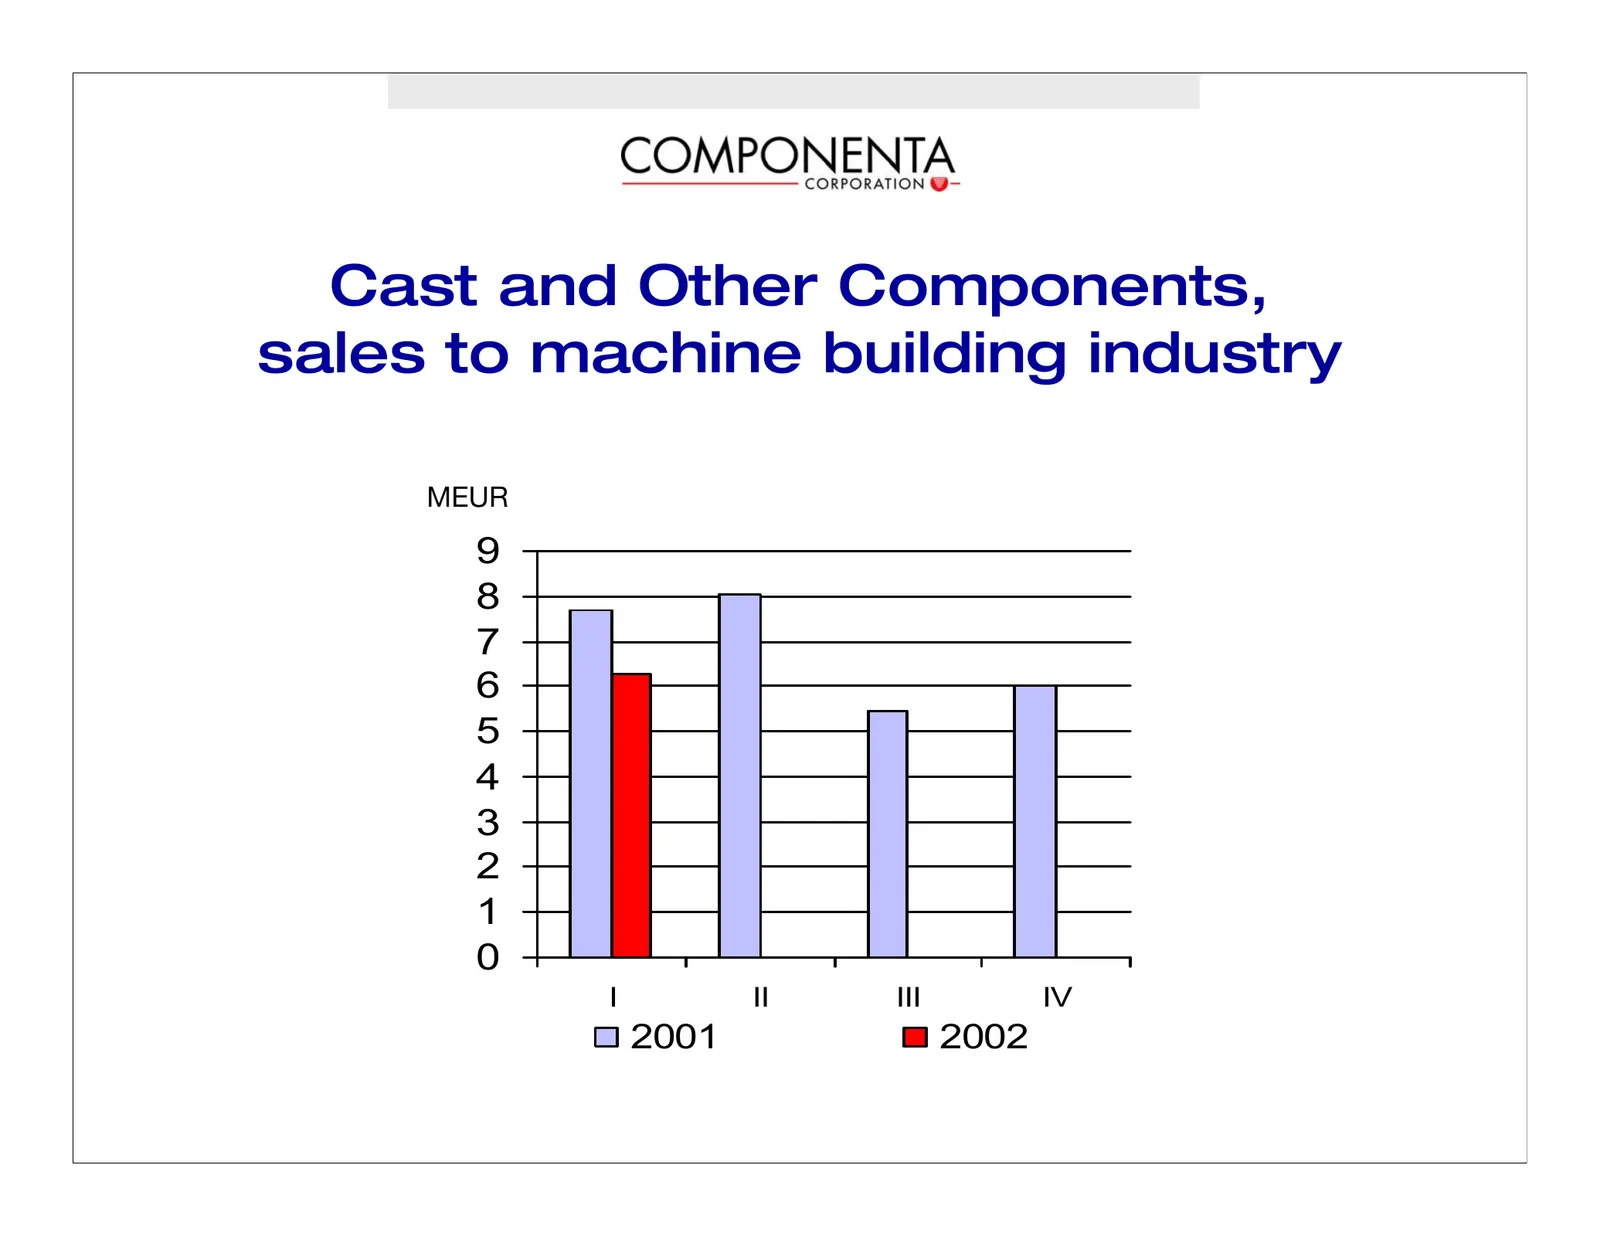
Cast and Other Components • Deliveries to heavy truck industry lower than in first quarter of previous year (-11%), but remained at same level as at end of previous year • Sales to machine building industry at same level as at end of previous year • Uncertainty in US energy markets delayed growth in
Slide 14: Cast and Other components, sales to heavy truck industry
Cast and Other components, sales to heavy truck industry jbro 25 20 15 10 5 0 I II III IV 2001 2002
Slide 15: Cast and Other Components, sales to power and transmission industries
Cast and Other Components, sales to power and transmission industries jbro= 8 7 6 5 4 3 2 1 0 I II III IV 2001 2002
Slide 16: Cast and Other Components, sales to machine building industry
Cast and Other Components, sales to machine building industry jbro= 9 8 7 6 5 4 3 2 1 0 I II III IV 2001 2002
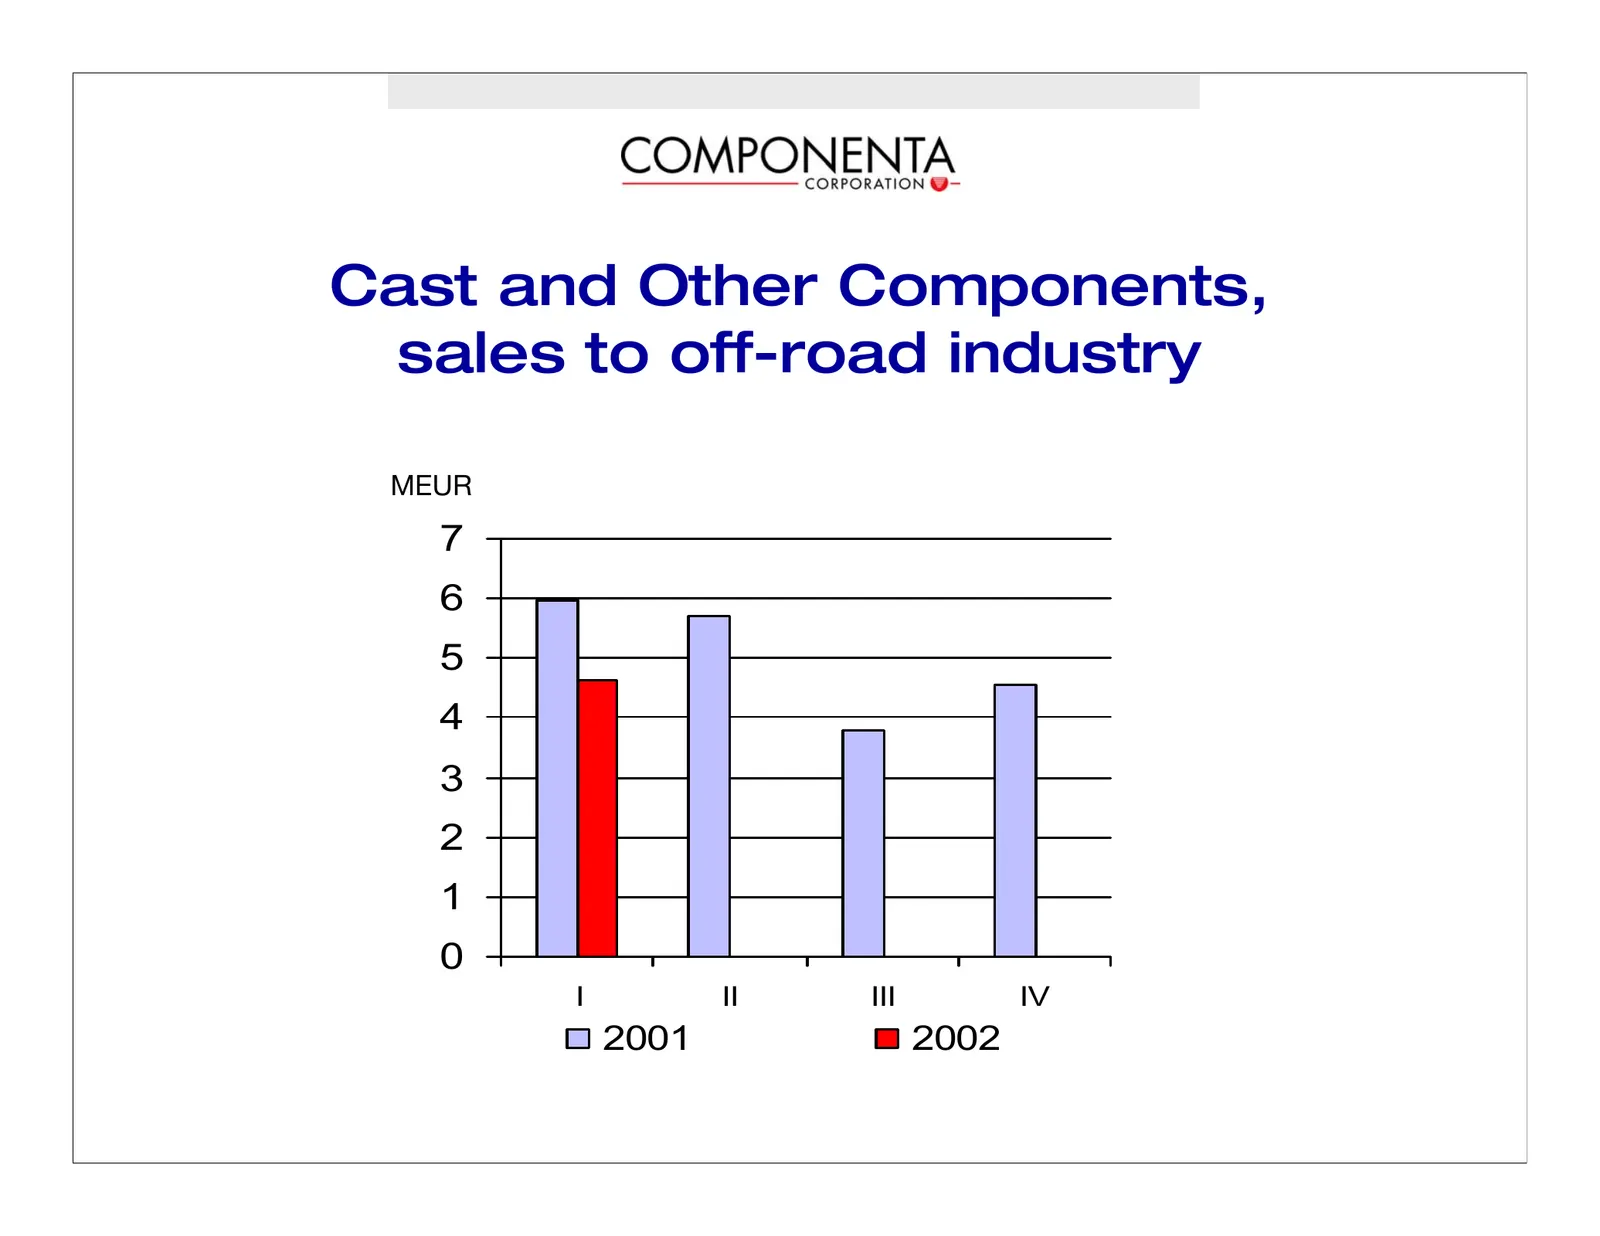
Slide 17: Cast and Other Components, sales to off-road industry
Cast and Other Components, sales to off-road industry jbro= 7 6 5 4 3 2 1 0 I II III IV 2001 2002
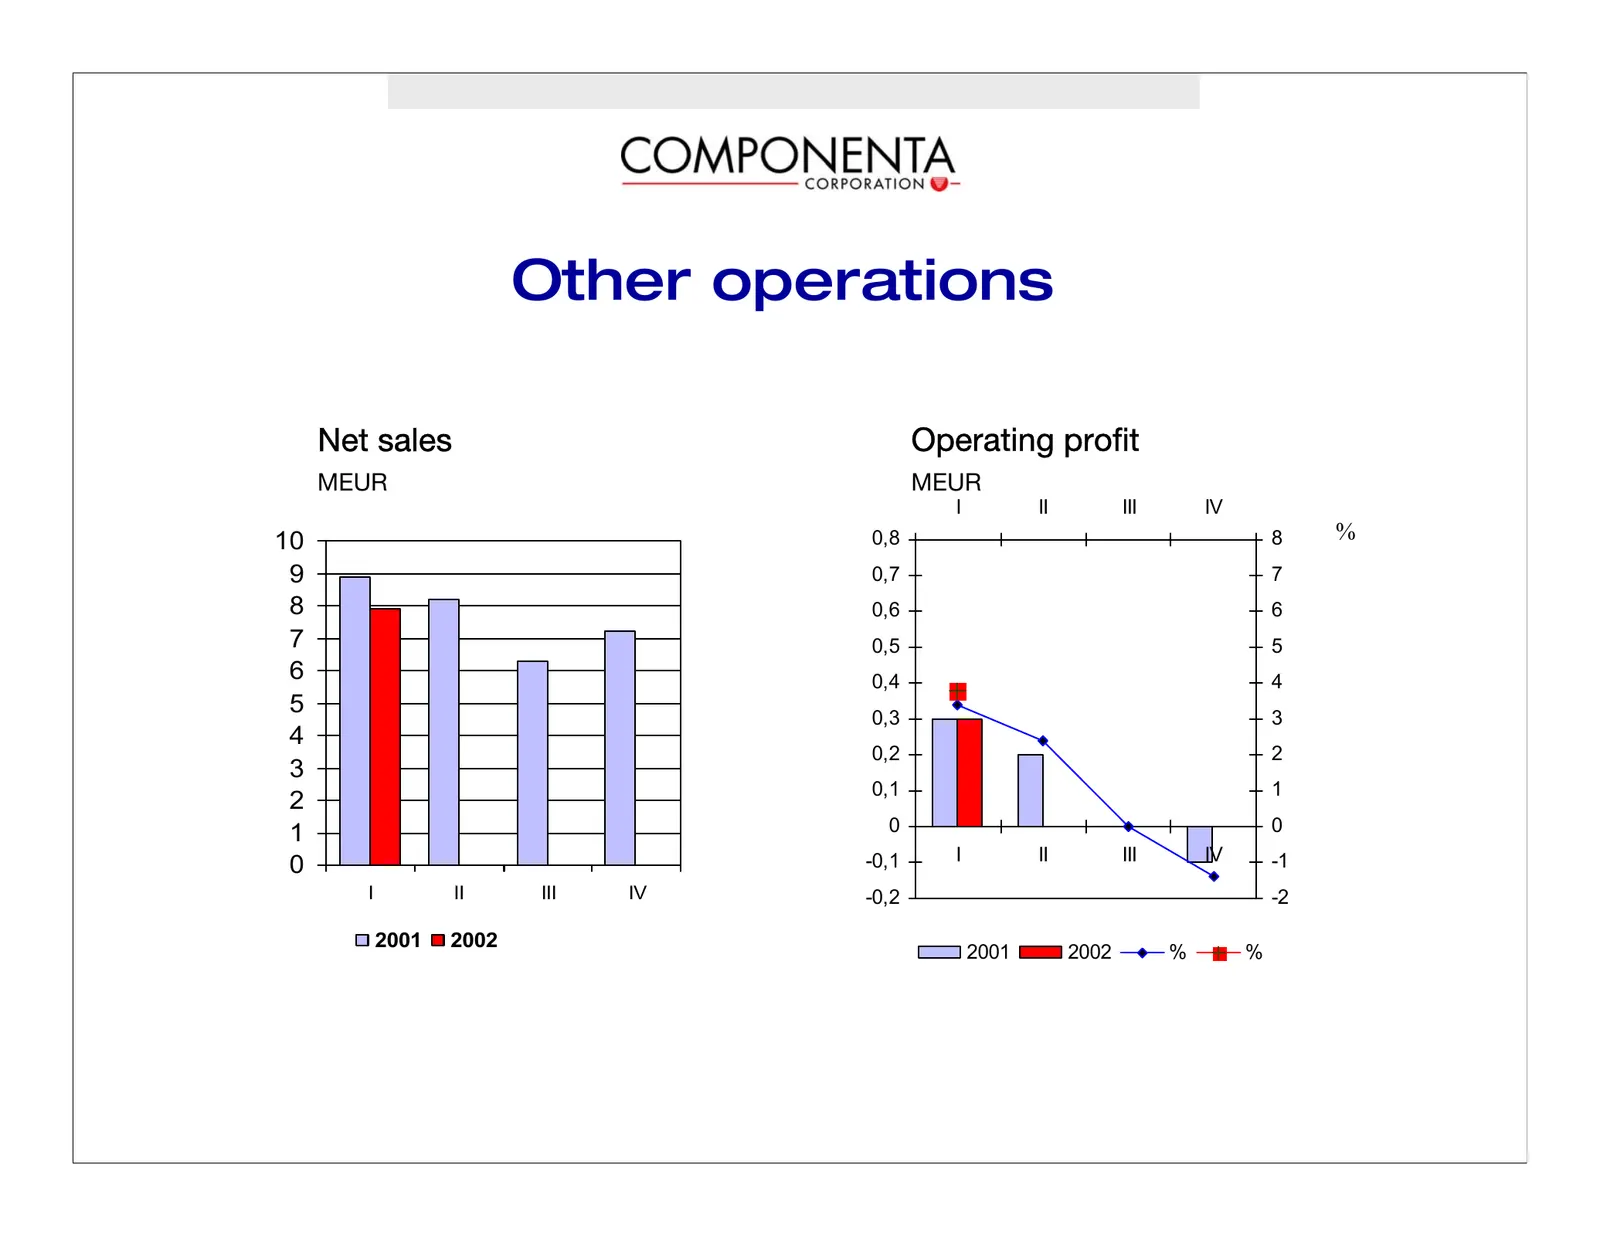
Slide 18: Other operations
Other operations kÉí=ë~äÉë léÉê~íáåÖ=éêçÑáí jbro jbro I II III IV 10 0,8 8 % 9 0,7 7 8 0,6 6 7 0,5 5 6 0,4 4 5 0,3 3 4 0,2 2 3 0,1 1 2 1 0 0 -0,1 I II III IV -1 0 I II III IV -0,2 -2 2001 2002 2001 2002 % %
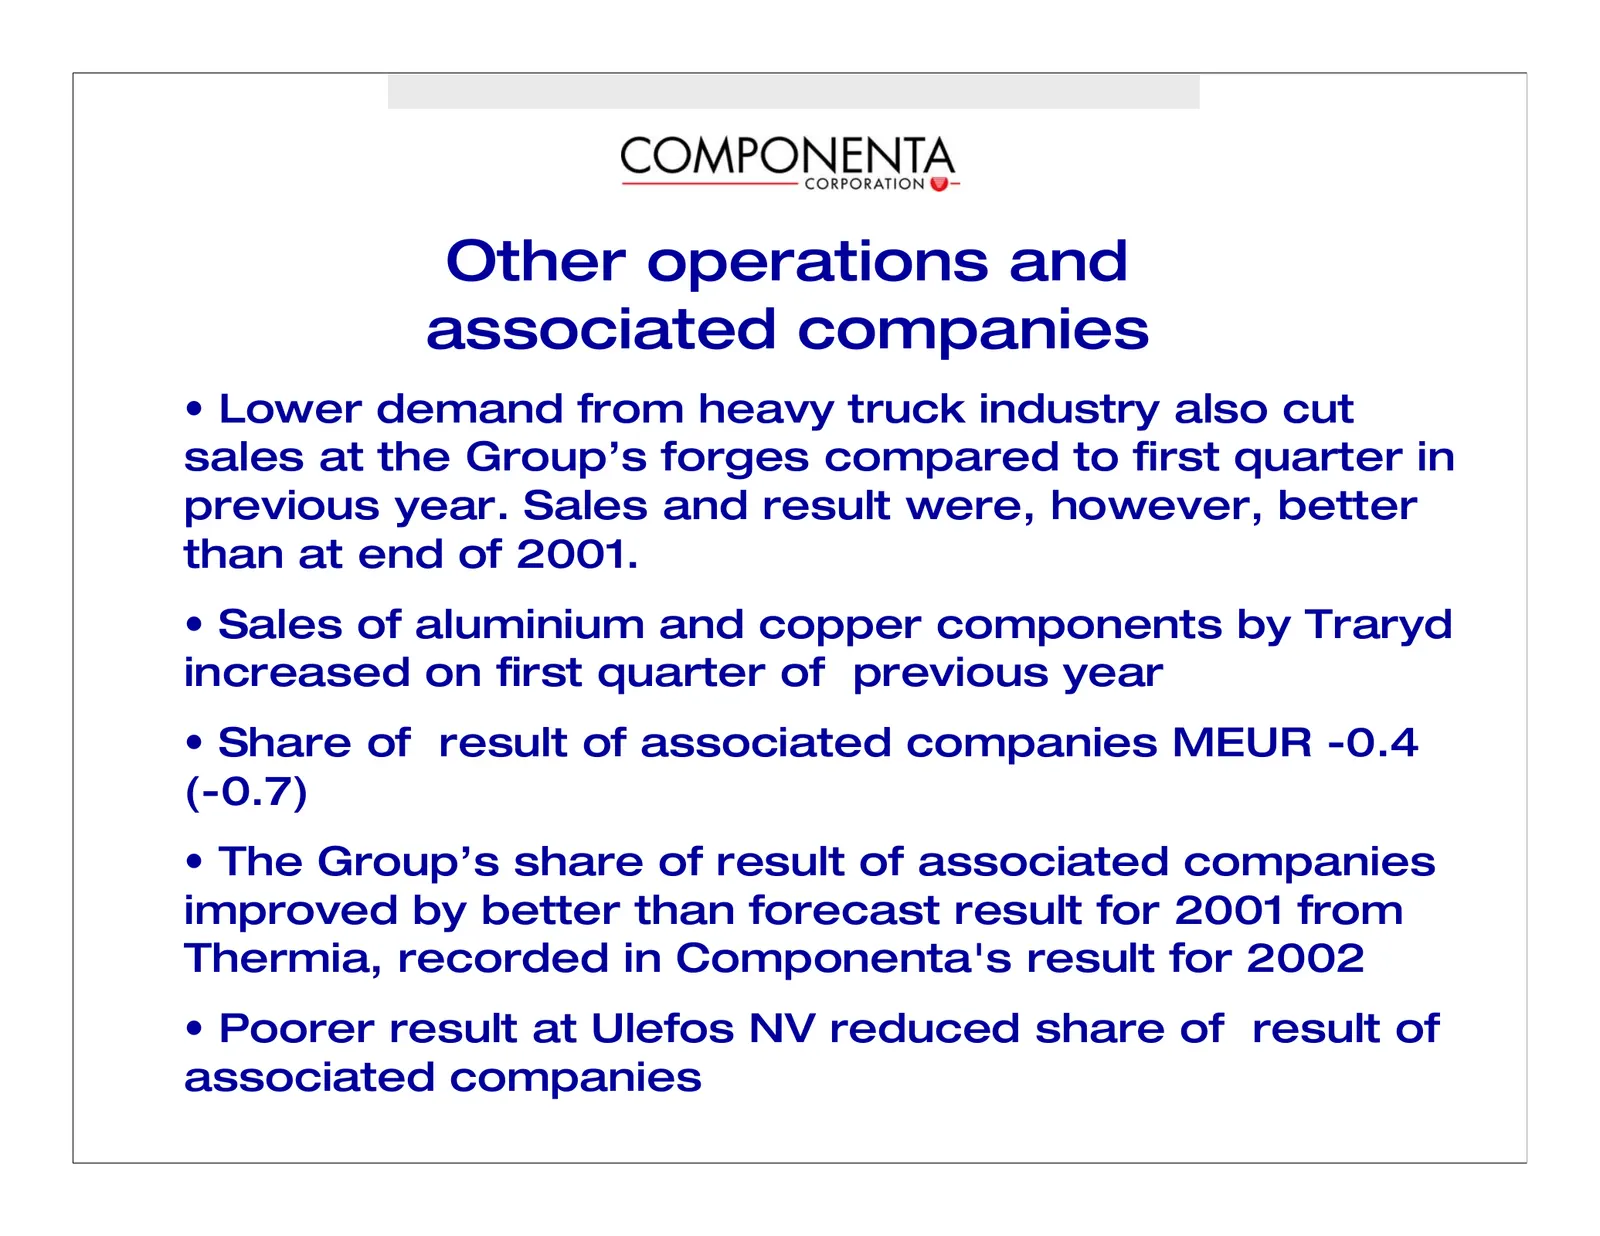
Slide 19: Other operations and associated companies
Other operations and associated companies • Lower demand from heavy truck industry also cut sales at the Group’s forges compared to first quarter in previous year. Sales and result were, however, better than at end of 2001. • Sales of aluminium and copper components by Traryd increased on first quar
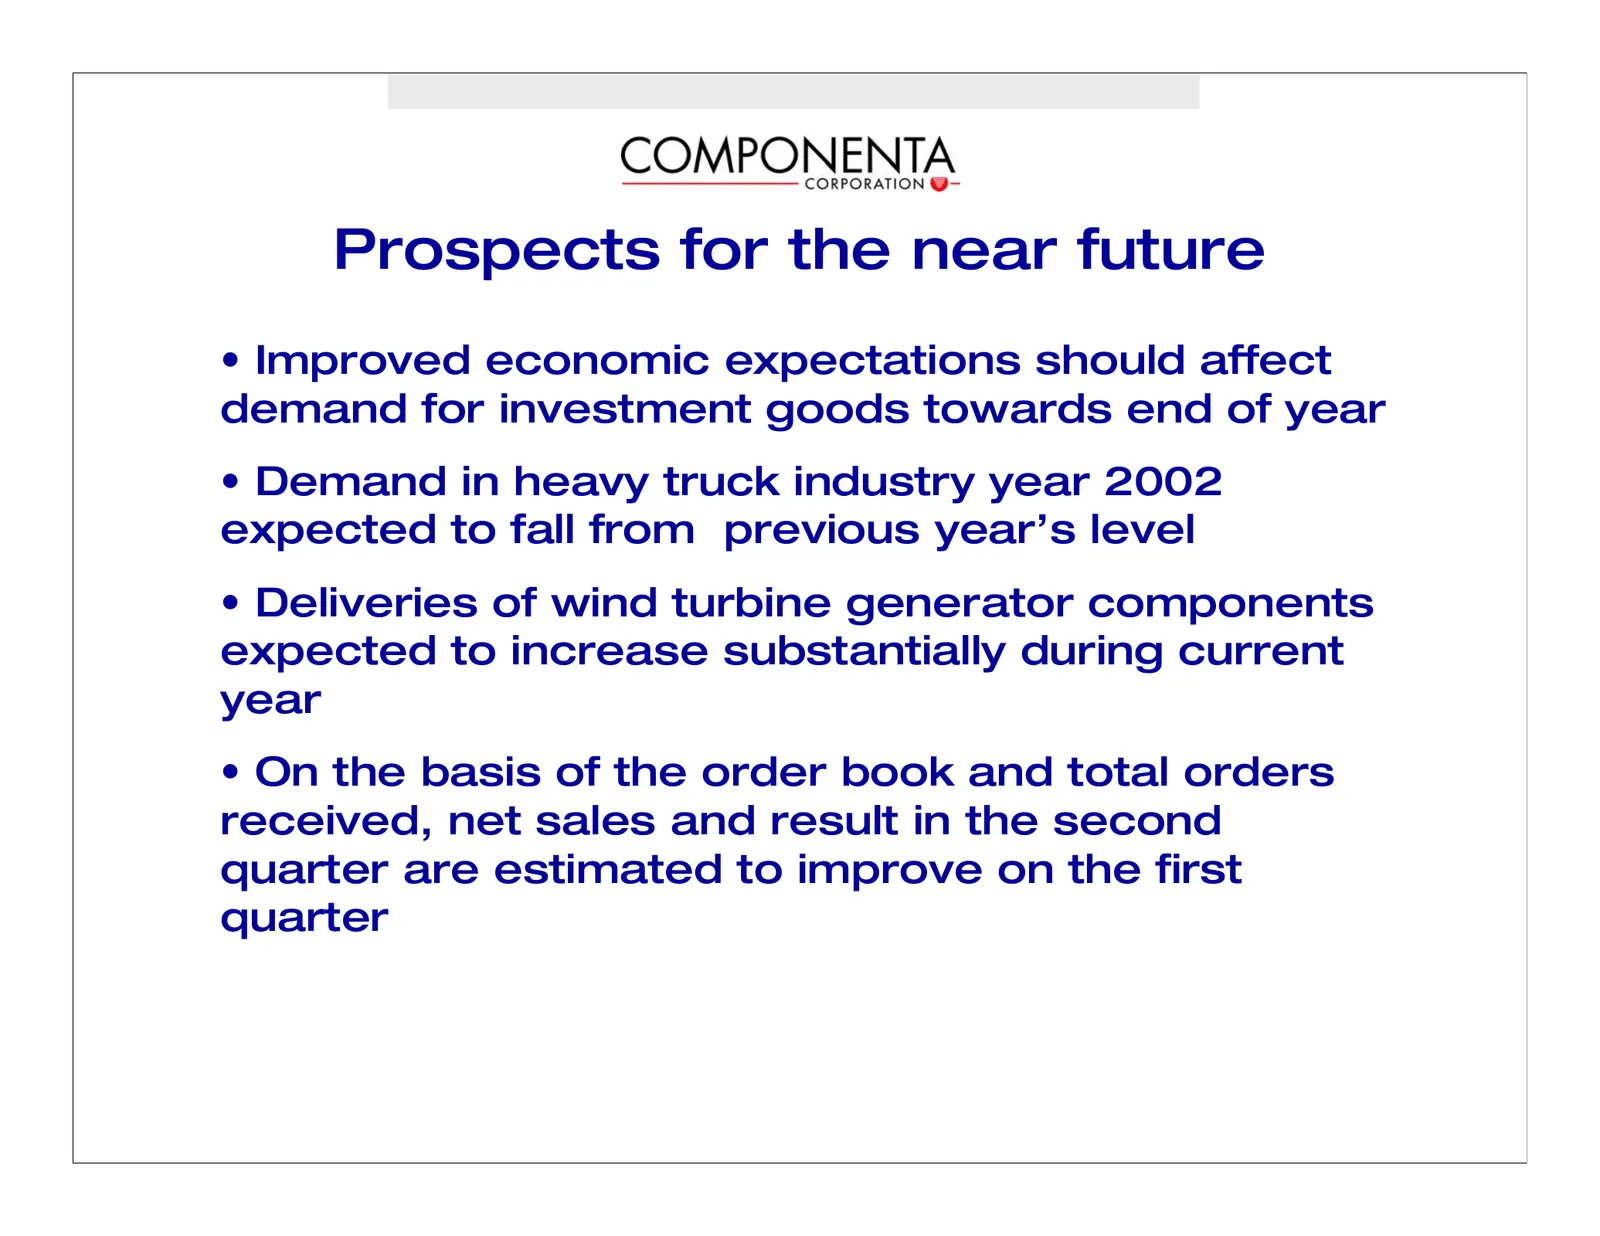
Slide 20: Prospects for the near future
Prospects for the near future • Improved economic expectations should affect demand for investment goods towards end of year • Demand in heavy truck industry year 2002 expected to fall from previous year’s level • Deliveries of wind turbine generator components expected to increase substantially dur
Source: Internet Archive copy of componenta.com
More decks from Componenta Oyj
 H1 2026 Earnings Presentation11 slides · Jul 23, 2026
 Q1 2026 Earnings Presentation10 slides · May 8, 2026
 FY2025 Earnings Presentation11 slides · Mar 6, 2026
 Q3 2025 Earnings Presentation12 slides · Oct 30, 2025
 H1 2025 Earnings Presentation12 slides · Jul 23, 2025
 Q1 2025 Earnings Presentation11 slides · May 9, 2025