Markwest Energy Partners LP — Investor Day (June 2012)
80 slides from Markwest Energy Partners LP's investor day presentation, Jun 1, 2012
Slide 1: Investor & Analyst Conference June 2012
INVESTOR & ANALYST CONFERENCE June 2012
Slide 2: Forward-Looking Statements
Forward-Looking Statements This presentation contains forward-looking statements and information. These forward-looking statements, which in many instances can be identified by words like “could,” “may,” “will,” “should,” “expects,” “plans,” “project,” “anticipates,” “believes,” “planned,” “proposed
Slide 3: Non-GAAP Measures
Non-GAAP Measures Distributable Cash Flow, Adjusted EBITDA , and Net Operating Margin are not measures of performance calculated in accordance with GAAP, and should not be considered separately from or as a substitute for net income, income from operations, or cash flow as reflected in our financial
Slide 4: Agenda
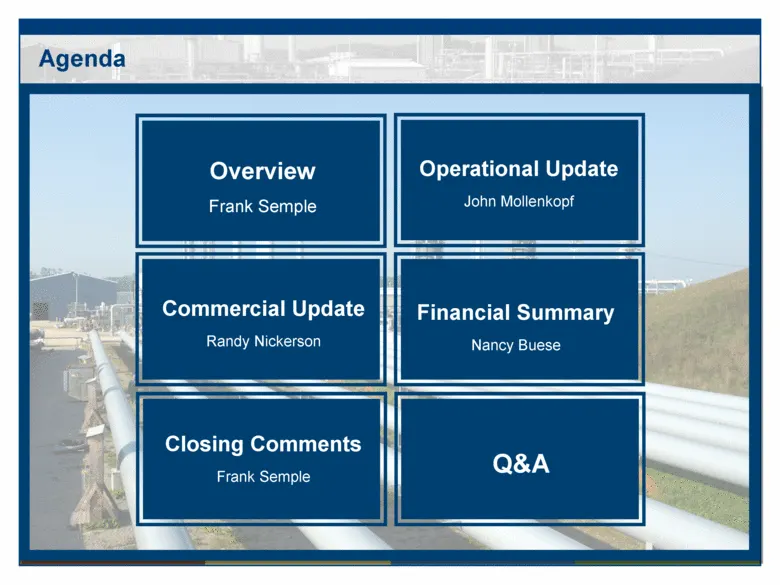
Agenda Commercial Update Randy Nickerson Closing Comments Frank Semple Operational Update John Mollenkopf Financial Summary Nancy Buese Q&A Overview Frank Semple
Slide 5: Overview
OVERVIEW Frank Semple (MARKWEST ENERGY PARTNERS, LP.
Slide 6: Key Investment Considerations
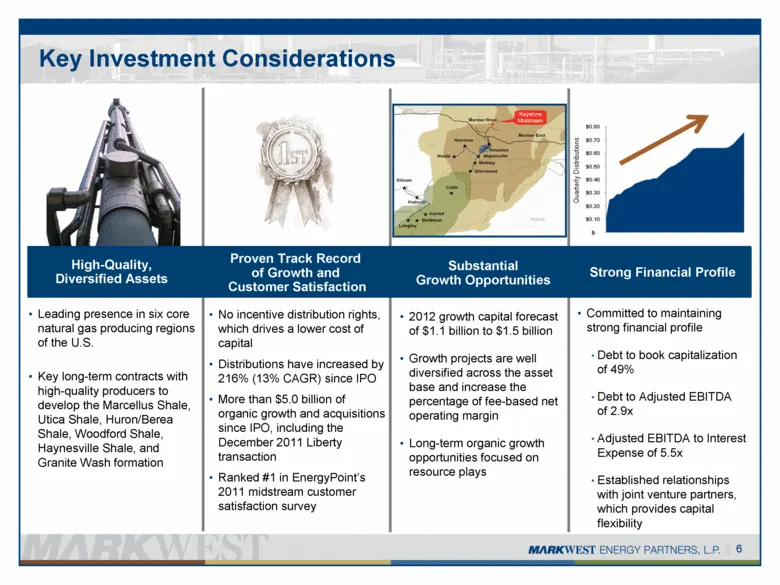
Key Investment Considerations High-Quality, Diversified Assets Proven Track Record of Growth and Customer Satisfaction Substantial Growth Opportunities Strong Financial Profile Leading presence in six core natural gas producing regions of the U.S. Key long-term contracts with high-quality producers
Slide 7: U.S. Shale Plays are Driving Natural Gas Supply
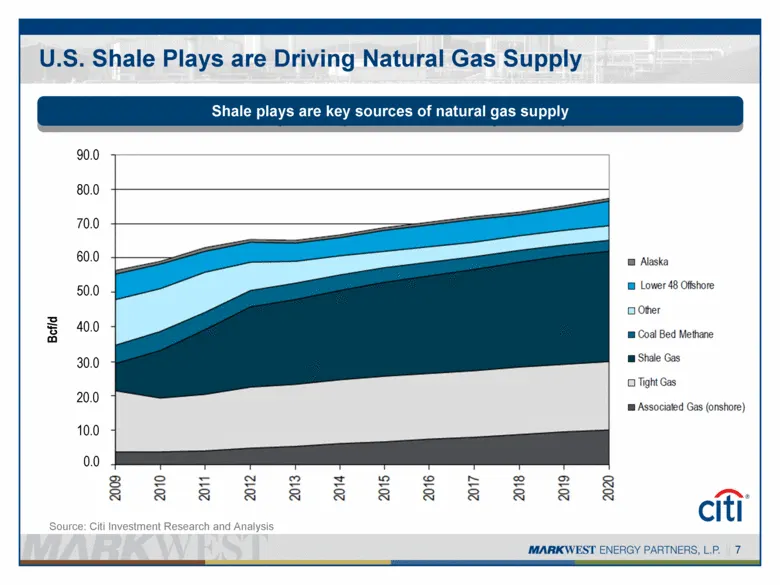
U.S. Shale Plays are Driving Natural Gas Supply 7 Source: Citi Investment Research and Analysis Shale plays are key sources of natural gas supply Bcf/d 90.0 80.0 70.0 60.0 50.0 40.0 30.0 20.0 10.0 0.0
Slide 8: Geographic Footprint
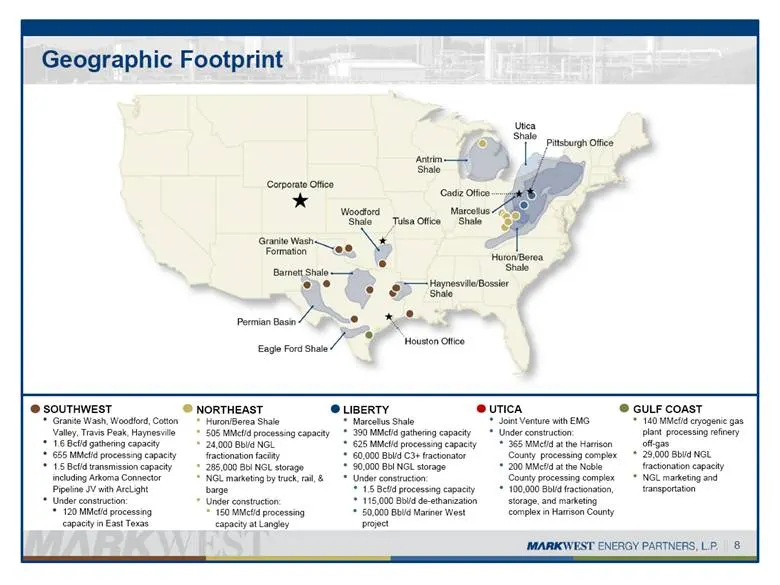
Geographic Footprint UTICA Joint Venture with EMG Under construction: 365 MMcf/d at the Harrison County processing complex 200 MMcf/d at the Noble County processing complex 100,000 Bbl/d fractionation, storage, and marketing complex in Harrison County SOUTHWEST Granite Wash, Woodford, Cotton Valley,
Slide 9: Strong Distribution Growth and Unit Performance
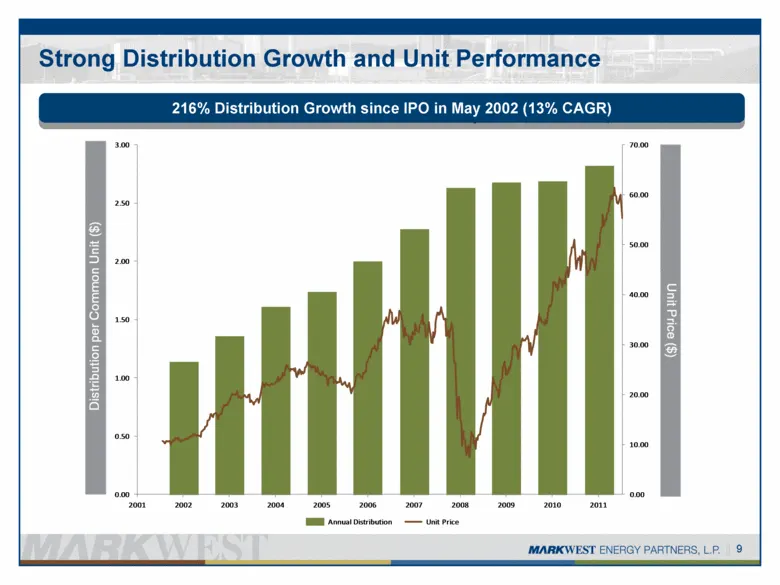
9 Strong Distribution Growth and Unit Performance 216% Distribution Growth since IPO in May 2002 (13% CAGR) 0.00 0.50 1.00 1.50 2.00 2.50 3.00 2001 2002 2003 2004 2005 2006 2007 2008 2009 2010 2011 0.00 10.00 20.00 30.00 40.00 50.00 60.00 70.00 Distribution per Common Unit ($) Unit Price ($) Annual
Slide 10: Operational Update
OPERATIONAL UPDATE John Mollenkopf
Slide 11: Operational Overview and Philosophy
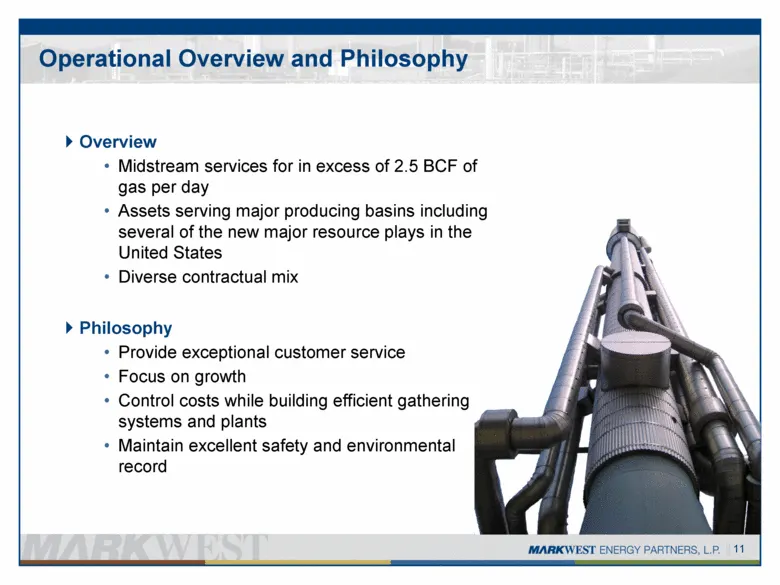
Operational Overview and Philosophy Overview Midstream services for in excess of 2.5 BCF of gas per day Assets serving major producing basins including several of the new major resource plays in the United States Diverse contractual mix Philosophy Provide exceptional customer service Focus on growth
Slide 12: Growth Driven by Customer Satisfaction
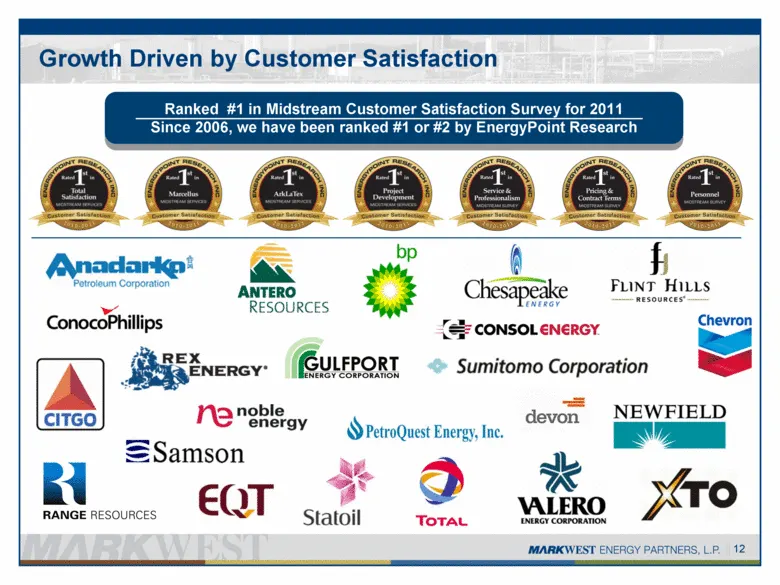
Growth Driven by Customer Satisfaction 12 Ranked #1 in Midstream Customer Satisfaction Survey for 2011 Since 2006, we have been ranked #1 or #2 by EnergyPoint Research
Slide 13: Significant Growth Requires a Highly Skilled Team
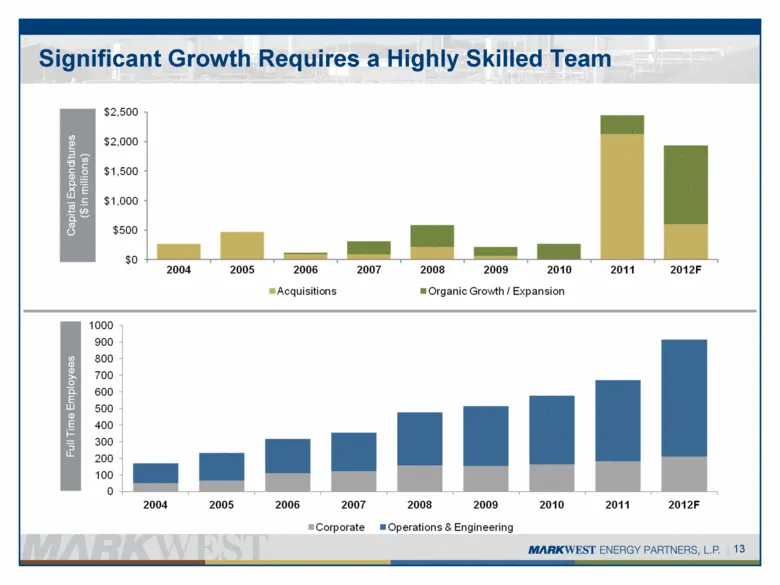
Significant Growth Requires a Highly Skilled Team 13
Slide 14: Project Execution
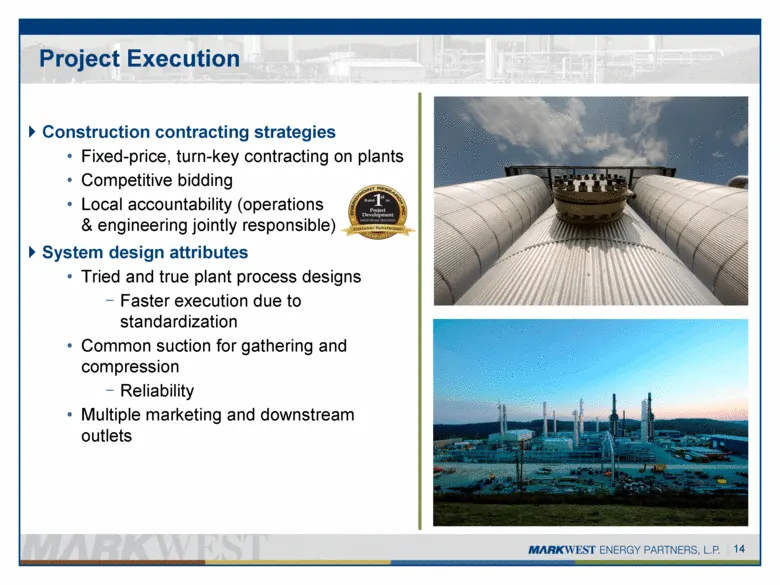
Project Execution Construction contracting strategies Fixed-price, turn-key contracting on plants Competitive bidding Local accountability (operations & engineering jointly responsible) System design attributes Tried and true plant process designs Faster execution due to standardization Common sucti
Slide 15: Regulatory and Permitting Strategies
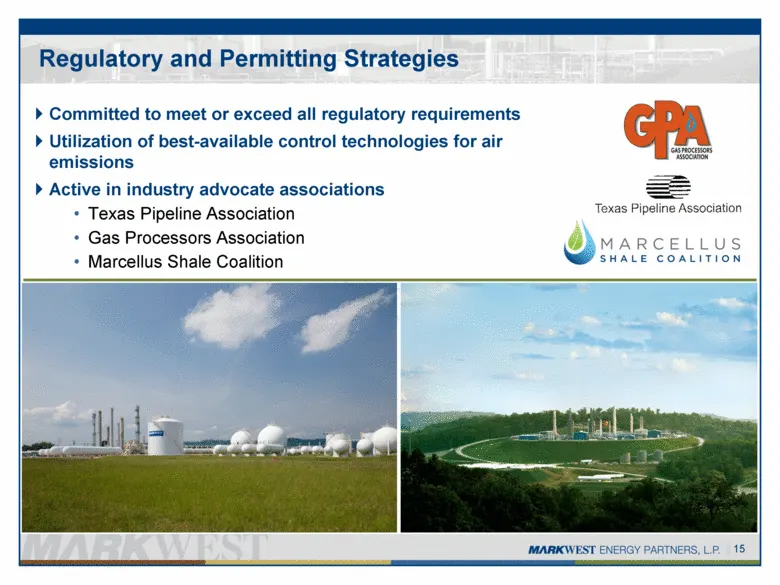
Regulatory and Permitting Strategies Committed to meet or exceed all regulatory requirements Utilization of best-available control technologies for air emissions Active in industry advocate associations Texas Pipeline Association Gas Processors Association Marcellus Shale Coalition 15
Slide 16: Diverse Midstream Volumes in Major Producing Basins
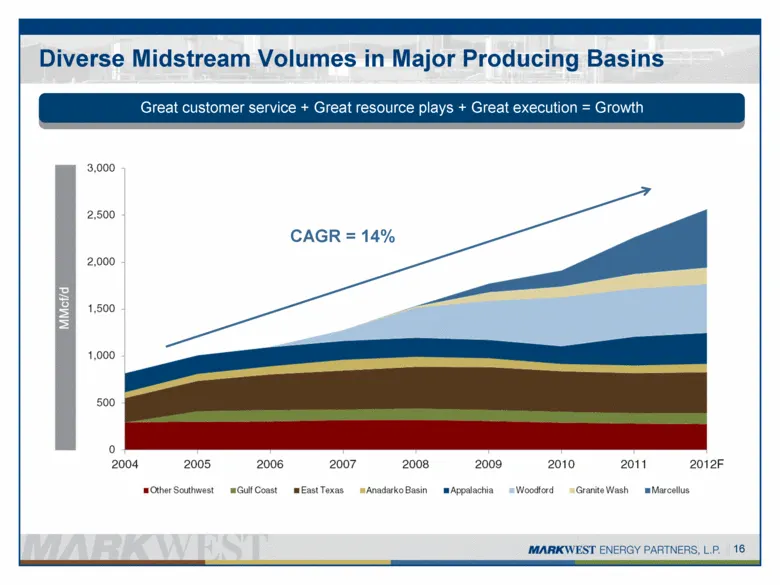
CAGR = 14% 16 Diverse Midstream Volumes in Major Producing Basins Great customer service + Great resource plays + Great execution = Growth
Slide 17: Segment Operating Income
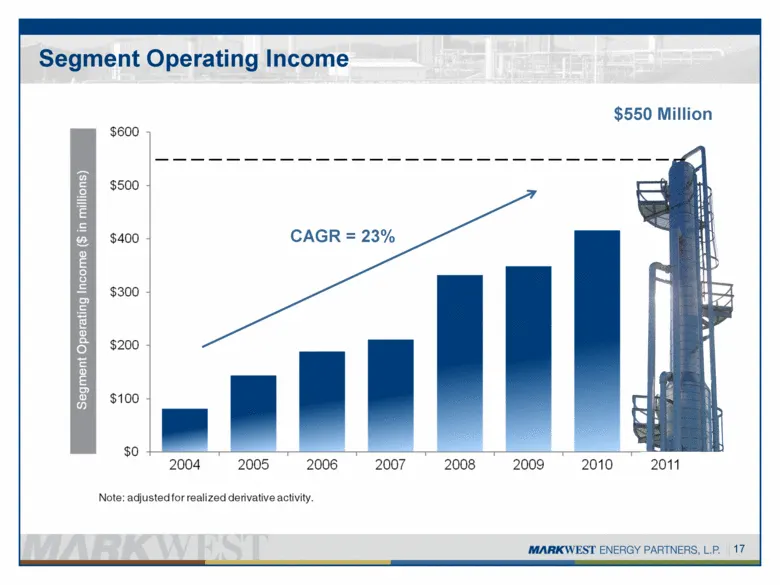
Segment Operating Income $550 Million 17 CAGR = 23%
Slide 18: Contributions to Operating Income by Segment
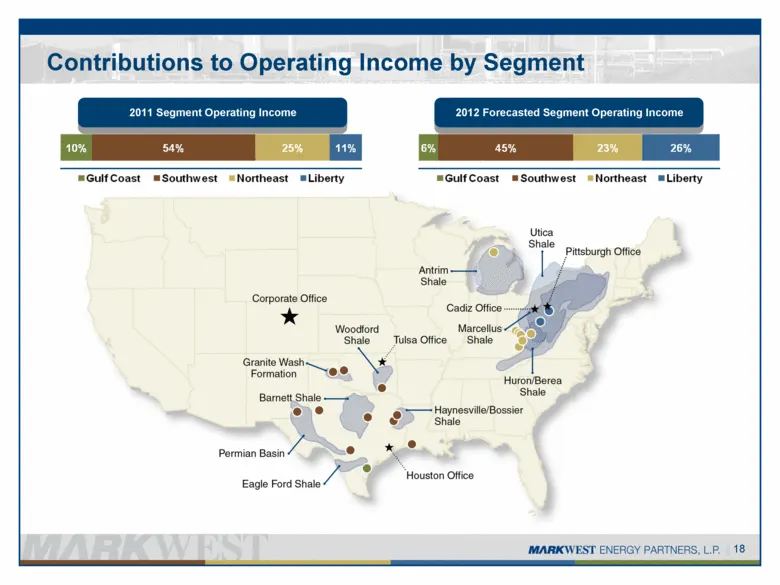
Contributions to Operating Income by Segment 18 2011 Segment Operating Income 2012 Forecasted Segment Operating Income
Slide 19: Southwest Segment
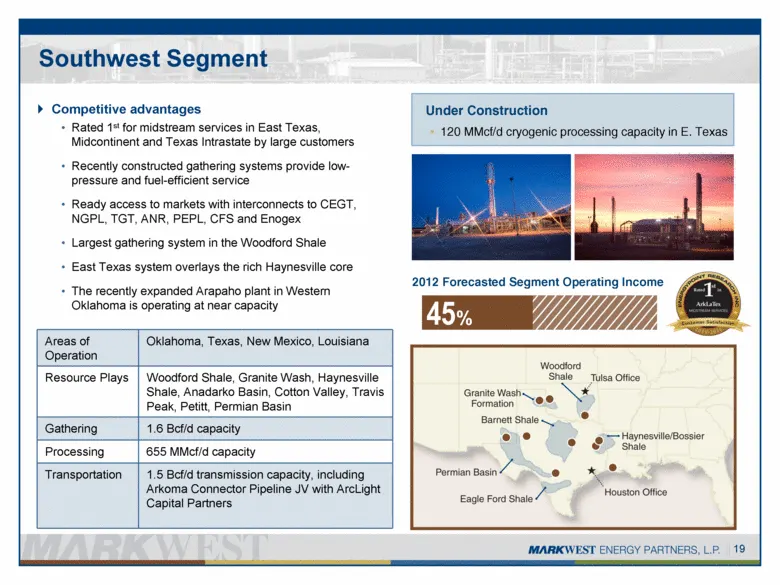
Southwest Segment Competitive advantages Rated 1st for midstream services in East Texas, Midcontinent and Texas Intrastate by large customers Recently constructed gathering systems provide low-pressure and fuel-efficient service Ready access to markets with interconnects to CEGT, NGPL, TGT, ANR, PEP
Slide 20: Gulf Coast Segment
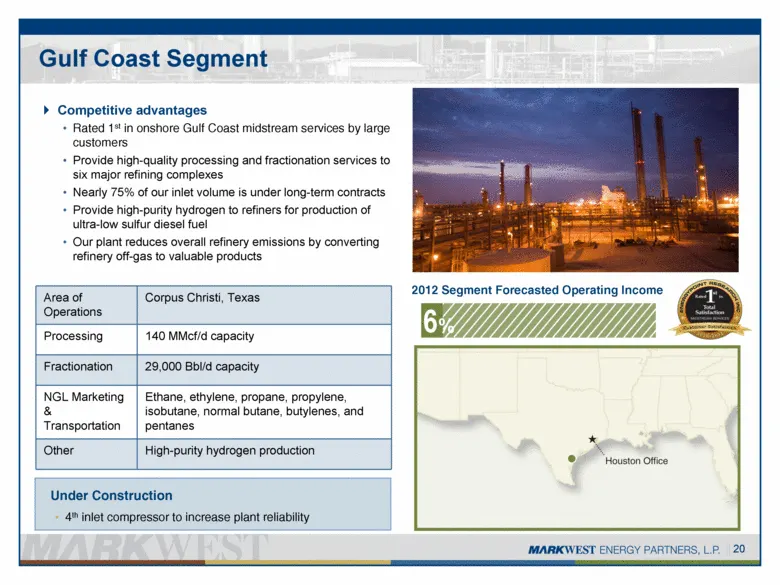
Gulf Coast Segment Competitive advantages Rated 1st in onshore Gulf Coast midstream services by large customers Provide high-quality processing and fractionation services to six major refining complexes Nearly 75% of our inlet volume is under long-term contracts Provide high-purity hydrogen to refin
Slide 21: Northeast Segment
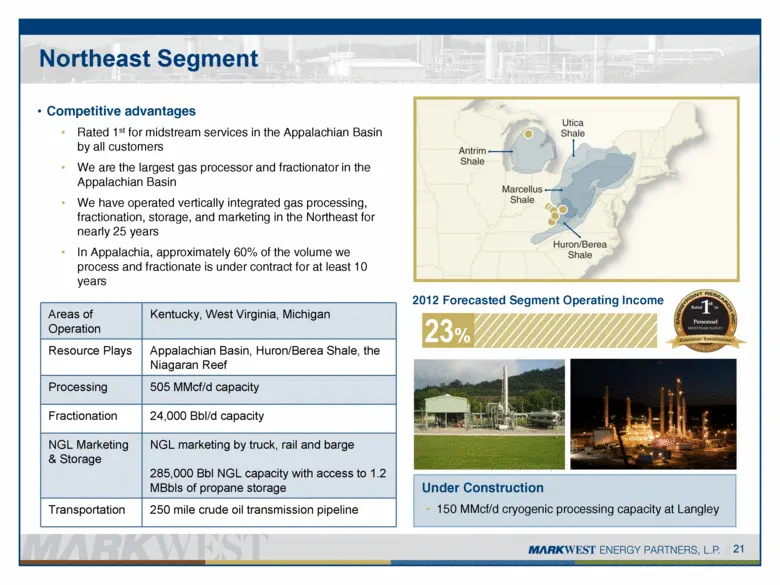
Northeast Segment Competitive advantages Rated 1st for midstream services in the Appalachian Basin by all customers We are the largest gas processor and fractionator in the Appalachian Basin We have operated vertically integrated gas processing, fractionation, storage, and marketing in the Northeast
Slide 22: Liberty Segment
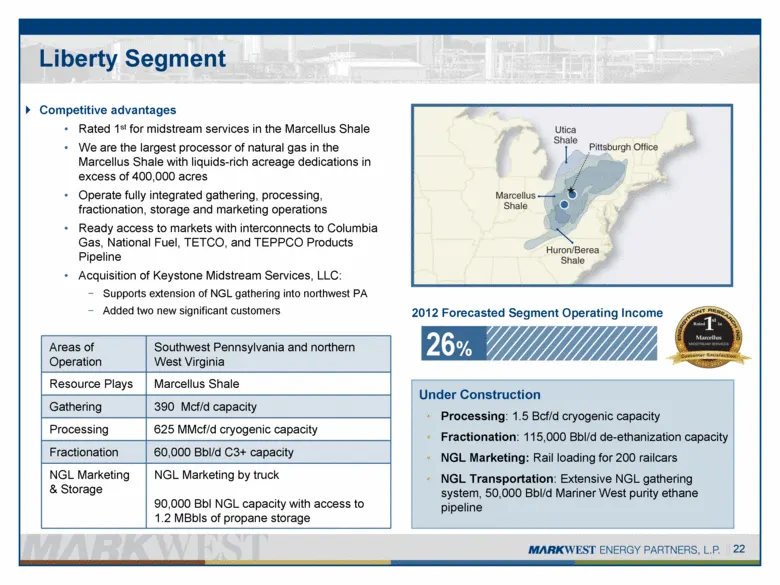
Liberty Segment Competitive advantages Rated 1st for midstream services in the Marcellus Shale We are the largest processor of natural gas in the Marcellus Shale with liquids-rich acreage dedications in excess of 400,000 acres Operate fully integrated gathering, processing, fractionation, storage an
Slide 23: Liberty 2011
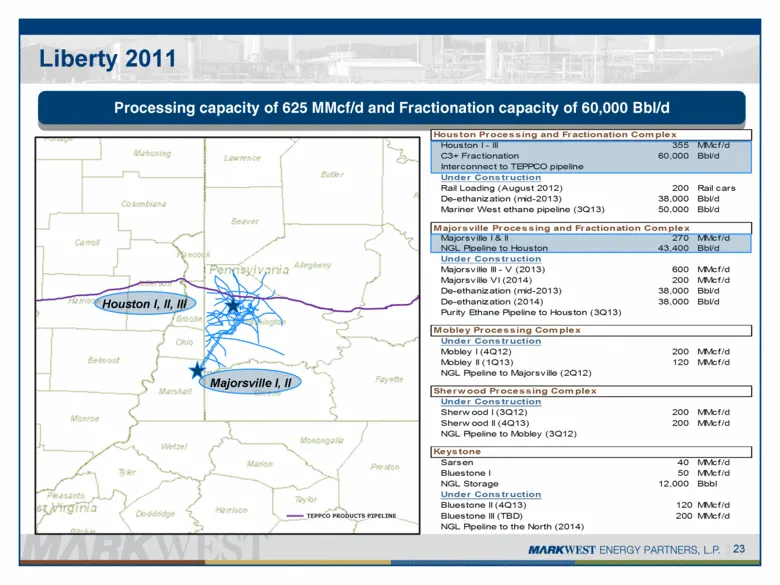
Liberty 2011 Houston I, II, III TEPPCO PRODUCTS PIPELINE Majorsville I, II 23 Houston I, II, III Processing capacity of 625 MMcf/d and Fractionation capacity of 60,000 Bbl/d Houston Processing and Fractionation Complex Houston I - III 355 MMcf/d C3+ Fractionation 60,000 Bbl/d Interconnect to TEPPCO
Slide 24: Liberty 2012
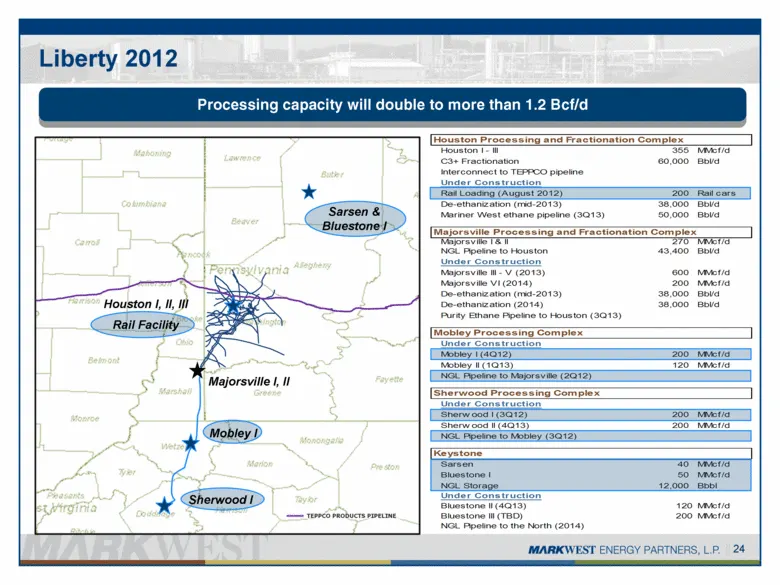
Liberty 2012 Houston I, II, III TEPPCO PRODUCTS PIPELINE 24 Processing capacity will double to more than 1.2 Bcf/d Houston I, II, III Majorsville I, II Sherwood I Mobley I Sarsen & Bluestone I Rail Facility Houston Processing and Fractionation Complex Houston I - III 355 MMcf/d C3+ Fractionation 60,
Slide 25: Liberty 2013
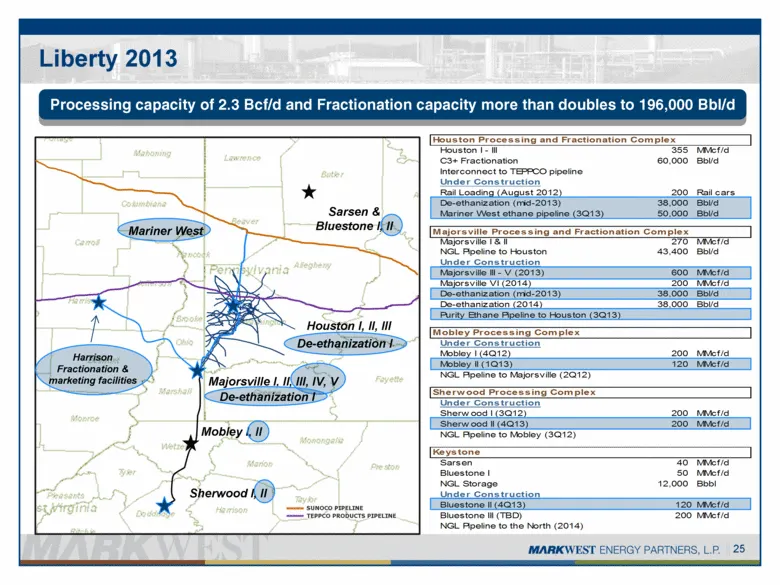
Liberty 2013 Houston I, II, III TEPPCO PRODUCTS PIPELINE SUNOCO PIPELINE 25 Processing capacity of 2.3 Bcf/d and Fractionation capacity more than doubles to 196,000 Bbl/d Sarsen & Bluestone I, II Sherwood I, II Majorsville I, II, III, IV, V Mobley I, II Houston I, II, III De-ethanization I Harrison
Slide 26: Liberty 2014
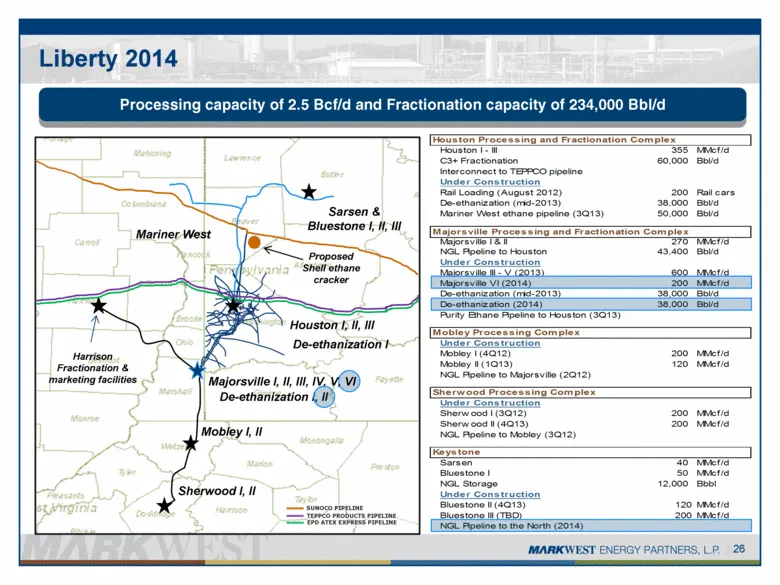
Liberty 2014 TEPPCO PRODUCTS PIPELINE SUNOCO PIPELINE EPD ATEX EXPRESS PIPELINE 26 Processing capacity of 2.5 Bcf/d and Fractionation capacity of 234,000 Bbl/d Mariner West De-ethanization I Houston I, II, III De-ethanization I, II Majorsville I, II, III, IV, V, VI Sarsen & Bluestone I, II, III Sher
Slide 27: Utica Joint Venture 2012
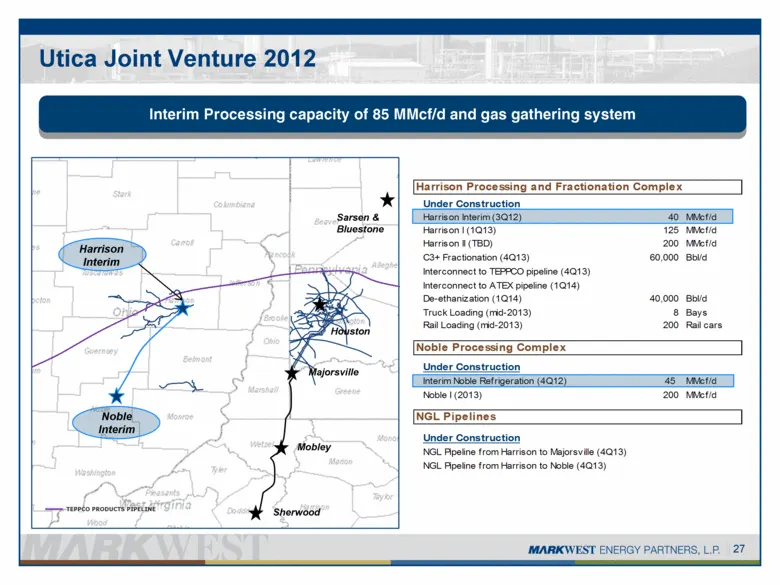
Utica Joint Venture 2012 27 Houston Majorsville Harrison Interim TEPPCO PRODUCTS PIPELINE Sarsen & Bluestone Interim Processing capacity of 85 MMcf/d and gas gathering system Noble Interim Mobley Sherwood Harrison Processing and Fractionation Complex Under Construction Harrison Interim (3Q12) 40 MMc
Slide 28: Utica Joint Venture 2013
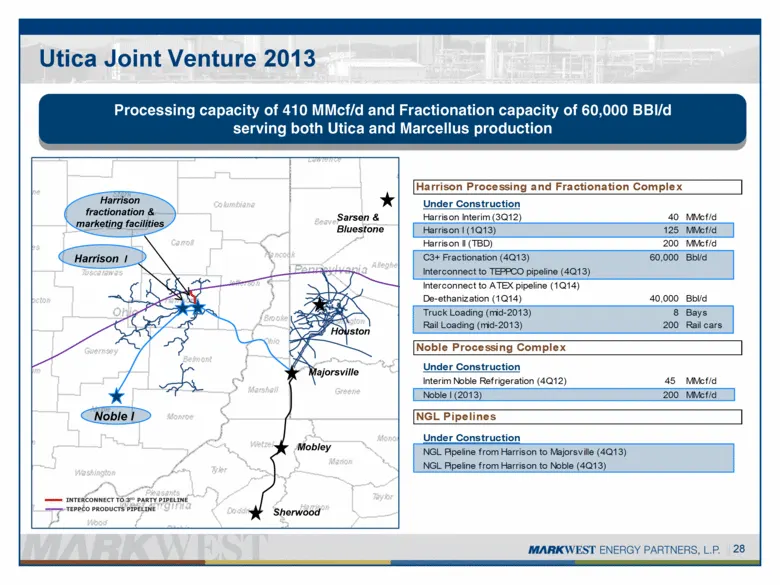
Utica Joint Venture 2013 28 Mobley Sherwood Houston Majorsville Noble I Harrison fractionation & marketing facilities Harrison I TEPPCO PRODUCTS PIPELINE Processing capacity of 410 MMcf/d and Fractionation capacity of 60,000 BBl/d serving both Utica and Marcellus production INTERCONNECT TO 3RD PARTY
Slide 29: Utica Joint Venture 2014
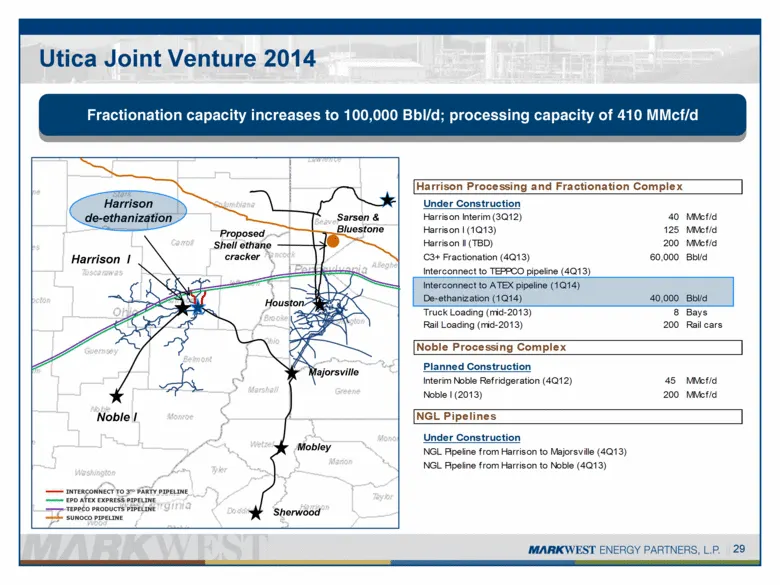
Utica Joint Venture 2014 29 Fractionation capacity increases to 100,000 Bbl/d; processing capacity of 410 MMcf/d Mobley Sherwood Houston Majorsville Noble I Harrison de-ethanization Proposed Shell ethane cracker TEPPCO PRODUCTS PIPELINE EPD ATEX EXPRESS PIPELINE Sarsen & Bluestone INTERCONNECT TO 3R
Slide 30: Significant Developments Since June 2011
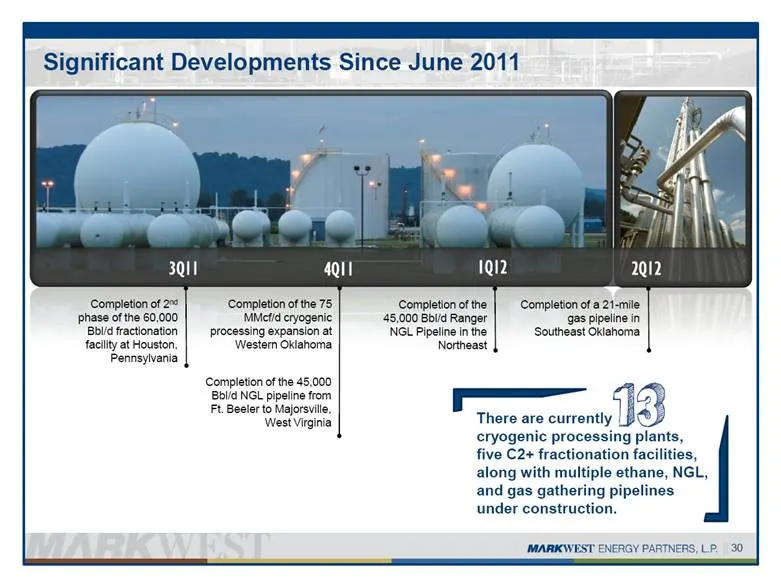
Significant Developments Since June 2011 30 3Q11 4Q11 1Q12 2Q12 Completion of 2nd phase of the 60,000 Bbl/d fractionation facility at Houston, Pennsylvania Completion of the 75 MMcf/d cryogenic processing expansion at Western Oklahoma Completion of the 45,000 Bbl/d NGL pipeline from Ft. Beeler to Ma
Slide 31: Operational Summary
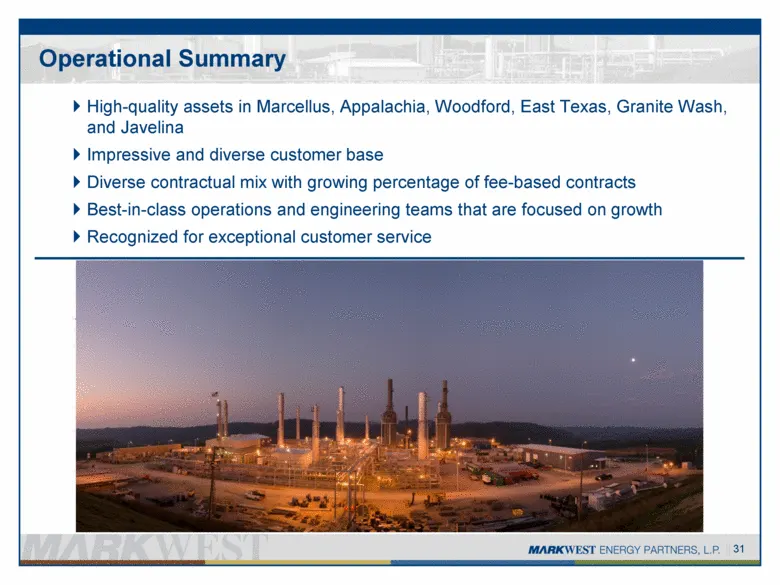
Operational Summary High-quality assets in Marcellus, Appalachia, Woodford, East Texas, Granite Wash, and Javelina Impressive and diverse customer base Diverse contractual mix with growing percentage of fee-based contracts Best-in-class operations and engineering teams that are focused on growth Rec
Slide 32: Commercial Update
COMMERCIAL UPDATE Randy Nickerson
Slide 33: It's been a busy couple of years – But where do we go from here?
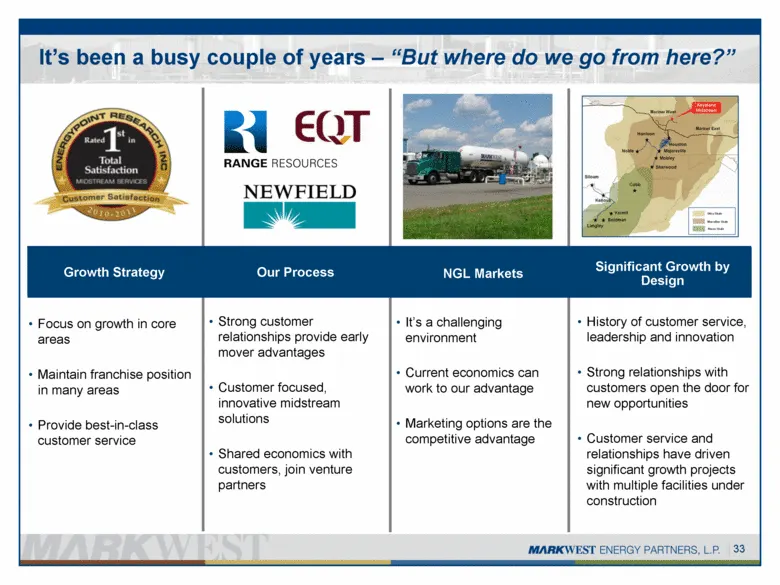
It’s been a busy couple of years – “But where do we go from here?” Growth Strategy Our Process NGL Markets Significant Growth by Design Focus on growth in core areas Maintain franchise position in many areas Provide best-in-class customer service Strong customer relationships provide early mover adv
Slide 34: Growth Strategy
GROWTH STRATEGY (MARKWEST ENERGY PARTNERS, LP.
Slide 35: Commitment to Resource Plays
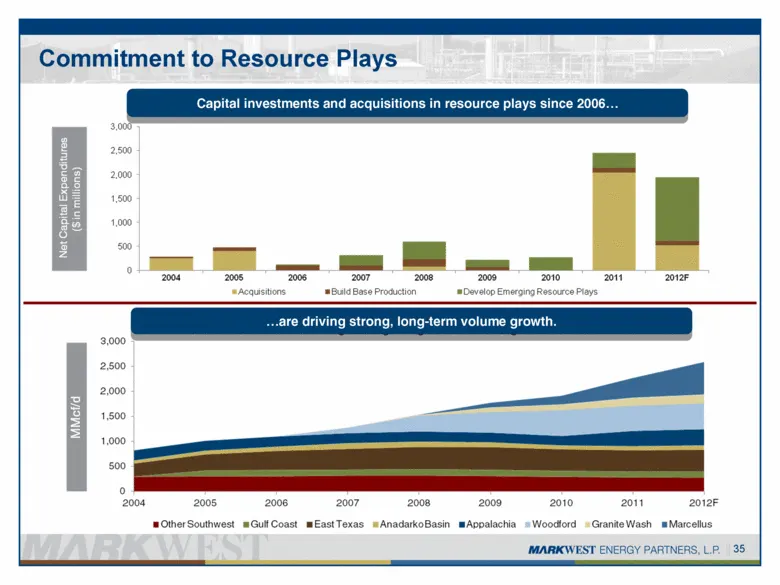
Develop Emerging Resource Plays Build Base Production Acquisitions (Conventional / Tight Sand) Base Production (Conventional / Tight Sand) 35 Commitment to Resource Plays Capital investments and acquisitions in resource plays since 2006 are driving strong, long-term volume growth.
Slide 36: Growth in Core Areas: The Granite Wash – Western Oklahoma
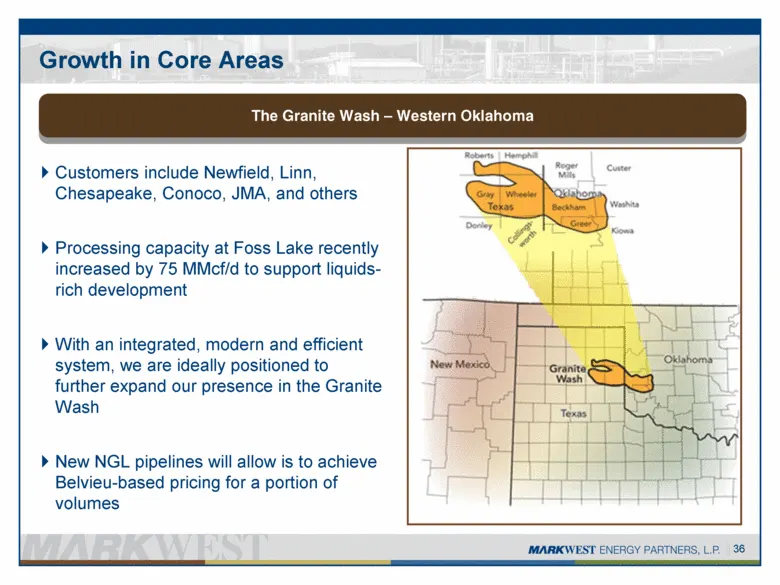
Customers include Newfield, Linn, Chesapeake, Conoco, JMA, and others Processing capacity at Foss Lake recently increased by 75 MMcf/d to support liquids-rich development With an integrated, modern and efficient system, we are ideally positioned to further expand our presence in the Granite Wash New
Slide 37: Growth in Core Areas: The Woodford Shale – Southeast Oklahoma
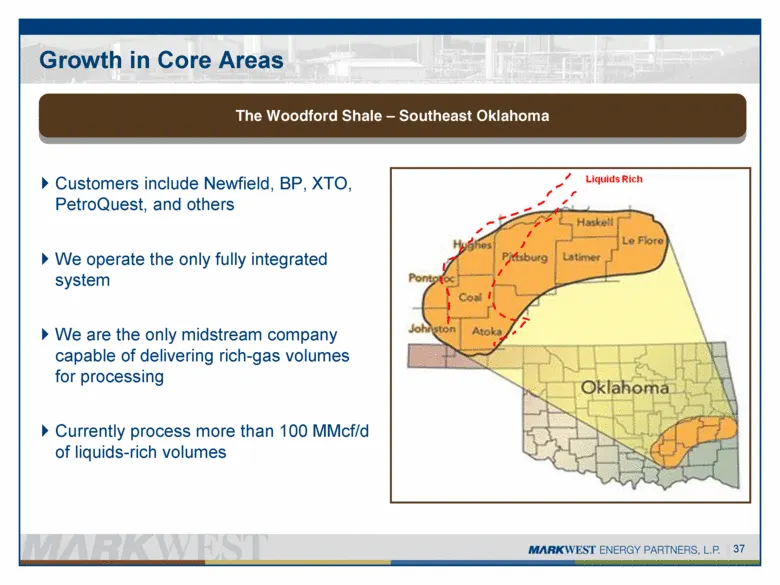
Customers include Newfield, BP, XTO, PetroQuest, and others We operate the only fully integrated system We are the only midstream company capable of delivering rich-gas volumes for processing Currently process more than 100 MMcf/d of liquids-rich volumes Growth in Core Areas 37 The Woodford Shale –
Slide 38: Growth in Core Areas: The Haynesville Shale – East Texas
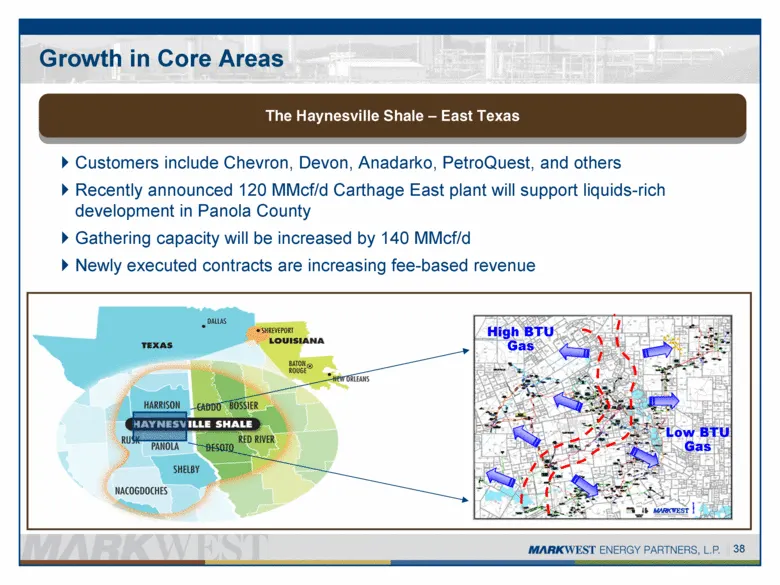
Growth in Core Areas 38 The Haynesville Shale – East Texas Customers include Chevron, Devon, Anadarko, PetroQuest, and others Recently announced 120 MMcf/d Carthage East plant will support liquids-rich development in Panola County Gathering capacity will be increased by 140 MMcf/d Newly executed con
Slide 39: Growth in Core Areas: Midstream Leader in Northeast Shales
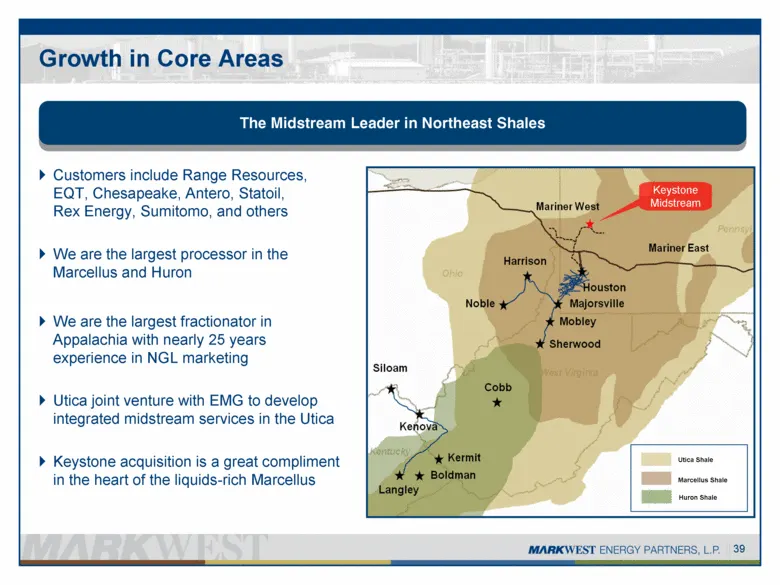
Growth in Core Areas 39 The Midstream Leader in Northeast Shales Customers include Range Resources, EQT, Chesapeake, Antero, Statoil, Rex Energy, Sumitomo, and others We are the largest processor in the Marcellus and Huron We are the largest fractionator in Appalachia with nearly 25 years experience
Slide 40: Maintain Our Franchise Positions – Northeast
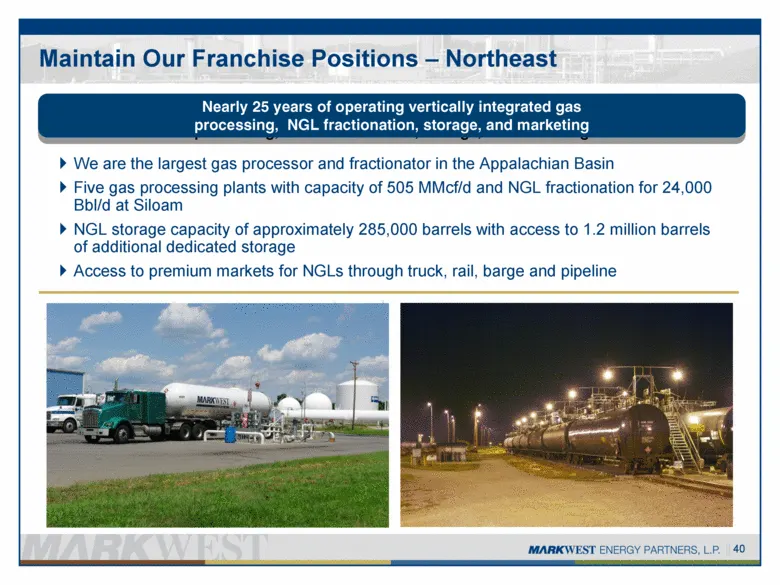
Maintain Our Franchise Positions – Northeast We are the largest gas processor and fractionator in the Appalachian Basin Five gas processing plants with capacity of 505 MMcf/d and NGL fractionation for 24,000 Bbl/d at Siloam NGL storage capacity of approximately 285,000 barrels with access to 1.2 mil
Slide 41: Maintain Our Franchise Positions – Marcellus and Utica
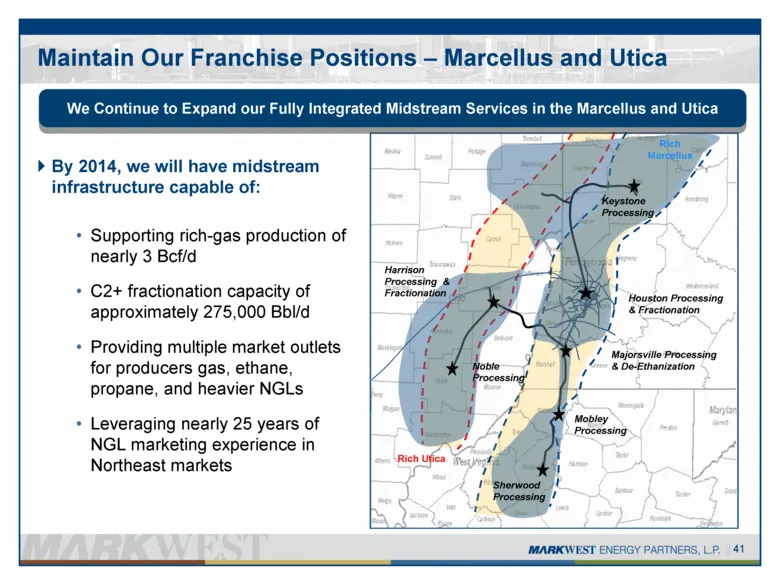
Maintain Our Franchise Positions – Marcellus and Utica We Continue to Expand our Fully Integrated Midstream Services in the Marcellus and Utica By 2014, we will have midstream infrastructure capable of: Supporting rich-gas production of nearly 3 Bcf/d C2+ fractionation capacity of approximately 275,
Slide 42: Our Process
OUR PROCESS (MARKWEST ENERGY PARTNERS, LP.
Slide 43: Customer Relationships & Strategic Partnerships
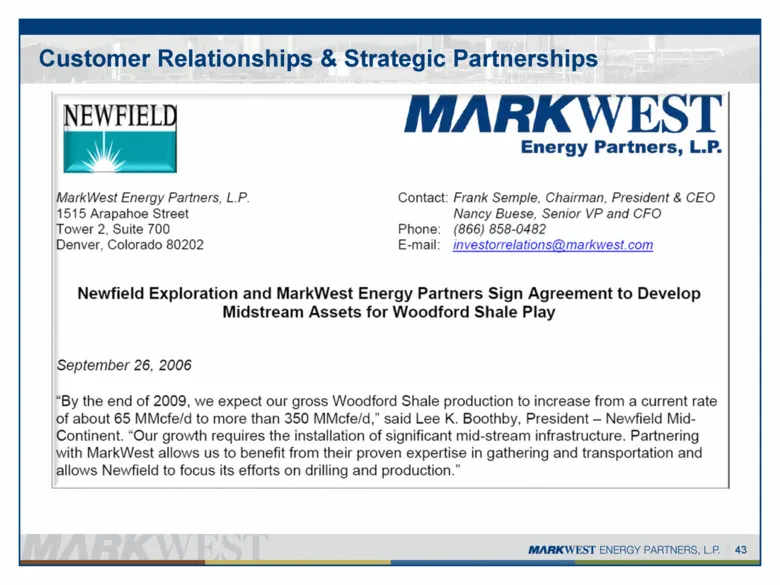
Customer Relationships & Strategic Partnerships 43
Slide 44: Customer Relationships & Strategic Partnerships
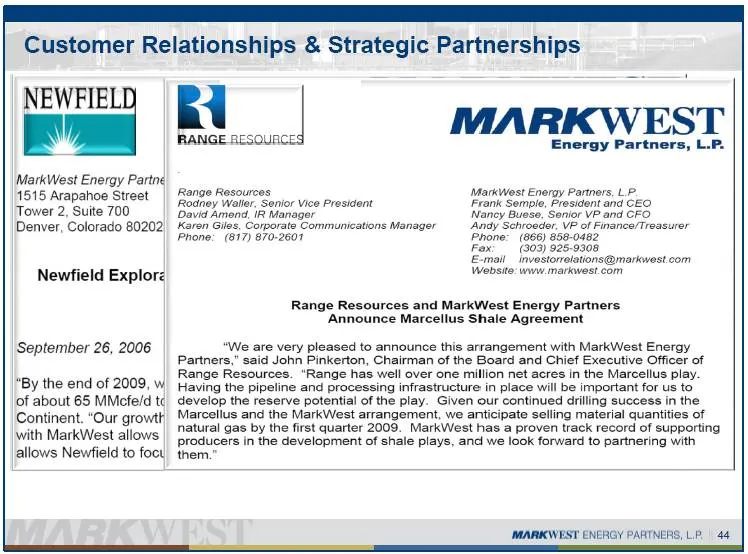
Customer Relationships & Strategic Partnerships a E MARKWEST ANGE AES Energy Partners, MarkWest Energy Partne Range Resources MarkWest Energy Partners, LP. 11515 Arapahoe Street Rodney Waller, Senior Vice President Frank Semple, President and CEO Tower 2, Suite 700 Davie Amend, if Manager Maney Bues
Slide 45: Customer Relationships & Strategic Partnerships
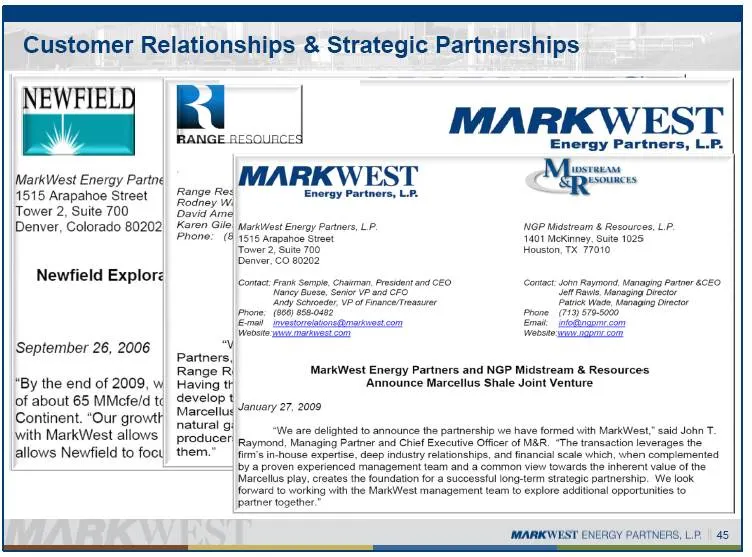
Customer Relationships & Strategic Partnerships NEWFIEL a | MARKWEST RANGE RESOURC! Energy Partners, L.P. MarkWest Energy Partne MARKWEST Migs. 1516 Arapahoe Street | Range Fes Enorgy Partners, LP. Tower 2, Suite 700 Davia Ame, Denver, Colorado 80202 Karen Gile| Markivest Enery Partners, LP. IGP Mid
Slide 46: Customer Relationships & Strategic Partnerships
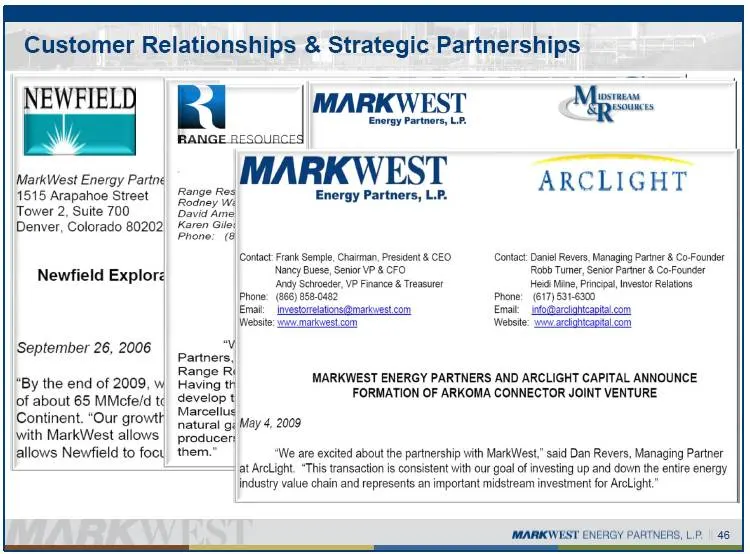
e MarkWest Energy Partne 1515 Arapahoe Street, Tower 2, Suite 700 Denver, Colorado 80202 Newfield Explore September 26, 2006 *By the end of 2009, w of about 65 MMcfe/d tc Continent. “Our growth with MarkWest allows allows Newfield to foct MARKWEST Energy Partners, Ad RANGE 8ES¢ MARKWEST Range Res En
Slide 47: Customer Relationships & Strategic Partnerships
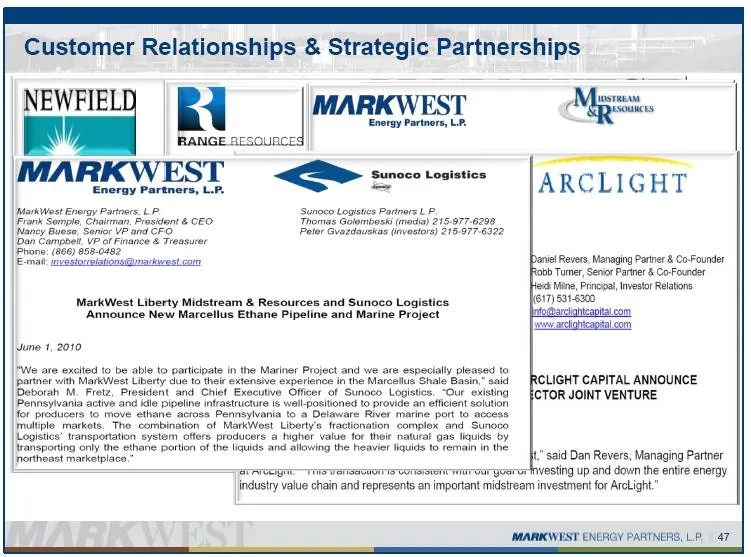
Customer Relationships & Strategic Partnerships NEWFIELD (MARKWEST —_ oer i oes —— arkwest Eneray Partners, LP FFrank Semple. Chairman. Prasident & CEO Sunoco Logistics Portners LP. Thomas Golombesh! (moda) 215-977-6298 Potor Gvazdauskae (mvestors) 215-977-6322 Phone: (866) 858-0482 Pennsyivania act
Slide 48: Customer Relationships & Strategic Partnerships
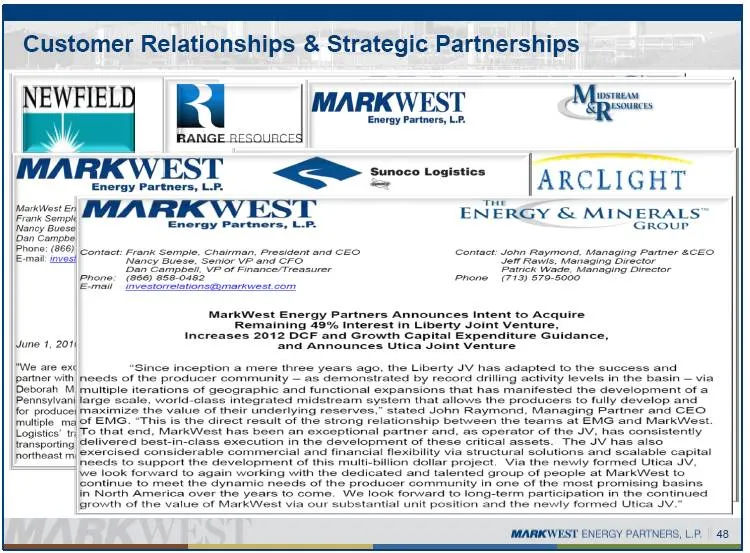
Customer Relationships & Strategic Partnerships NEWFIEL! MARKWEST pa Be — MARKWEST = Sunoco Logistics ARCLIGHT Energy Partners, pemete: IVIAFRICW EST NERGY & Ronee Energy Partners, LP Bee Zanss Prone! (66) contact Frank Semple. Chavman, President and CEO Contact Jon Raymend. Managing Parner ACEO Evo
Slide 49: Innovative Midstream Solutions
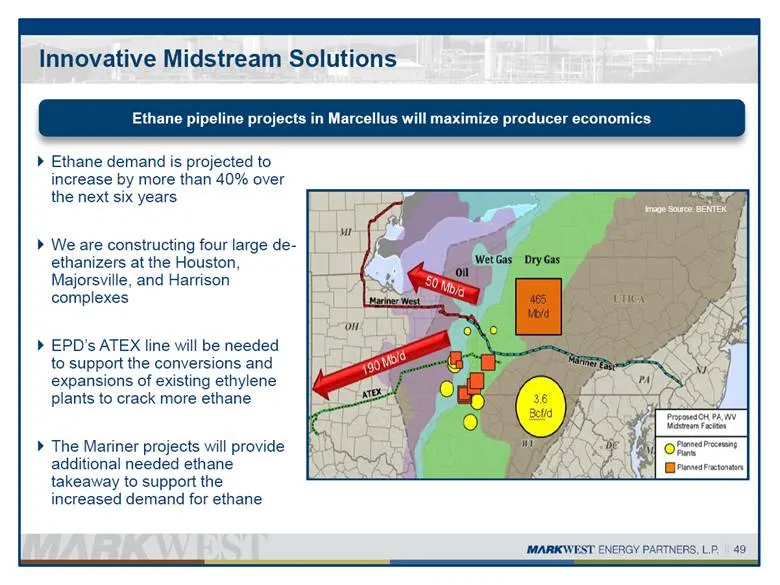
Innovative Midstream Solutions Ethane demand is projected to increase by more than 40% over the next six years We are constructing four large de-ethanizers at the Houston, Majorsville, and Harrison complexes EPD’s ATEX line will be needed to support the conversions and expansions of existing ethylen
Slide 50: NGL Markets
NGL MARKETS (MARKWEST ENERGY PARTNERS, LP.
Slide 51: Resource Play Economics
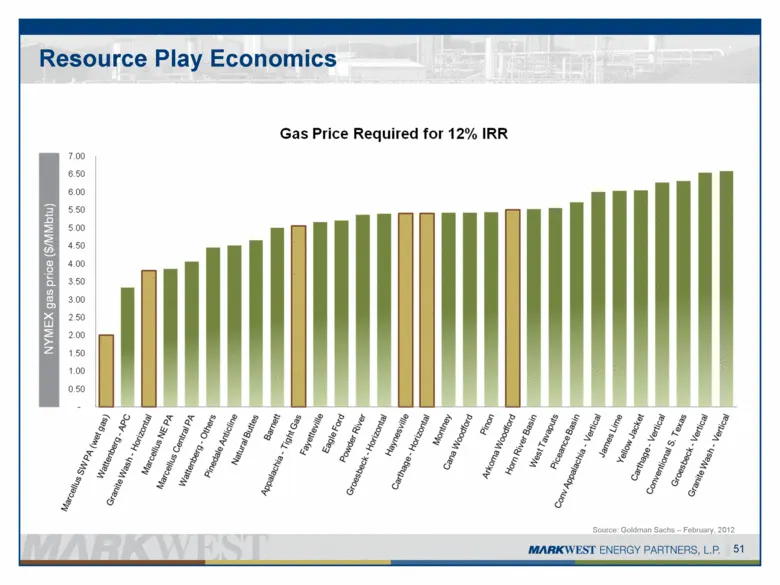
Source: Goldman Sachs – February, 2012 51 Resource Play Economics
Slide 52: NGL Markets – Total Production Forecast
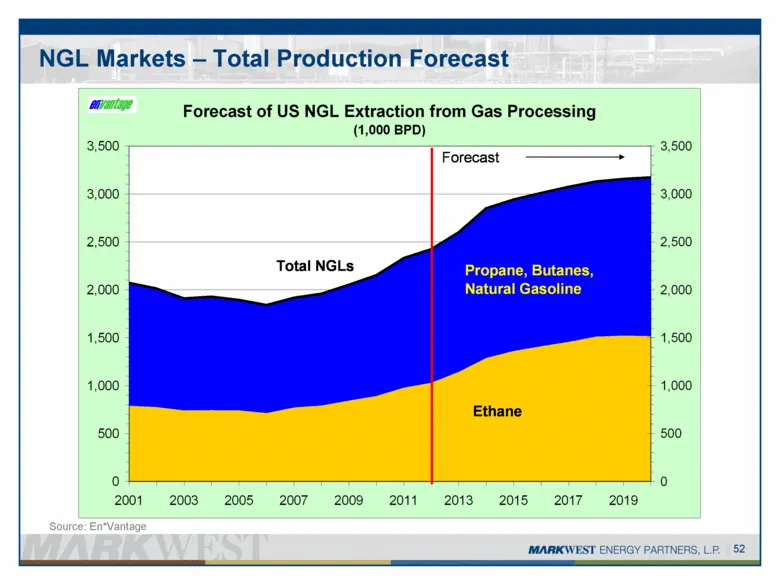
52 NGL Markets – Total Production Forecast Source: En*Vantage Forecast of US NGL Extraction from Gas Processing (1,000 BPD) 0 500 1,000 1,500 2,000 2,500 3,000 3,500 2001 2003 2005 2007 2009 2011 2013 2015 2017 2019 0 500 1,000 1,500 2,000 2,500 3,000 3,500 Forecast Total NGLs Propane, Butanes, Natu
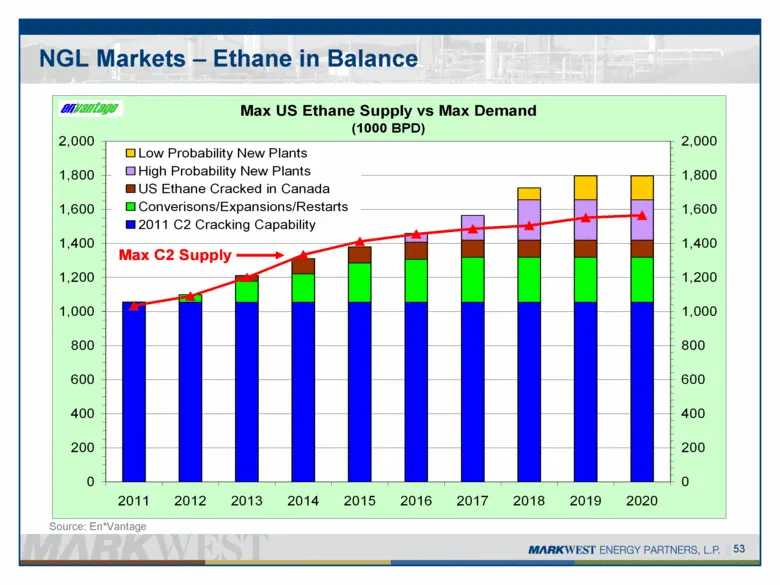
Slide 53: NGL Markets – Ethane in Balance
Base Production (Conventional / Tight Sand) 53 NGL Markets – Ethane in Balance Source: En*Vantage Max US Ethane Supply vs Max Demand (1000 BPD) 0 200 400 600 800 1,000 1,200 1,400 1,600 1,800 2,000 2011 2012 2013 2014 2015 2016 2017 2018 2019 2020 0 200 400 600 800 1,000 1,200 1,400 1,600 1,800 2,00
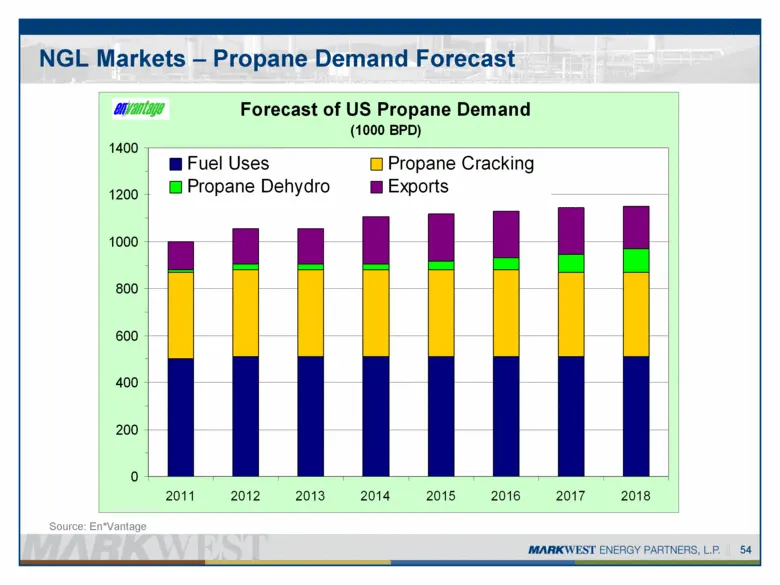
Slide 54: NGL Markets – Propane Demand Forecast
NGL Markets – Propane Demand Forecast 54 Source: En*Vantage Forecast of US Propane Demand (1000 BPD) 0 200 400 600 800 1000 1200 1400 2011 2012 2013 2014 2015 2016 2017 2018 Fuel Uses Propane Cracking Propane Dehydro Exports
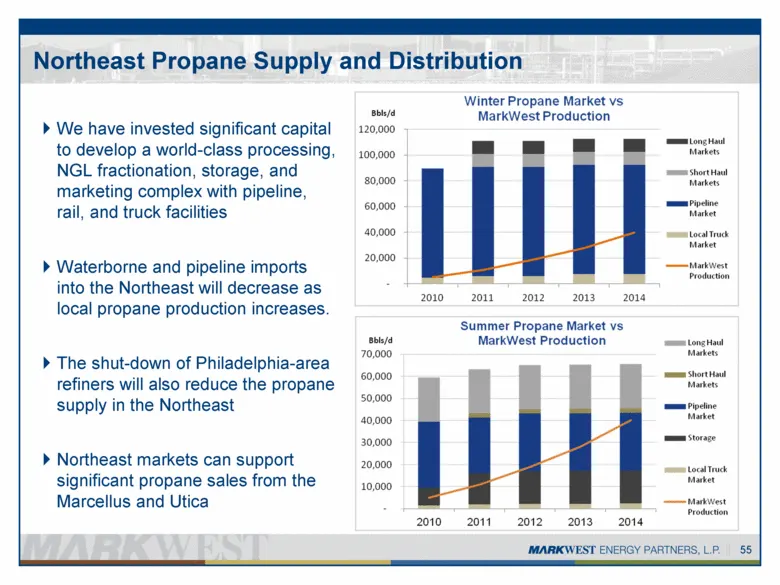
Slide 55: Northeast Propane Supply and Distribution
Northeast Propane Supply and Distribution We have invested significant capital to develop a world-class processing, NGL fractionation, storage, and marketing complex with pipeline, rail, and truck facilities Waterborne and pipeline imports into the Northeast will decrease as local propane production
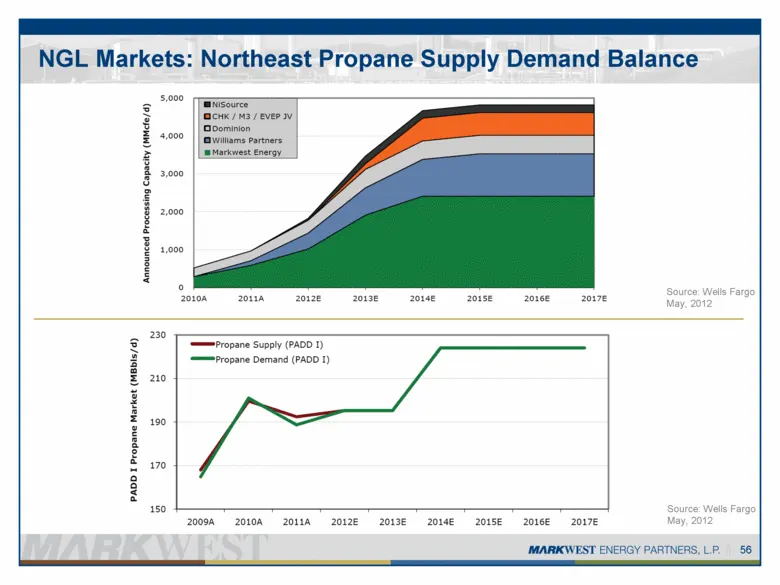
Slide 56: NGL Markets: Northeast Propane Supply Demand Balance
NGL Markets: Northeast Propane Supply Demand Balance 56 Source: Wells Fargo May, 2012 Source: Wells Fargo May, 2012
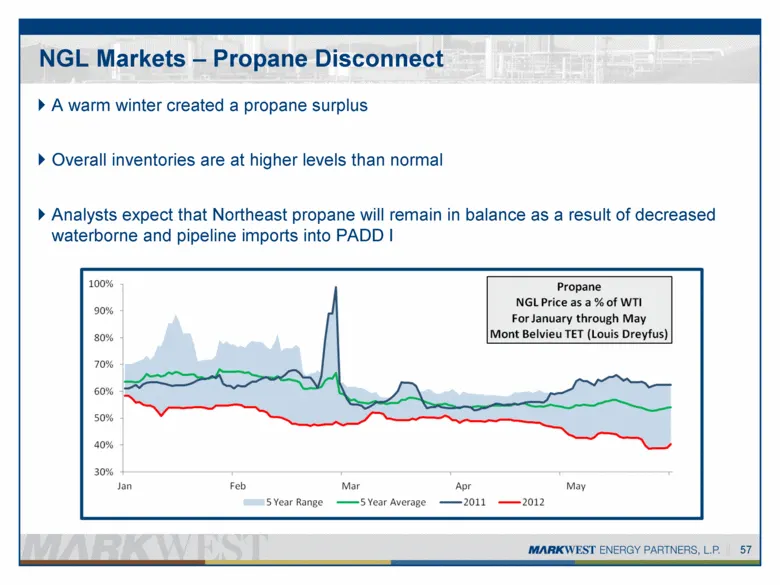
Slide 57: NGL Markets – Propane Disconnect
NGL Markets – Propane Disconnect A warm winter created a propane surplus Overall inventories are at higher levels than normal Analysts expect that Northeast propane will remain in balance as a result of decreased waterborne and pipeline imports into PADD I 57
Slide 58: NGL Marketing – Options are the Competitive Advantage
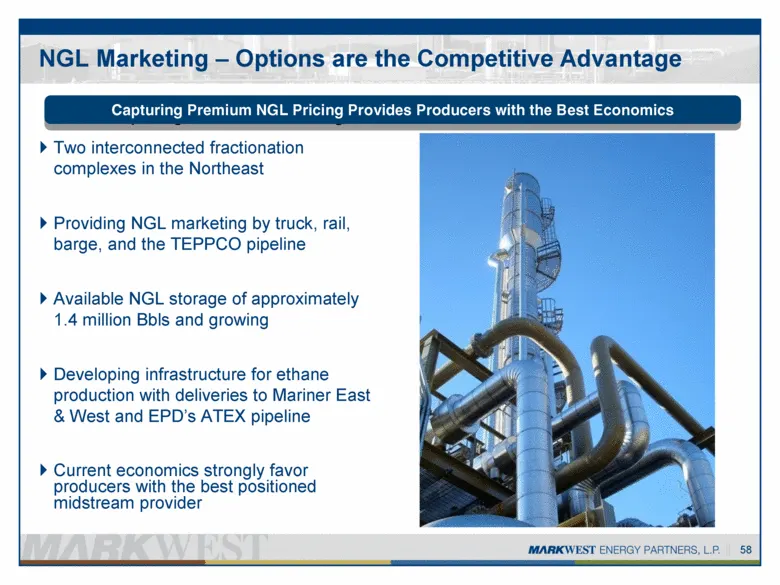
NGL Marketing – Options are the Competitive Advantage Two interconnected fractionation complexes in the Northeast Providing NGL marketing by truck, rail, barge, and the TEPPCO pipeline Available NGL storage of approximately 1.4 million Bbls and growing Developing infrastructure for ethane production
Slide 59: Significant Growth By Design
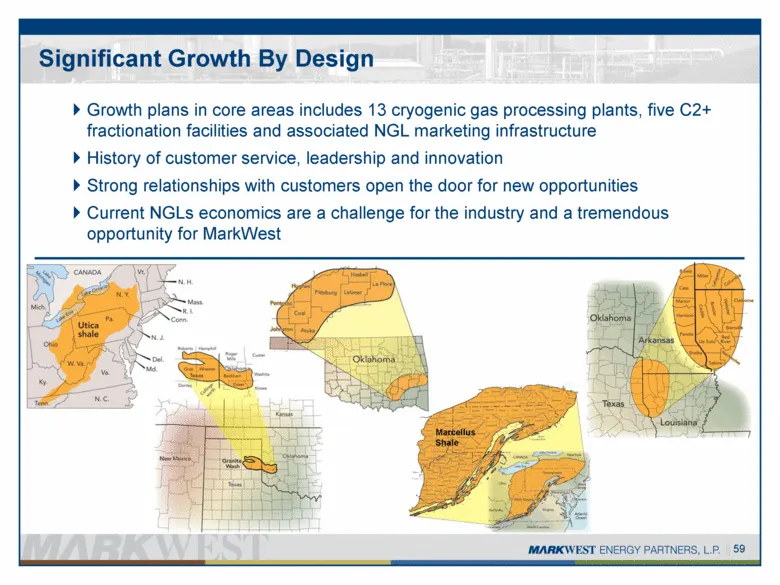
Significant Growth By Design Growth plans in core areas includes 13 cryogenic gas processing plants, five C2+ fractionation facilities and associated NGL marketing infrastructure History of customer service, leadership and innovation Strong relationships with customers open the door for new opportun
Slide 60: Financial Summary
FINANCIAL SUMMARY Nancy Buese
Slide 61: Financial Strategy
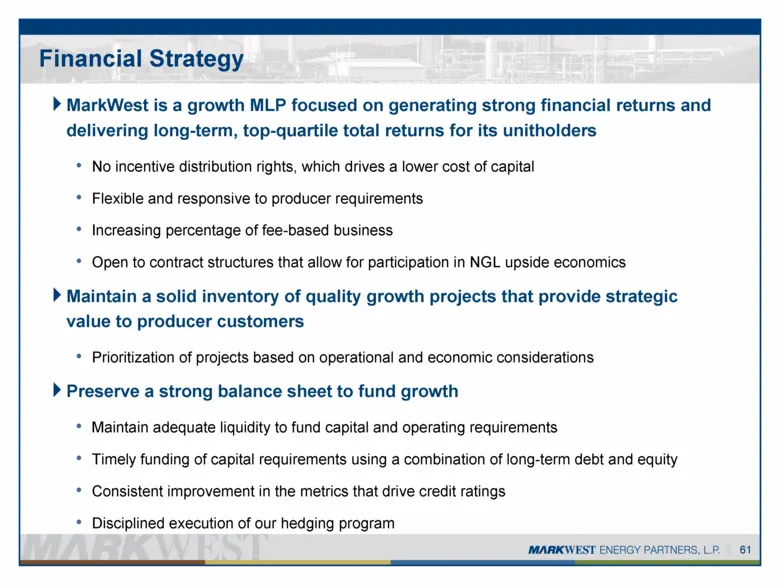
MarkWest is a growth MLP focused on generating strong financial returns and delivering long-term, top-quartile total returns for its unitholders No incentive distribution rights, which drives a lower cost of capital Flexible and responsive to producer requirements Increasing percentage of fee-based
Slide 62: 2012 DCF and Capital Guidance
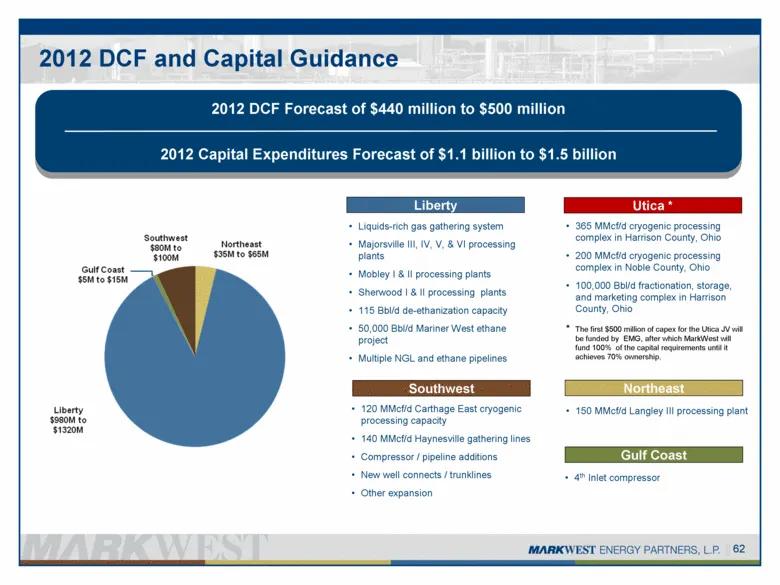
2012 DCF and Capital Guidance Liberty Northeast Southwest Utica * * The first $500 million of capex for the Utica JV will be funded by EMG, after which MarkWest will fund 100% of the capital requirements until it achieves 70% ownership. Gulf Coast 4th Inlet compressor Liquids-rich gas gathering syst
Slide 63: Capital Markets and Liquidity Update
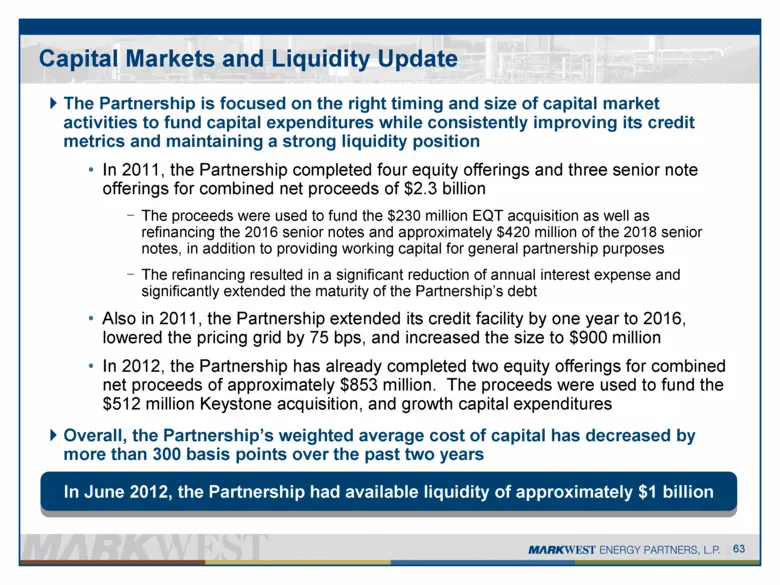
Capital Markets and Liquidity Update The Partnership is focused on the right timing and size of capital market activities to fund capital expenditures while consistently improving its credit metrics and maintaining a strong liquidity position In 2011, the Partnership completed four equity offerings
Slide 64: Capital Structure
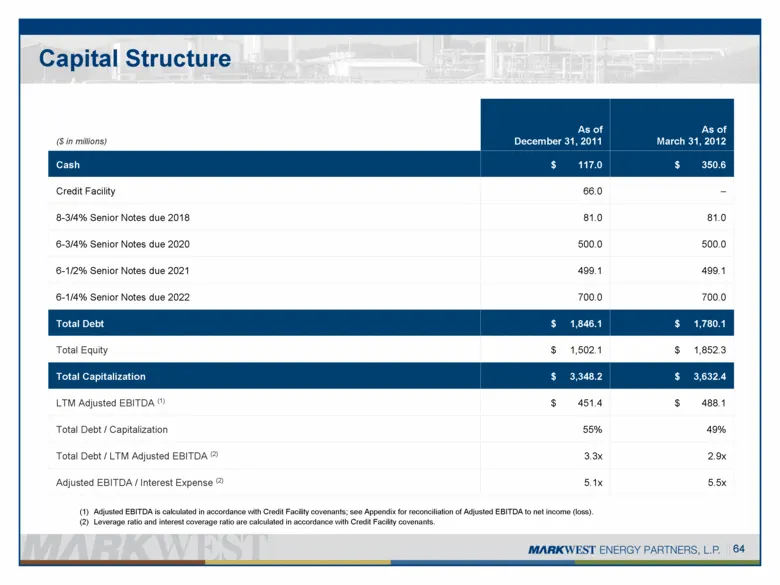
($ in millions) As of December 31, 2011 As of March 31, 2012 Cash $ 117.0 $ 350.6 Credit Facility 66.0 – 8-3/4% Senior Notes due 2018 81.0 81.0 6-3/4% Senior Notes due 2020 500.0 500.0 6-1/2% Senior Notes due 2021 499.1 499.1 6-1/4% Senior Notes due 2022 700.0 700.0 Total Debt $ 1,846.1 $ 1,780.1 To
Slide 65: Cost of Equity Capital
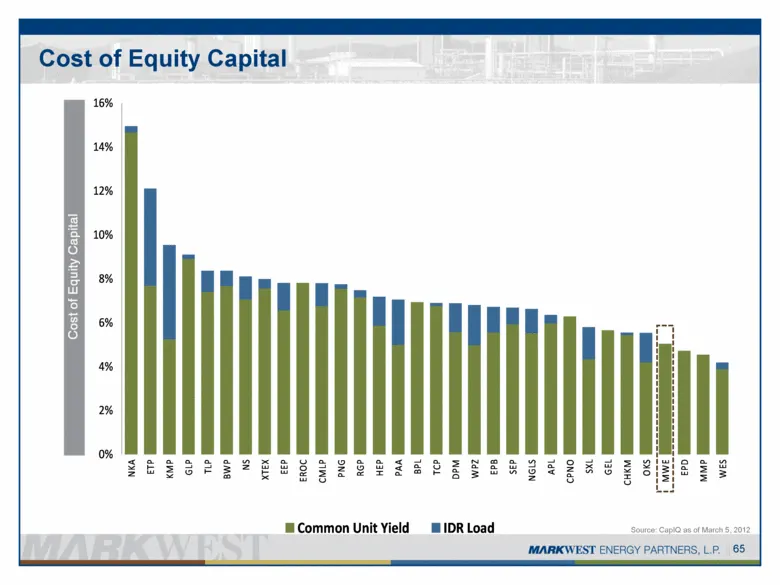
Source: CapIQ as of March 5, 2012 65 Cost of Equity Capital 0% 2% 4% 6% 8% 10% 12% 14% 16% NKA ETP KMP GLP TLP BWP NS XTEX EEP EROC CMLP PNG RGP HEP PAA BPL TCP DPM WPZ EPB SEP NGLS APL CPNO SXL GEL CHKM OKS MWE EPD MMP WES Cost of Equity Capital Common Unit Yield IDR Load
Slide 66: Total Return Since 2009
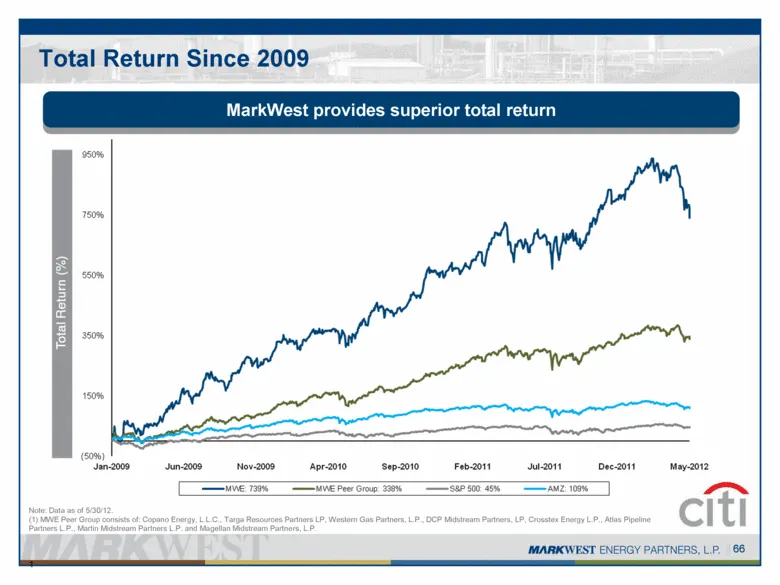
Total Return Since 2009 Note: Data as of 5/30/12. (1) MWE Peer Group consists of: Copano Energy, L.L.C., Targa Resources Partners LP, Western Gas Partners, L.P., DCP Midstream Partners, LP, Crosstex Energy L.P., Atlas Pipeline Partners L.P., Martin Midstream Partners L.P. and Magellan Midstream Part
Slide 67: Current Yield on Senior Notes
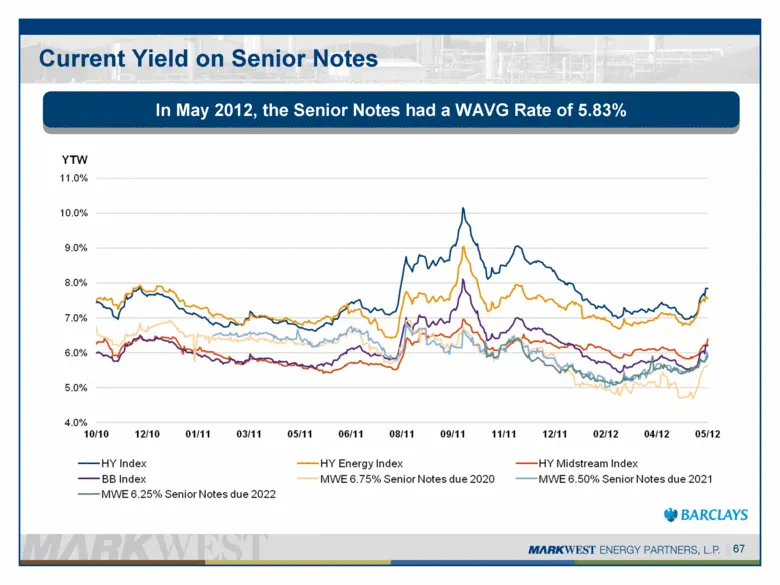
Current Yield on Senior Notes 67 In May 2012, the Senior Notes had a WAVG Rate of 5.83%
Slide 68: Rating Agency Update
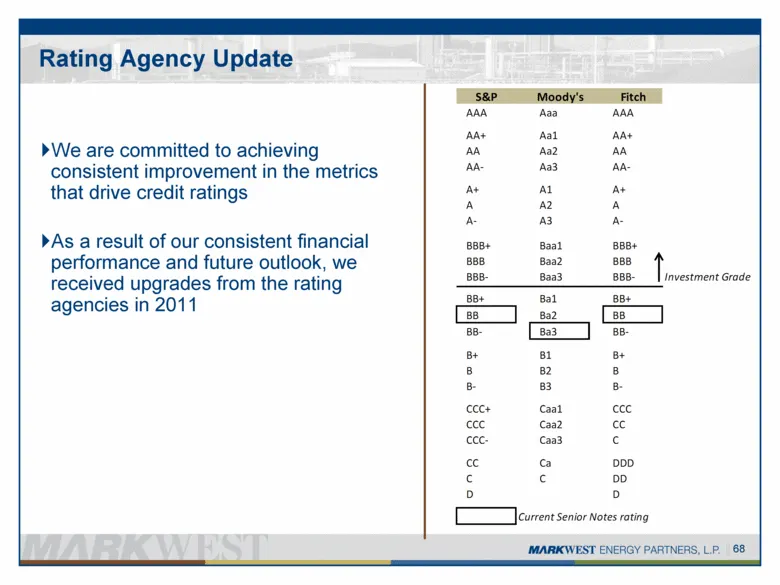
Rating Agency Update We are committed to achieving consistent improvement in the metrics that drive credit ratings As a result of our consistent financial performance and future outlook, we received upgrades from the rating agencies in 2011 68 S&P Moody's Fitch AAA Aaa AAA AA+ Aa1 AA+ AA Aa2 AA AA-
Slide 69: Risk Management Program
We remain committed to the disciplined execution of our rolling 36-month hedging program to manage the risk associated with commodity price exposure and protect future cash flows We execute direct product and crude proxy hedges using a combination of collars, swaps, and puts We conservatively set ou
Slide 70: Risk Management Program: Net Operating Margin and Hedges
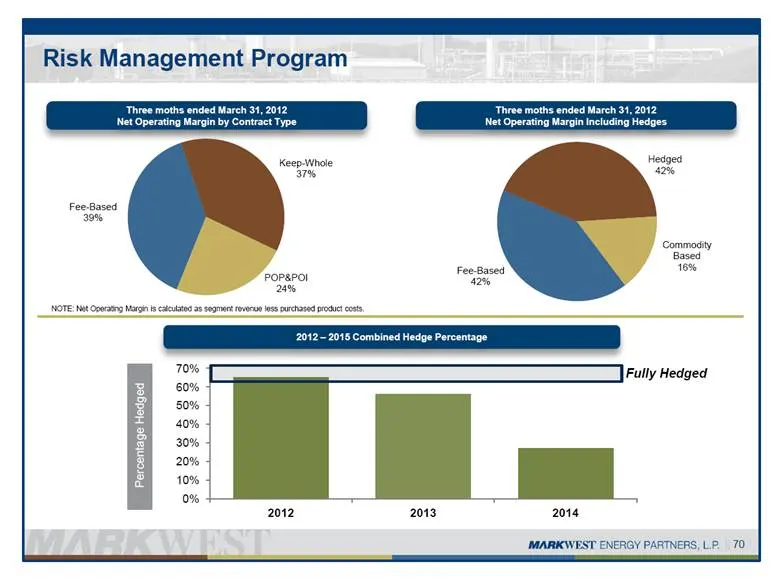
Three moths ended March 31, 2012 Net Operating Margin by Contract Type 2012 – 2015 Combined Hedge Percentage Risk Management Program NOTE: Net Operating Margin is calculated as segment revenue less purchased product costs. Fully Hedged 70 Three moths ended March 31, 2012 Net Operating Margin Includi
Slide 71: Estimated Range of 2012 DCF
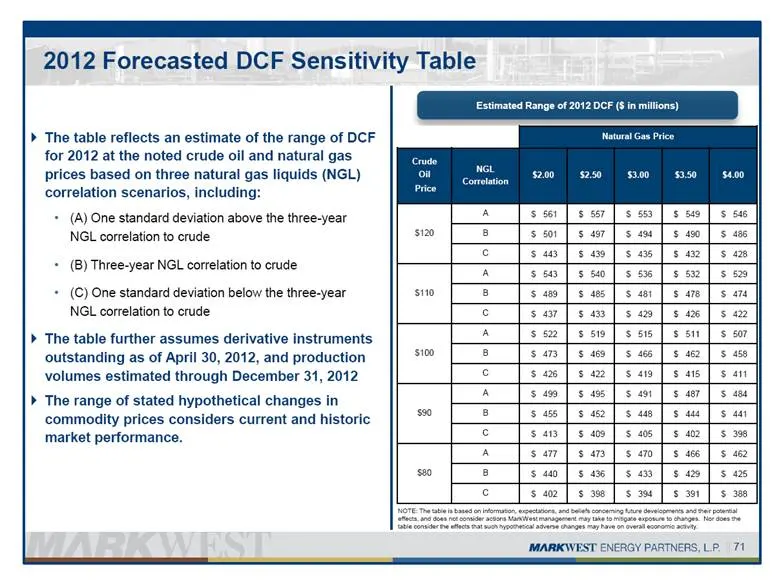
Estimated Range of 2012 DCF ($ in millions) 2012 Forecasted DCF Sensitivity Table Natural Gas Price Crude Oil Price NGL Correlation $2.00 $2.50 $3.00 $3.50 $4.00 $120 A $ 561 $ 557 $ 553 $ 549 $ 546 B $ 501 $ 497 $ 494 $ 490 $ 486 C $ 443 $ 439 $ 435 $ 432 $ 428 $110 A $ 543 $ 540 $ 536 $ 532 $ 529
Slide 72: Significant Developments Since June 2011
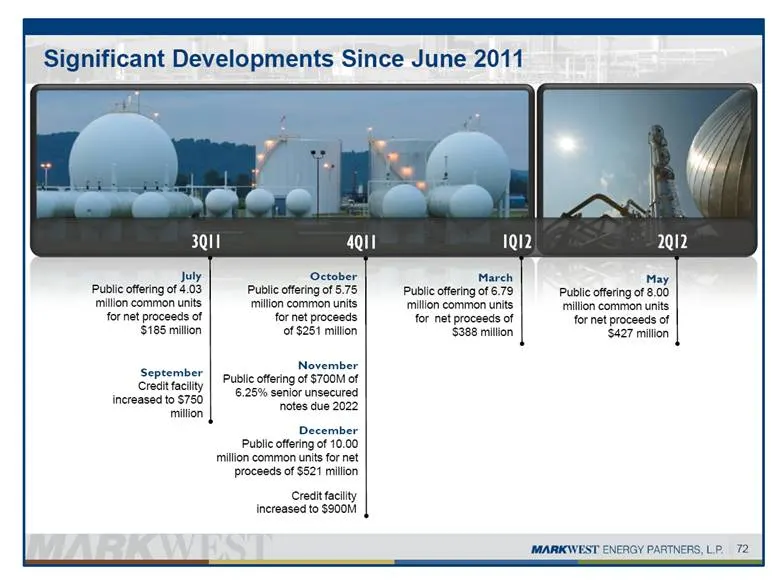
Significant Developments Since June 2011 3Q11 4Q11 1Q12 2Q12 September Credit facility increased to $750 million October Public offering of 5.75 million common units for net proceeds of $251 million November Public offering of $700M of 6.25% senior unsecured notes due 2022 December Public offering o
Slide 73: Closing Comments
CLOSING COMMENTS Frank Semple
Slide 74: Keys to Success
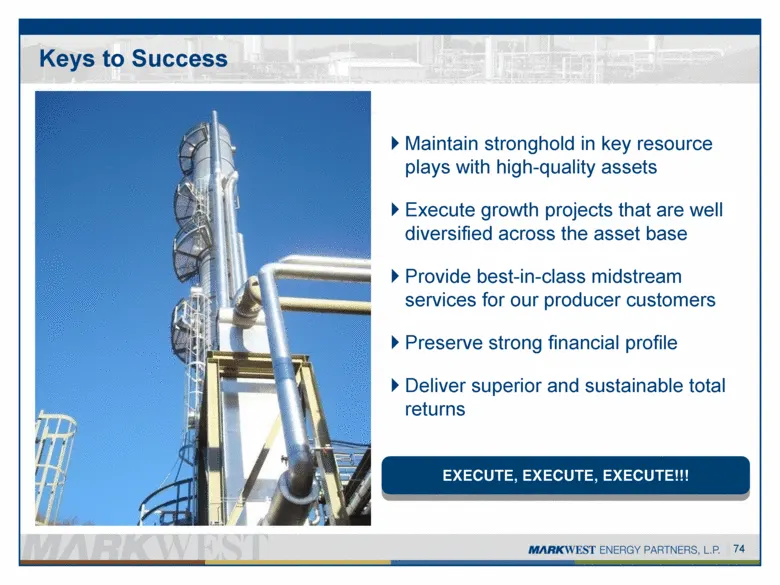
Keys to Success Maintain stronghold in key resource plays with high-quality assets Execute growth projects that are well diversified across the asset base Provide best-in-class midstream services for our producer customers Preserve strong financial profile Deliver superior and sustainable total retu
Slide 75: Questions & Answers
QUESTIONS & ANSWERS (MARKWEST ENERGY PARTNERS, LP.
Slide 76: Appendix
APPENDIX MARKWEST ENERGY PARTNERS, LP.
Slide 77: Reconciliation of DCF and Distribution Coverage
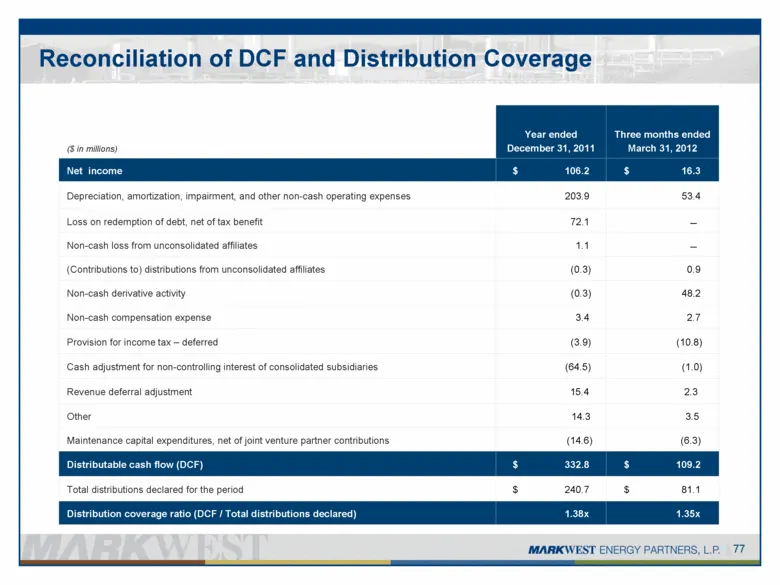
Reconciliation of DCF and Distribution Coverage ($ in millions) Year ended December 31, 2011 Three months ended March 31, 2012 Net income $ 106.2 $ 16.3 Depreciation, amortization, impairment, and other non-cash operating expenses 203.9 53.4 Loss on redemption of debt, net of tax benefit 72.1 – Non-
Slide 78: Reconciliation of Adjusted EBITDA
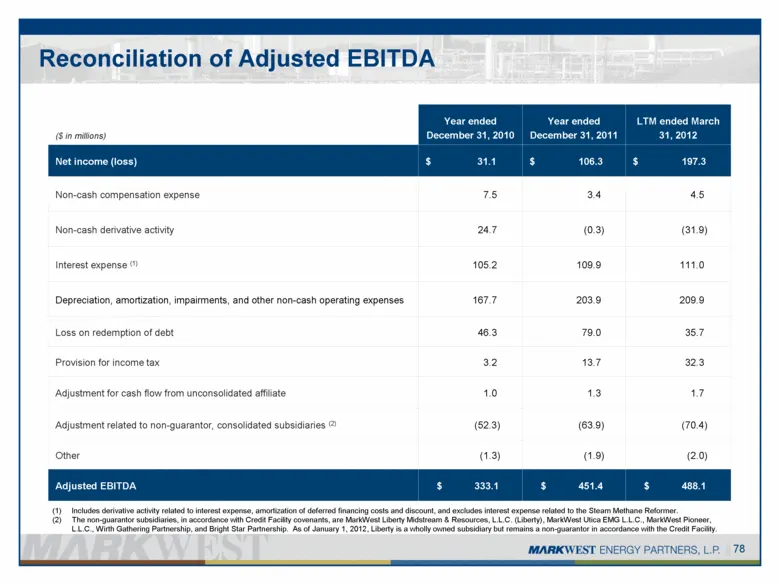
Reconciliation of Adjusted EBITDA ($ in millions) Year ended December 31, 2010 Year ended December 31, 2011 LTM ended March 31, 2012 Net income (loss) $ 31.1 $ 106.3 $ 197.3 Non-cash compensation expense 7.5 3.4 4.5 Non-cash derivative activity 24.7 (0.3) (31.9) Interest expense (1) 105.2 109.9 111.
Slide 79: Reconciliation of Net Operating Margin
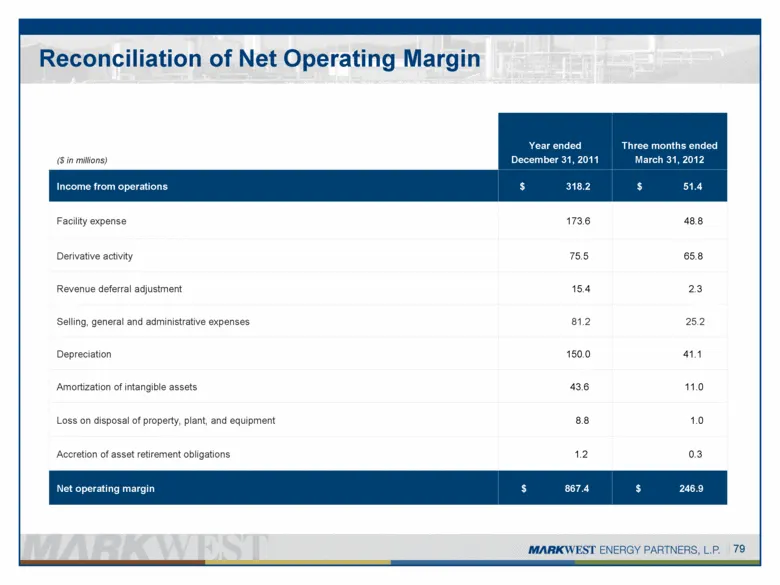
($ in millions) Year ended December 31, 2011 Three months ended March 31, 2012 Income from operations $ 318.2 $ 51.4 Facility expense 173.6 48.8 Derivative activity 75.5 65.8 Revenue deferral adjustment 15.4 2.3 Selling, general and administrative expenses 81.2 25.2 Depreciation 150.0 41.1 Amortizat
Slide 80: 1515 ARAPAHOE STREET TOWER 1, SUITE 1600 DENVER, COLORADO 202 PHONE: 303-925-9200 INVESTOR RELATIONS:
1515 ARAPAHOE STREET TOWER 1, SUITE 1600 DENVER, COLORADO 80202 PHONE: 303-925-9200 INVESTOR RELATIONS: 866-858-0482 EMAIL: INVESTORRELATIONS@MARKWEST.COM WEBSITE: WWW.MARKWEST.COM
Source: SEC EDGAR · 8-K filed Jun 1, 2012
More decks from Markwest Energy Partners LP
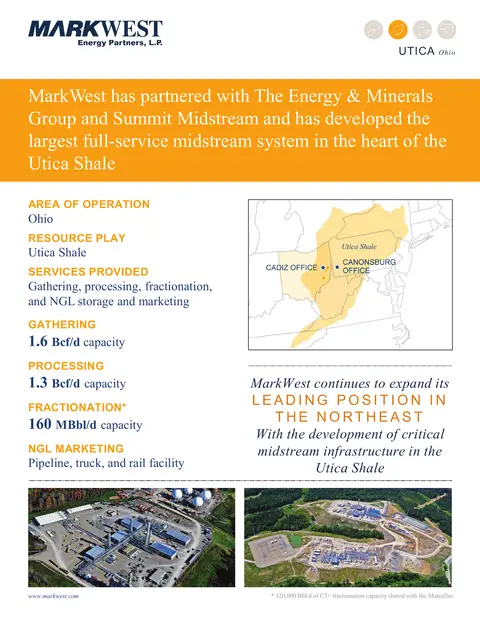 Fact Sheet (July 2017)1 slide · July 2017
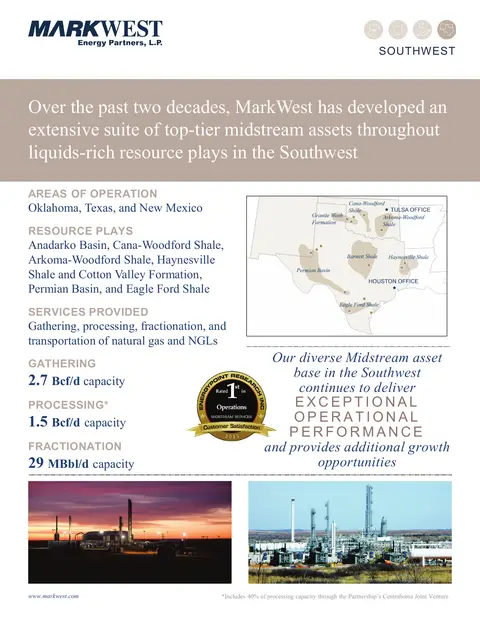 Fact Sheet (July 2017)1 slide · July 2017
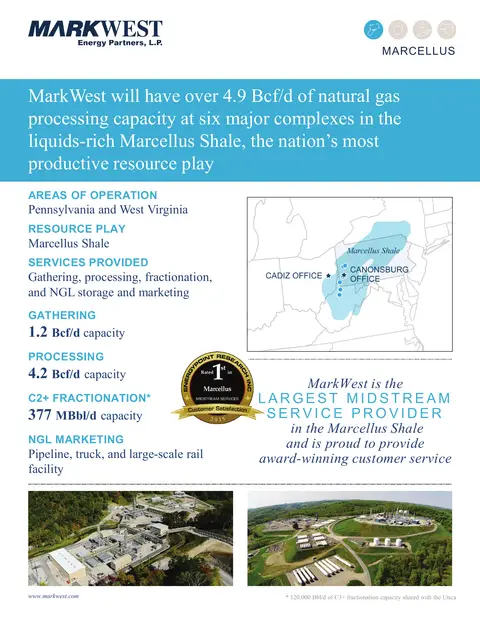 Fact Sheet (July 2017)1 slide · July 2017
 Markwest Energy Partners L P — Investor Day (December 2015)116 slides · Dec 3, 2015
 Merger or Acquisition (November 2015)17 slides · Nov 13, 2015
 Merger or Acquisition (November 2015)17 slides · Nov 12, 2015