Continental AG · XETR:CON
Continental — Q1 2017 Earnings Presentation
52 slides from Continental's earnings presentation, May 9, 2017
Slide 1: Q1 2017 Results
Q1 2017 Results Hanover – May 9, 2017 Ticker: CON ADR-Ticker: CTTAY Twitter: @Continental_IR http://www.continental-ir.com Wolfgang Schaefer – CFO
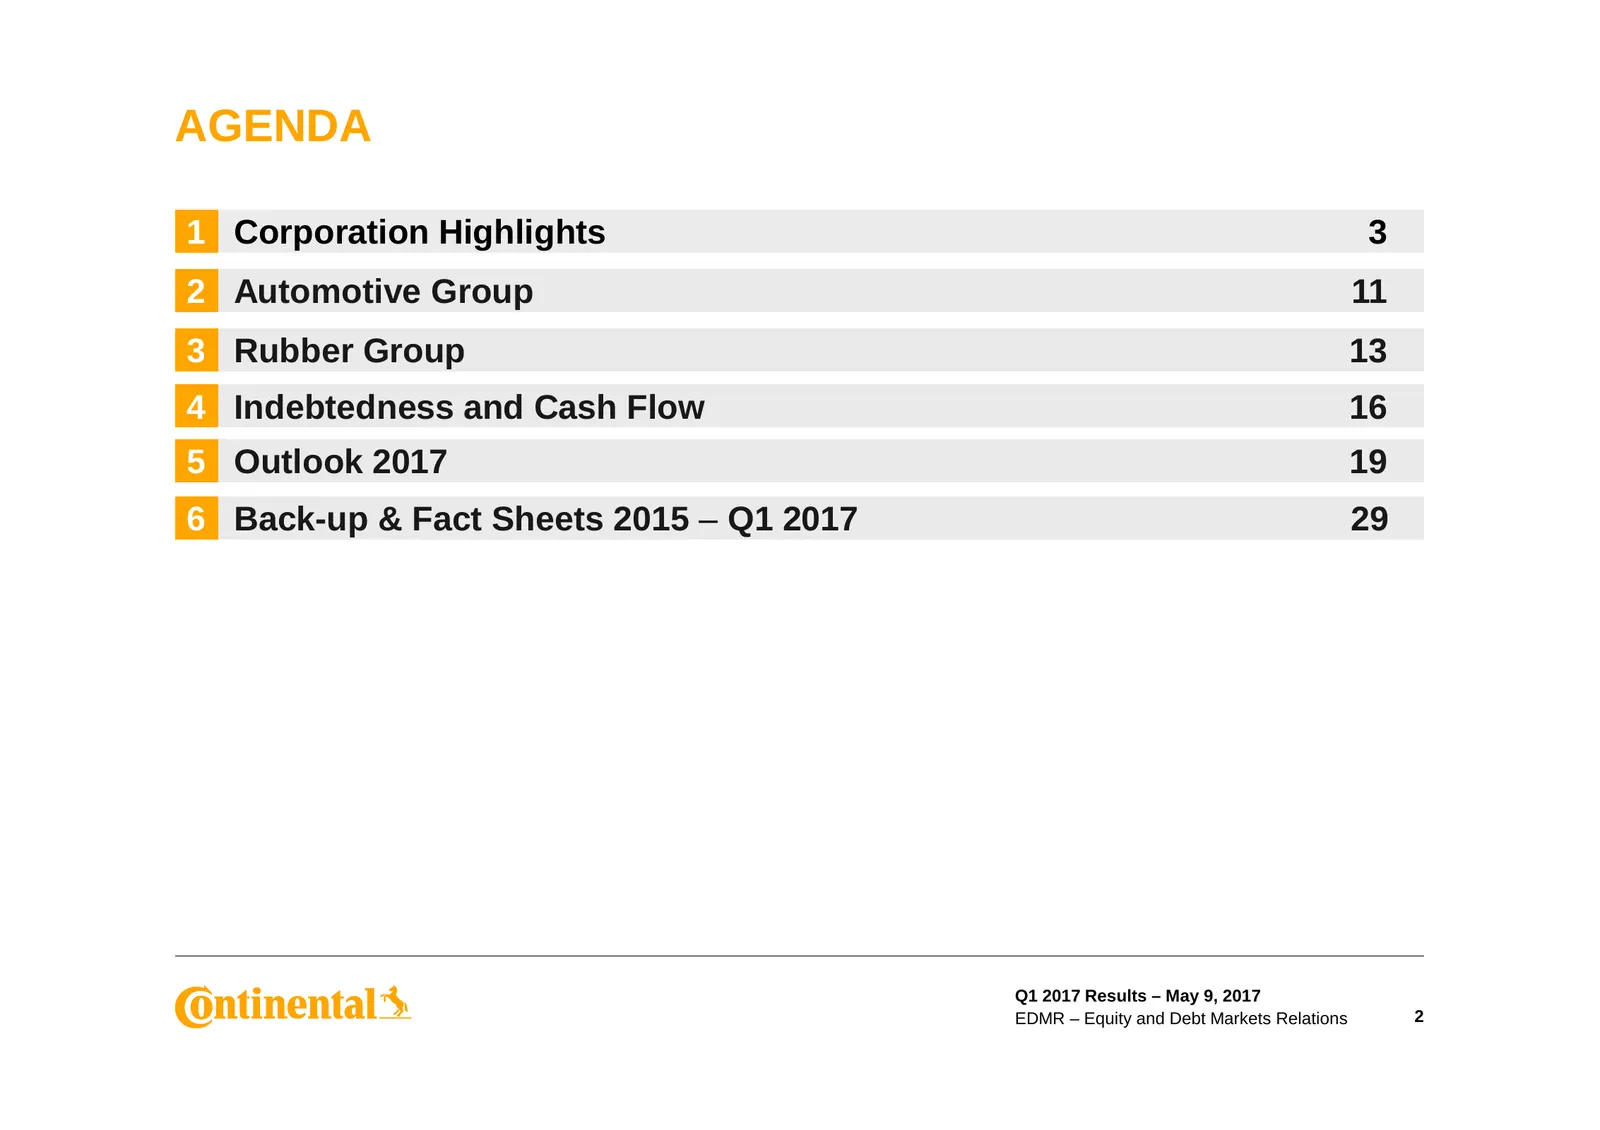
Slide 2: Agenda
AGENDA 1 Corporation Highlights 3 2 Automotive Group 11 3 Rubber Group 13 4 Indebtedness and Cash Flow 16 5 Outlook 2017 19 6 Back-up & Fact Sheets 2015 – Q1 2017 29 Q1 2017 Results – May 9, 2017 EDMR – Equity and Debt Markets Relations 2
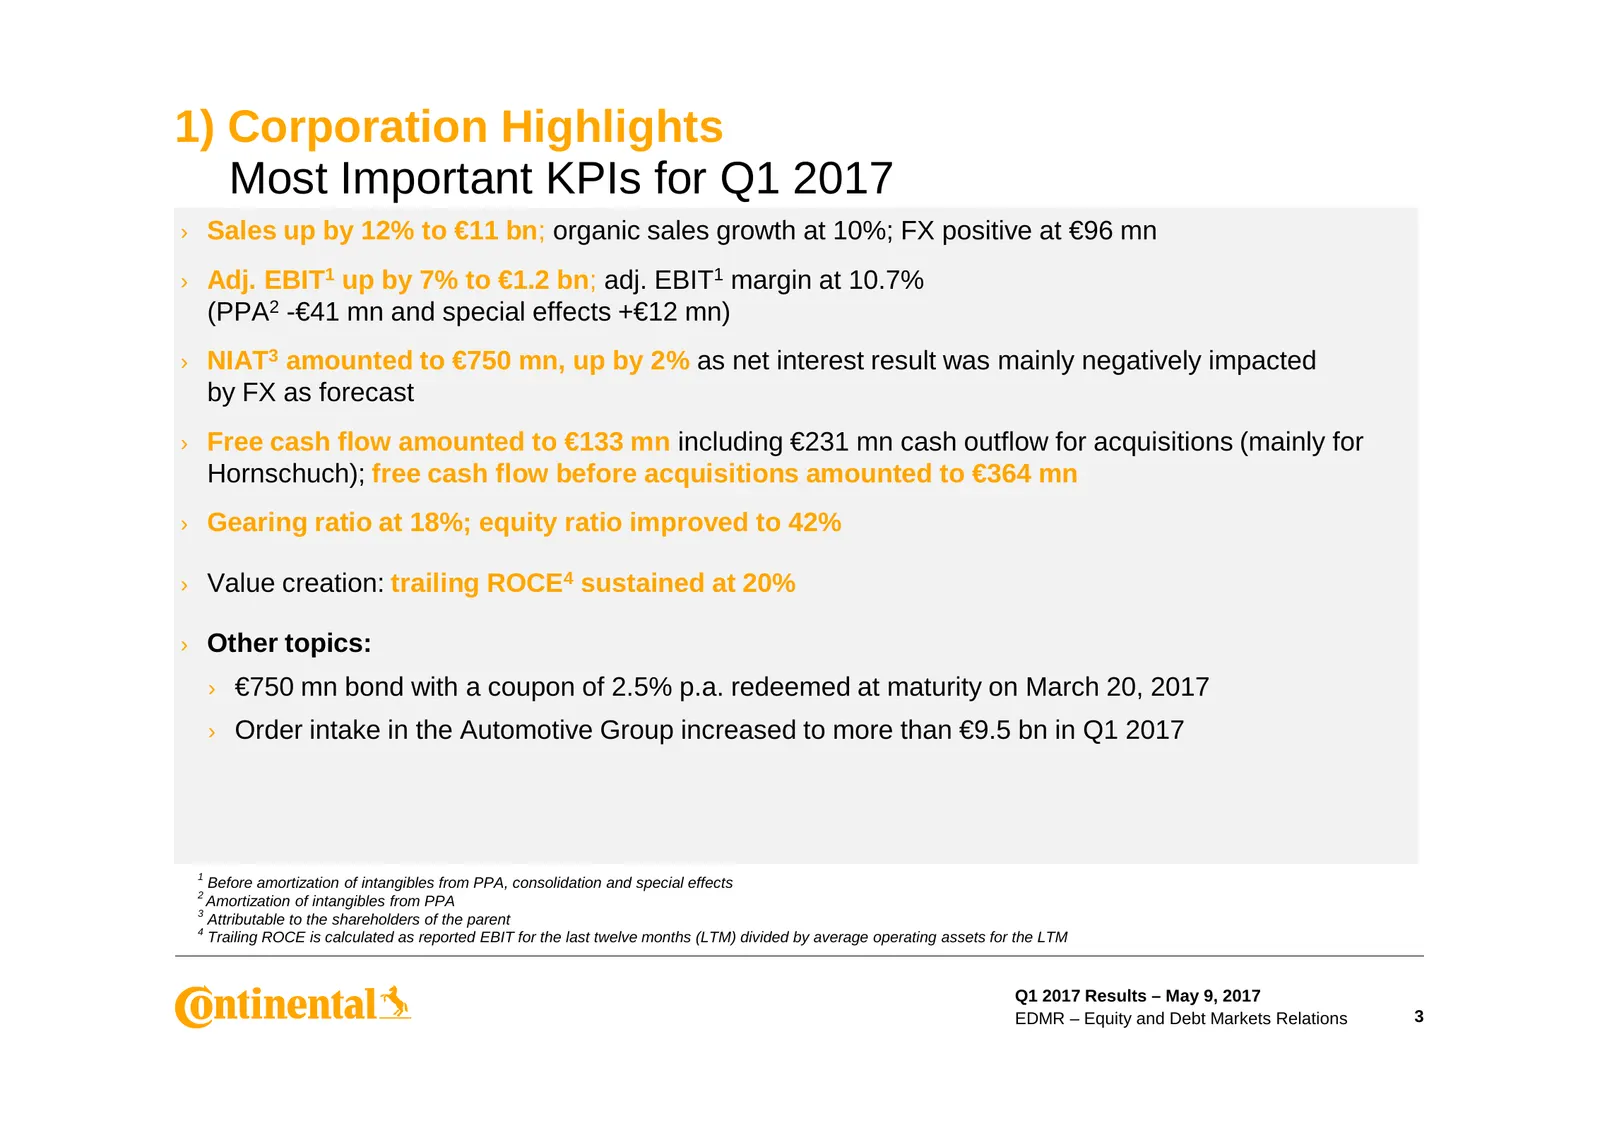
Slide 3: Most Important KPIs for Q1 2017
1) Corporation Highlights Most Important KPIs for Q1 2017 › Sales up by 12% to €11 bn; organic sales growth at 10%; FX positive at €96 mn › Adj. EBIT1 up by 7% to €1.2 bn; adj. EBIT1 margin at 10.7% (PPA2 -€41 mn and special effects +€12 mn) › NIAT3 amounted to €750 mn, up by 2% as net interest resu
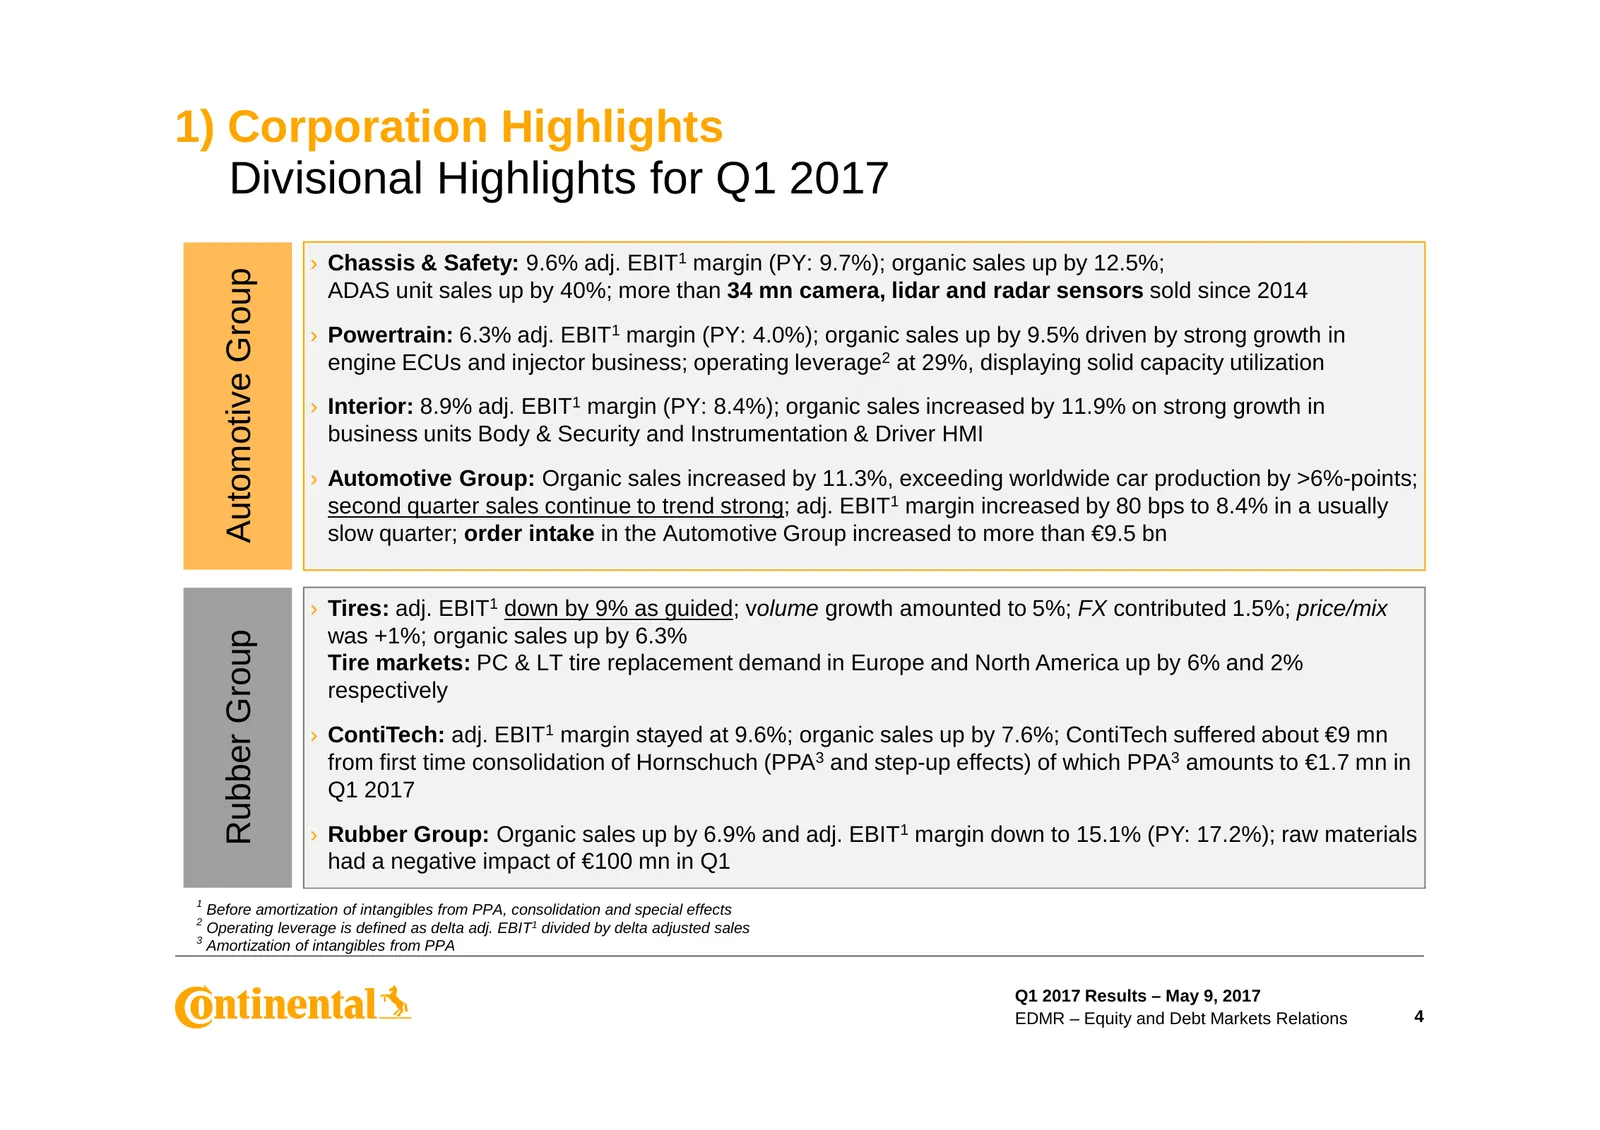
Slide 4: Divisional Highlights for Q1 2017
1) Corporation Highlights Divisional Highlights for Q1 2017 › Chassis & Safety: 9.6% adj. EBIT1 margin (PY: 9.7%); organic sales up by 12.5%; Automotive Group ADAS unit sales up by 40%; more than 34 mn camera, lidar and radar sensors sold since 2014 › Powertrain: 6.3% adj. EBIT1 margin (PY: 4.0%); o
Slide 5: Selected Press Clippings Released Until Recently
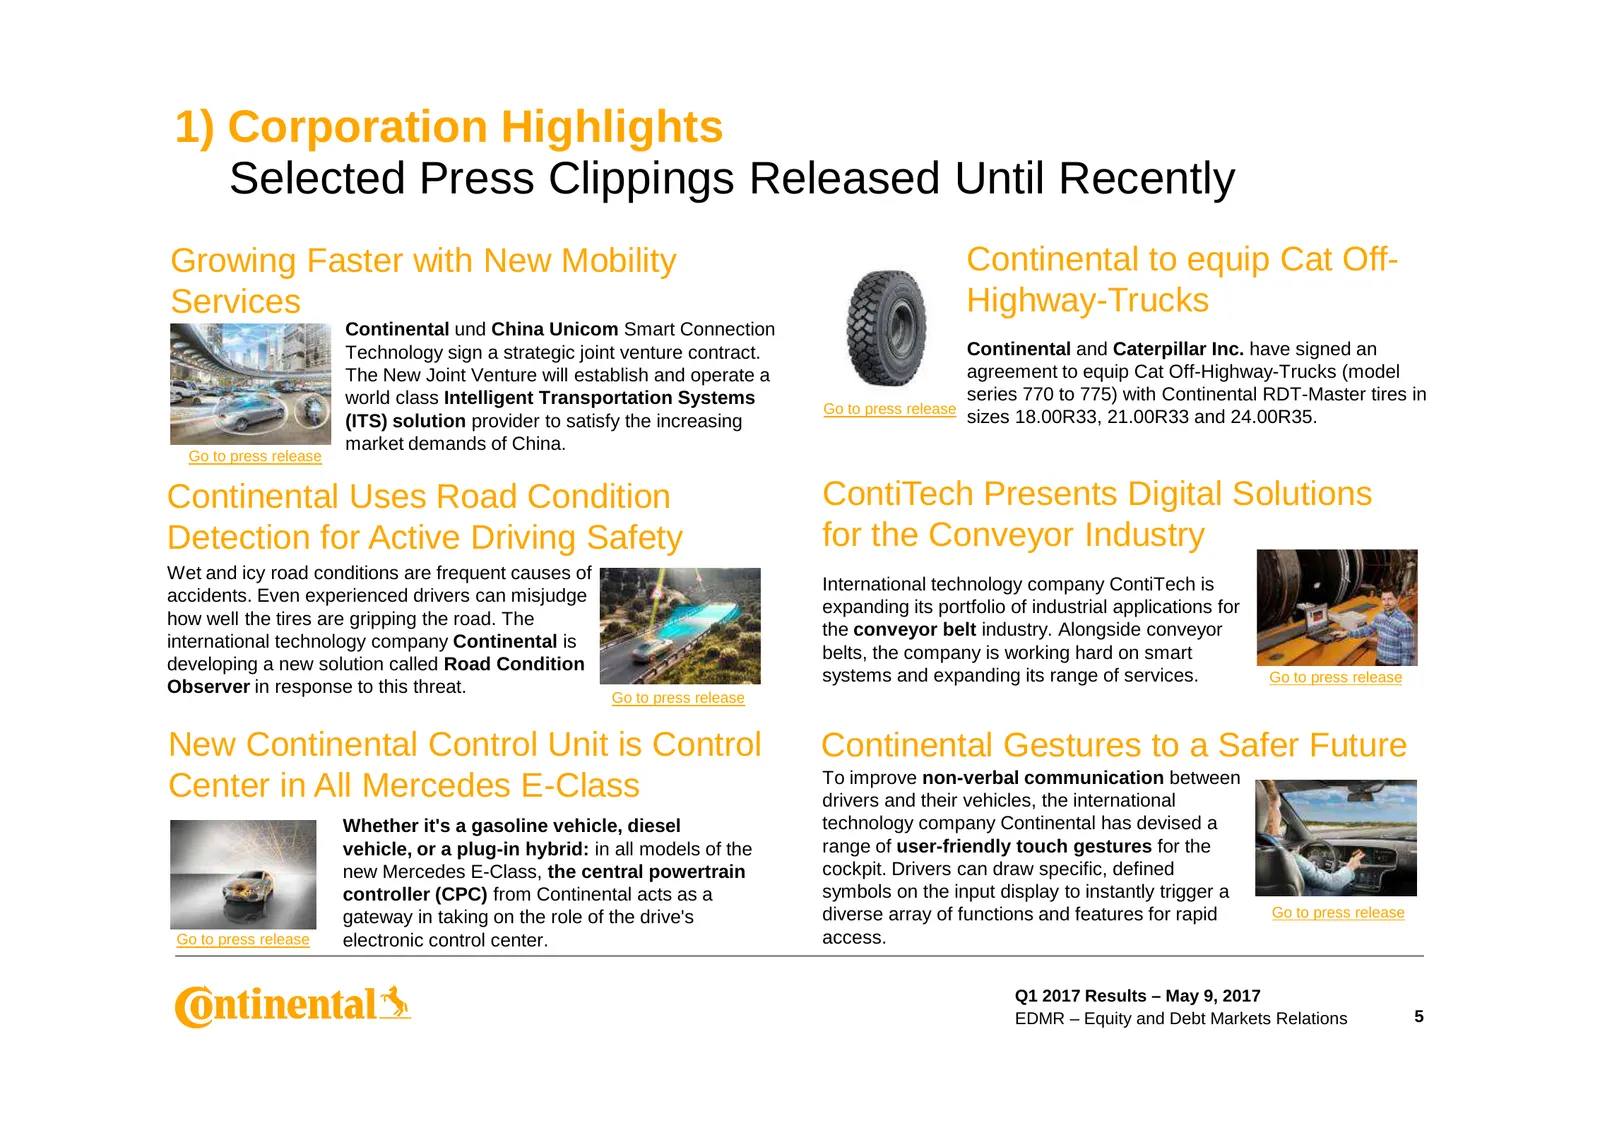
1) Corporation Highlights Selected Press Clippings Released Until Recently Growing Faster with New Mobility Continental to equip Cat Off- Services Highway-Trucks Continental und China Unicom Smart Connection Technology sign a strategic joint venture contract. Continental and Caterpillar Inc. have si
Slide 6: Sales and Adjusted EBIT by Quarter
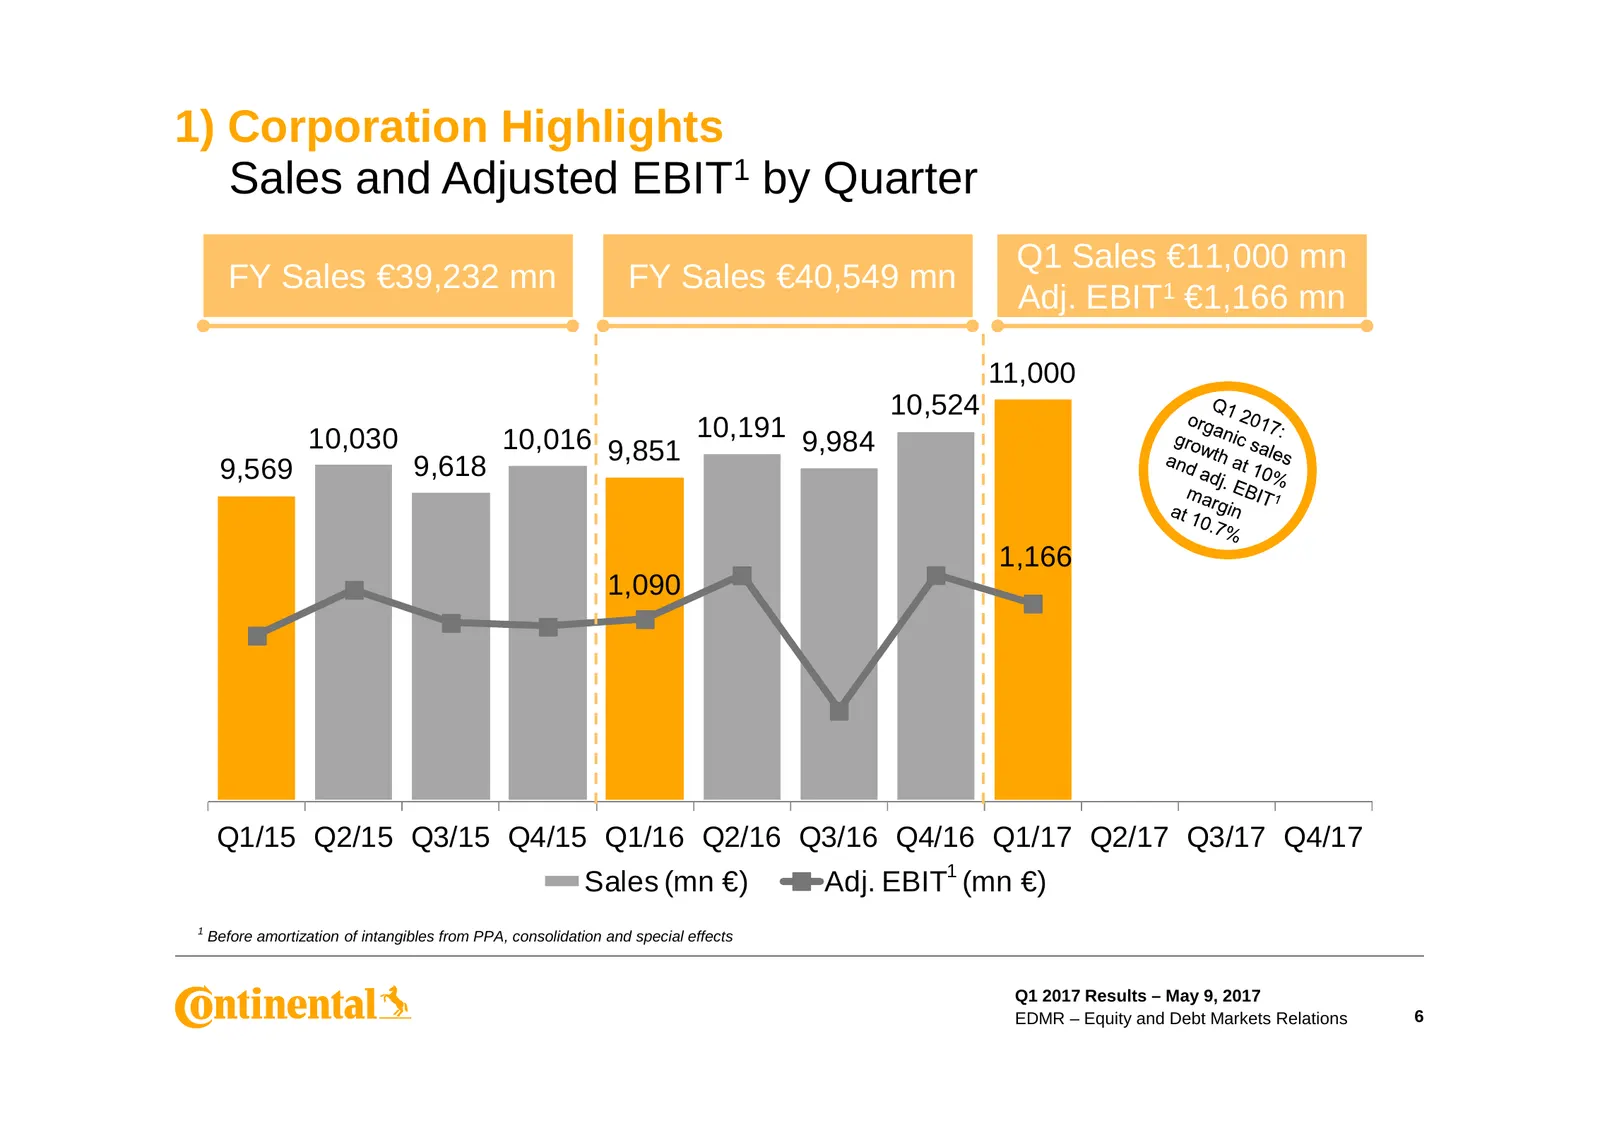
1) Corporation Highlights Sales and Adjusted EBIT1 by Quarter Q1 Sales €11,000 mn FY Sales €39,232 mn FY Sales €40,549 mn Adj. EBIT1 €1,166 mn 11,000 10,524 10,030 10,016 9,851 10,191 9,984 9,569 9,618 1,166 1,090 Q1/15 Q2/15 Q3/15 Q4/15 Q1/16 Q2/16 Q3/16 Q4/16 Q1/17 Q2/17 Q3/17 Q4/17 Sales (mn €) A
Slide 7: Automotive Group and Rubber Group by Quarter
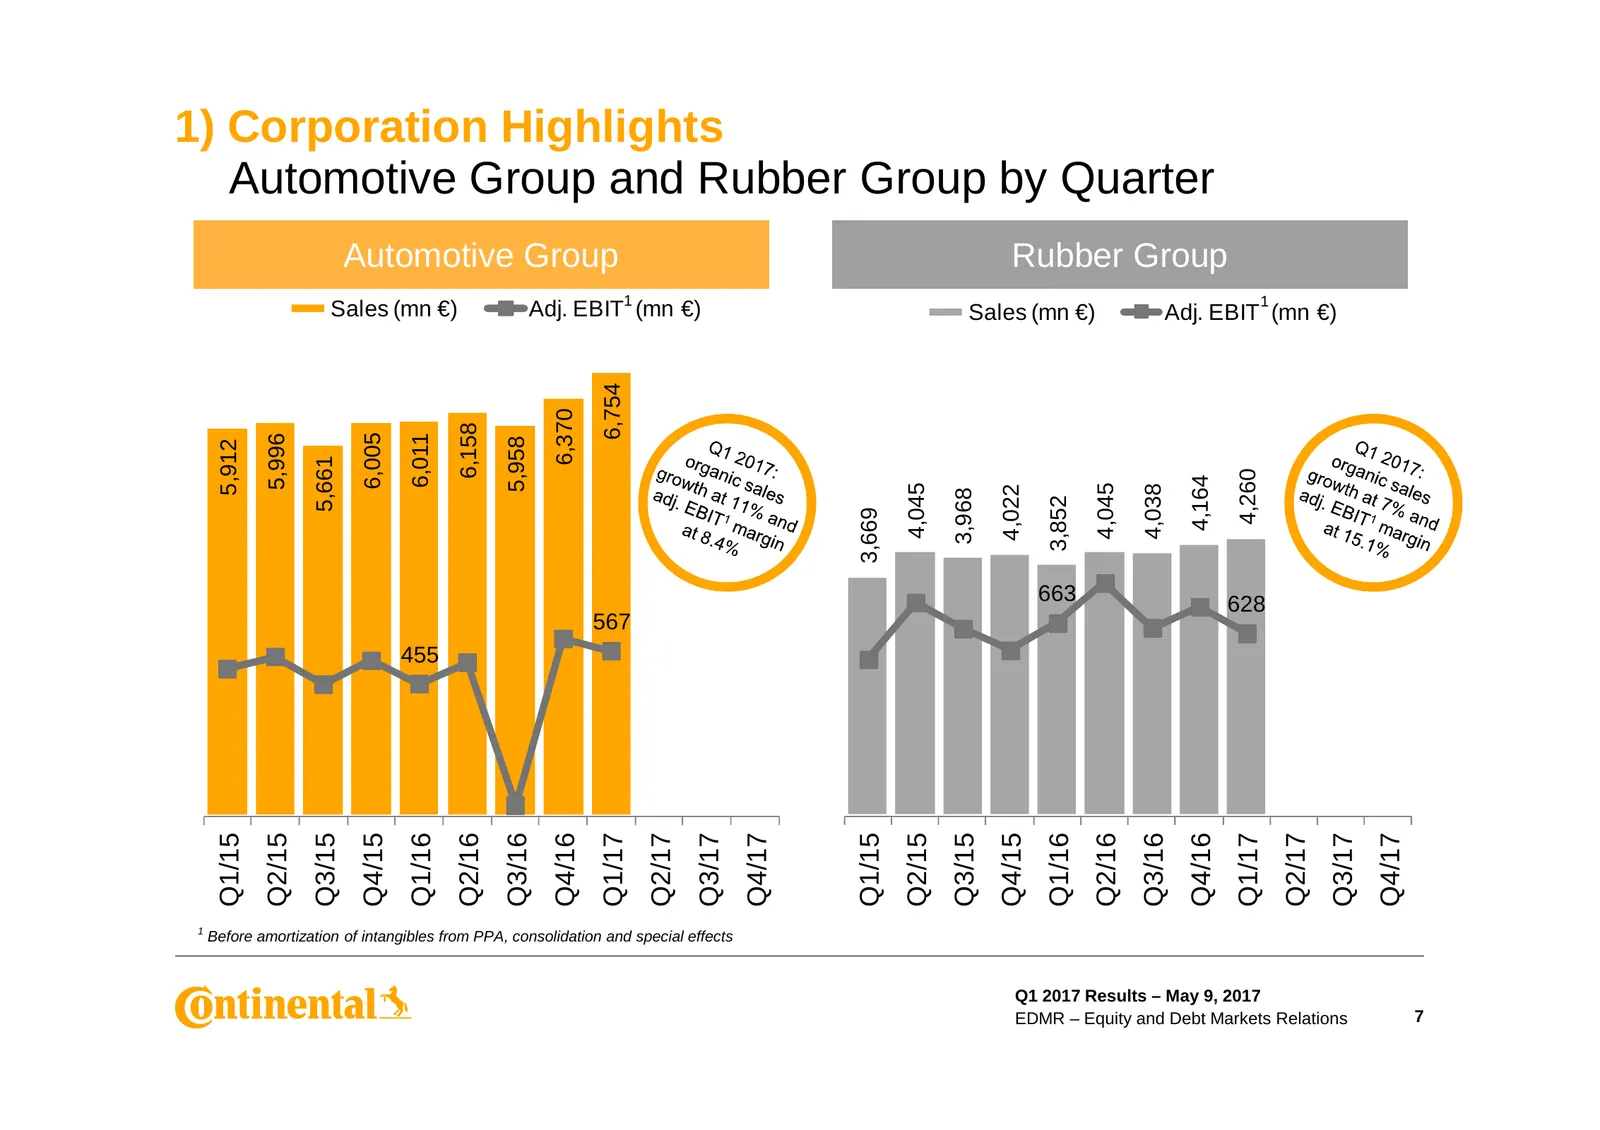
1) Corporation Highlights Automotive Group and Rubber Group by Quarter Automotive Group Rubber Group Sales (mn €) Adj. EBIT1 (mn €) Sales (mn €) Adj. EBIT (mn €) 1 6,754 6,370 6,158 6,005 6,011 5,996 5,958 5,912 5,661 4,260 4,164 4,045 4,045 4,038 4,022 3,968 3,852 3,669 663 628 567 455 Q1/15 Q2/15
Slide 8: Growth Profile of the Corporation Q1 2017
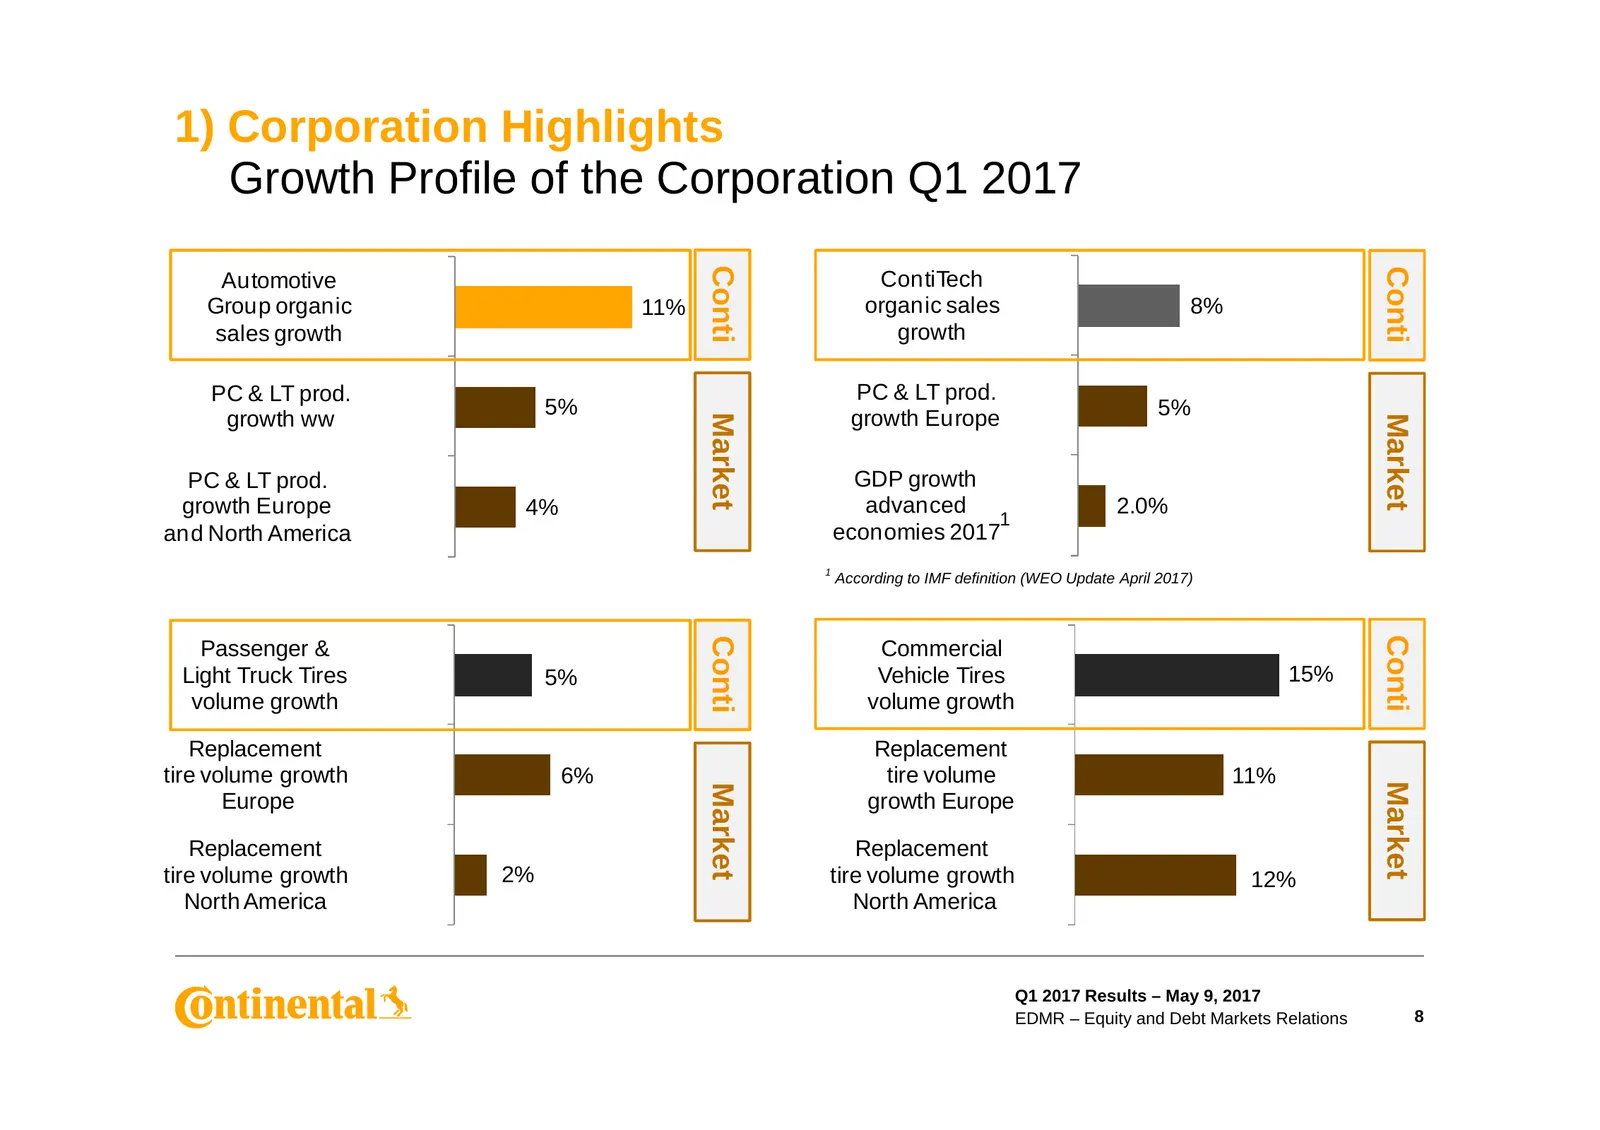
1) Corporation Highlights Growth Profile of the Corporation Q1 2017 Conti Conti Automotive ContiTech Group organic 11% organic sales 8% sales growth growth PC & LT prod. PC & LT prod. 5% growth Europe 5% growth ww Market Market PC & LT prod. GDP growth growth Europe 4% advanced 2.0% 1 and North Amer
Slide 9: Sustainable Value Creation
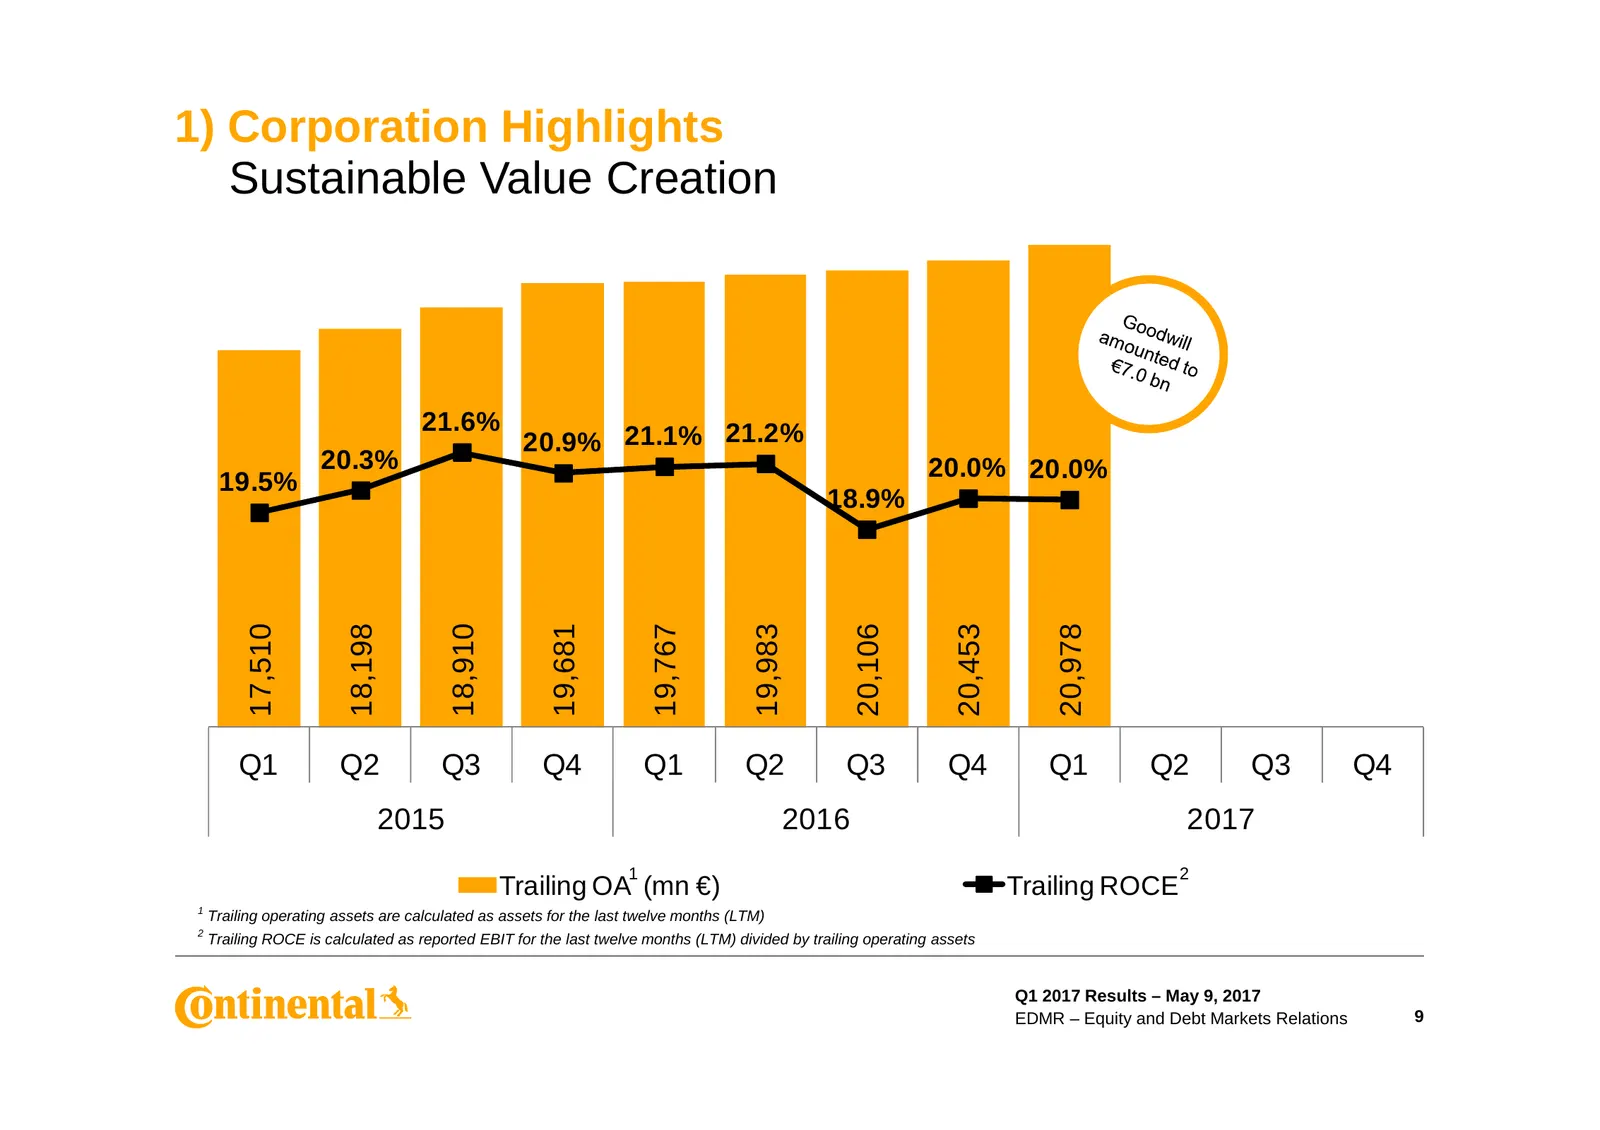
1) Corporation Highlights Sustainable Value Creation 21.6% 20.9% 21.1% 21.2% 20.3% 20.0% 20.0% 19.5% 18.9% 17,510 18,198 18,910 19,681 19,767 19,983 20,106 20,453 20,978 Q1 Q2 Q3 Q4 Q1 Q2 Q3 Q4 Q1 Q2 Q3 Q4 2015 2016 2017 1 2 Trailing OA (mn €) Trailing ROCE 1 Trailing operating assets are calculated
Slide 10: Maturities for Bonds
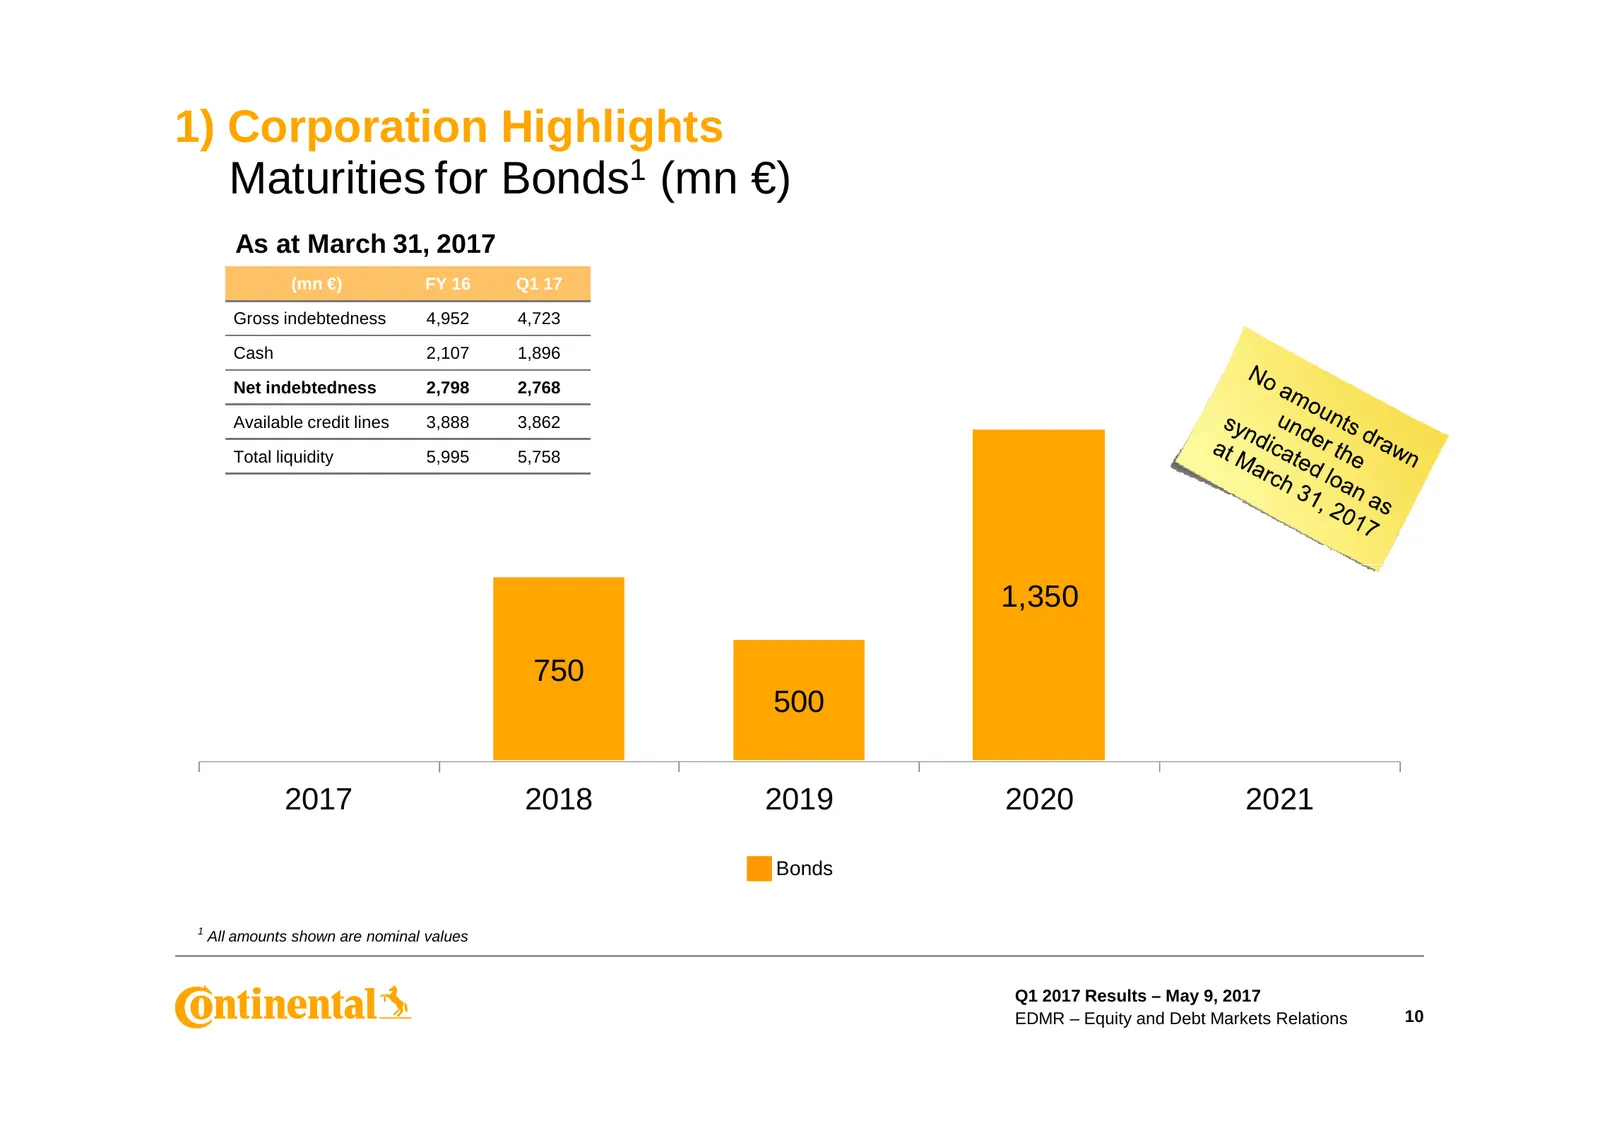
1) Corporation Highlights Maturities for Bonds1 (mn €) As at March 31, 2017 (mn €) FY 16 Q1 17 Gross indebtedness 4,952 4,723 Cash 2,107 1,896 Net indebtedness 2,798 2,768 Available credit lines 3,888 3,862 Total liquidity 5,995 5,758 1,350 750 500 2017 2018 2019 2020 2021 Bonds 1 All amounts shown
Slide 11: Sales and Adj. EBIT by Division
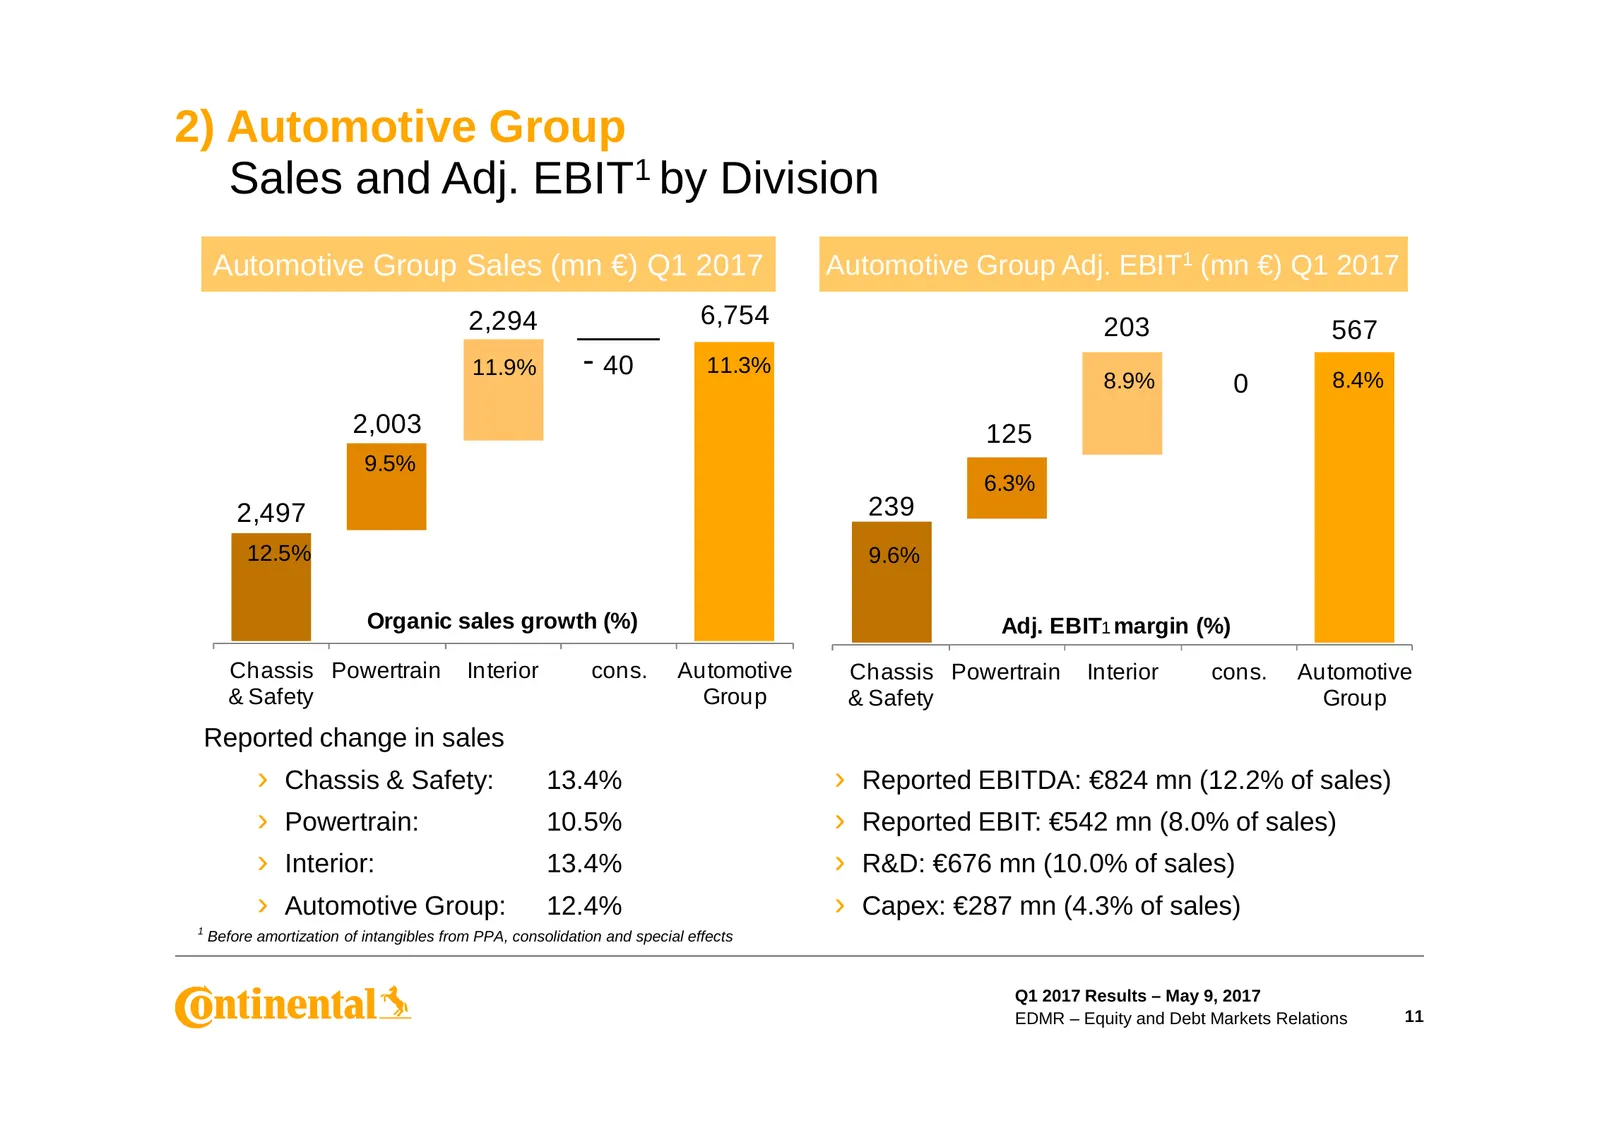
2) Automotive Group Sales and Adj. EBIT1 by Division Automotive Group Sales (mn €) Q1 2017 Automotive Group Adj. EBIT1 (mn €) Q1 2017 2,294 6,754 203 567 11.9% - 40 11.3% 8.9% 8.4% 0 2,003 125 9.5% 6.3% 2,497 239 12.5% 9.6% Organic sales growth (%) Adj. EBIT1 margin (%) Chassis Powertrain Interior c
Slide 12: Q1 2017: Strong Start to the Year
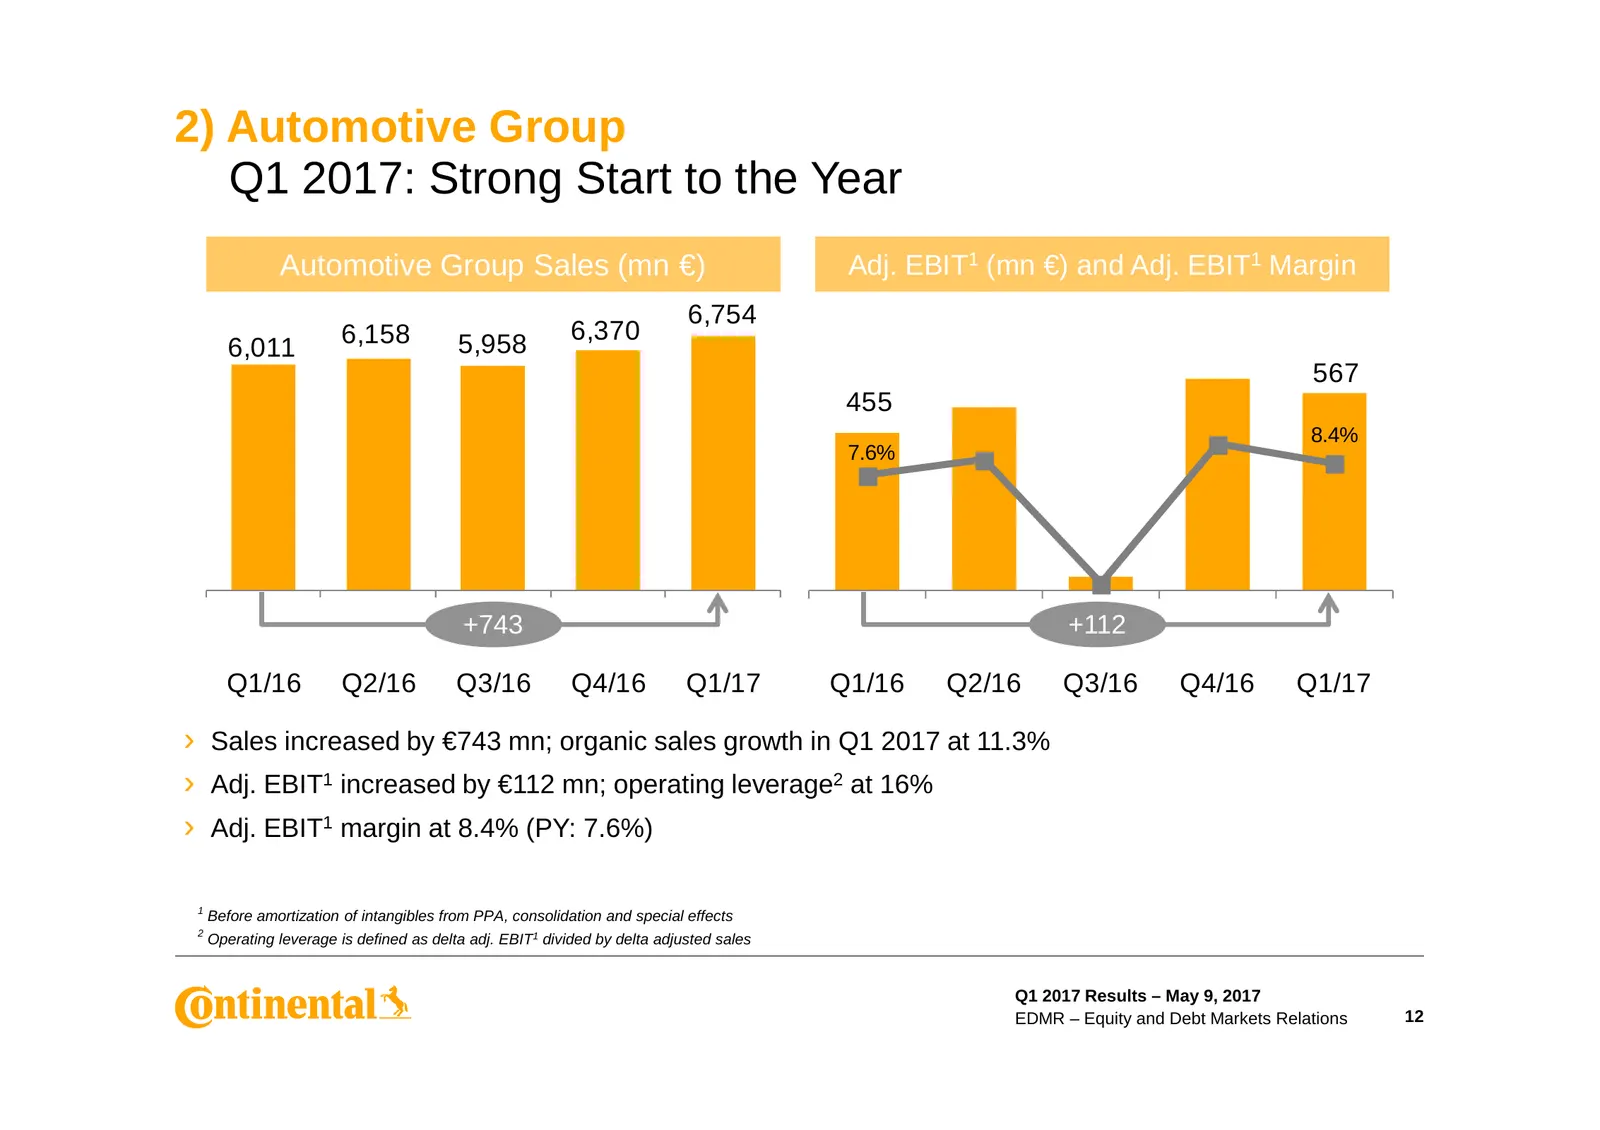
2) Automotive Group Q1 2017: Strong Start to the Year Automotive Group Sales (mn €) Adj. EBIT1 (mn €) and Adj. EBIT1 Margin 6,754 6,158 5,958 6,370 6,011 567 455 8.4% 7.6% +743 +112 Q1/16 Q2/16 Q3/16 Q4/16 Q1/17 Q1/16 Q2/16 Q3/16 Q4/16 Q1/17 › Sales increased by €743 mn; organic sales growth in Q1 2
Slide 13: Profitability Temporarily Impacted by Rising Raw Materials
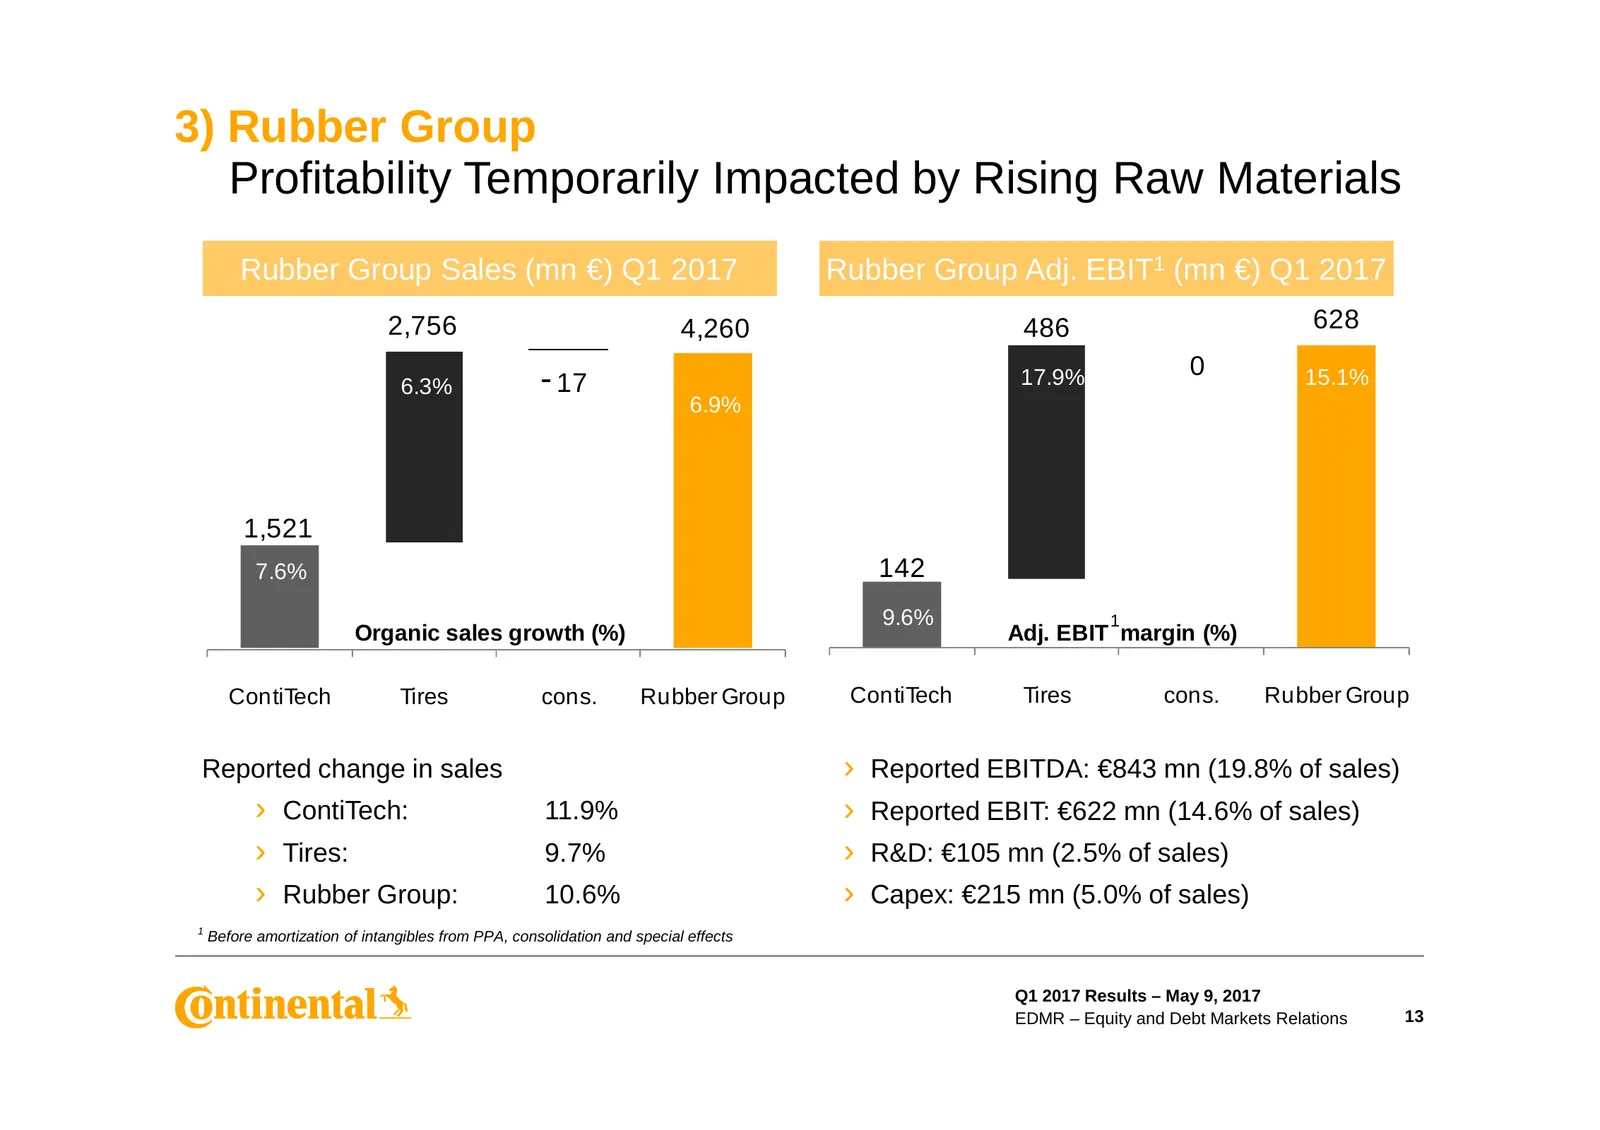
3) Rubber Group Profitability Temporarily Impacted by Rising Raw Materials Rubber Group Sales (mn €) Q1 2017 Rubber Group Adj. EBIT1 (mn €) Q1 2017 2,756 4,260 486 628 0 6.3% - 17 17.9% 15.1% 6.9% 1,521 7.6% 142 9.6% 1 Organic sales growth (%) Adj. EBIT margin (%) ContiTech Tires cons. Rubber Group
Slide 14: Q1 2017: Challenging Start to the Year
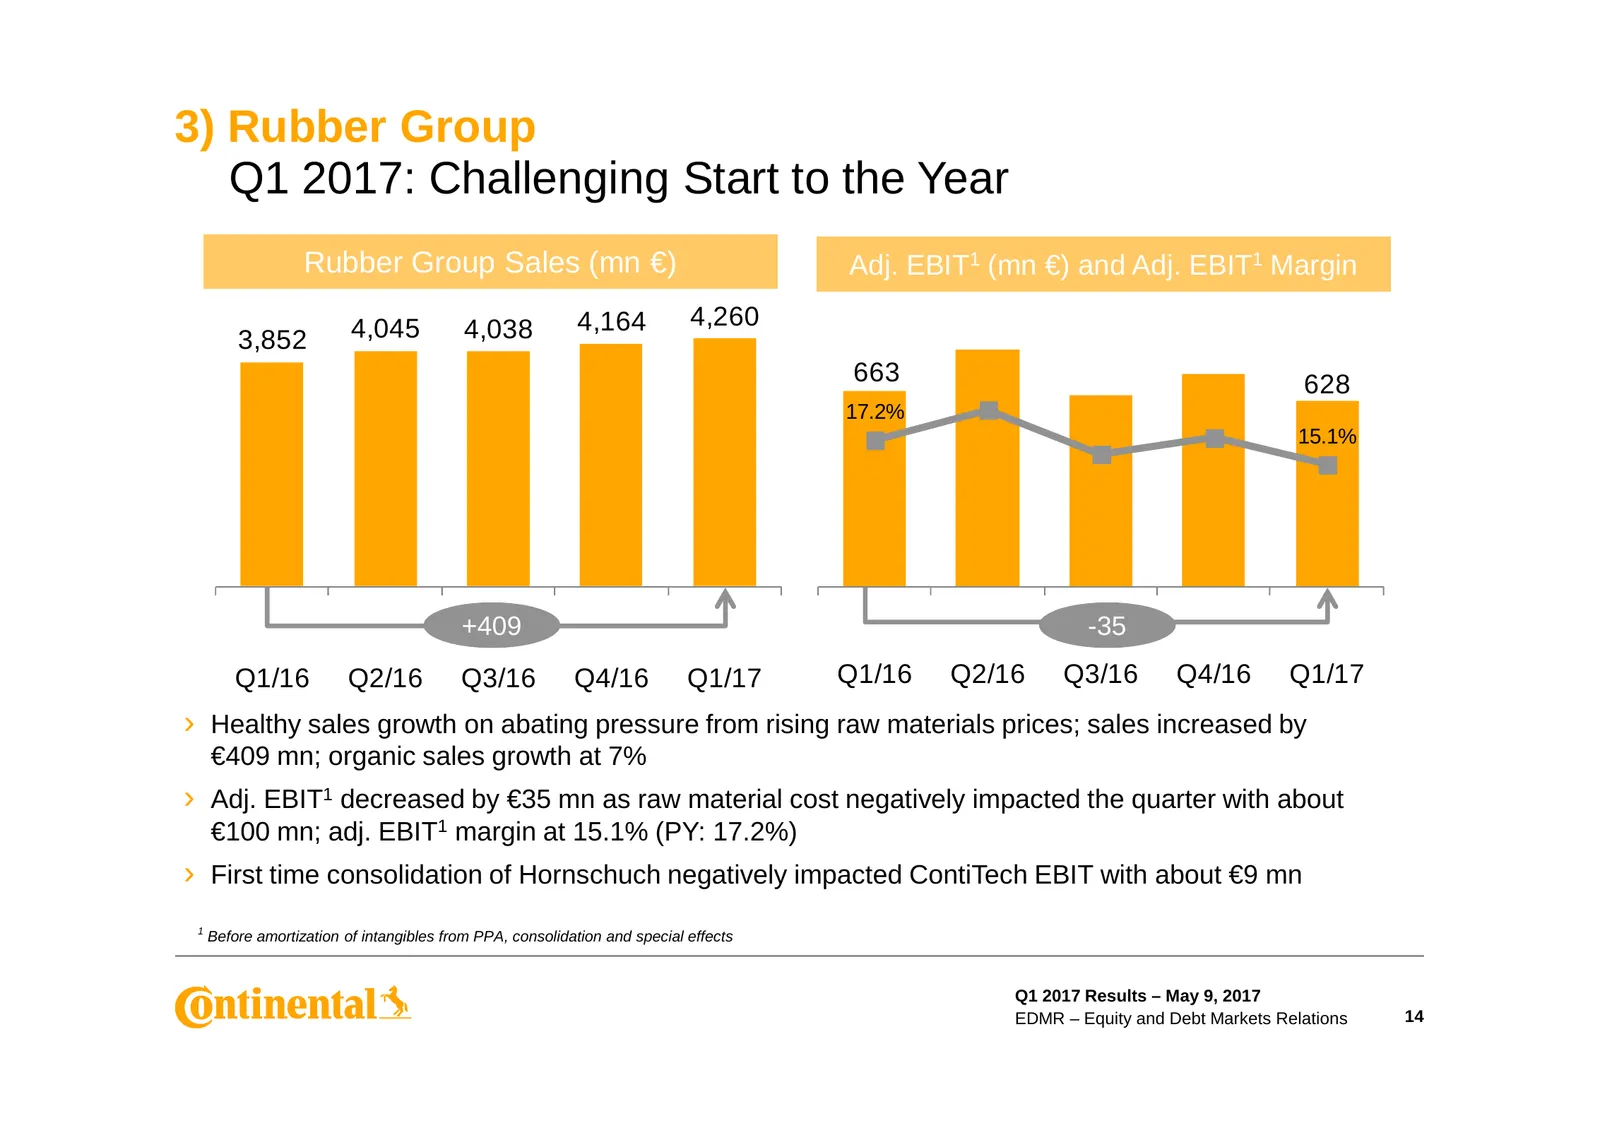
3) Rubber Group Q1 2017: Challenging Start to the Year Rubber Group Sales (mn €) Adj. EBIT1 (mn €) and Adj. EBIT1 Margin 4,045 4,038 4,164 4,260 3,852 663 628 17.2% 15.1% +409 -35 Q1/16 Q2/16 Q3/16 Q4/16 Q1/17 Q1/16 Q2/16 Q3/16 Q4/16 Q1/17 › Healthy sales growth on abating pressure from rising raw m
Slide 15: Expected Raw Material Price Development in 2017
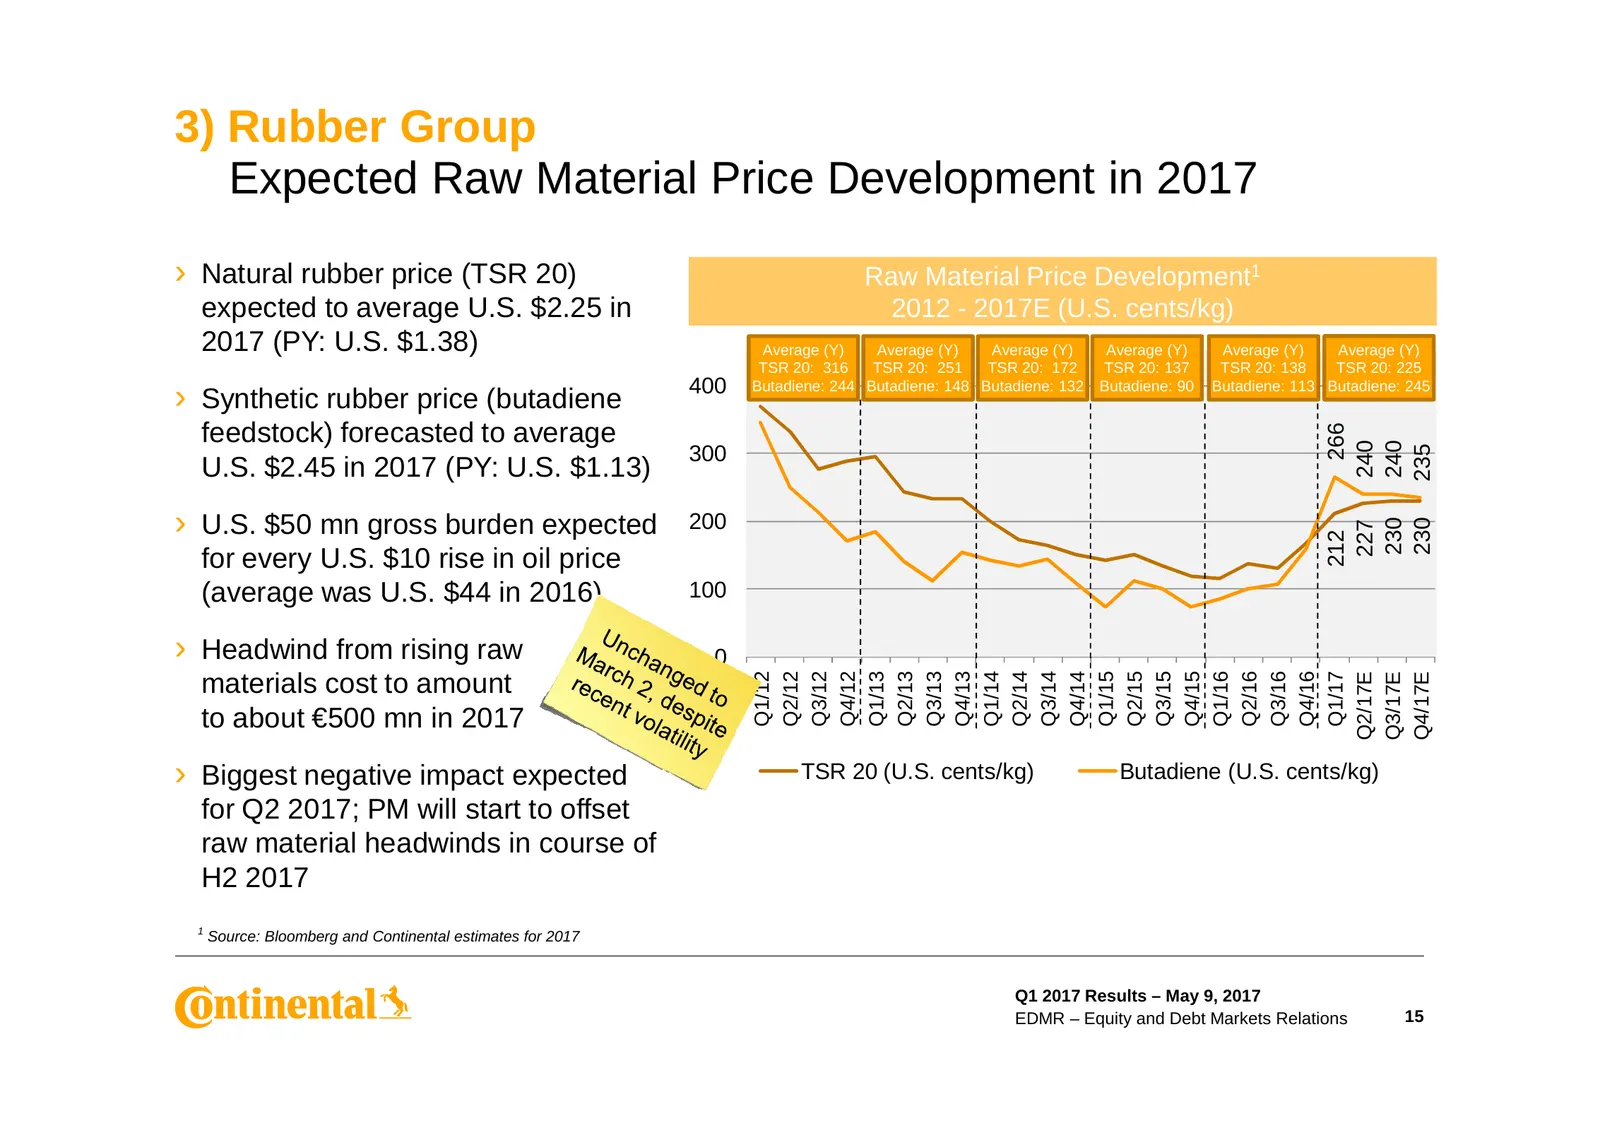
3) Rubber Group Expected Raw Material Price Development in 2017 › Natural rubber price (TSR 20) Raw Material Price Development1 expected to average U.S. $2.25 in 2012 - 2017E (U.S. cents/kg) 2017 (PY: U.S. $1.38) Average (Y) Average (Y) Average (Y) Average (Y) Average (Y) Average (Y) TSR 20: 1316 TS
Slide 16: Net Indebtedness Bridge
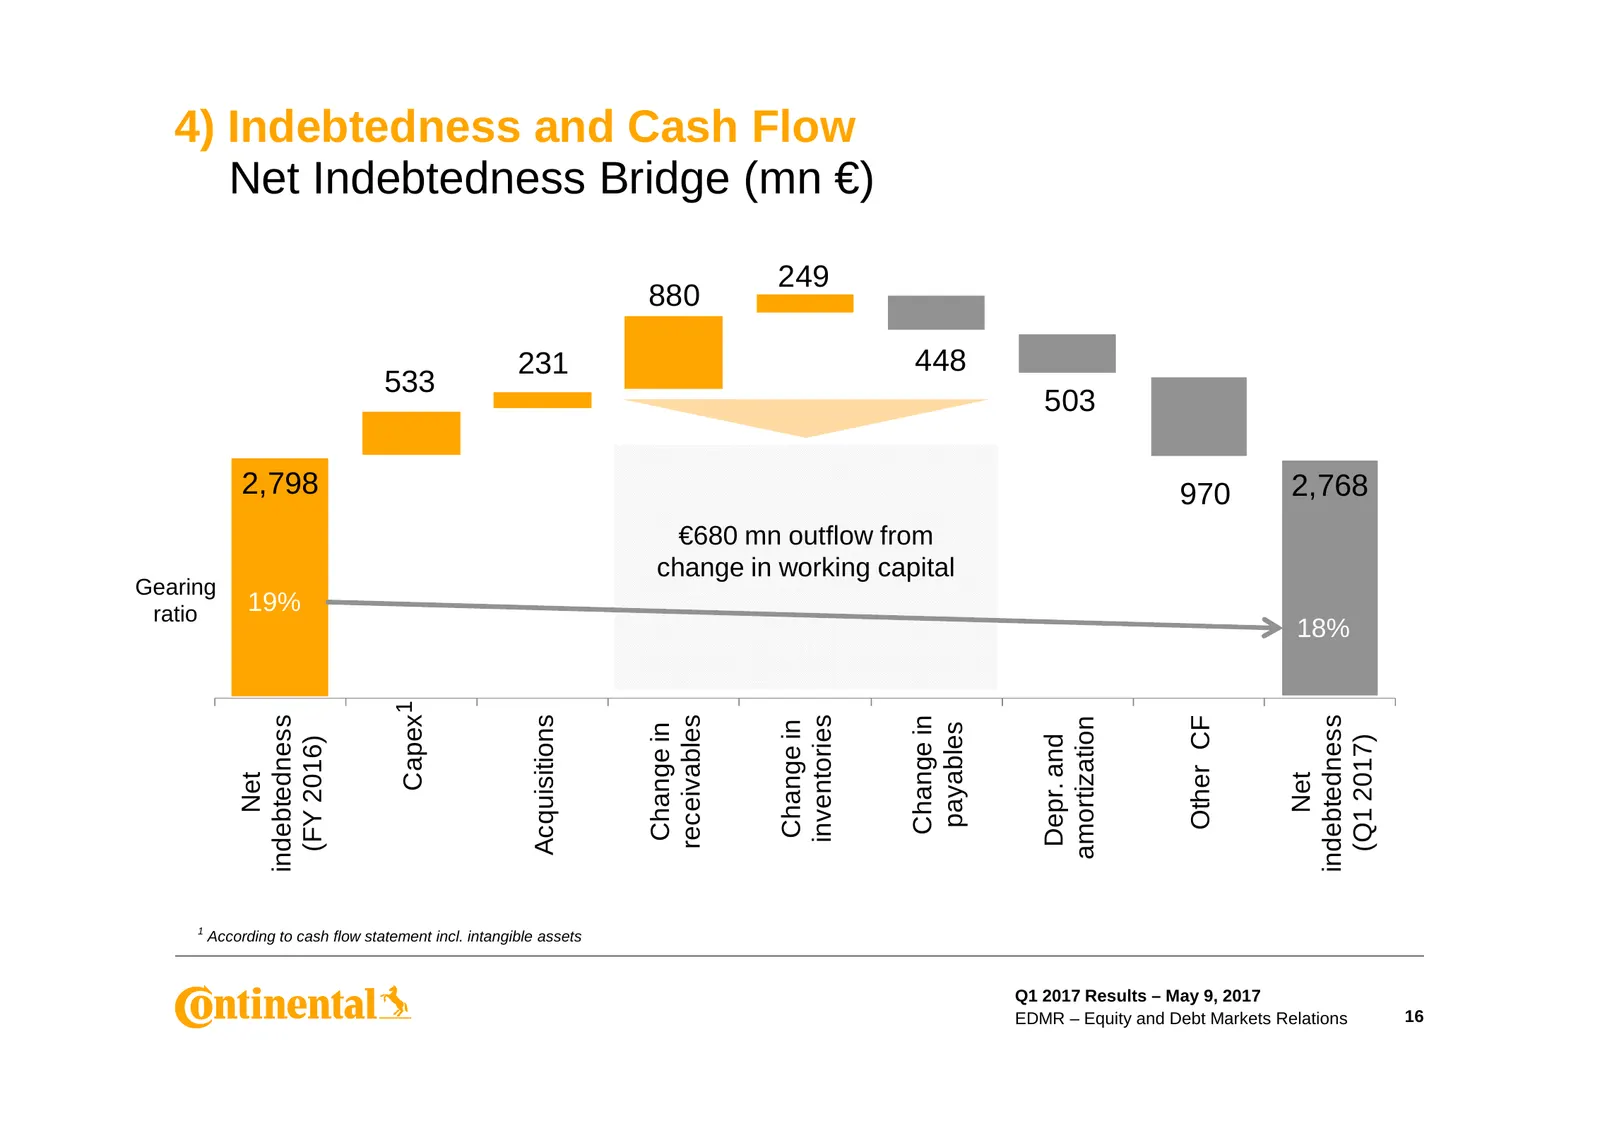
4) Indebtedness and Cash Flow Net Indebtedness Bridge (mn €) 249 880 231 448 533 503 2,798 970 2,768 €680 mn outflow from change in working capital Gearing ratio 19% 18% Capex1 receivables Acquisitions indebtedness inventories indebtedness Other CF Change in amortization Change in payables Change in
Slide 17: Cash Flow Overview
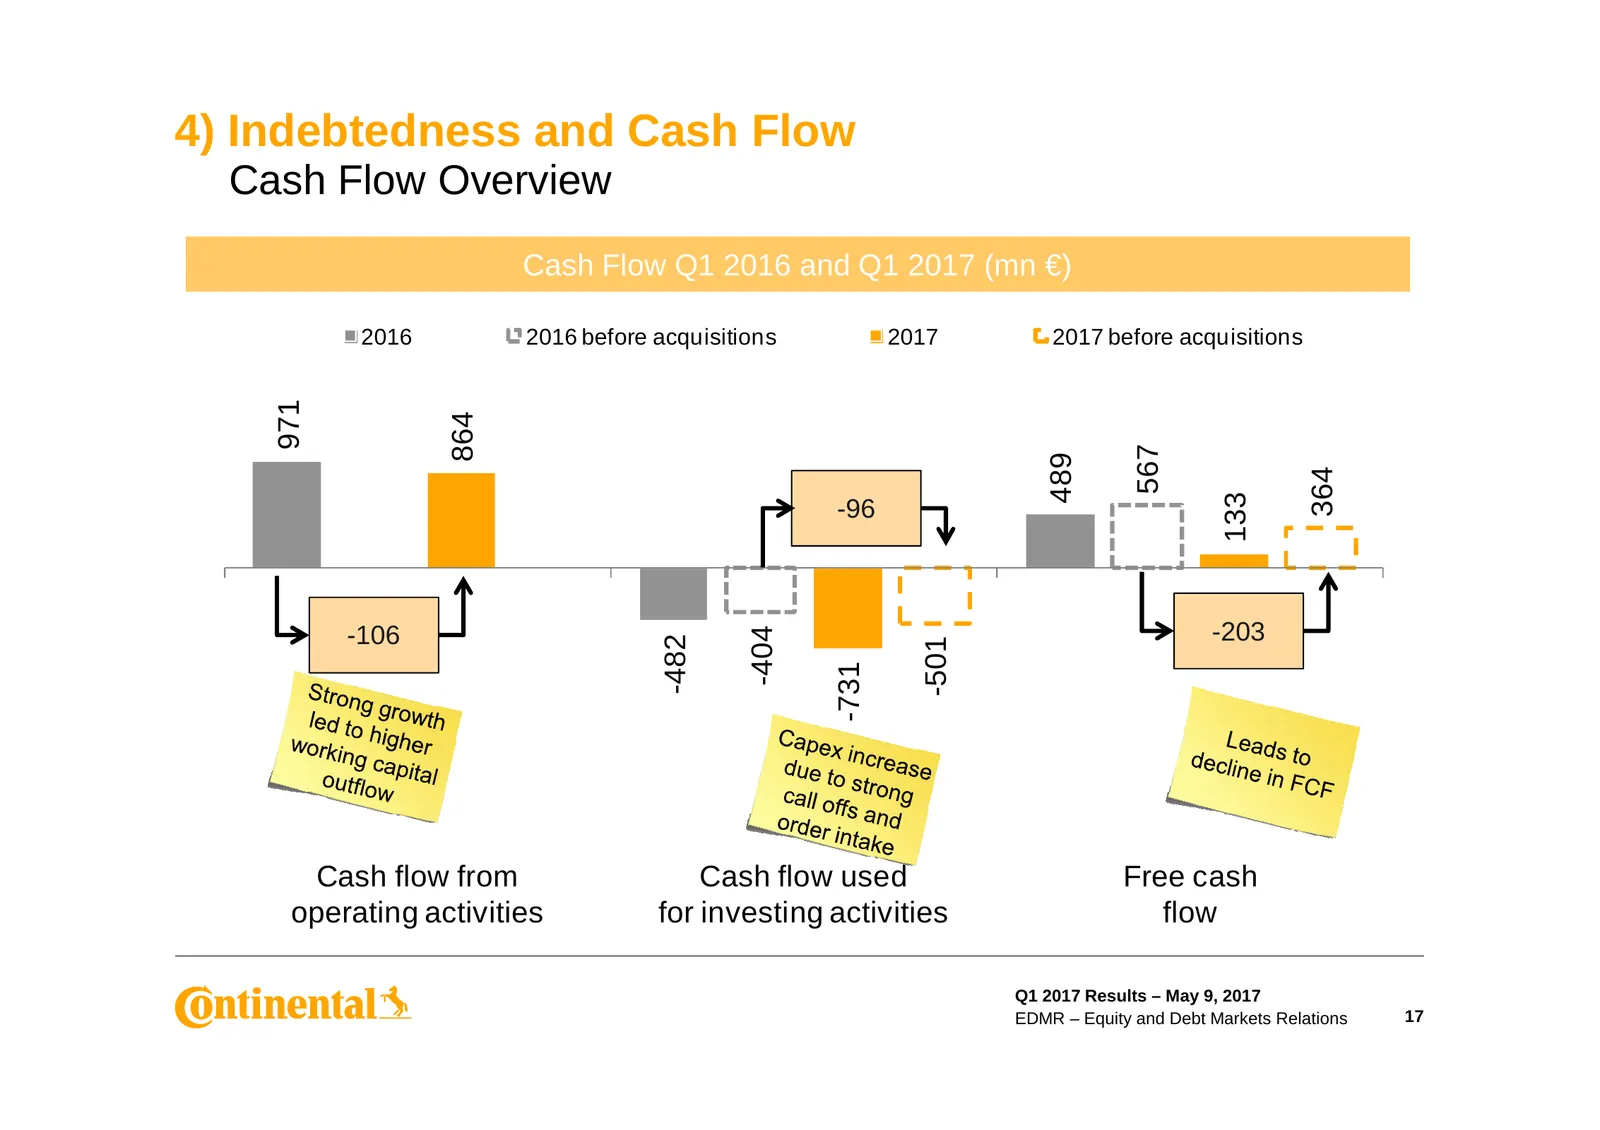
4) Indebtedness and Cash Flow Cash Flow Overview Cash Flow Q1 2016 and Q1 2017 (mn €) 2016 2016 before acquisitions 2017 2017 before acquisitions 971 864 567 489 364 133 -96 -106 -203 -404 -482 -501 -731 Cash flow from Cash flow used Free cash operating activities for investing activities flow Q1 20
Slide 18: Net Indebtedness and Gearing Ratio
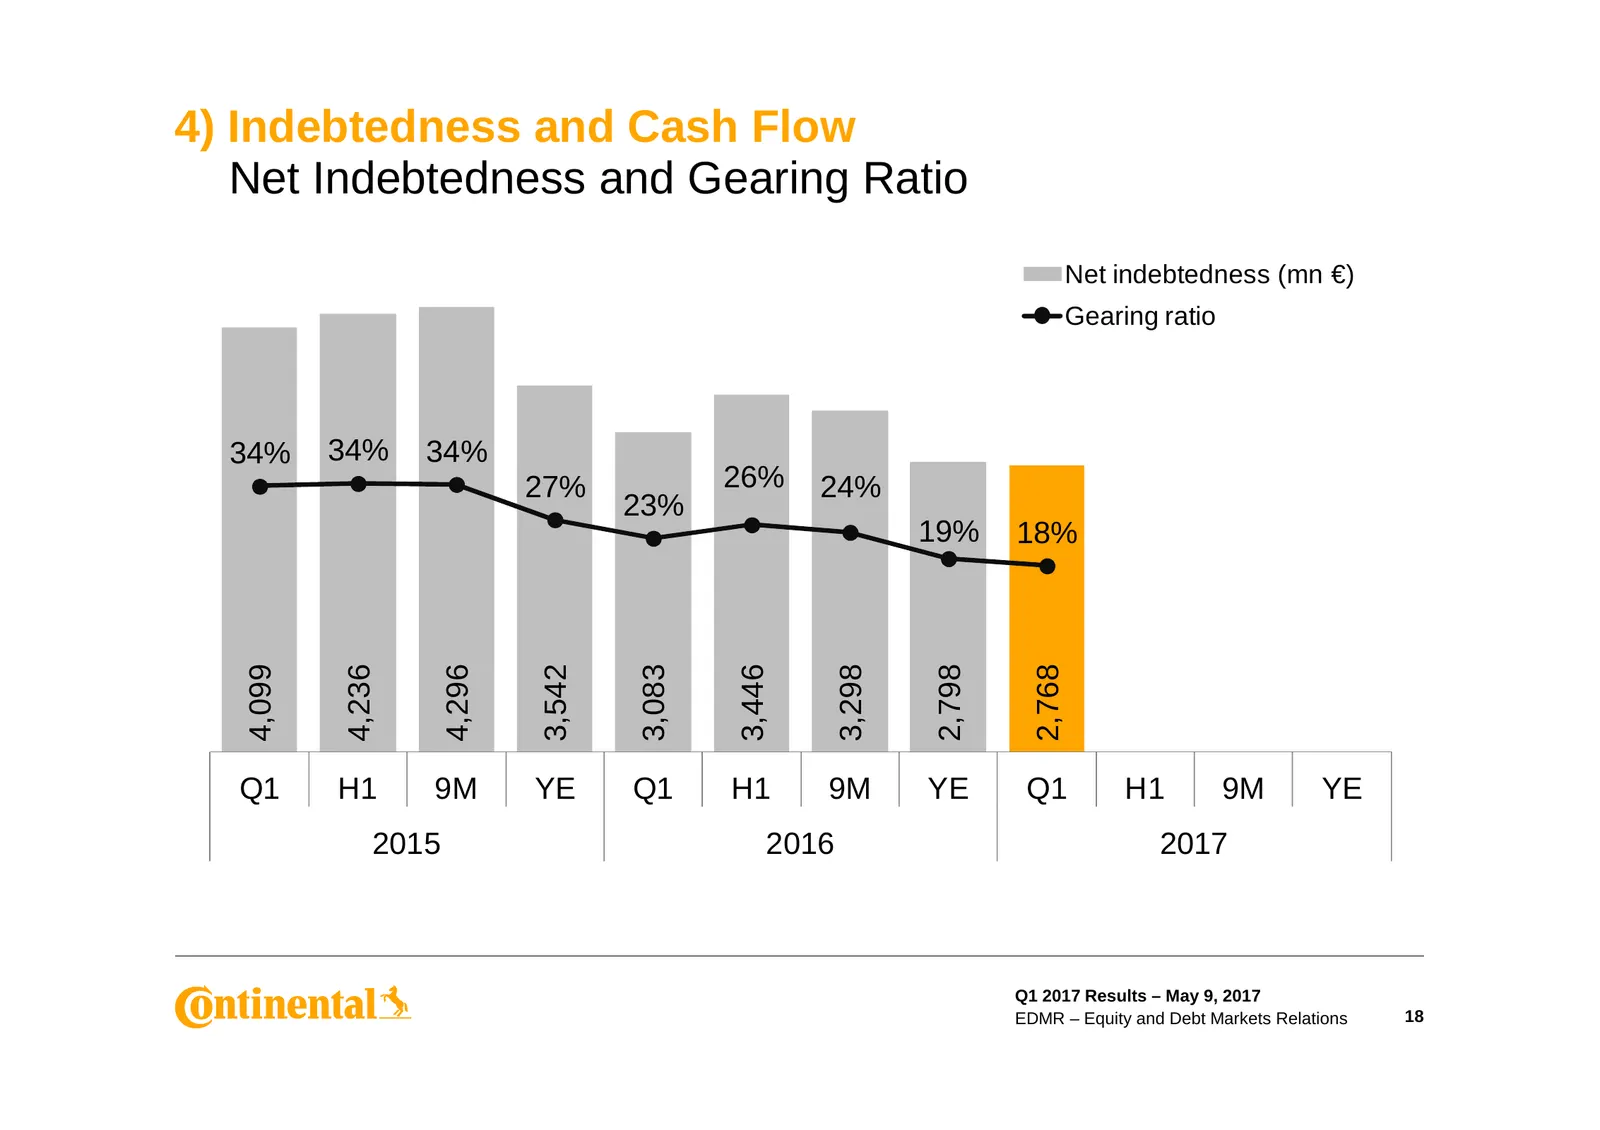
4) Indebtedness and Cash Flow Net Indebtedness and Gearing Ratio Net indebtedness (mn €) Gearing ratio 34% 34% 34% 27% 26% 24% 23% 19% 18% 4,099 4,236 4,296 3,542 3,083 3,446 3,298 2,798 2,768 Q1 H1 9M YE Q1 H1 9M YE Q1 H1 9M YE 2015 2016 2017 Q1 2017 Results – May 9, 2017 EDMR – Equity and Debt Mar
Slide 19: PC & LT Production by Quarter in Major Regions
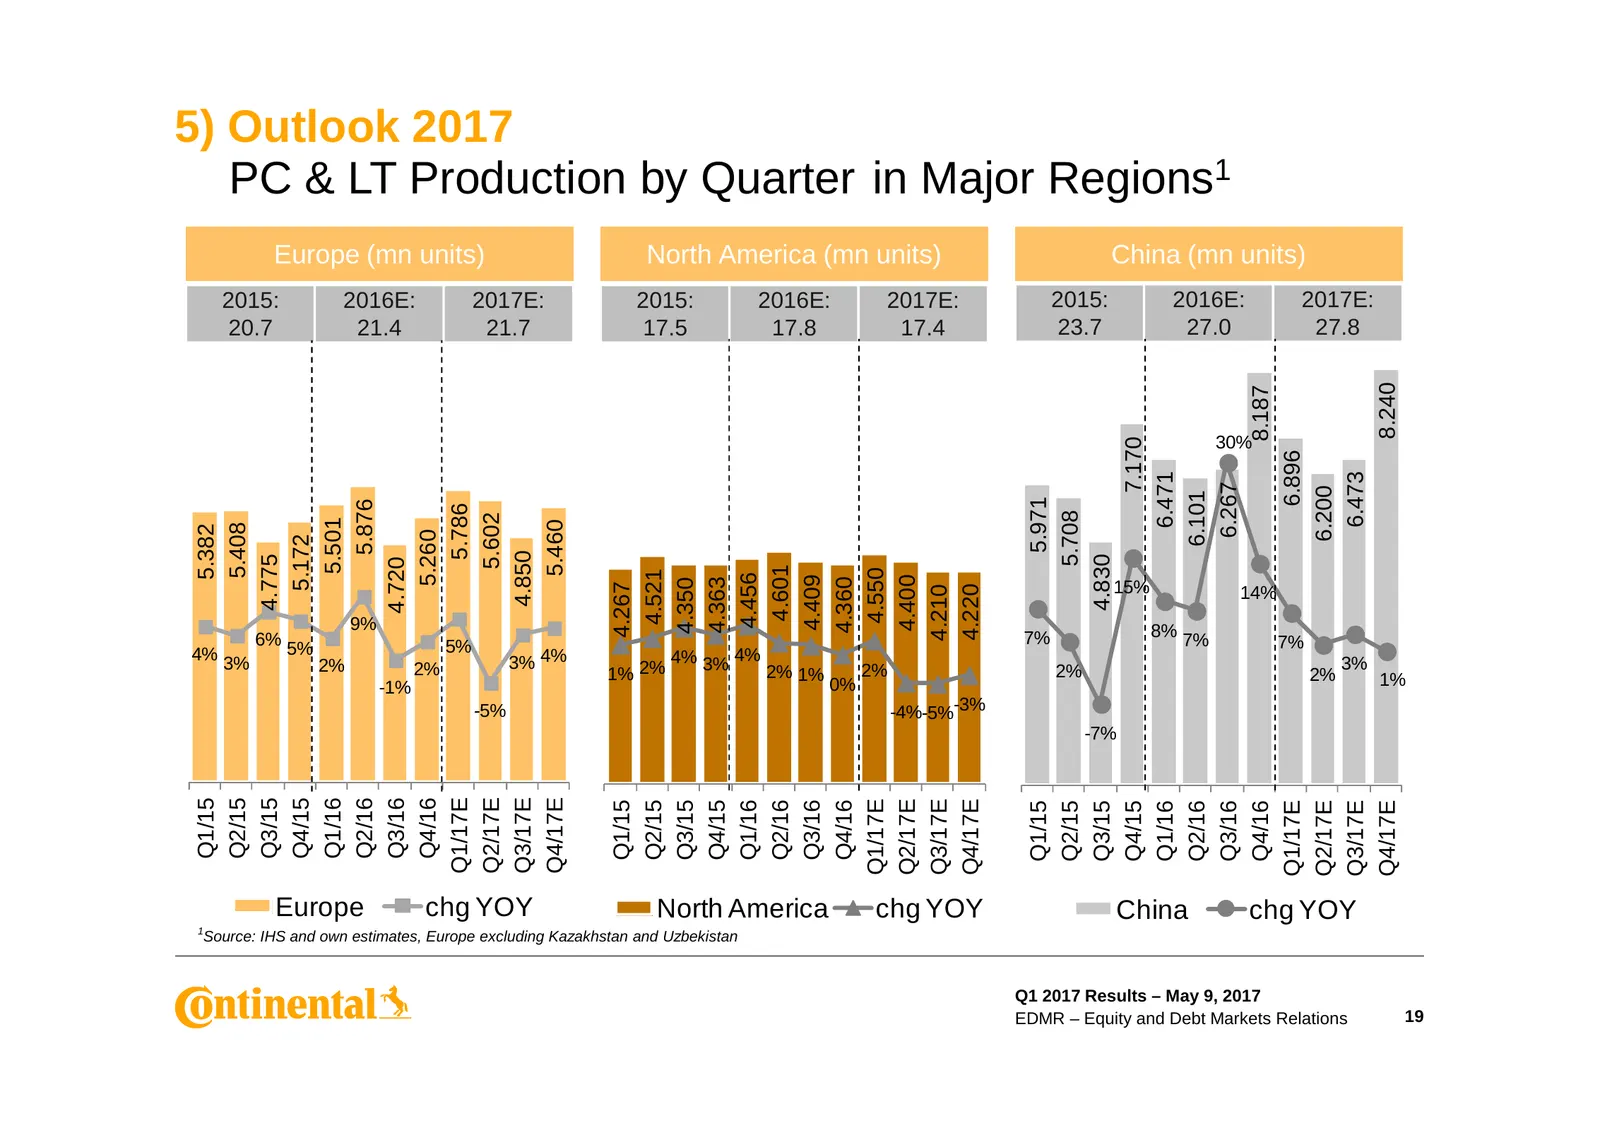
5) Outlook 2017 PC & LT Production by Quarter in Major Regions1 Europe (mn units) North America (mn units) China (mn units) 2015: 2016E: 2017E: 2015: 2016E: 2017E: 2015: 2016E: 2017E: 20.7 21.4 21.7 17.5 17.8 17.4 23.7 27.0 27.8 8.240 8.187 30% 7.170 6.896 6.471 6.473 6.267 6.200 6.101 5.971 5.876 5
Slide 20: Market Outlook for Major Regions
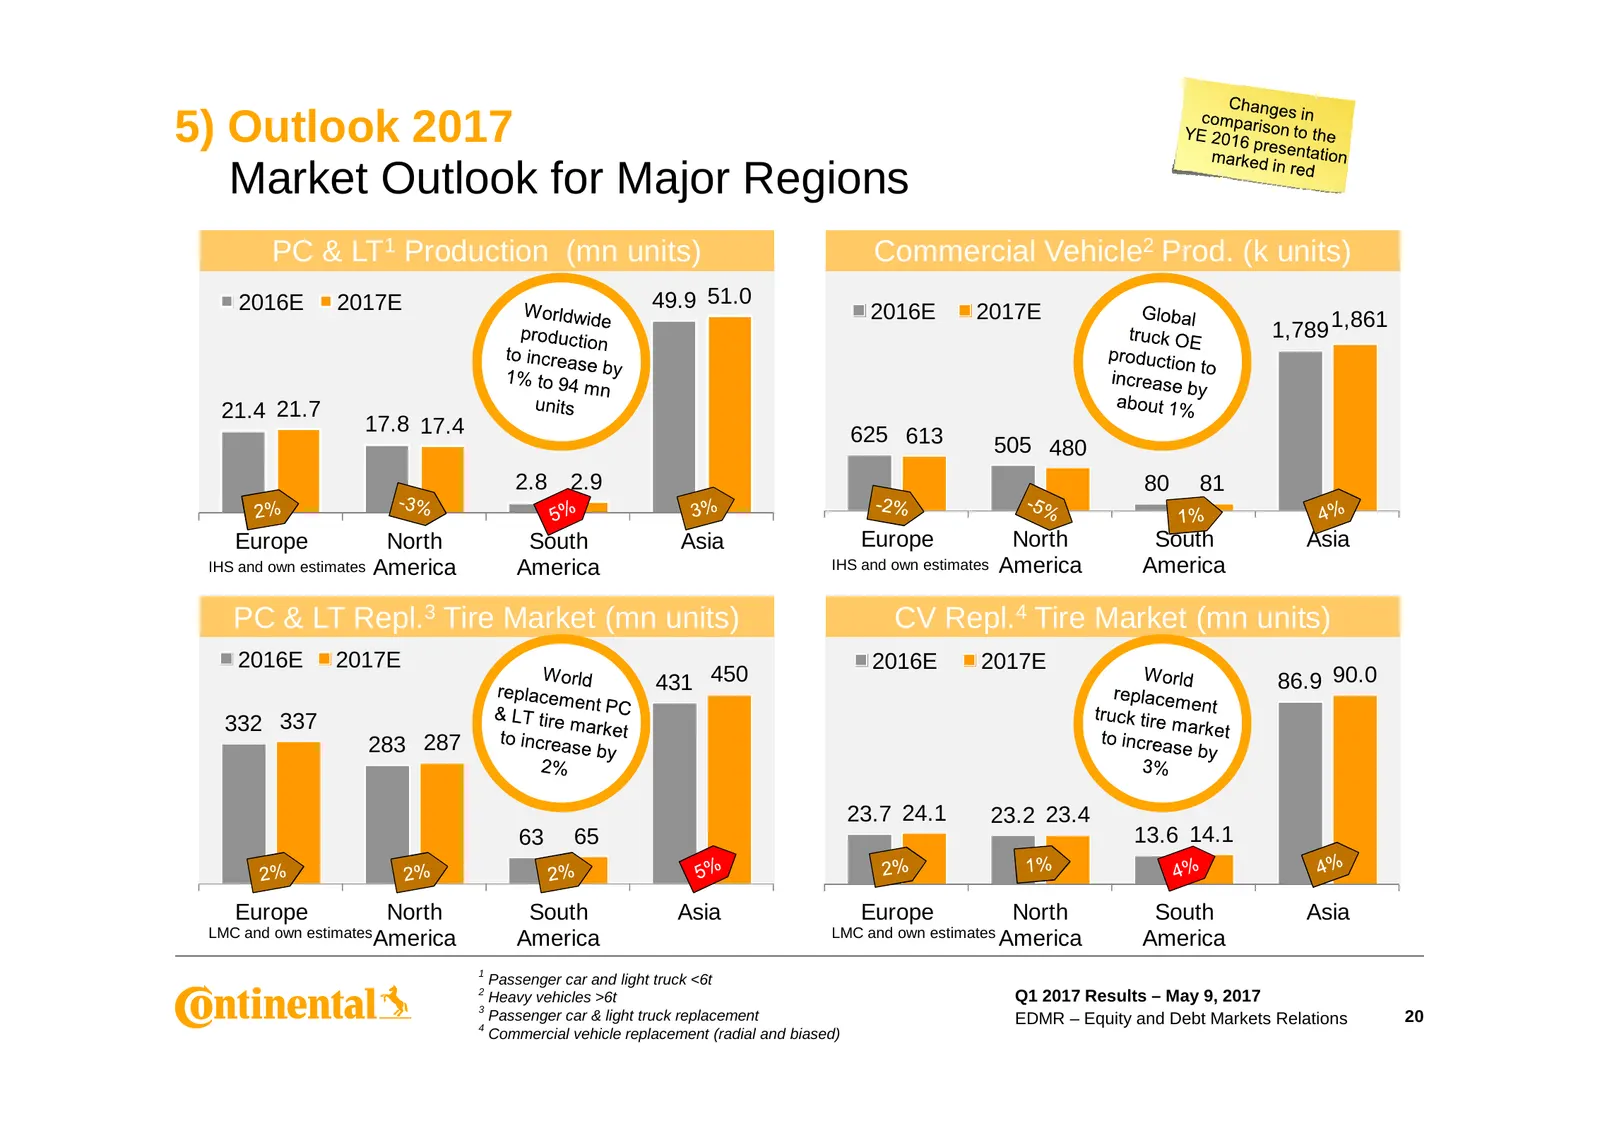
5) Outlook 2017 Market Outlook for Major Regions PC & LT1 Production (mn units) Commercial Vehicle2 Prod. (k units) 2016E 2017E 49.9 51.0 2016E 2017E 1,789 1,861 21.4 21.7 17.8 17.4 625 613 505 480 2.8 2.9 80 81 Europe North South Asia Europe North South Asia IHS and own estimates America America IH
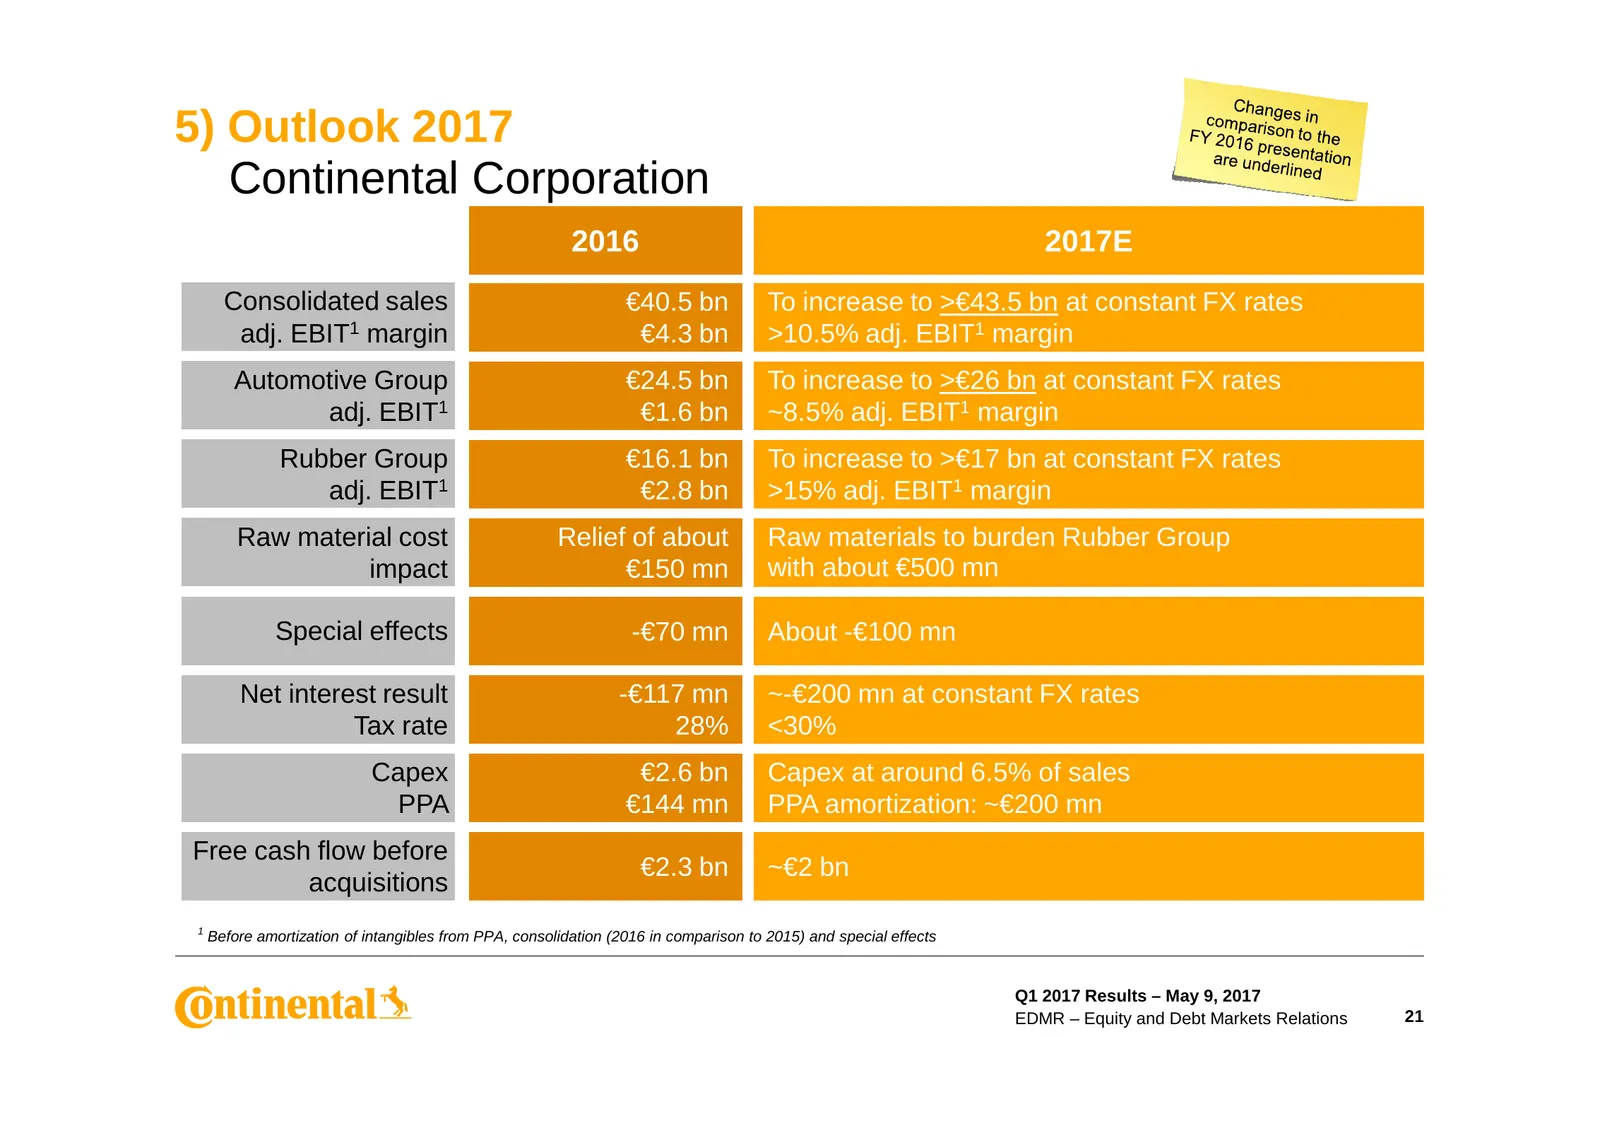
Slide 21: Outlook 2017: Continental Corporation
5) Outlook 2017 Continental Corporation 2016 2017E Consolidated sales €40.5 bn To increase to >€43.5 bn at constant FX rates adj. EBIT1 margin €4.3 bn >10.5% adj. EBIT1 margin Automotive Group €24.5 bn To increase to >€26 bn at constant FX rates adj. EBIT1 €1.6 bn ~8.5% adj. EBIT1 margin Rubber Grou
Slide 22: Thank you!
Thank you! Q1 2017 Results – May 9, 2017 EDMR – Equity and Debt Markets Relations 22
Slide 23: Disclaimer
Disclaimer › This presentation has been prepared by Continental Aktiengesellschaft solely in connection with the release of the Q1 2017 results on May 9, 2017, in Hanover and the subsequent road shows in Europe and North America. It has not been independently verified. It does not constitute an offe
Slide 24: Contact: Equity and Debt Markets Relations
Contact Equity and Debt Markets Relations Vahrenwalder Str. 9 Michael Saemann 30165 Hanover Analysts, Institutional Investors and Sustainability Investors Germany Phone: +49 511 938 1307 E-mail: ir@conti.de E-mail: michael.saemann@conti.de Fax: +49 511 938 1080 www.continental-ir.com Klaus Paesler A
Slide 25: Continental Financial Calendar
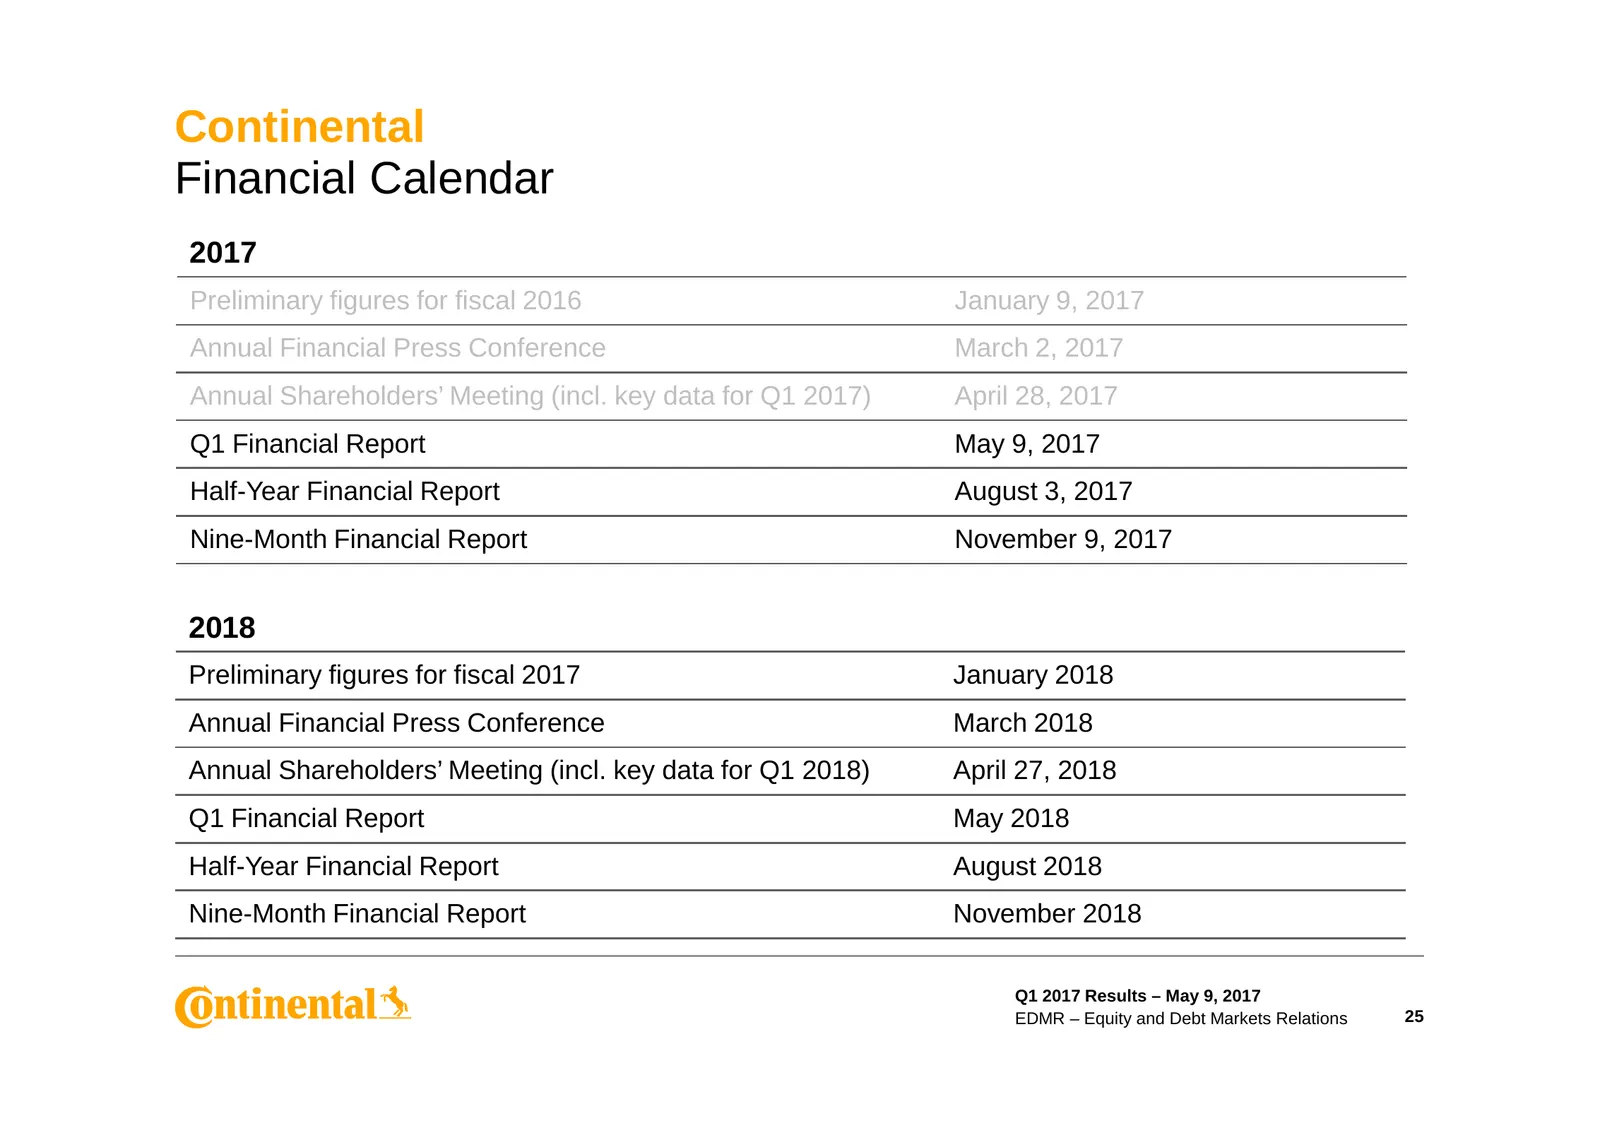
Continental Financial Calendar 2017 Preliminary figures for fiscal 2016 January 9, 2017 Annual Financial Press Conference March 2, 2017 Annual Shareholders’ Meeting (incl. key data for Q1 2017) April 28, 2017 Q1 Financial Report May 9, 2017 Half-Year Financial Report August 3, 2017 Nine-Month Financ
Slide 26: Continental Share Data/ADR Data
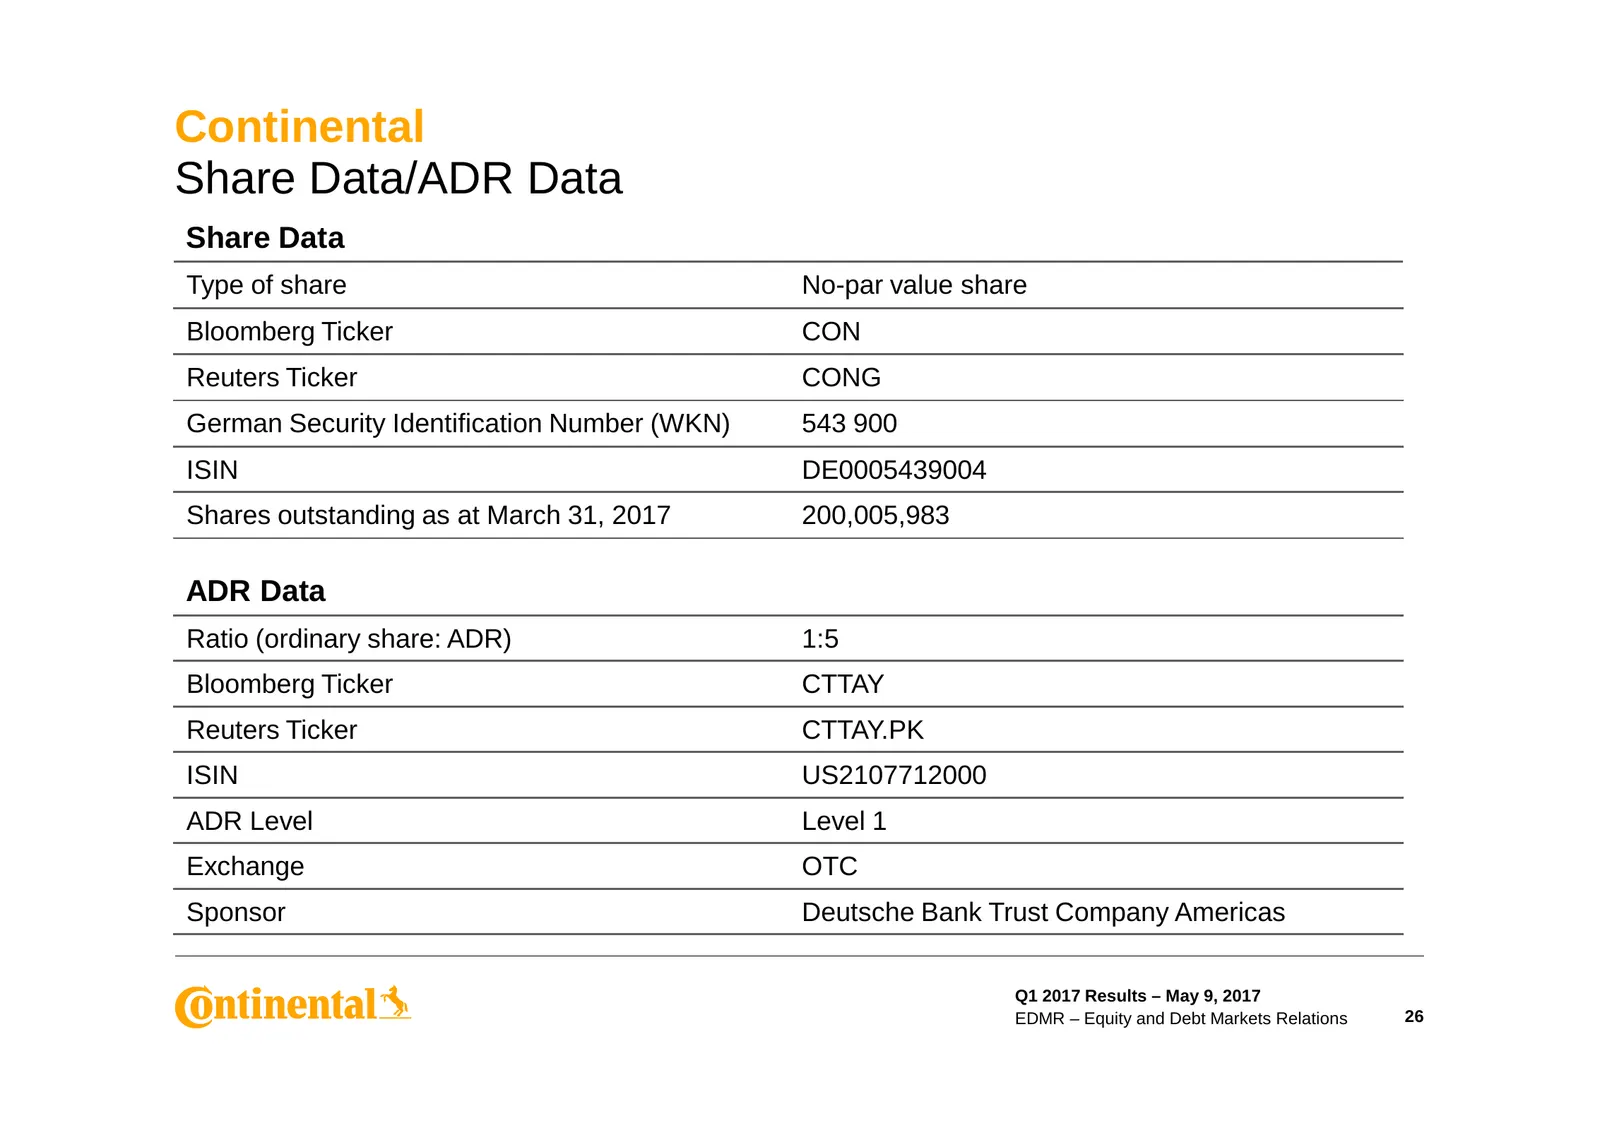
Continental Share Data/ADR Data Share Data Type of share No-par value share Bloomberg Ticker CON Reuters Ticker CONG German Security Identification Number (WKN) 543 900 ISIN DE0005439004 Shares outstanding as at March 31, 2017 200,005,983 ADR Data Ratio (ordinary share: ADR) 1:5 Bloomberg Ticker CTT
Slide 27: Continental Bond Data
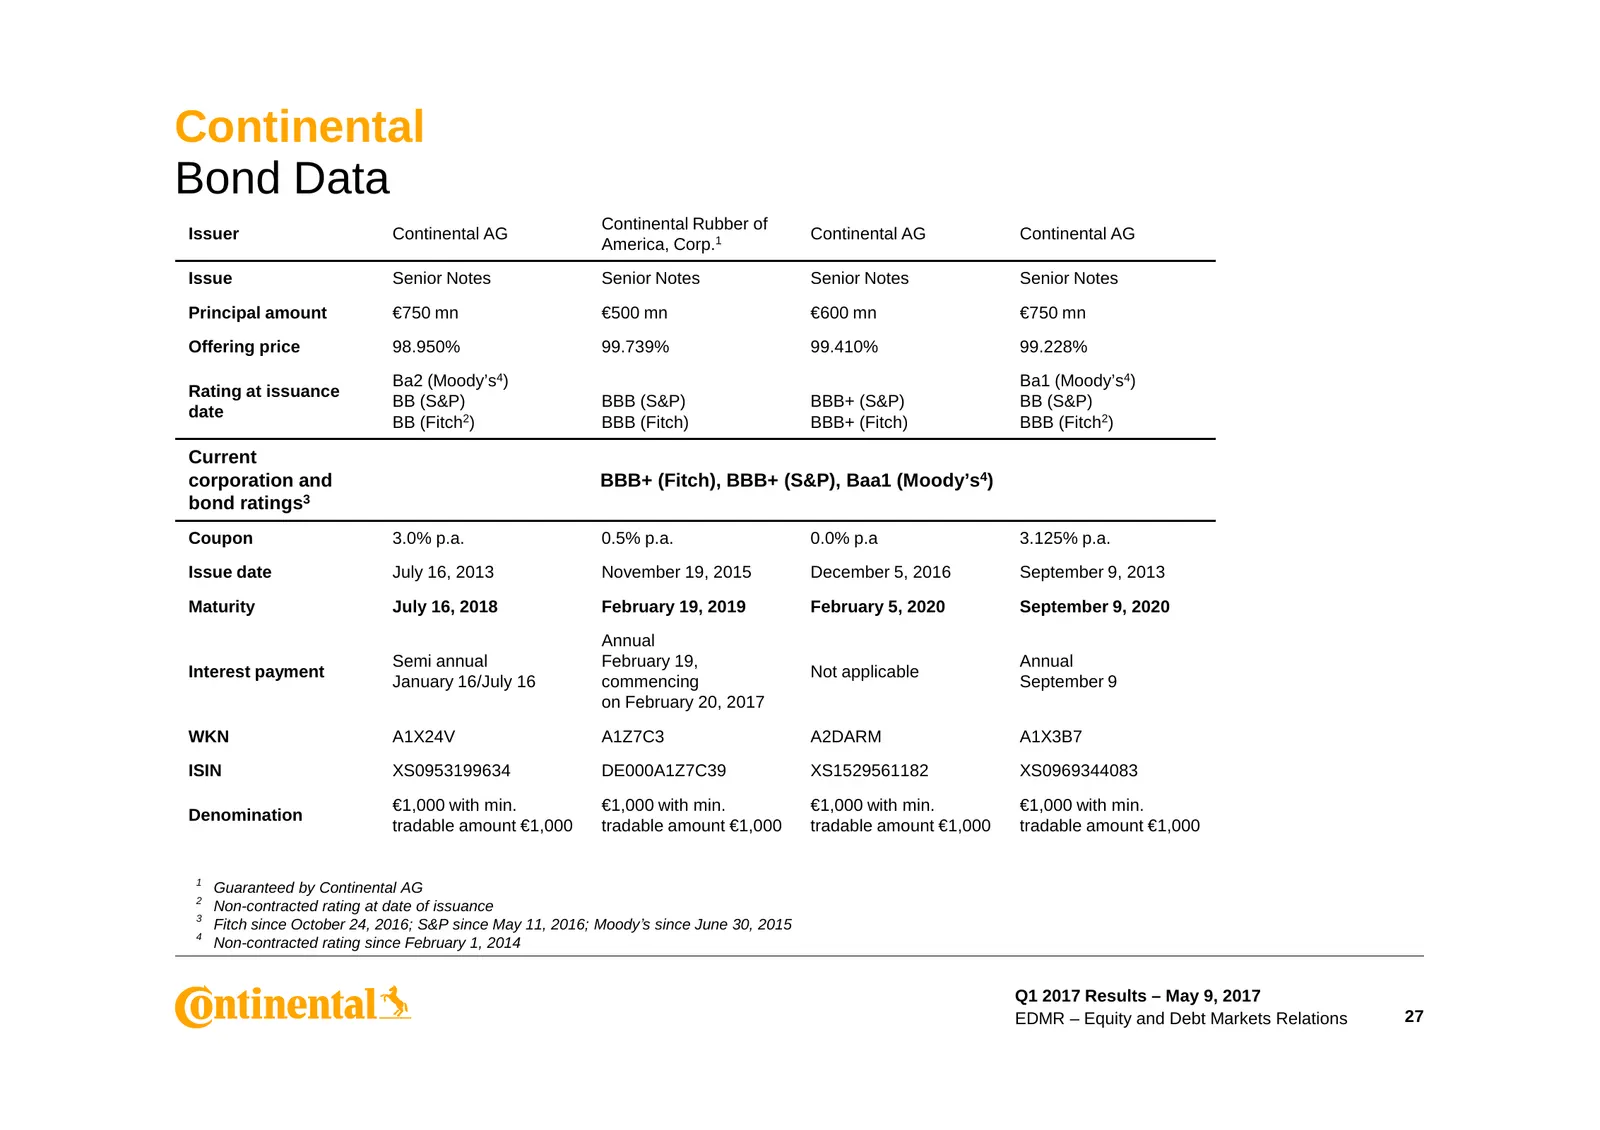
Continental Bond Data Continental Rubber of Issuer Continental AG Continental AG Continental AG America, Corp.1 Issue Senior Notes Senior Notes Senior Notes Senior Notes Principal amount €750 mn €500 mn €600 mn €750 mn Offering price 98.950% 99.739% 99.410% 99.228% Ba2 (Moody’s4) Ba1 (Moody’s4) Rati
Slide 28: Back-up
Back-up Q1 2017 Results – May 9, 2017 EDMR – Equity and Debt Markets Relations 28
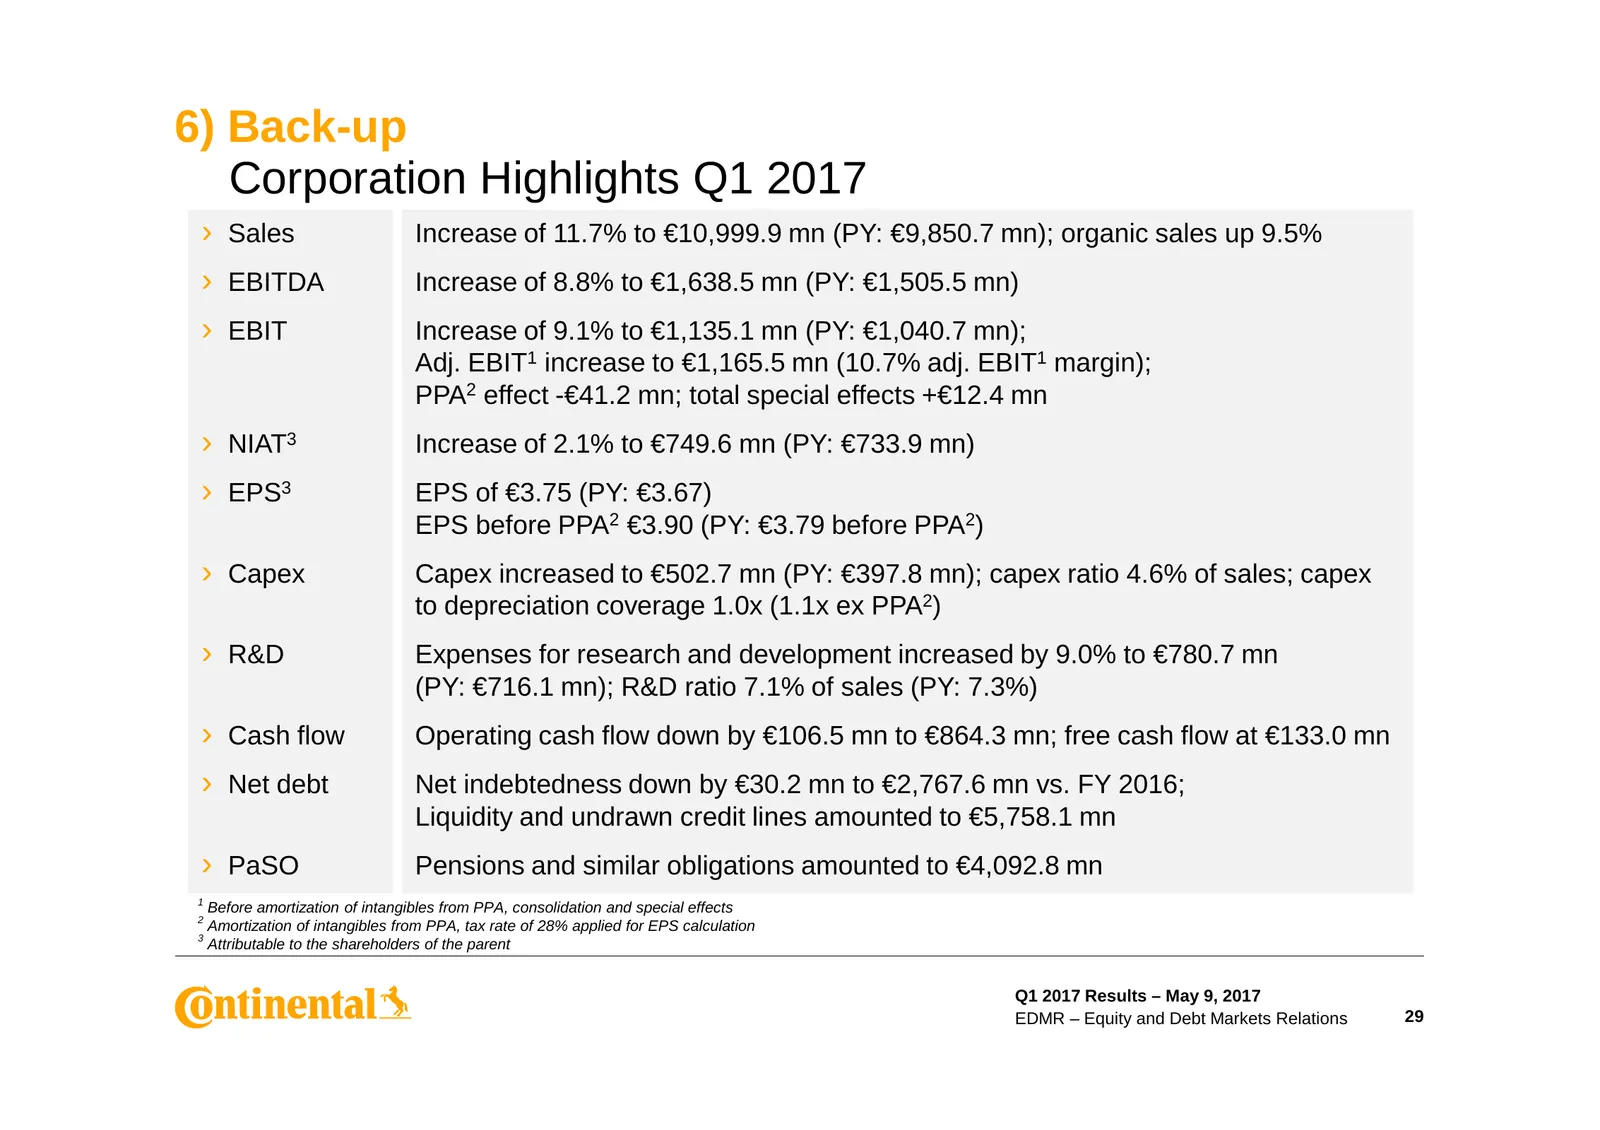
Slide 29: Corporation Highlights Q1 2017
6) Back-up Corporation Highlights Q1 2017 › Sales Increase of 11.7% to €10,999.9 mn (PY: €9,850.7 mn); organic sales up 9.5% › EBITDA Increase of 8.8% to €1,638.5 mn (PY: €1,505.5 mn) › EBIT Increase of 9.1% to €1,135.1 mn (PY: €1,040.7 mn); Adj. EBIT1 increase to €1,165.5 mn (10.7% adj. EBIT1 margi
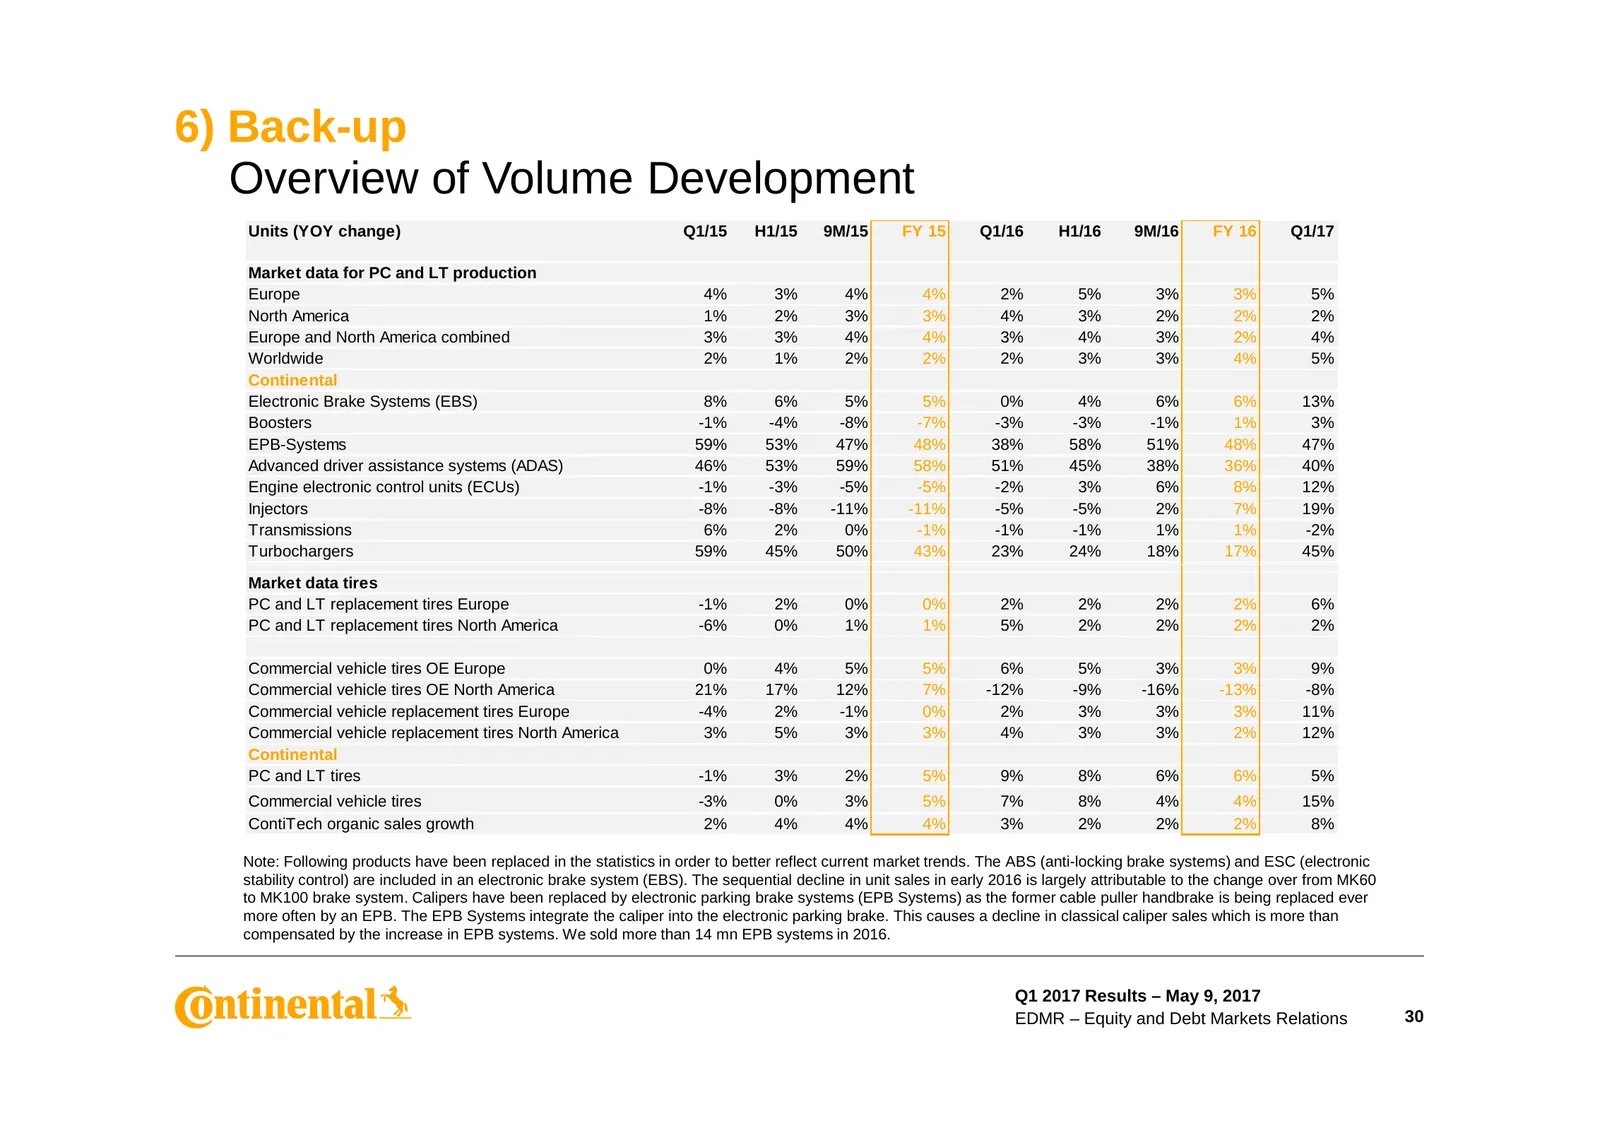
Slide 30: Overview of Volume Development
6) Back-up Overview of Volume Development Units (YOY change) Q1/15 H1/15 9M/15 FY 15 Q1/16 H1/16 9M/16 FY 16 Q1/17 Market data for PC and LT production Europe 4% 3% 4% 4% 2% 5% 3% 3% 5% North America 1% 2% 3% 3% 4% 3% 2% 2% 2% Europe and North America combined 3% 3% 4% 4% 3% 4% 3% 2% 4% Worldwide 2%
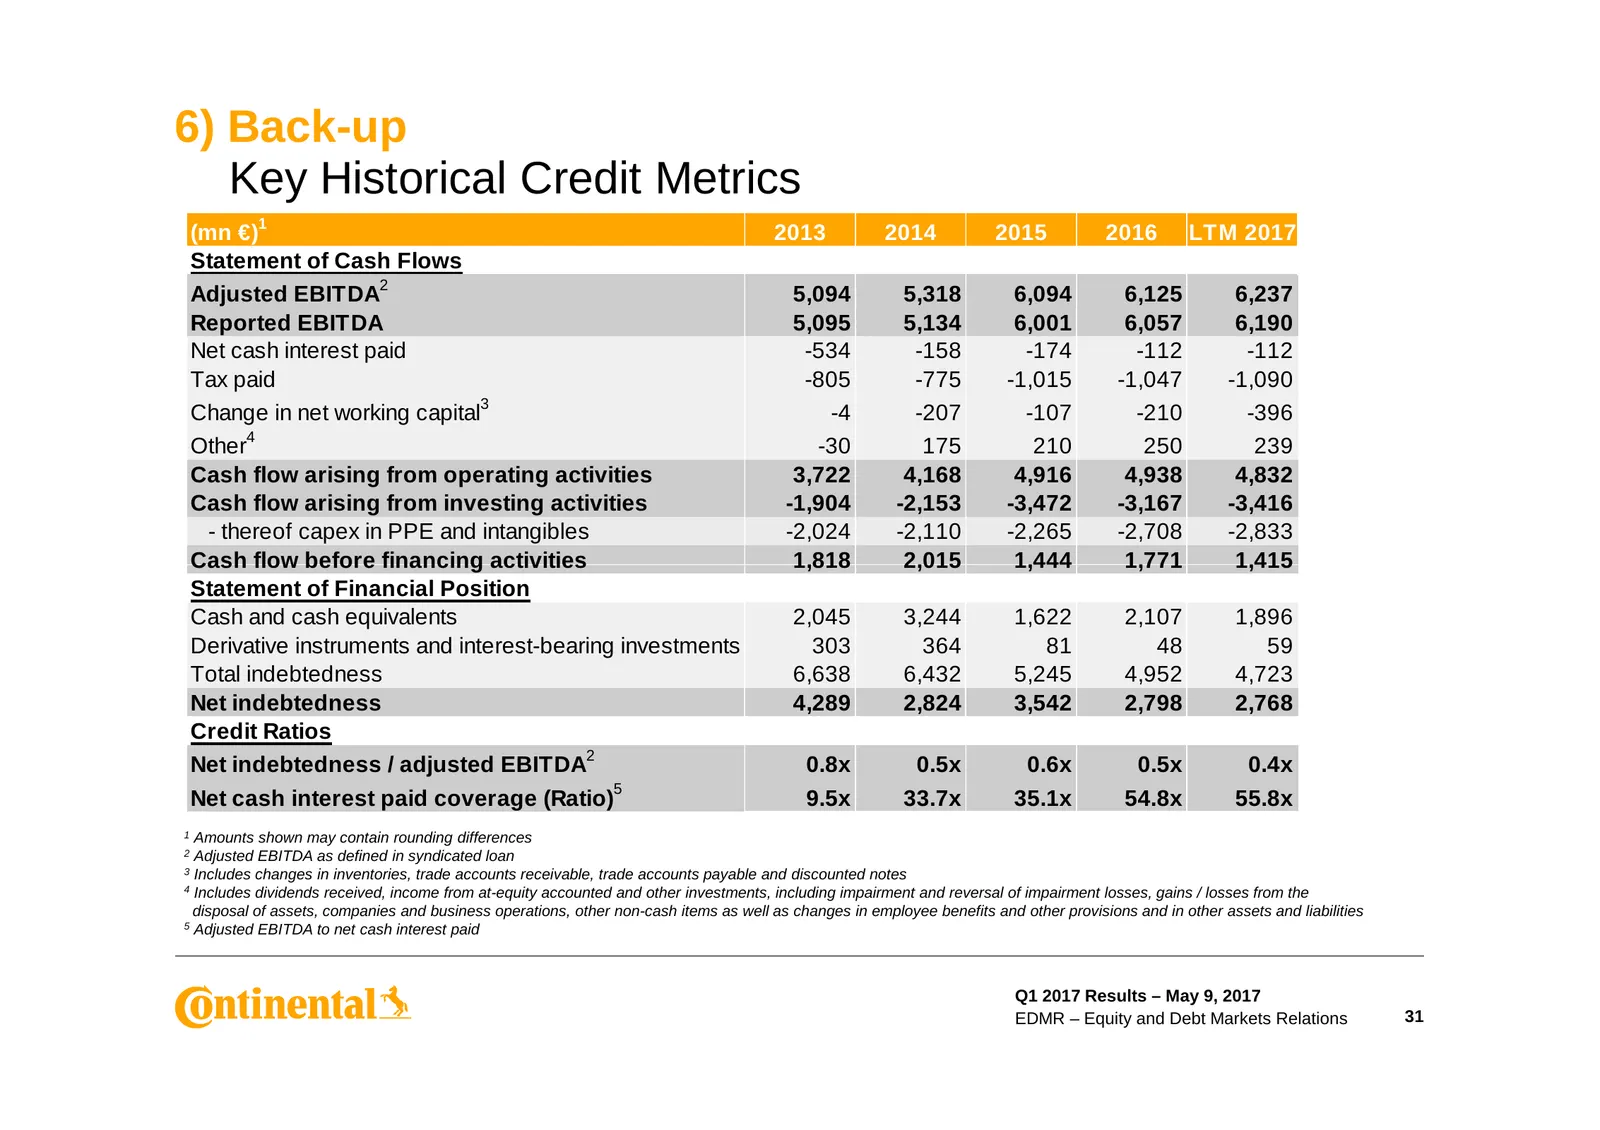
Slide 31: Key Historical Credit Metrics
6) Back-up Key Historical Credit Metrics (mn €)1 2013 2014 2015 2016 LTM 2017 Statement of Cash Flows 2 Adjusted EBITDA 5,094 5,318 6,094 6,125 6,237 Reported EBITDA 5,095 5,134 6,001 6,057 6,190 Net cash interest paid -534 -158 -174 -112 -112 Tax paid -805 -775 -1,015 -1,047 -1,090 Change in net wo
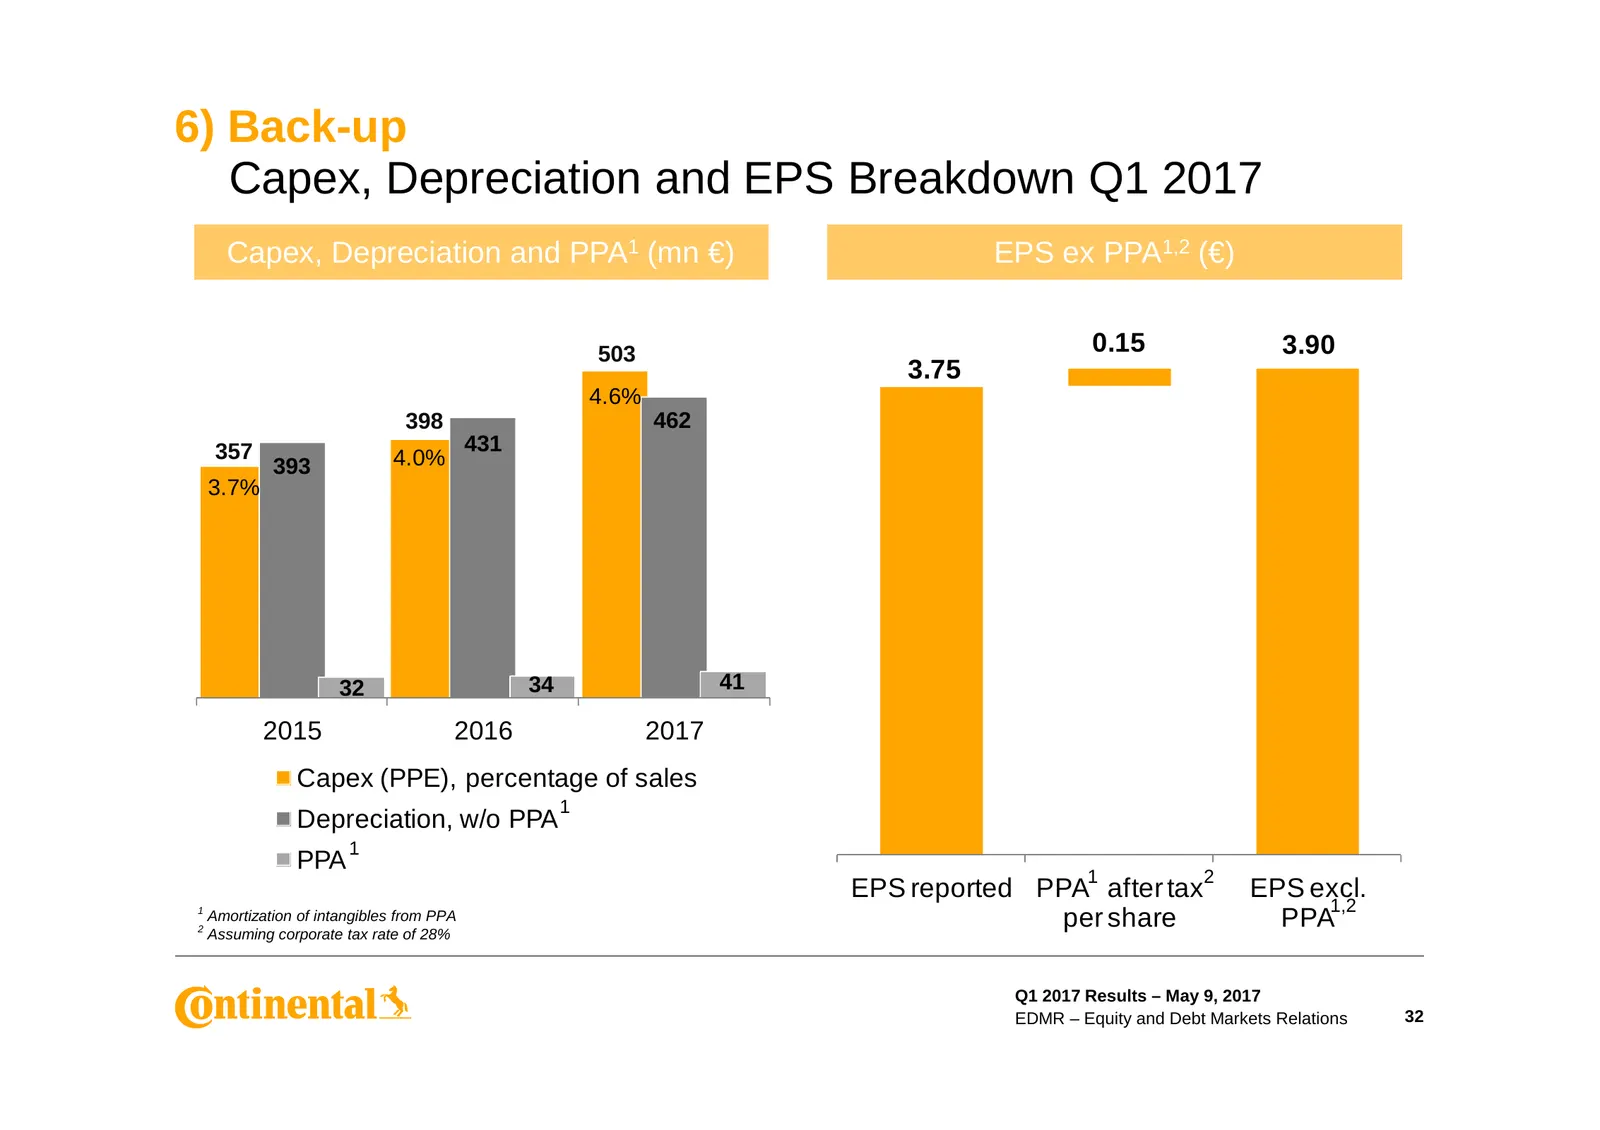
Slide 32: Capex, Depreciation and EPS Breakdown Q1 2017
6) Back-up Capex, Depreciation and EPS Breakdown Q1 2017 Capex, Depreciation and PPA1 (mn €) EPS ex PPA1,2 (€) 503 0.15 3.90 3.75 4.6% 398 462 357 431 393 4.0% 3.7% 32 34 41 2015 2016 2017 Capex (PPE), percentage of sales 1 Depreciation, w/o PPA 1 PPA 1 2 EPS reported PPA after tax EPS excl. 1 1,2 2
Slide 33: Automotive Group Financials – Chassis & Safety
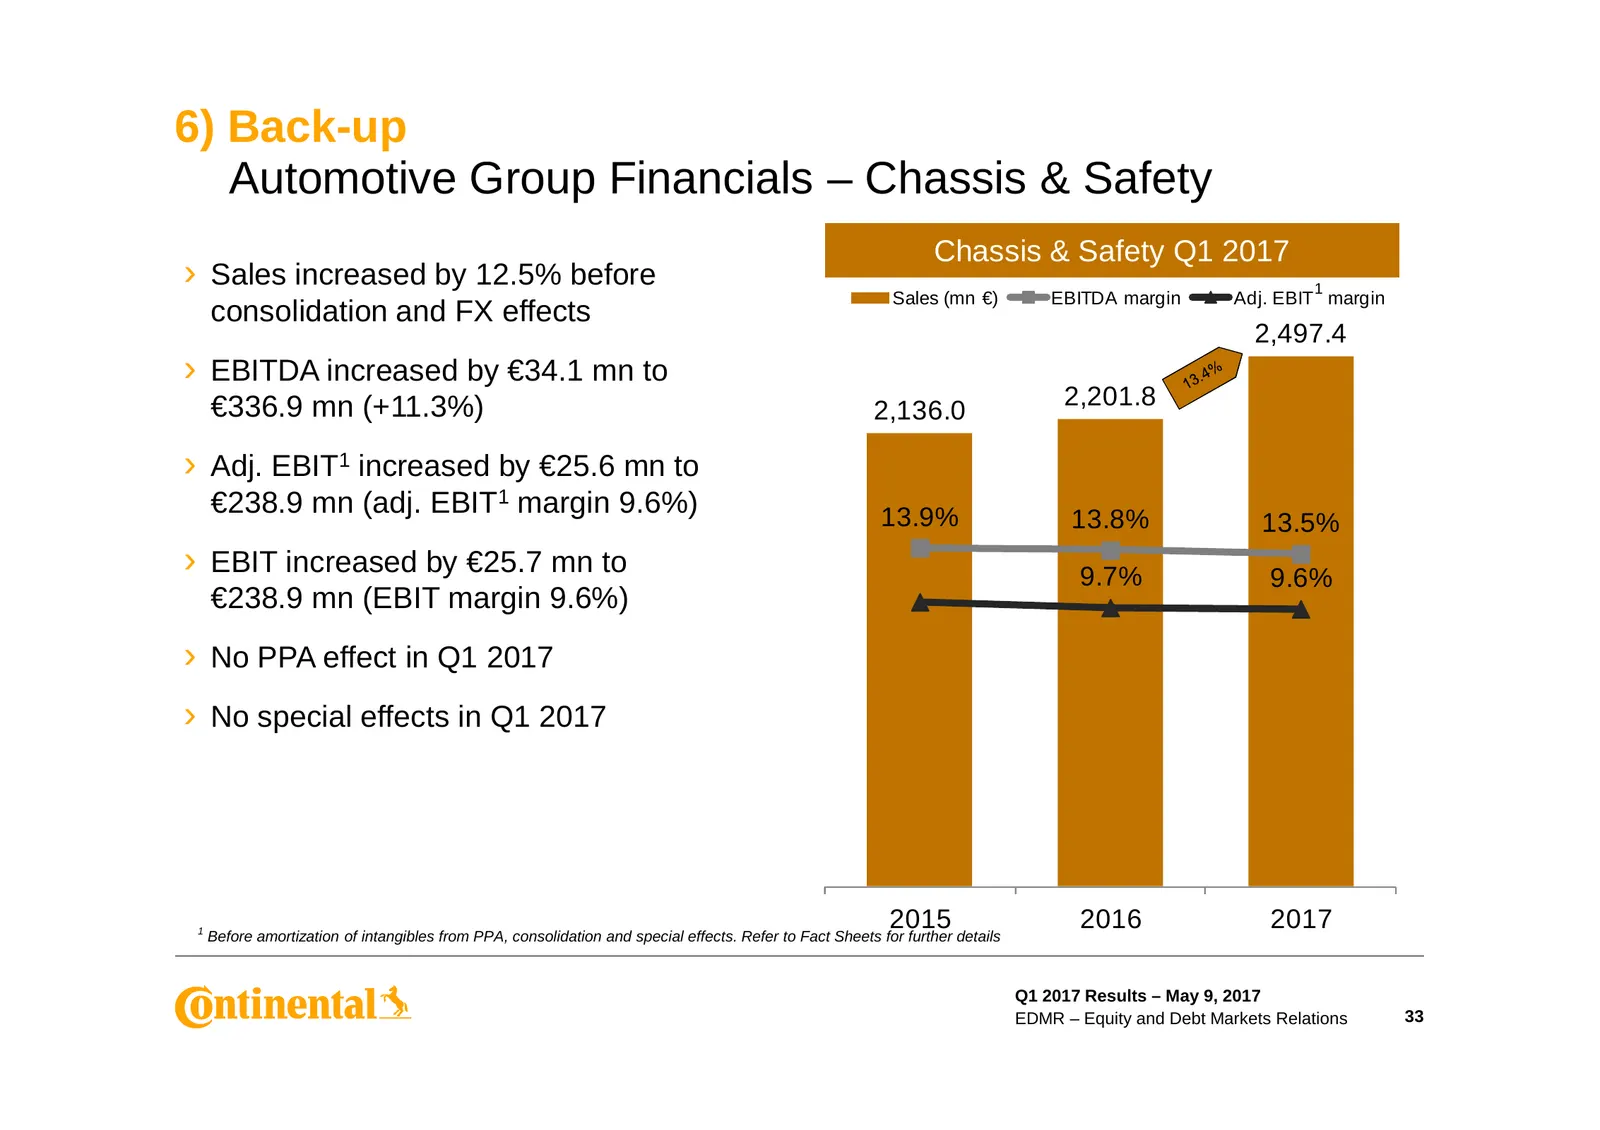
6) Back-up Automotive Group Financials – Chassis & Safety Chassis & Safety Q1 2017 › Sales increased by 12.5% before 1 Sales (mn €) EBITDA margin Adj. EBIT margin consolidation and FX effects 2,497.4 › EBITDA increased by €34.1 mn to €336.9 mn (+11.3%) 2,201.8 2,136.0 › Adj. EBIT1 increased by €25.6
Slide 34: Automotive Group Financials – Powertrain
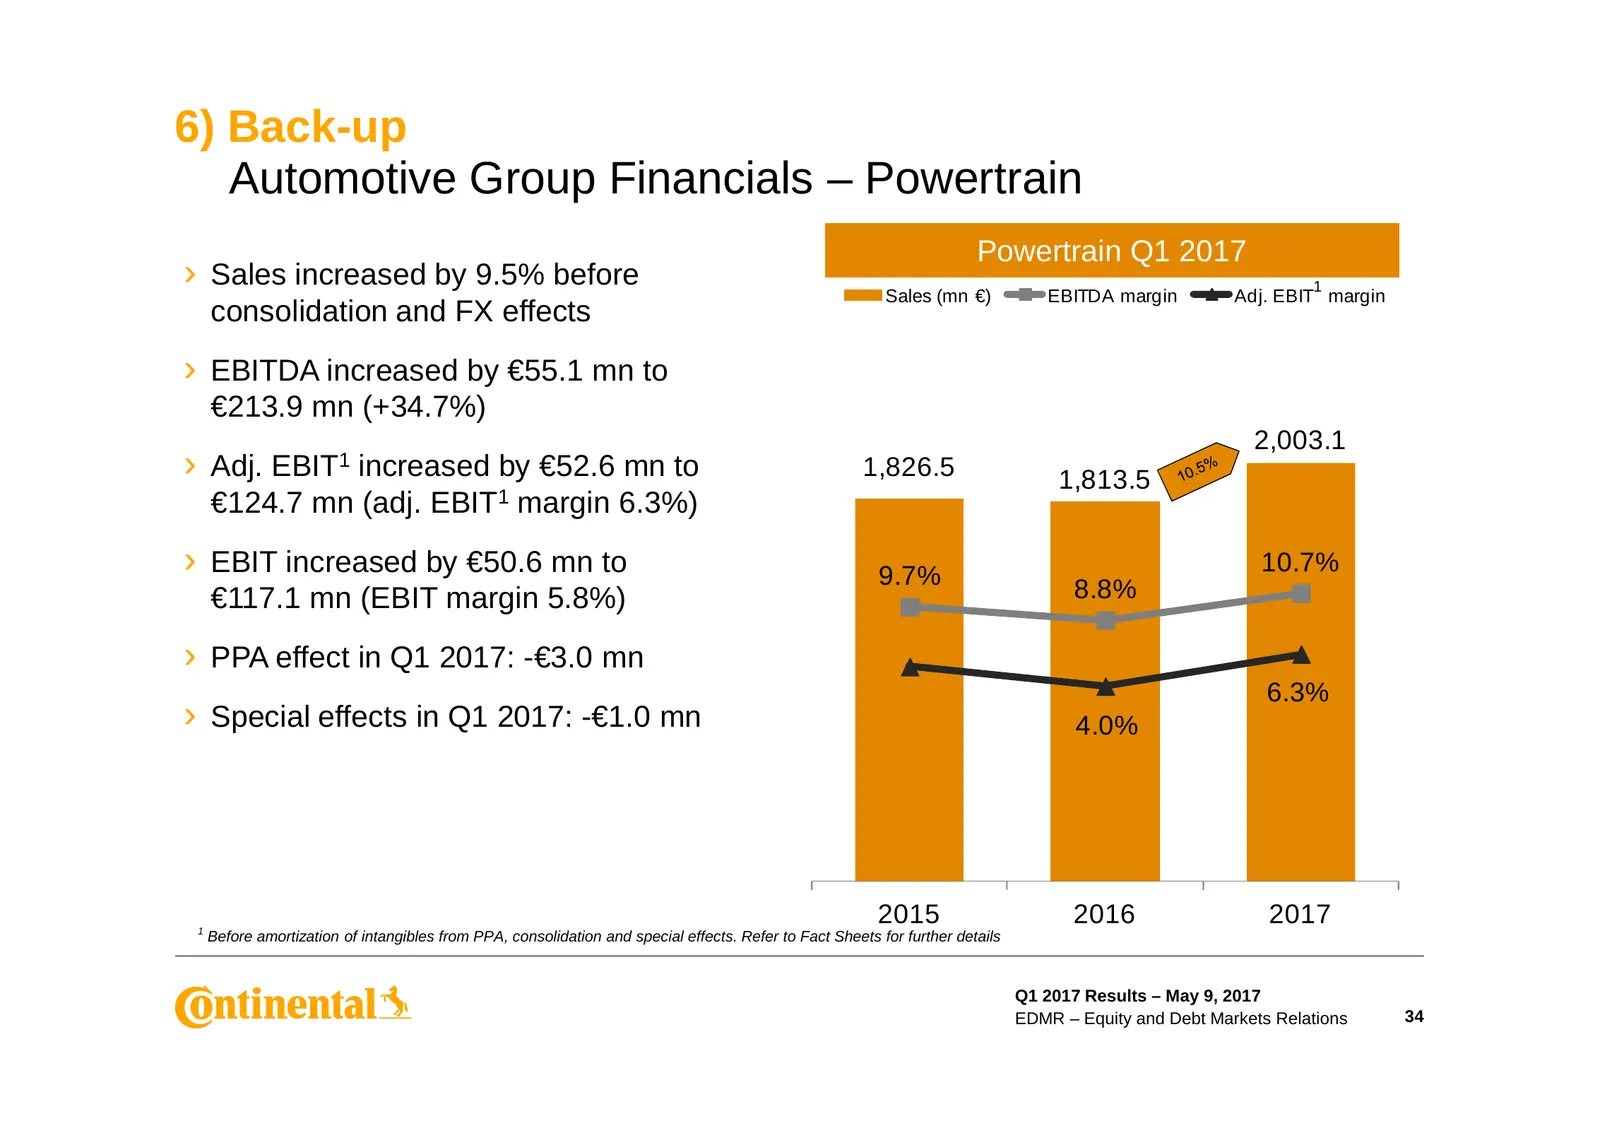
6) Back-up Automotive Group Financials – Powertrain Powertrain Q1 2017 › Sales increased by 9.5% before Sales (mn €) EBITDA margin 1 Adj. EBIT margin consolidation and FX effects › EBITDA increased by €55.1 mn to €213.9 mn (+34.7%) 2,003.1 › Adj. EBIT1 increased by €52.6 mn to 1,826.5 1,813.5 €124.7
Slide 35: Automotive Group Financials – Interior
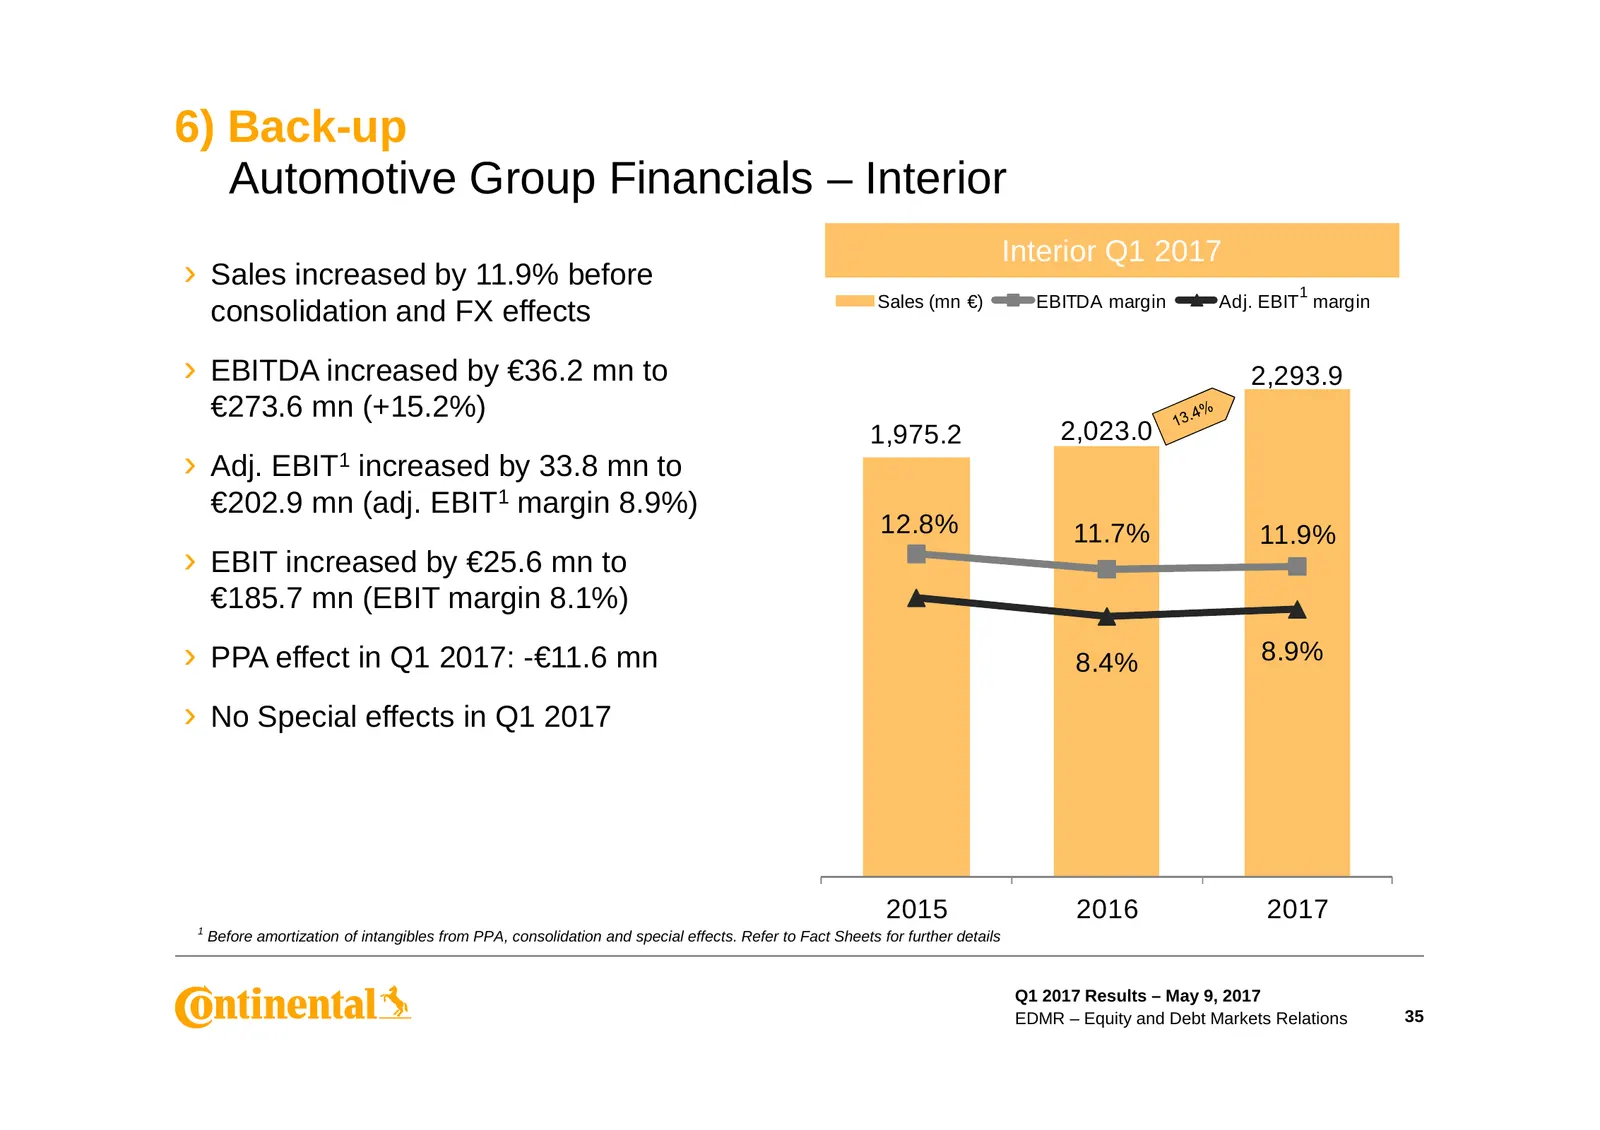
6) Back-up Automotive Group Financials – Interior Interior Q1 2017 › Sales increased by 11.9% before 1 Sales (mn €) EBITDA margin Adj. EBIT margin consolidation and FX effects › EBITDA increased by €36.2 mn to 2,293.9 €273.6 mn (+15.2%) 1,975.2 2,023.0 › Adj. EBIT1 increased by 33.8 mn to €202.9 mn
Slide 36: Rubber Group Financials – Tires
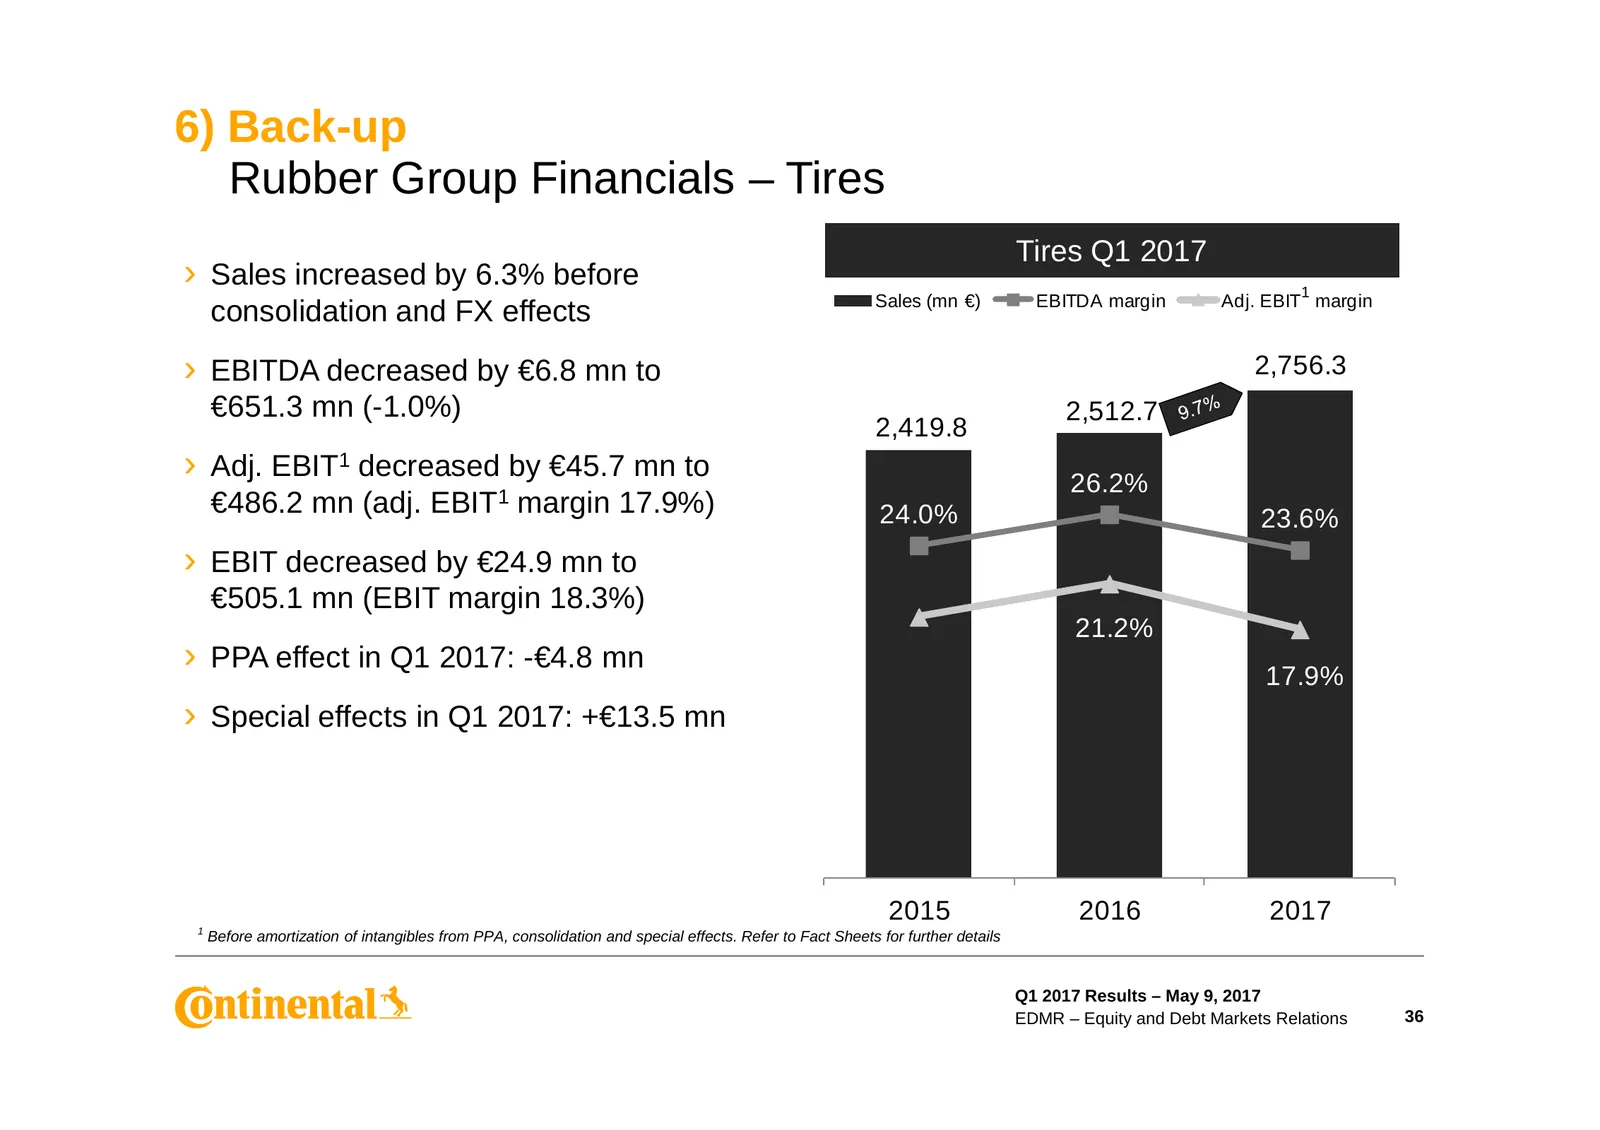
6) Back-up Rubber Group Financials – Tires Tires Q1 2017 › Sales increased by 6.3% before 1 Sales (mn €) EBITDA margin Adj. EBIT margin consolidation and FX effects › EBITDA decreased by €6.8 mn to 2,756.3 €651.3 mn (-1.0%) 2,512.7 2,419.8 › Adj. EBIT1 decreased by €45.7 mn to 26.2% €486.2 mn (adj.
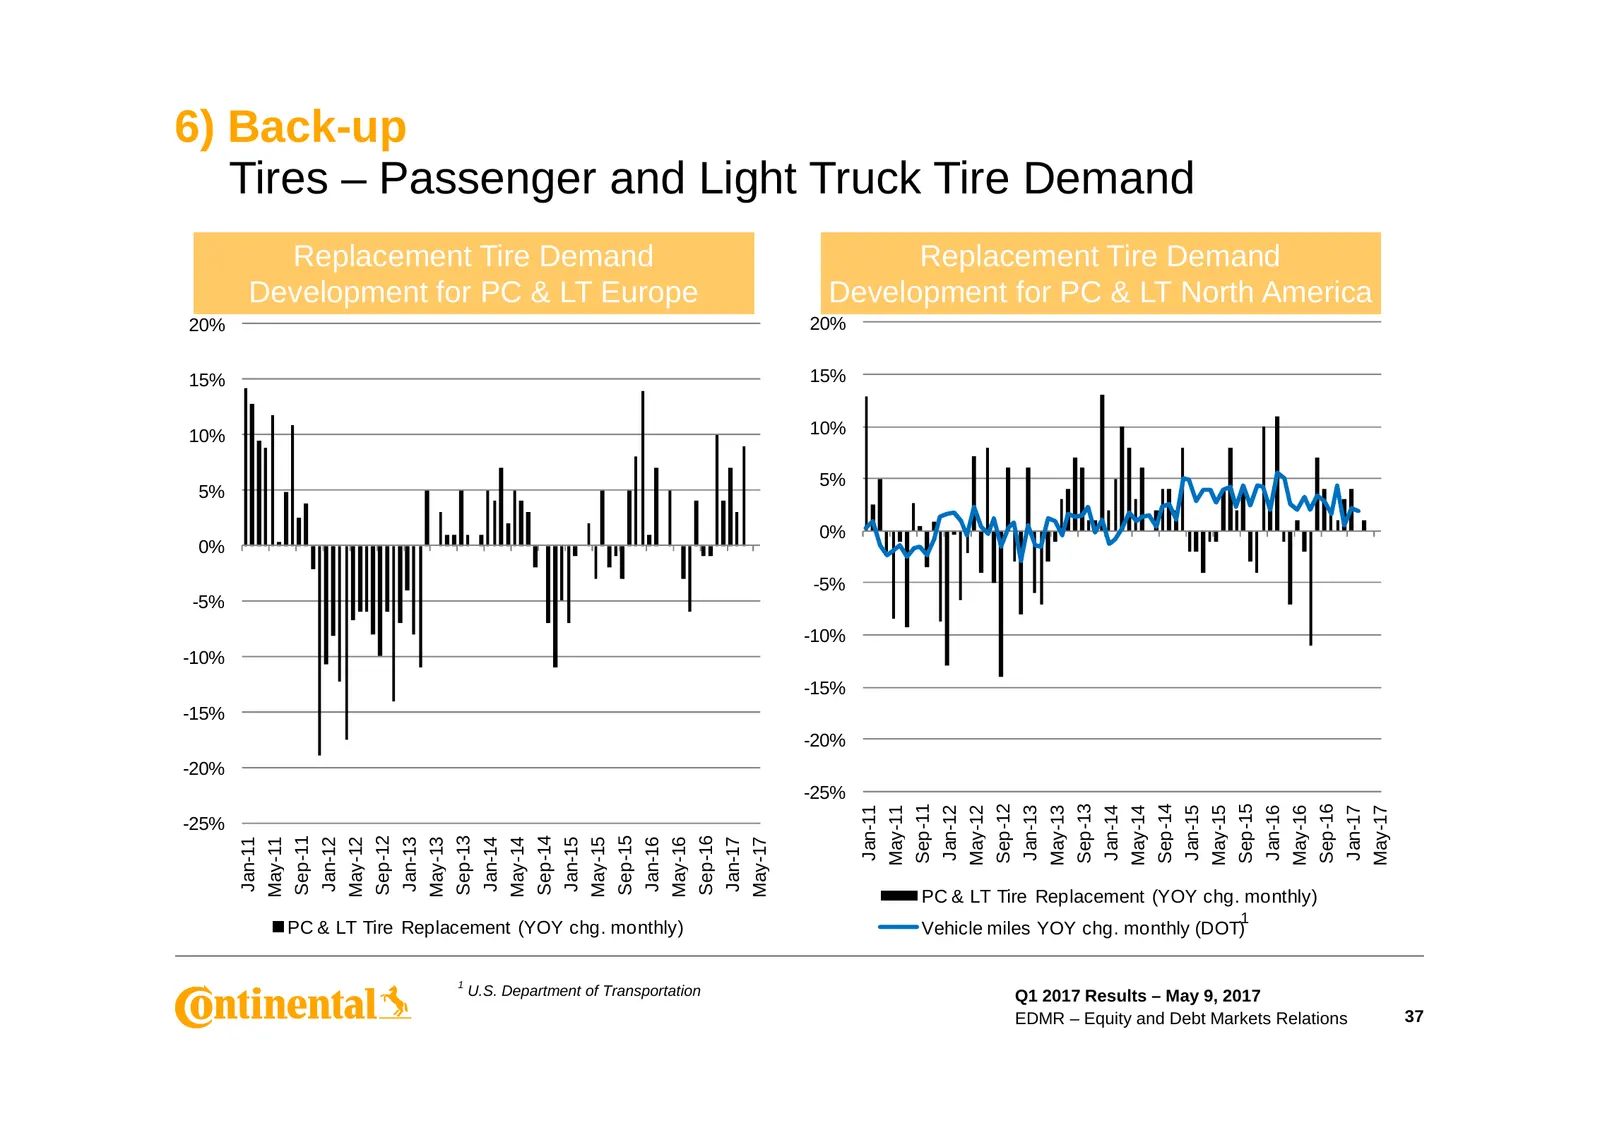
Slide 37: Tires – Passenger and Light Truck Tire Demand
6) Back-up Tires – Passenger and Light Truck Tire Demand Replacement Tire Demand Replacement Tire Demand Development for PC & LT Europe Development for PC & LT North America 20% 20% 15% 15% 10% 10% 5% 5% 0% 0% -5% -5% -10% -10% -15% -15% -20% -20% -25% Sep-11 Sep-12 Sep-13 Sep-14 Sep-15 Sep-16 May-1
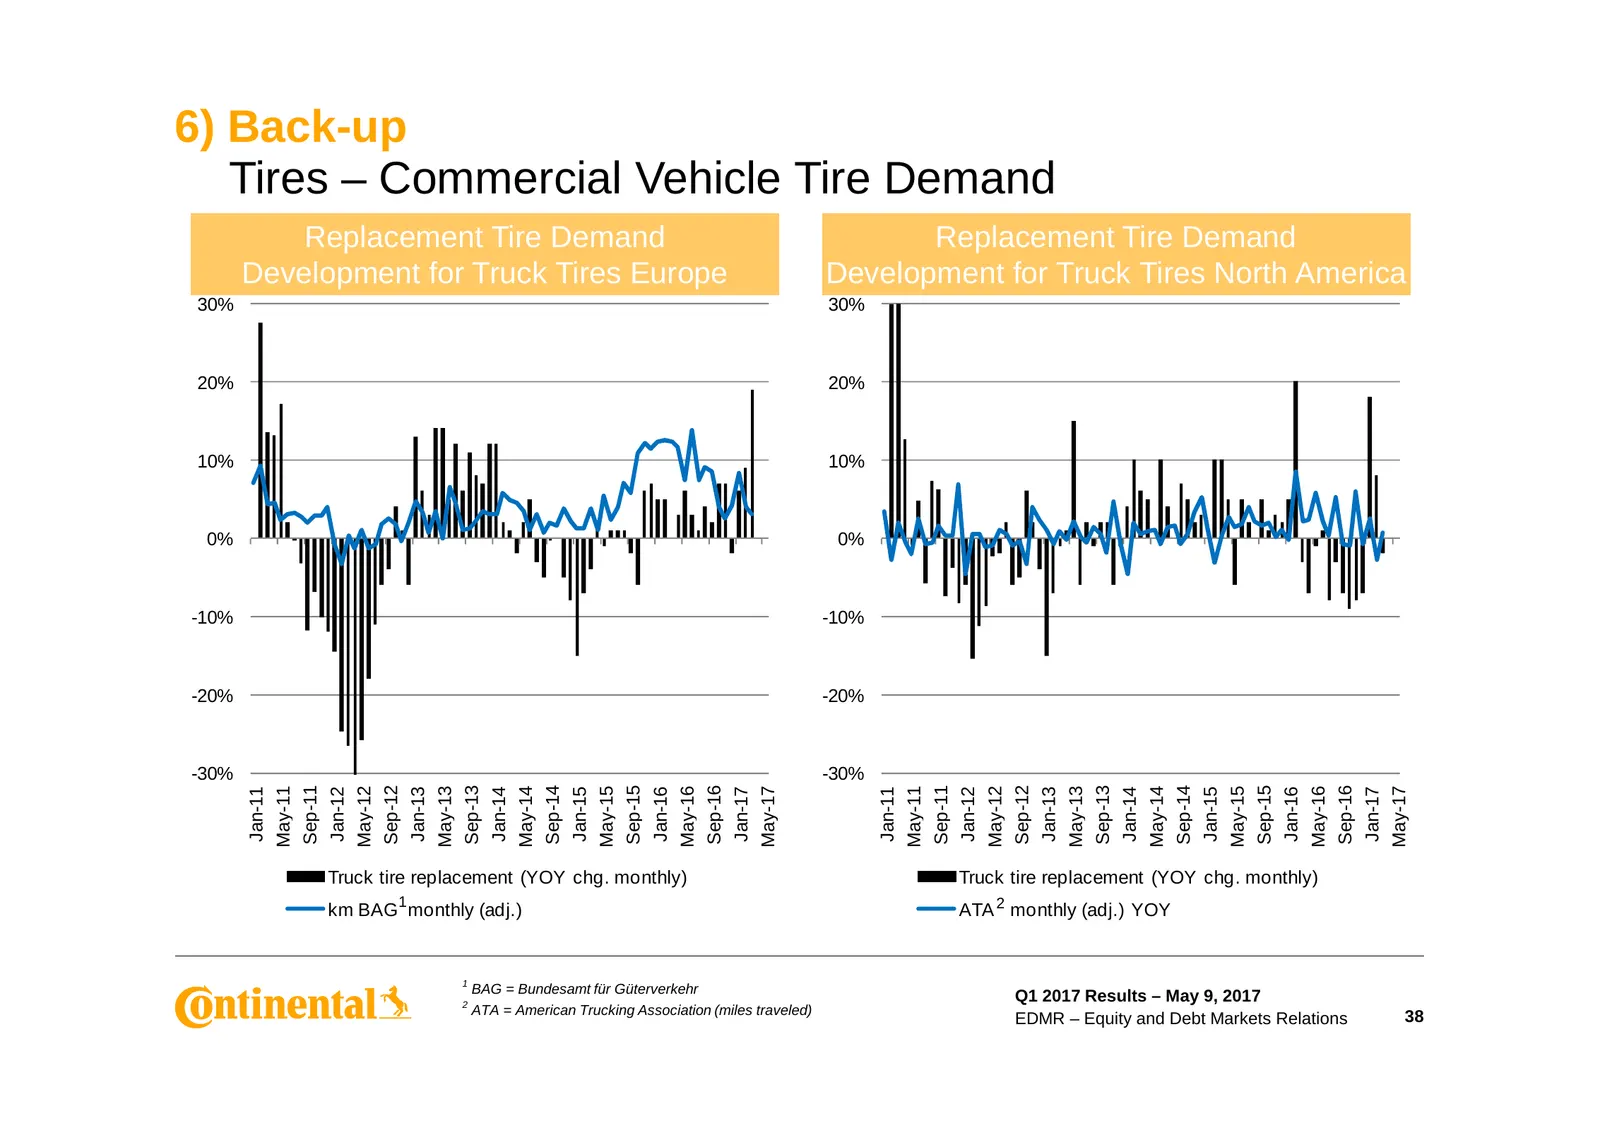
Slide 38: Tires – Commercial Vehicle Tire Demand
6) Back-up Tires – Commercial Vehicle Tire Demand Replacement Tire Demand Replacement Tire Demand Development for Truck Tires Europe Development for Truck Tires North America 30% 30% 20% 20% 10% 10% 0% 0% -10% -10% -20% -20% -30% -30% Sep-11 Sep-12 Sep-13 Sep-14 Sep-15 Sep-16 Sep-11 Sep-12 Sep-13 Se
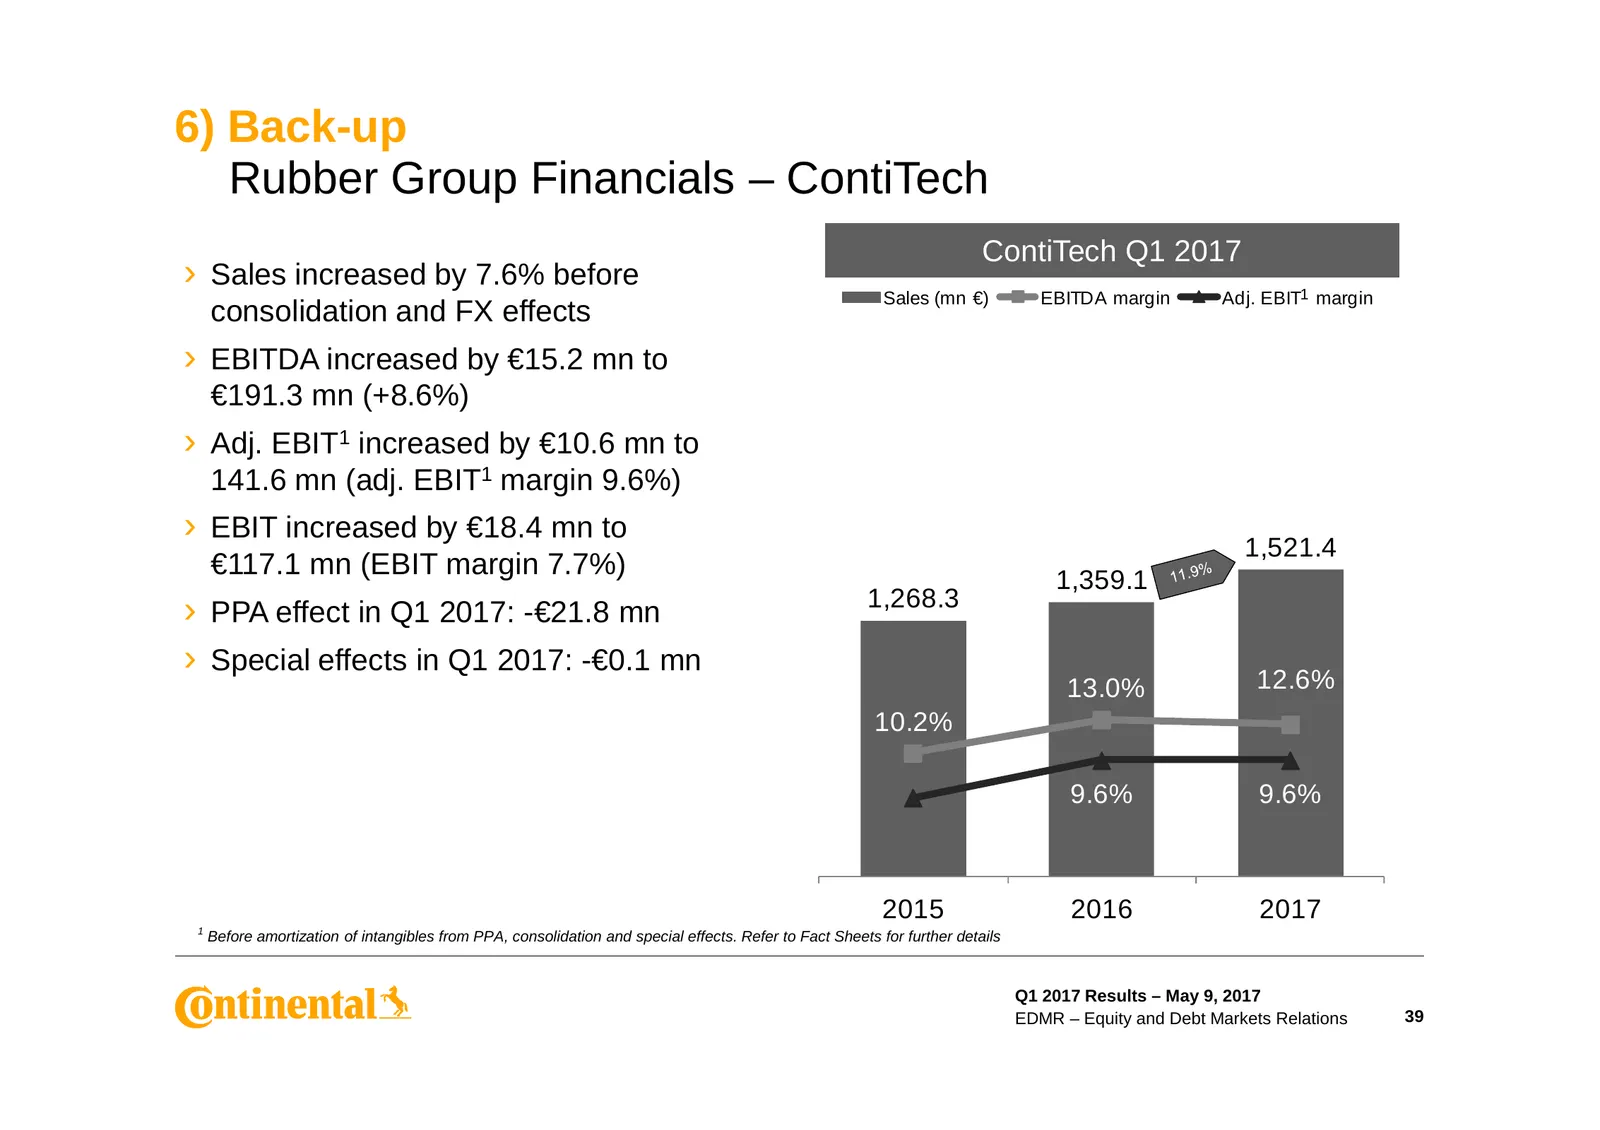
Slide 39: Rubber Group Financials – ContiTech
6) Back-up Rubber Group Financials – ContiTech ContiTech Q1 2017 › Sales increased by 7.6% before Sales (mn €) EBITDA margin Adj. EBIT1 margin consolidation and FX effects › EBITDA increased by €15.2 mn to €191.3 mn (+8.6%) › Adj. EBIT1 increased by €10.6 mn to 141.6 mn (adj. EBIT1 margin 9.6%) › EB
Slide 40: Fact Sheets 2015 – Q1 2017
Fact Sheets 2015 – Q1 2017 Q1 2017 Results – May 9, 2017 EDMR – Equity and Debt Markets Relations 40
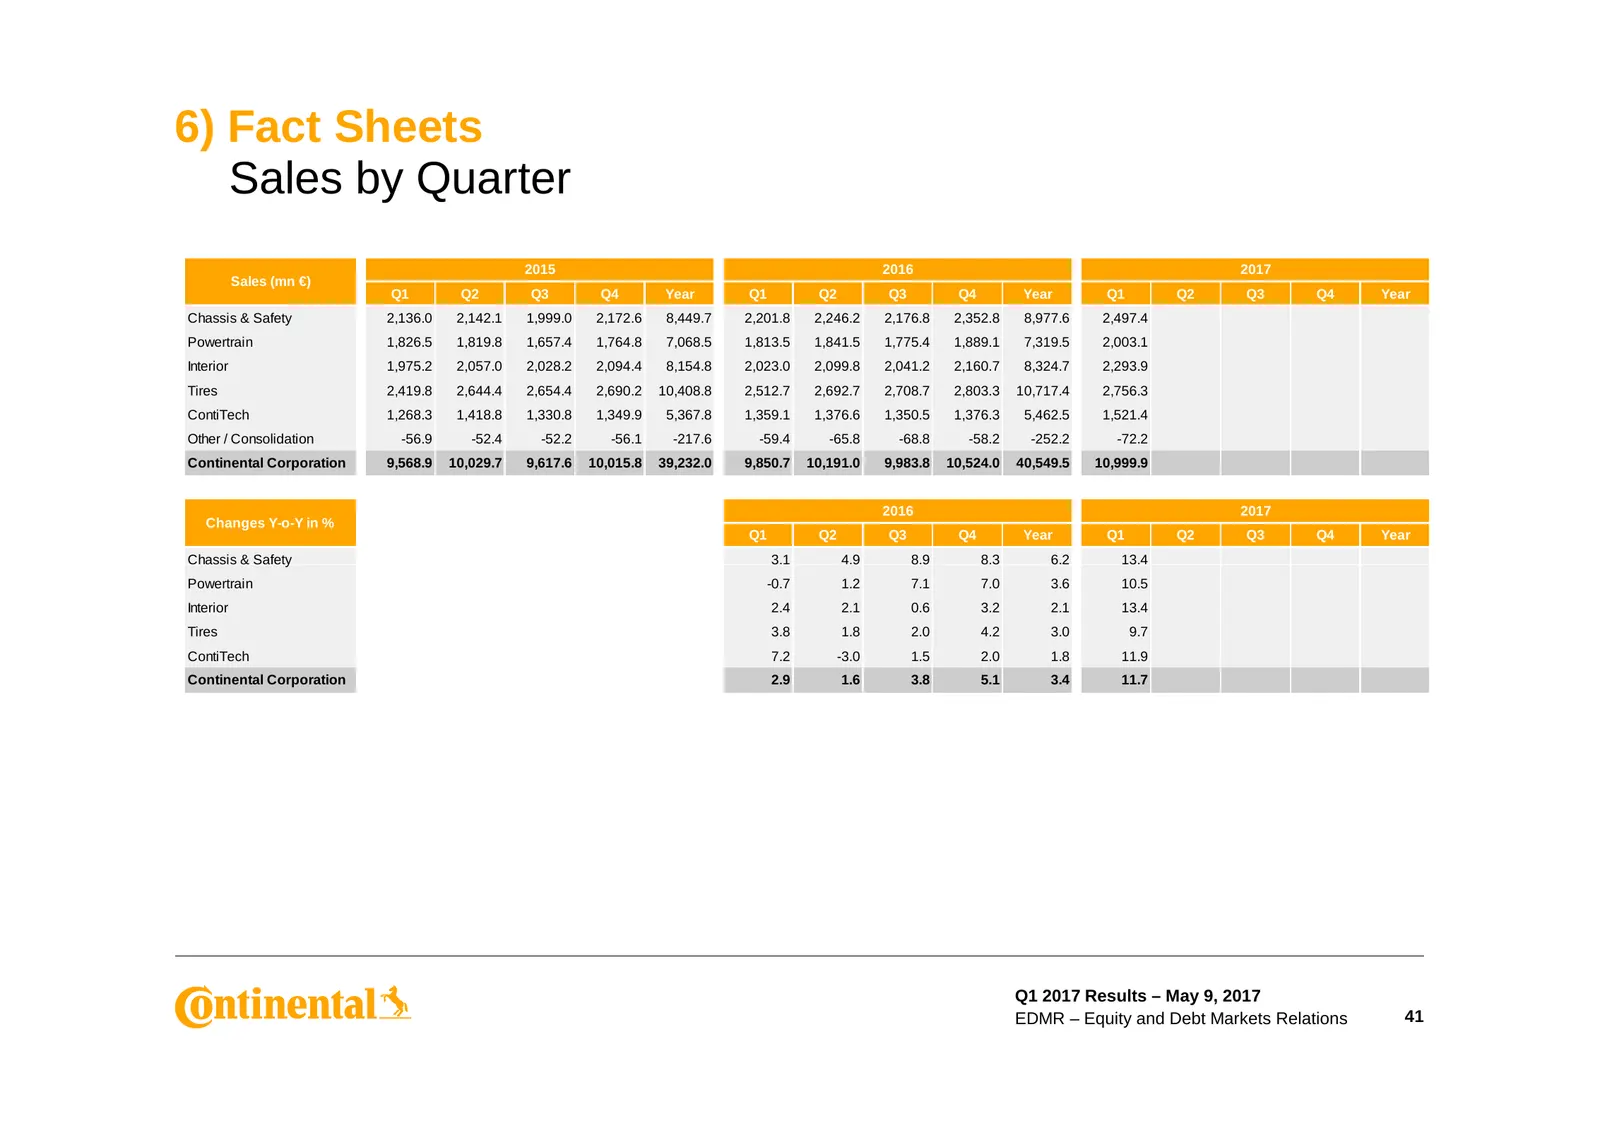
Slide 41: Sales by Quarter
6) Fact Sheets Sales by Quarter 2015 2016 2017 Sales (mn €) Q1 Q2 Q3 Q4 Year Q1 Q2 Q3 Q4 Year Q1 Q2 Q3 Q4 Year Chassis & Safety 2,136.0 2,142.1 1,999.0 2,172.6 8,449.7 2,201.8 2,246.2 2,176.8 2,352.8 8,977.6 2,497.4 Powertrain 1,826.5 1,819.8 1,657.4 1,764.8 7,068.5 1,813.5 1,841.5 1,775.4 1,889.1 7
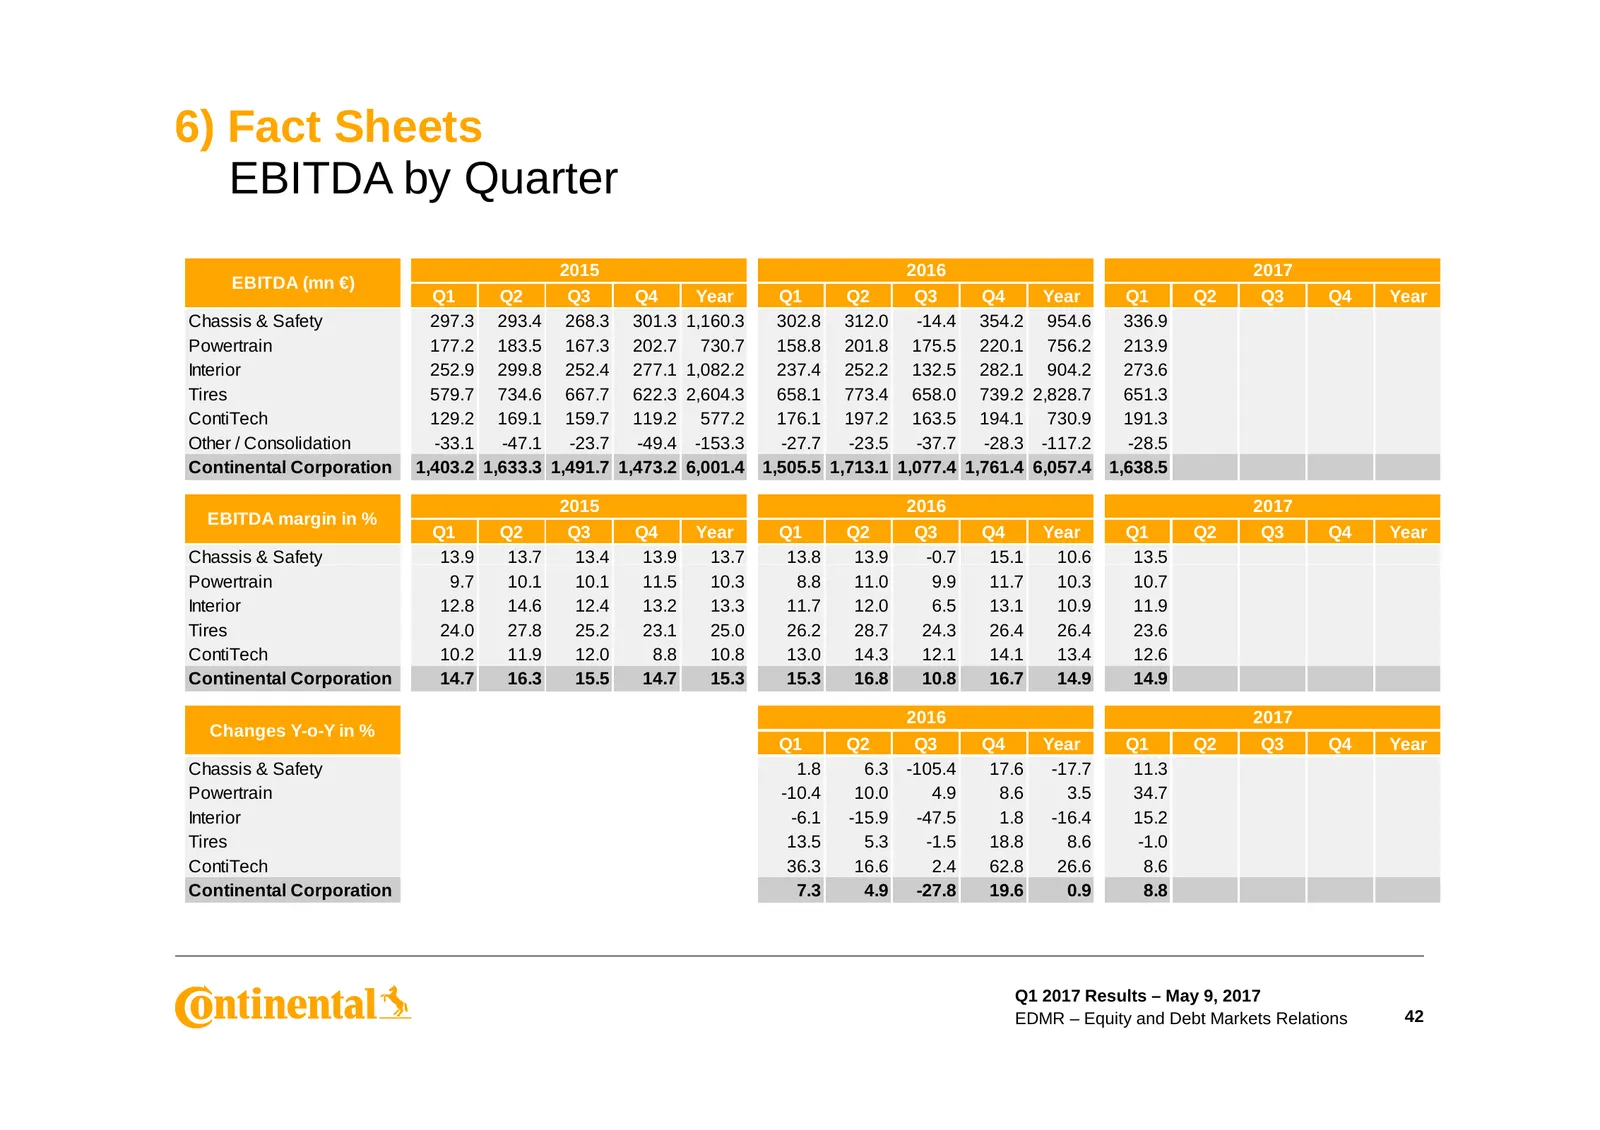
Slide 42: EBITDA by Quarter
6) Fact Sheets EBITDA by Quarter 2015 2016 2017 EBITDA (mn €) Q1 Q2 Q3 Q4 Year Q1 Q2 Q3 Q4 Year Q1 Q2 Q3 Q4 Year Chassis & Safety 297.3 293.4 268.3 301.3 1,160.3 302.8 312.0 -14.4 354.2 954.6 336.9 Powertrain 177.2 183.5 167.3 202.7 730.7 158.8 201.8 175.5 220.1 756.2 213.9 Interior 252.9 299.8 252.
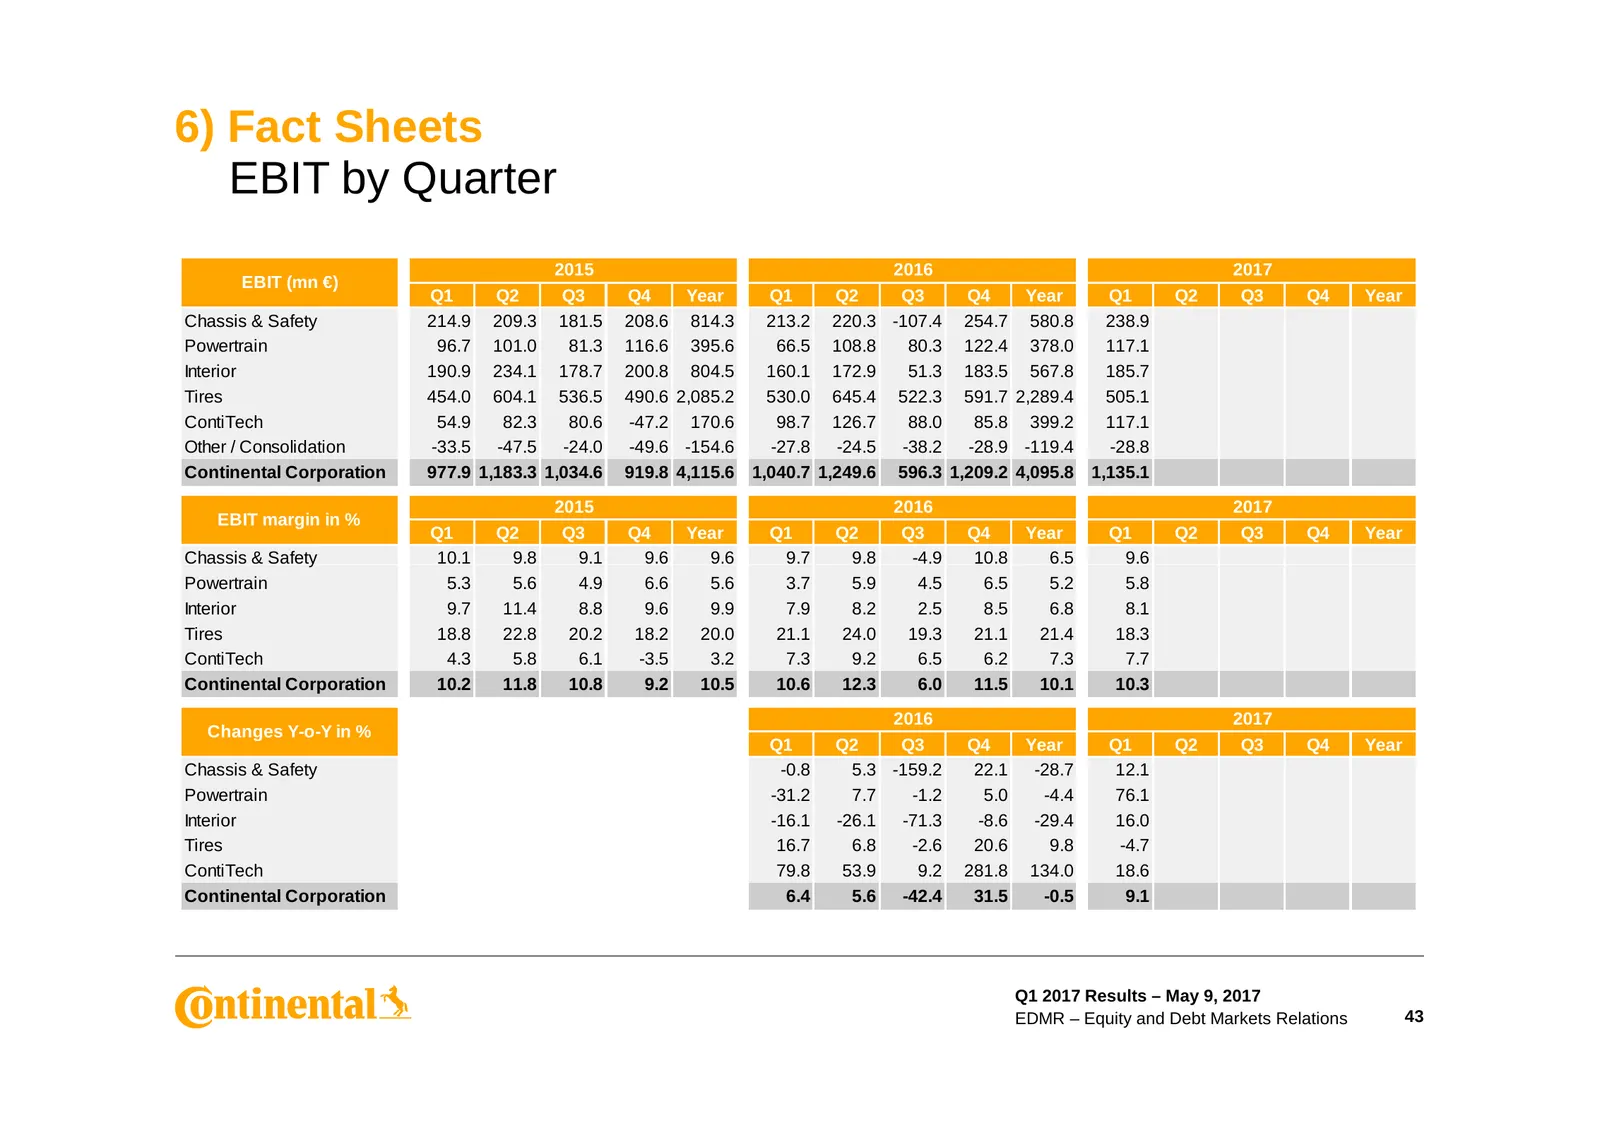
Slide 43: EBIT by Quarter
6) Fact Sheets EBIT by Quarter 2015 2016 2017 EBIT (mn €) Q1 Q2 Q3 Q4 Year Q1 Q2 Q3 Q4 Year Q1 Q2 Q3 Q4 Year Chassis & Safety 214.9 209.3 181.5 208.6 814.3 213.2 220.3 -107.4 254.7 580.8 238.9 Powertrain 96.7 101.0 81.3 116.6 395.6 66.5 108.8 80.3 122.4 378.0 117.1 Interior 190.9 234.1 178.7 200.8 8
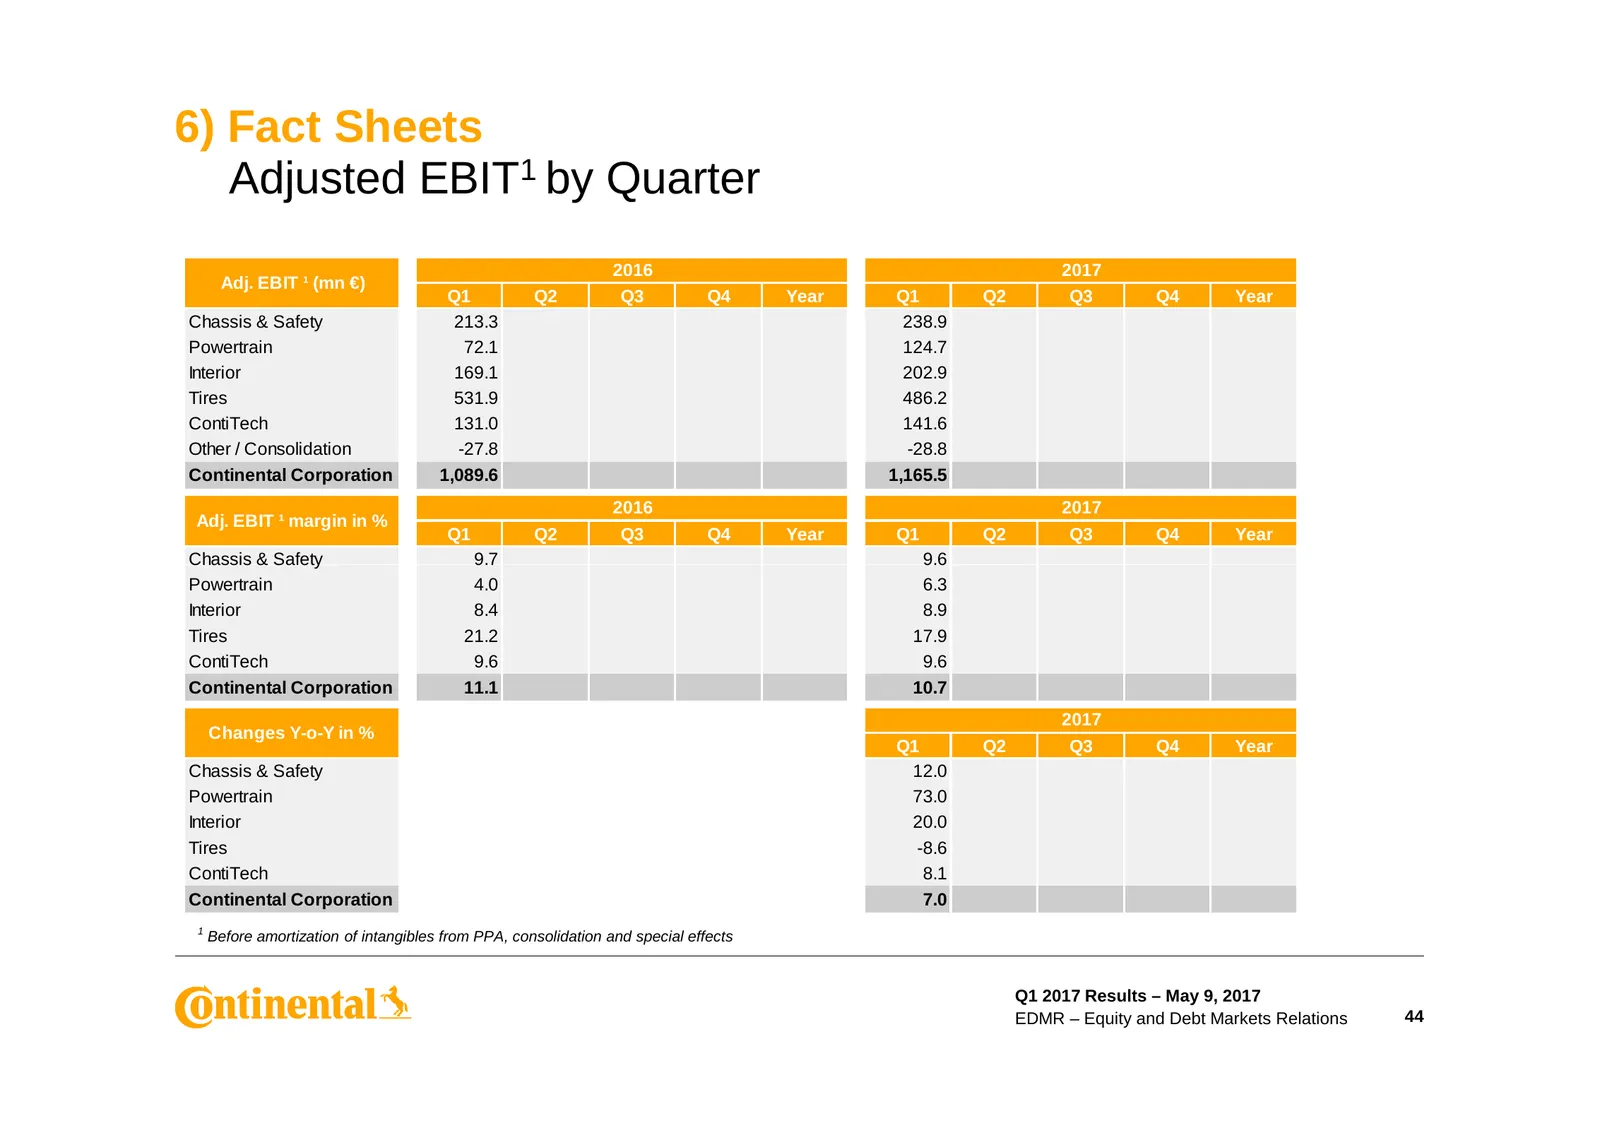
Slide 44: Adjusted EBIT by Quarter
6) Fact Sheets Adjusted EBIT1 by Quarter 2016 2017 Adj. EBIT ¹ (mn €) Q1 Q2 Q3 Q4 Year Q1 Q2 Q3 Q4 Year Chassis & Safety 213.3 238.9 Powertrain 72.1 124.7 Interior 169.1 202.9 Tires 531.9 486.2 ContiTech 131.0 141.6 Other / Consolidation -27.8 -28.8 Continental Corporation 1,089.6 1,165.5 2016 2017
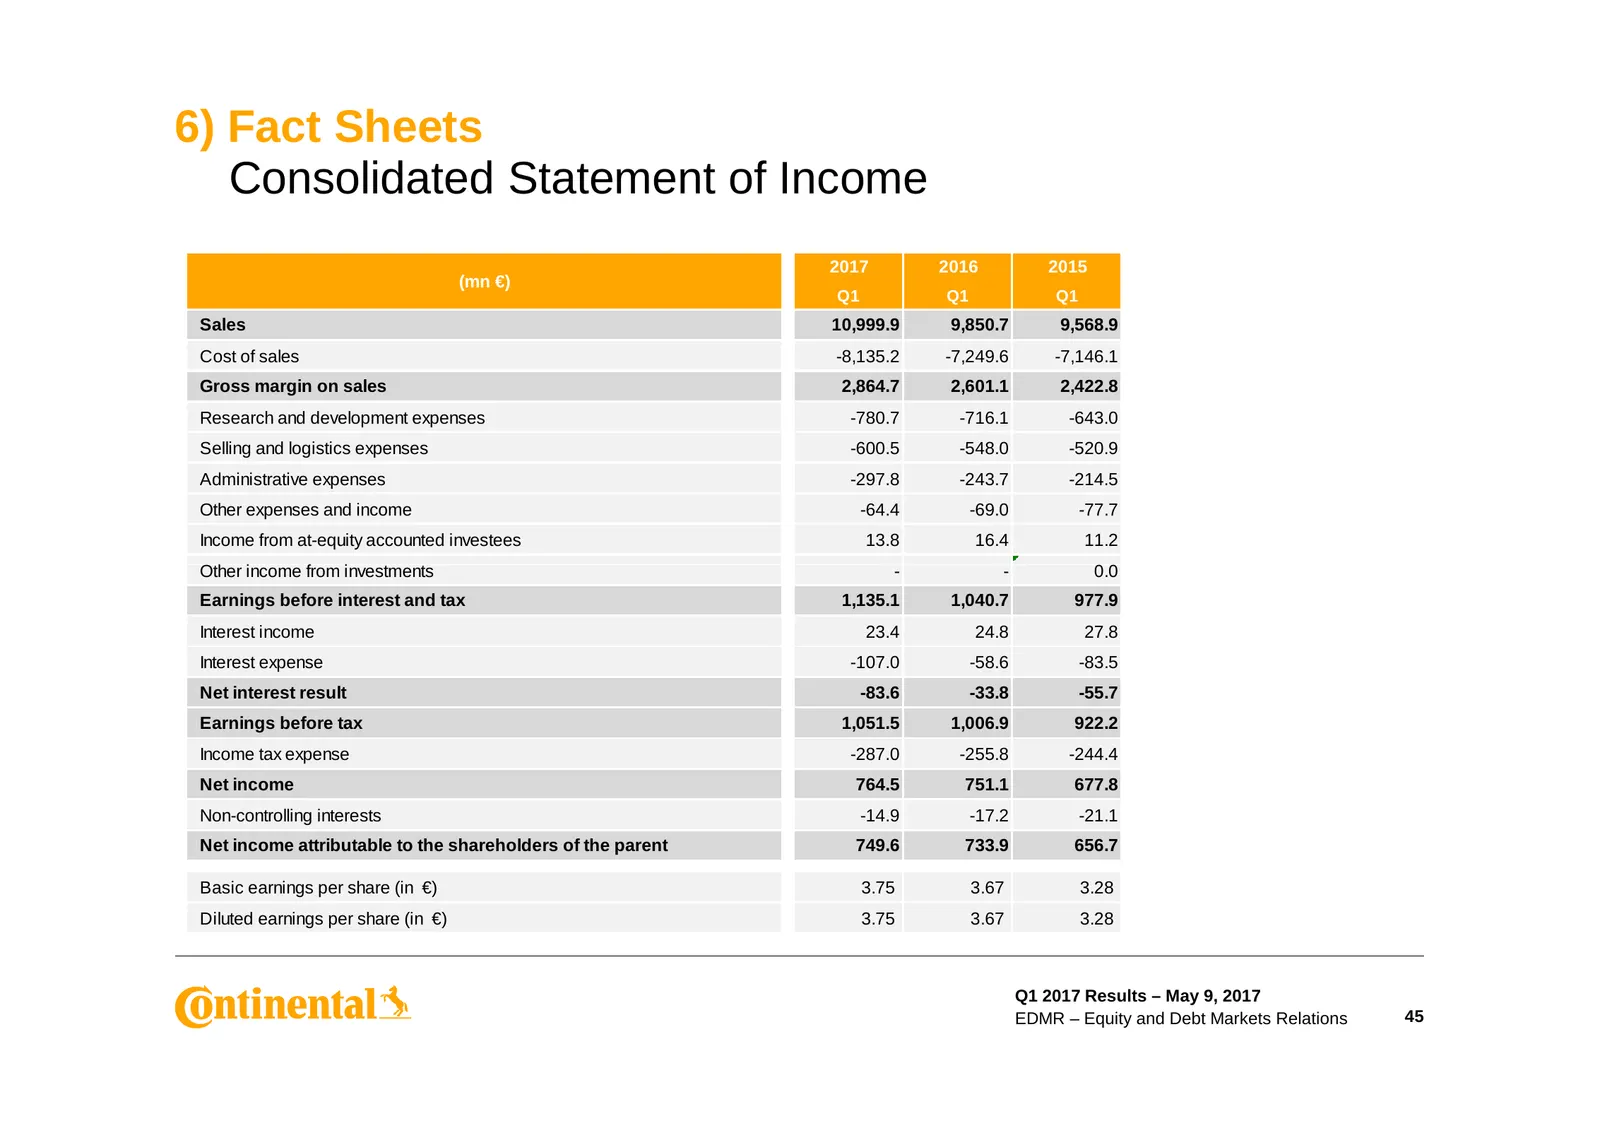
Slide 45: Consolidated Statement of Income
6) Fact Sheets Consolidated Statement of Income 2017 2016 2015 (mn €) Q1 Q1 Q1 Sales 10,999.9 9,850.7 9,568.9 Cost of sales -8,135.2 -7,249.6 -7,146.1 Gross margin on sales 2,864.7 2,601.1 2,422.8 Research and development expenses -780.7 -716.1 -643.0 Selling and logistics expenses -600.5 -548.0 -52
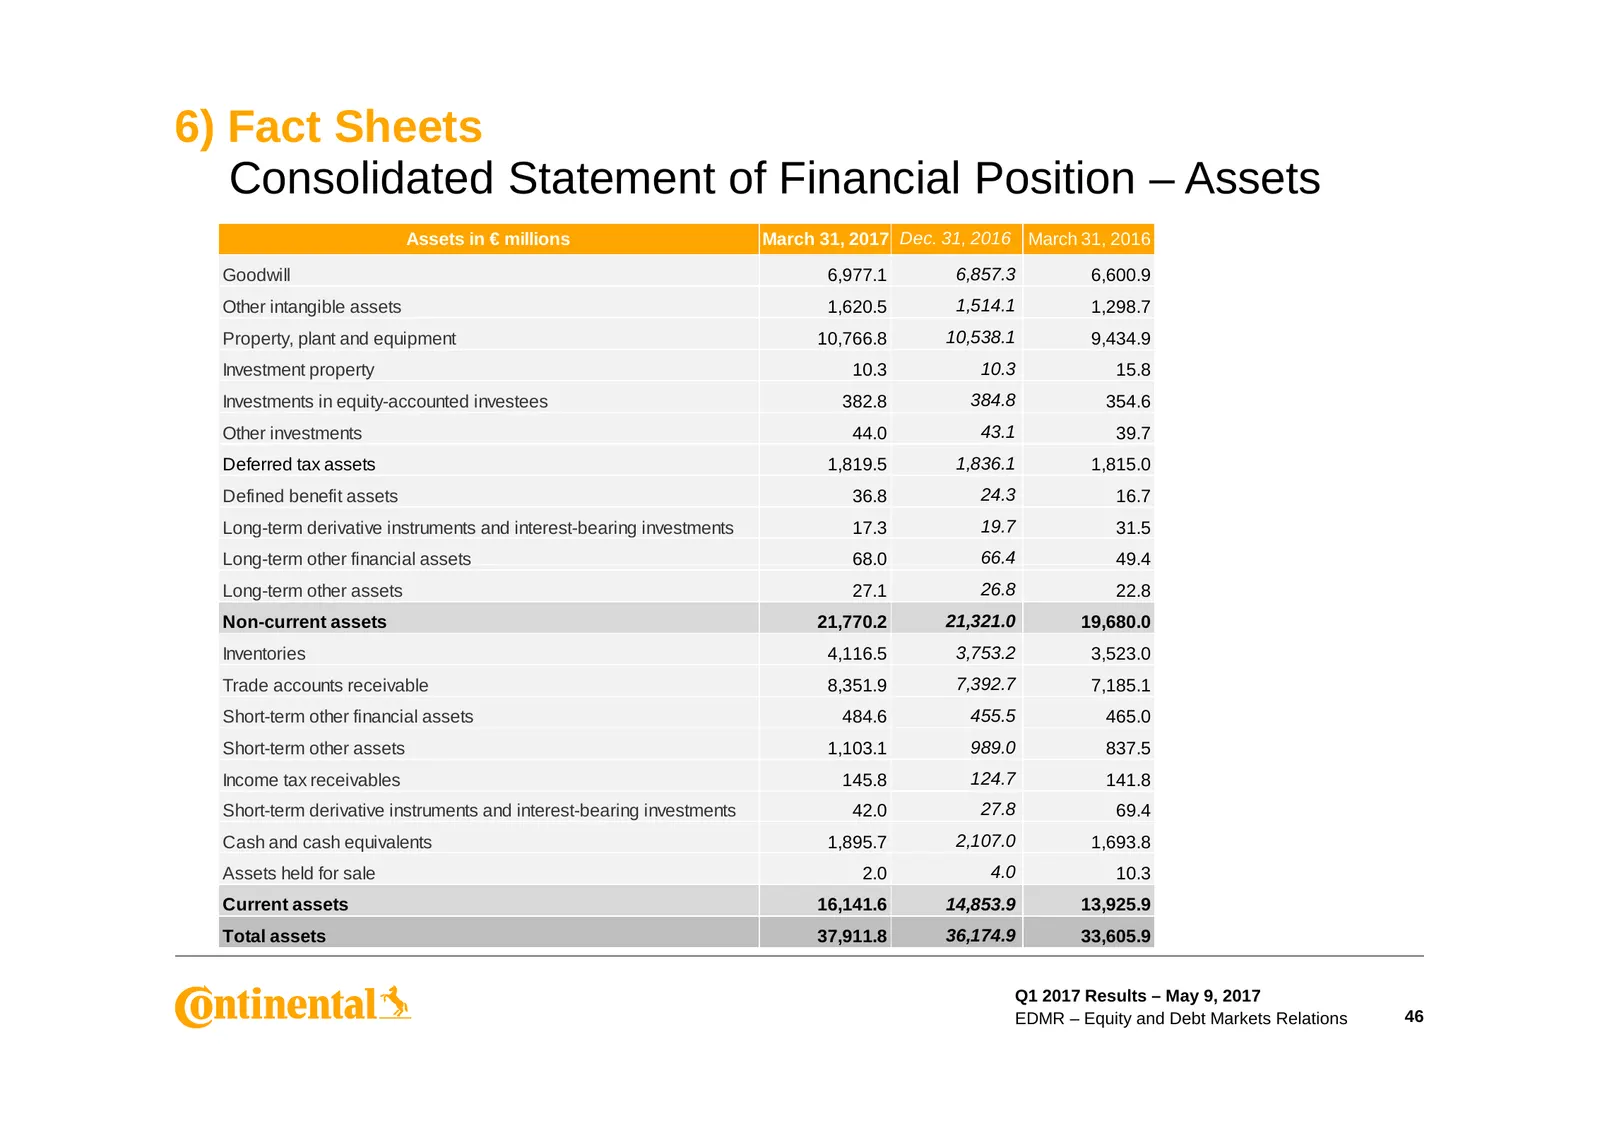
Slide 46: Consolidated Statement of Financial Position – Assets
6) Fact Sheets Consolidated Statement of Financial Position – Assets Assets in € millions March 31, 2017 Dec. 31, 2016 March 31, 2016 Goodwill 6,977.1 6,857.3 6,600.9 Other intangible assets 1,620.5 1,514.1 1,298.7 Property, plant and equipment 10,766.8 10,538.1 9,434.9 Investment property 10.3 10.3
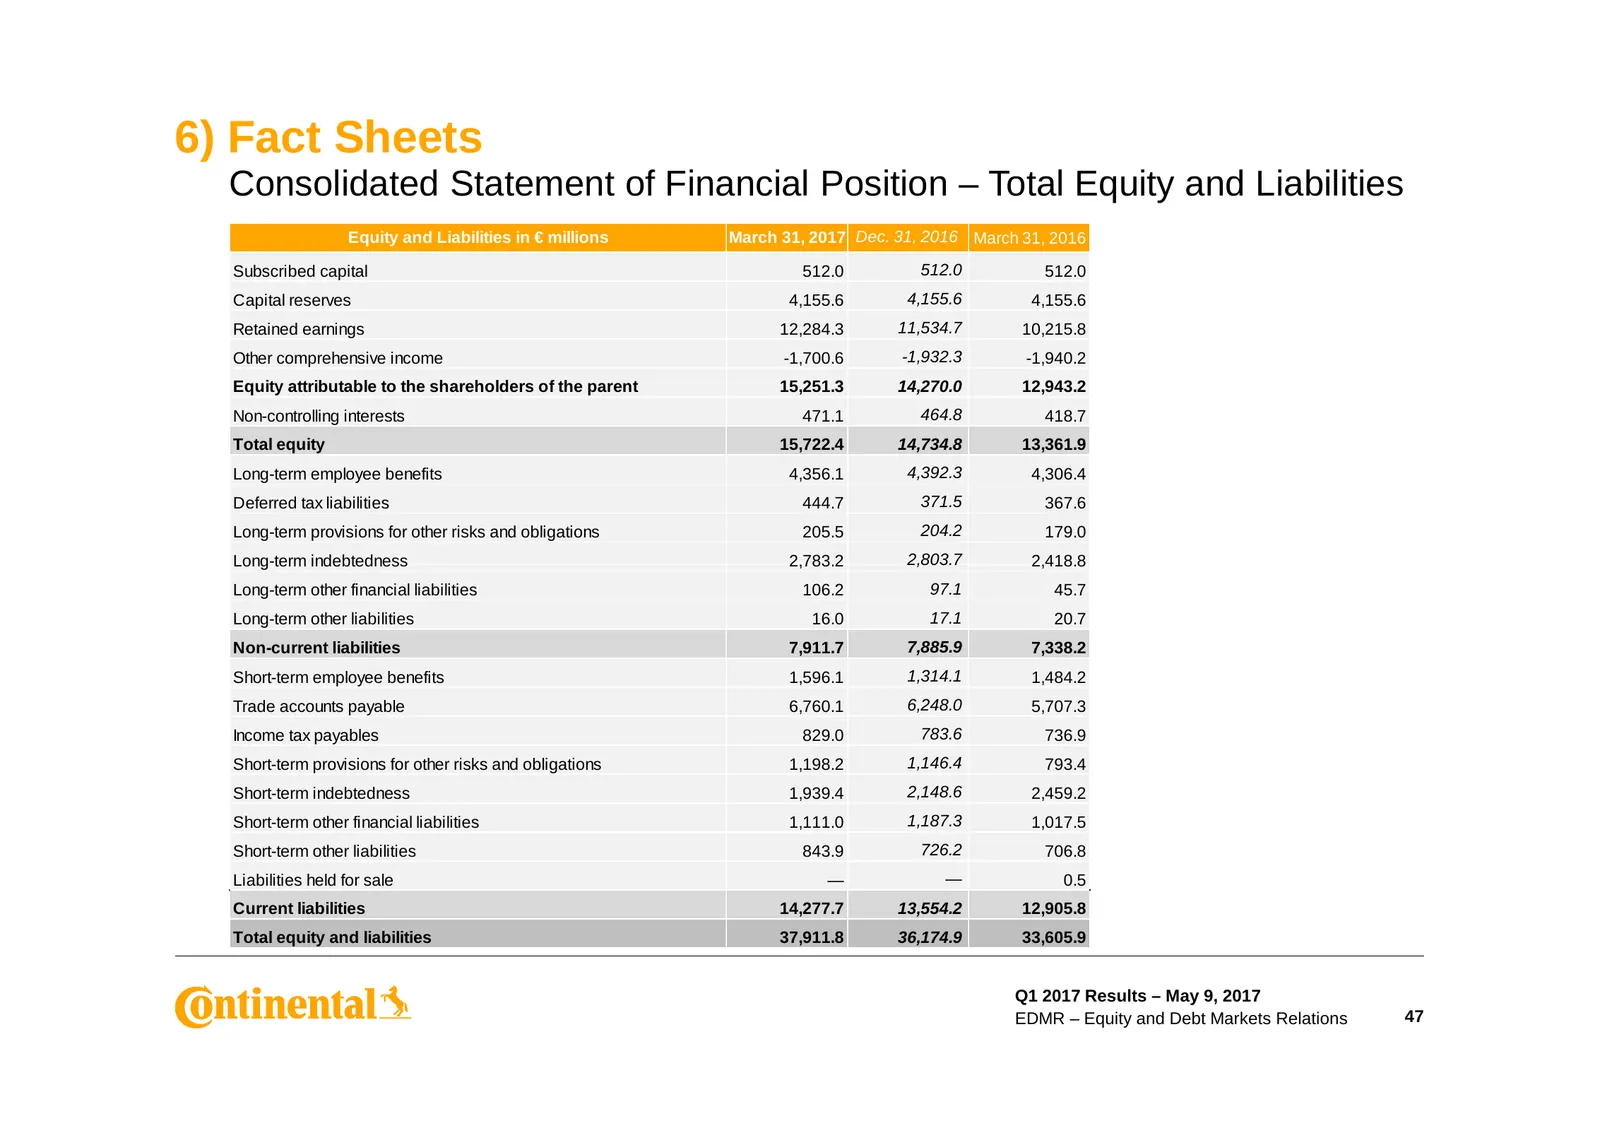
Slide 47: Consolidated Statement of Financial Position – Equity and Liabilities
6) Fact Sheets Consolidated Statement of Financial Position – Total Equity and Liabilities Equity and Liabilities in € millions March 31, 2017 Dec. 31, 2016 March 31, 2016 Subscribed capital 512.0 512.0 512.0 Capital reserves 4,155.6 4,155.6 4,155.6 Retained earnings 12,284.3 11,534.7 10,215.8 Other
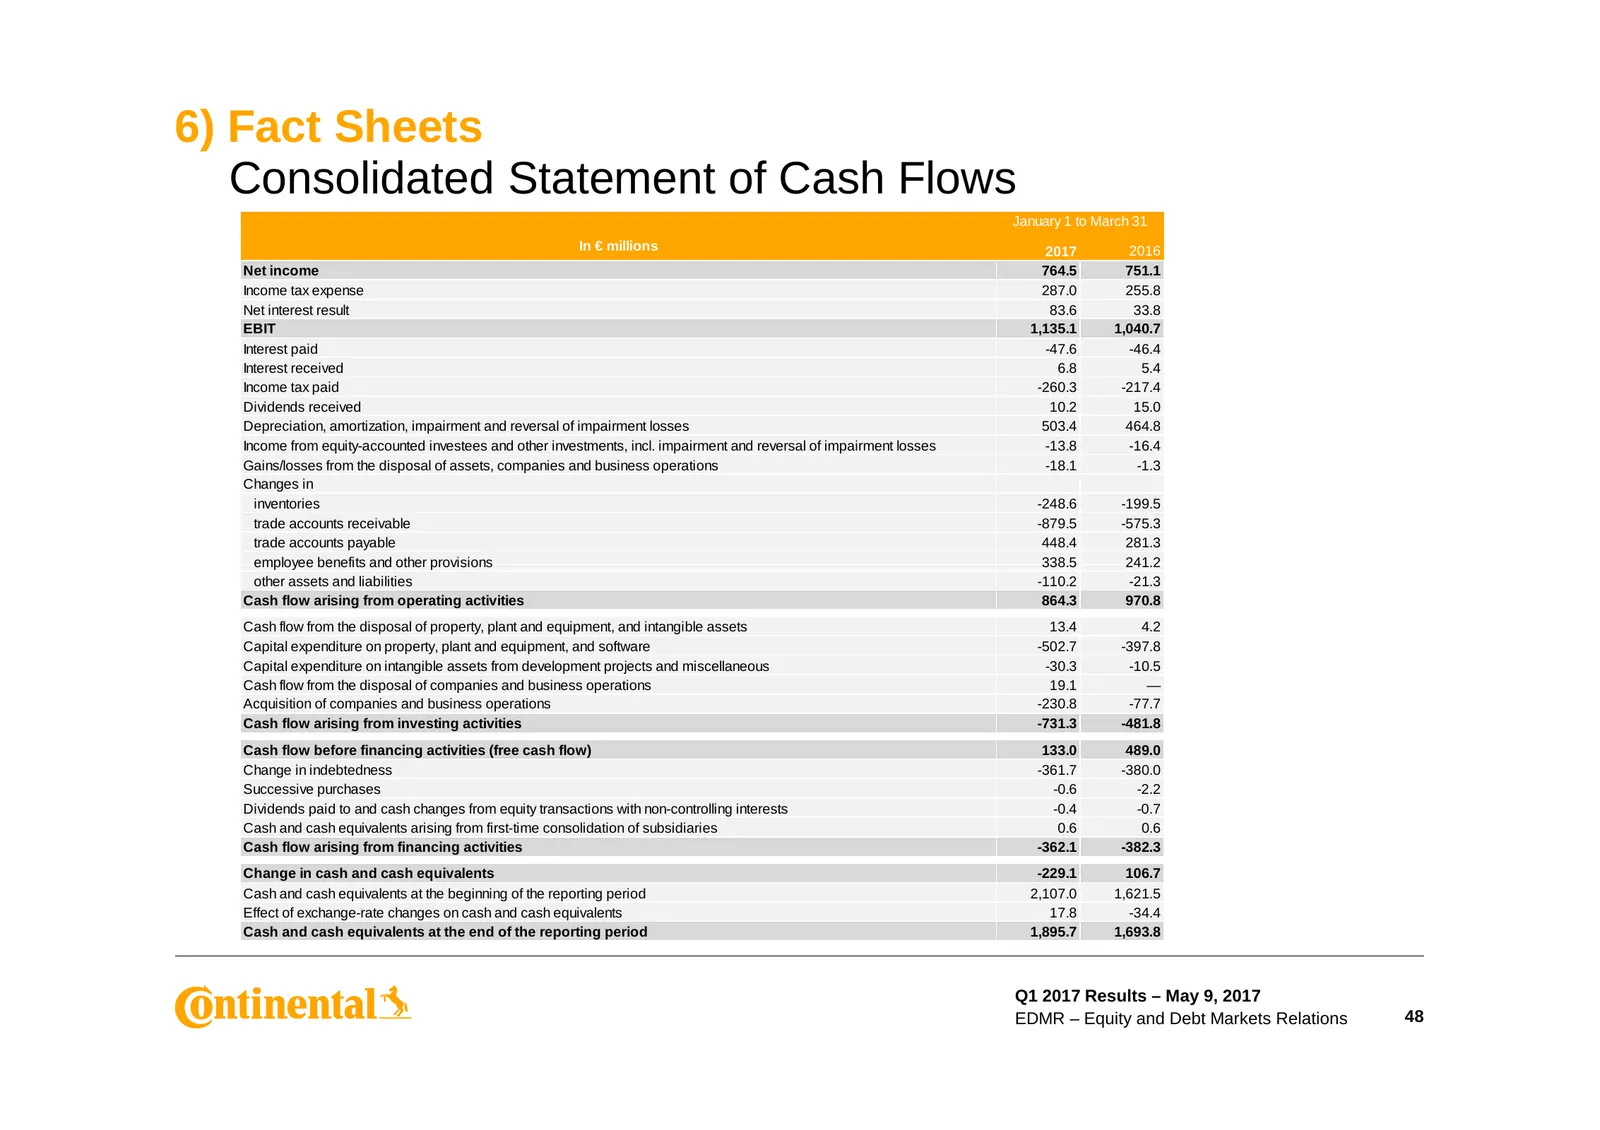
Slide 48: Consolidated Statement of Cash Flows
6) Fact Sheets Consolidated Statement of Cash Flows 1 January 1 to March 31 In € millions 2017 2016 Net income 764.5 751.1 Income tax expense 287.0 255.8 Net interest result 83.6 33.8 EBIT 1,135.1 1,040.7 Interest paid -47.6 -46.4 Interest received 6.8 5.4 Income tax paid -260.3 -217.4 Dividends rec
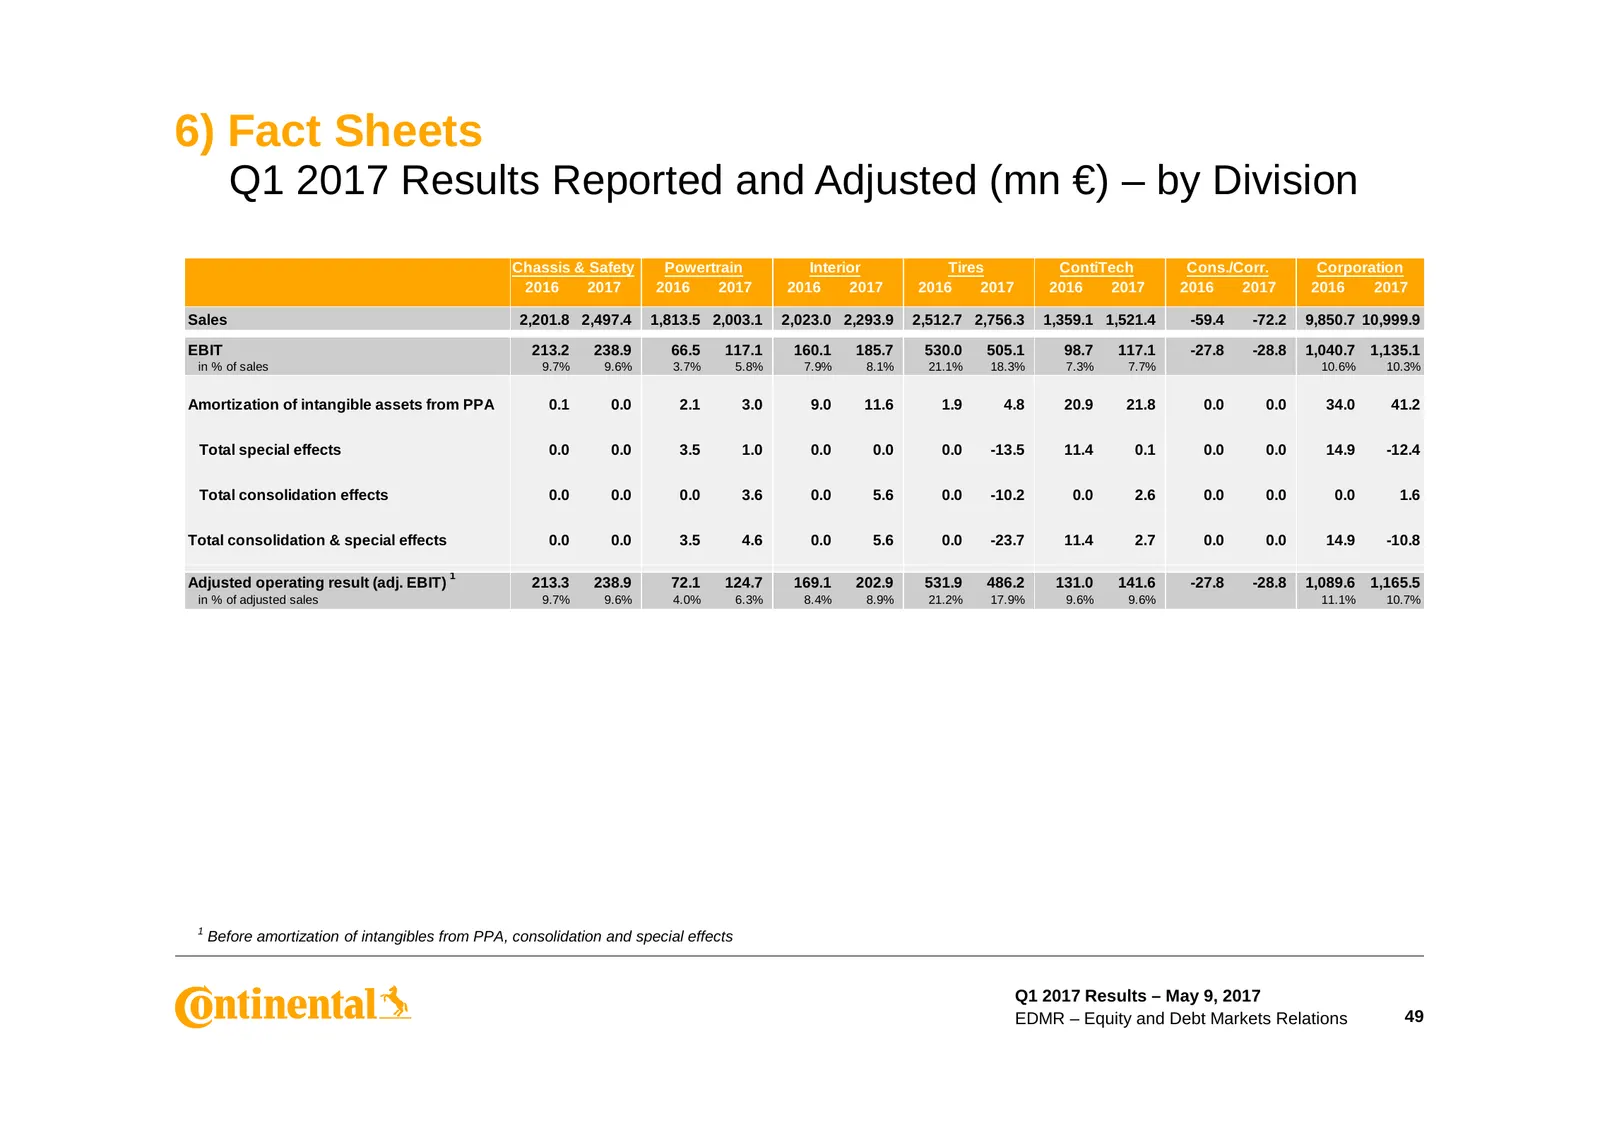
Slide 49: Q1 2017 Results Reported and Adjusted – by Division
6) Fact Sheets Q1 2017 Results Reported and Adjusted (mn €) – by Division Chassis & Safety Powertrain Interior Tires ContiTech Cons./Corr. Corporation 2016 2017 2016 2017 2016 2017 2016 2017 2016 2017 2016 2017 2016 2017 Sales 2,201.8 2,497.4 1,813.5 2,003.1 2,023.0 2,293.9 2,512.7 2,756.3 1,359.1 1
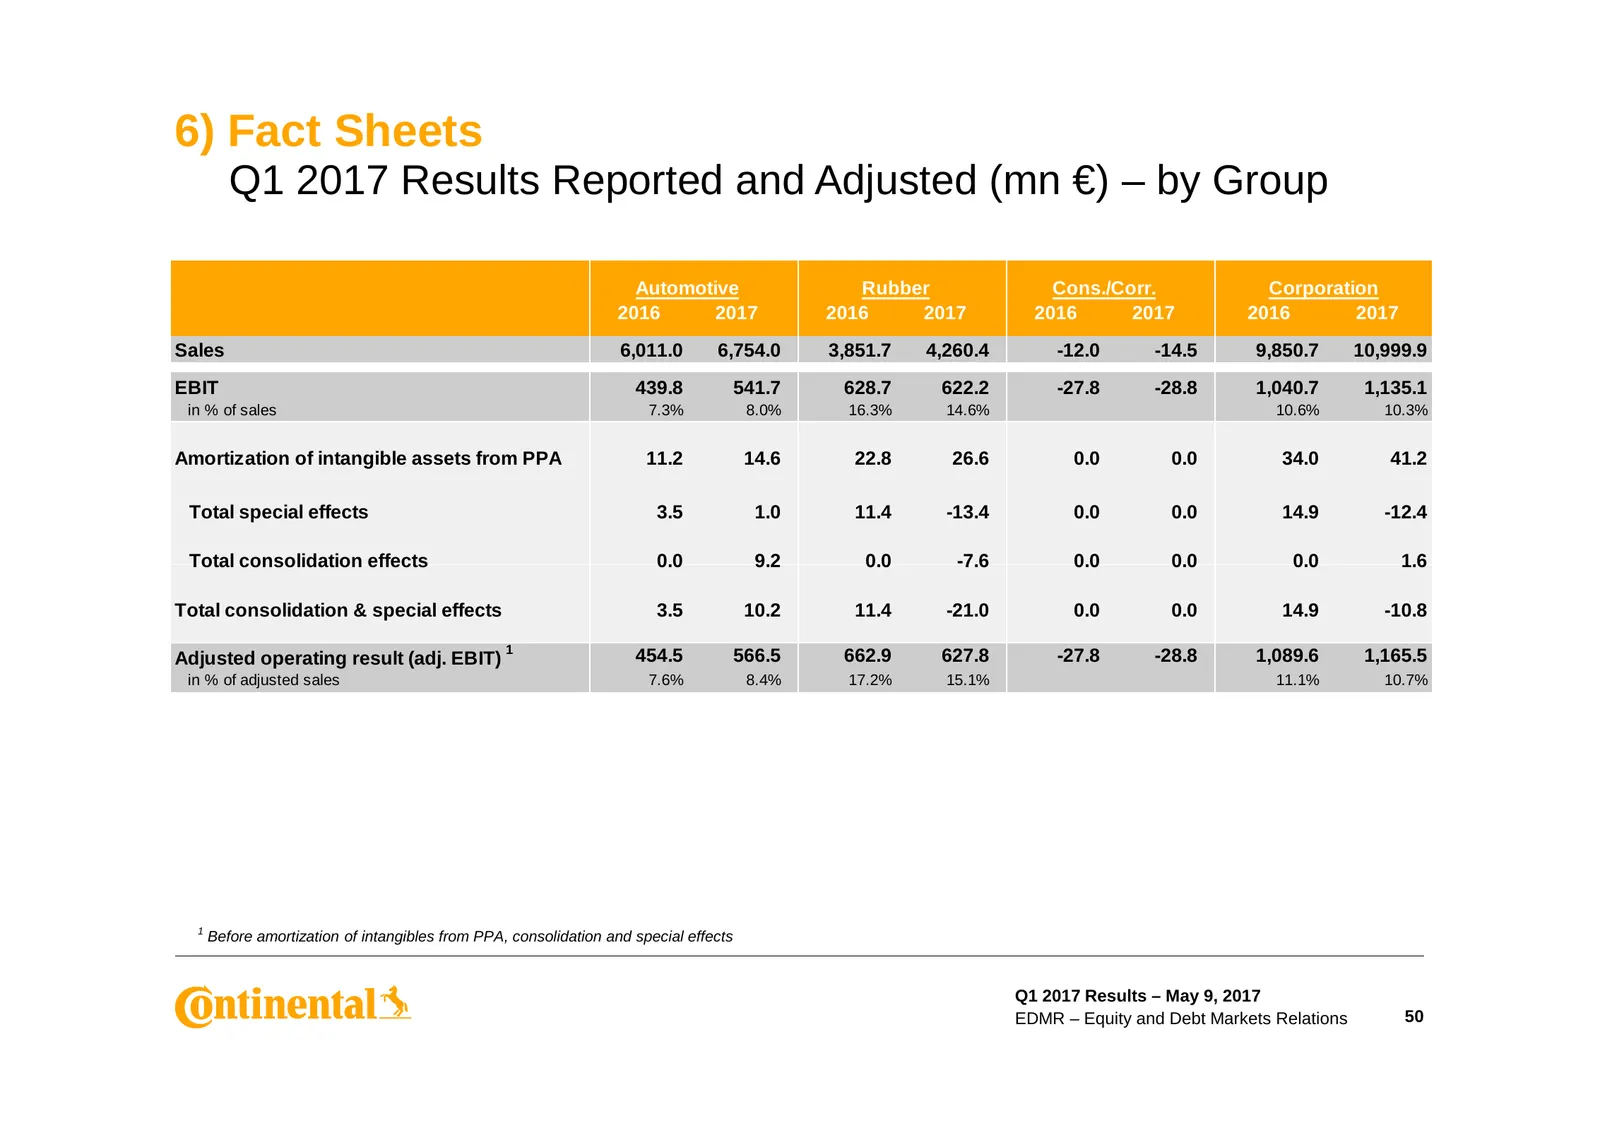
Slide 50: Q1 2017 Results Reported and Adjusted – by Group
6) Fact Sheets Q1 2017 Results Reported and Adjusted (mn €) – by Group Automotive Rubber Cons./Corr. Corporation 2016 2017 2016 2017 2016 2017 2016 2017 Sales 6,011.0 6,754.0 3,851.7 4,260.4 -12.0 -14.5 9,850.7 10,999.9 EBIT 439.8 541.7 628.7 622.2 -27.8 -28.8 1,040.7 1,135.1 in % of sales 7.3% 8.0%
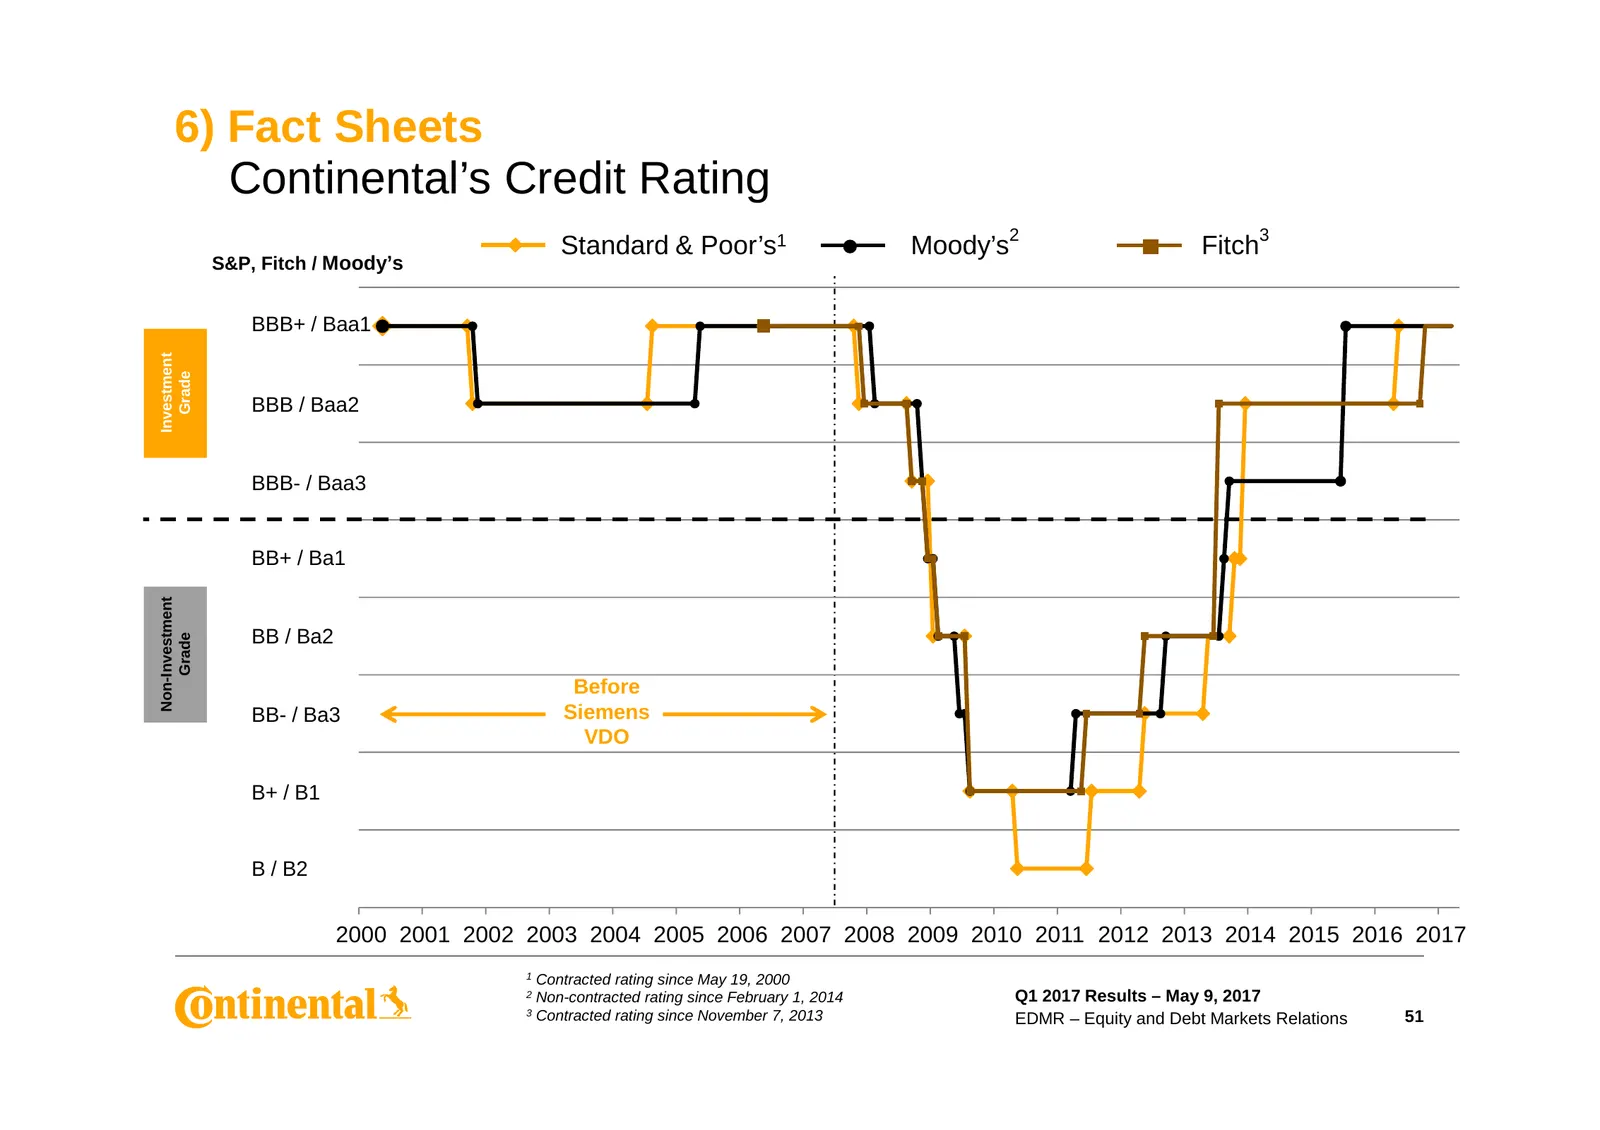
Slide 51: Continental's Credit Rating
6) Fact Sheets Continental’s Credit Rating Standard & Poor’s1 Moody’s2 Fitch3 S&P, Fitch / Moody’s BBB+ / Baa1 Investment Grade BBB / Baa2 BBB- / Baa3 BB+ / Ba1 Non-Investment BB / Ba2 Grade Before BB- / Ba3 Siemens VDO B+ / B1 B / B2 2000 2001 2002 2003 2004 2005 2006 2007 2008 2009 2010 2011 2012
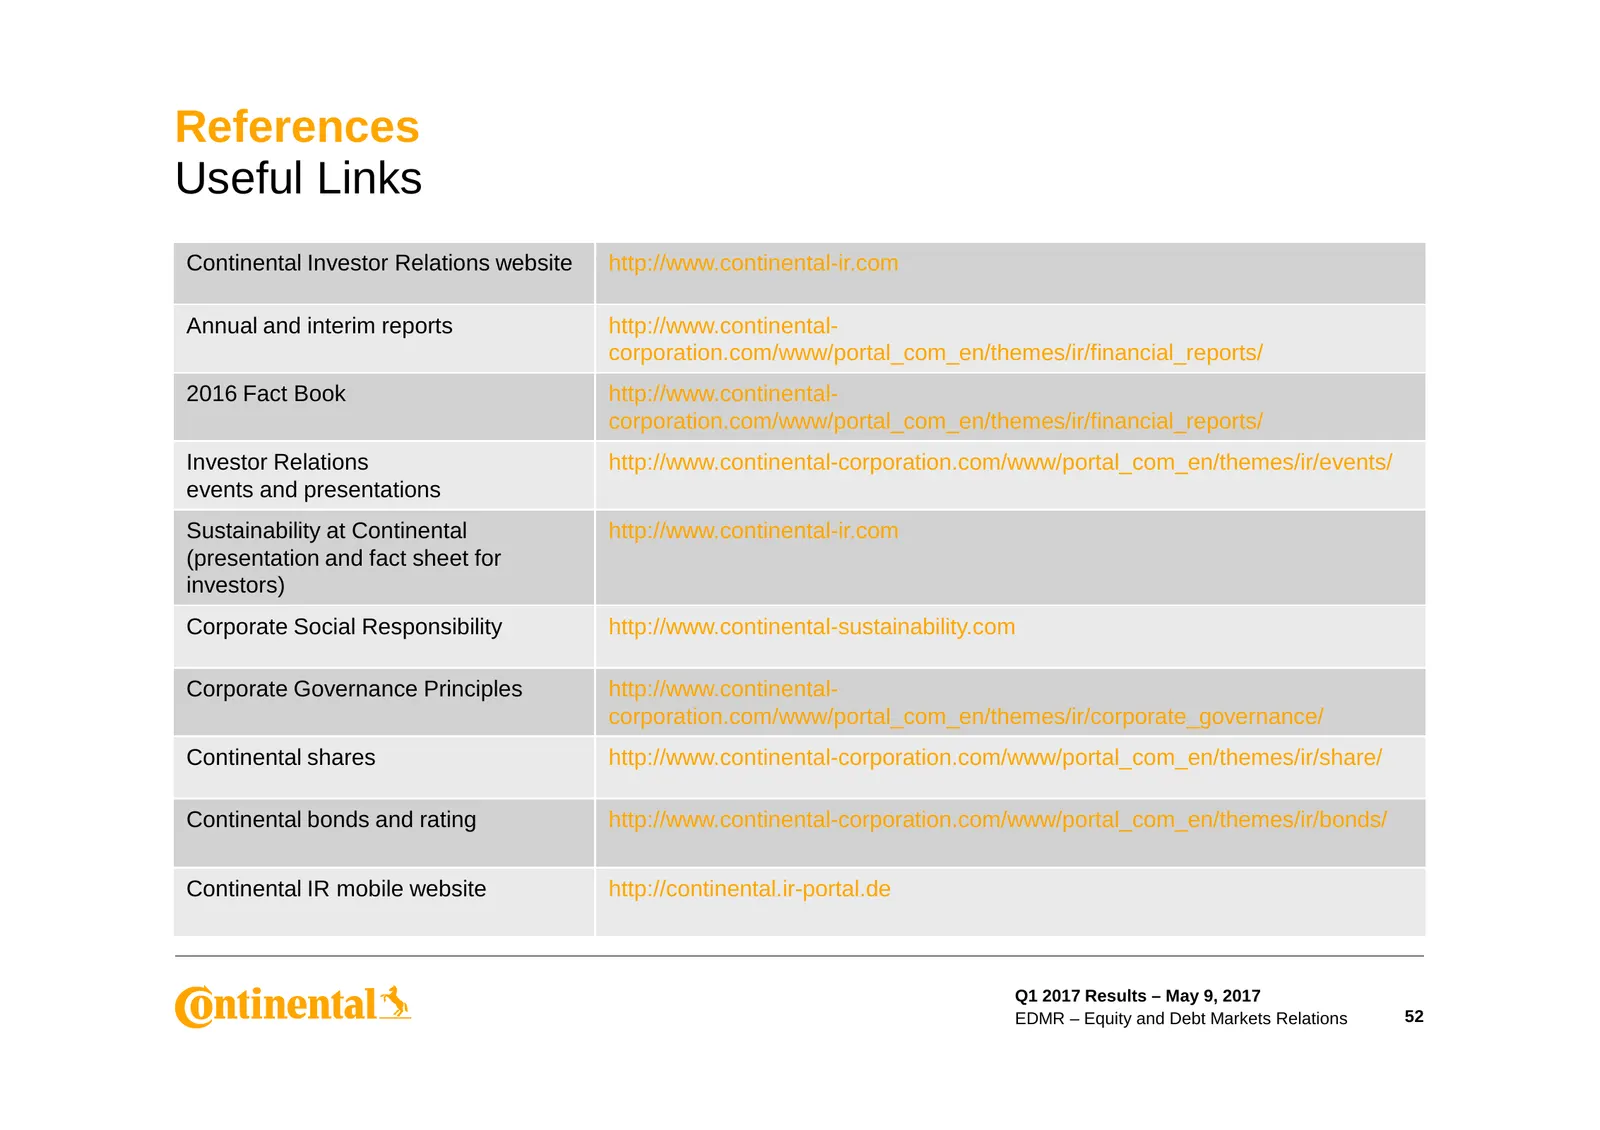
Slide 52: References: Useful Links
References Useful Links Continental Investor Relations website http://www.continental-ir.com Annual and interim reports http://www.continental- corporation.com/www/portal_com_en/themes/ir/financial_reports/ 2016 Fact Book http://www.continental- corporation.com/www/portal_com_en/themes/ir/financial_
Source: Internet Archive copy of continental.com
More decks from Continental AG
 Q3 2026 Earnings Presentation30 slides · Nov 4, 2026
 Investor Presentation (November 2026)86 slides · November 2026
 Q2 2026 Earnings Presentation27 slides · Aug 4, 2026
 Investor Presentation (June 2026)86 slides · June 2026
 Q1 2026 Earnings Presentation26 slides · May 6, 2026
 FY2025 Earnings Presentation30 slides · Mar 4, 2026