JBS N.V. · NYSE:JBS
JBS — Q4 2013 Earnings Presentation
76 slides from JBS's earnings presentation, Mar 25, 2014
Slide 1: JBS Day New York: 4Q13 and 2013 Results Presentation
JBS DAY New York 4Q13 and 2013 Results Presentation March 25th, 2014
Slide 2: Disclaimer
Disclaimer This release contains forward-looking statements relating to the prospects of the business, estimates for operating and financial results, and those related to growth prospects of JBS. These are merely projections and, as such, are based exclusively on the expectations of JBS’ management
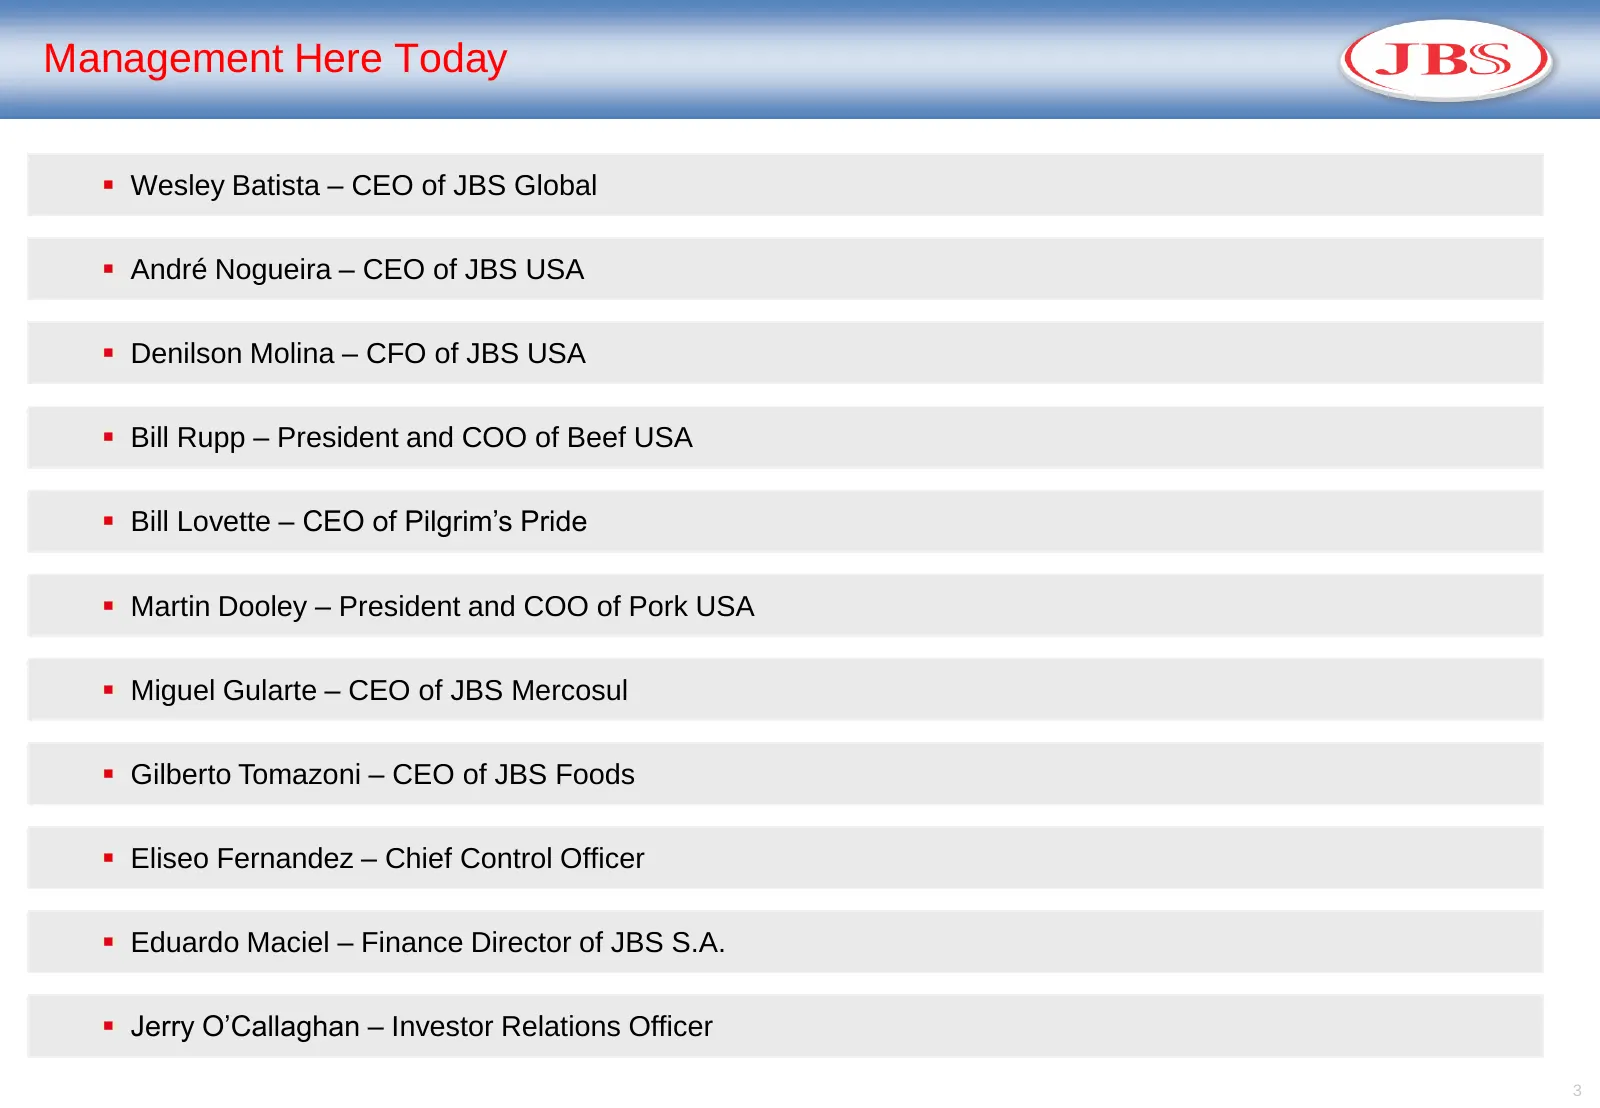
Slide 3: Management Here Today
Management Here Today Wesley Batista – CEO of JBS Global André Nogueira – CEO of JBS USA Denilson Molina – CFO of JBS USA Bill Rupp – President and COO of Beef USA Bill Lovette – CEO of Pilgrim’s Pride Martin Dooley – President and COO of Pork USA Miguel Gularte – CEO of JBS Mercosul
Slide 4: JBS at a Glance
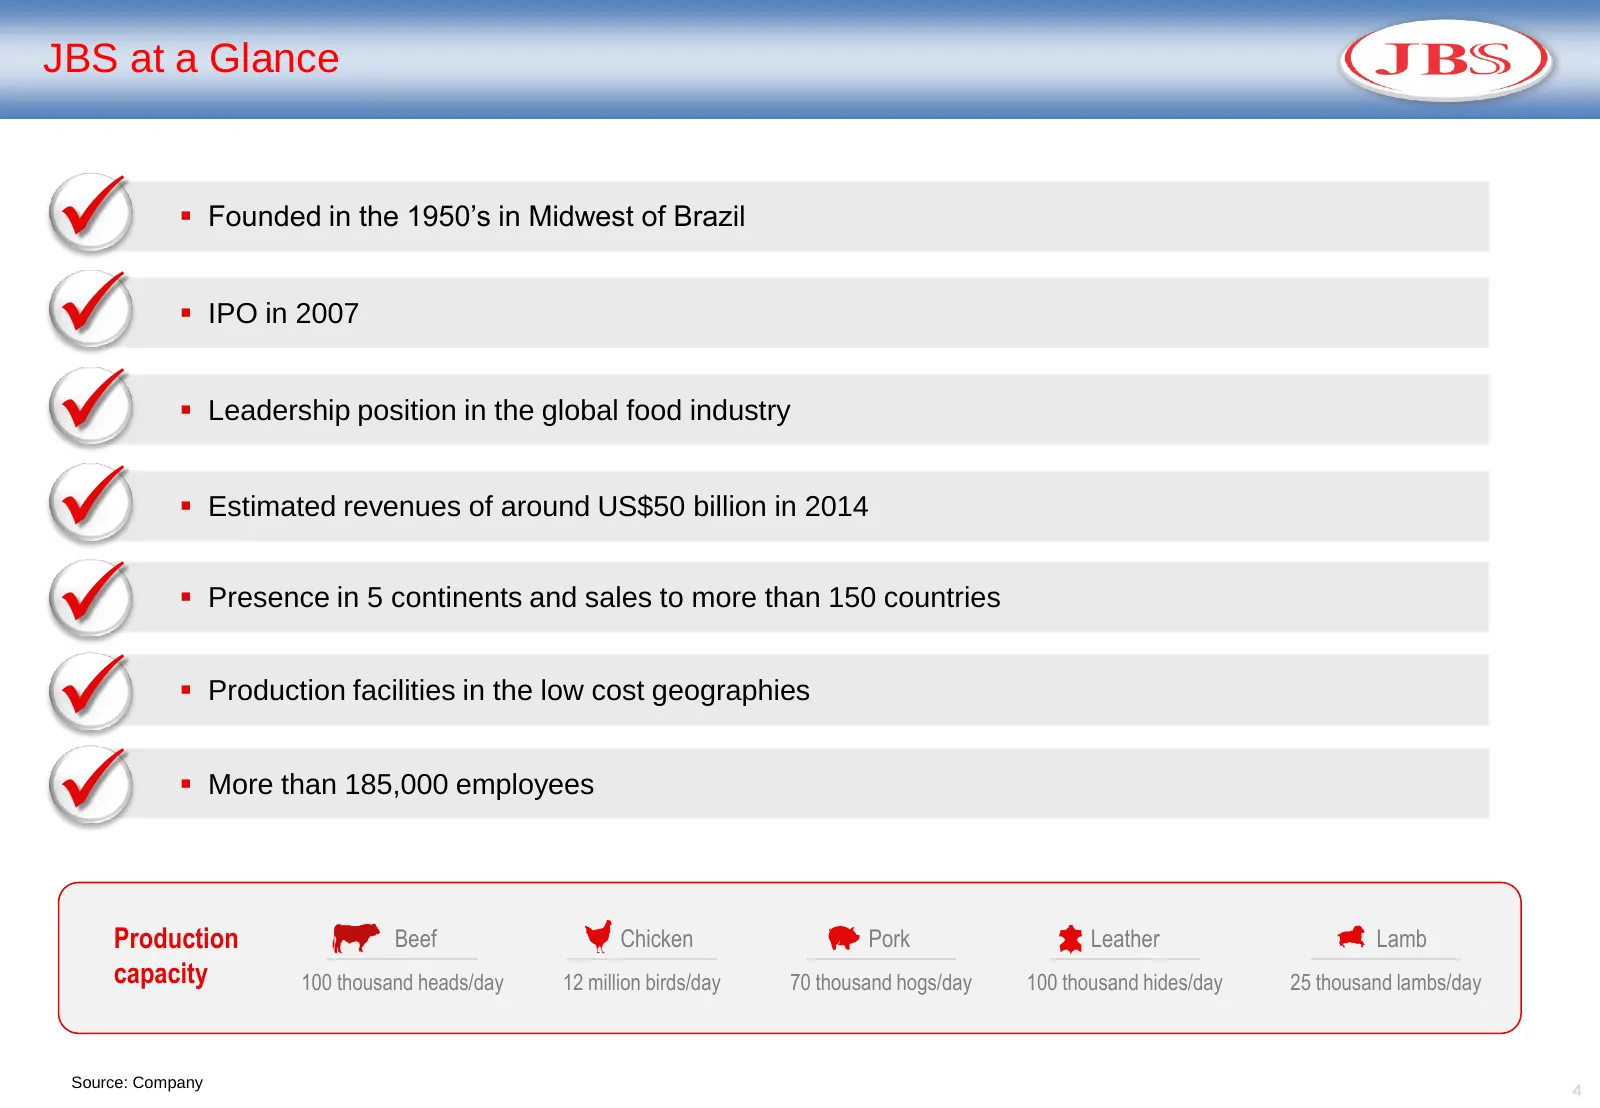
JBS at a Glance Founded in the 1950’s in Midwest of Brazil IPO in 2007 Leadership position in the global food industry Estimated revenues of around US$50 billion in 2014 Presence in 5 continents and sales to more than 150 countries Production facilities in the low cost geogra
Slide 5: JBS 4Q13 Results Highlights
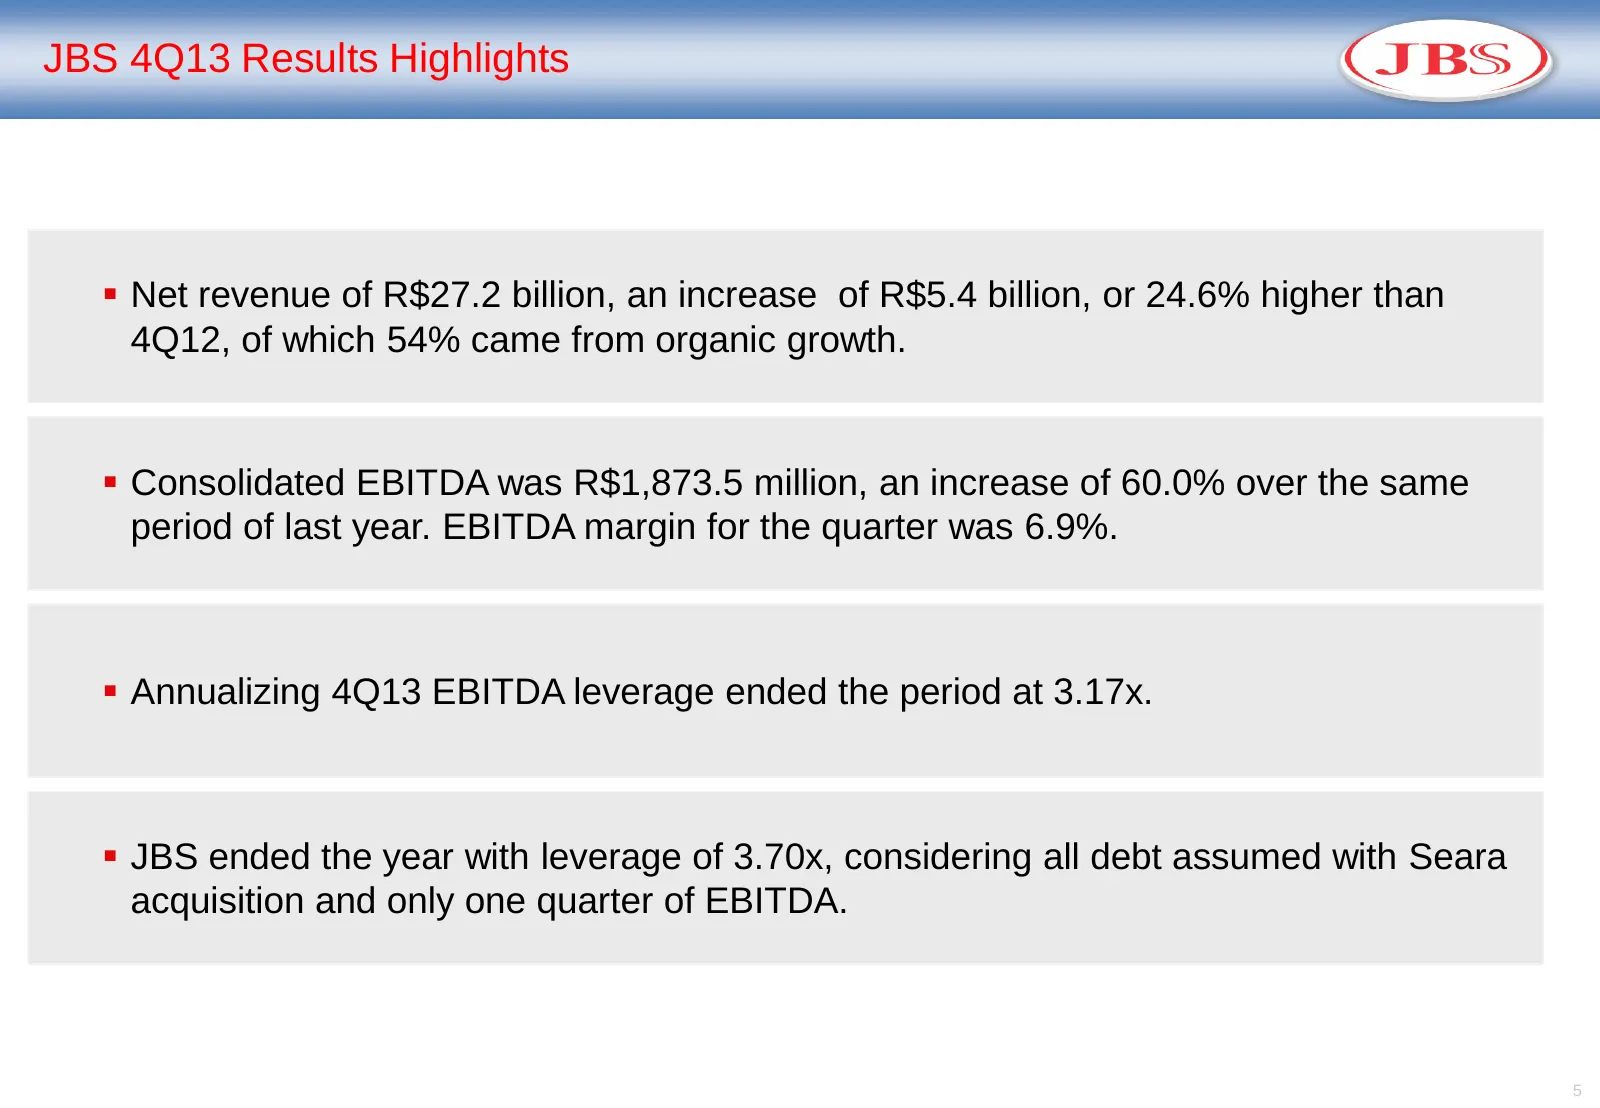
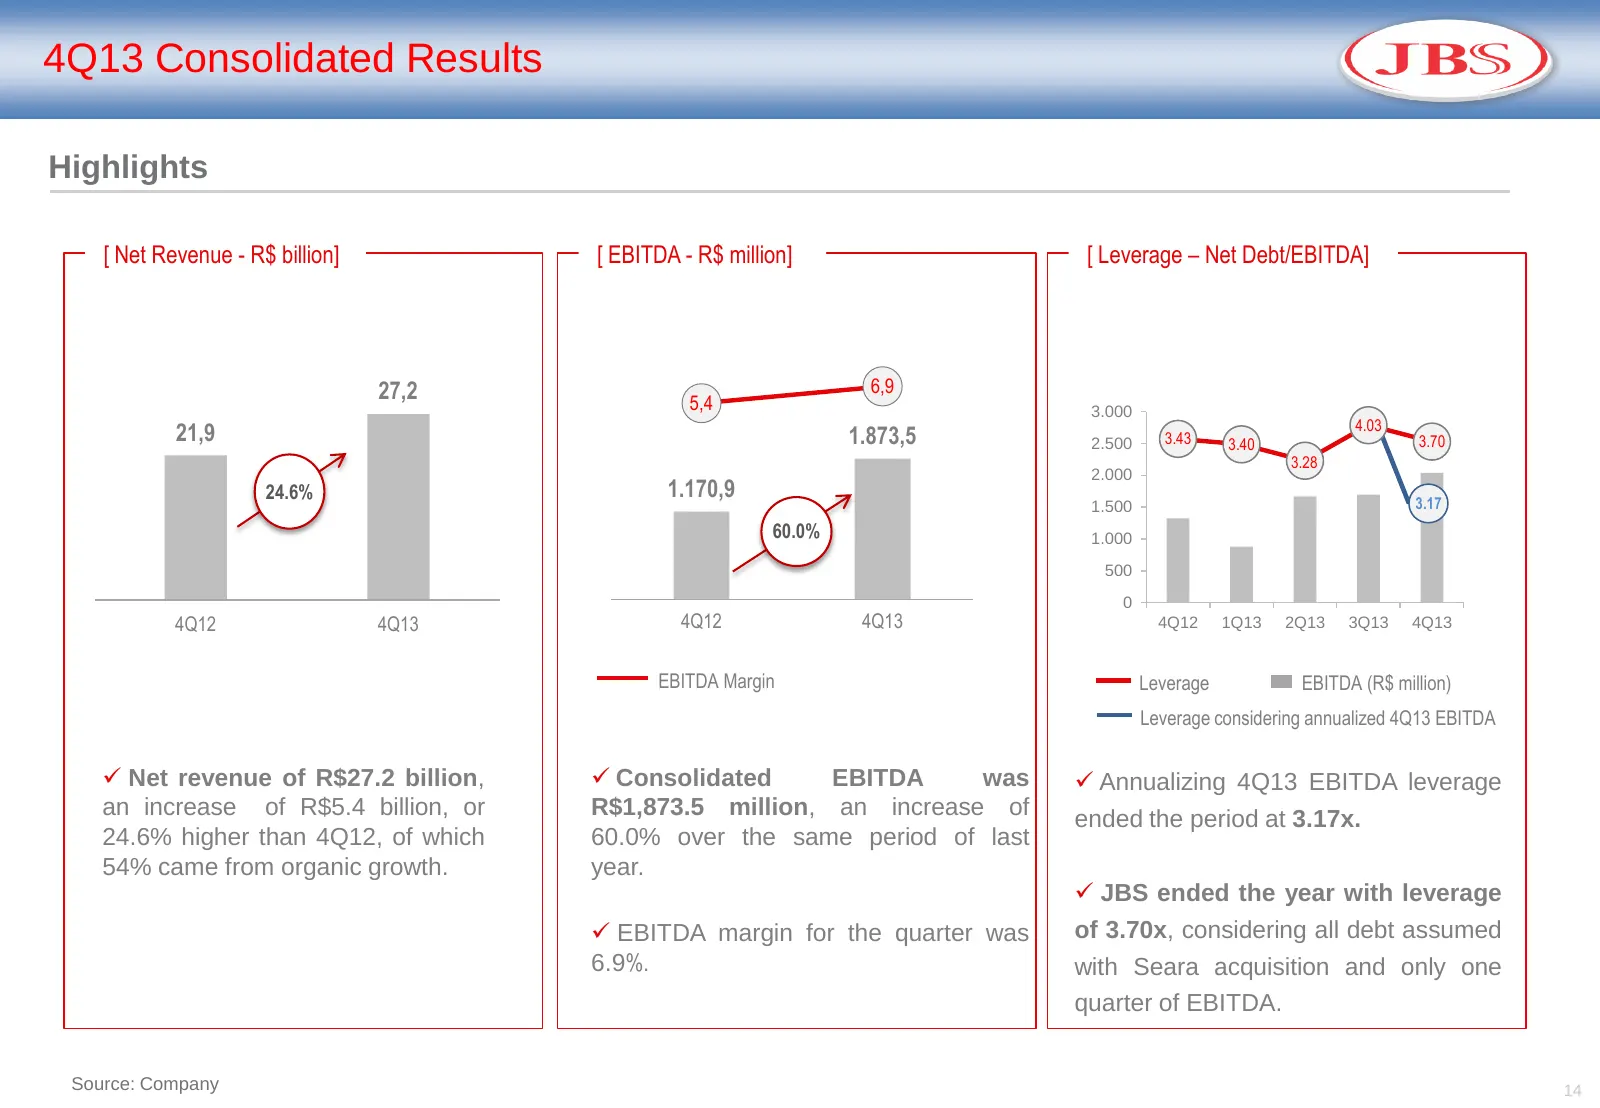
JBS 4Q13 Results Highlights Net revenue of R$27.2 billion, an increase of R$5.4 billion, or 24.6% higher than 4Q12, of which 54% came from organic growth. Consolidated EBITDA was R$1,873.5 million, an increase of 60.0% over the same period of last year. EBITDA margin for the quarter was 6.9%.
Slide 6: JBS 2013 Results Highlights
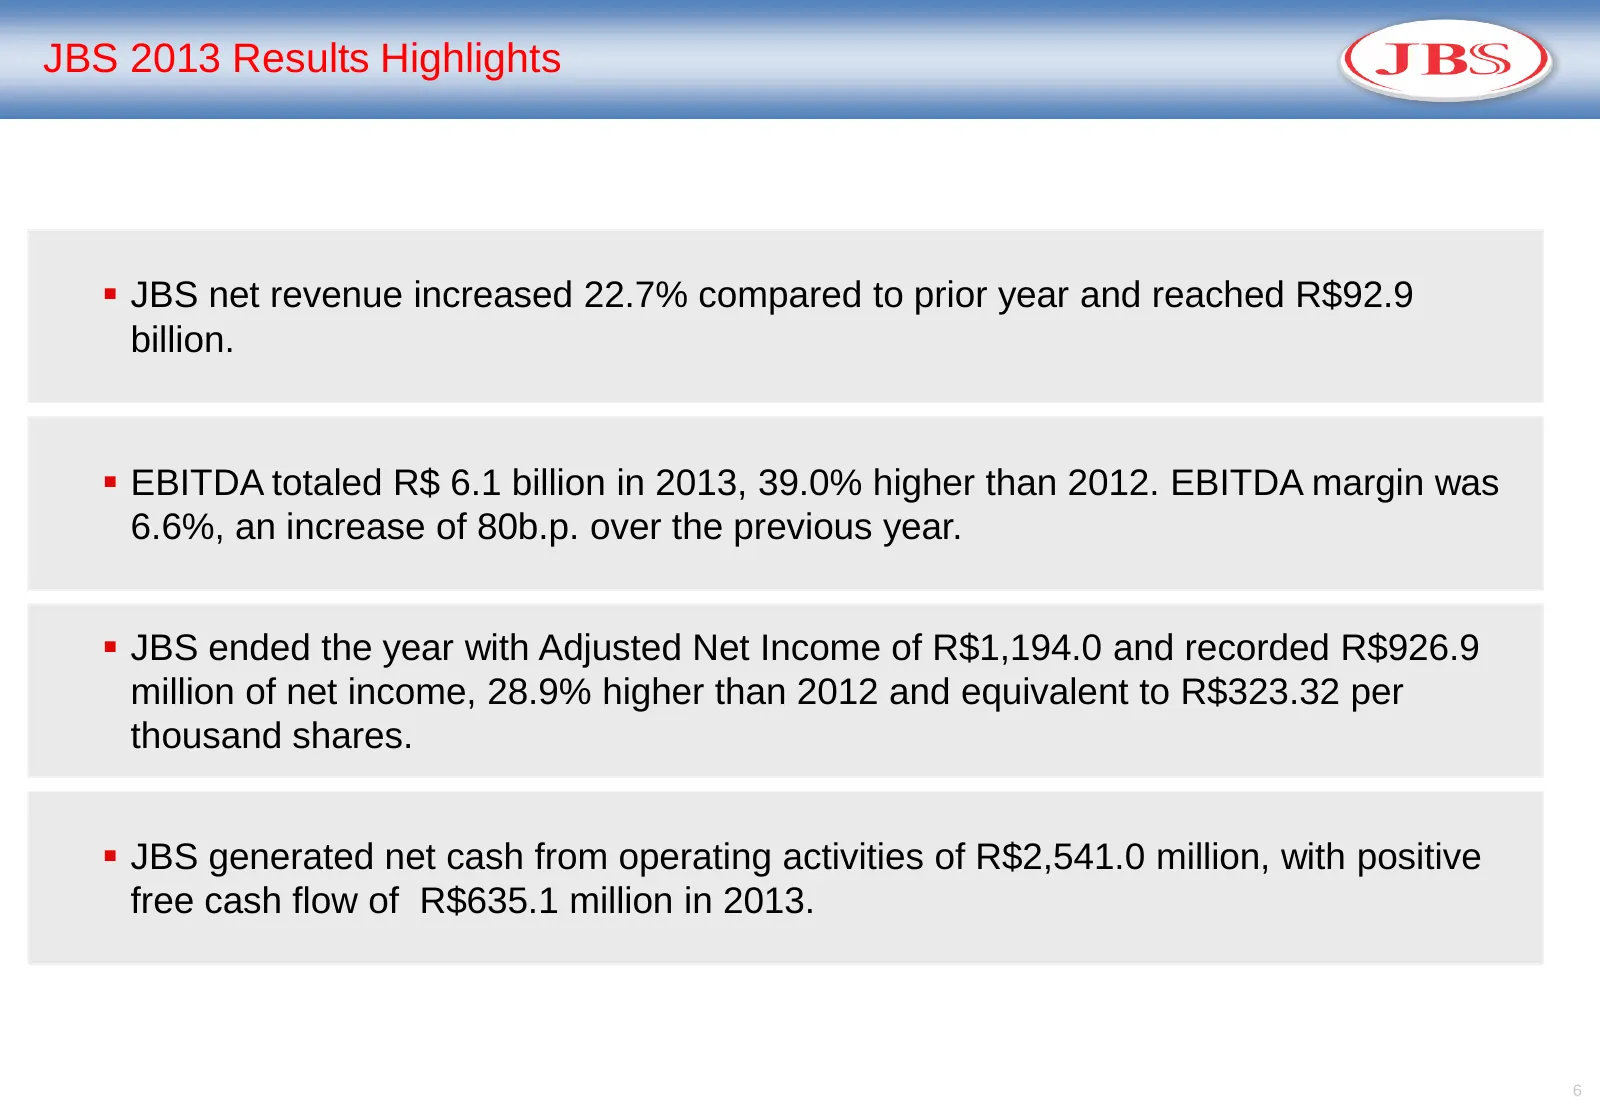
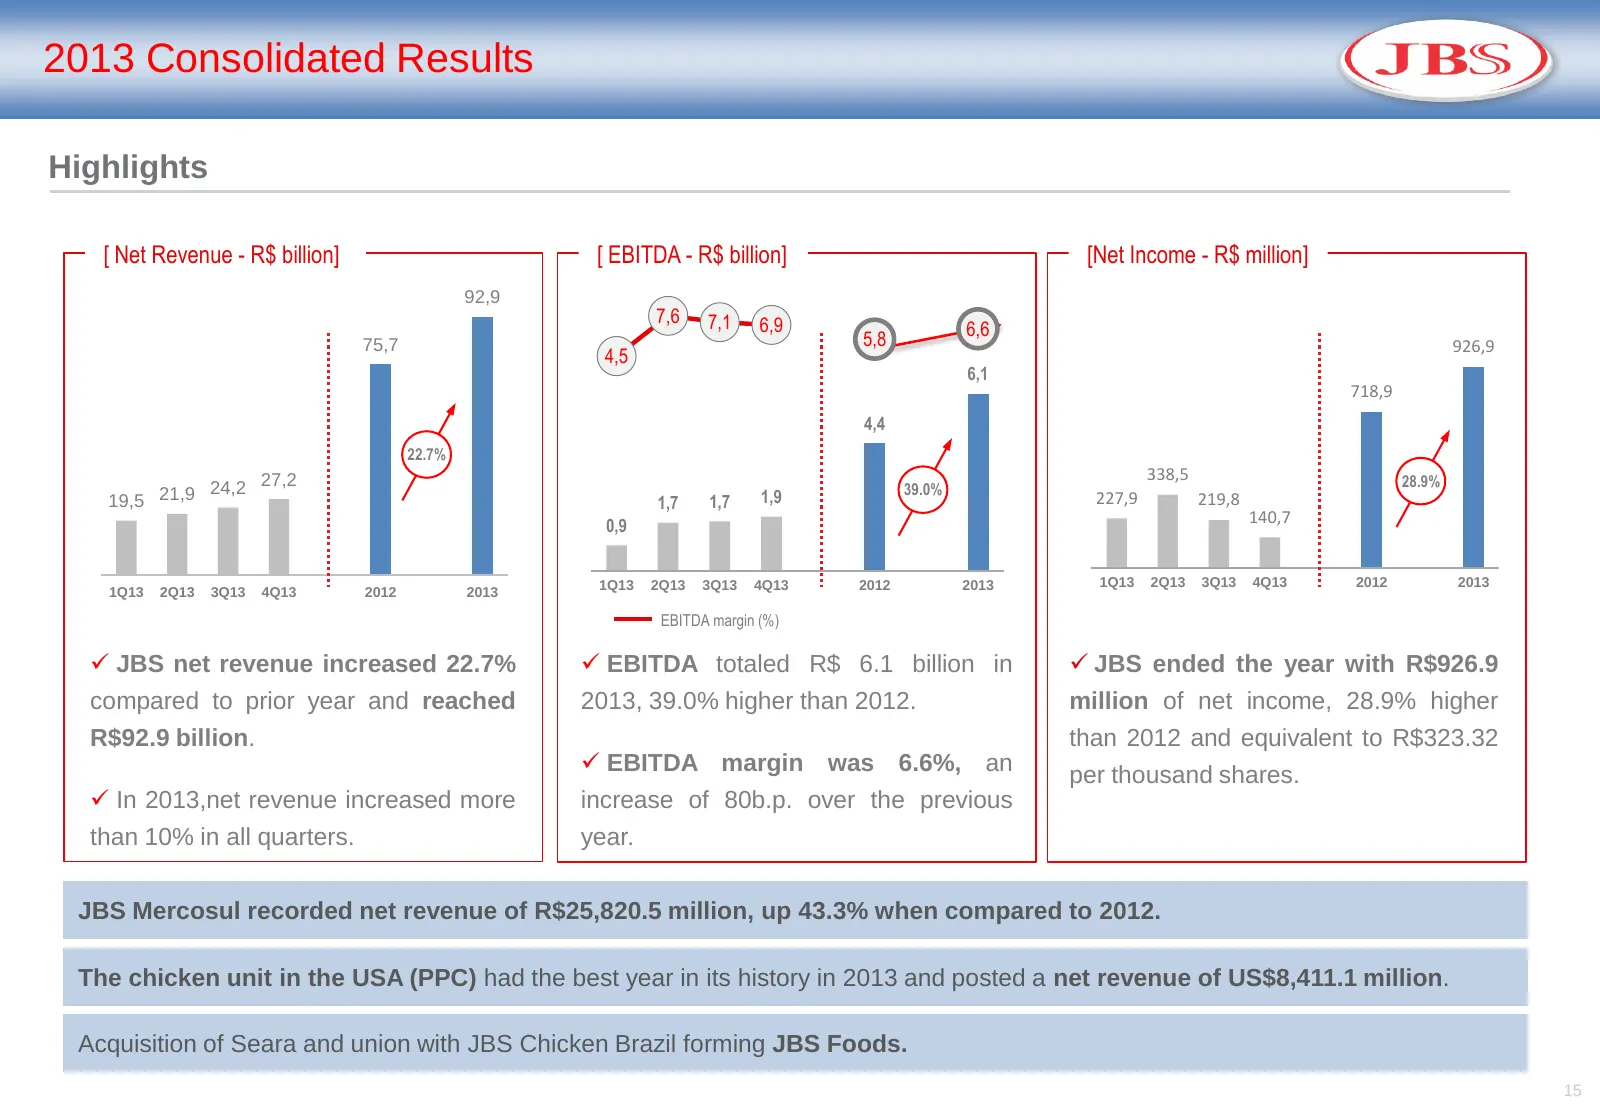
JBS 2013 Results Highlights JBS net revenue increased 22.7% compared to prior year and reached R$92.9 billion. EBITDA totaled R$ 6.1 billion in 2013, 39.0% higher than 2012. EBITDA margin was 6.6%, an increase of 80b.p. over the previous year. JBS ended the year with Adjusted Net Income of R$1
Slide 7: Market Analysis
Market Analysis (JBS)
Slide 8: World's Food Surpluses and Deficits
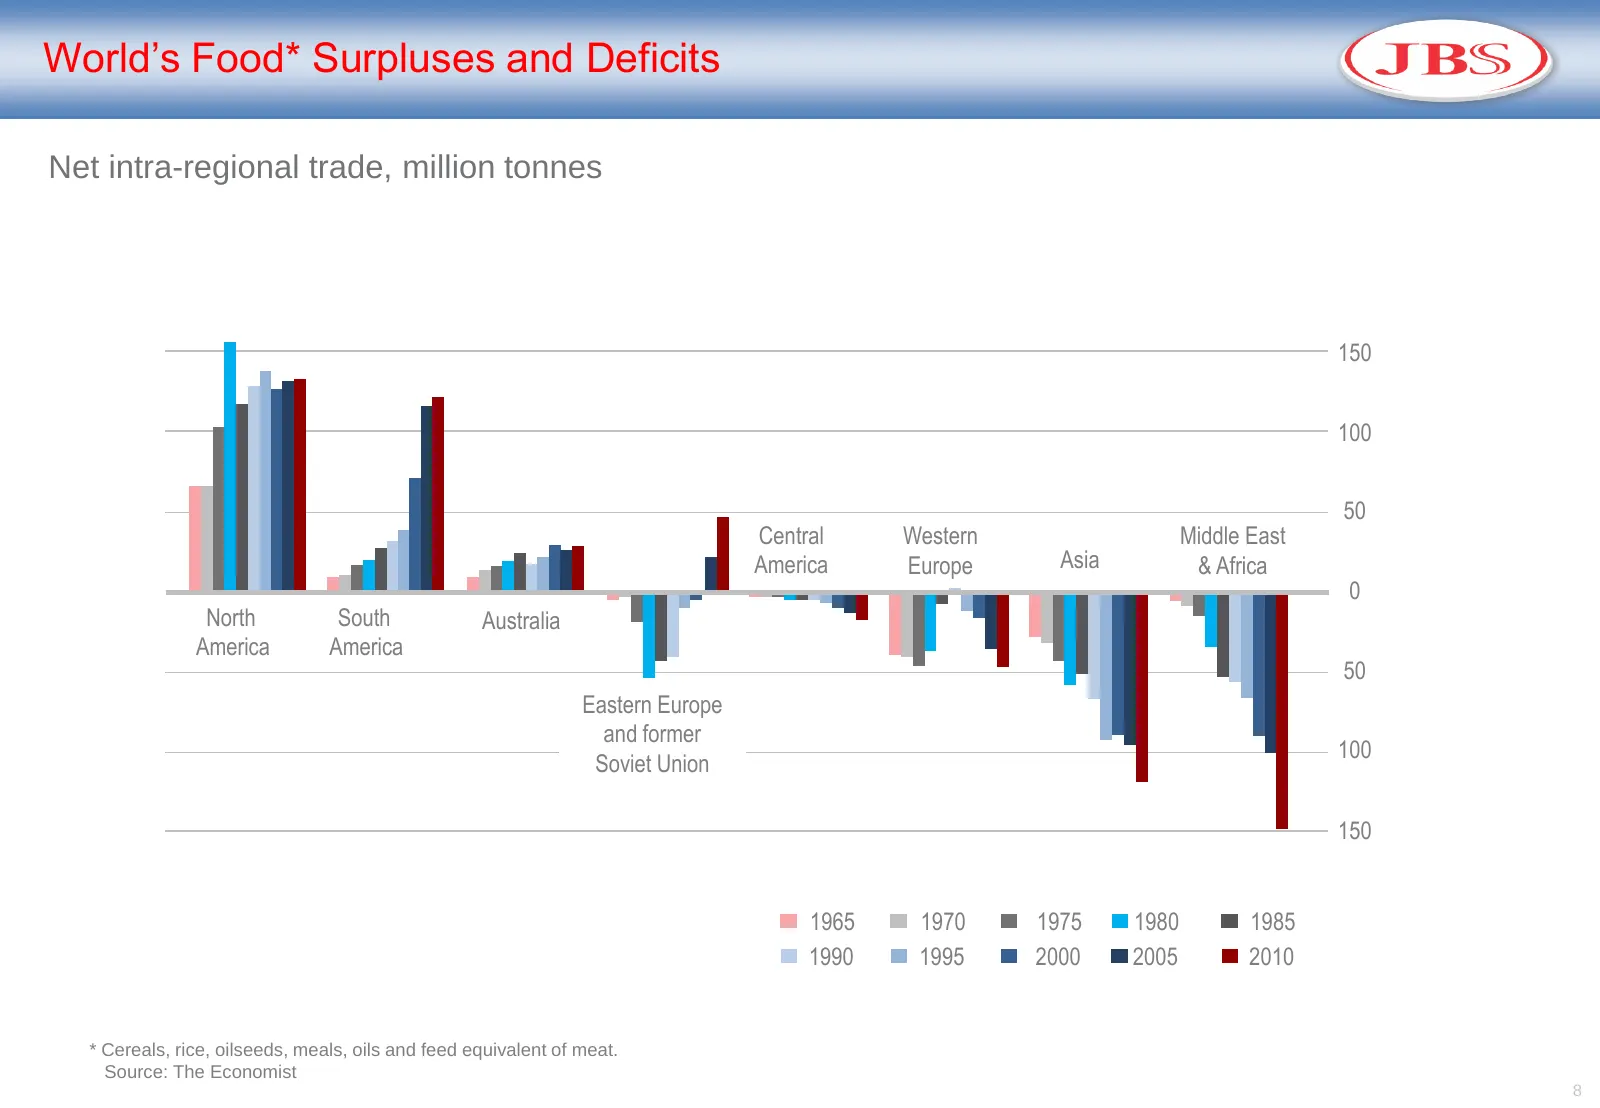
World’s Food* Surpluses and Deficits Net intra-regional trade, million tonnes 150 100 50 Central Western Middle East America Europe Asia & Africa 0 North South Australia America America 50 Eastern Europe and former 100 Soviet Union 150 1965 1970 1975 1980 1985 1990 1995 2000 2005 2010 * Cereals, ric
Slide 9: Global Protein Trade – Largest Exporters
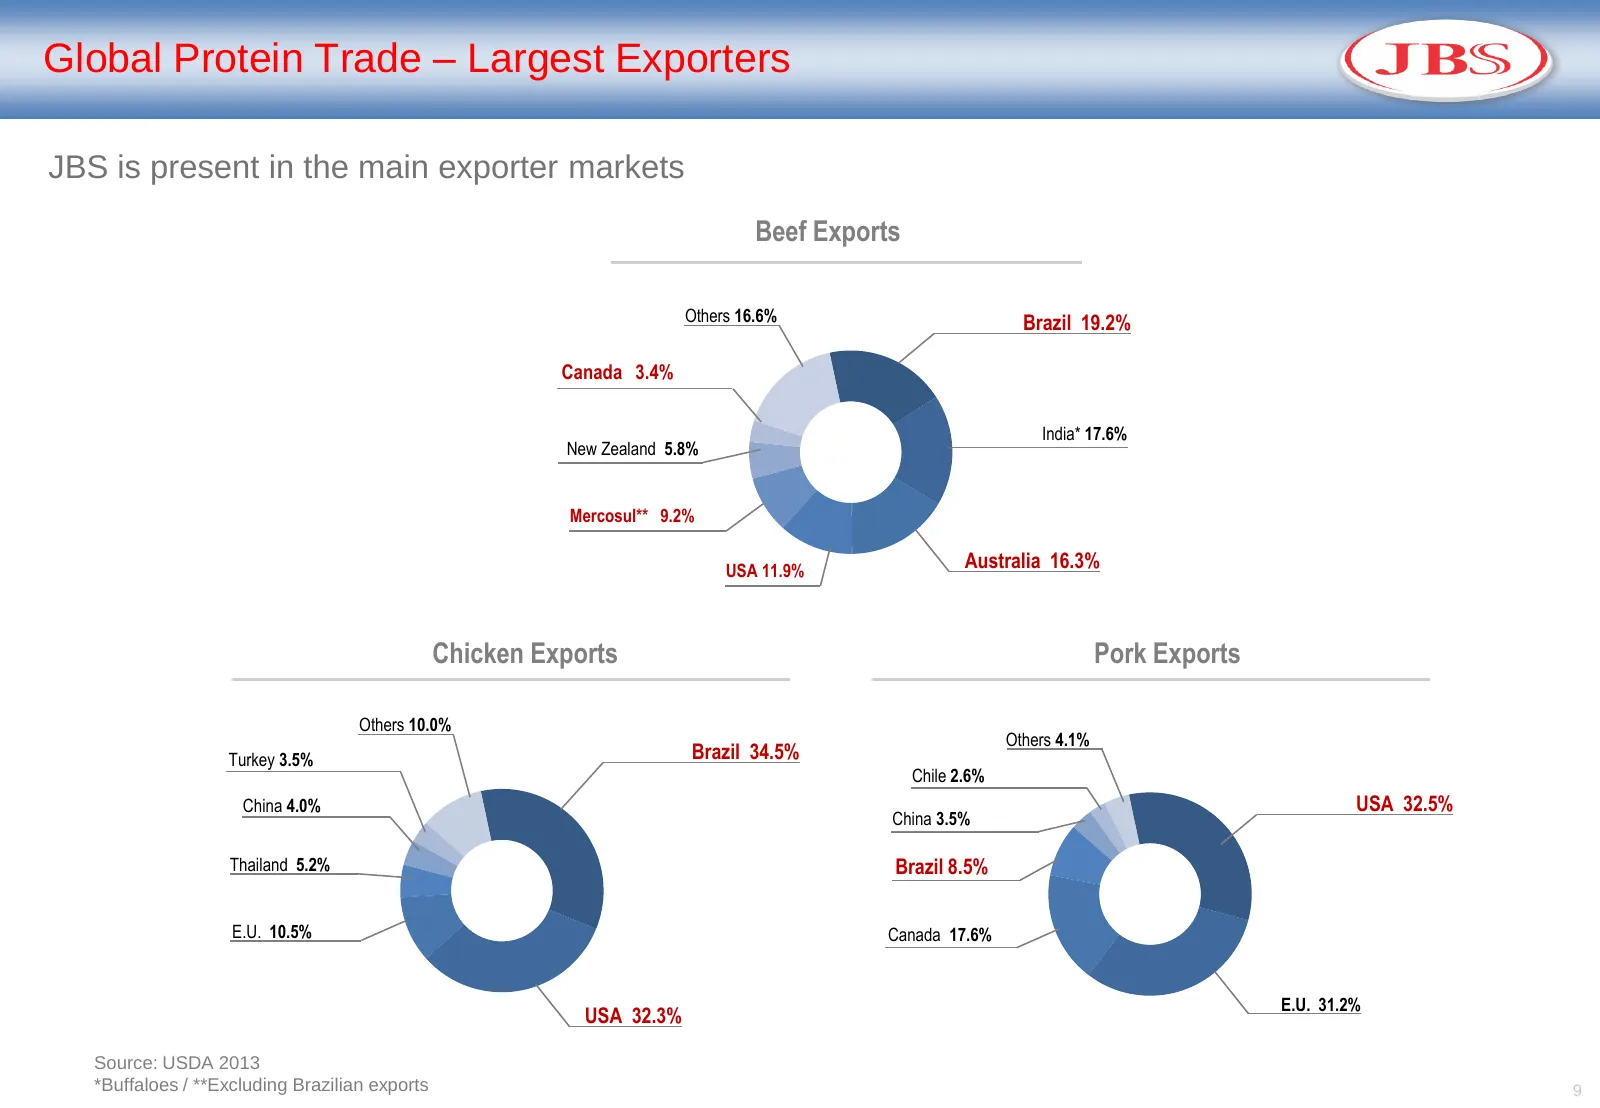
Global Protein Trade – Largest Exporters JBS is present in the main exporter markets Beef Exports Others 16.6% Brazil 19.2% Canada 3.4% India* 17.6% New Zealand 5.8% Mercosul** 9.2% USA 11.9% Australia 16.3% Chicken Exports Pork Exports Others 10.0% Others 4.1% Turkey 3.5% Brazil 34.5% Chile 2.6% Ch
Slide 10: Meat Consumption Growth Forecast 2011-2020
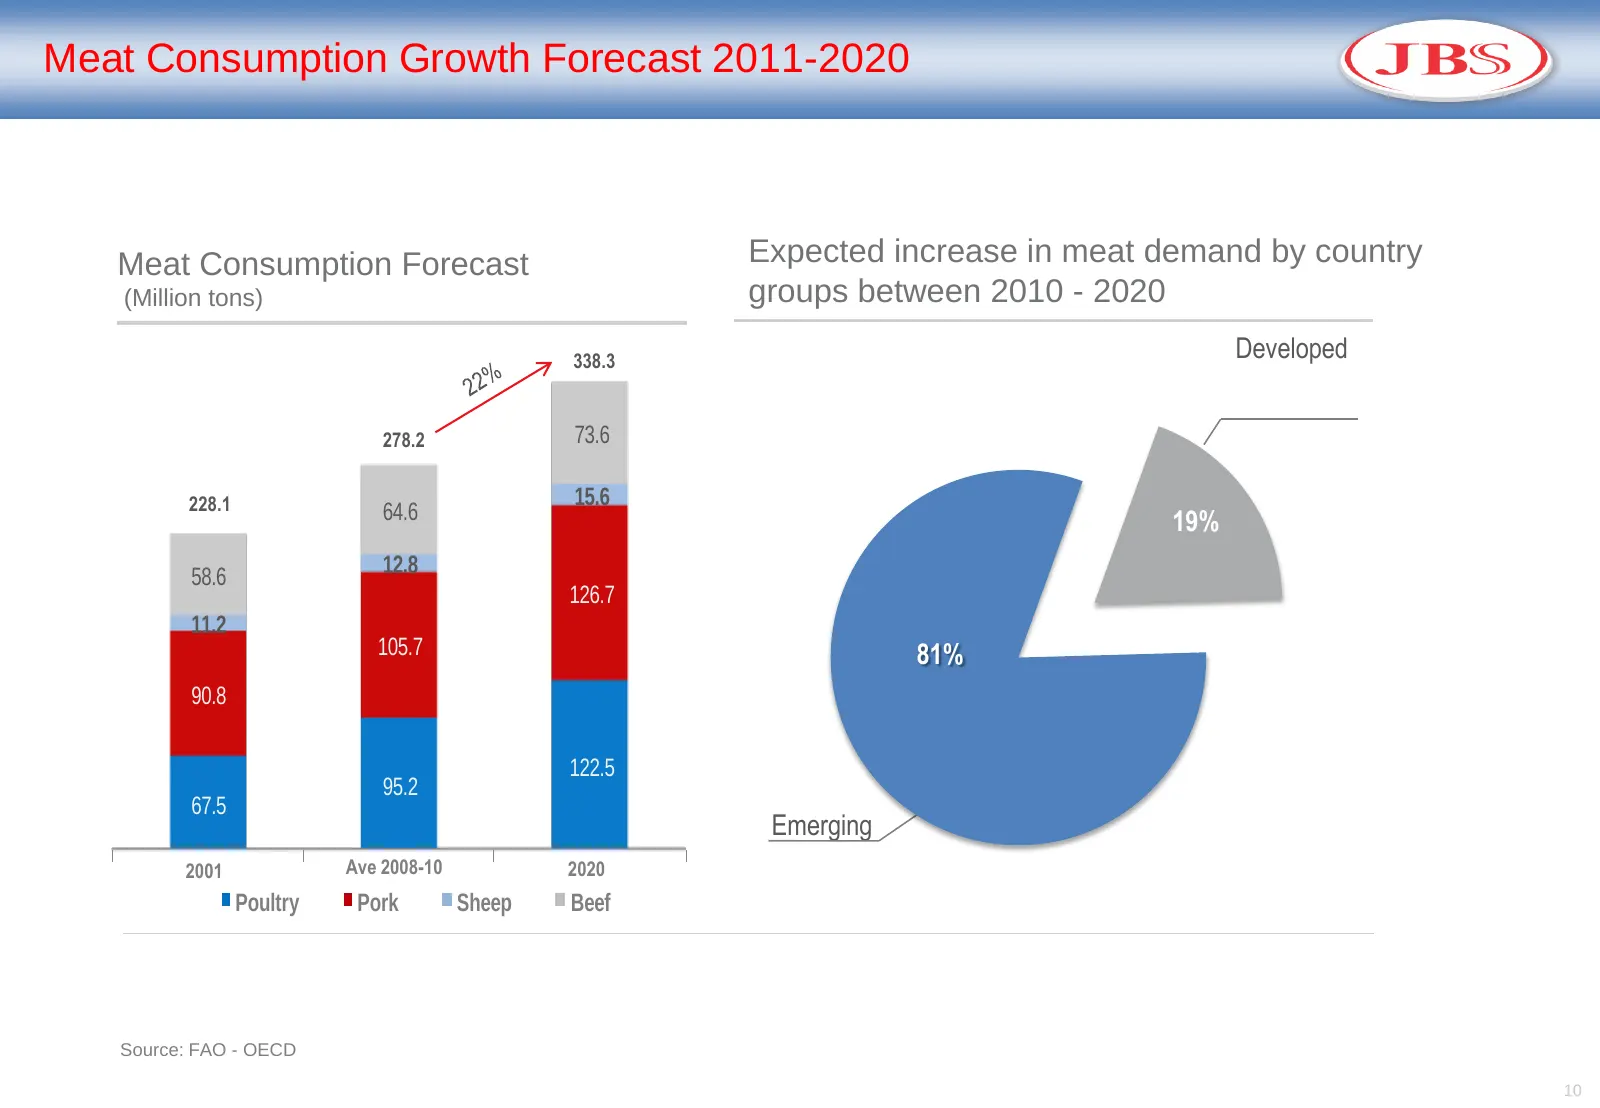
Meat Consumption Growth Forecast 2011-2020 Meat Consumption Forecast Expected increase in meat demand by country (Million tons) groups between 2010 - 2020 338.3 Developed 278.2 73.6 228.1 15.6 64.6 19% 58.6 12.8 126.7 11.2 105.7 81% 90.8 122.5 95.2 67.5 Emerging 2001 Ave 2008-10 2020 Poultry Pork Sh
Slide 11: Global Protein Consumption Growth by Species
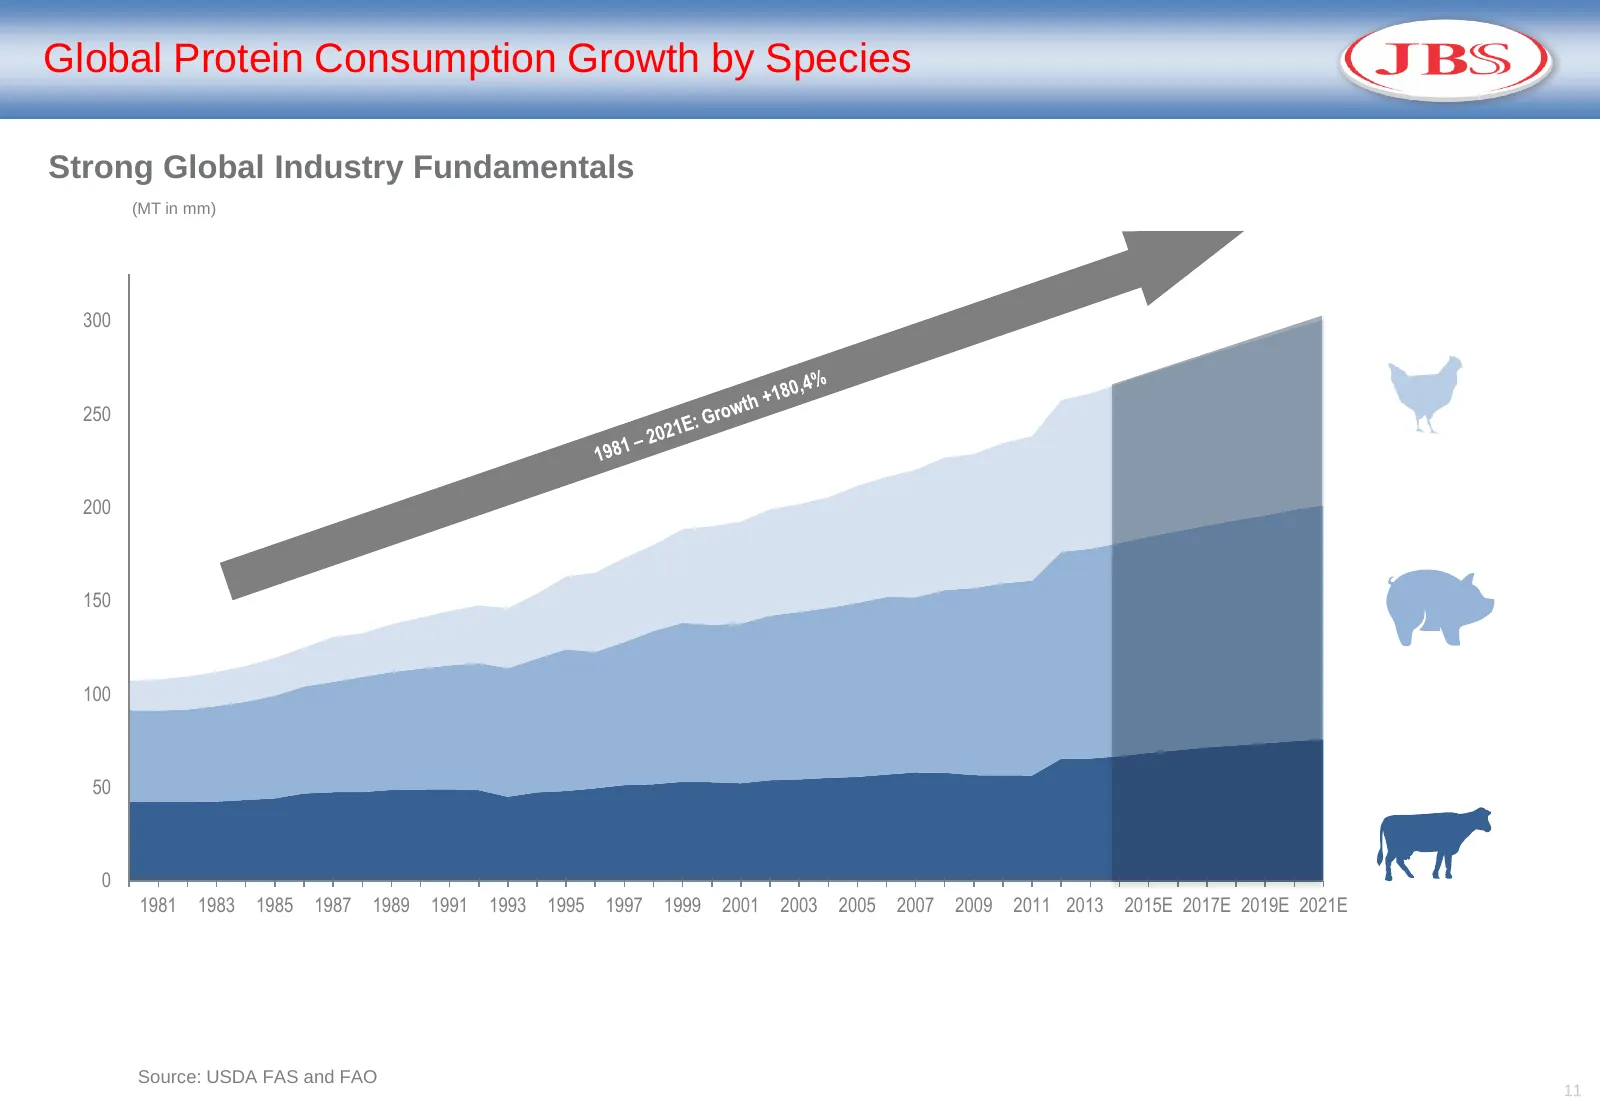
Global Protein Consumption Growth by Species Strong Global Industry Fundamentals (MT in mm) 300 250 200 150 100 50 0 1981 1983 1985 1987 1989 1991 1993 1995 1997 1999 2001 2003 2005 2007 2009 2011 2013E 2015E 2017E 2019E 2021E Source: USDA FAS and FAO 11
Slide 12: Average global per capita meat consumption, 1960-2030
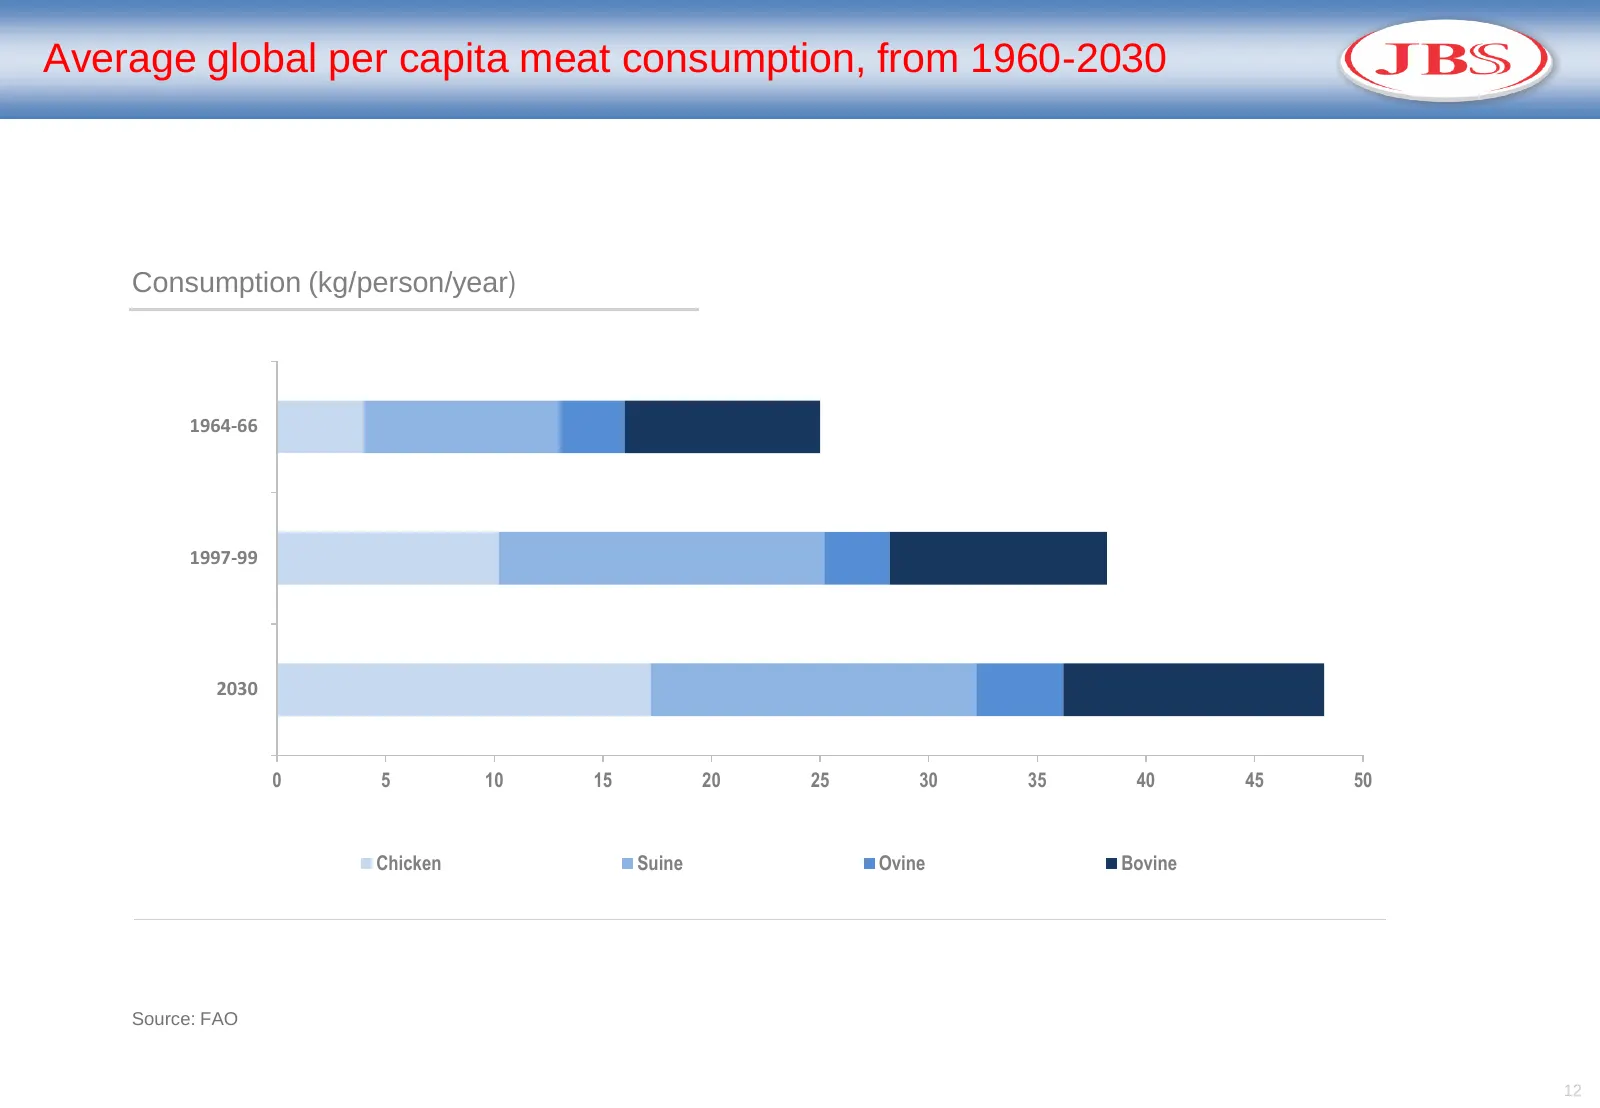
Average global per capita meat consumption, from 1960-2030 Consumption (kg/person/year) 1964-66 1997-99 2030 0 5 10 15 20 25 30 35 40 45 50 Chicken Suine Ovine Bovine Source: FAO 12
Slide 13: Consolidated Results
Consolidated Results (JBS)
Slide 14: 4Q13 Consolidated Results
4Q13 Consolidated Results Highlights [ Net Revenue - R$ billion] [ EBITDA - R$ million] [ Leverage – Net Debt/EBITDA] 27,2 6,9 5,4 3.000 4.03 21,9 1.873,5 2.500 3.43 3.40 3.70 3.28 2.000 24.6% 1.170,9 1.500 3.17 60.0% 1.000 500 0 4Q12 4Q13 4Q12 4Q13 4Q12 1Q13 2Q13 3Q13 4Q13 EBITDA Margin Leverage EB
Slide 15: 2013 Consolidated Results
2013 Consolidated Results Highlights EBITDA [ Net Revenue - R$ billion] [ EBITDA - R$ billion] [Net Income - R$ million] 92,9 7,6 7,1 6,9 6,6 75,7 5,8 926,9 4,5 6,1 718,9 4,4 22.7% 338,5 28.9% 24,2 27,2 1,9 39.0% 19,5 21,9 1,7 1,7 227,9 219,8 0,9 140,7 1Q13 2Q13 3Q13 4Q13 2012 2013 1Q13 2Q13 3Q13 4Q
Slide 16: 2013 Consolidated Results
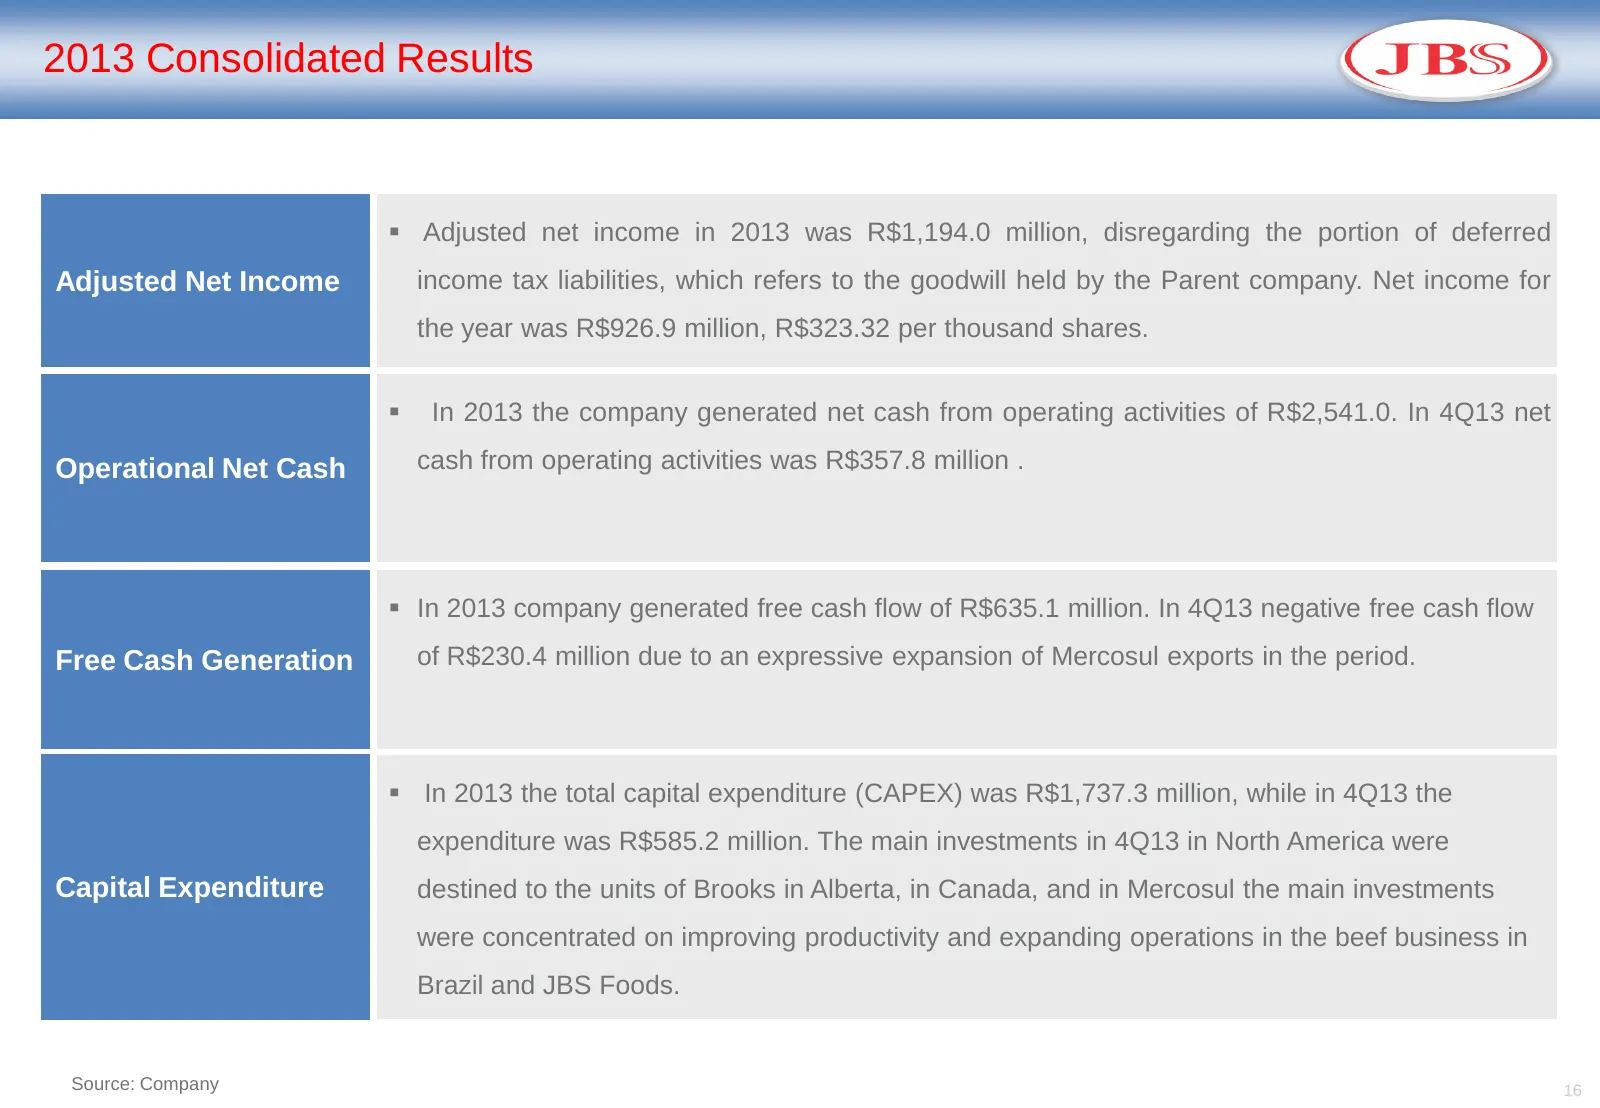
2013 Consolidated Results Adjusted net income in 2013 was R$1,194.0 million, disregarding the portion of deferred Adjusted Net Income income tax liabilities, which refers to the goodwill held by the Parent company. Net income for the year was R$926.9 million, R$323.32 per thousand shares. In 201
Slide 17: JBS Consolidated Exports Distribution in 2013 and 2012
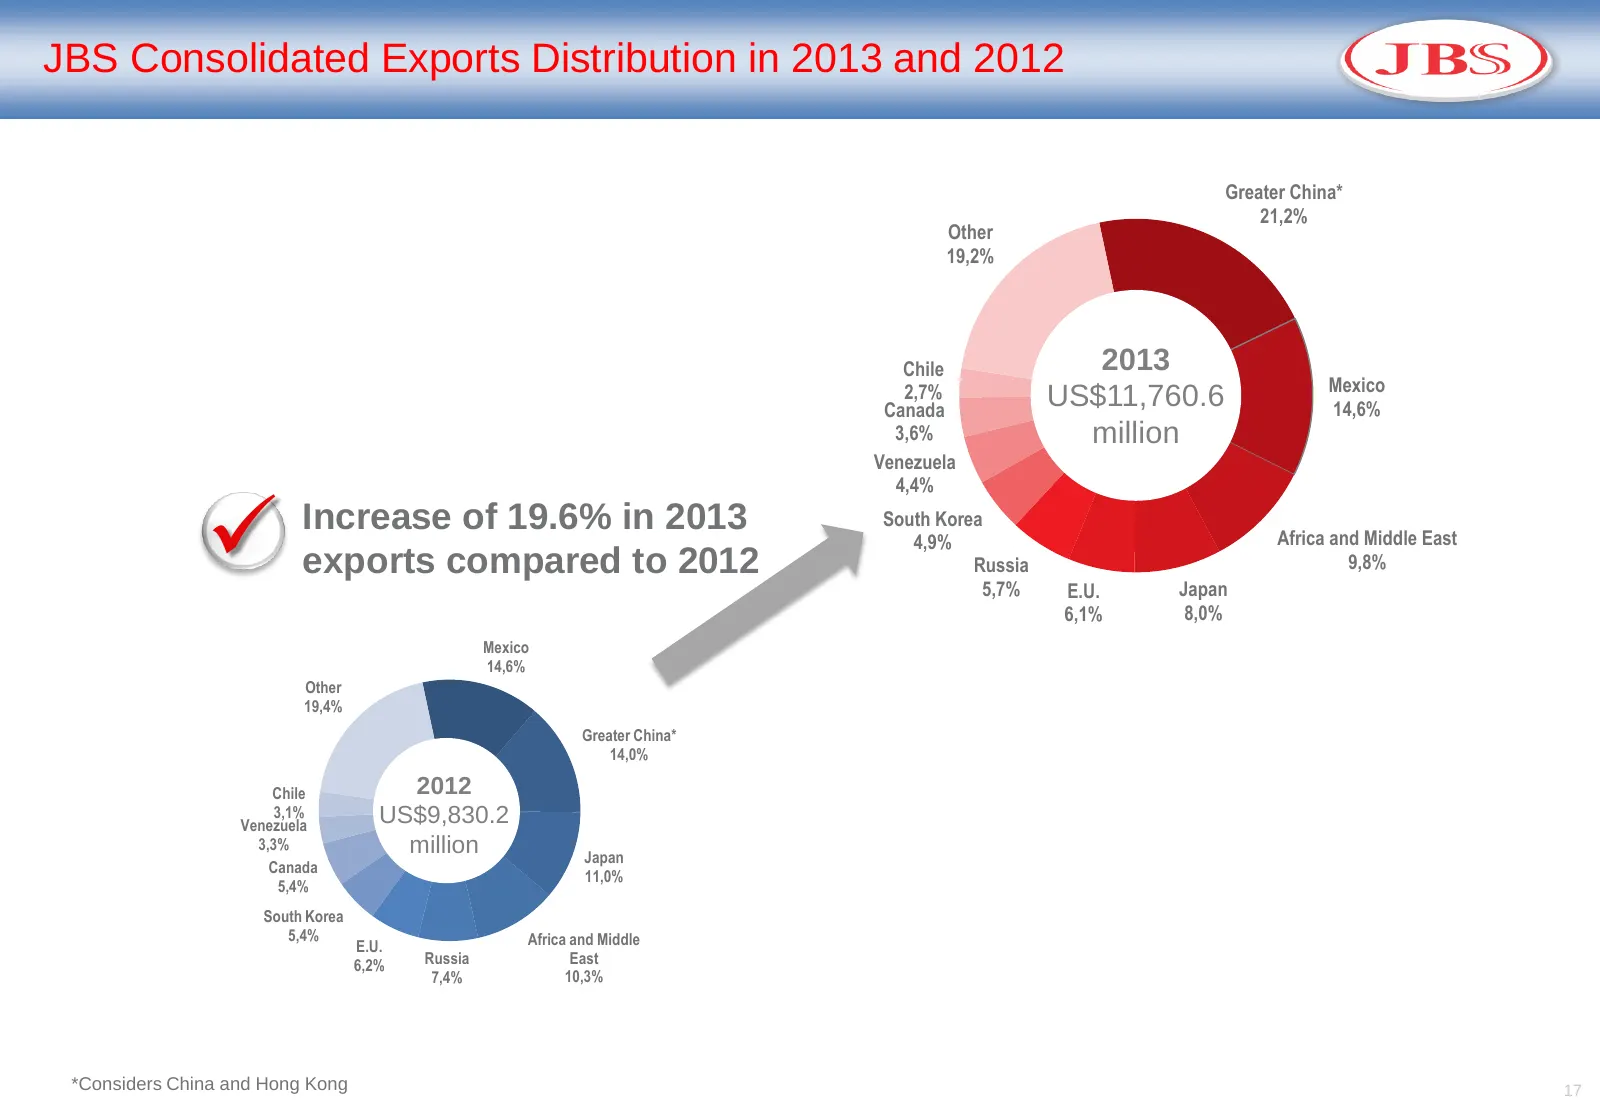
JBS Consolidated Exports Distribution in 2013 and 2012 Greater China* 21,2% Other 19,2% Chile 2013 2,7% Mexico Canada US$11,760.6 14,6% 3,6% million Venezuela 4,4% Increase of 19.6% in 2013 exports compared to 2012 South Korea 4,9% Russia 5,7% E.U. Japan Africa and Middle East 9,8% 6,1% 8,0% Mexic
Slide 18: Debt Profile
Debt Profile (JBS)
Slide 19: Indebtedness
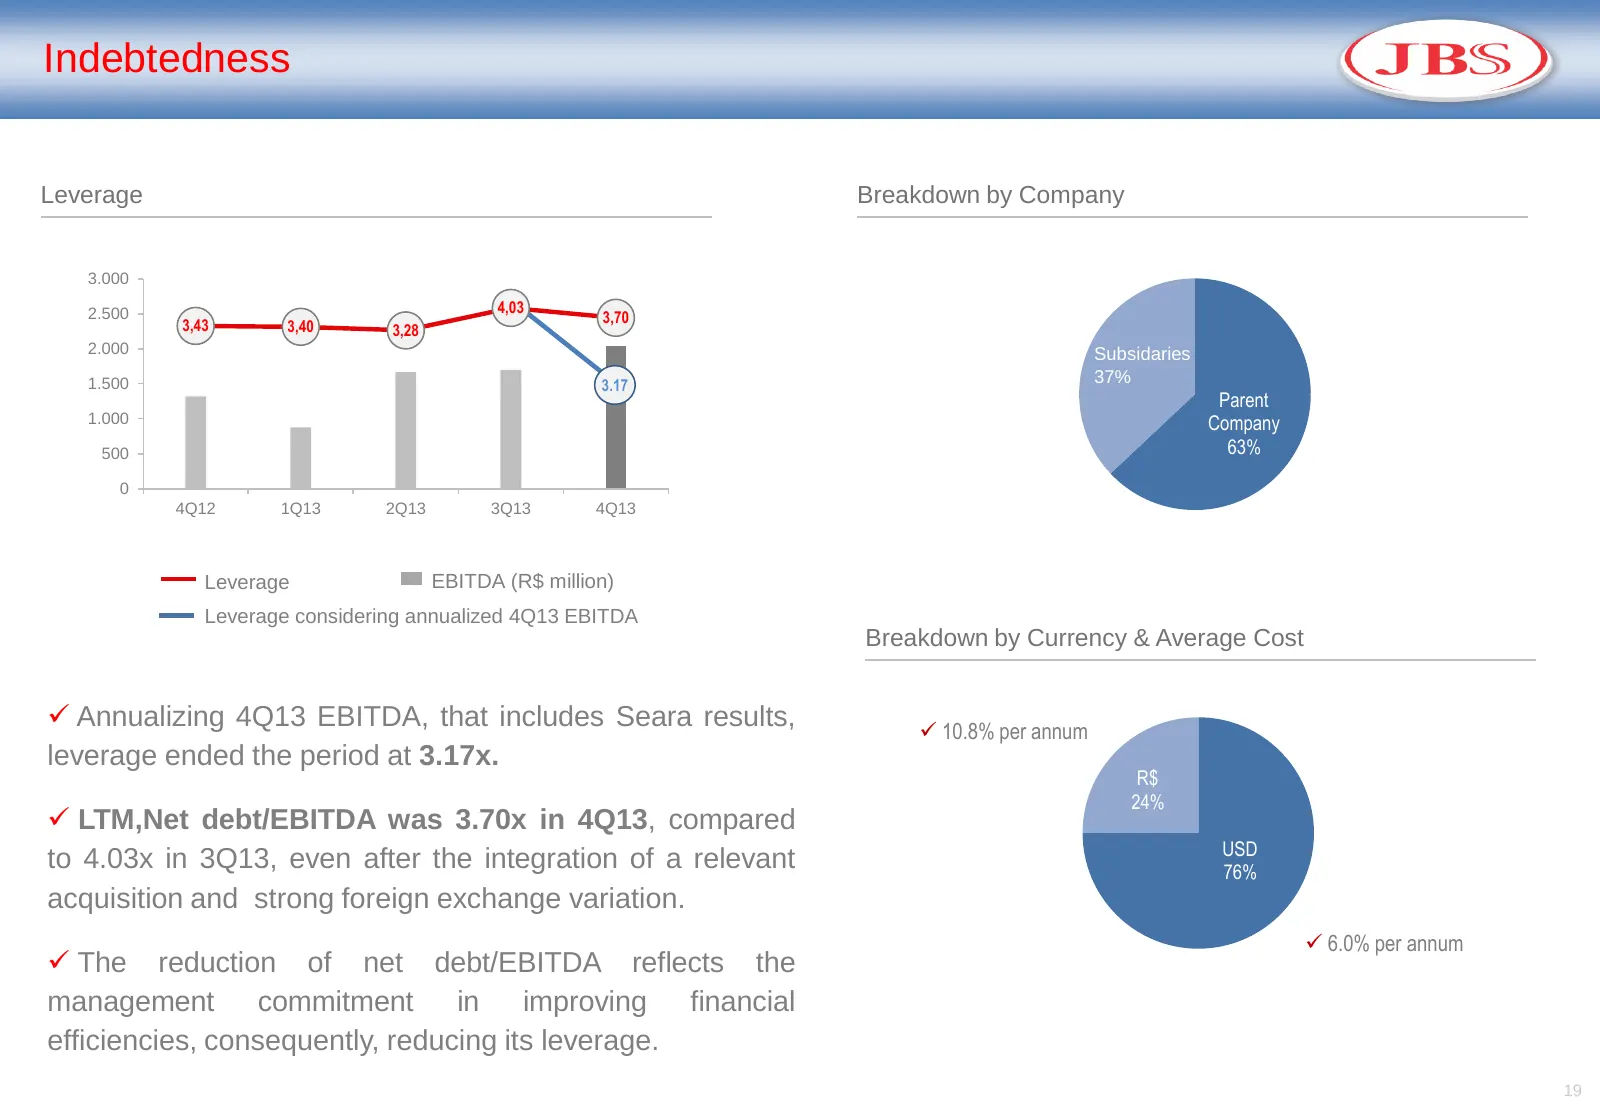
Indebtedness Leverage Breakdown by Company 3.000 2.500 4,03 3,43 3,70 3,40 3,28 2.000 Subsidaries 1.500 3.17 37% Parent 1.000 Company 500 63% 0 4Q12 1Q13 2Q13 3Q13 4Q13 Leverage EBITDA (R$ million) . Leverage considering annualized 4Q13 EBITDA Breakdown by Currency & Average Cost Annualizing 4Q13
Slide 20: Debt Profile
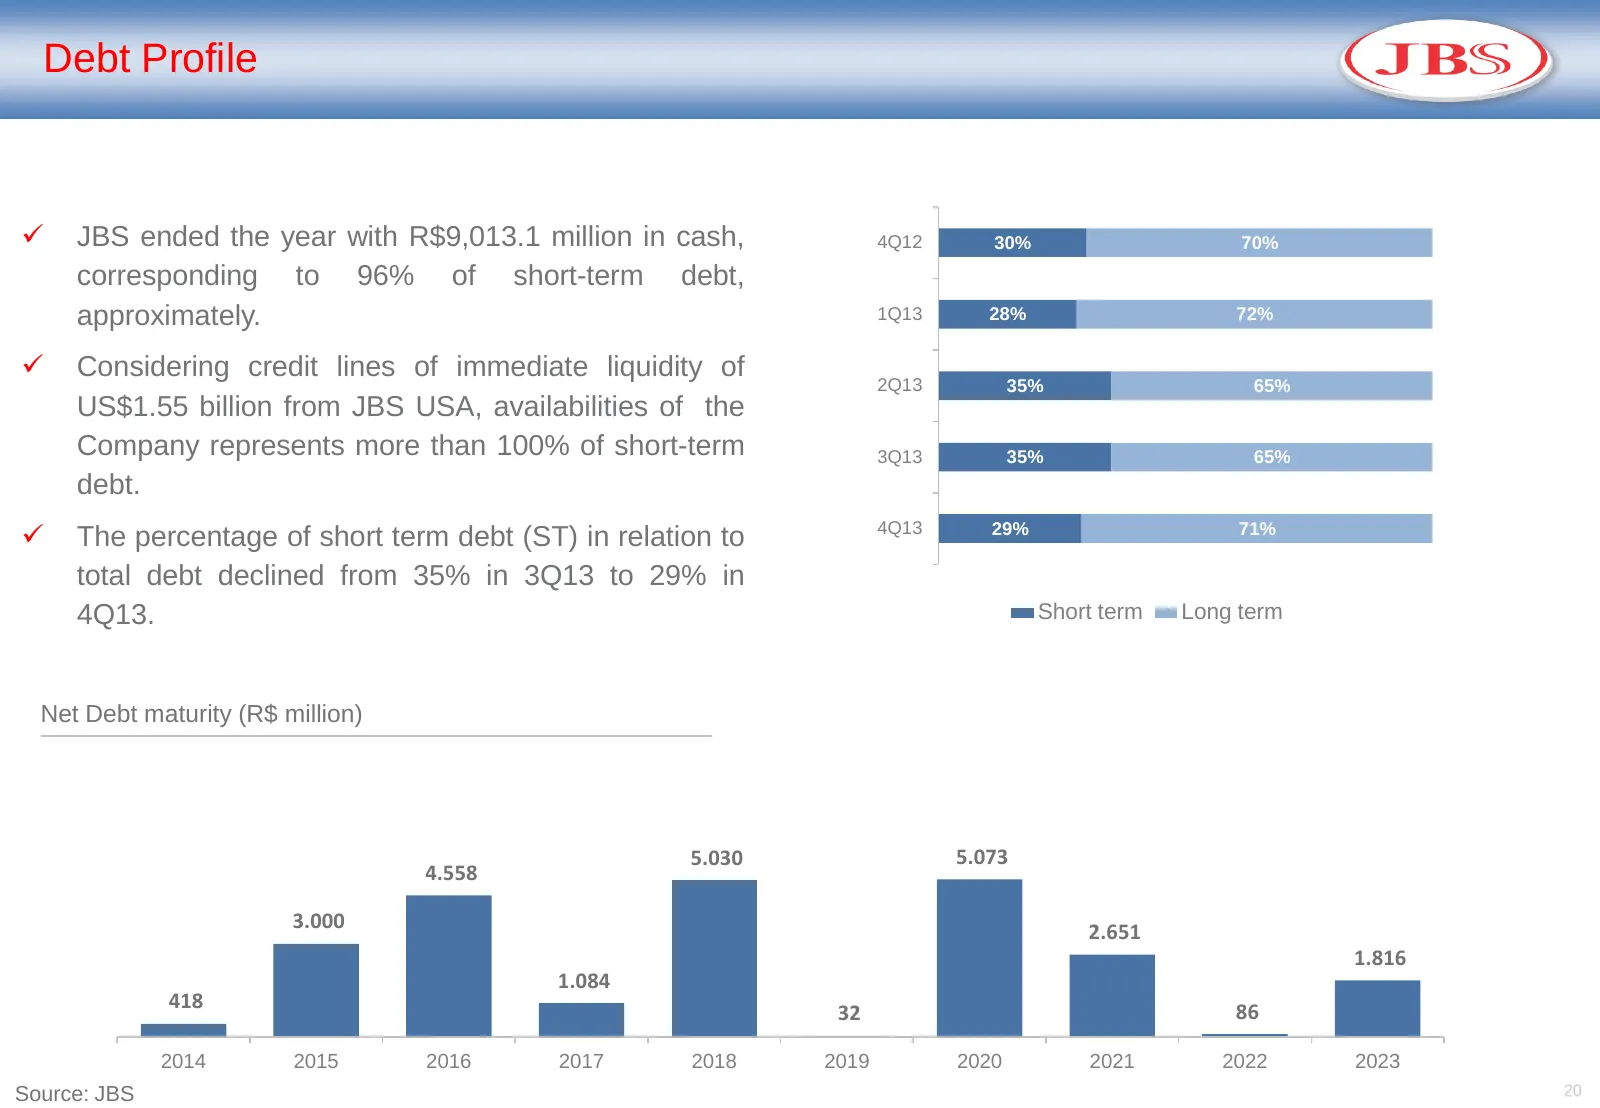
Debt Profile JBS ended the year with R$9,013.1 million in cash, 4Q12 30% 70% corresponding to 96% of short-term debt, approximately. 1Q13 28% 72% Considering credit lines of immediate liquidity of 2Q13 35% 65% US$1.55 billion from JBS USA, availabilities of the Company represents more than 100%
Slide 21: Stock Performance
Stock Performance (JBS)
Slide 22: Stock Performance
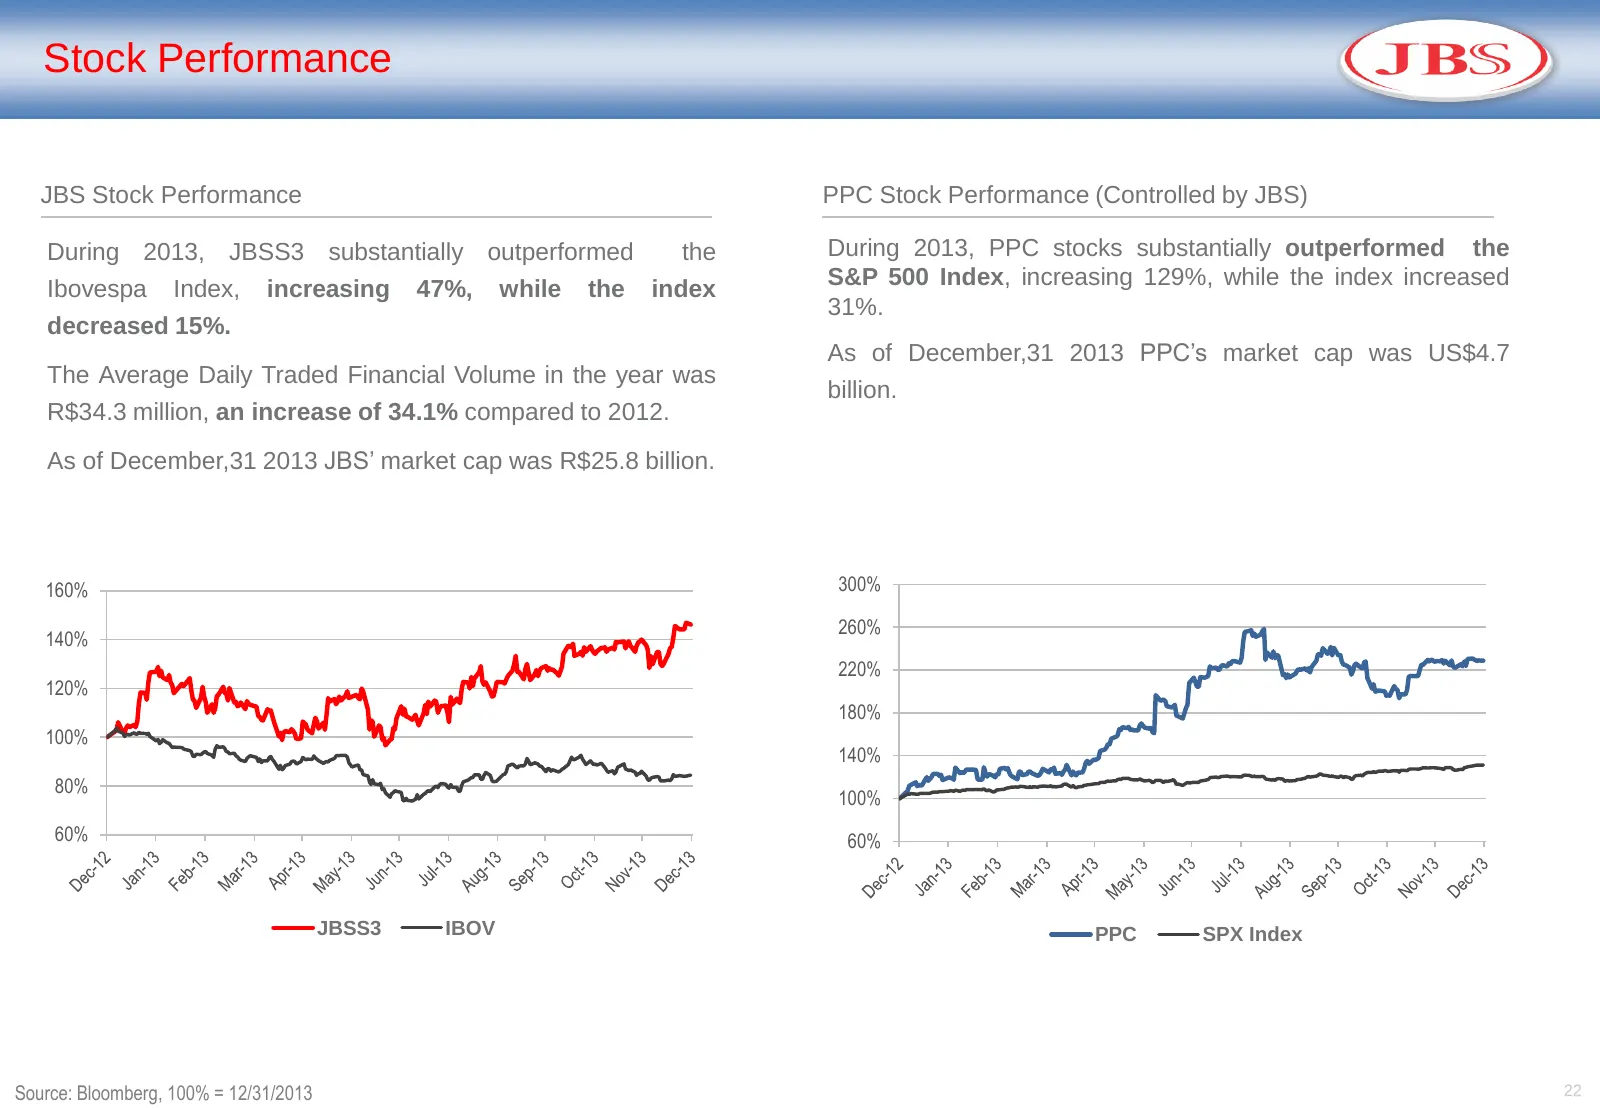
Stock Performance JBS Stock Performance PPC Stock Performance (Controlled by JBS) During 2013, JBSS3 substantially outperformed the During 2013, PPC stocks substantially outperformed the Ibovespa Index, increasing 47%, while the index S&P 500 Index, increasing 129%, while the index increased 31%. de
Slide 23: JBS Mercosul
JBS Mercosul (JBS)
Slide 24: JBS Mercosul
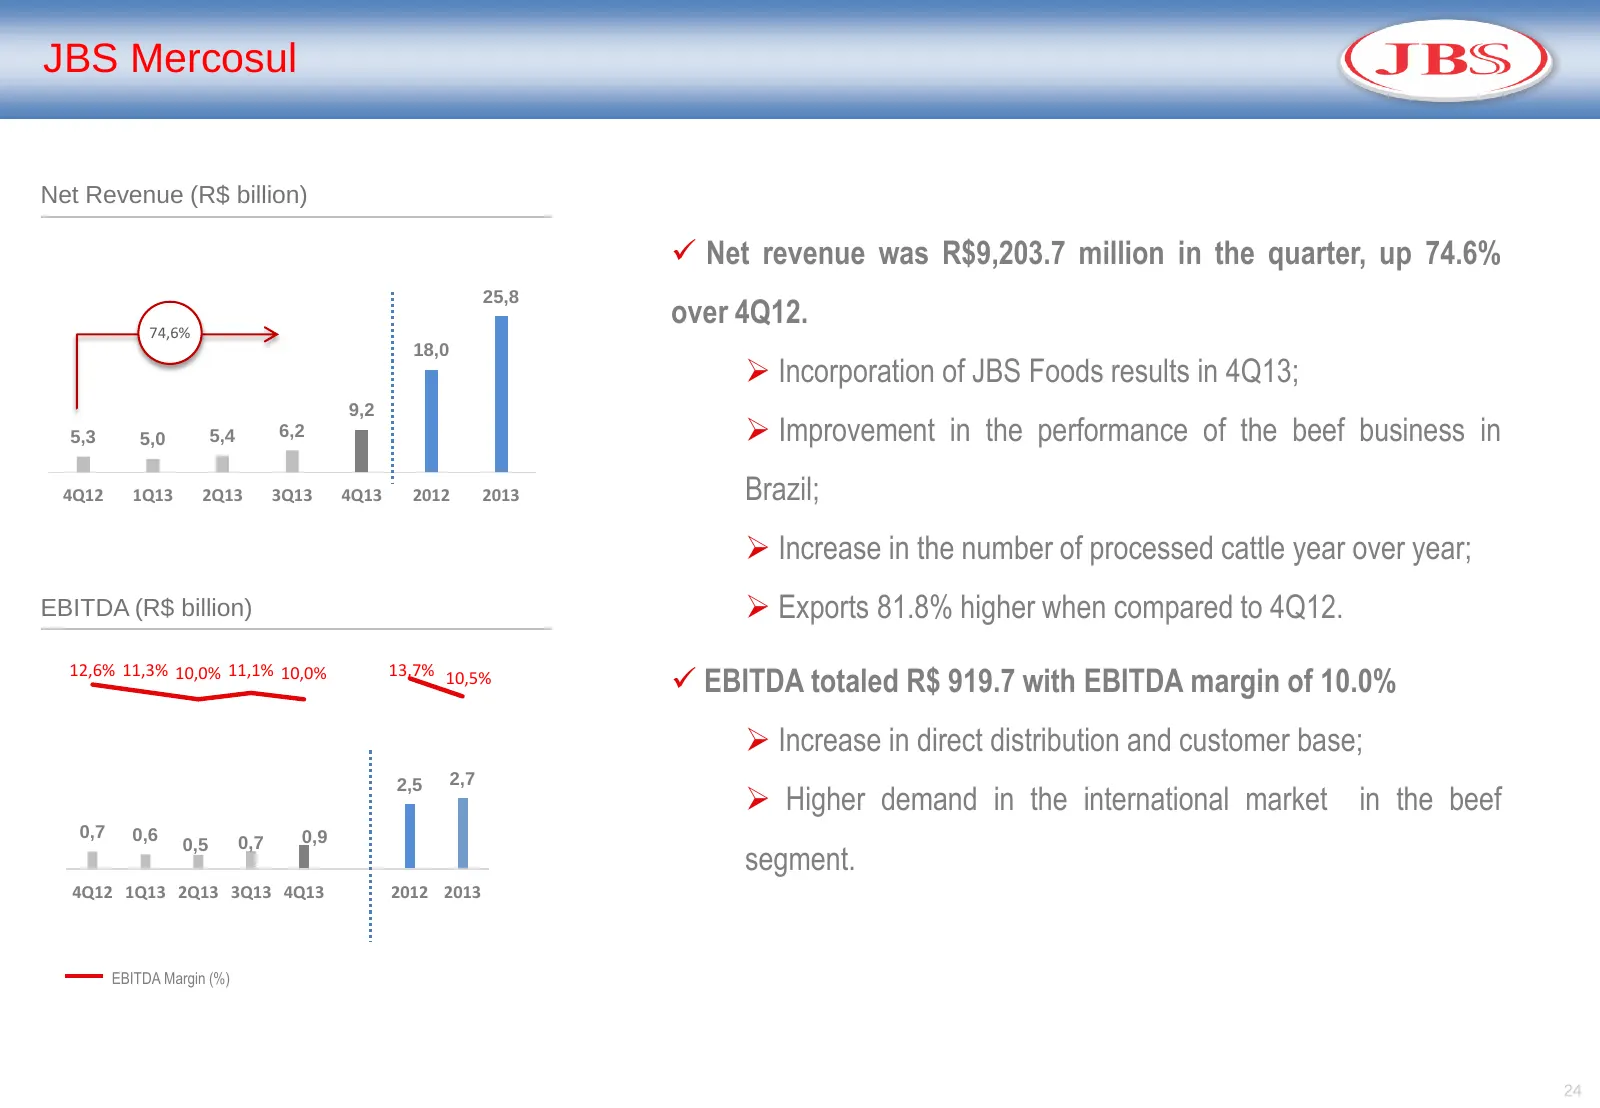
JBS Mercosul Net Revenue (R$ billion) Net revenue was R$9,203.7 million in the quarter, up 74.6% 25,8 74,6% over 4Q12. 18,0 Incorporation of JBS Foods results in 4Q13; 9,2 5,3 5,0 5,4 6,2 Improvement in the performance of the beef business in 4Q12 1Q13 2Q13 3Q13 4Q13 2012 2013 Brazil; Increa
Slide 25: JBS Mercosul Geographic Footprint and Capacity
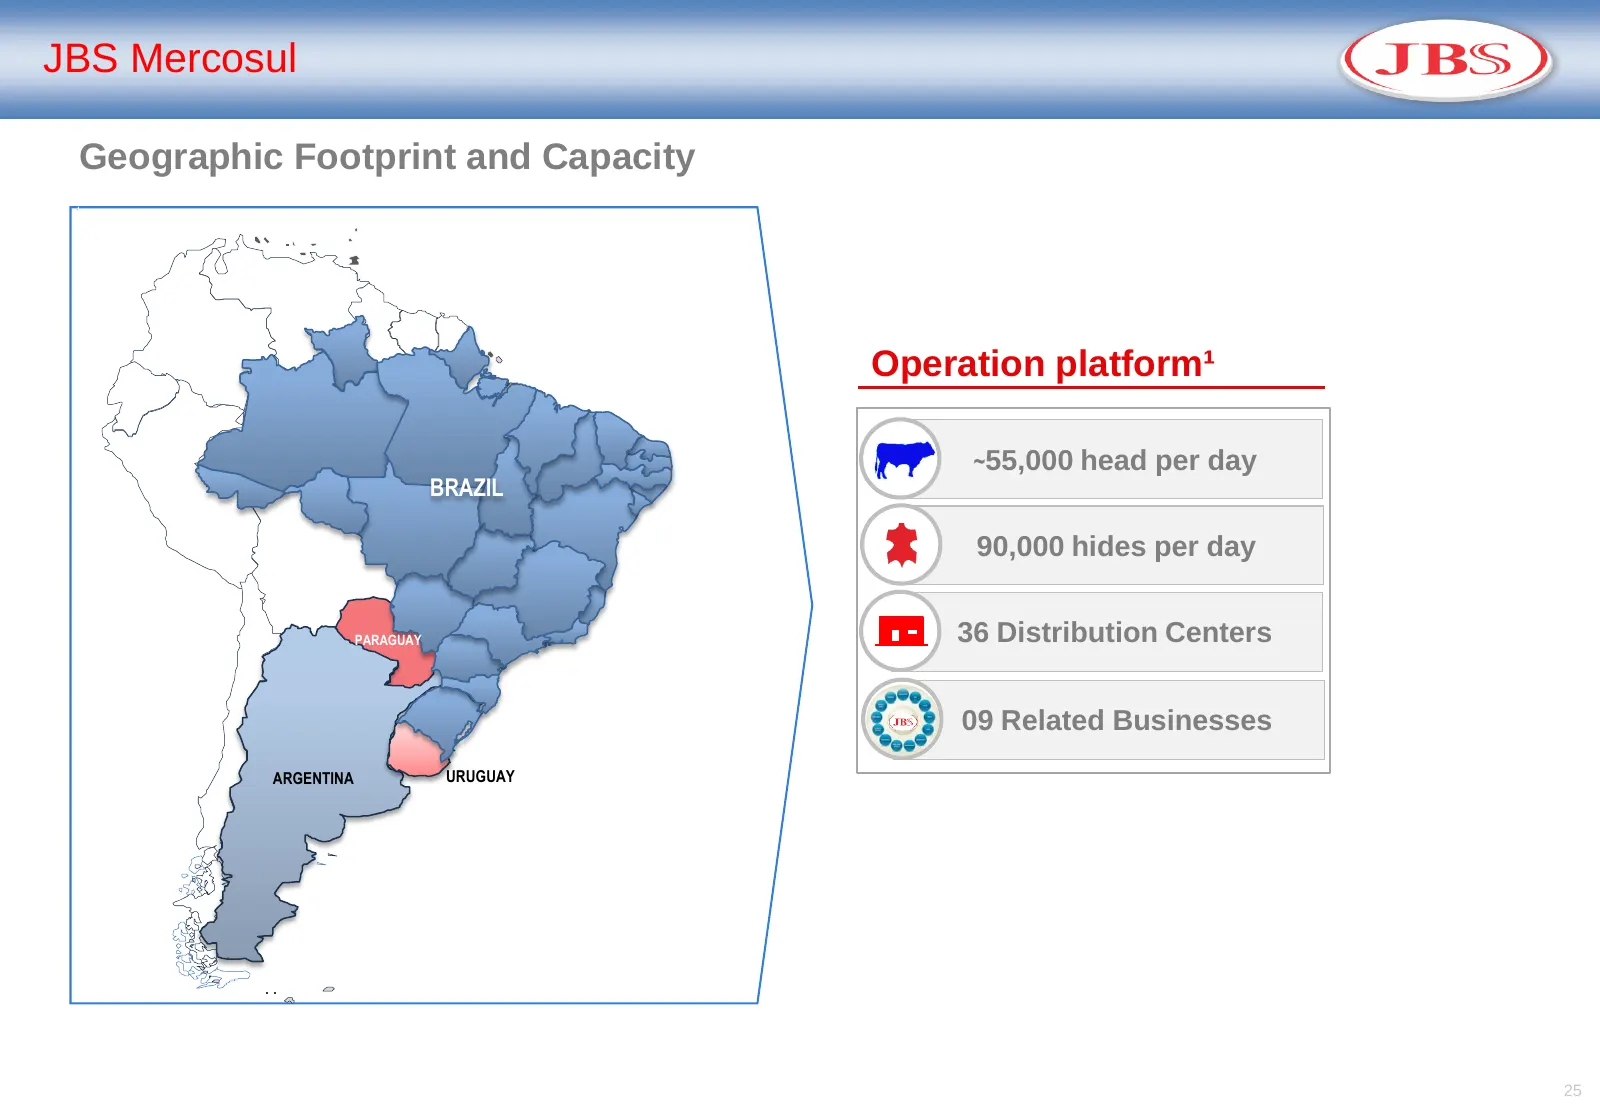
JBS Mercosul Geographic Footprint and Capacity Operation platform¹ ~55,000 head per day BRAZIL 90,000 hides per day PARAGUAY 36 Distribution Centers 09 Related Businesses ARGENTINA URUGUAY 25
Slide 26: JBS Uruguay
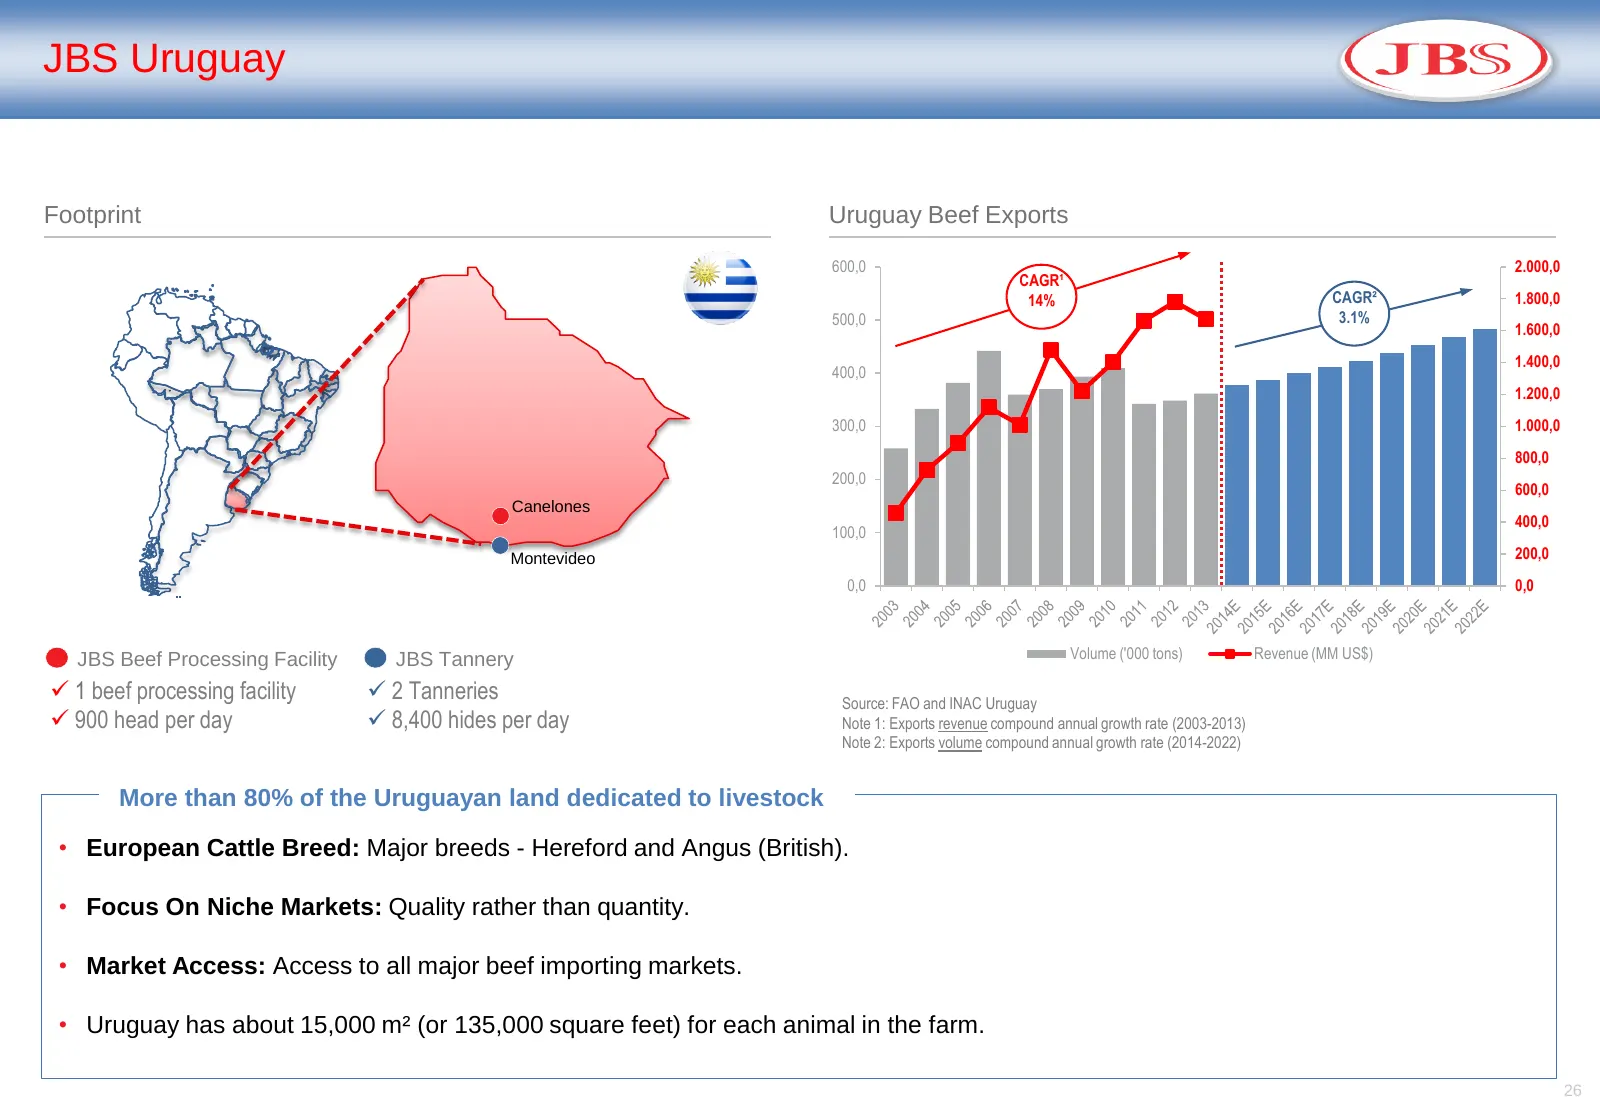
JBS Uruguay Footprint Uruguay Beef Exports 600,0 2.000,0 CAGR¹ 14% CAGR² 1.800,0 500,0 3.1% 1.600,0 1.400,0 400,0 1.200,0 300,0 1.000,0 800,0 200,0 600,0 Canelones 400,0 100,0 Montevideo 200,0 0,0 0,0 JBS Beef Processing Facility JBS Tannery Volume ('000 tons) Revenue (MM US$) 1 beef processing fa
Slide 27: JBS Paraguay
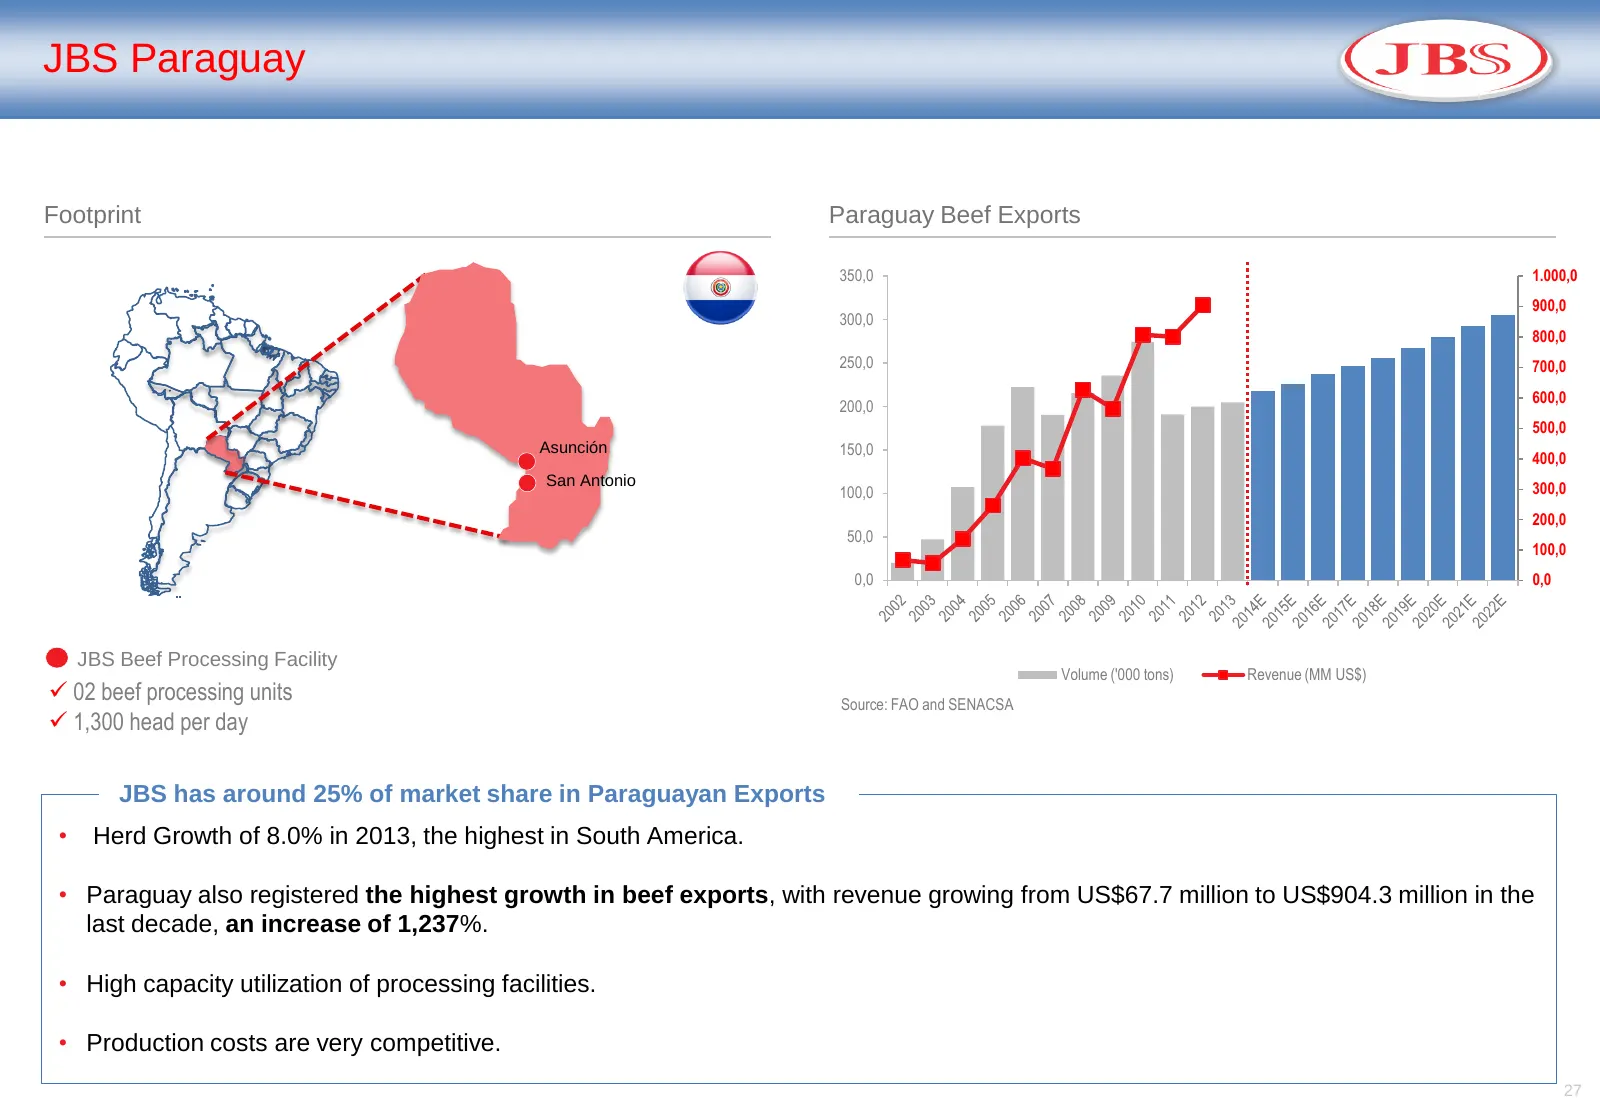
JBS Paraguay Footprint Paraguay Beef Exports 350,0 1.000,0 900,0 300,0 800,0 250,0 700,0 600,0 200,0 500,0 Asunción 150,0 400,0 San Antonio 100,0 300,0 200,0 50,0 100,0 0,0 0,0 JBS Beef Processing Facility Volume ('000 tons) Revenue (MM US$) 02 beef processing units Source: FAO and SENACSA 1,300
Slide 28: JBS Argentina
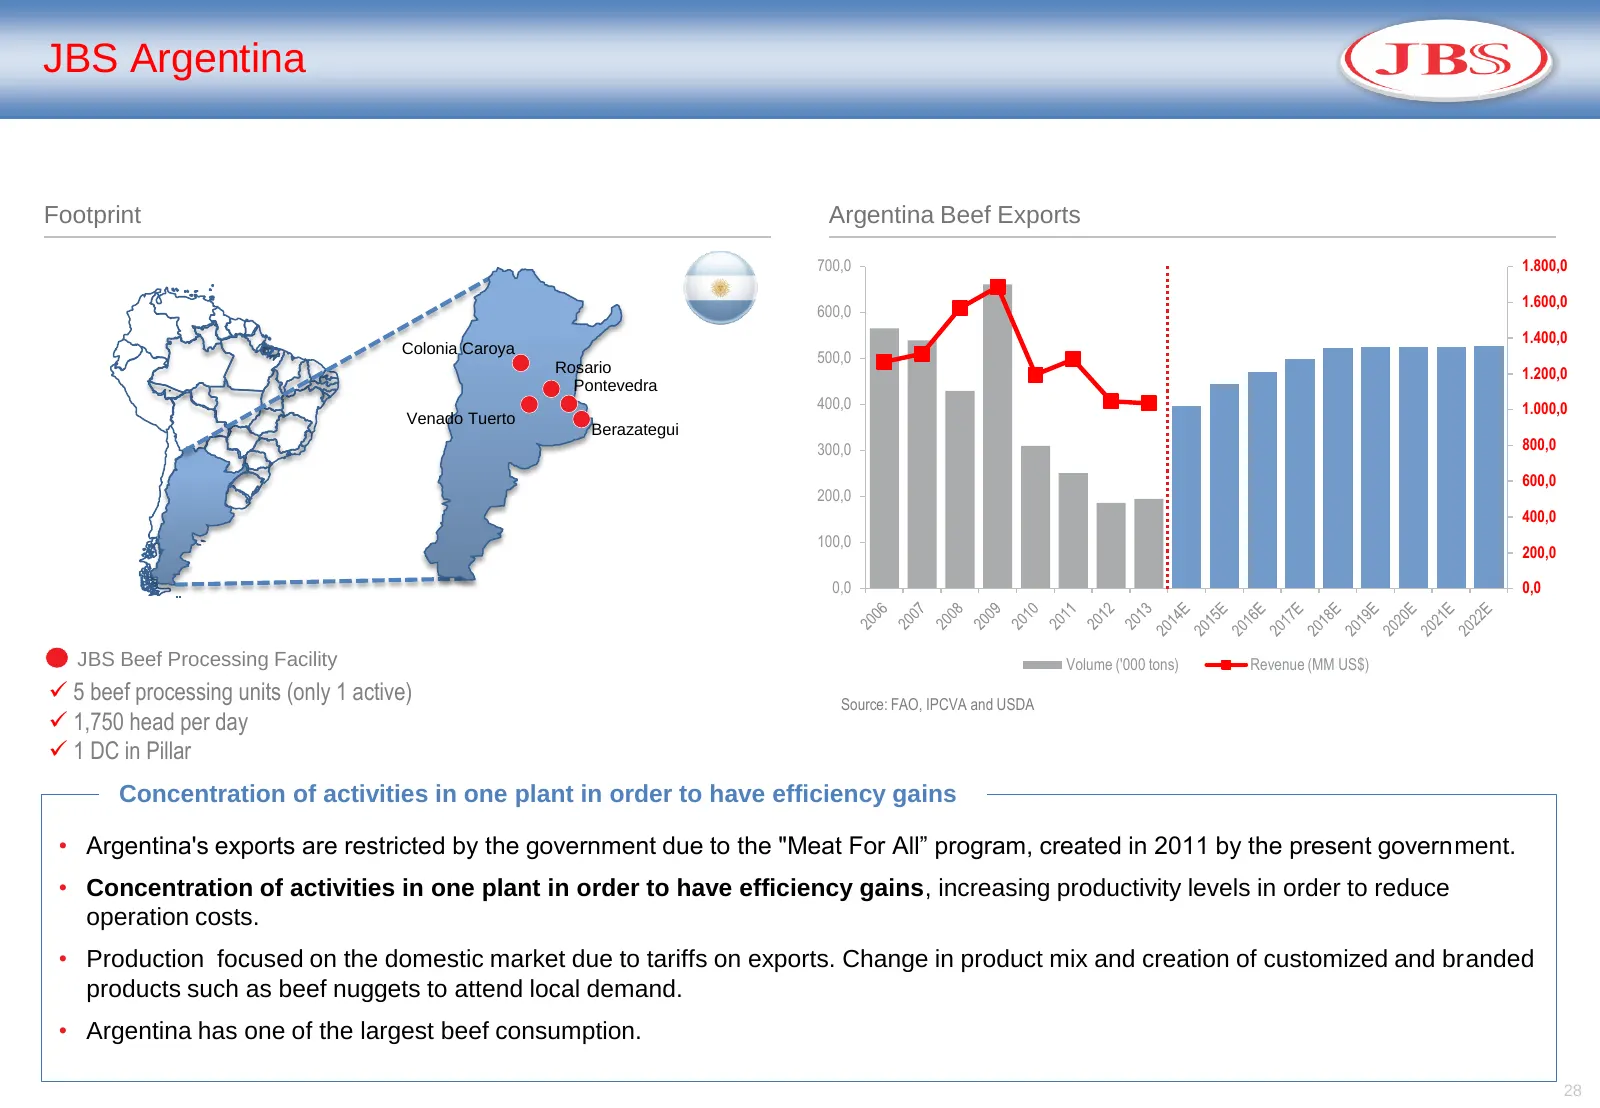
JBS Argentina Footprint Argentina Beef Exports 700,0 1.800,0 1.600,0 600,0 1.400,0 Colonia Caroya 500,0 Rosario 1.200,0 Pontevedra 400,0 1.000,0 Venado Tuerto Berazategui 300,0 800,0 600,0 200,0 400,0 100,0 200,0 0,0 0,0 JBS Beef Processing Facility Volume ('000 tons) Revenue (MM US$) 5 beef proce
Slide 29: JBS Brazil
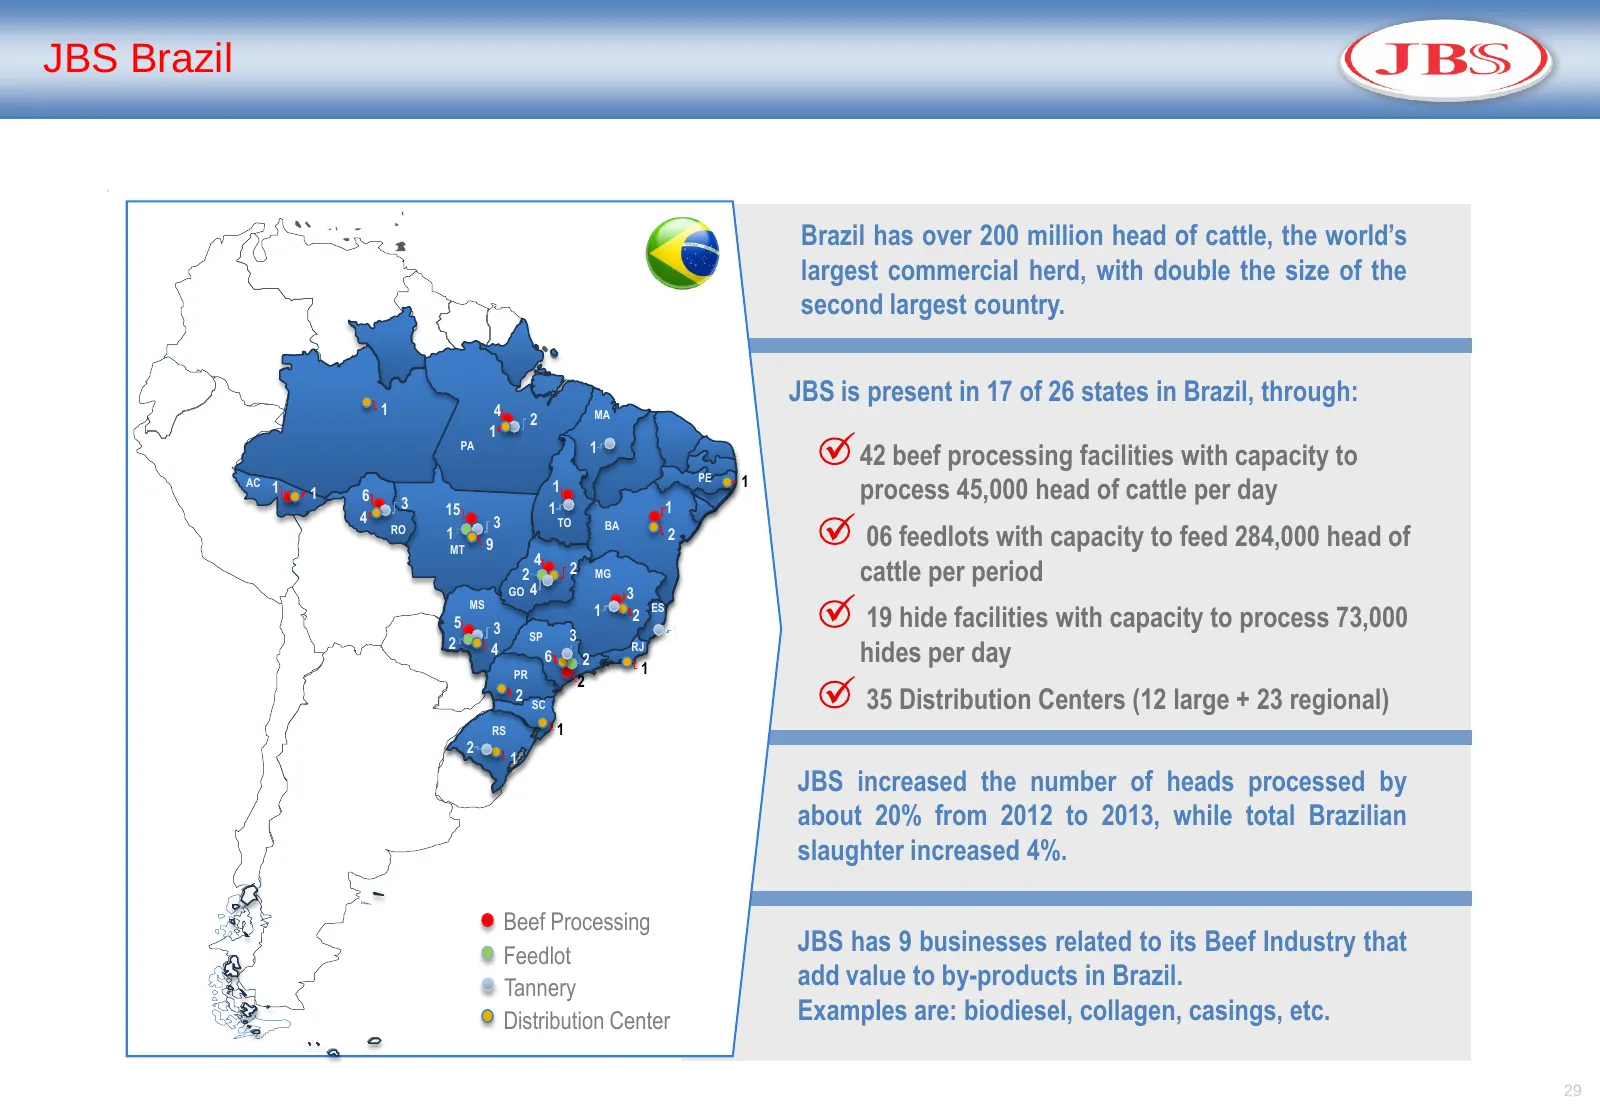
JBS Brazil Brazil has over 200 million head of cattle, the world’s largest commercial herd, with double the size of the second largest country. 1 JBS is present in 17 of 26 states in Brazil, through: 4 MA 2 1 PA 1 PE 42 beef processing facilities with capacity to 1 AC 1 1 6 3 1 1 process 45,000 he
Slide 30: JBS Brazil
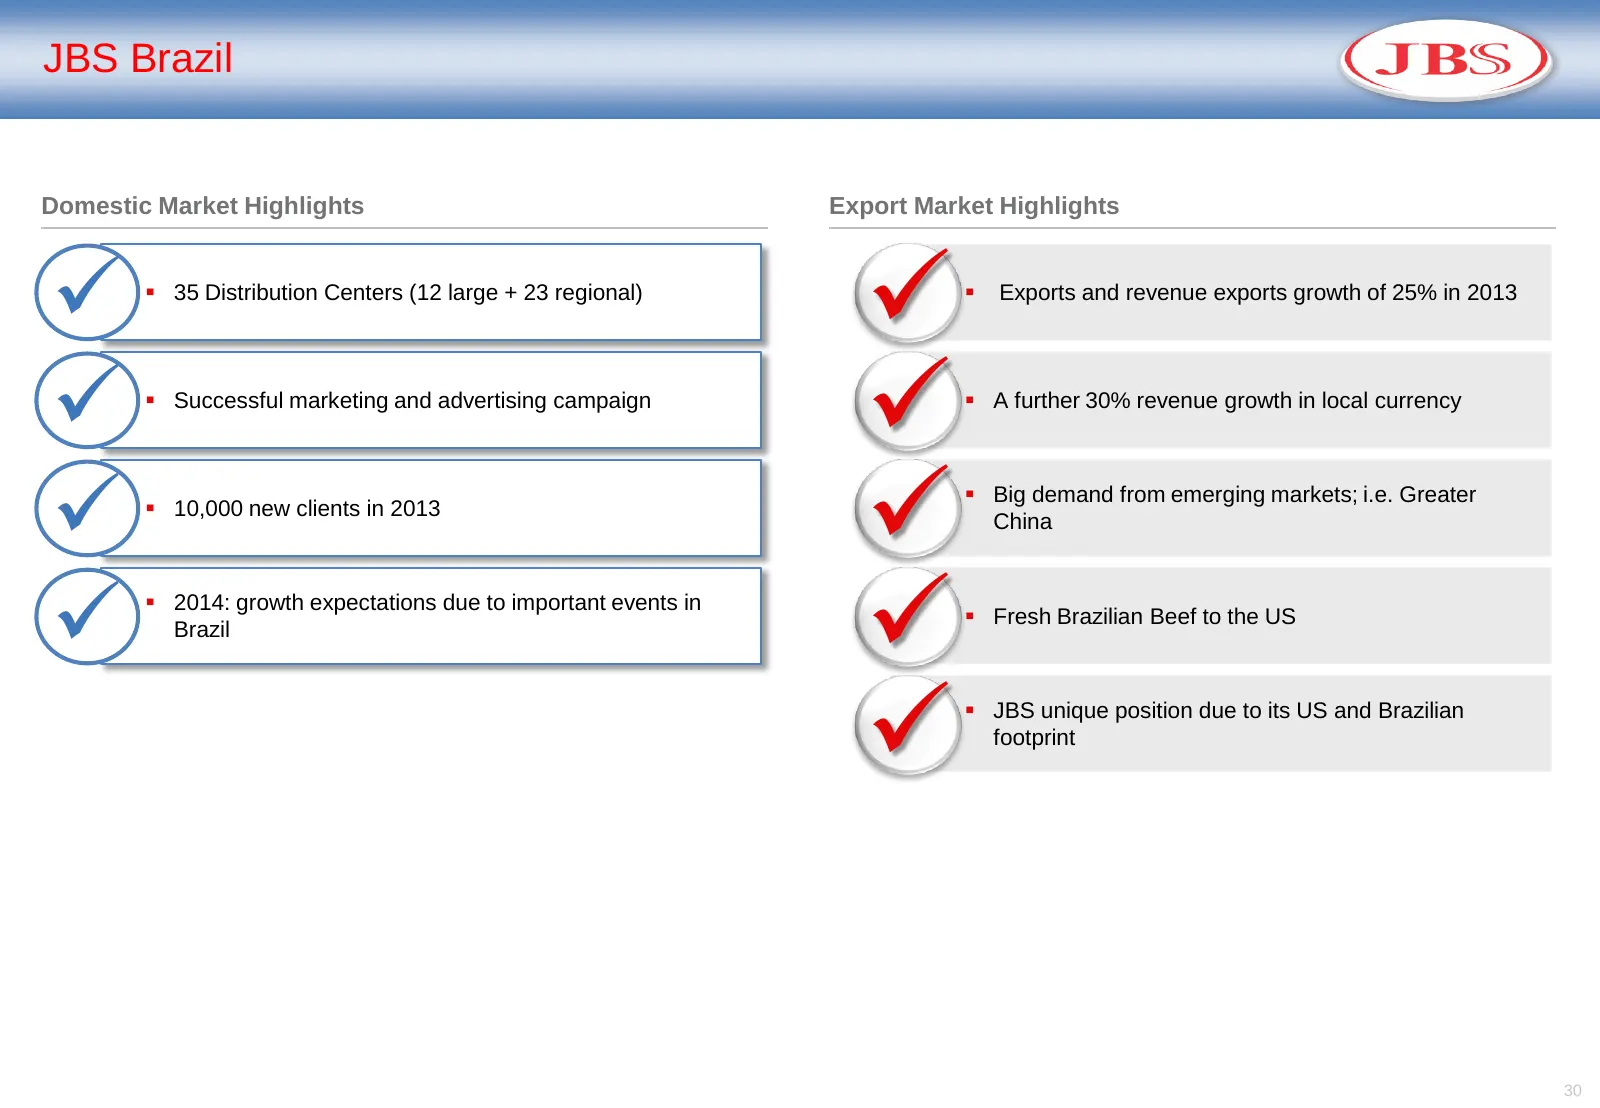
JBS Brazil Domestic Market Highlights Export Market Highlights 35 Distribution Centers (12 large + 23 regional) Exports and revenue exports growth of 25% in 2013 Successful marketing and advertising campaign A further 30% revenue growth in local currency 10,000 new clients in 201
Slide 31: JBS Leather Business
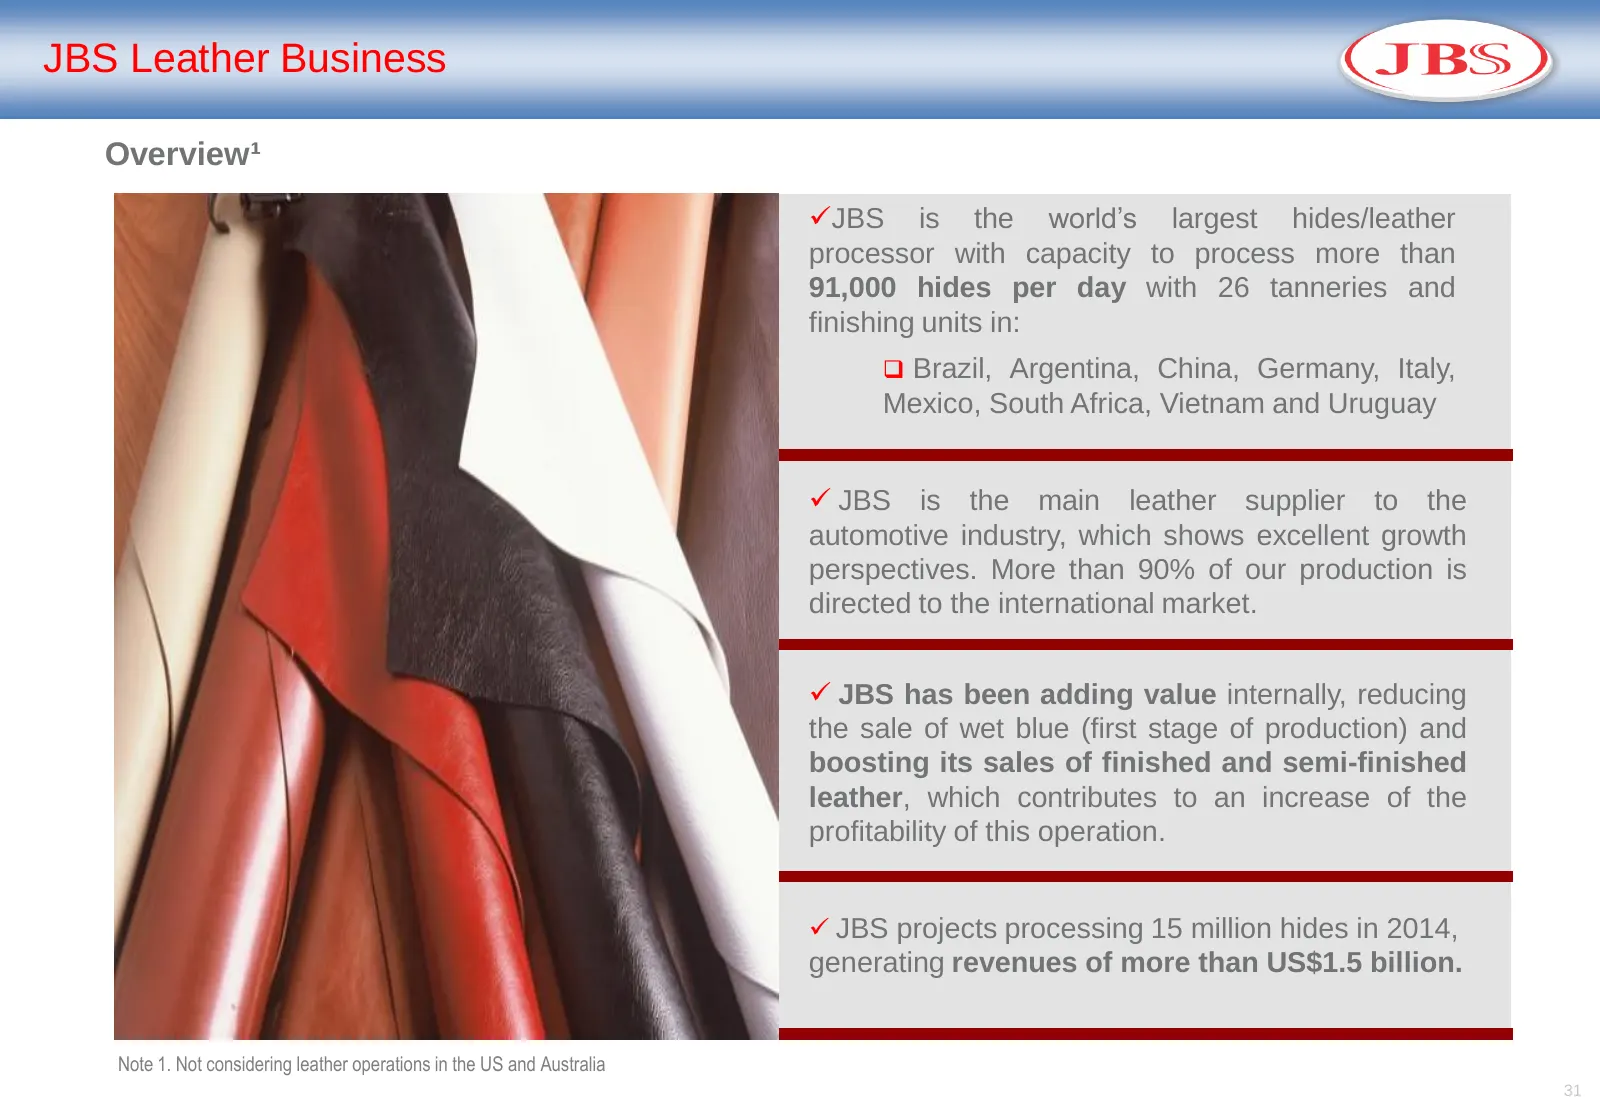
JBS Leather Business Overview¹ JBS is the world’s largest hides/leather processor with capacity to process more than 91,000 hides per day with 26 tanneries and finishing units in: Brazil, Argentina, China, Germany, Italy, Mexico, South Africa, Vietnam and Uruguay JBS is the main leather supplie
Slide 32: JBS Related Businesses in Brazil
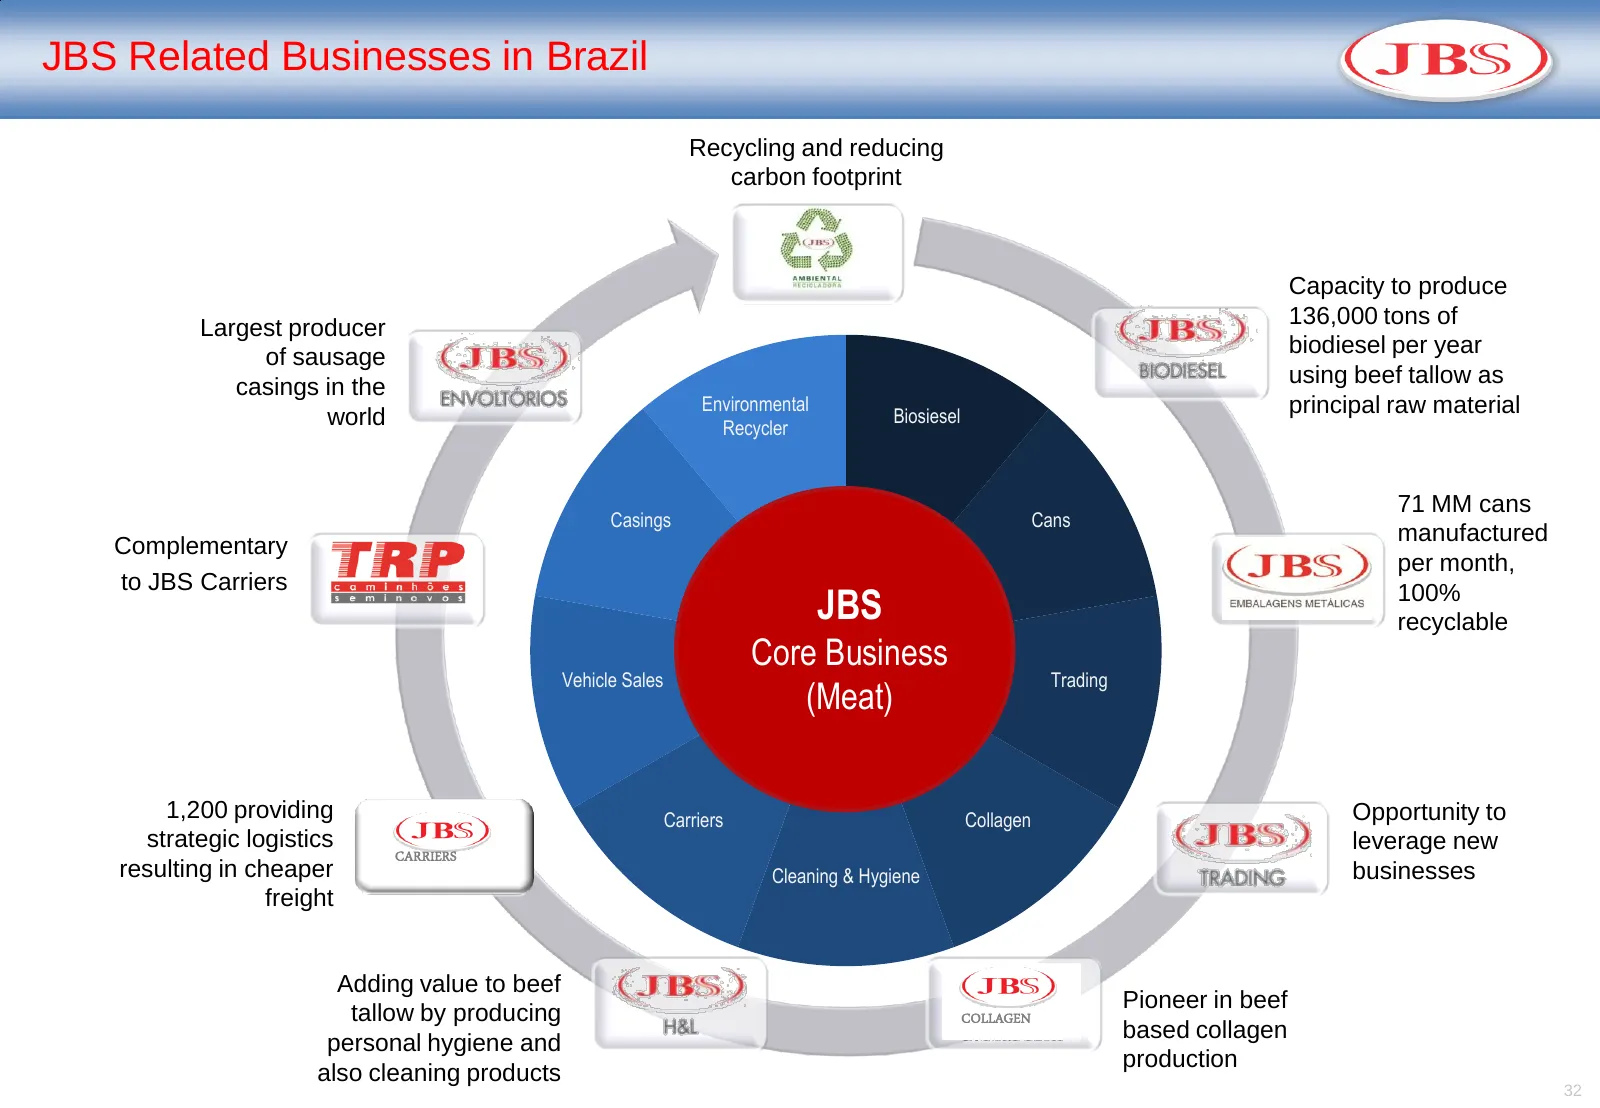
JBS Related Businesses in Brazil Recycling and reducing carbon footprint Capacity to produce Largest producer 136,000 tons of of sausage biodiesel per year casings in the using beef tallow as Environmental principal raw material world Biosiesel Recycler 71 MM cans Casings Cans manufactured Complemen
Slide 33: Closing Remarks JBS Mercosul
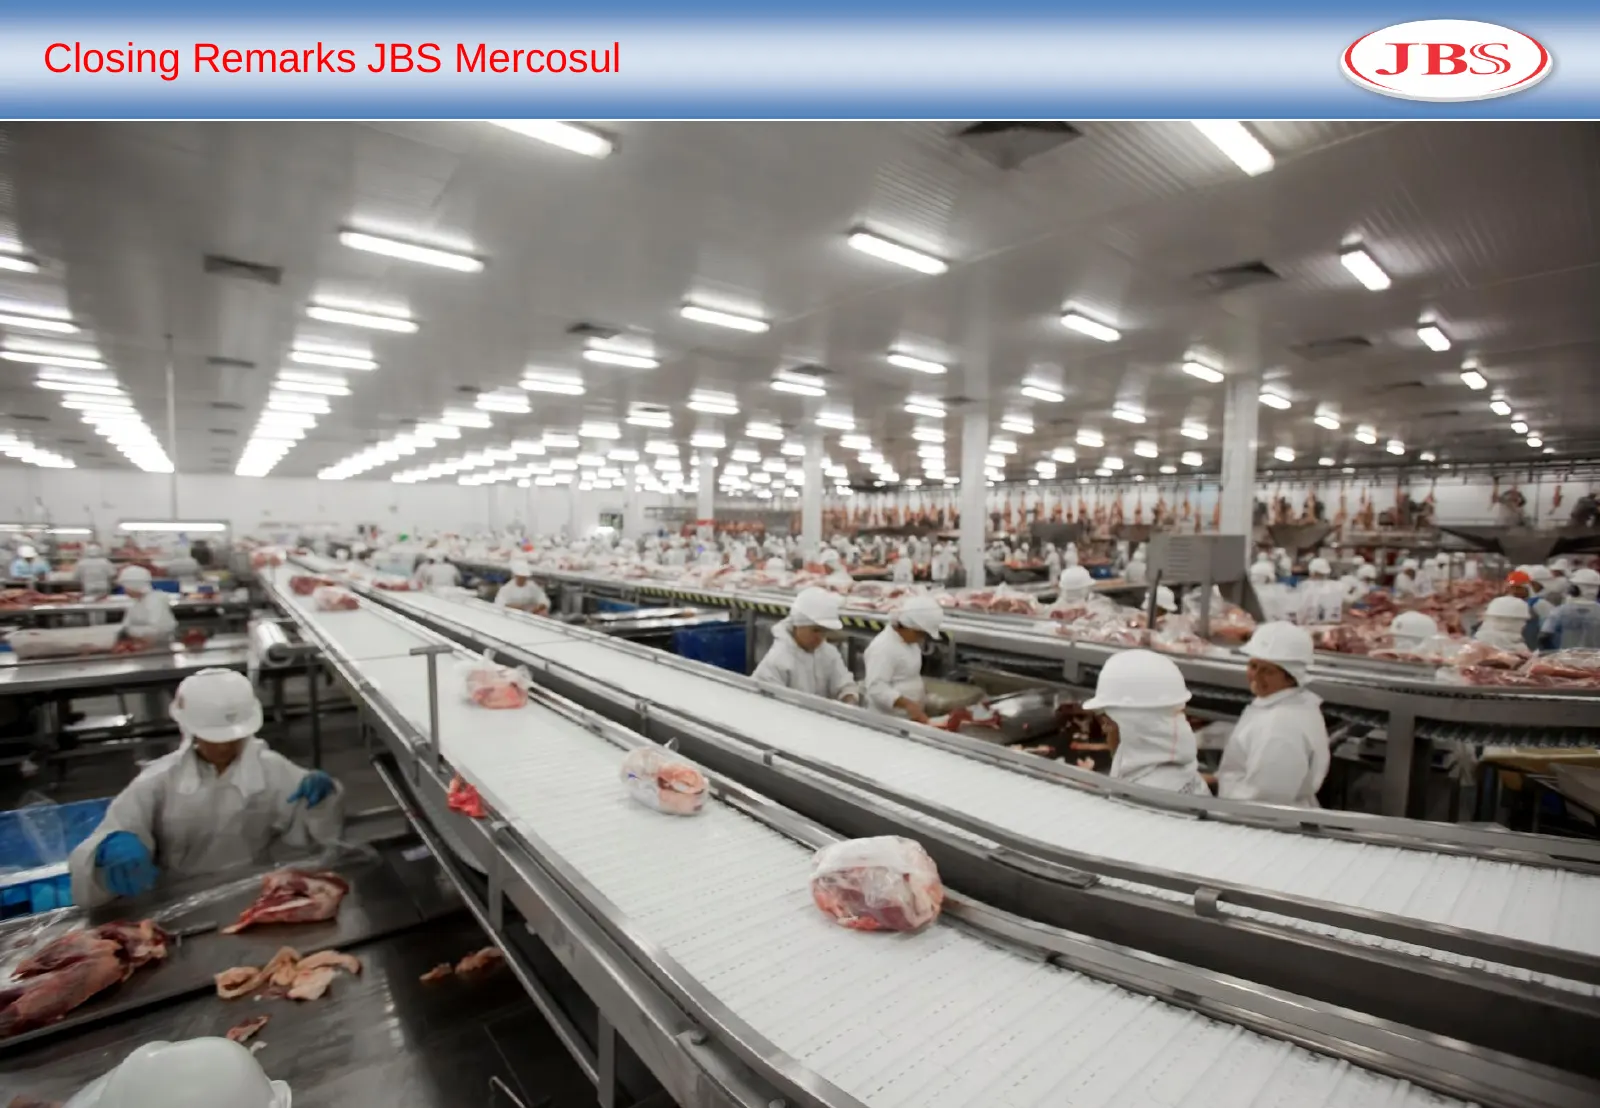
Closing Remarks JBS Mercosul 33
Slide 34: JBS USA
JBS USA (JBS)
Slide 35: JBS USA at a Glance
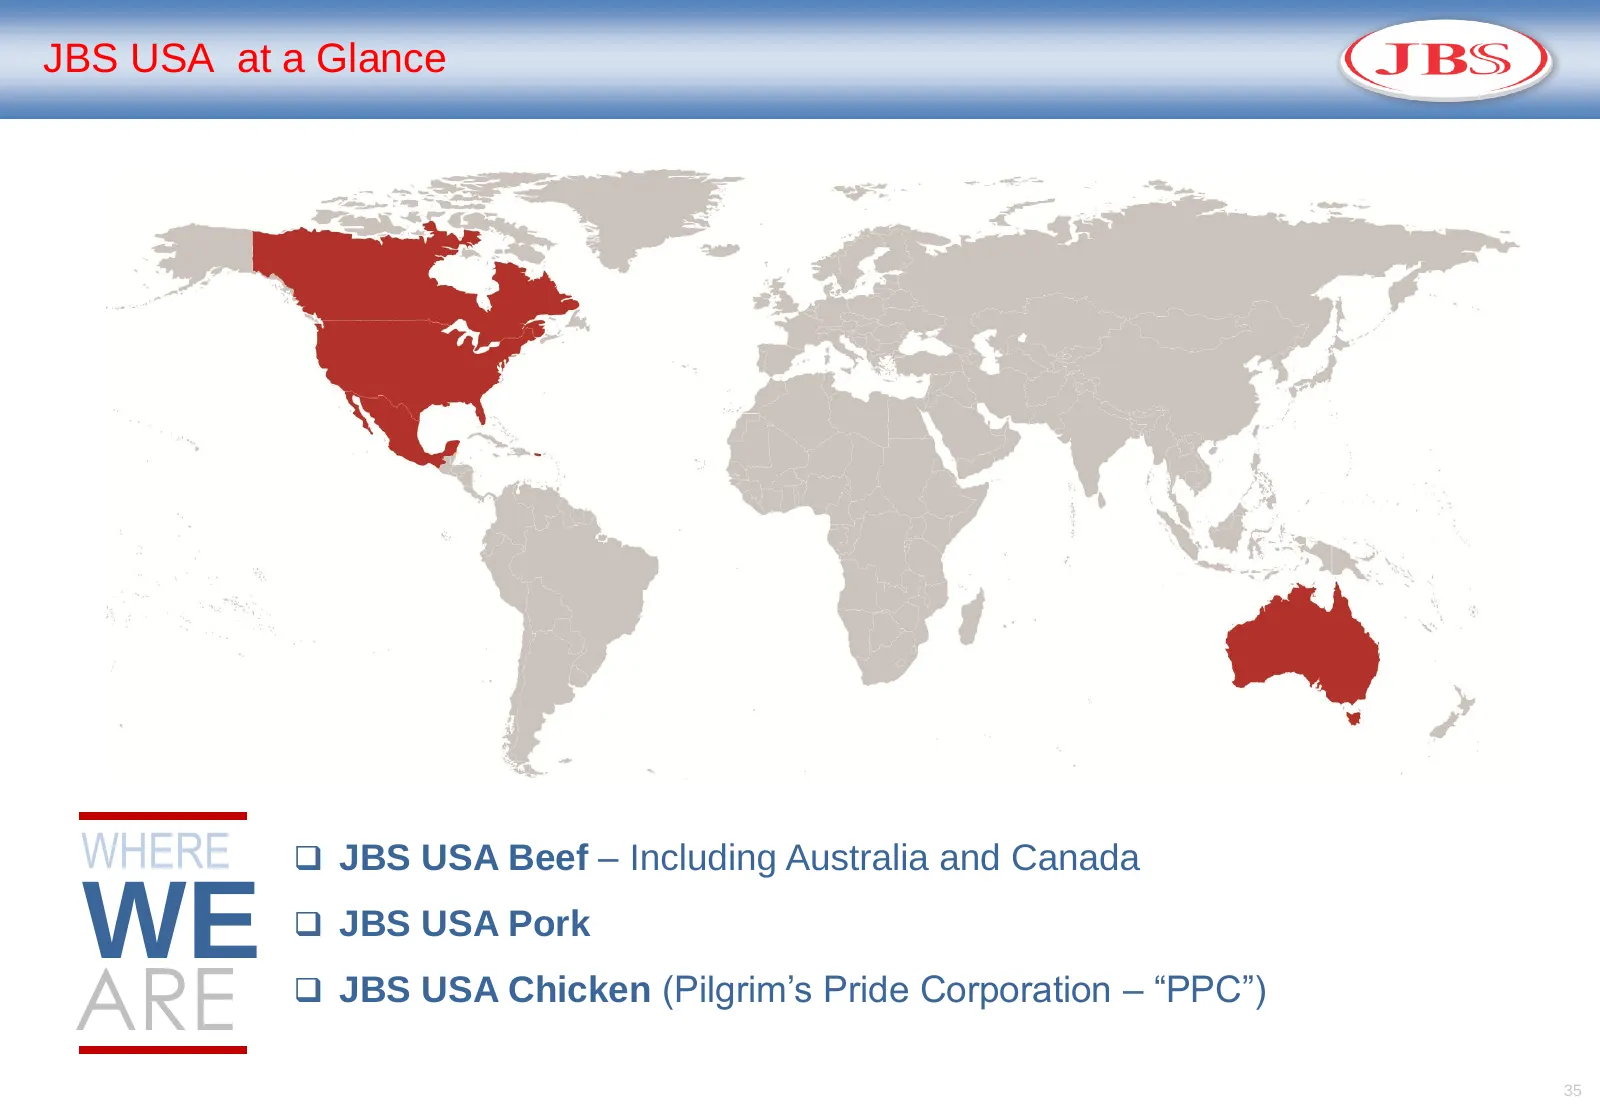
JBS USA at a Glance WHERE JBS USA Beef – Including Australia and Canada WE JBS USA Pork ARE JBS USA Chicken (Pilgrim’s Pride Corporation – “PPC”) 35
Slide 36: Why North America / Australia?
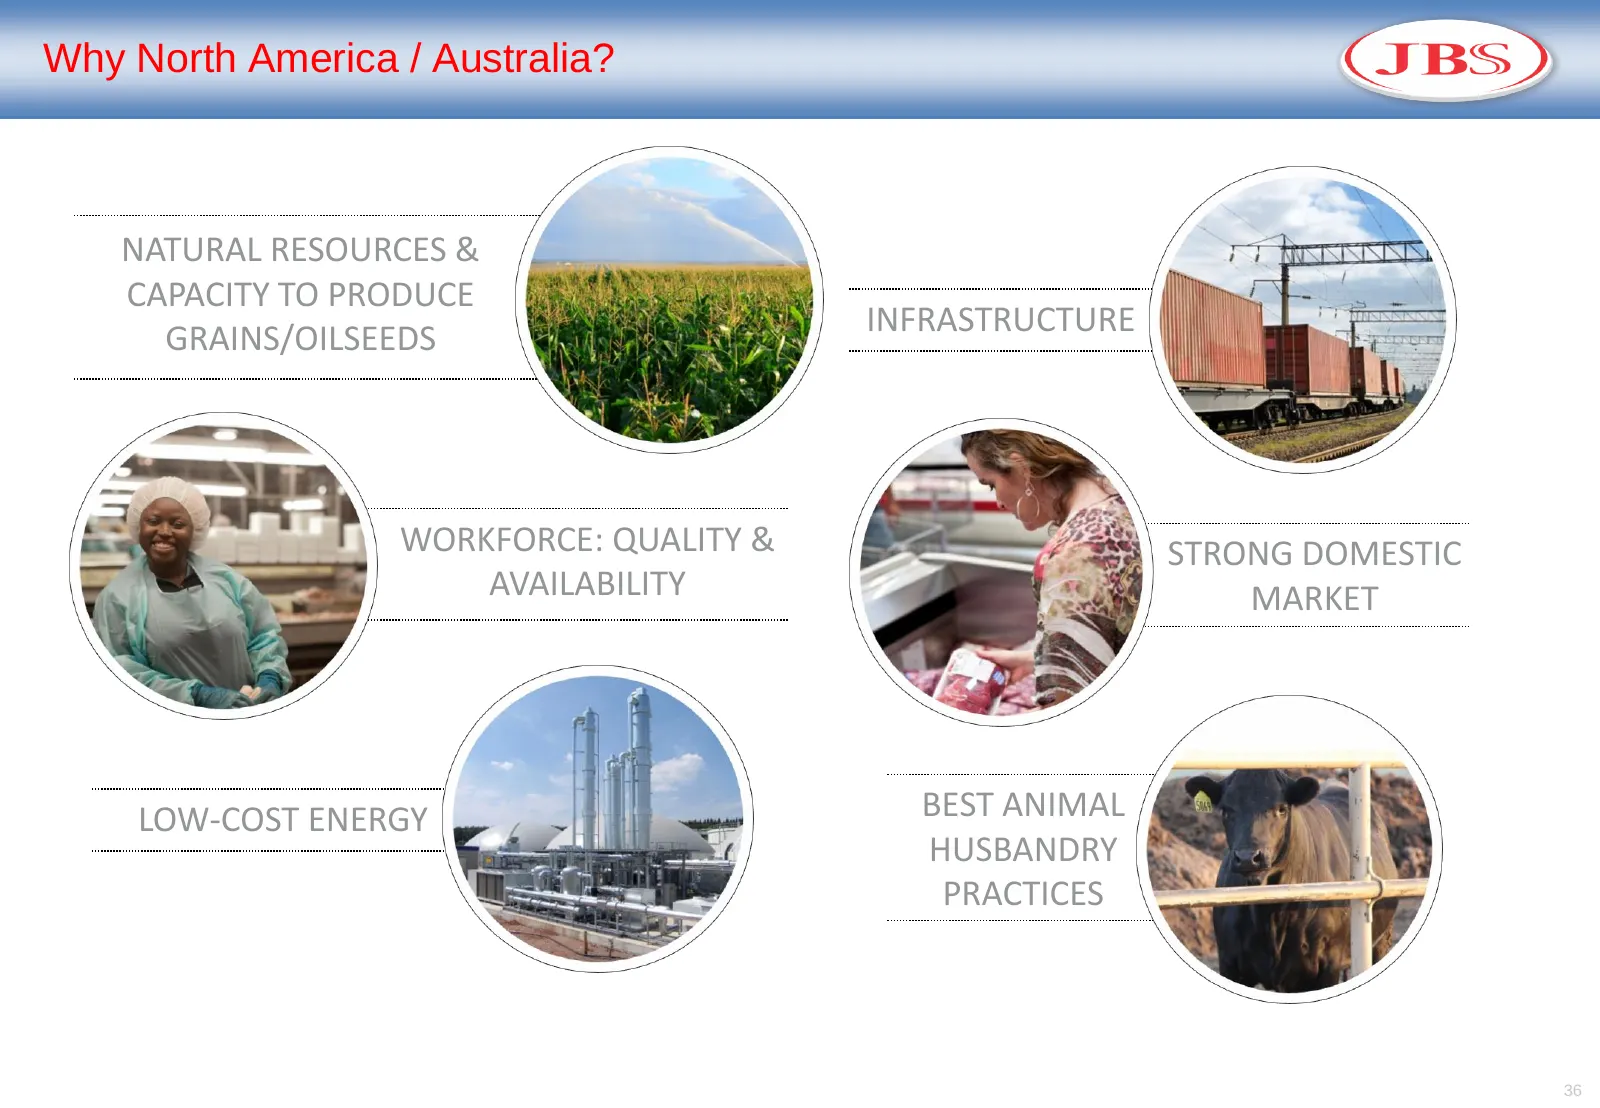
Why North America / Australia? NATURAL RESOURCES & CAPACITY TO PRODUCE INFRASTRUCTURE GRAINS/OILSEEDS WORKFORCE: QUALITY & STRONG DOMESTIC AVAILABILITY MARKET LOW-COST ENERGY BEST ANIMAL HUSBANDRY PRACTICES 36
Slide 37: Why North America / Australia? Top Exporters
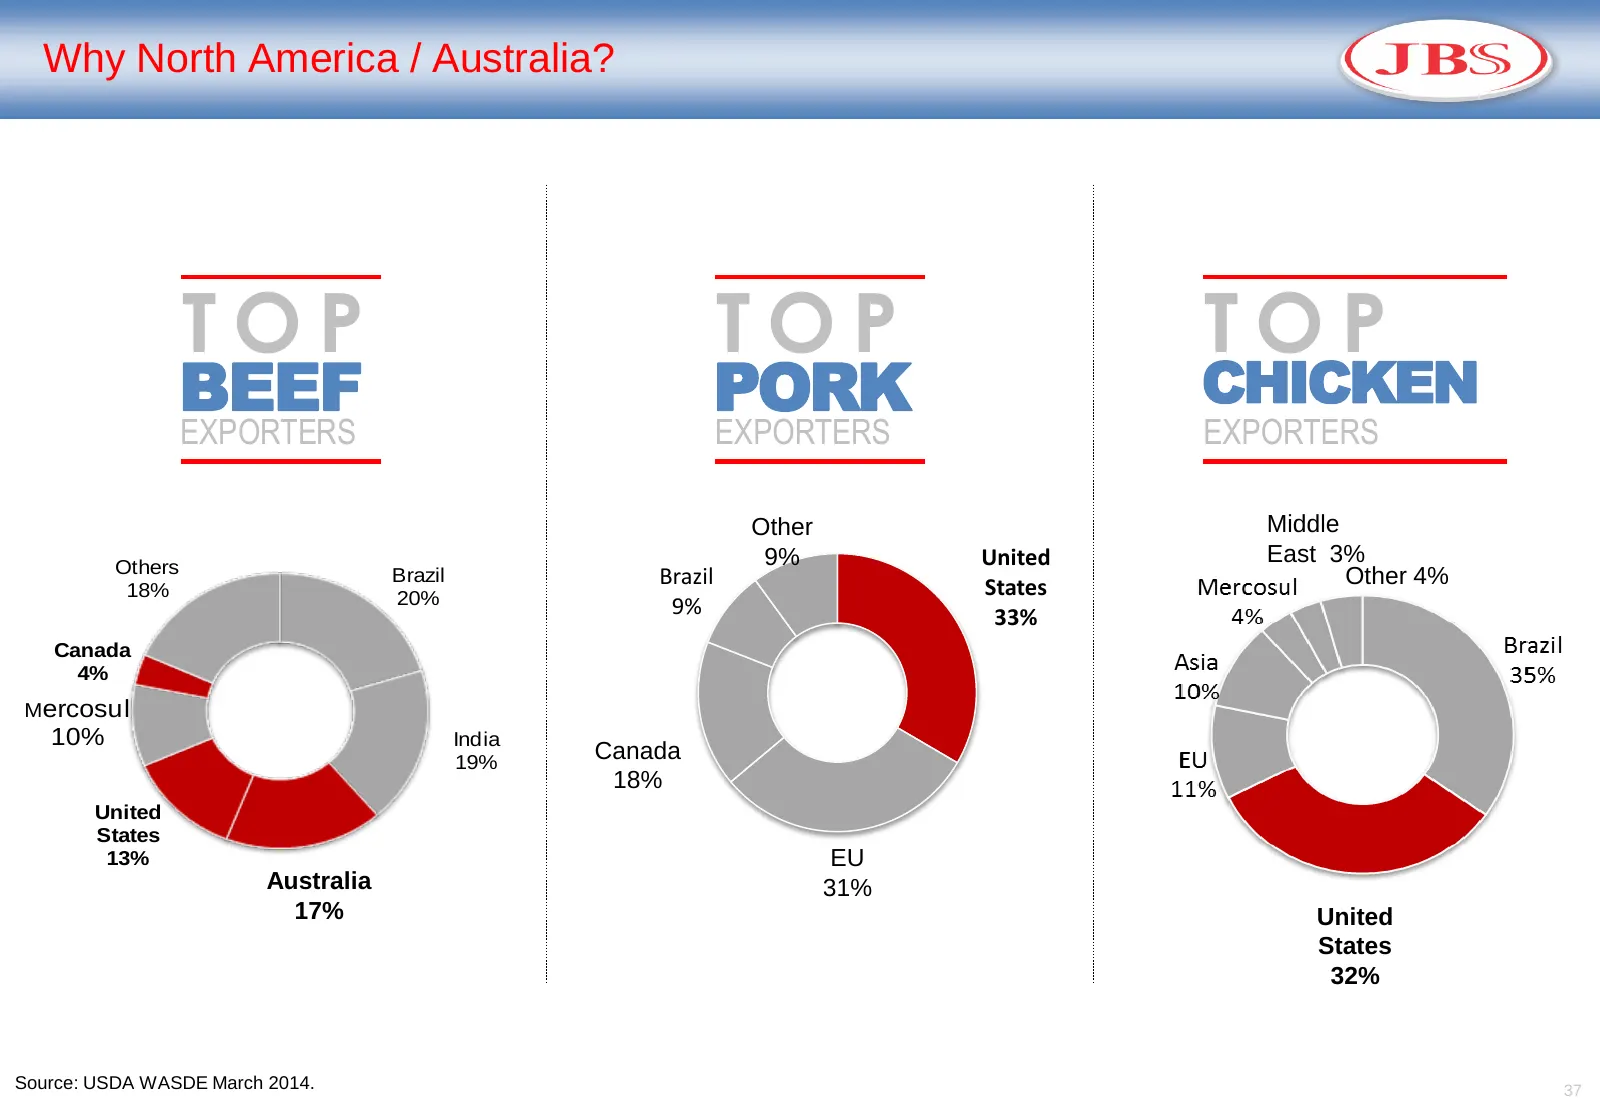
Why North America / Australia? TOP TOP TOP BEEF PORK CHICKEN EXPORTERS EXPORTERS EXPORTERS Other Middle Others 9% United East 3% Brazil Brazil States Other 4% 18% 20% 9% 33% Canada 4% Mercosul 10% India 19% Canada 18% United States 13% EU Australia 31% 17% United States 32% Source: USDA WASDE March
Slide 38: Why North America / Australia? Exports share of production
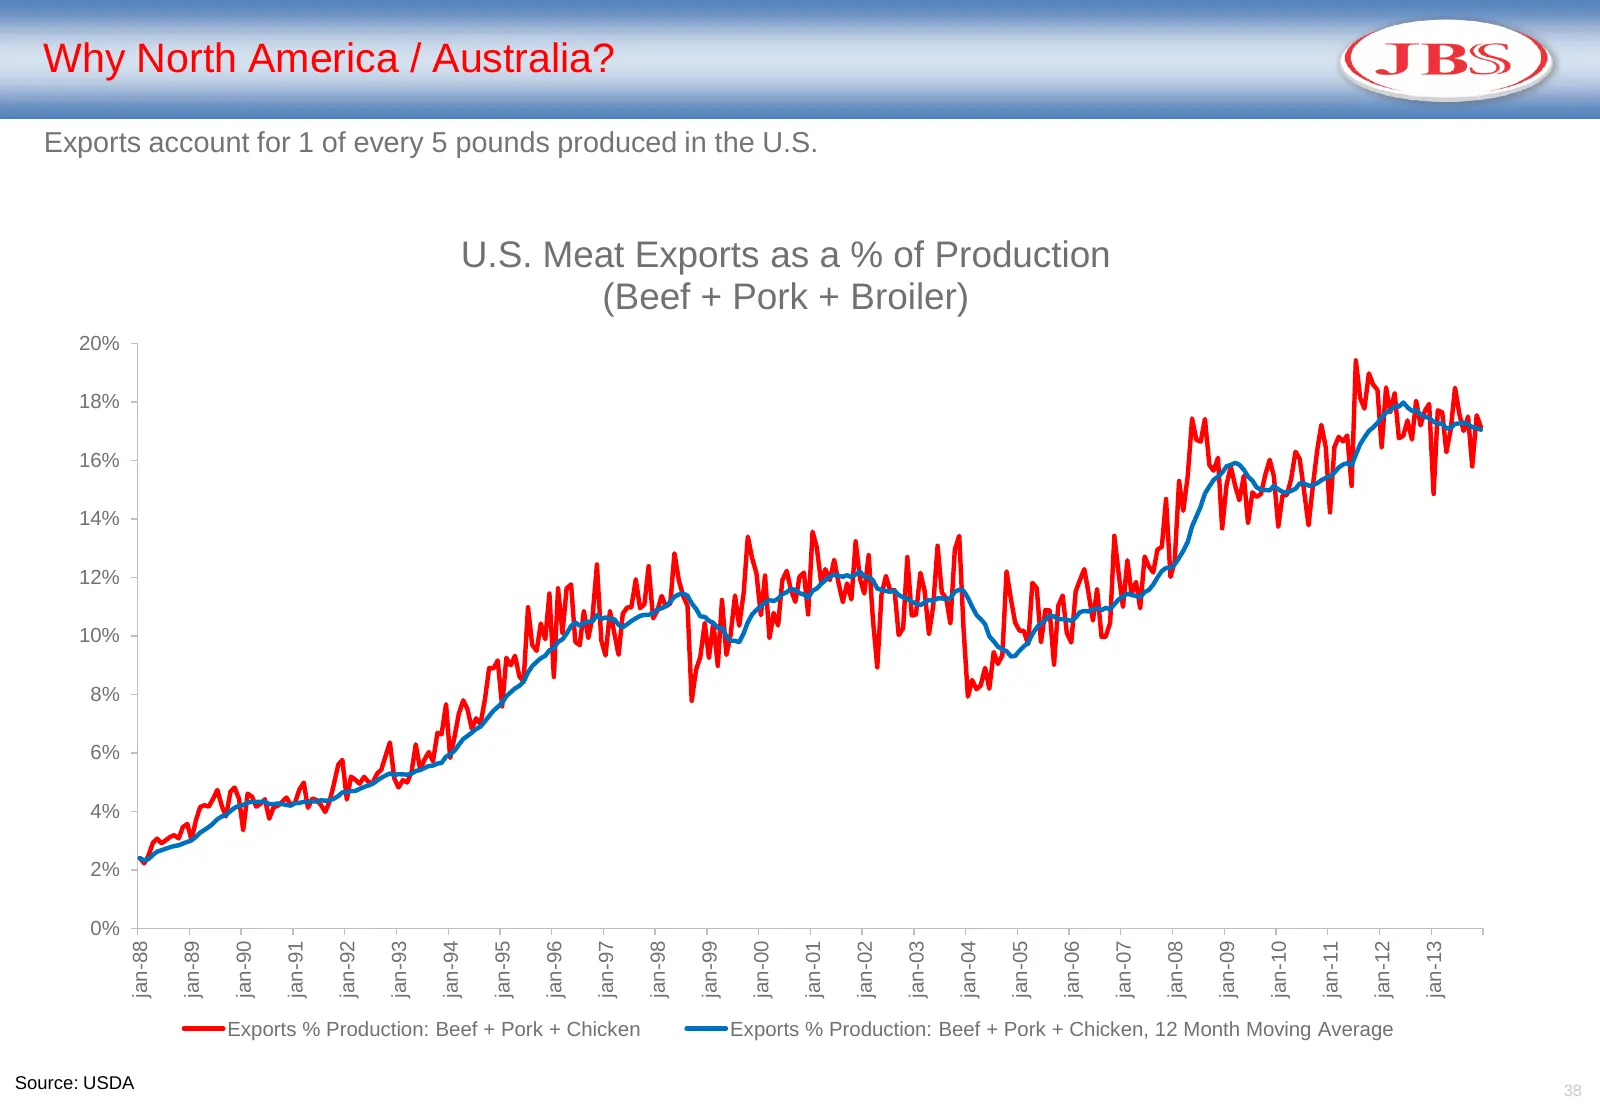
Why North America / Australia? Exports account for 1 of every 5 pounds produced in the U.S. U.S. Meat Exports as a % of Production (Beef + Pork + Broiler) 20% 18% 16% 14% 12% 10% 8% 6% 4% 2% 0% jan-04 jan-88 jan-89 jan-90 jan-91 jan-92 jan-93 jan-94 jan-95 jan-96 jan-97 jan-98 jan-99 jan-00 jan-01 j
Slide 39: Why North America / Australia? Beef Exports
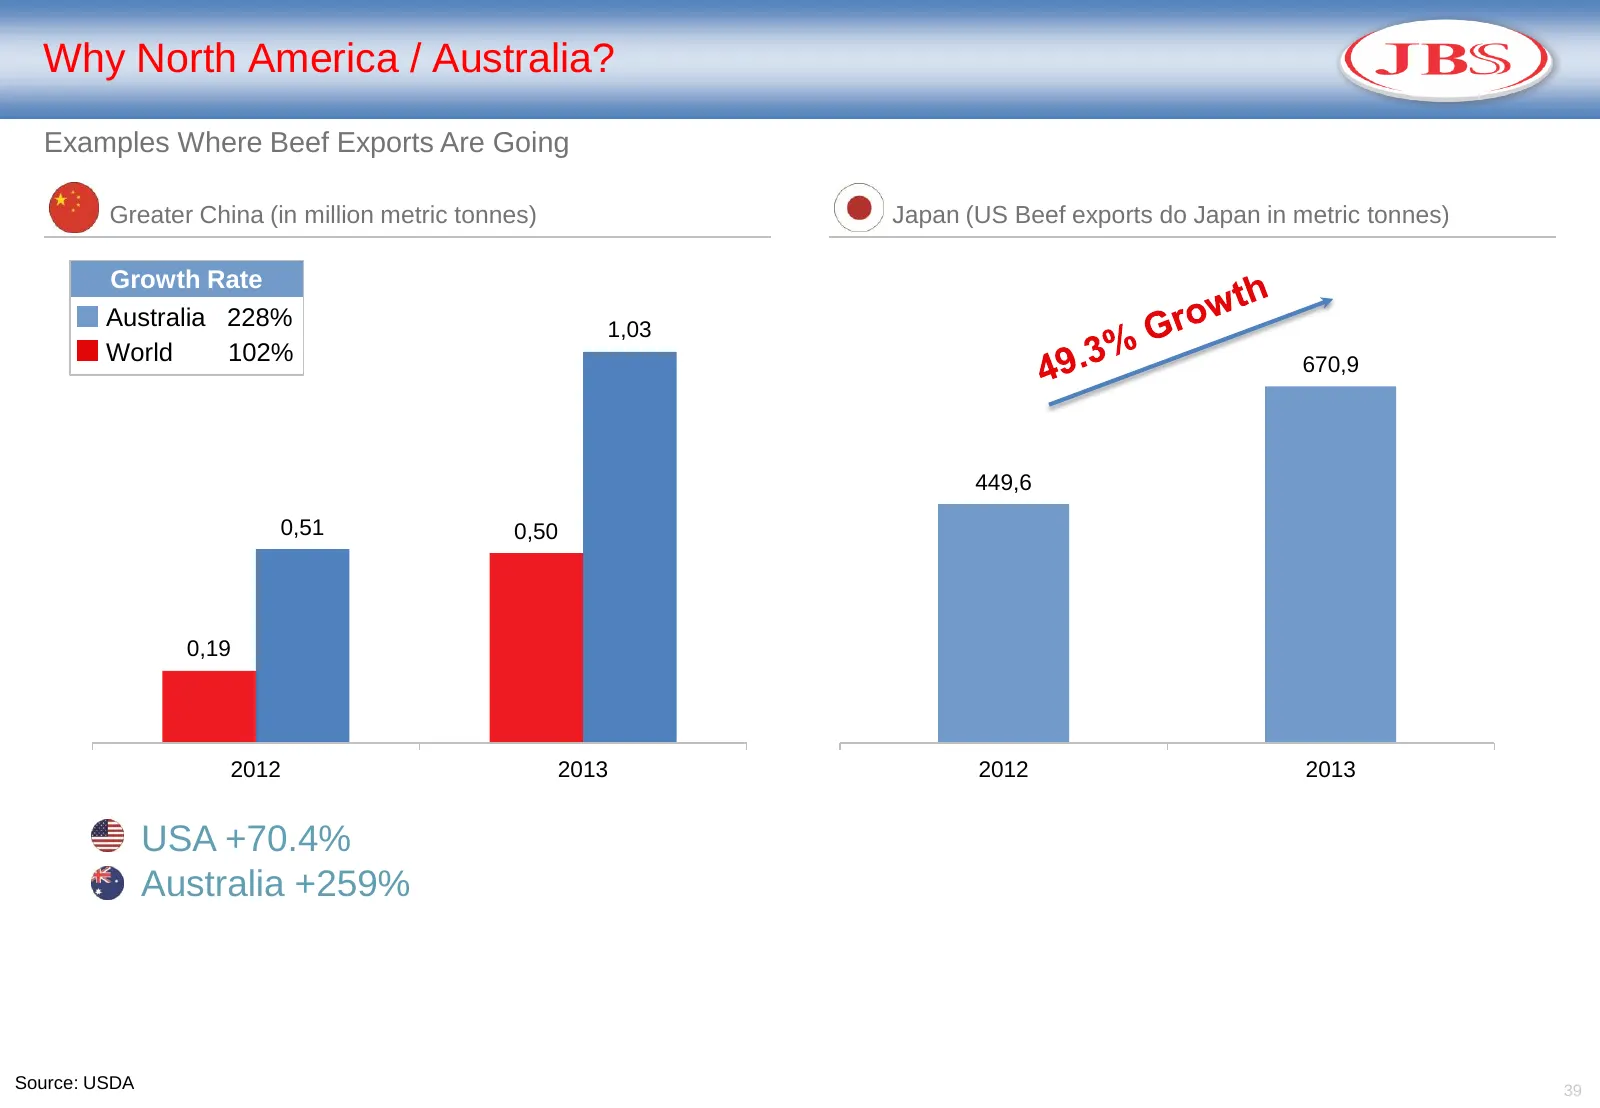
Why North America / Australia? Examples Where Beef Exports Are Going Greater China (in million metric tonnes) Japan (US Beef exports do Japan in metric tonnes) Growth Rate Australia 228% 1,03 World 102% 670,9 449,6 0,51 0,50 0,19 2012 2013 2012 2013 USA +70.4% Australia +259% Source: USDA 39
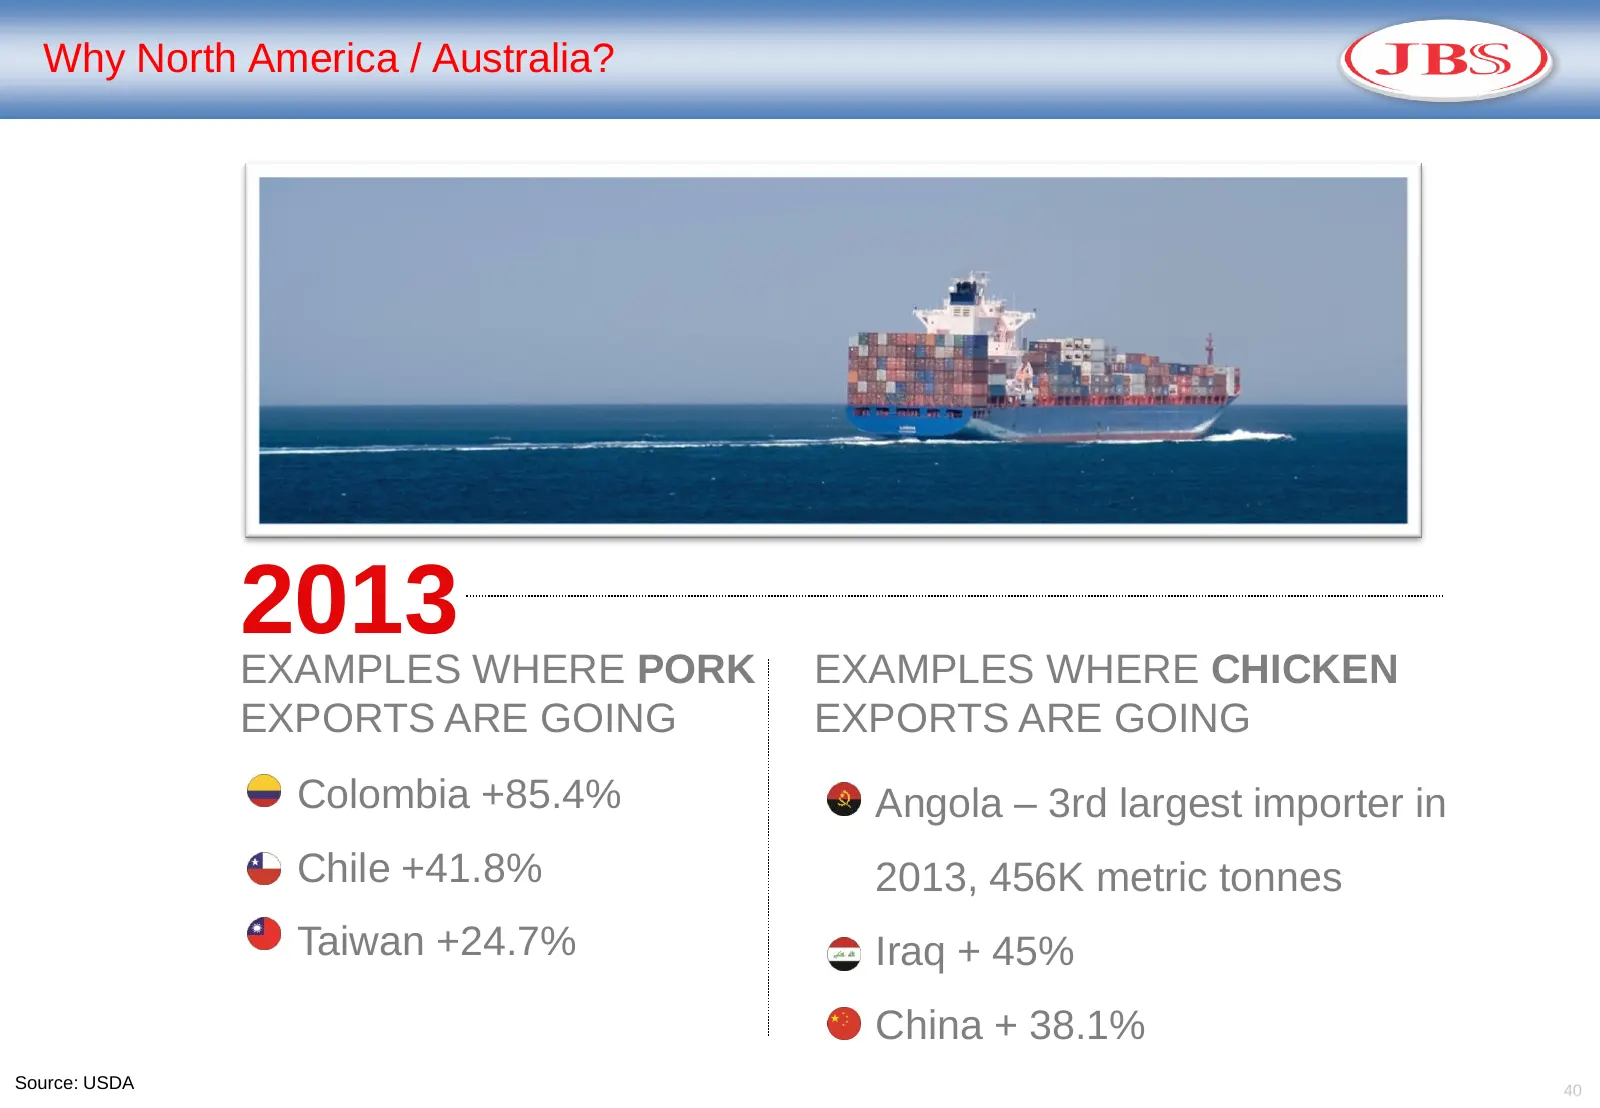
Slide 40: Why North America / Australia? Pork and Chicken Exports
Why North America / Australia? 2013 EXAMPLES WHERE PORK EXAMPLES WHERE CHICKEN EXPORTS ARE GOING EXPORTS ARE GOING Colombia +85.4% Angola – 3rd largest importer in Chile +41.8% 2013, 456K metric tonnes Taiwan +24.7% Iraq + 45% China + 38.1% Source: USDA 40
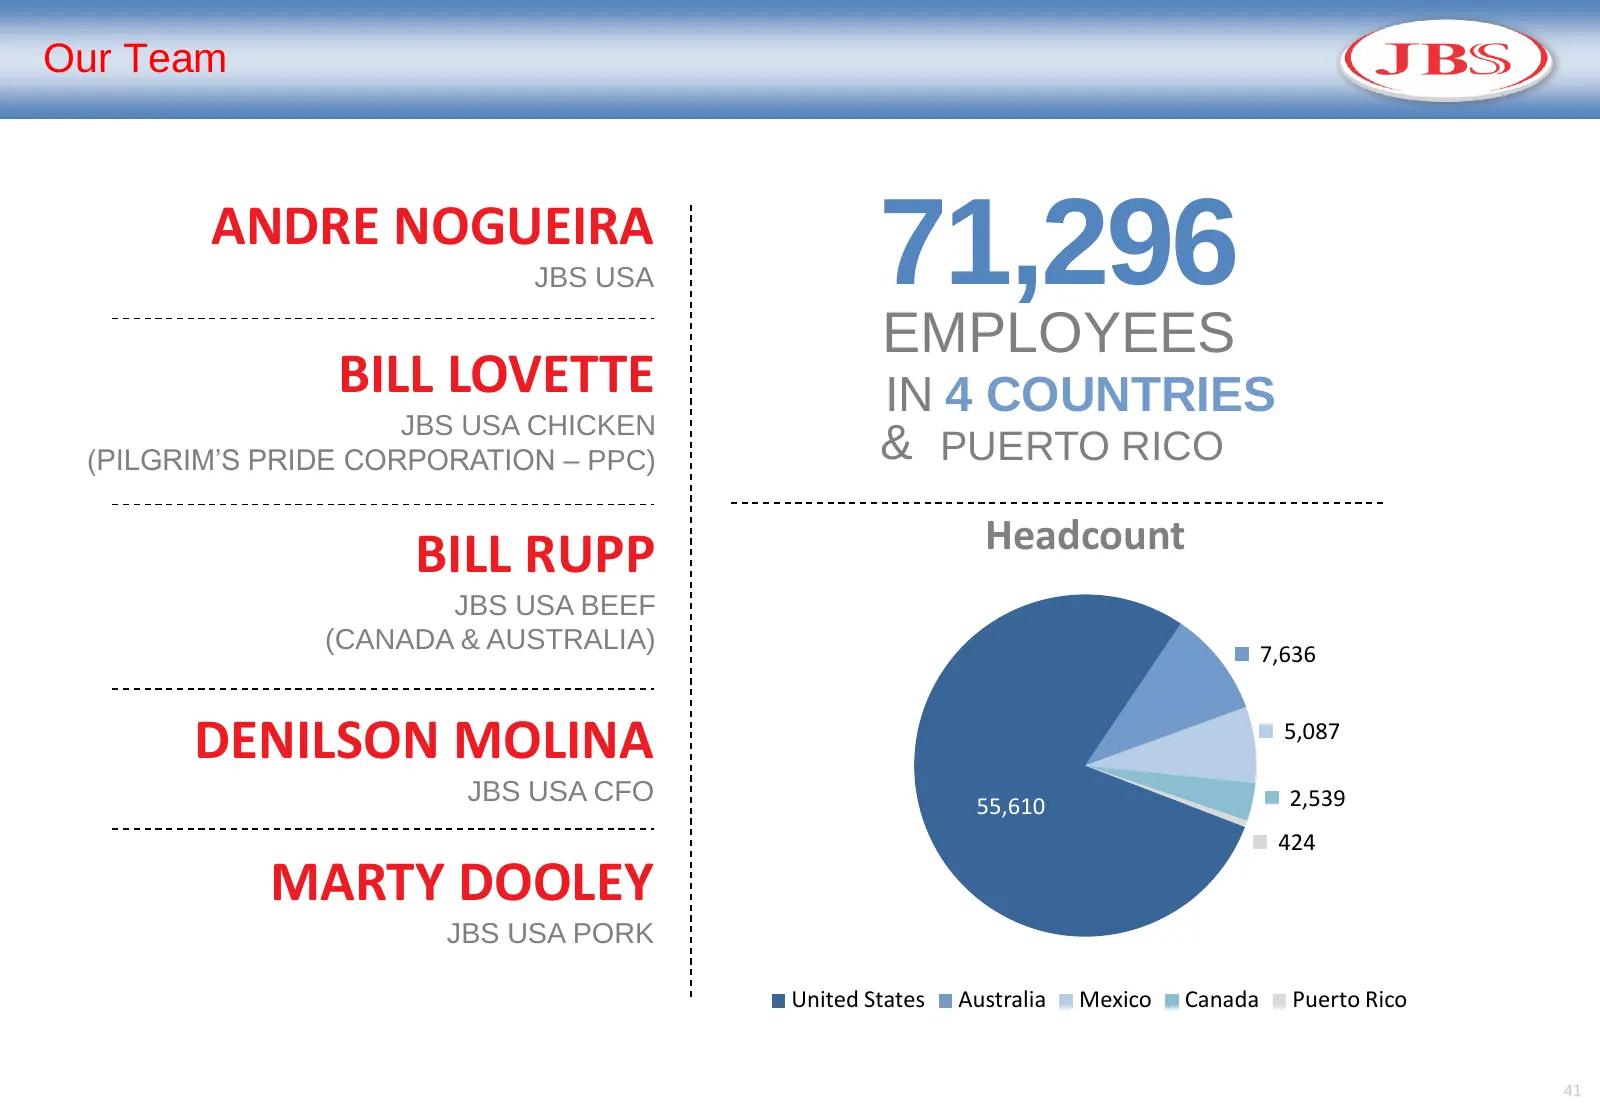
Slide 41: Our Team
Our Team ANDRE NOGUEIRA JBS USA 71,296 EMPLOYEES BILL LOVETTE IN 4 COUNTRIES JBS USA CHICKEN (PILGRIM’S PRIDE CORPORATION – PPC) & PUERTO RICO Headcount BILL RUPP JBS USA BEEF (CANADA & AUSTRALIA) 7,636 DENILSON MOLINA 5,087 JBS USA CFO 55,610 2,539 424 MARTY DOOLEY JBS USA PORK United States Austra
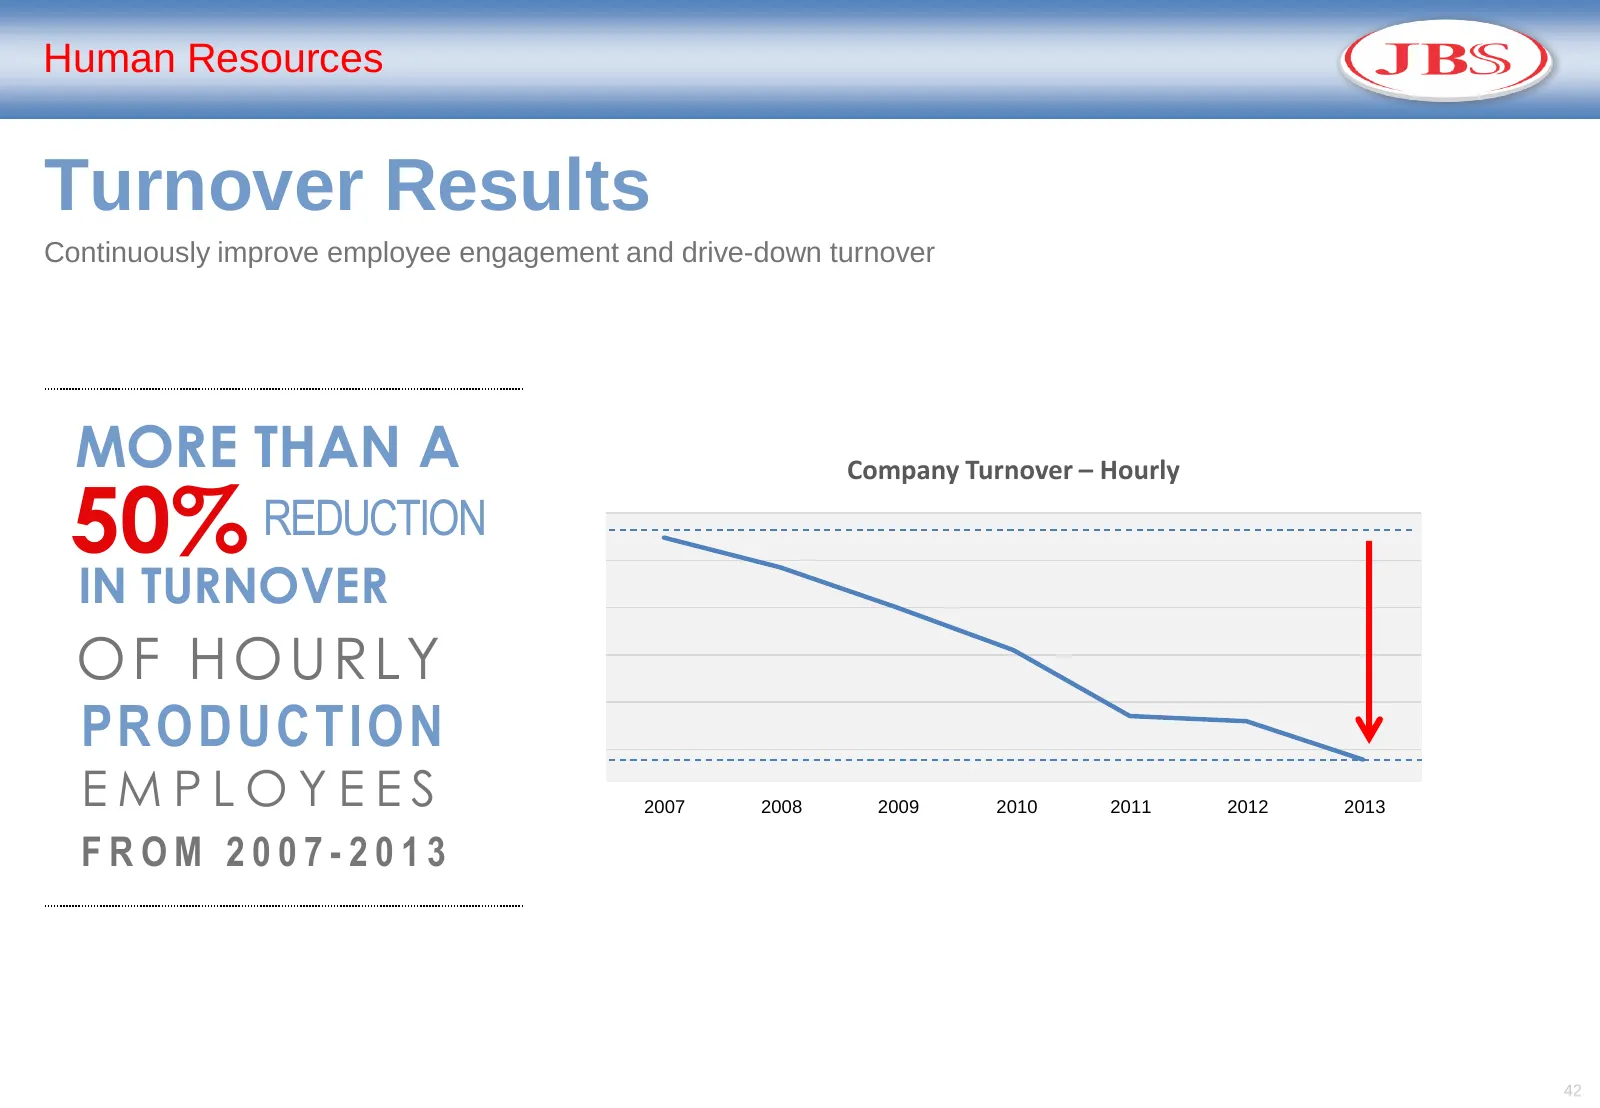
Slide 42: Human Resources: Turnover Results
Human Resources Turnover Results Continuously improve employee engagement and drive-down turnover MORE THAN A Company Turnover – Hourly 50% REDUCTION IN TURNOVER OF HOURLY PRODUCTION EMPLOYEES 2007 2008 2009 2010 2011 2012 2013 FROM 2007-2013 2007 2008 2009 2010 2011 2012 2013 42
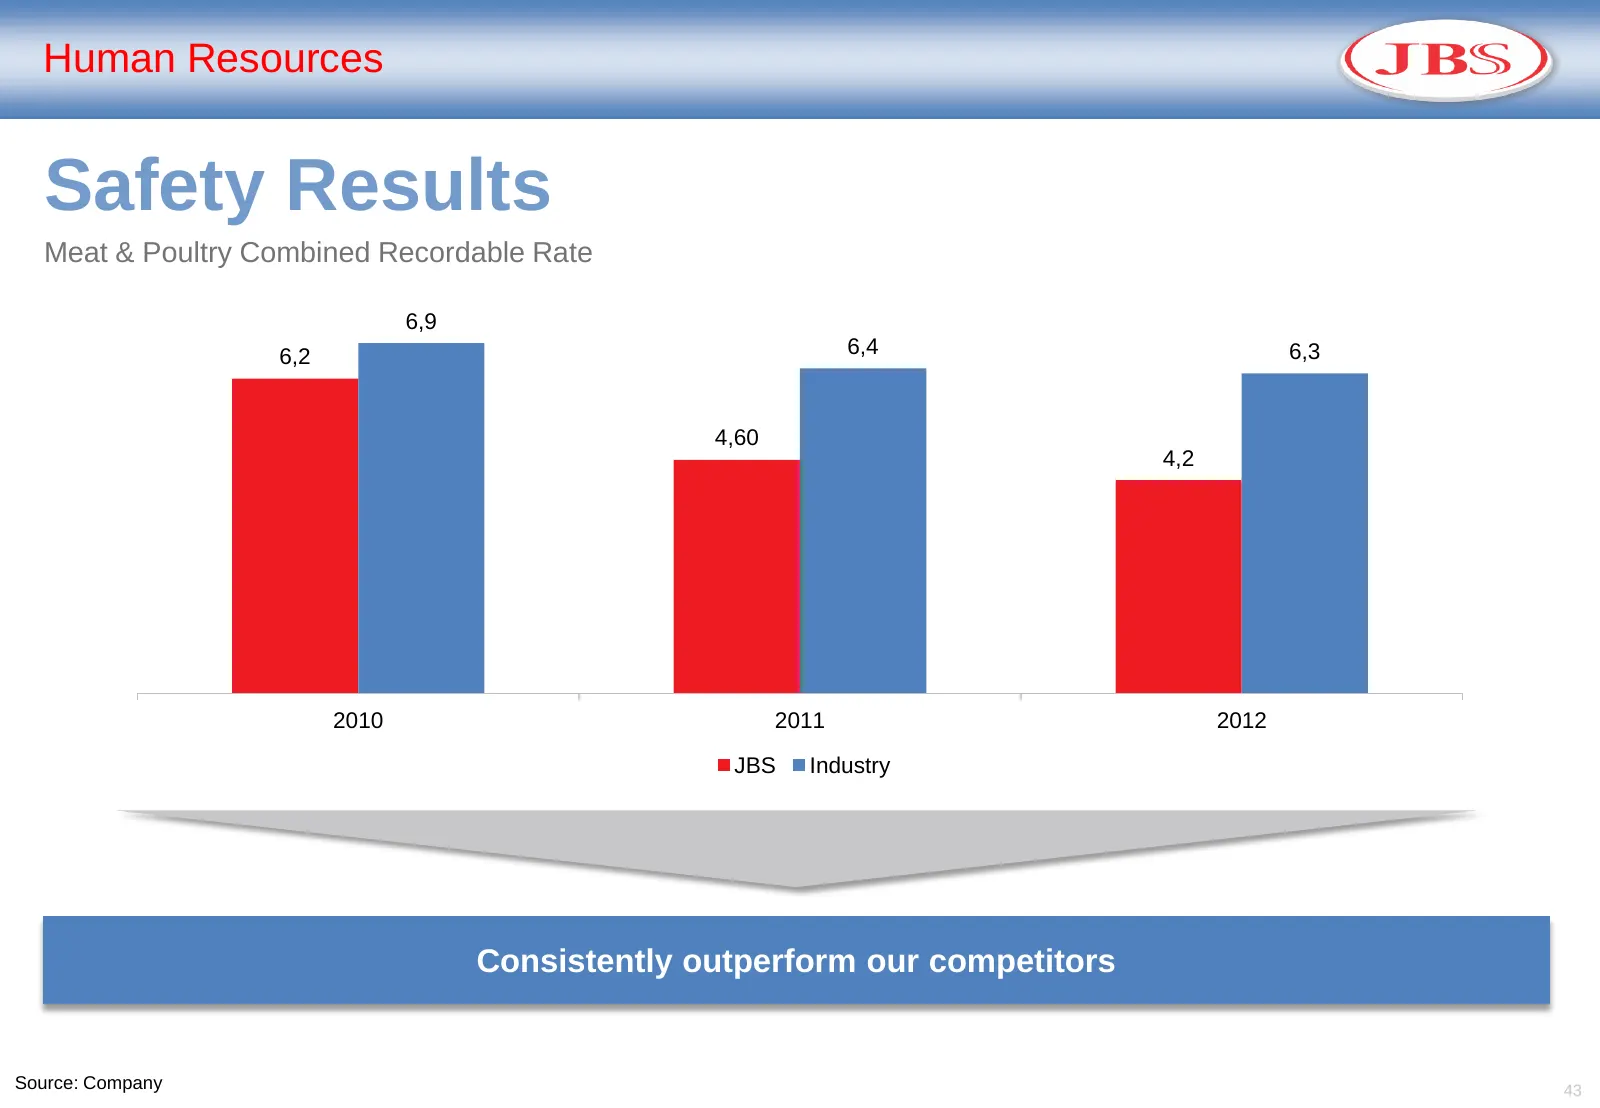
Slide 43: Human Resources: Safety Results
Human Resources Safety Results Meat & Poultry Combined Recordable Rate 6,9 6,2 6,4 6,3 4,60 4,2 2010 2011 2012 JBS Industry Consistently outperform our competitors Source: Company 43
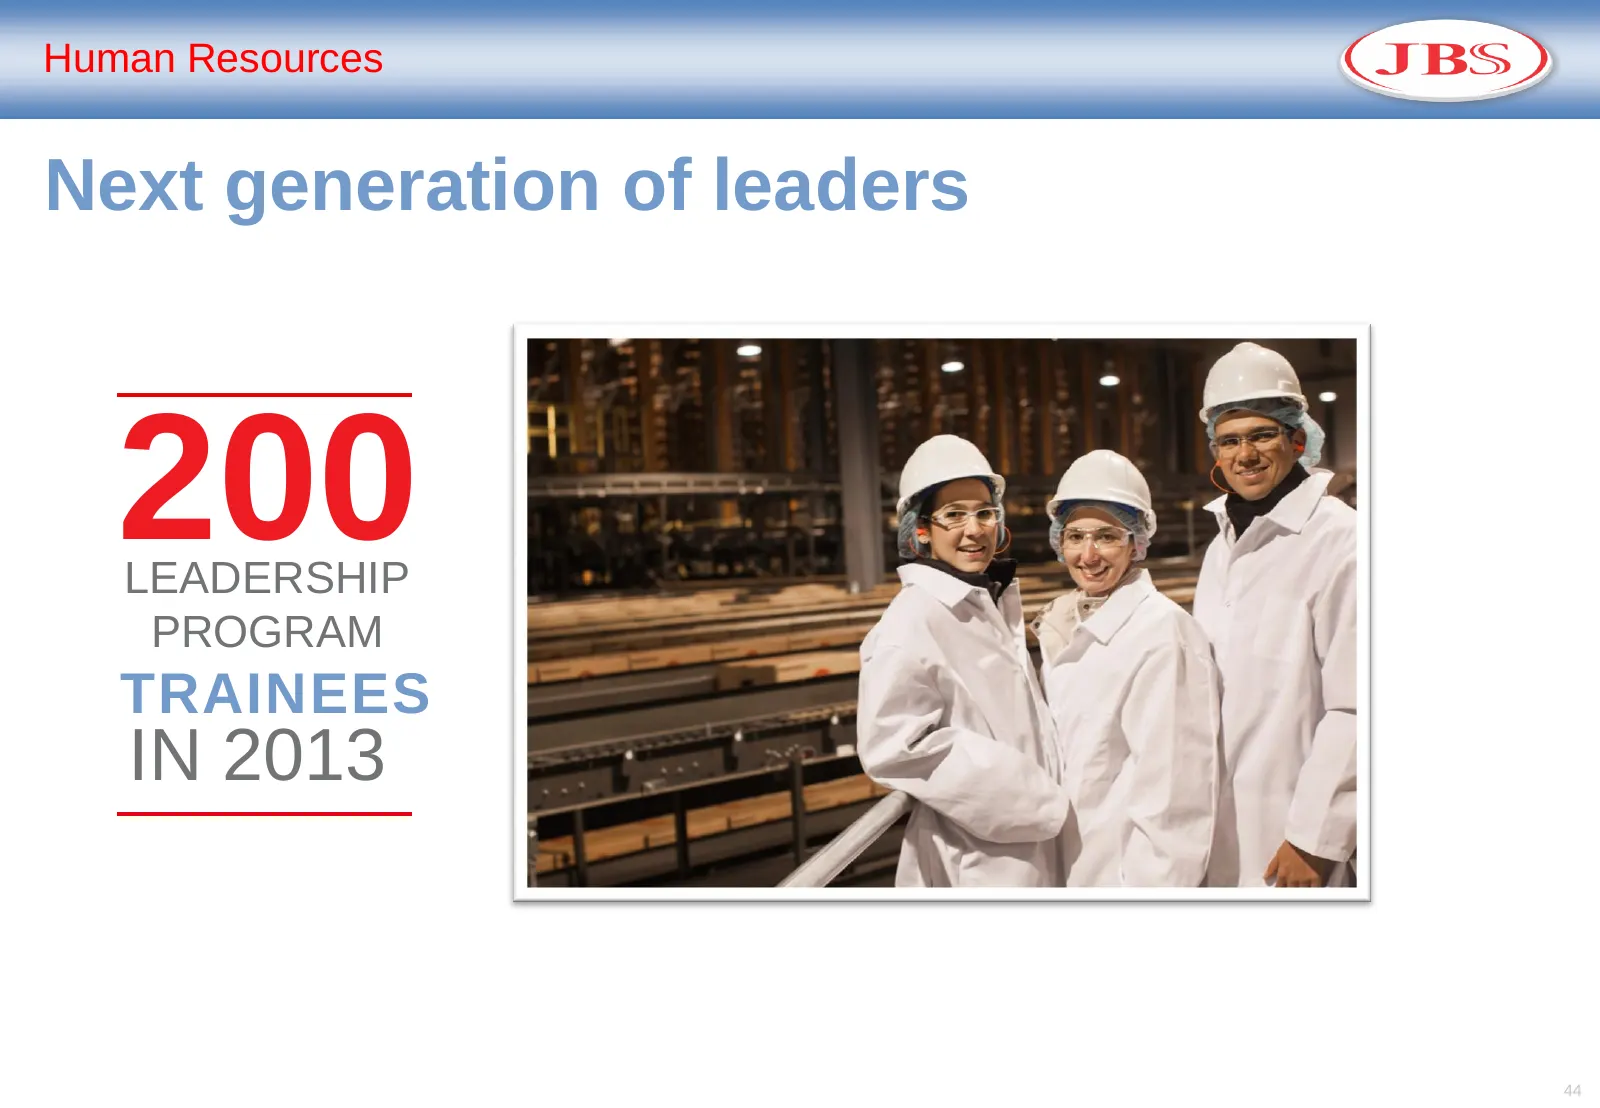
Slide 44: Human Resources: Next generation of leaders
Human Resources Next generation of leaders 200 LEADERSHIP PROGRAM TRAINEES IN 2013 44
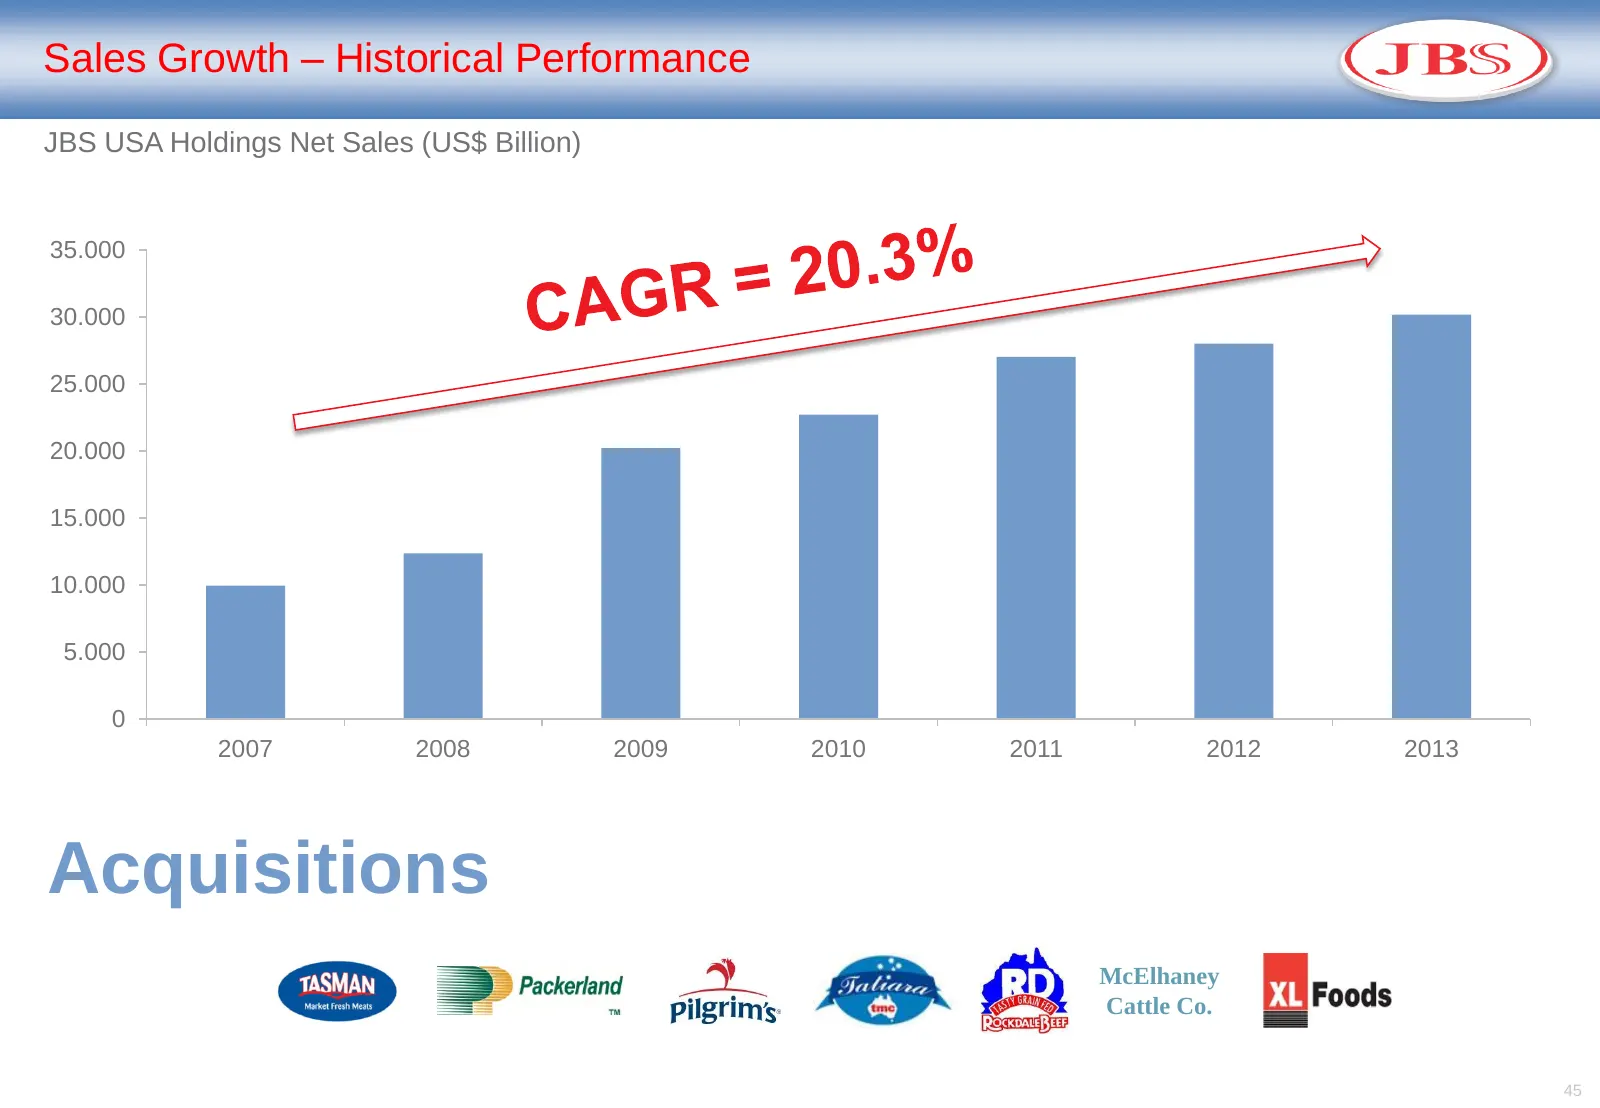
Slide 45: Sales Growth – Historical Performance
Sales Growth – Historical Performance JBS USA Holdings Net Sales (US$ Billion) 35.000 30.000 25.000 20.000 15.000 10.000 5.000 0 2007 2008 2009 2010 2011 2012 2013 Acquisitions McElhaney Cattle Co. 45
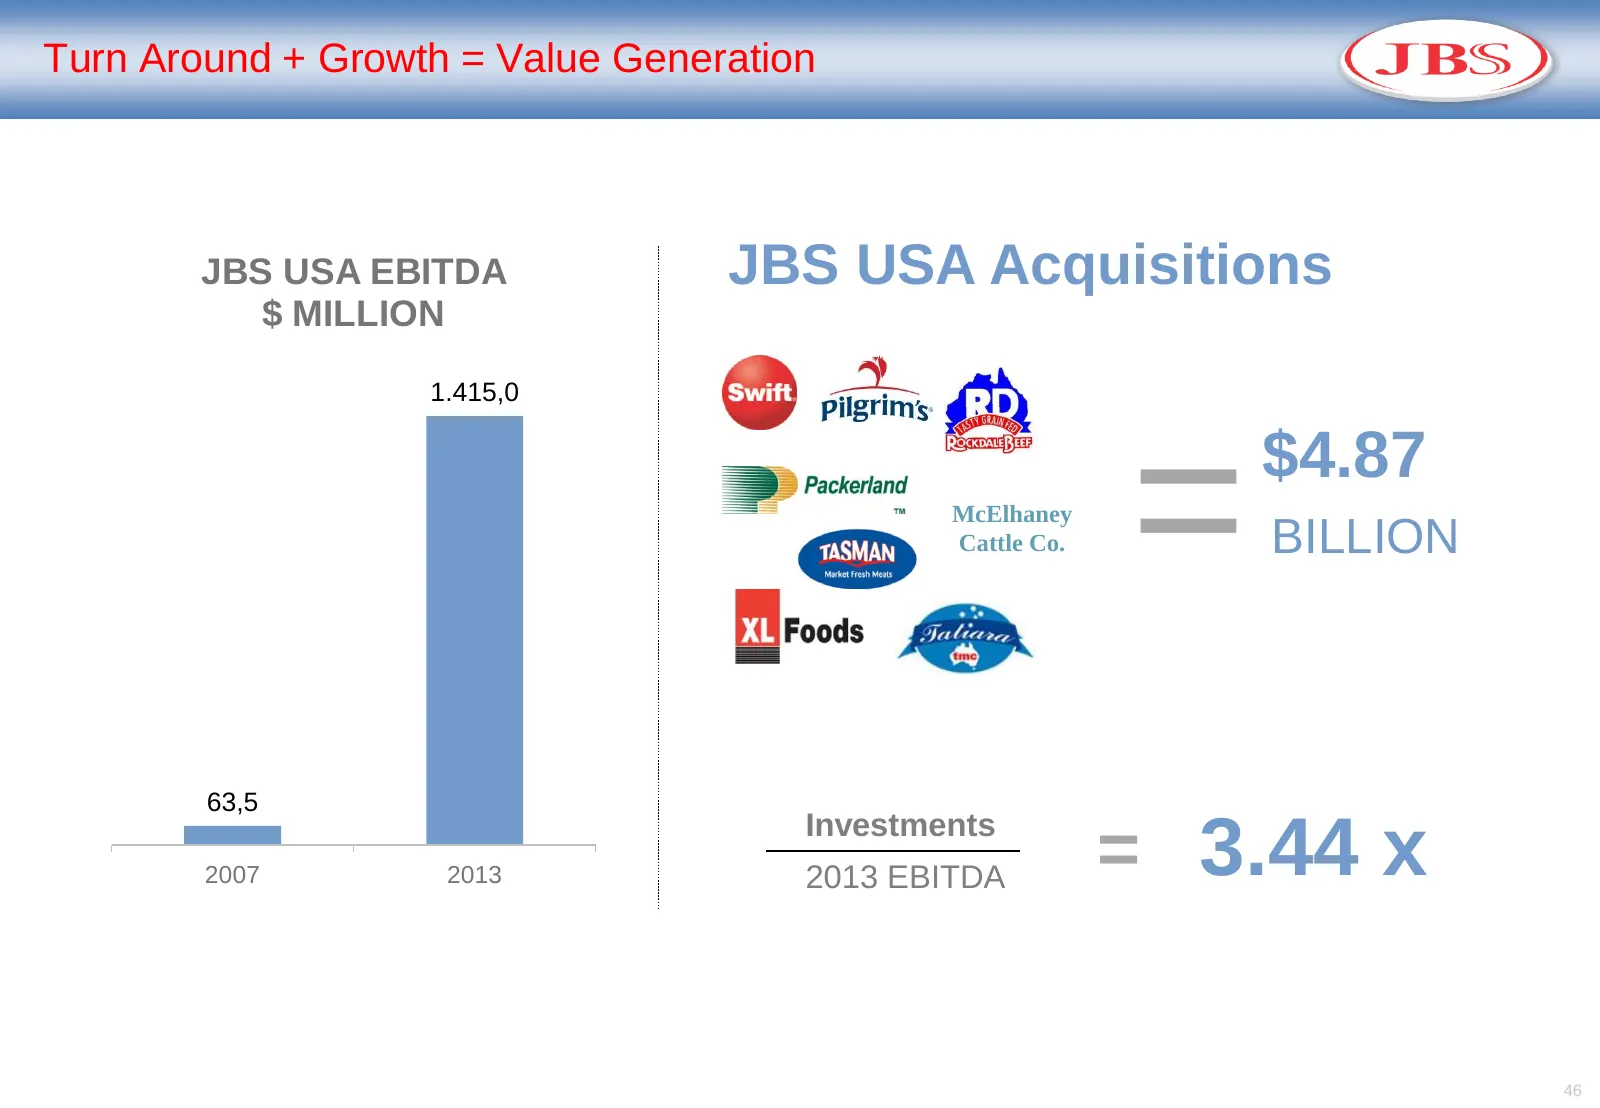
Slide 46: Turn Around + Growth = Value Generation
Turn Around + Growth = Value Generation JBS USA EBITDA JBS USA Acquisitions $ MILLION 1.415,0 McElhaney Cattle Co. = $4.87 BILLION 63,5 Investments 2007 2013 2013 EBITDA = 3.44 x 46
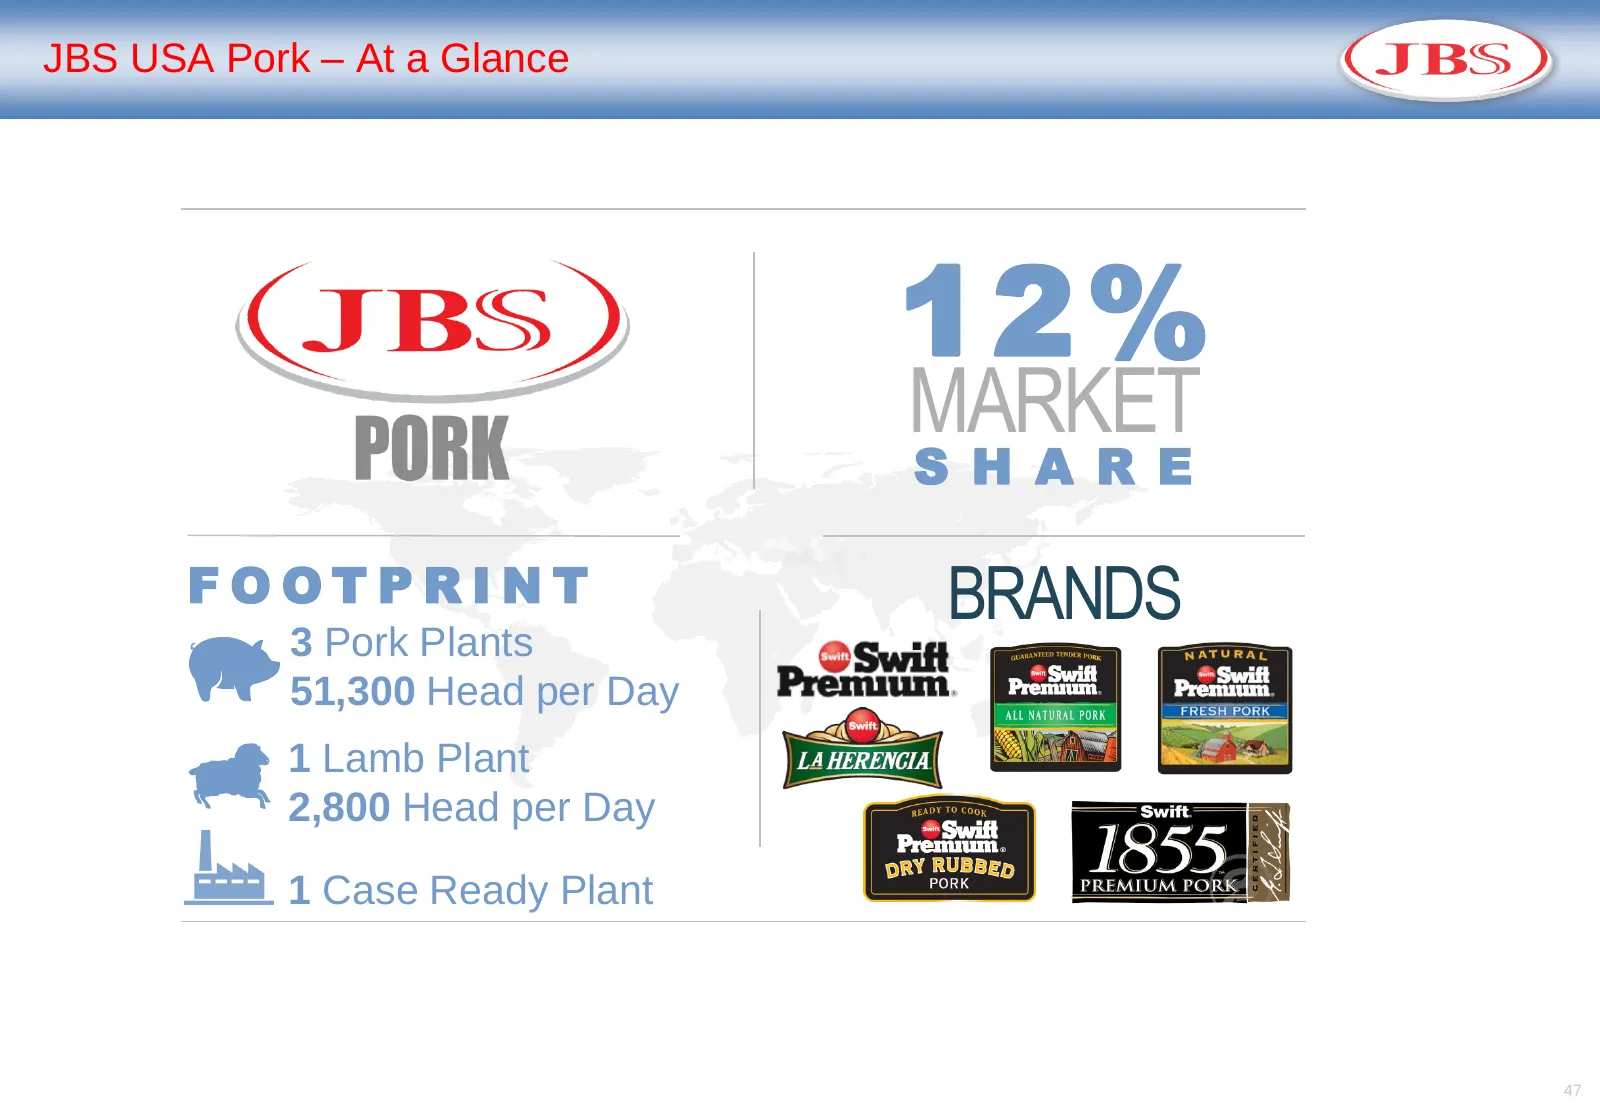
Slide 47: JBS USA Pork – At a Glance
JBS USA Pork – At a Glance 12% MARKET S H A R E FOOTPRINT BRANDS 3 Pork Plants 51,300 Head per Day 1 Lamb Plant 2,800 Head per Day 1 Case Ready Plant 47
Slide 48: JBS USA Pork – Where We Are
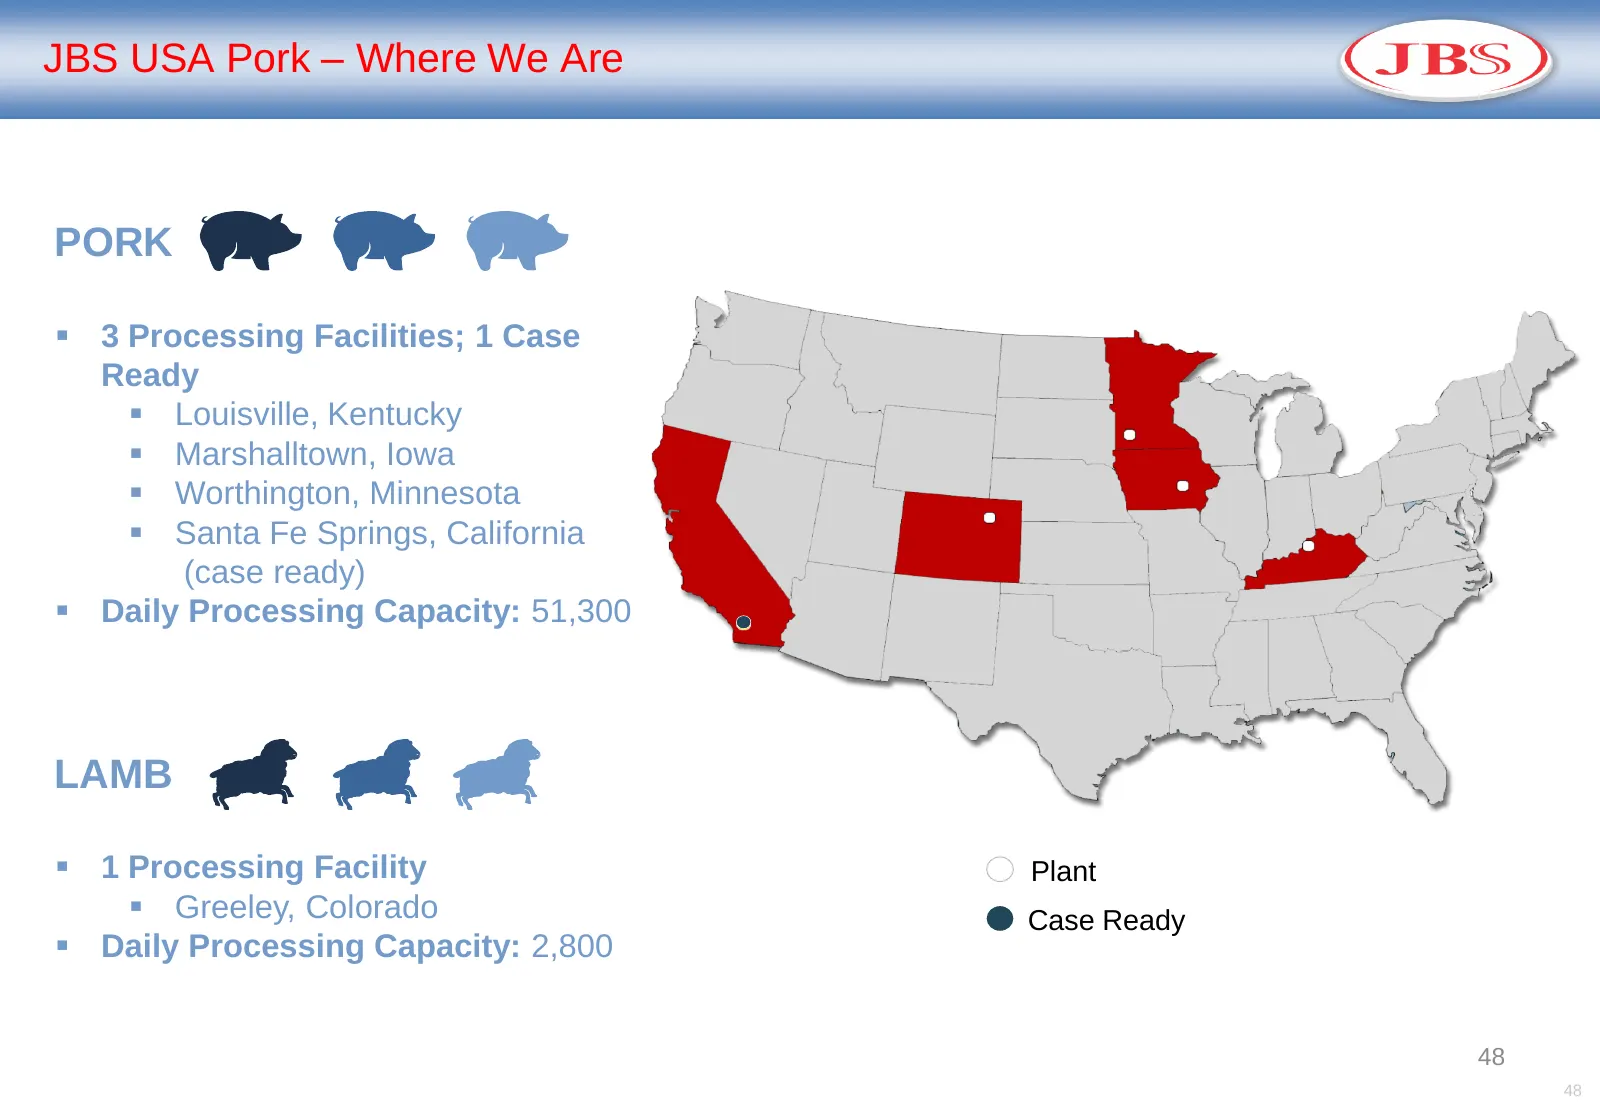
JBS USA Pork – Where We Are PORK 3 Processing Facilities; 1 Case Ready Louisville, Kentucky Marshalltown, Iowa Worthington, Minnesota Santa Fe Springs, California (case ready) Daily Processing Capacity: 51,300 LAMB 1 Processing Facility Plant Greeley, Colorado Case Ready Daily Proc
Slide 49: JBS USA Pork
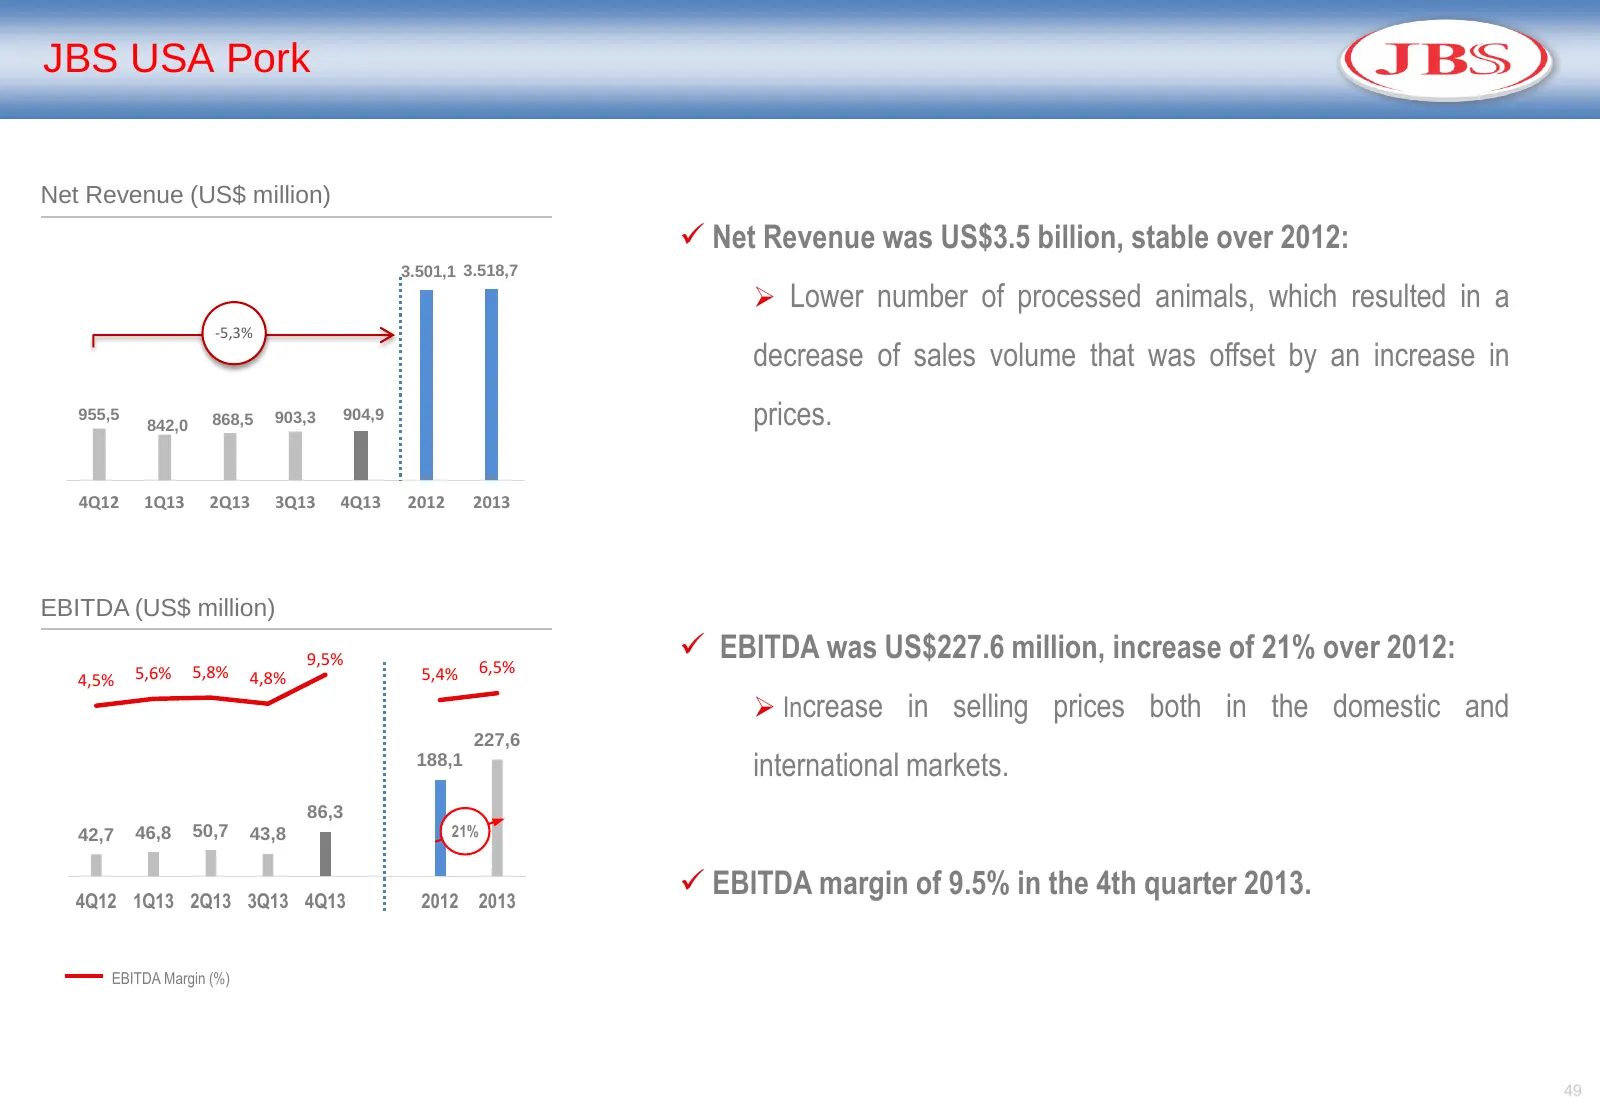
8% JBS USA Pork Net Revenue (US$ million) 4000,0 Net Revenue was US$3.5 billion, stable over 2012: 3.501,1 3.518,7 Lower number of processed animals, which resulted in a 3500,0 3000,0 -5,3% decrease of sales volume that was offset by an increase in 2500,0 2000,0 prices. 1500,0 955,5 868,5 903,3
Slide 50: Strategy
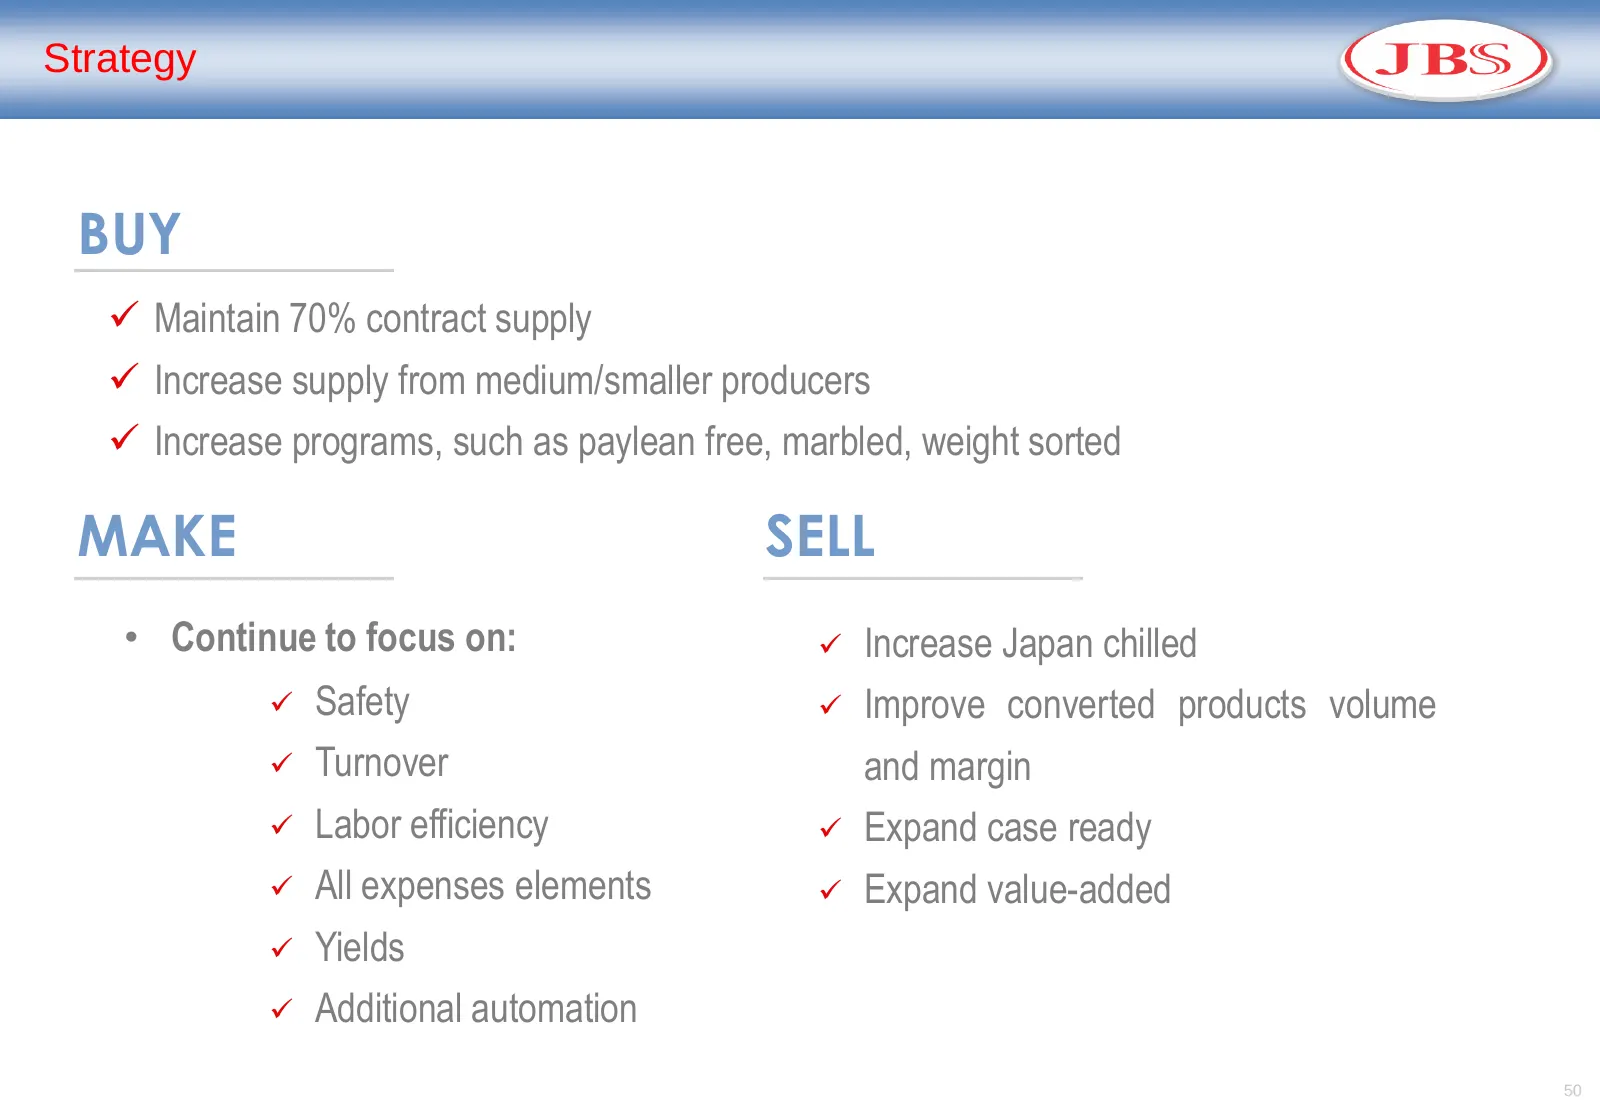
Strategy BUY Maintain 70% contract supply Increase supply from medium/smaller producers Increase programs, such as paylean free, marbled, weight sorted MAKE SELL • Continue to focus on: Increase Japan chilled Safety Improve converted products volume Turnover and margin Labor efficien
Slide 51: US Pork - Added Value Products
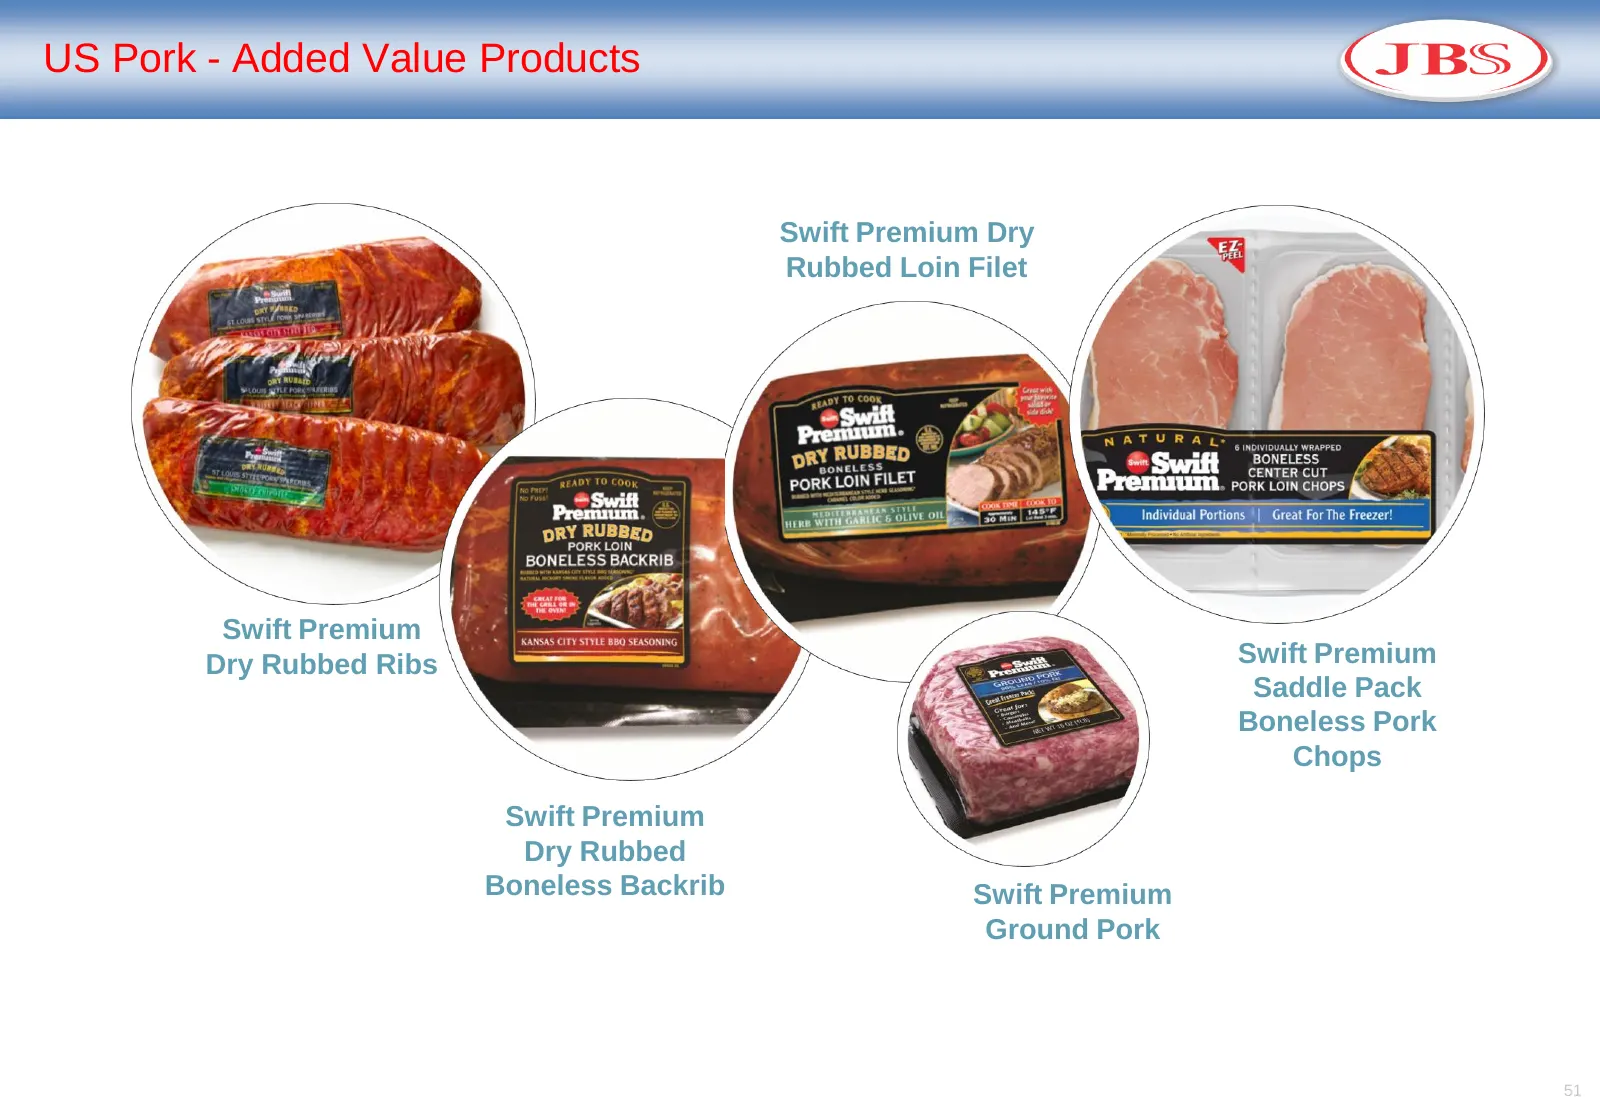
US Pork - Added Value Products Swift Premium Dry Rubbed Loin Filet Swift Premium Dry Rubbed Ribs Swift Premium Saddle Pack Boneless Pork Chops Swift Premium Dry Rubbed Boneless Backrib Swift Premium Ground Pork 51
Slide 52: JBS USA Beef – At a Glance
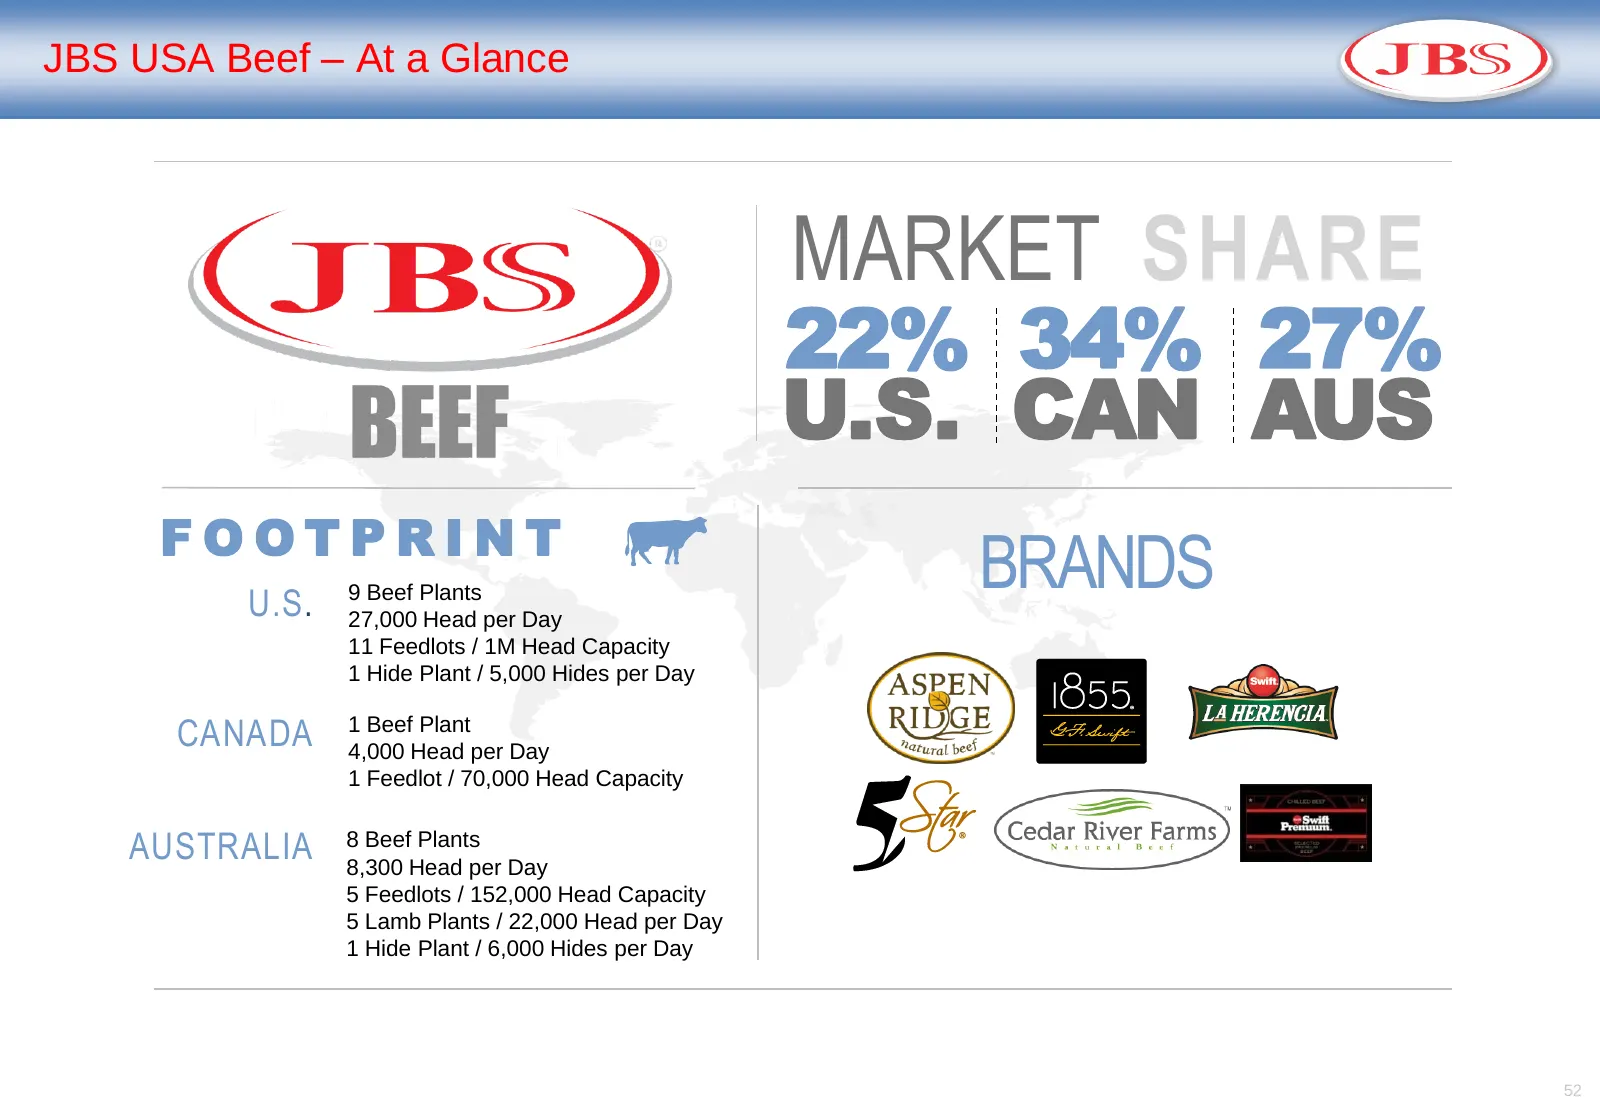
JBS USA Beef – At a Glance MARKET SHARE 22% 34% 27% U.S. CAN AUS FOOTPRINT U.S. 9 Beef Plants BRANDS 27,000 Head per Day 11 Feedlots / 1M Head Capacity 1 Hide Plant / 5,000 Hides per Day CANADA 1 Beef Plant 4,000 Head per Day 1 Feedlot / 70,000 Head Capacity AUSTRALIA 8 Beef Plants 8,300 Head per Da
Slide 53: JBS USA Beef – Where We Are
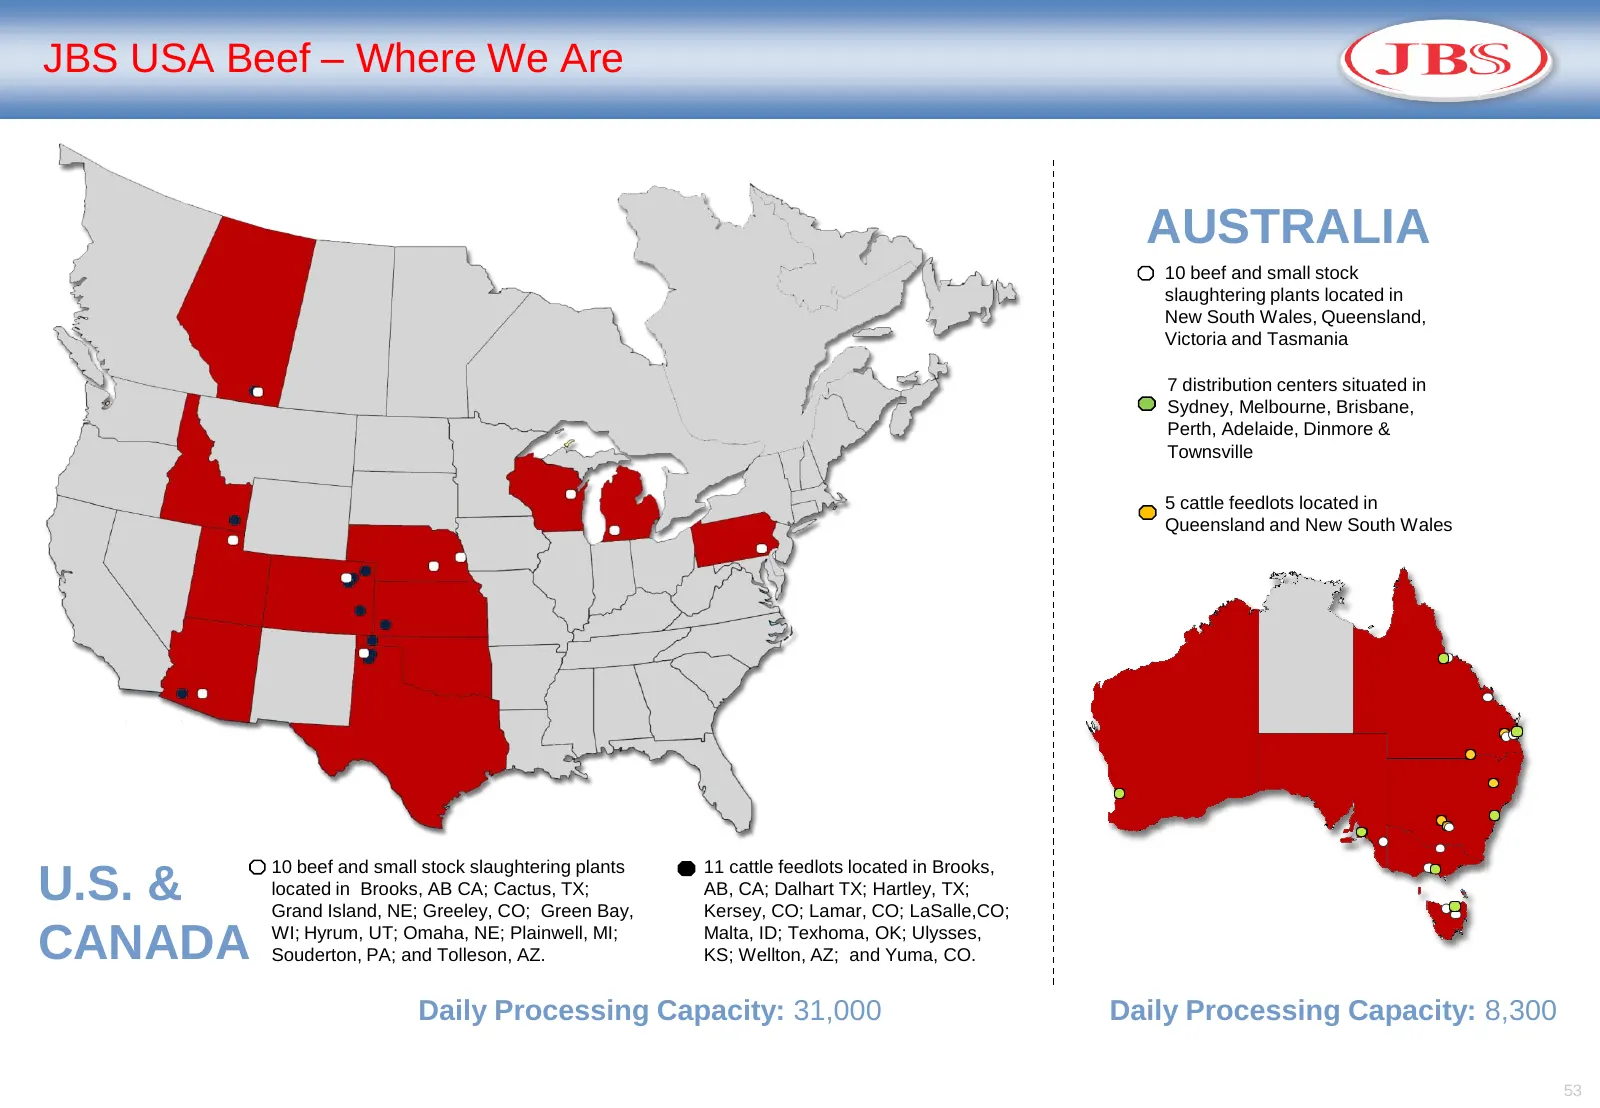
JBS USA Beef – Where We Are AUSTRALIA 10 beef and small stock slaughtering plants located in New South Wales, Queensland, Victoria and Tasmania 7 distribution centers situated in Sydney, Melbourne, Brisbane, Perth, Adelaide, Dinmore & Townsville 5 cattle feedlots located in Queensland and New South
Slide 54: JBS USA Beef (including Australia and Canada)
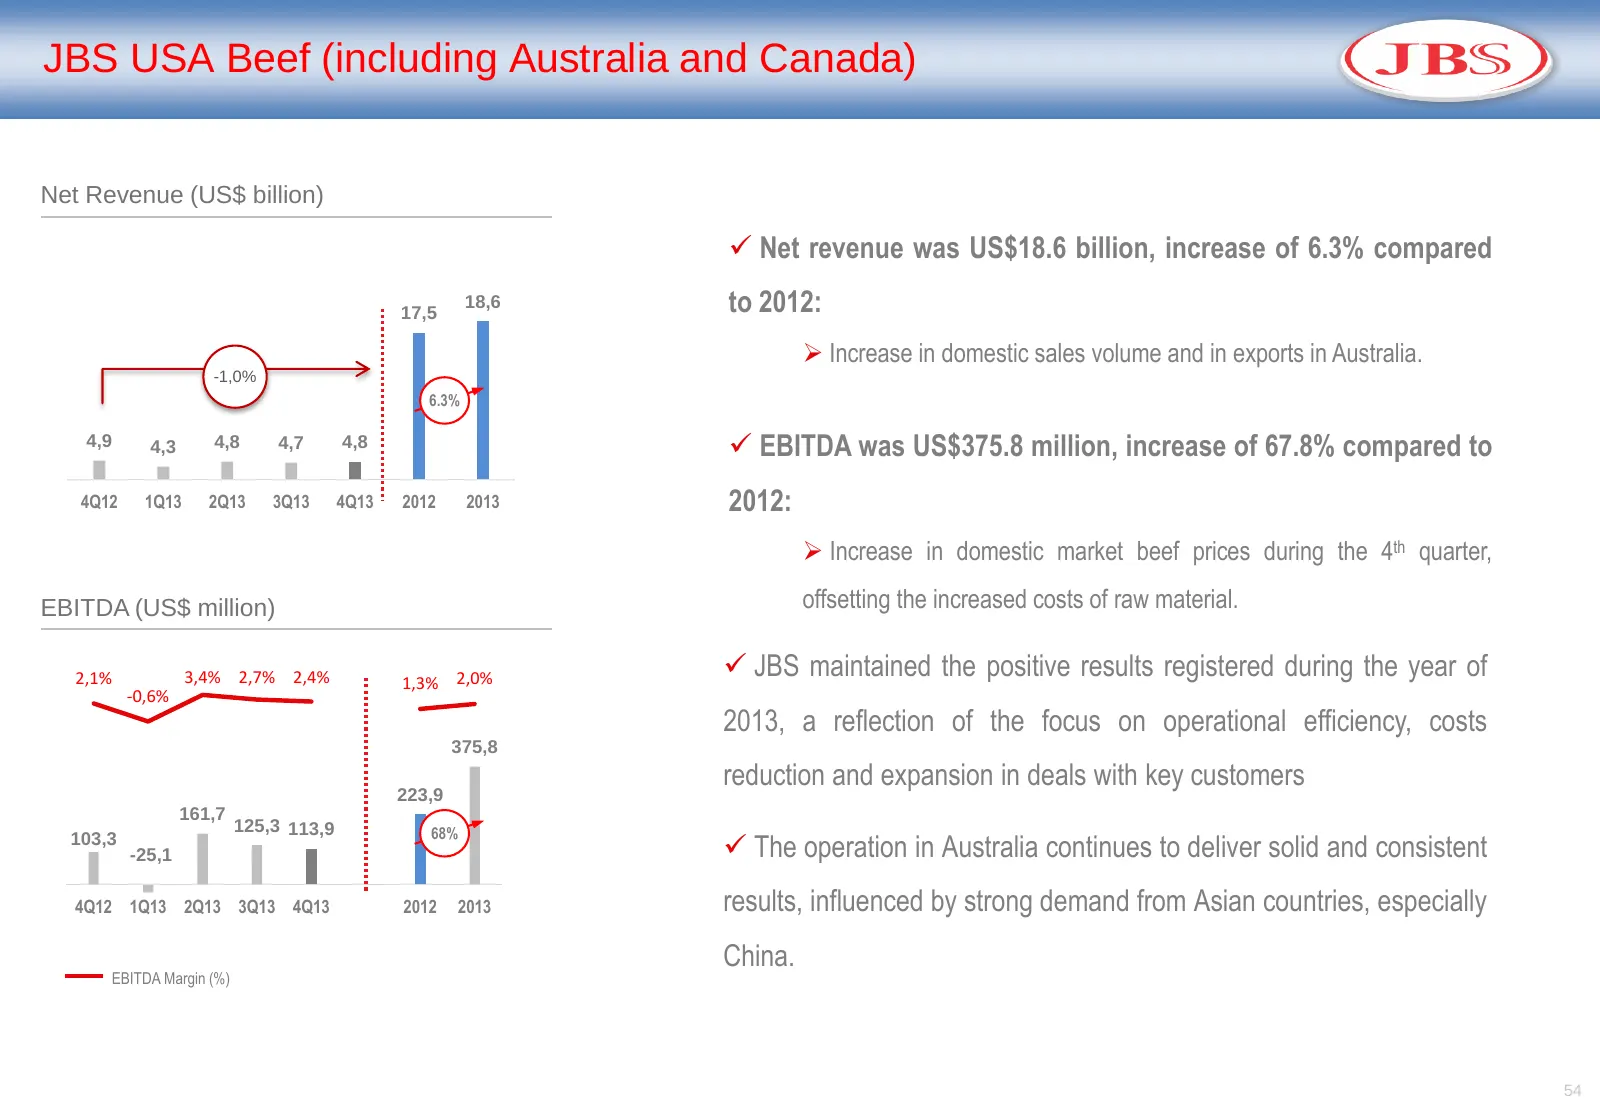
JBS USA Beef (including Australia and Canada) Net Revenue (US$ billion) Net revenue was US$18.6 billion, increase of 6.3% compared 17,5 18,6 to 2012: Increase in domestic sales volume and in exports in Australia. -1,0% 6.3% 4,9 4,3 4,8 4,7 4,8 EBITDA was US$375.8 million, increase of 67.8% com
Slide 55: Marketing Conditions
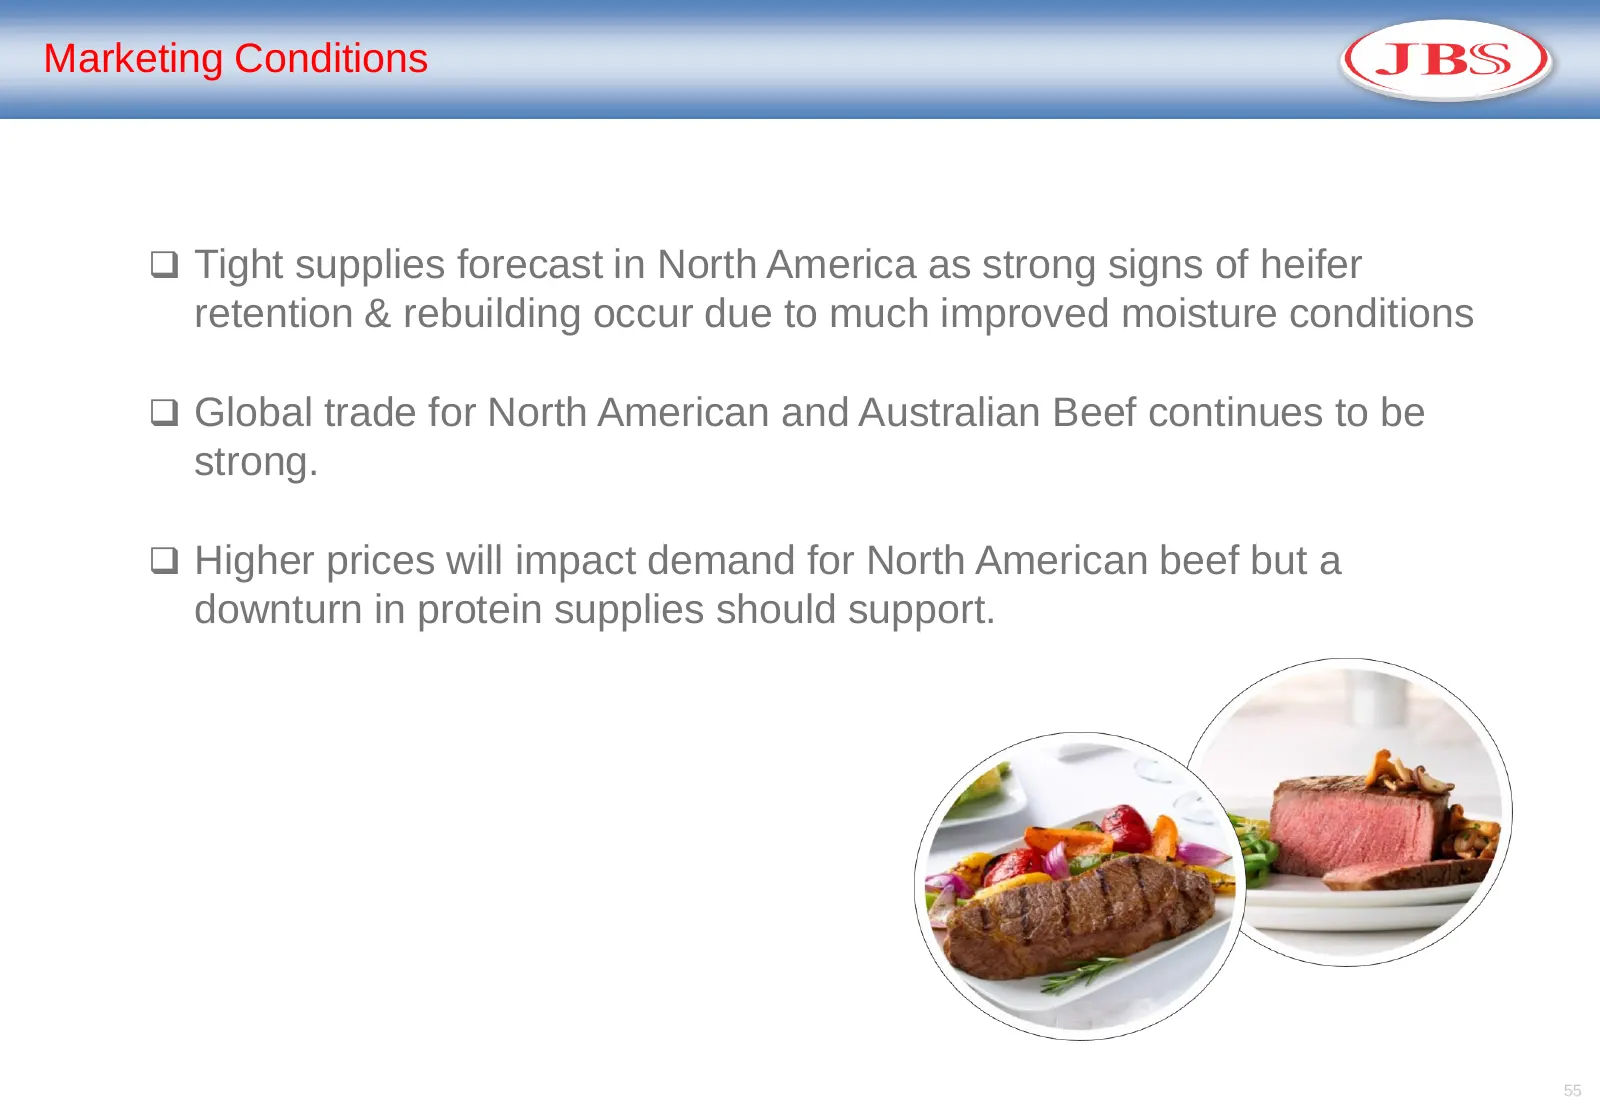
Marketing Conditions Tight supplies forecast in North America as strong signs of heifer retention & rebuilding occur due to much improved moisture conditions Global trade for North American and Australian Beef continues to be strong. Higher prices will impact demand for North American beef but
Slide 56: Strategy
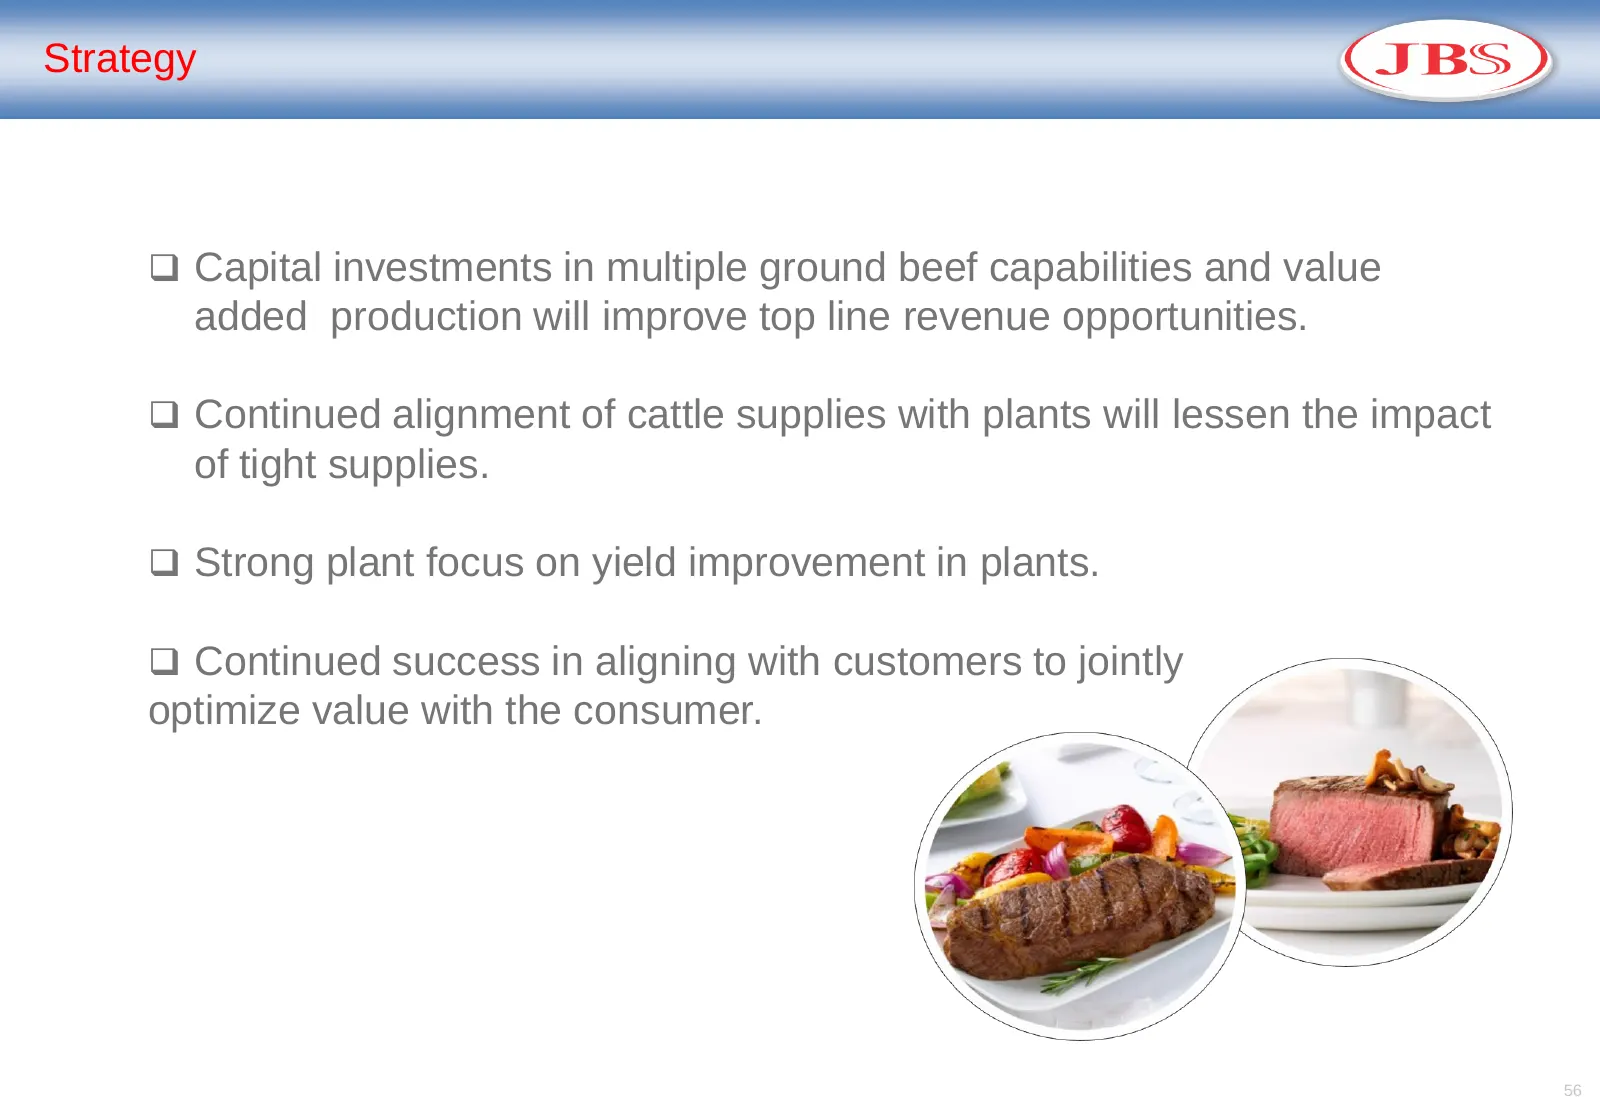
Strategy Capital investments in multiple ground beef capabilities and value added production will improve top line revenue opportunities. Continued alignment of cattle supplies with plants will lessen the impact of tight supplies. Strong plant focus on yield improvement in plants. Continued
Slide 57: JBS USA Chicken – Pilgrim's Pride Co.
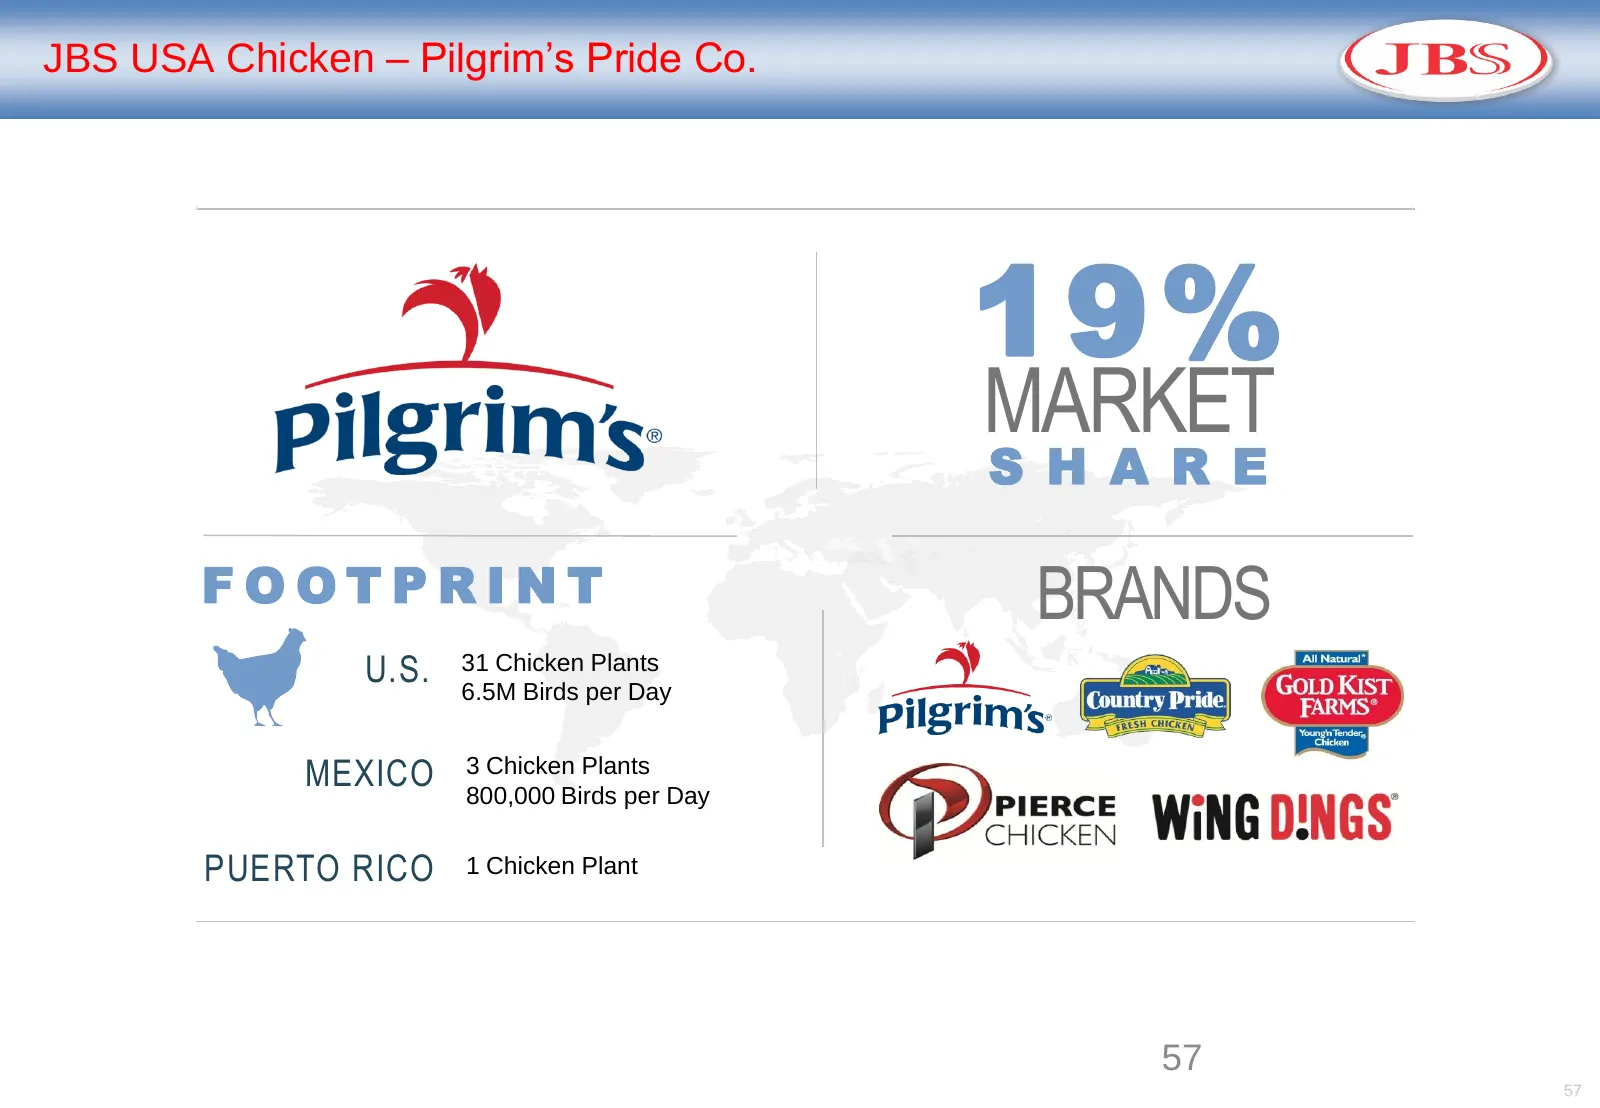
JBS USA Chicken – Pilgrim’s Pride Co. 19% MARKET S H A R E FOOTPRINT BRANDS U.S. 31 Chicken Plants 6.5M Birds per Day MEXICO 3 Chicken Plants 800,000 Birds per Day PUERTO RICO 1 Chicken Plant 57 57
Slide 58: JBS USA Chicken – Where We Are
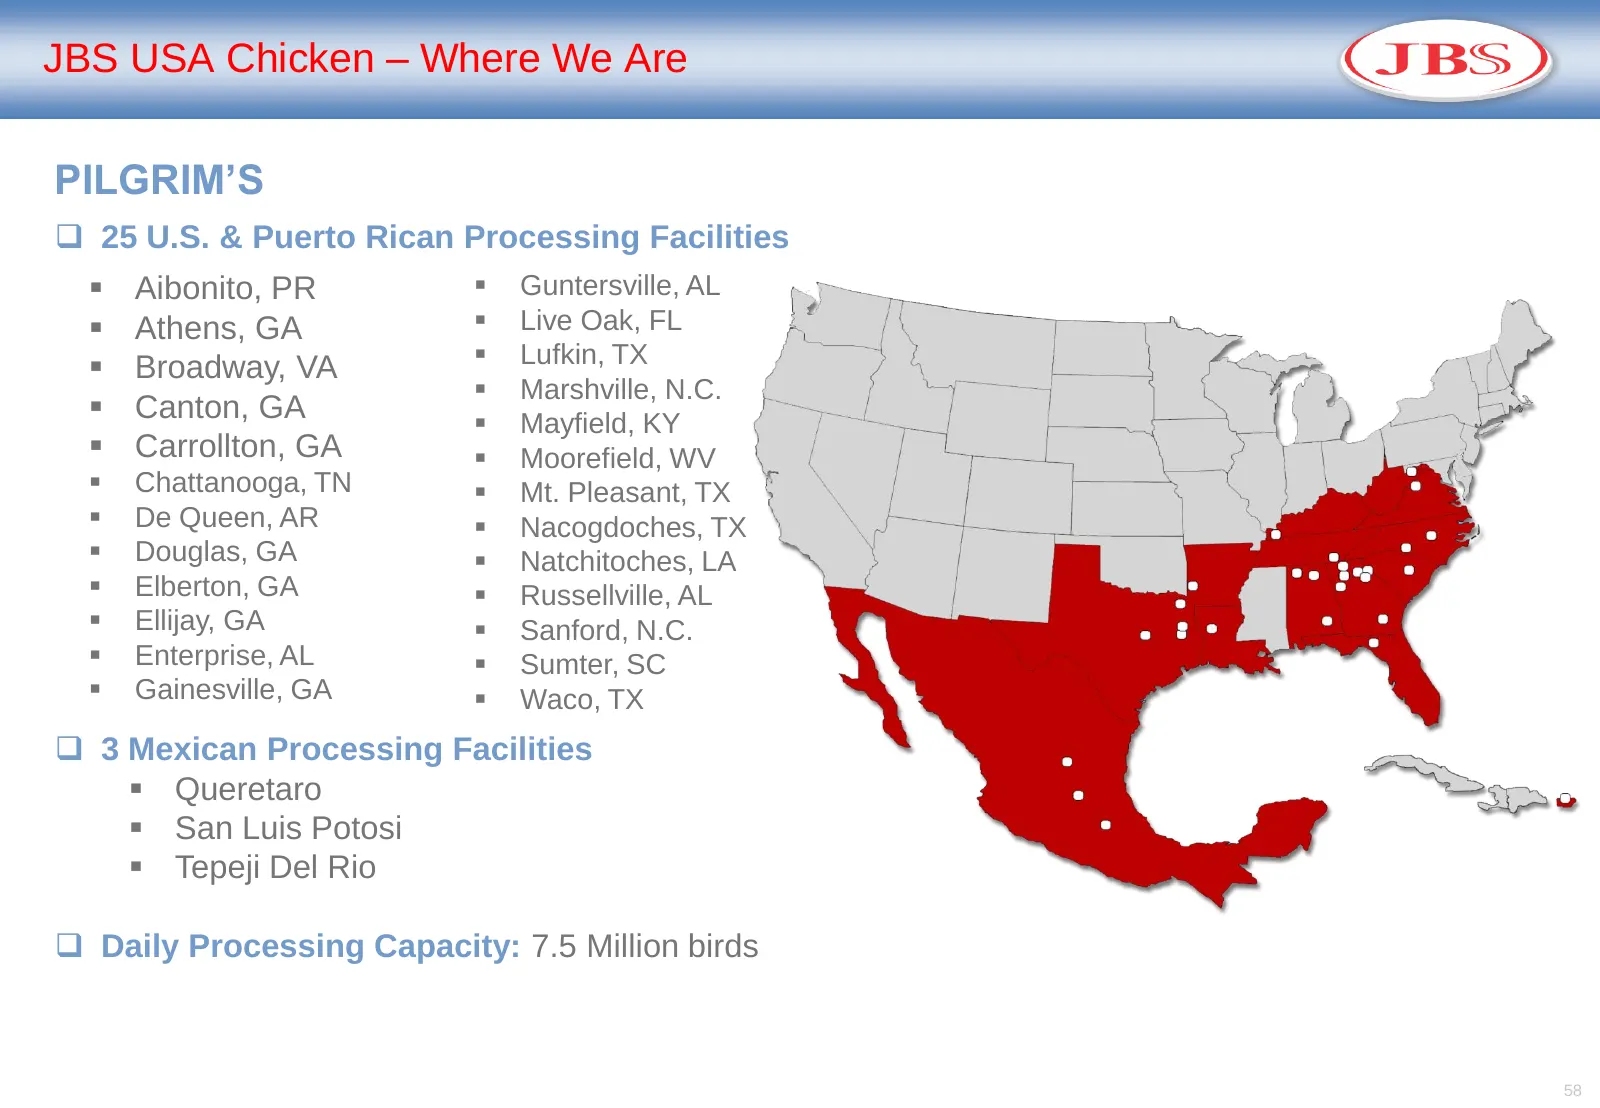
JBS USA Chicken – Where We Are PILGRIM’S 25 U.S. & Puerto Rican Processing Facilities Aibonito, PR Guntersville, AL Athens, GA Live Oak, FL Broadway, VA Lufkin, TX Marshville, N.C. Canton, GA Mayfield, KY Carrollton, GA Moorefield, WV Chattanooga, TN Mt. Pleasant, TX De
Slide 59: JBS USA Chicken (Pilgrim's Pride Corporation)
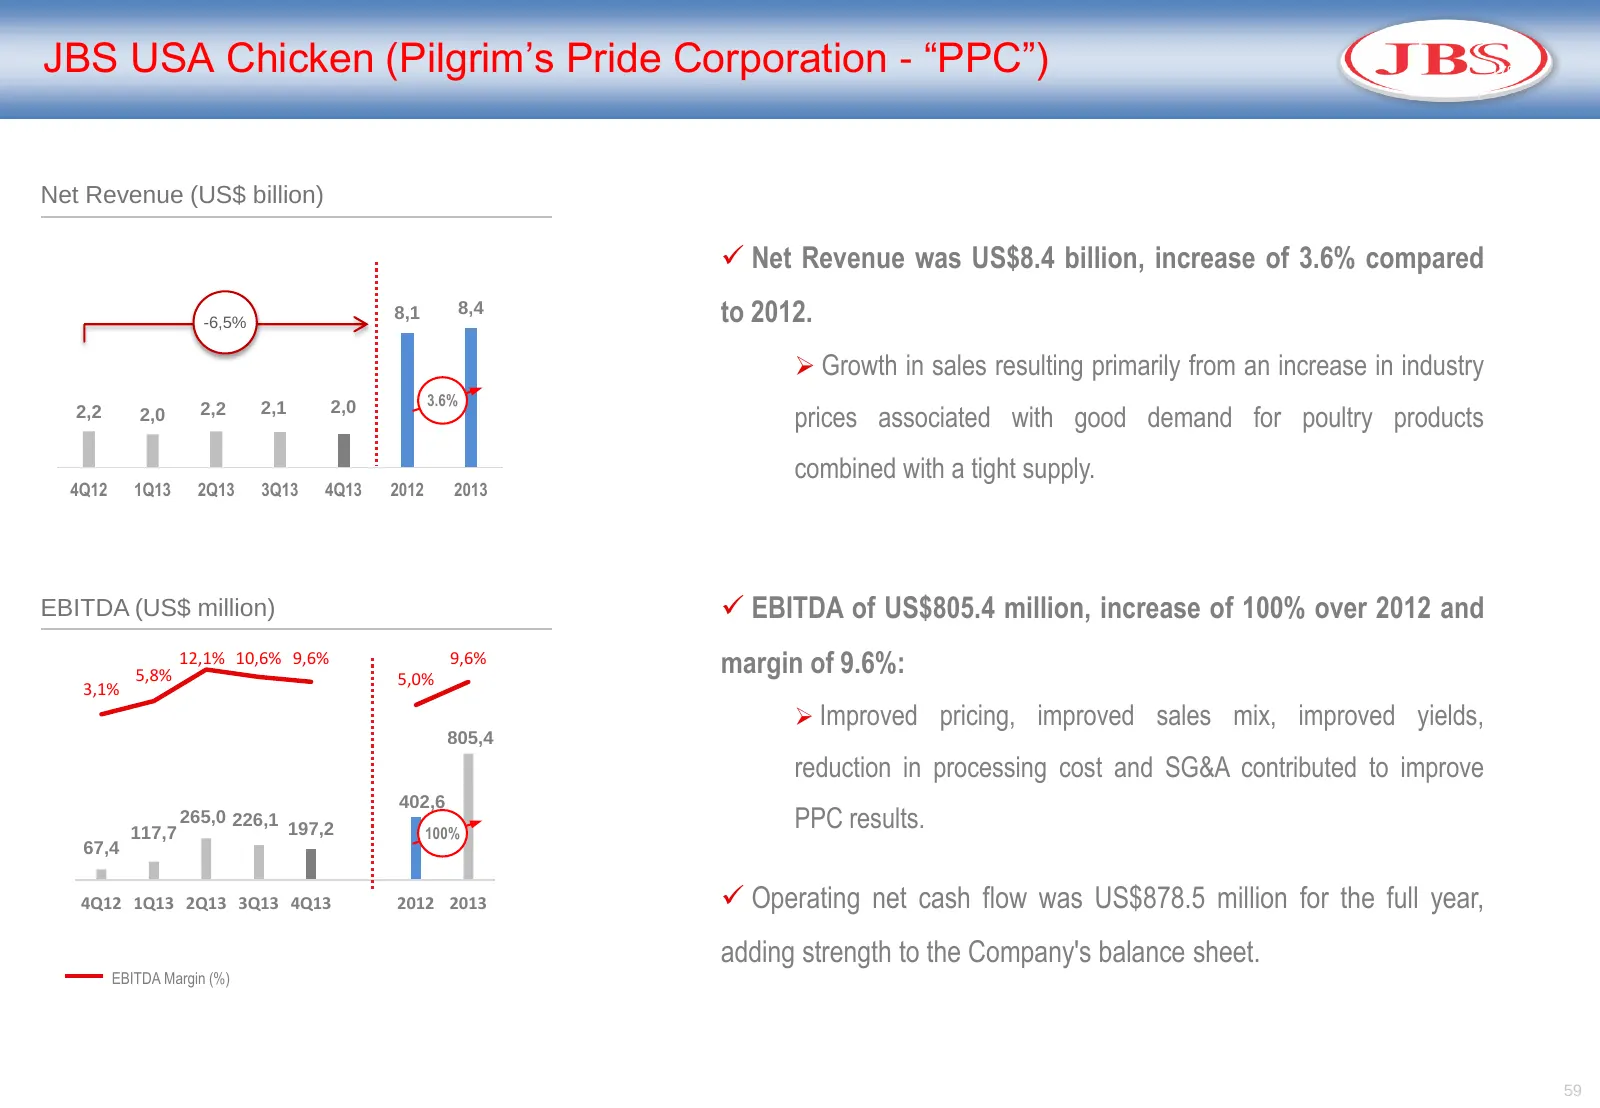
JBS USA Chicken (Pilgrim’s Pride Corporation - “PPC”) 17% Net Revenue (US$ billion) Net Revenue was US$8.4 billion, increase of 3.6% compared -6,5% 8,1 8,4 to 2012. Growth in sales resulting primarily from an increase in industry 3.6% 2,2 2,0 2,2 2,1 2,0 prices associated with good demand for po
Slide 60: Strategy
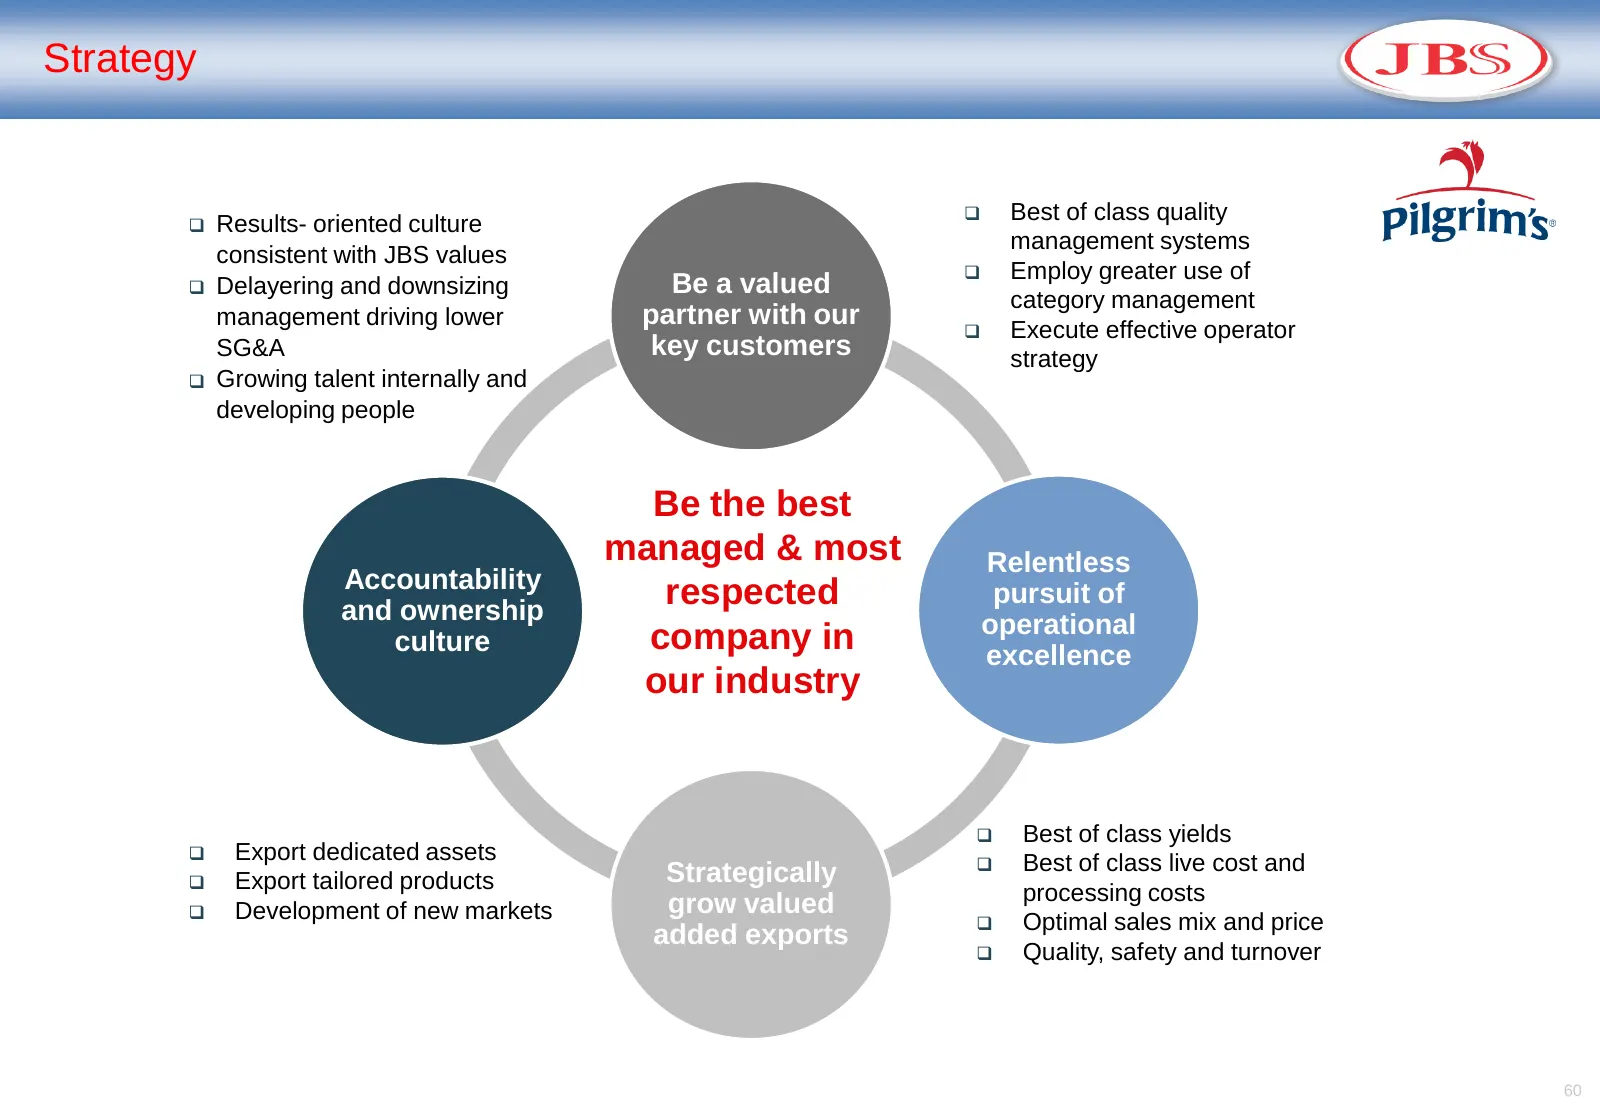
Strategy Best of class quality Results- oriented culture management systems consistent with JBS values Employ greater use of Delayering and downsizing Be a valued category management management driving lower partner with our Execute effective operator SG&A key customers strategy Growing
Slide 61: On a Path Toward Growth, We're Ready
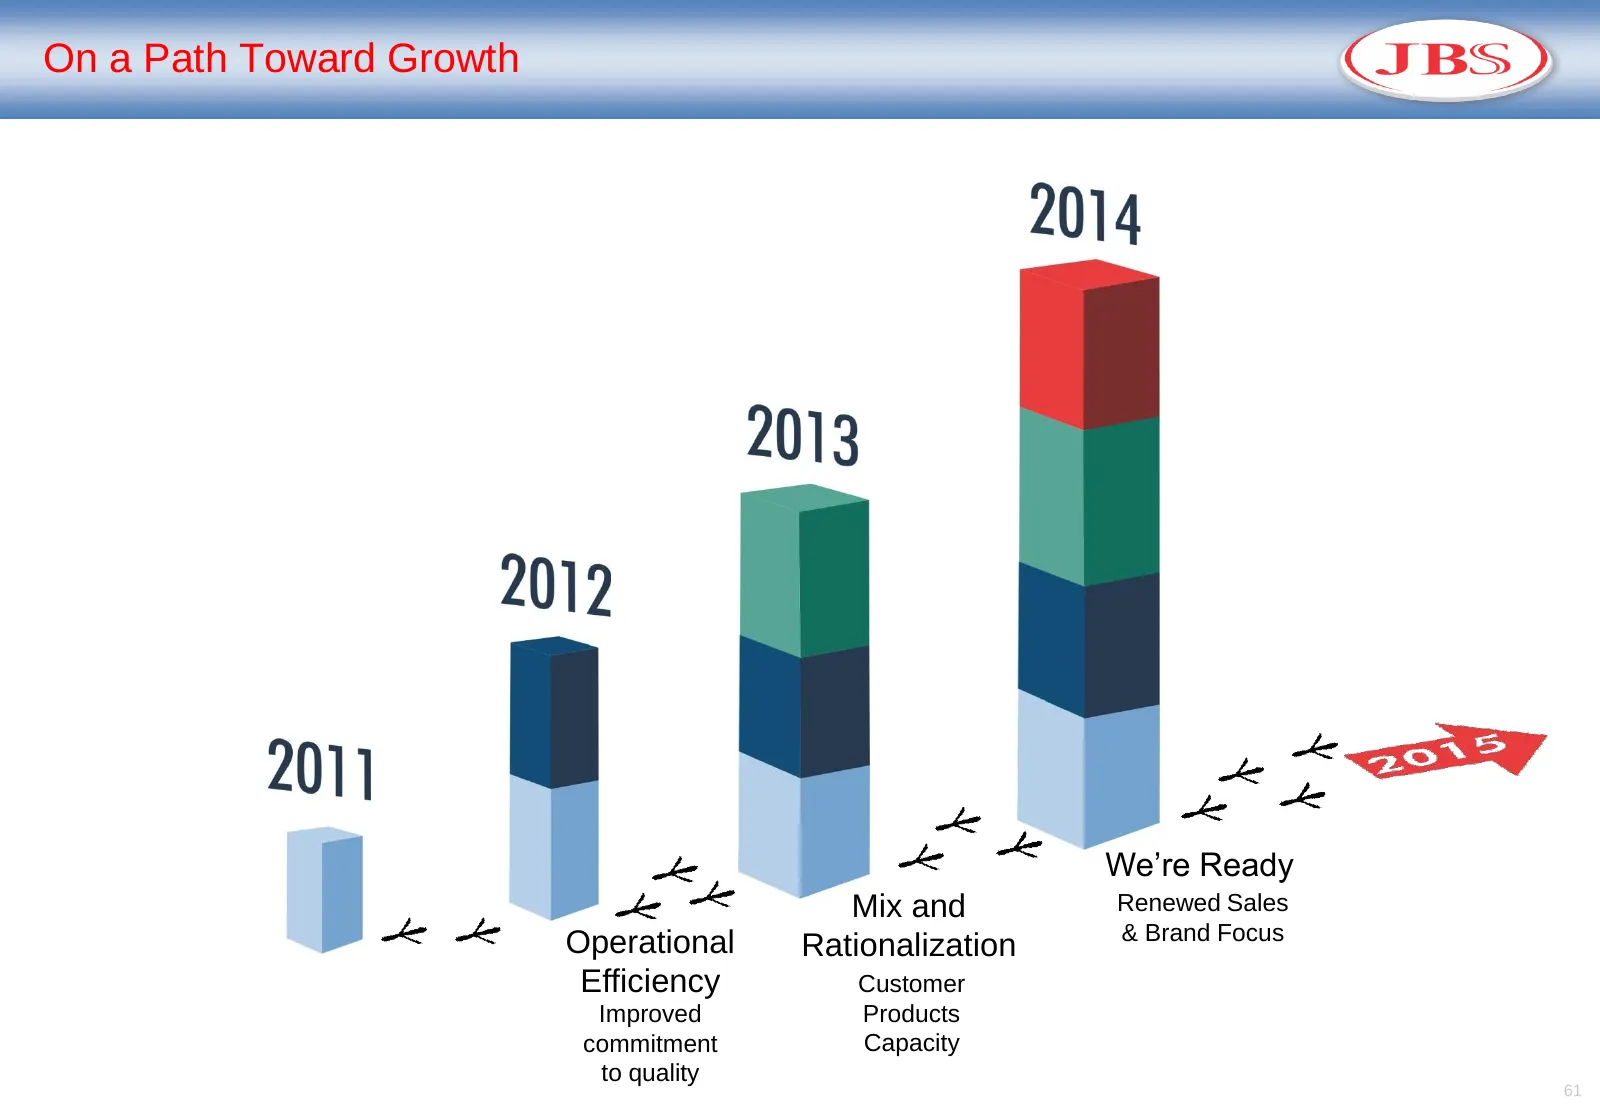
On a Path Toward Growth We’re Ready Mix and Renewed Sales Operational & Brand Focus Rationalization Efficiency Customer Improved Products commitment Capacity to quality 61
Slide 62: What's Next
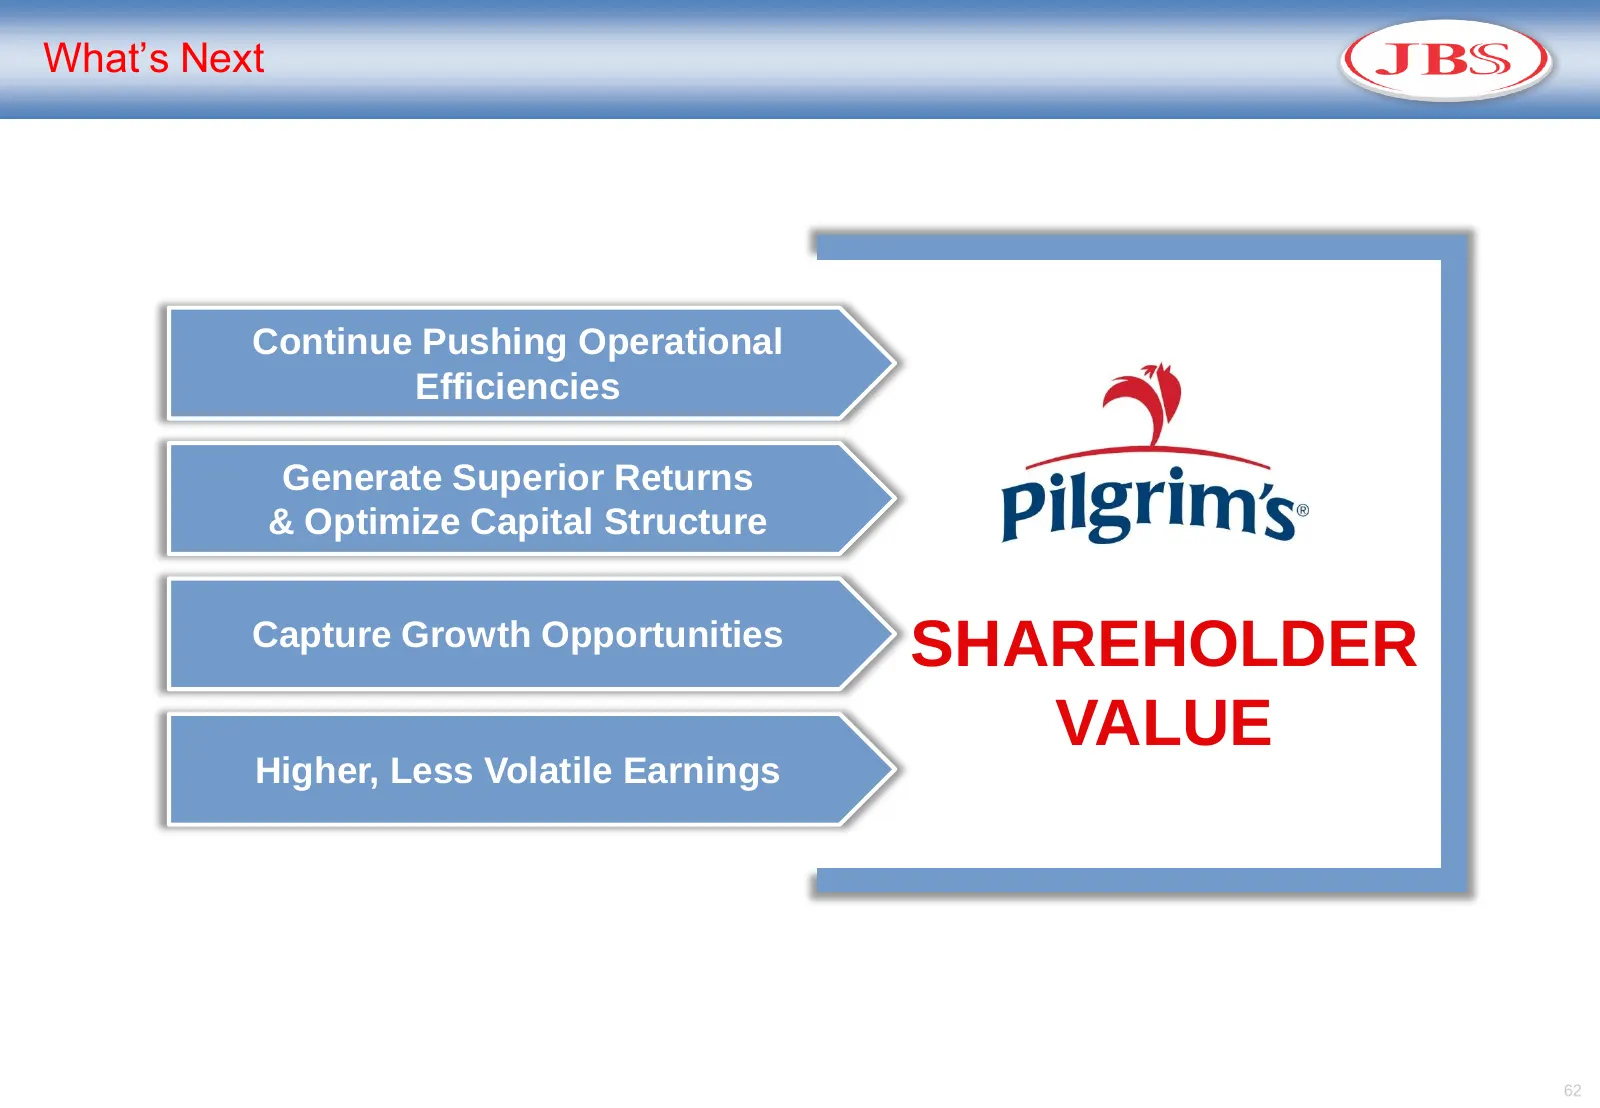
What’s Next Continue Pushing Operational Efficiencies Generate Superior Returns & Optimize Capital Structure Capture Growth Opportunities SHAREHOLDER VALUE Higher, Less Volatile Earnings 62
Slide 63: What's Next
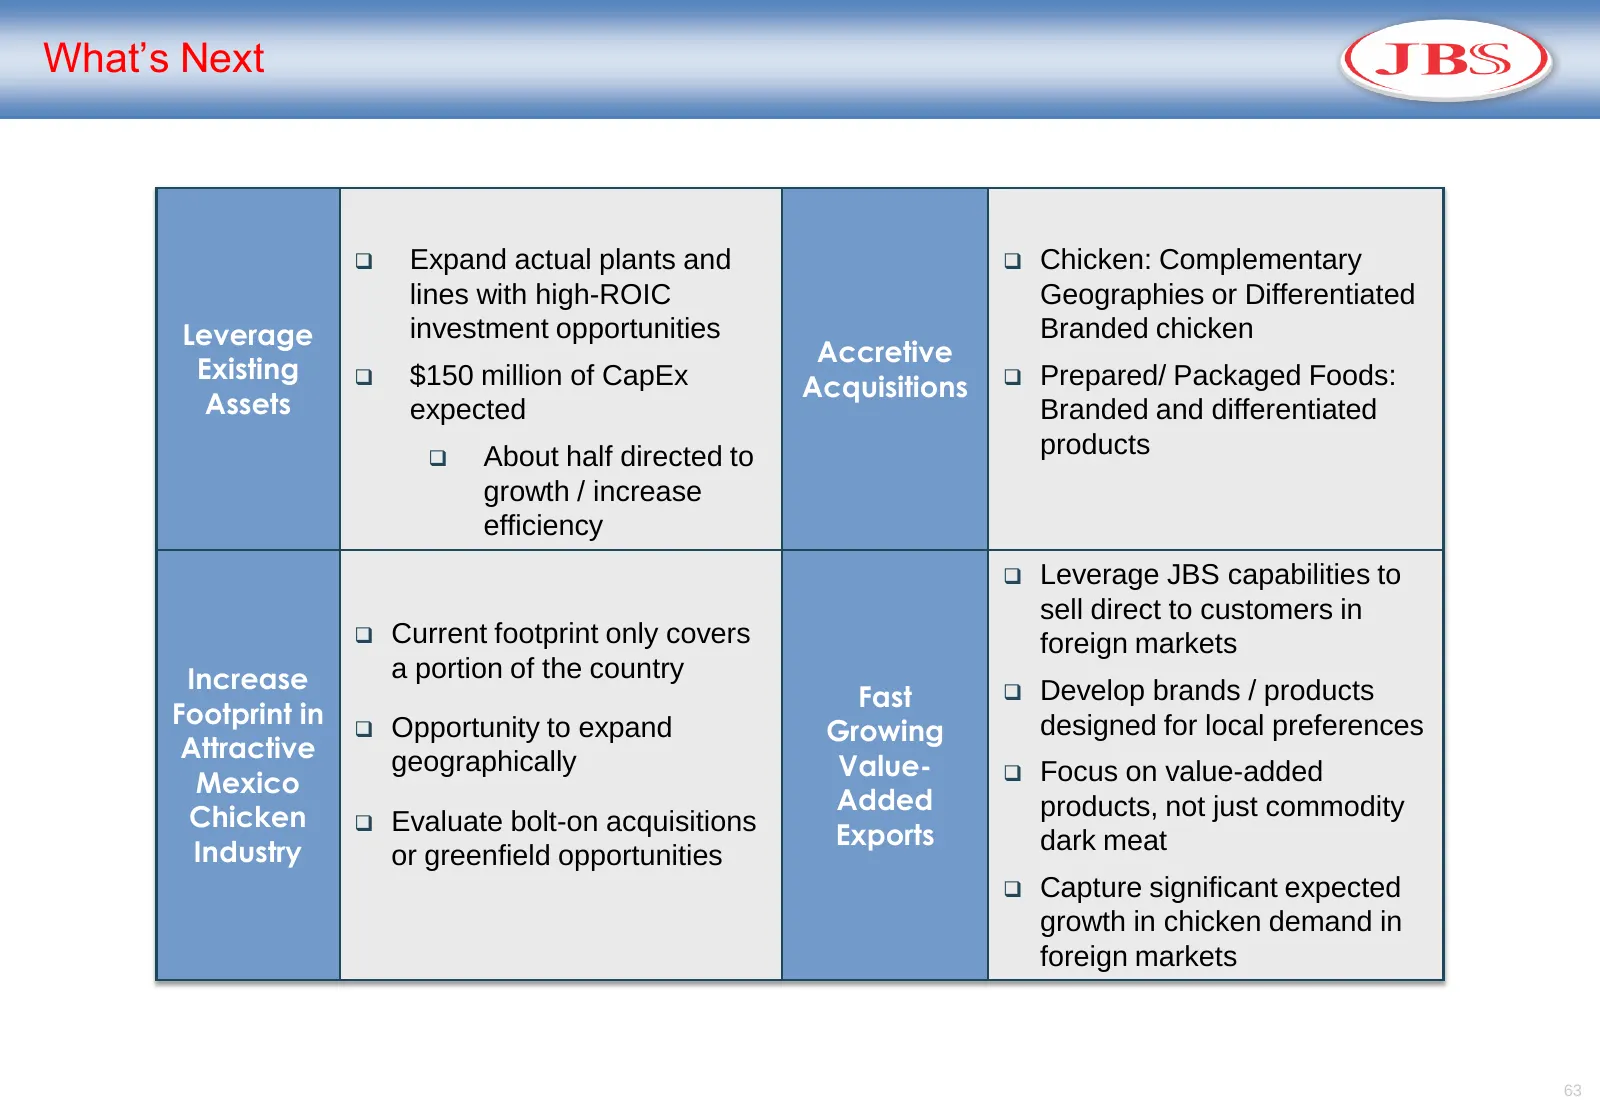
What’s Next Expand actual plants and Chicken: Complementary lines with high-ROIC Geographies or Differentiated Leverage investment opportunities Branded chicken Accretive Existing $150 million of CapEx Prepared/ Packaged Foods: Acquisitions Assets expected Branded and differentiated About
Slide 64: JBS Foods
JBS Foods (JBS)
Slide 65: JBS Foods at a Glance
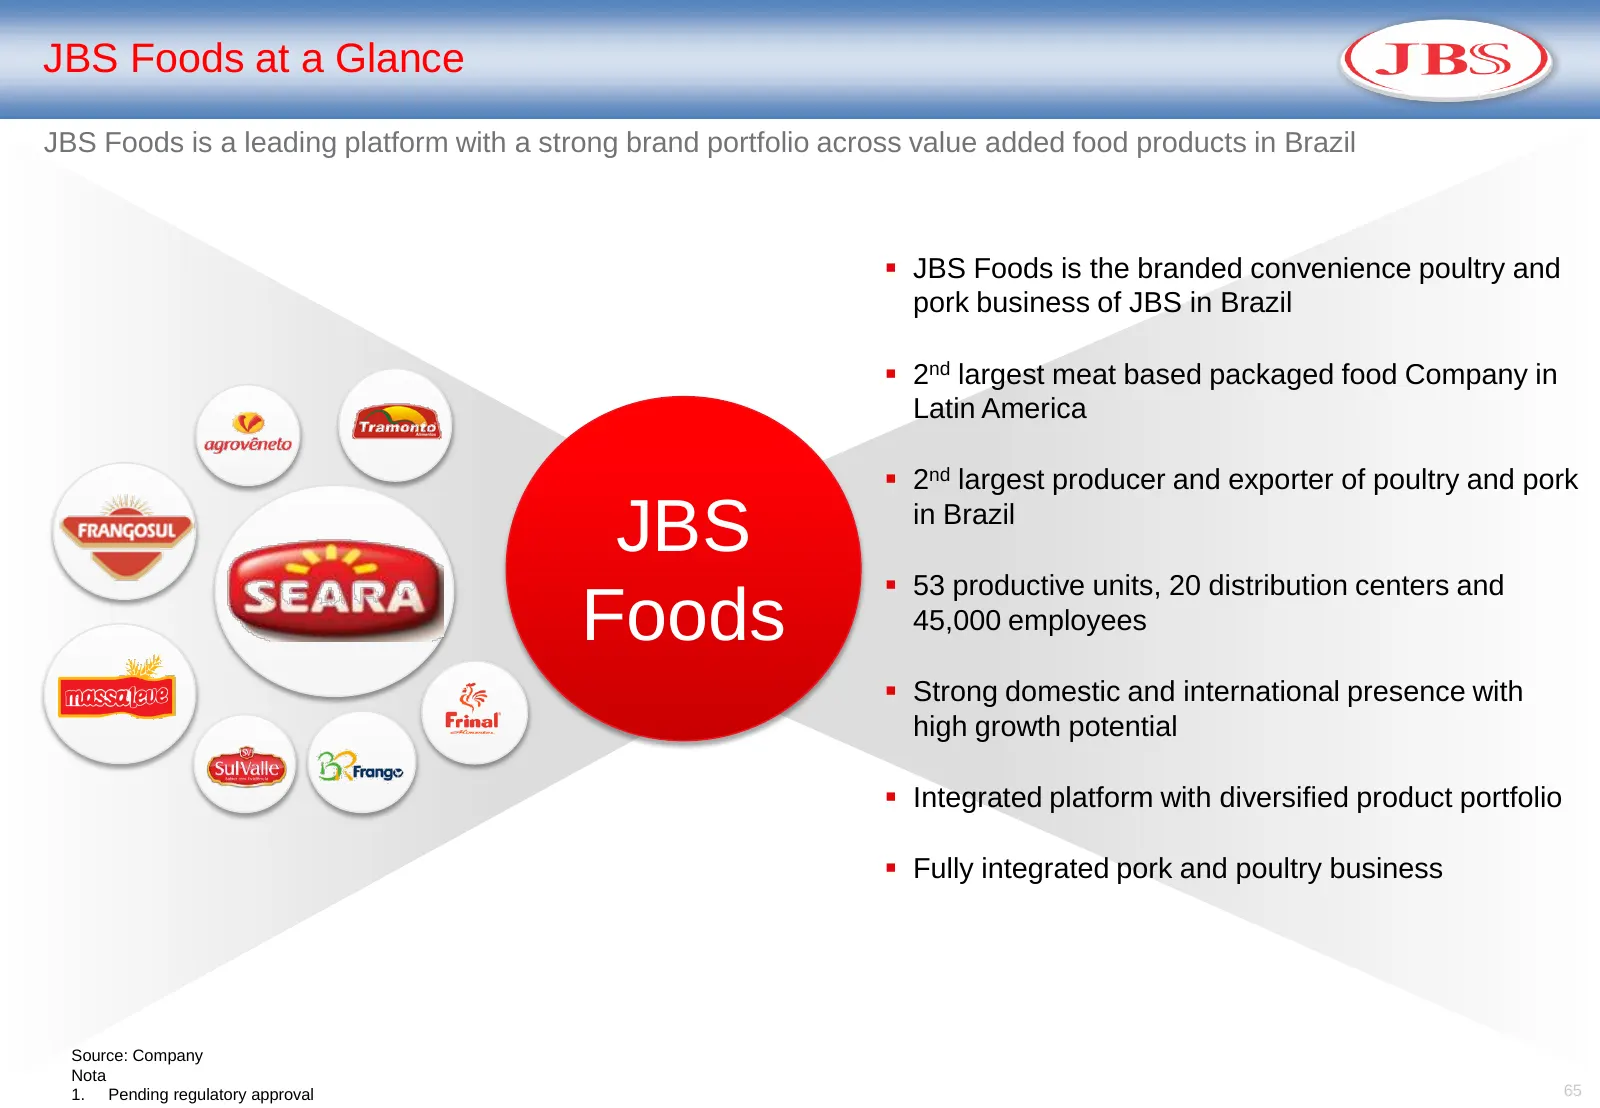
JBS Foods at a Glance JBS Foods is a leading platform with a strong brand portfolio across value added food products in Brazil JBS Foods is the branded convenience poultry and pork business of JBS in Brazil 2nd largest meat based packaged food Company in Latin America 2nd largest producer and
Slide 66: JBS Foods: Footprint
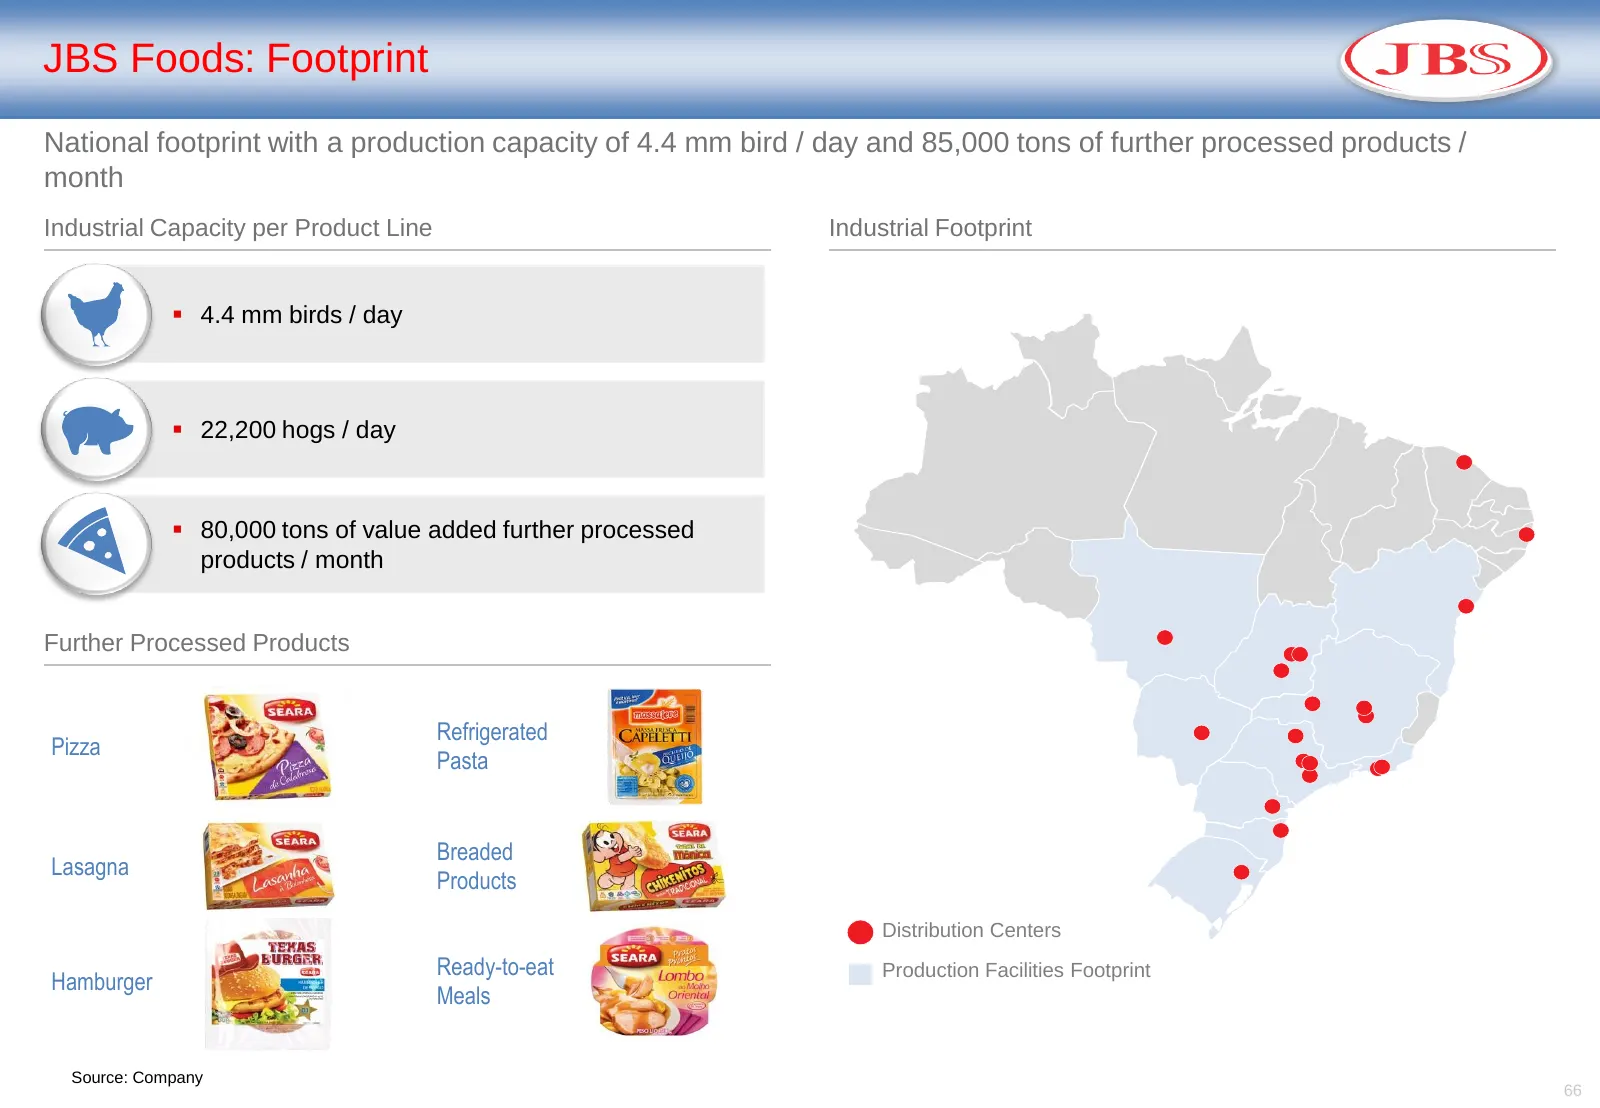
JBS Foods: Footprint National footprint with a production capacity of 4.4 mm bird / day and 85,000 tons of further processed products / month Industrial Capacity per Product Line Industrial Footprint 4.4 mm birds / day 22,200 hogs / day 80,000 tons of value added further processed products / m
Slide 67: Turnaround Under Way
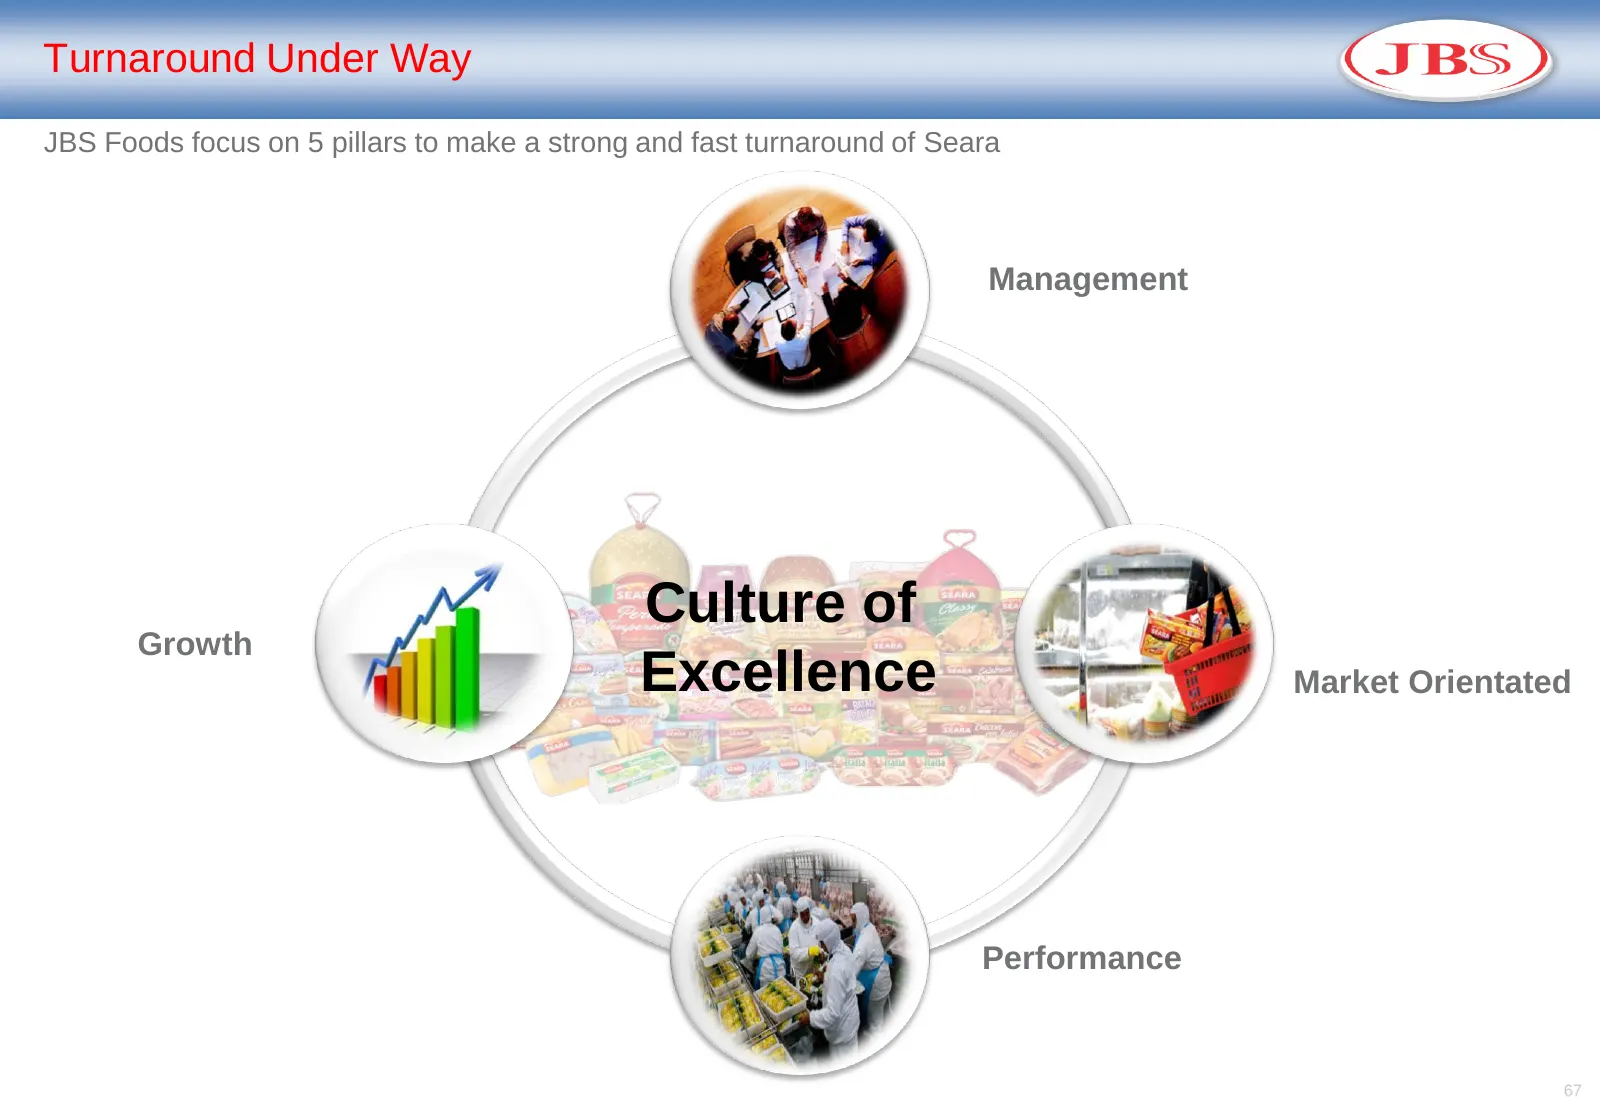
Turnaround Under Way JBS Foods focus on 5 pillars to make a strong and fast turnaround of Seara Management Culture of Growth Excellence Market Orientated Performance 67
Slide 68: Our Team and Our Culture Makes the Difference
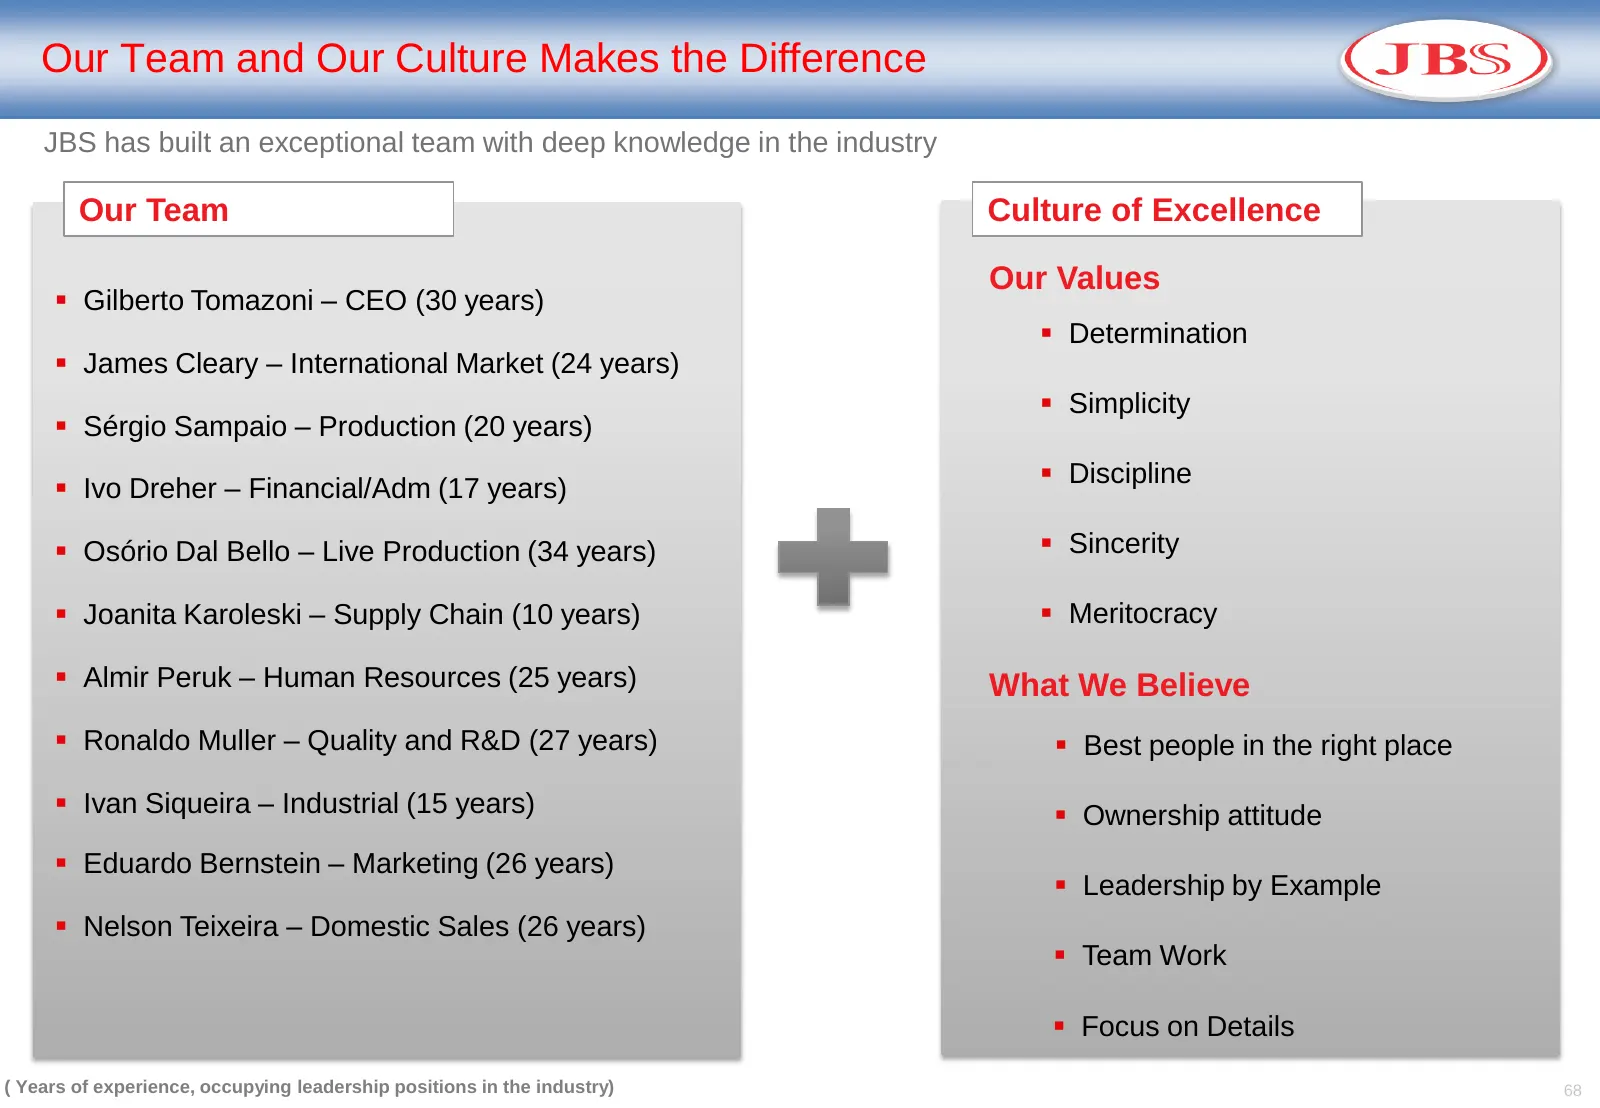
Our Team and Our Culture Makes the Difference JBS has built an exceptional team with deep knowledge in the industry Our Team Culture of Excellence Our Values Gilberto Tomazoni – CEO (30 years) Determination James Cleary – International Market (24 years) Simplicity Sérgio Sampaio – Producti
Slide 69: Market Orientated: Streamlining and Repositioning of Brands
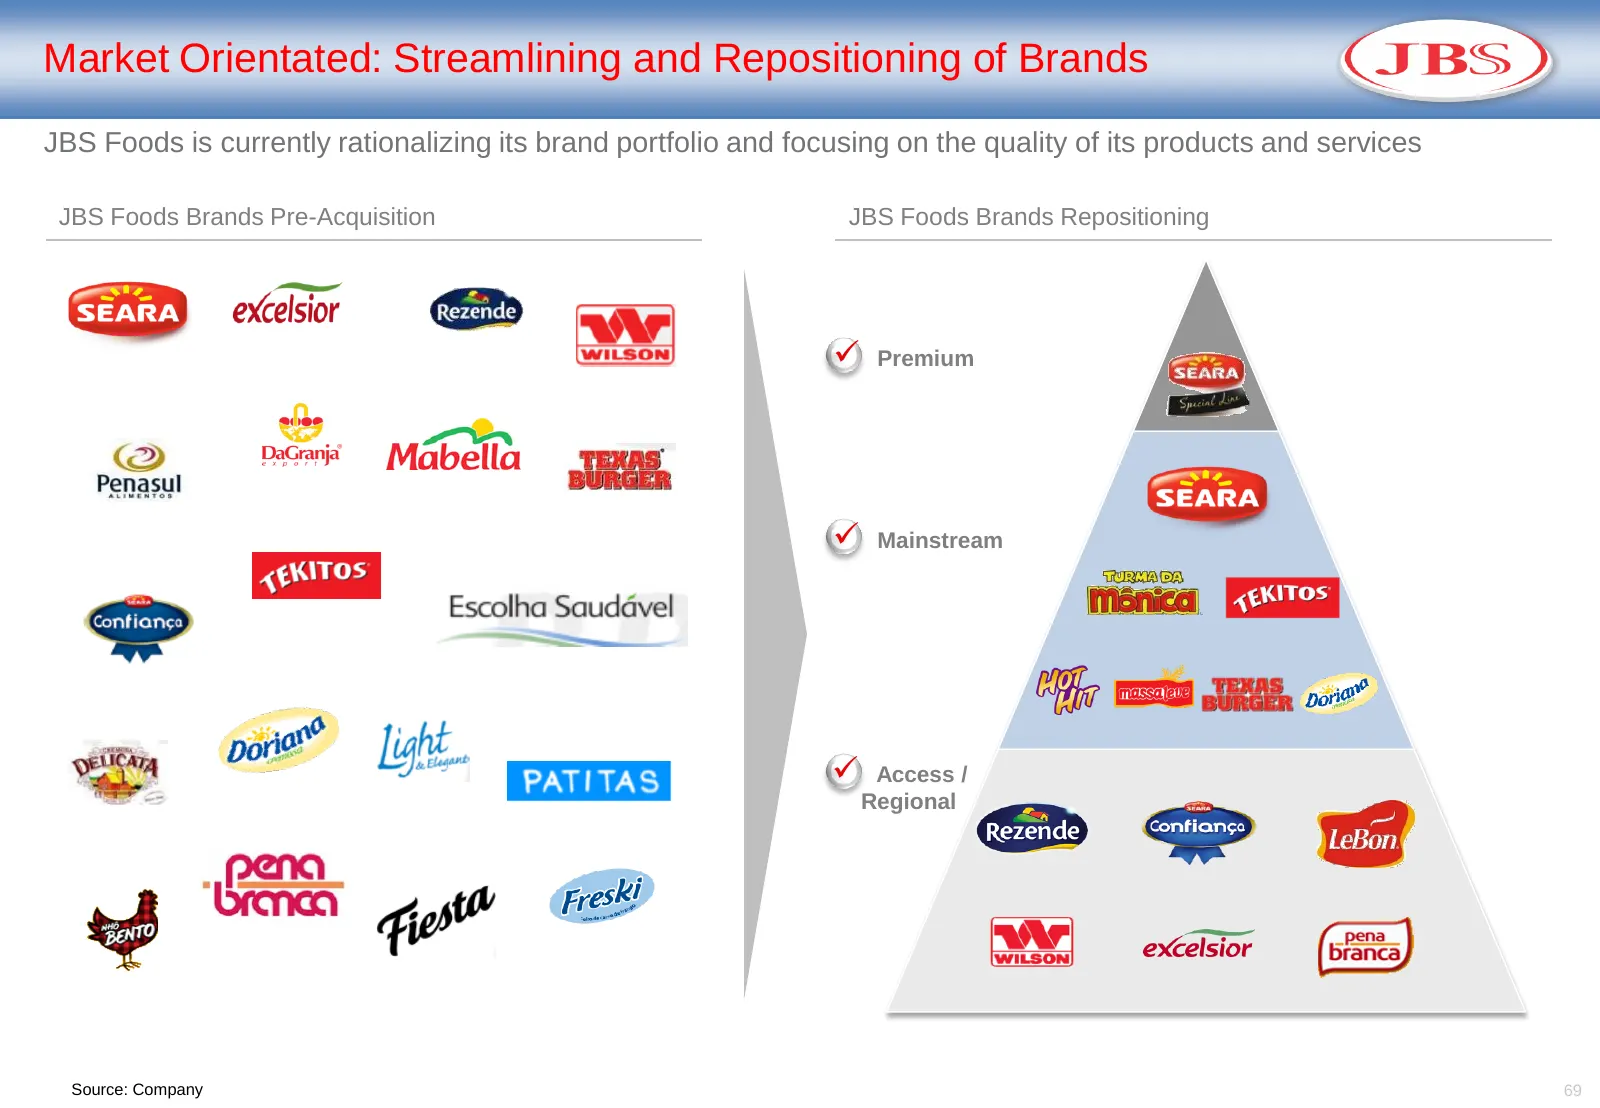
Market Orientated: Streamlining and Repositioning of Brands JBS Foods is currently rationalizing its brand portfolio and focusing on the quality of its products and services JBS Foods Brands Pre-Acquisition JBS Foods Brands Repositioning Premium Mainstream Access / Regional Source: Company 69
Slide 70: Market Orientated: Improved Pricing Strategy
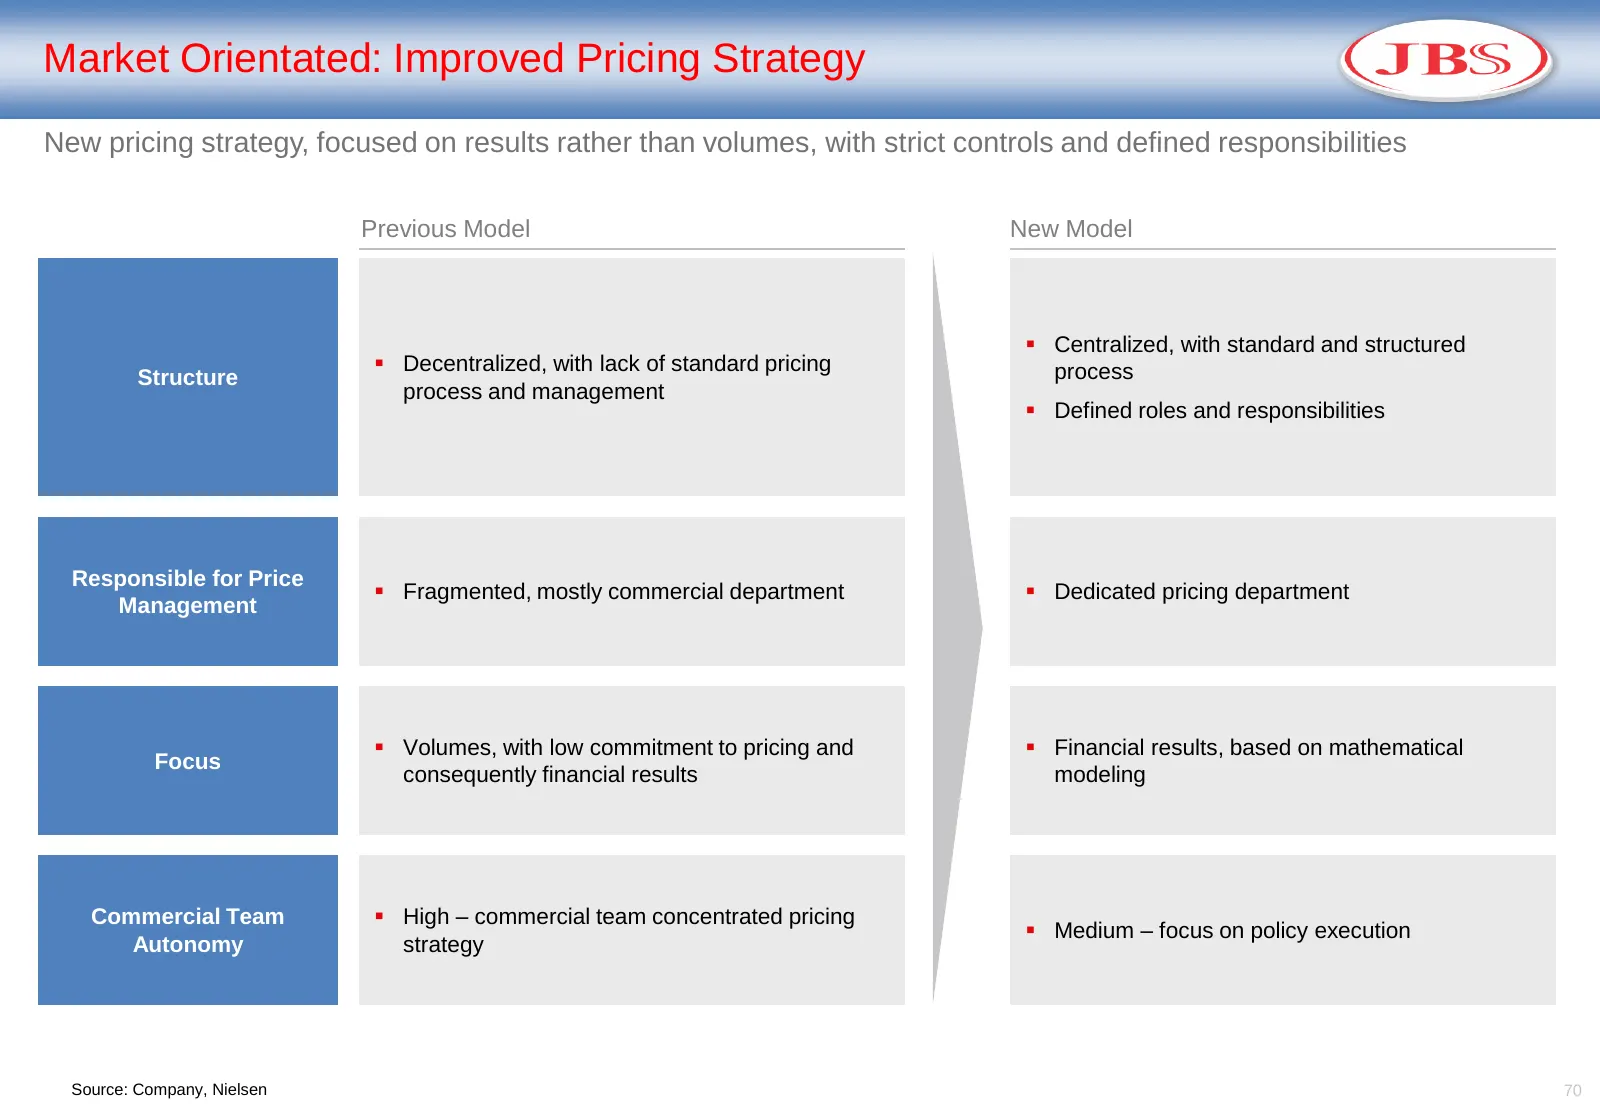
Market Orientated: Improved Pricing Strategy New pricing strategy, focused on results rather than volumes, with strict controls and defined responsibilities Previous Model New Model Centralized, with standard and structured Decentralized, with lack of standard pricing process Structure process a
Slide 71: JBS Foods: Global Positioning and International Growth Strategy
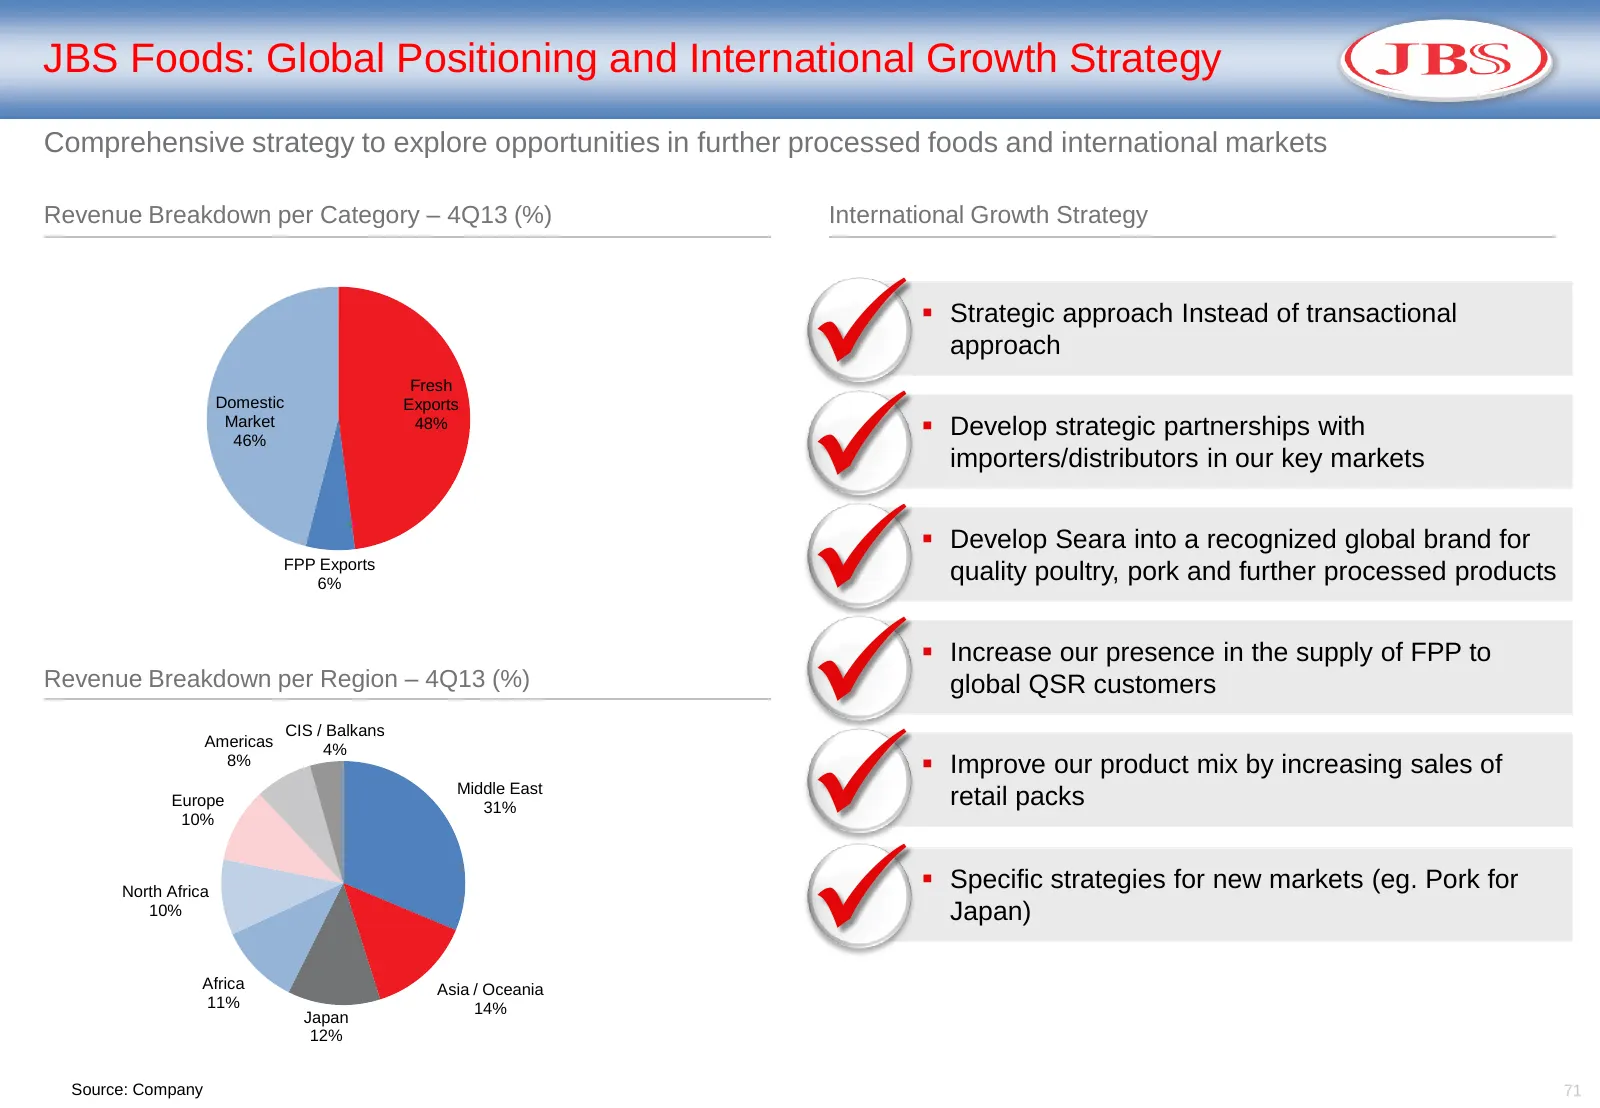
JBS Foods: Global Positioning and International Growth Strategy Comprehensive strategy to explore opportunities in further processed foods and international markets Revenue Breakdown per Category – 4Q13 (%) International Growth Strategy Strategic approach Instead of transactional approach Fres
Slide 72: Improved Performance from Farm to Market
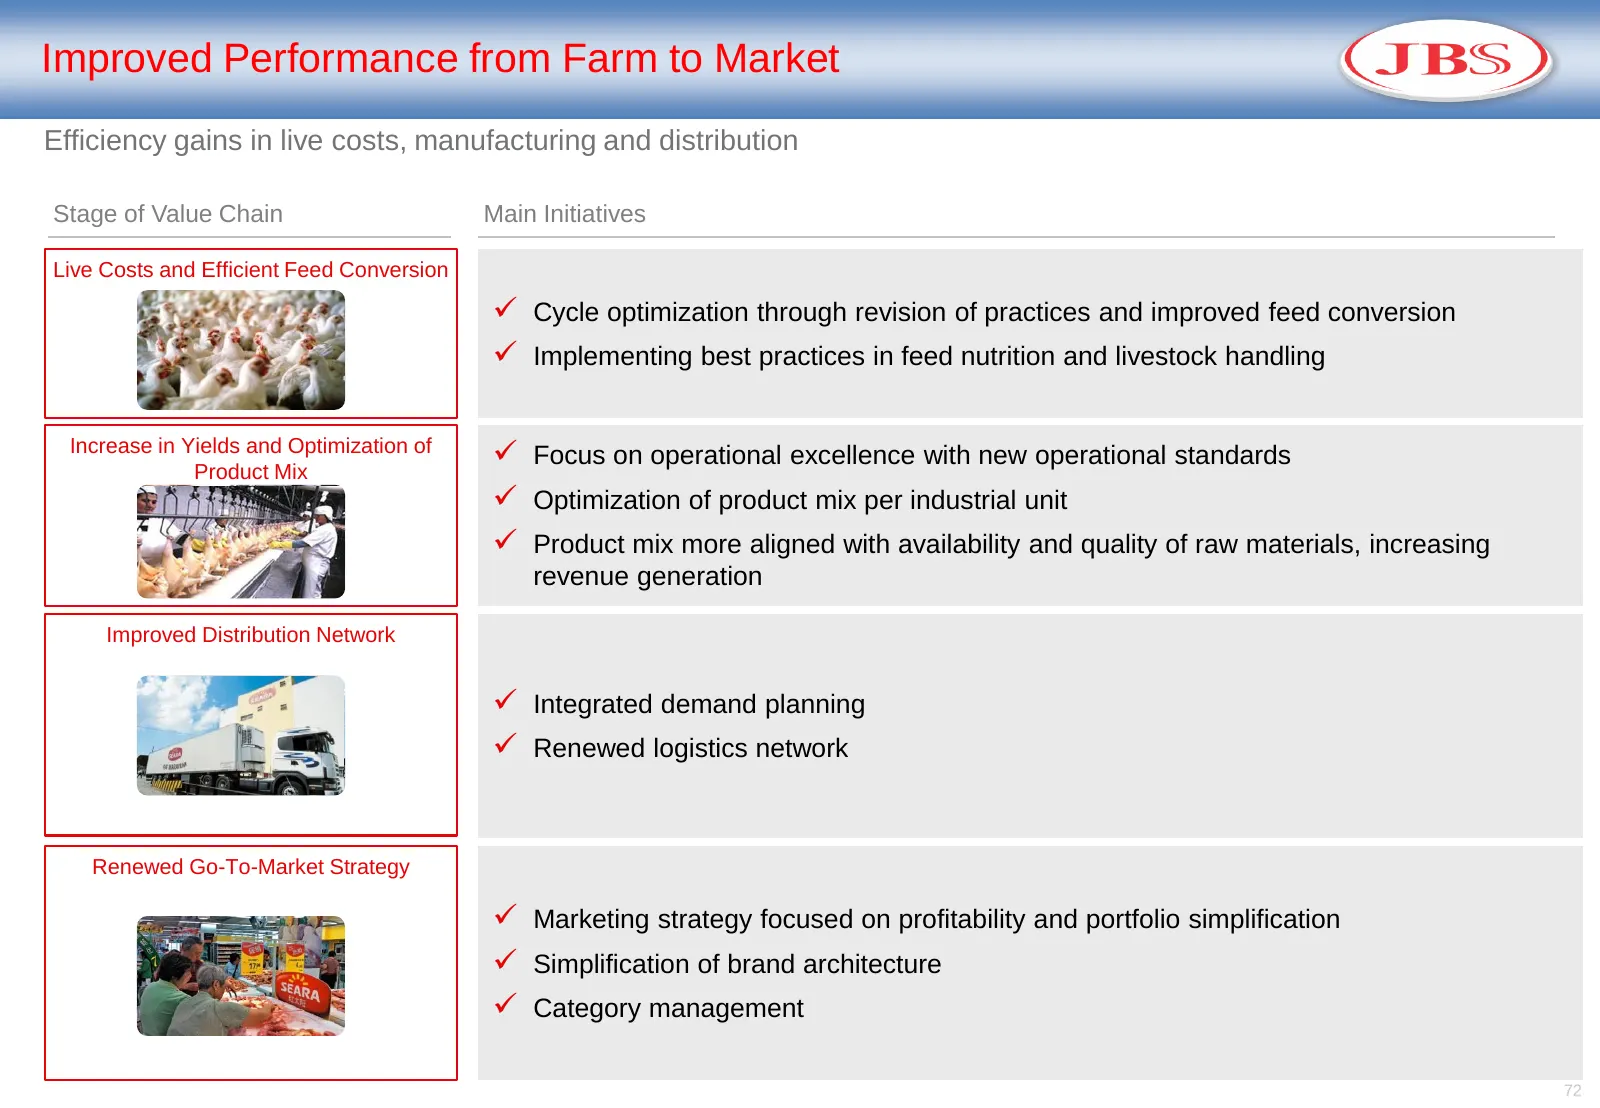
Improved Performance from Farm to Market Efficiency gains in live costs, manufacturing and distribution Stage of Value Chain Main Initiatives Live Costs and Efficient Feed Conversion Cycle optimization through revision of practices and improved feed conversion Implementing best practices in feed
Slide 73: Value Creation Through Management Initiatives in 2014
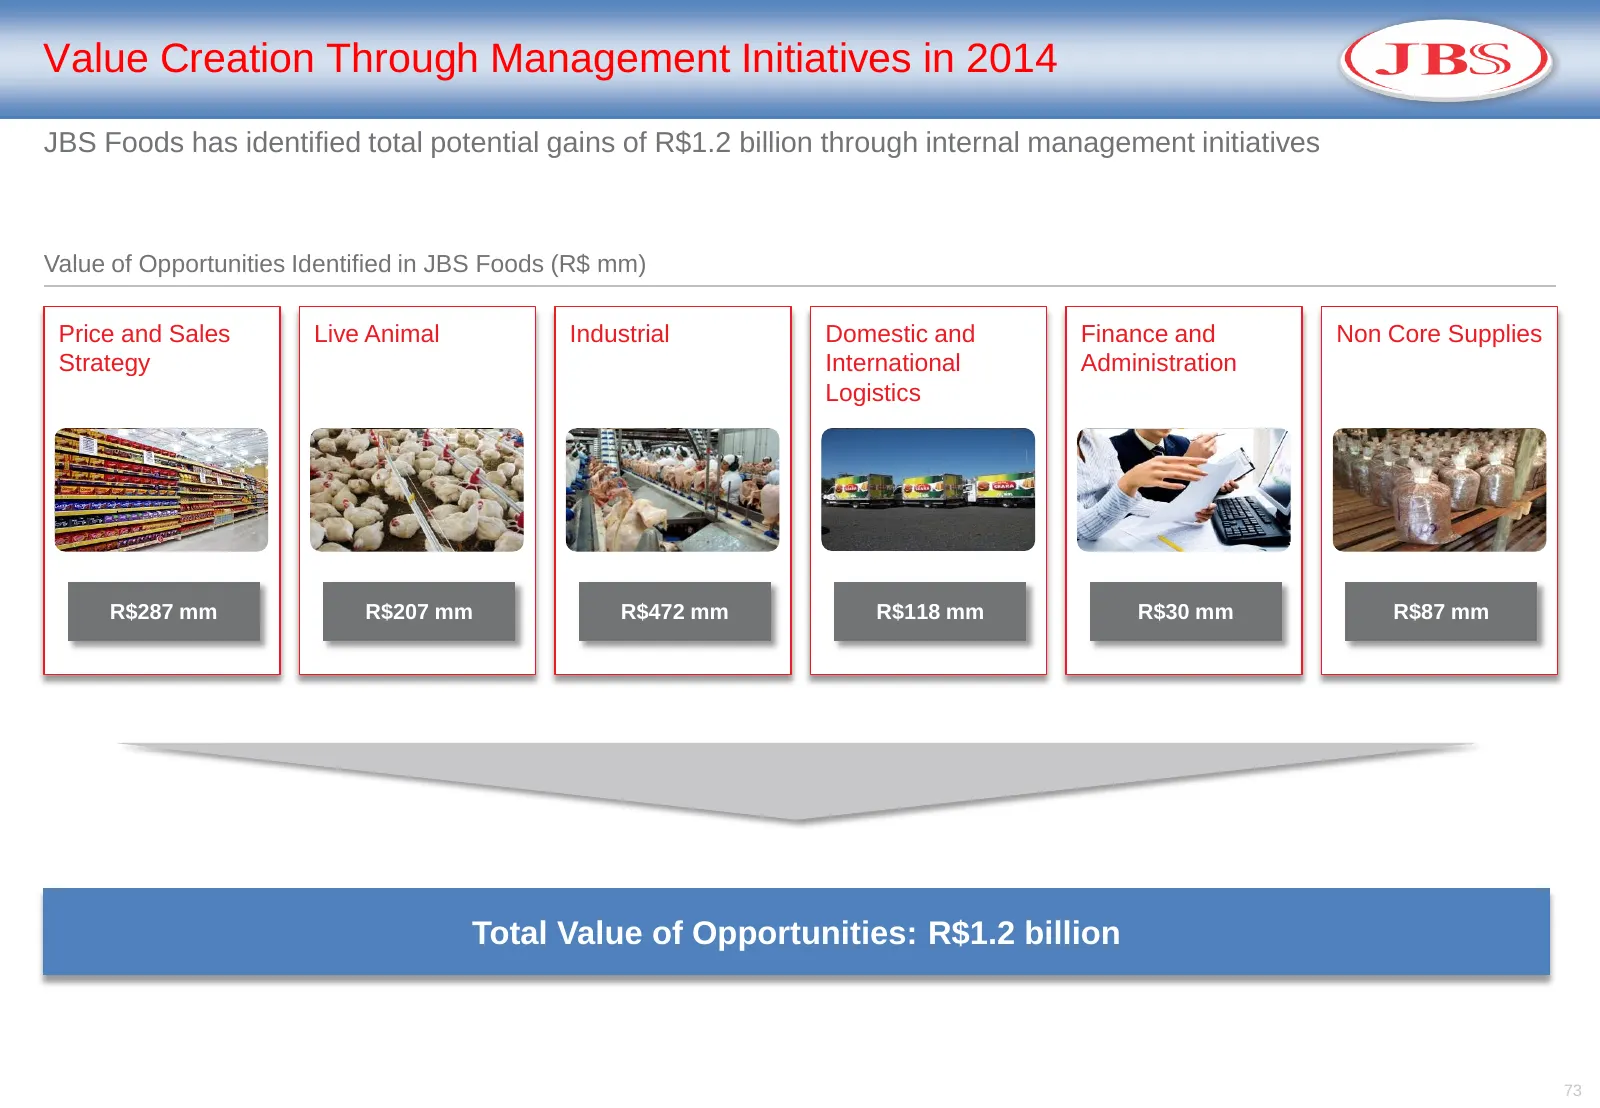
Value Creation Through Management Initiatives in 2014 JBS Foods has identified total potential gains of R$1.2 billion through internal management initiatives Value of Opportunities Identified in JBS Foods (R$ mm) Price and Sales Live Animal Industrial Domestic and Finance and Non Core Supplies Strat
Slide 74: Growth Opportunities Through Organic and Inorganic Growth
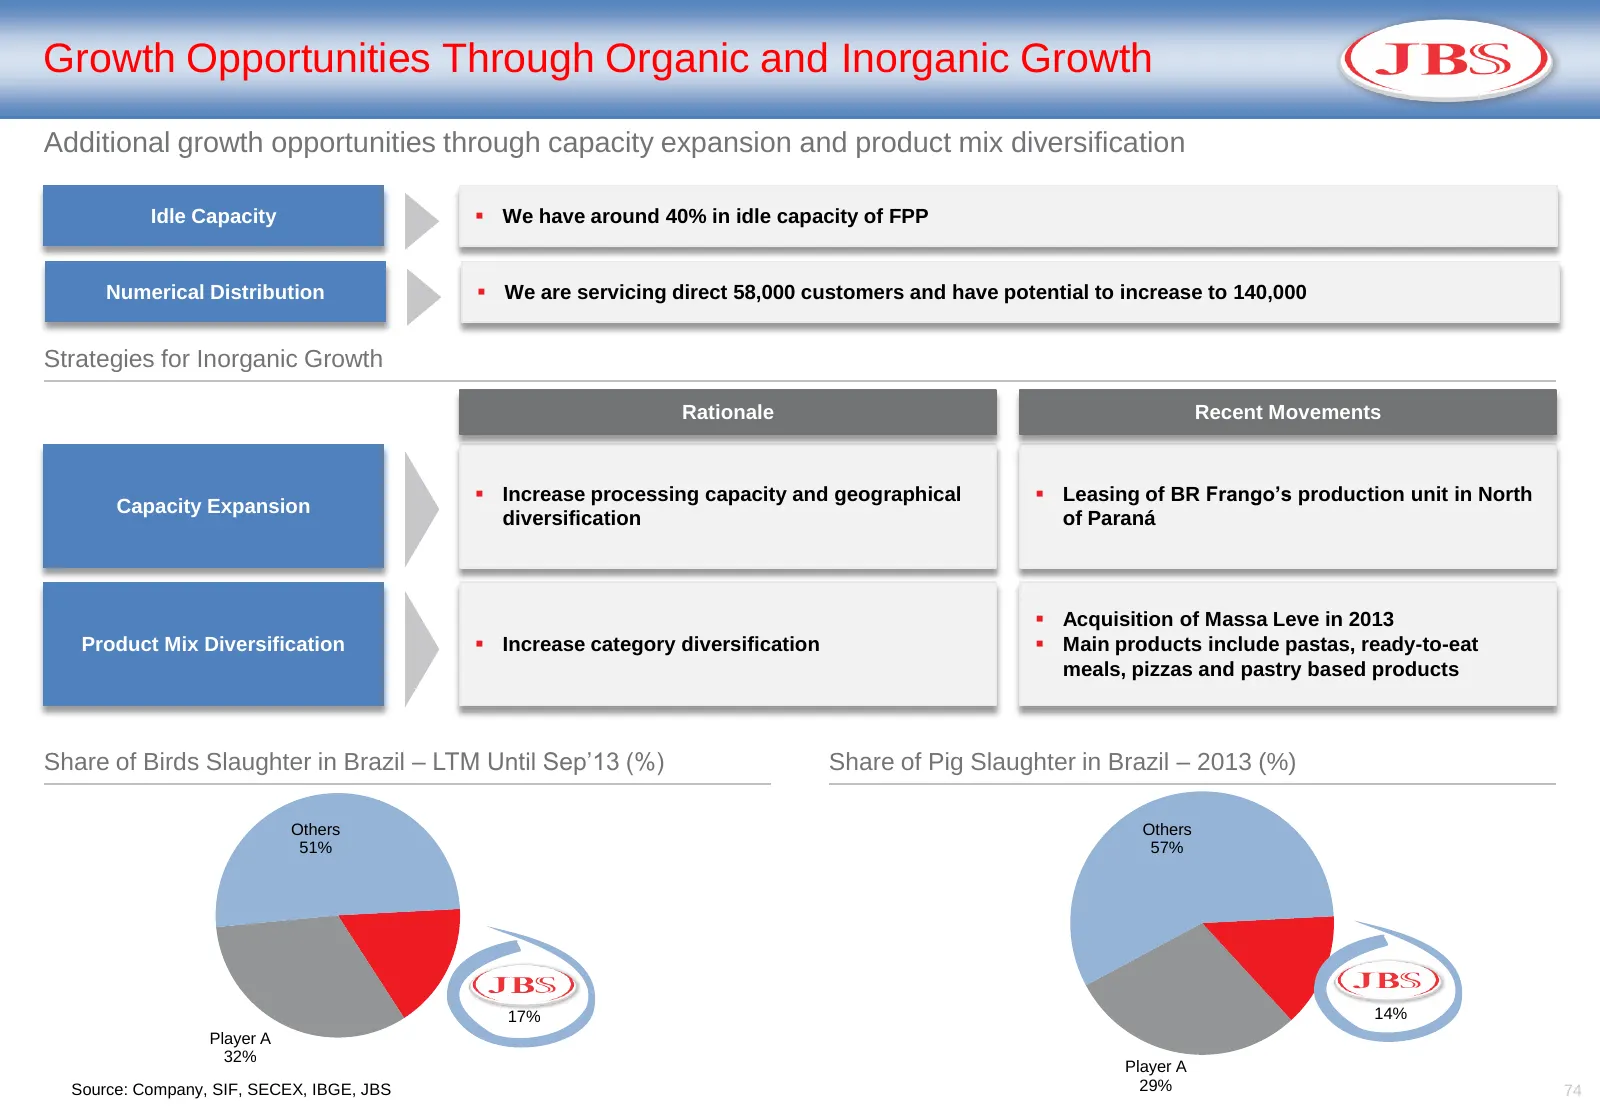
Growth Opportunities Through Organic and Inorganic Growth Additional growth opportunities through capacity expansion and product mix diversification Idle Capacity We have around 40% in idle capacity of FPP Numerical Distribution We are servicing direct 58,000 customers and have potential to incr
Slide 75: We Are Confident That We Will Continue to Deliver Value
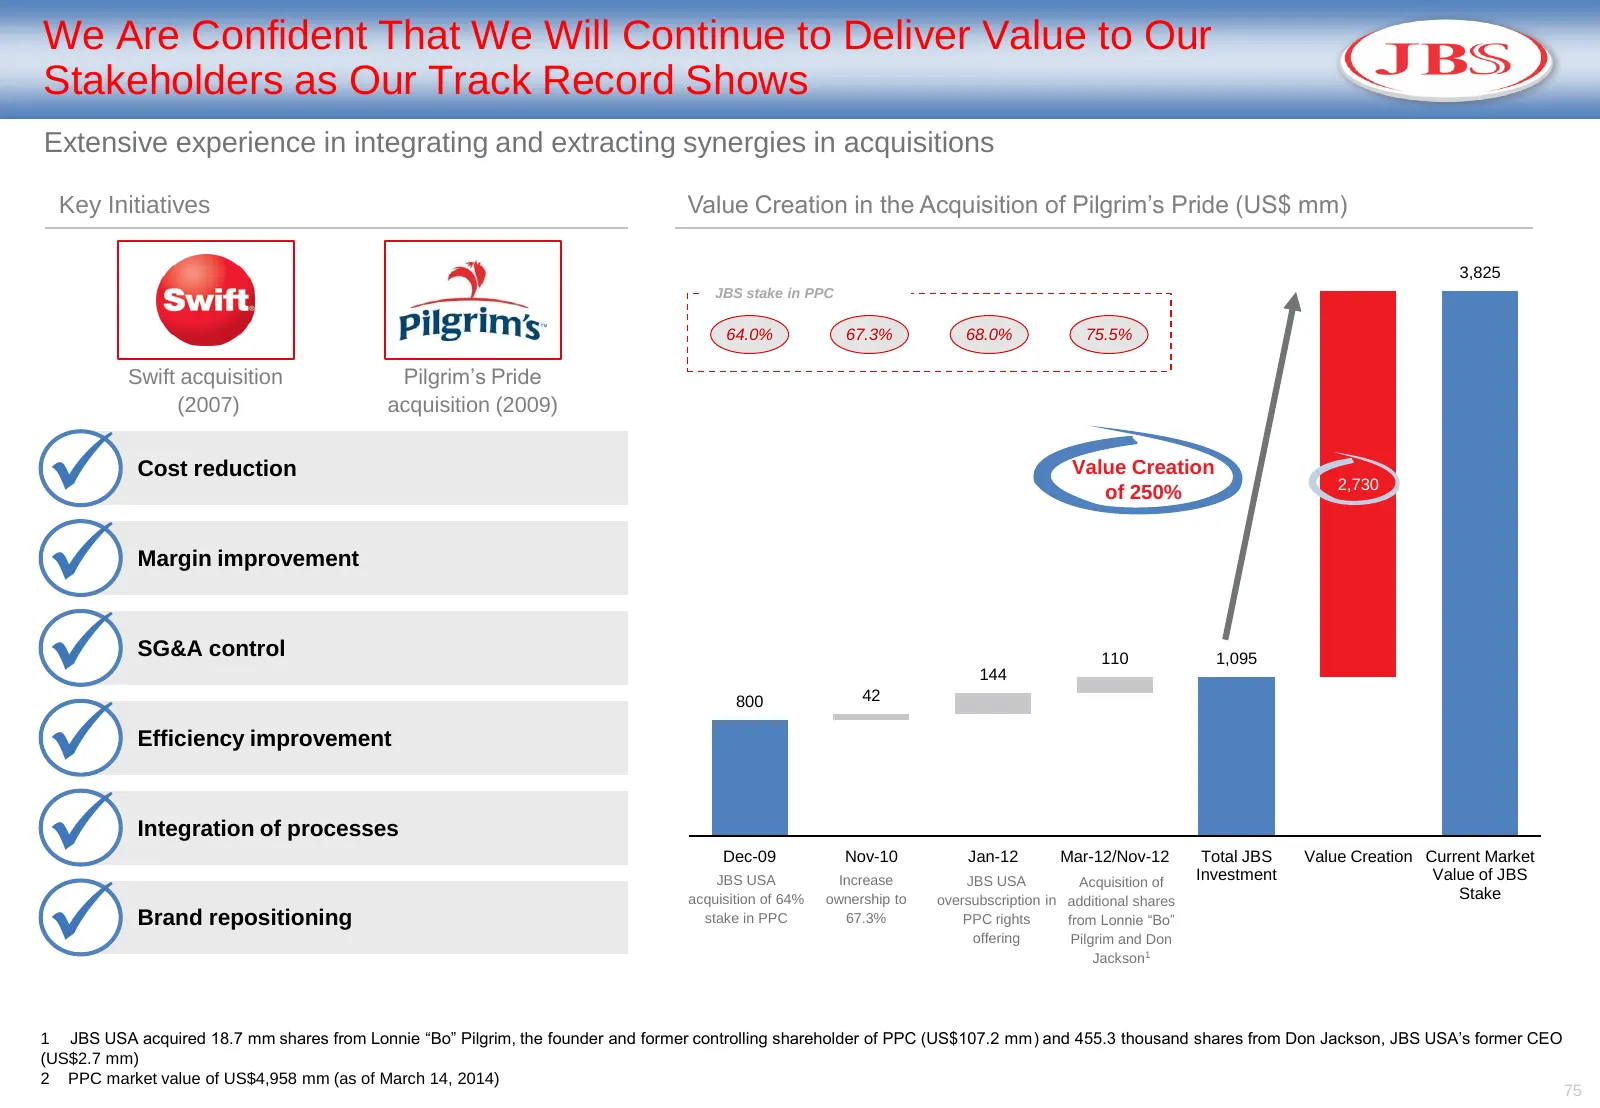
We Are Confident That We Will Continue to Deliver Value to Our Stakeholders as Our Track Record Shows Extensive experience in integrating and extracting synergies in acquisitions Key Initiatives Value Creation in the Acquisition of Pilgrim’s Pride (US$ mm) 3,825 JBS stake in PPC 64.0% 67.3% 68.0% 75
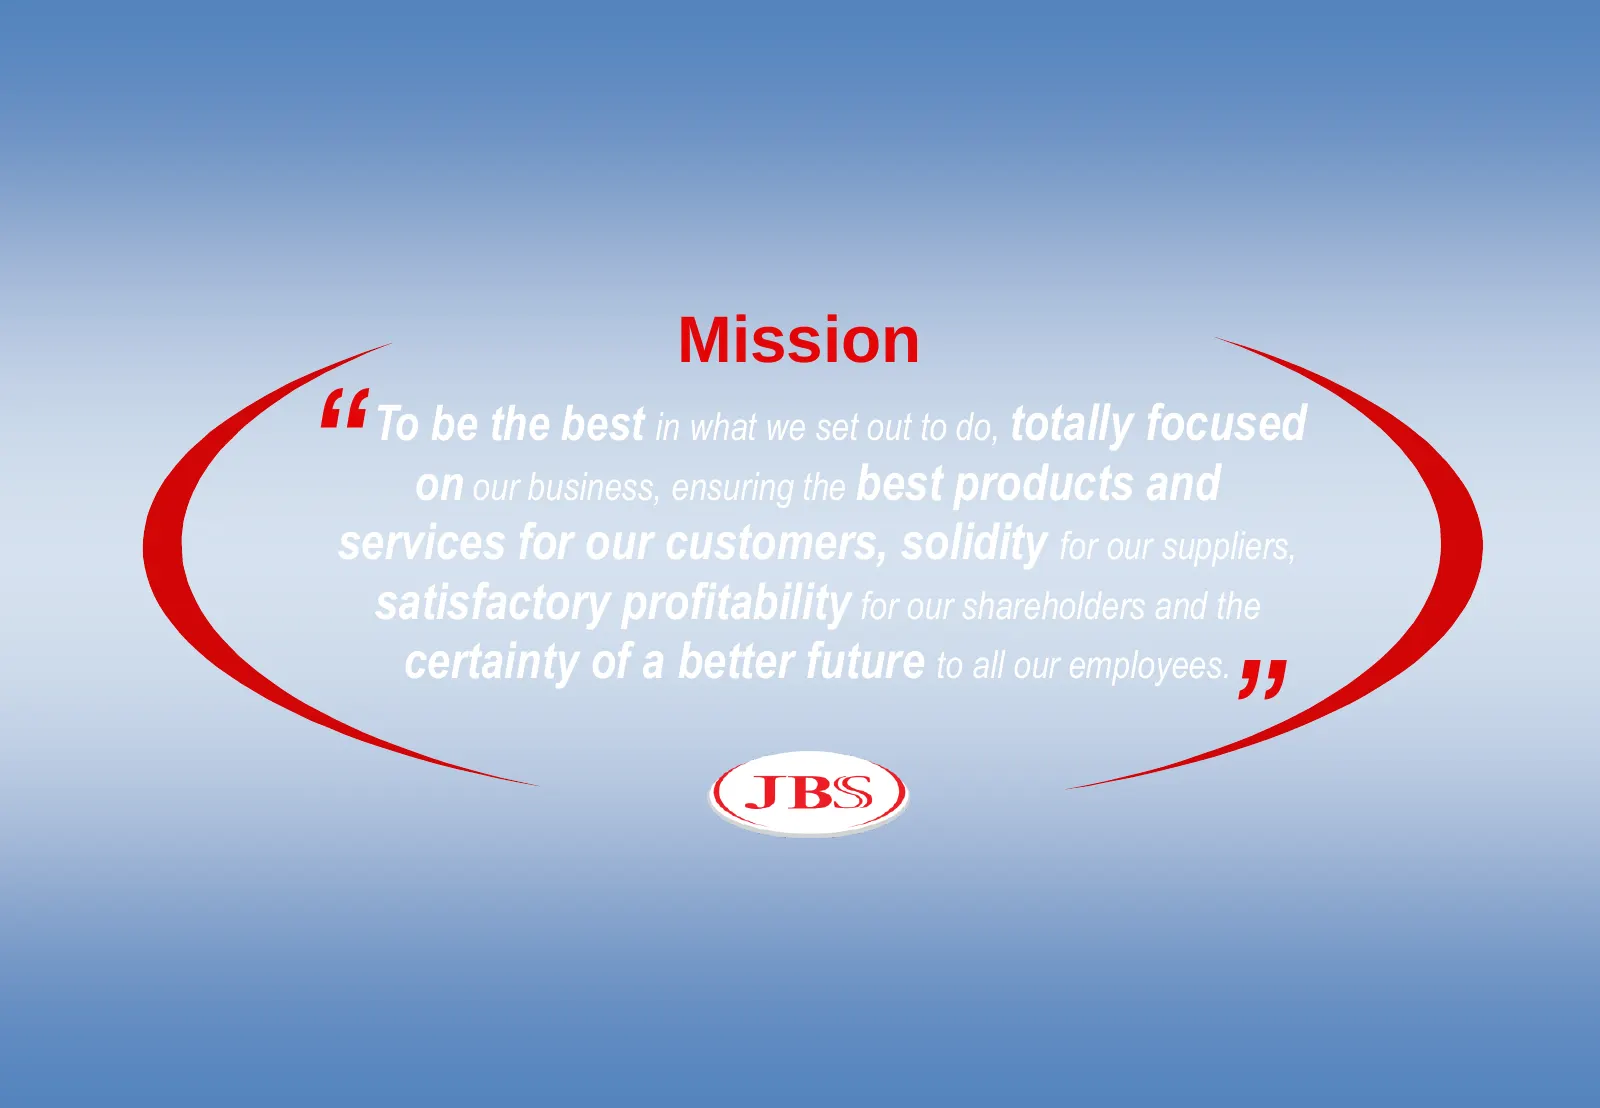
Slide 76: Mission
Mission “ To be the best in what we set out to do, totally focused on our business, ensuring the best products and services for our customers, solidity for our suppliers, satisfactory profitability for our shareholders and the ” certainty of a better future to all our employees.
Source: Internet Archive copy of jbsglobal.com