LegacyTexas Financial Group Inc
LegacyTexas Financial — ViewPoint Financial Group — Sterne Agee Investor Conference 2012
32 slides from LegacyTexas Financial's conference presentation, Feb 10, 2012

Slide 1: Sterne Agee Investor Conference February 13, 2012
1 NASDAQ: VPFG Sterne Agee Investor Conference February 13, 2012 Mark Hord - Interim President and Chief Executive Officer Patti McKee - Executive Vice President and Chief Financial Officer
Slide 2: Safe Harbor Statement
2 Safe Harbor Statement When used in filings by the Company with the Securities and Exchange Commission (the "SEC") in the Company's press releases or other public or shareholder communications, and in oral statements made with the approval of an authorized executive officer, the words or phrases "w
Slide 3: Corporate & Geographic Overview
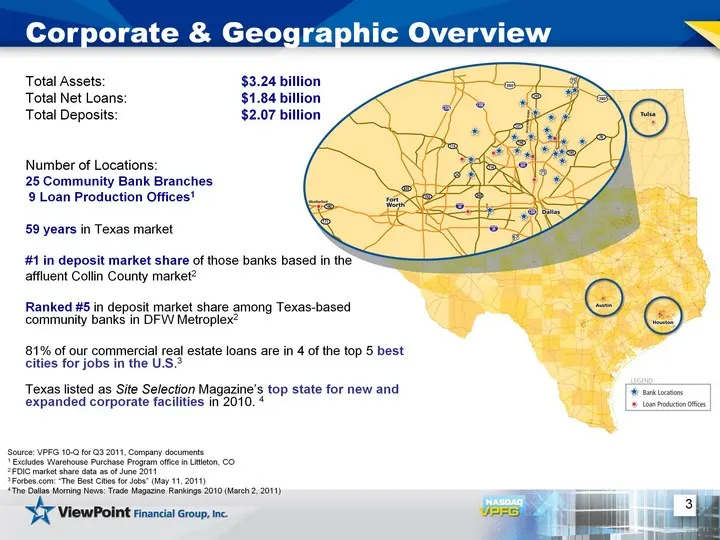
3 Corporate & Geographic Overview Total Assets: $3.24 billion Total Net Loans: $1.84 billion Total Deposits: $2.07 billion Number of Locations: 25 Community Bank Branches 9 Loan Production Offices1 59 years in Texas market #1 in deposit market share of those banks based in the affluent Collin County
Slide 4: Attractive Markets: Demographics
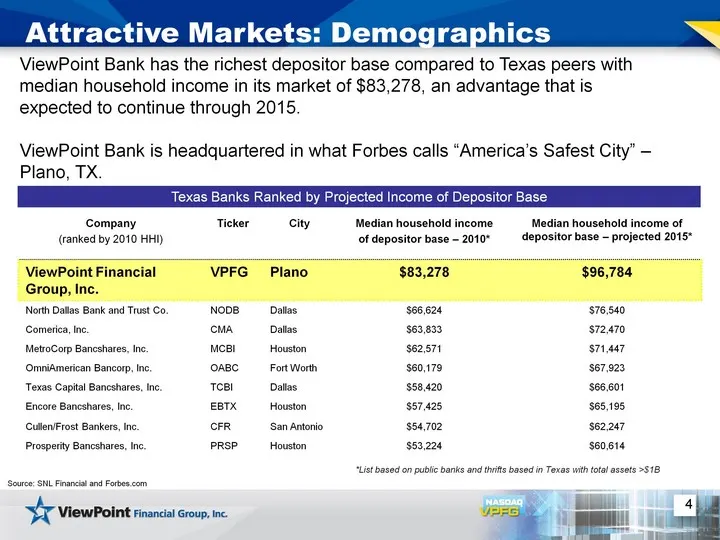
4 *List based on public banks and thrifts based in Texas with total assets >$1B Attractive Markets: Demographics Texas Banks Ranked by Projected Income of Depositor Base Company (ranked by 2010 HHI) Ticker City Median household income of depositor base - 2010* Median household income of depositor ba
Slide 5: Dallas Metroplex: Stable Home Prices
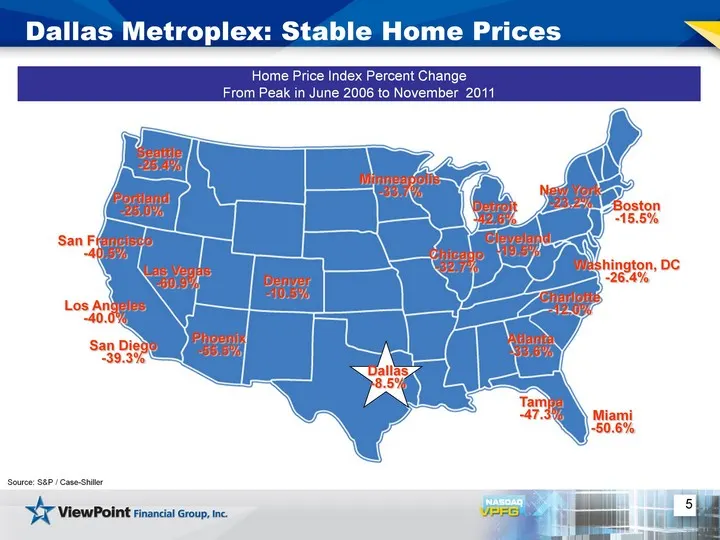
5 Seattle -25.4% San Francisco -40.5% Los Angeles -40.0% San Diego -39.3% Phoenix -55.5% Las Vegas -60.9% Denver -10.5% Minneapolis -33.7% Chicago -32.7% Detroit -42.6% Cleveland -19.5% Boston -15.5% New York -23.2% Washington, DC -26.4% Charlotte -12.0% Atlanta -33.6% Tampa -47.3% Miami -50.6% Port
Slide 6: ViewPoint Markets: Lower Unemployment Rates
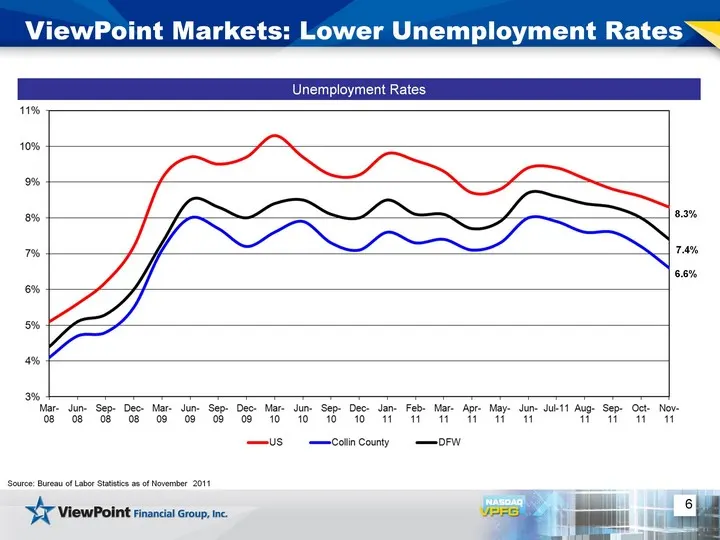
6 ViewPoint Markets: Lower Unemployment Rates Unemployment Rates Source: Bureau of Labor Statistics as of November 2011 8.3% 7.4% 6.6%
Slide 7: Business Strategy
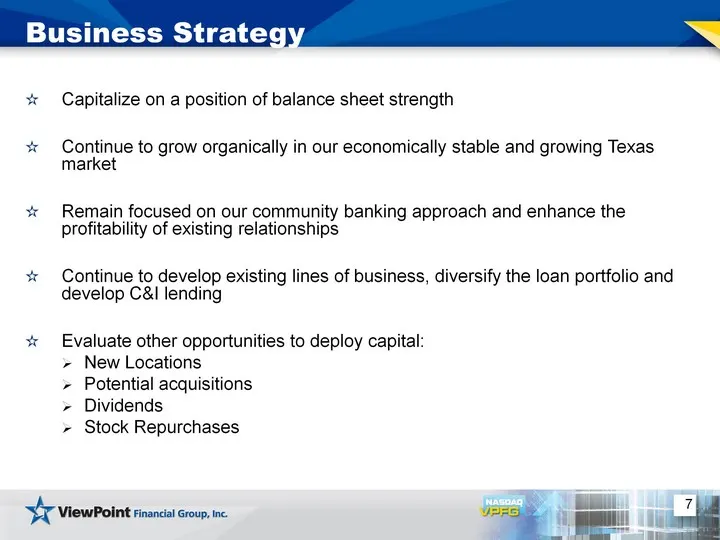
7 Capitalize on a position of balance sheet strength Continue to grow organically in our economically stable and growing Texas market Remain focused on our community banking approach and enhance the profitability of existing relationships Continue to develop existing lines of business, diversify the
Slide 8: 2011 Accomplishments
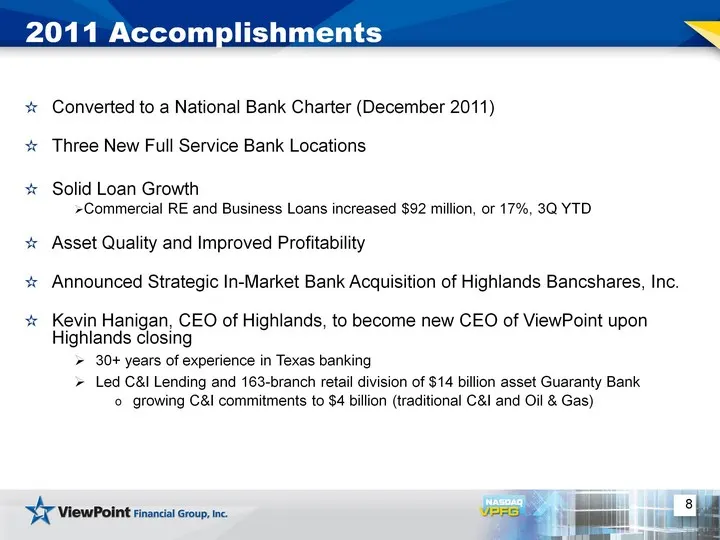
Converted to a National Bank Charter (December 2011) Three New Full Service Bank Locations Solid Loan Growth Commercial RE and Business Loans increased $92 million, or 17%, 3Q YTD Asset Quality and Improved Profitability Announced Strategic In-Market Bank Acquisition of Highlands Bancshares, Inc. Ke
Slide 9: ViewPoint's Loan Portfolio Strategy
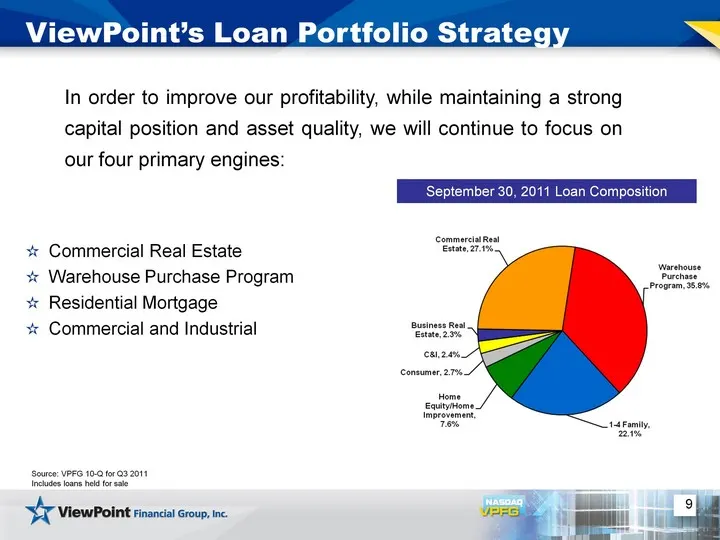
9 ViewPoint's Loan Portfolio Strategy Commercial Real Estate Warehouse Purchase Program Residential Mortgage Commercial and Industrial September 30, 2011 Loan Composition Source: VPFG 10-Q for Q3 2011 Includes loans held for sale In order to improve our profitability, while maintaining a strong capi
Slide 10: Commercial RE Portfolio
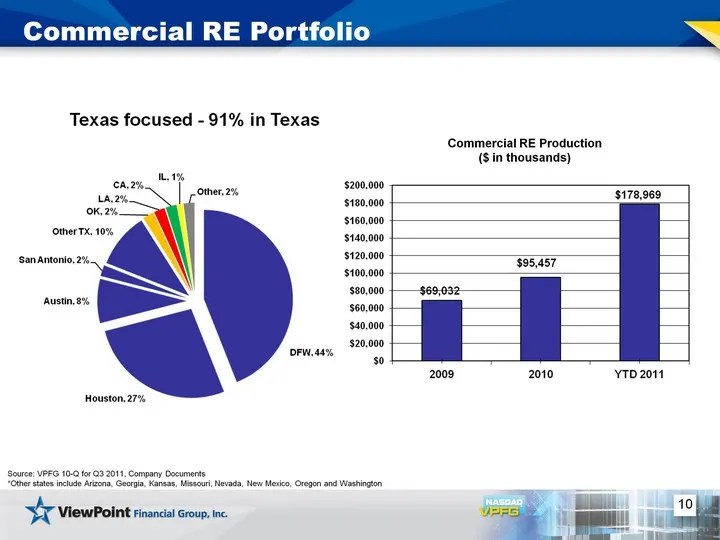
10 Commercial RE Portfolio Source: VPFG 10-Q for Q3 2011, Company Documents *Other states include Arizona, Georgia, Kansas, Missouri, Nevada, New Mexico, Oregon and Washington Commercial RE Production ($ in thousands)
Slide 11: Warehouse Purchase Program
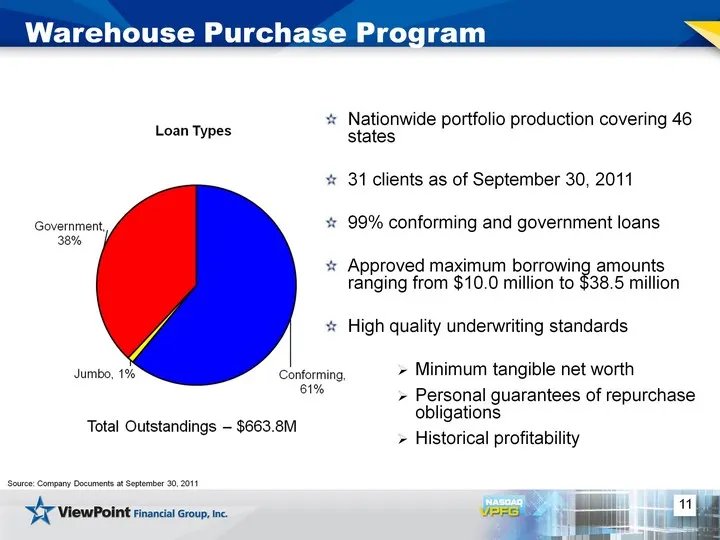
11 Warehouse Purchase Program Source: Company Documents at September 30, 2011 Nationwide portfolio production covering 46 states 31 clients as of September 30, 2011 99% conforming and government loans Approved maximum borrowing amounts ranging from $10.0 million to $38.5 million High quality underwr
Slide 12: Residential Mortgage
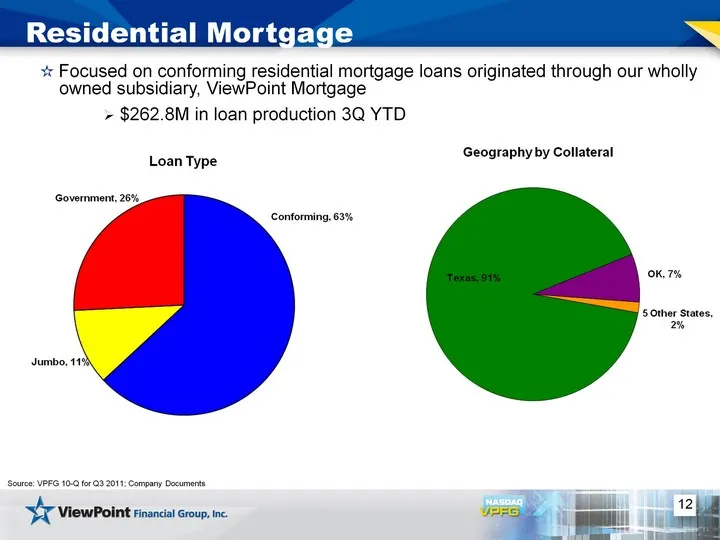
12 Residential Mortgage Source: VPFG 10-Q for Q3 2011; Company Documents Focused on conforming residential mortgage loans originated through our wholly owned subsidiary, ViewPoint Mortgage $262.8M in loan production 3Q YTD
Slide 13: VPFG - Track Record of Strong Growth
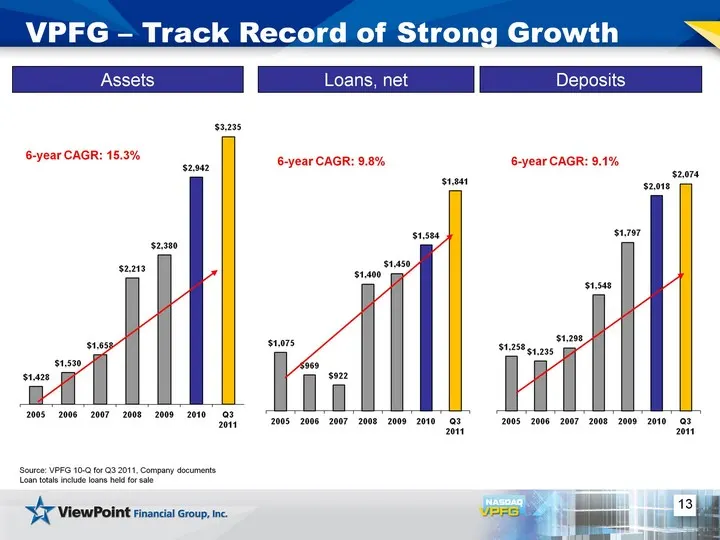
13 VPFG - Track Record of Strong Growth Assets Loans, net Deposits 6-year CAGR: 9.8% 6-year CAGR: 9.1% 6-year CAGR: 15.3% Source: VPFG 10-Q for Q3 2011, Company documents Loan totals include loans held for sale
Slide 14: Earnings Per Share Growth
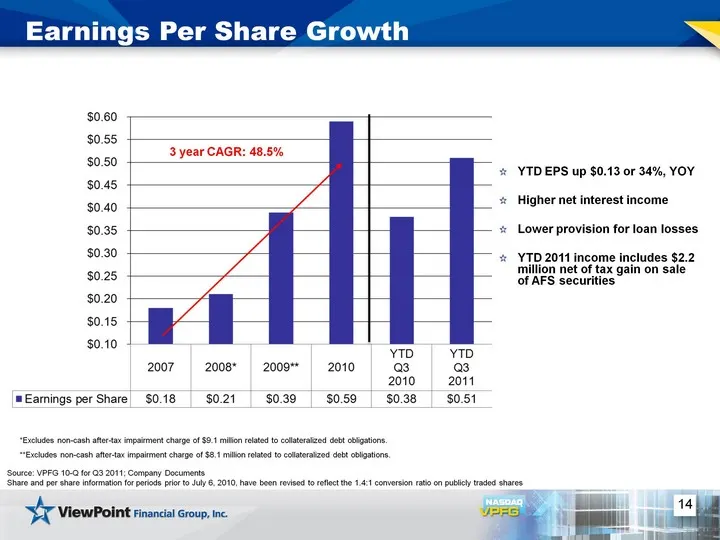
14 Earnings Per Share Growth YTD EPS up $0.13 or 34%, YOY Higher net interest income Lower provision for loan losses YTD 2011 income includes $2.2 million net of tax gain on sale of AFS securities *Excludes non-cash after-tax impairment charge of $9.1 million related to collateralized debt obligatio
Slide 15: Credit Quality Trends
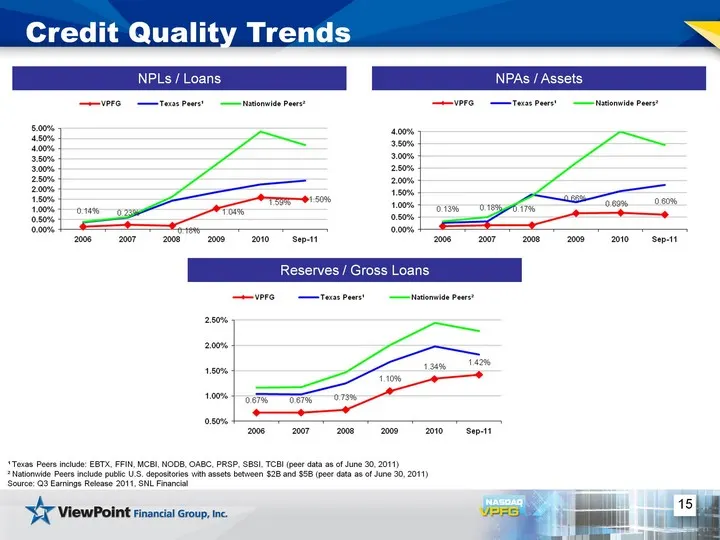
15 Credit Quality Trends NPAs / Assets NPLs / Loans 1 Texas Peers include: EBTX, FFIN, MCBI, NODB, OABC, PRSP, SBSI, TCBI (peer data as of June 30, 2011) 2 Nationwide Peers include public U.S. depositories with assets between $2B and $5B (peer data as of June 30, 2011) Source: Q3 Earnings Release 20
Slide 16: Net Charge-Off Trends
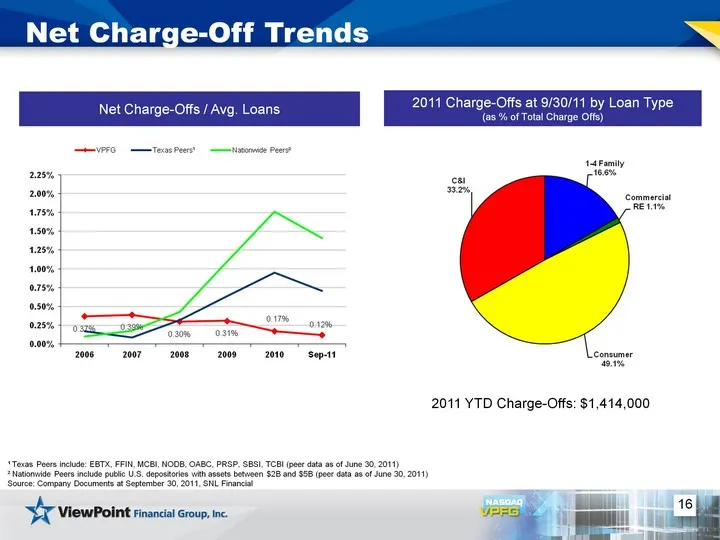
16 Net Charge-Off Trends 2011 Charge-Offs at 9/30/11 by Loan Type (as % of Total Charge Offs) Net Charge-Offs / Avg. Loans 2011 YTD Charge-Offs: $1,414,000 1 Texas Peers include: EBTX, FFIN, MCBI, NODB, OABC, PRSP, SBSI, TCBI (peer data as of June 30, 2011) 2 Nationwide Peers include public U.S. dep
Slide 17: Deposit Composition
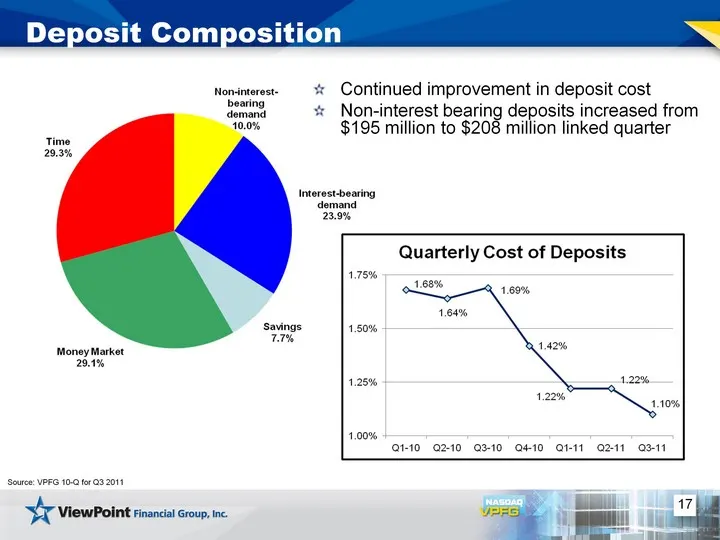
17 Deposit Composition Source: VPFG 10-Q for Q3 2011 Continued improvement in deposit cost Non-interest bearing deposits increased from $195 million to $208 million linked quarter
Slide 18: Capital Management Plan
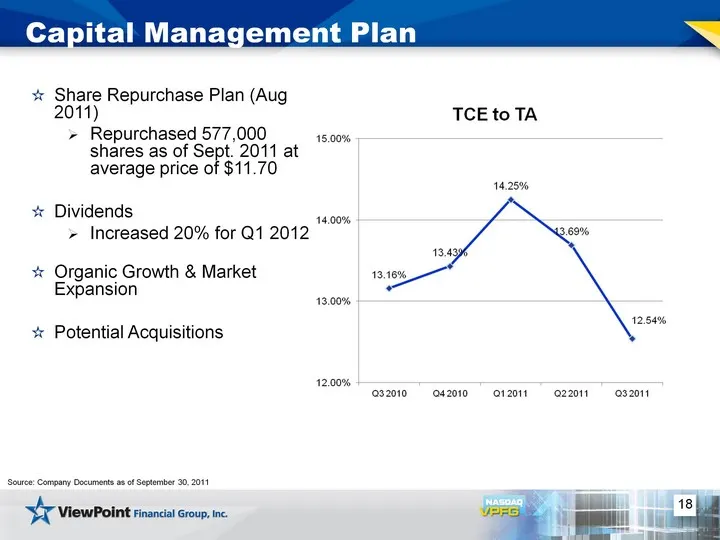
18 Capital Management Plan Source: Company Documents as of September 30, 2011 Share Repurchase Plan (Aug 2011) Repurchased 577,000 shares as of Sept. 2011 at average price of $11.70 Dividends Increased 20% for Q1 2012 Organic Growth & Market Expansion Potential Acquisitions
Slide 19: Highlands Acquisition Summary
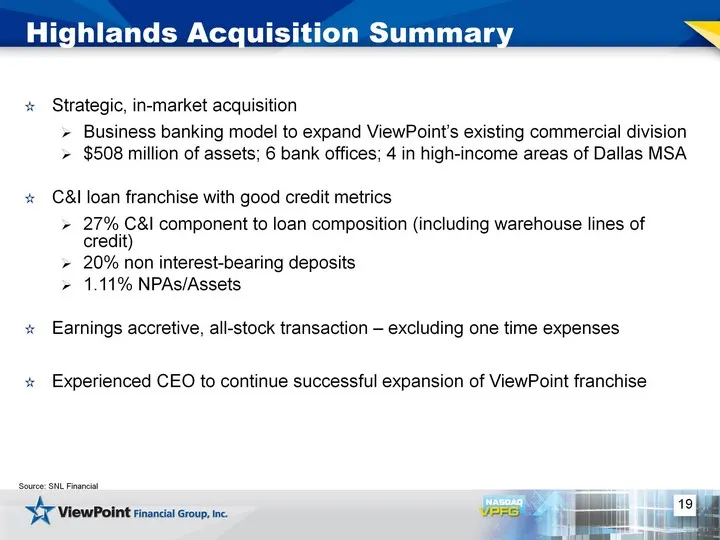
Highlands Acquisition Summary Strategic, in-market acquisition Business banking model to expand ViewPoint's existing commercial division $508 million of assets; 6 bank offices; 4 in high-income areas of Dallas MSA C&I loan franchise with good credit metrics 27% C&I component to loan composition (inc
Slide 20: Pro Forma Franchise
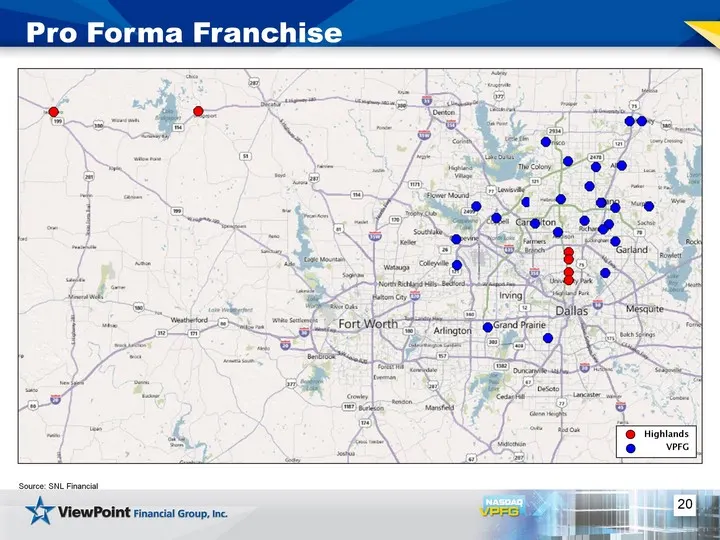
Pro Forma Franchise Highlands VPFG Source: SNL Financial 20
Slide 21: Accelerates Commercial Banking Platform
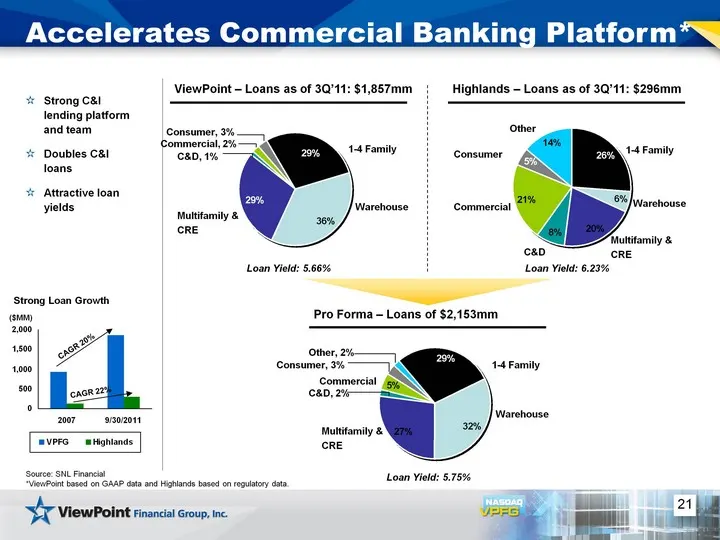
Accelerates Commercial Banking Platform* CAGR 20% CAGR 22% C&D 21
Slide 22: Attractive Deposit Mix
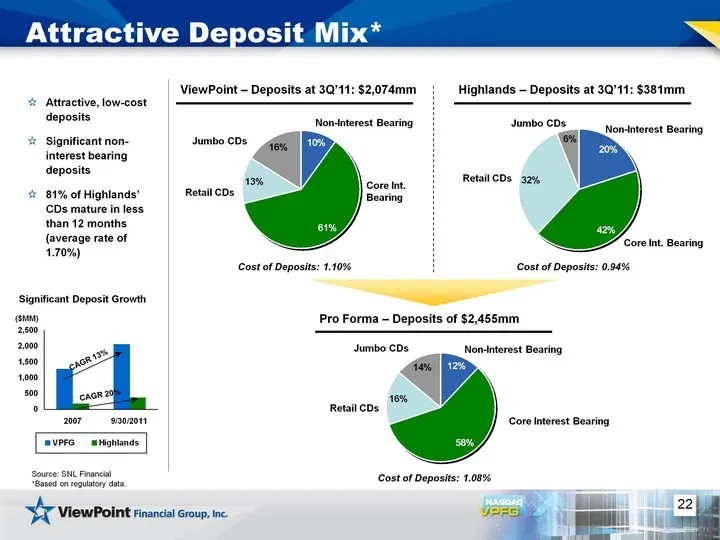
Attractive Deposit Mix* Labels Series Non-Interest Bearing 10 Core Interest Bearing 61 Retail CDs 13 Jumbo CDs 16 Labels Series Non-Interest Bearing 20 Core Interest Bearing 42 Retail CDs 32 Jumbo CDs 6 Labels Series Non-Interest Bearing 12 Core Interst Bearing 58 Retail CDs 16 Jumbo CDs 14 Attracti
Slide 23: Strong Stock Performance
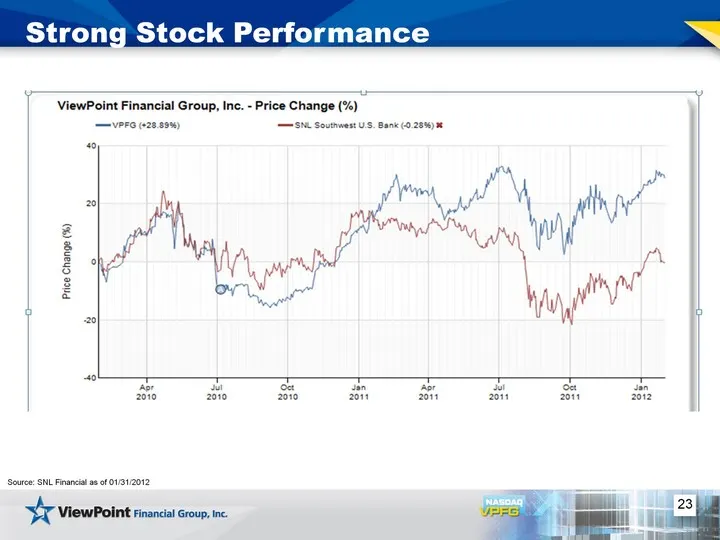
23 Strong Stock Performance Source: SNL Financial as of 01/31/2012
Slide 24: Closing Remarks
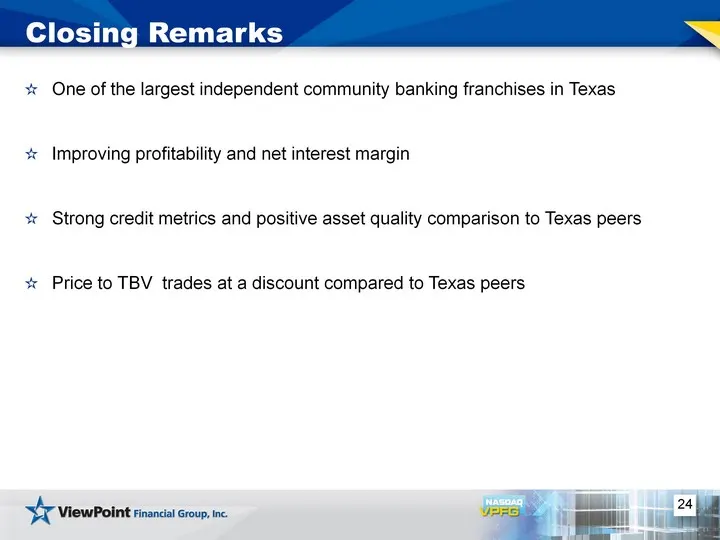
24 Closing Remarks One of the largest independent community banking franchises in Texas Improving profitability and net interest margin Strong credit metrics and positive asset quality comparison to Texas peers Price to TBV trades at a discount compared to Texas peers

Slide 25: Questions?
» Si Questions?
Slide 26: Appendix
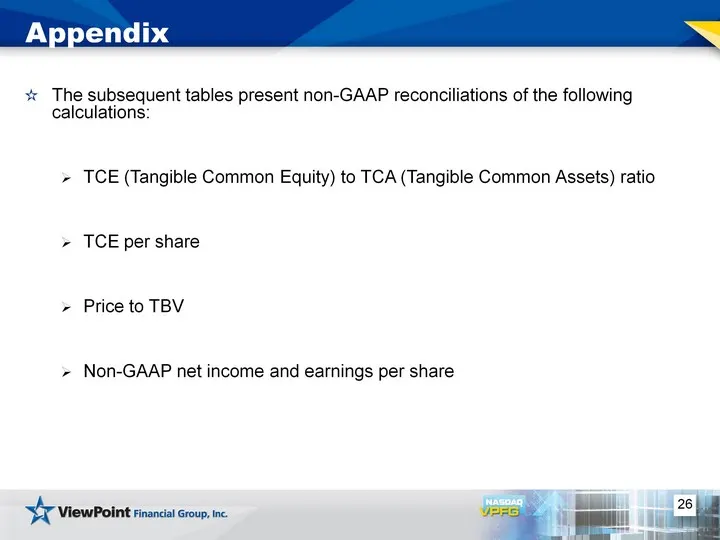
26 Appendix The subsequent tables present non-GAAP reconciliations of the following calculations: TCE (Tangible Common Equity) to TCA (Tangible Common Assets) ratio TCE per share Price to TBV Non-GAAP net income and earnings per share
Slide 27: Appendix: TCE to TA, TCE per Share and Price to TBV
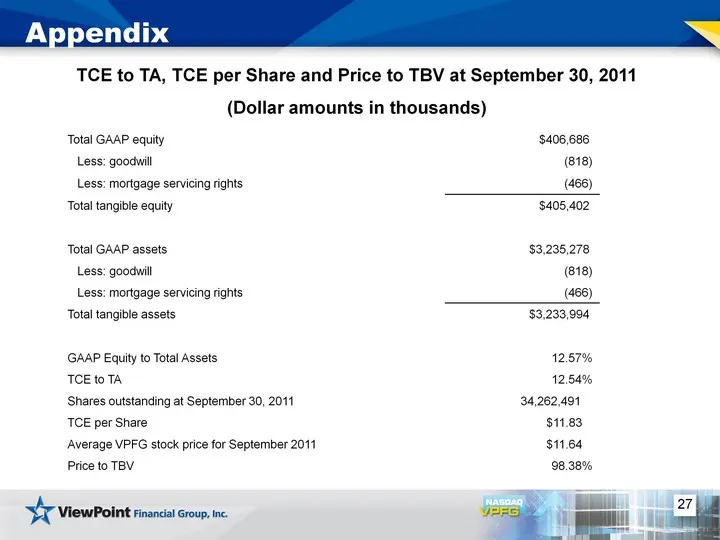
27 Appendix TCE to TA, TCE per Share and Price to TBV at September 30, 2011 (Dollar amounts in thousands) Total GAAP equity $406,686 Less: goodwill (818) Less: mortgage servicing rights (466) Total tangible equity $405,402 Total GAAP assets $3,235,278 Less: goodwill (818) Less: mortgage servicing ri
Slide 28: Appendix: Reconciliation of Non-GAAP to GAAP Net Income and EPS
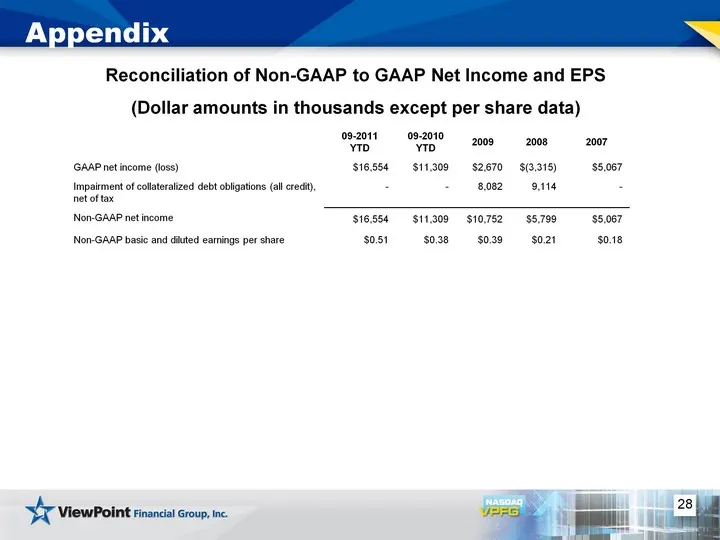
28 Appendix Reconciliation of Non-GAAP to GAAP Net Income and EPS (Dollar amounts in thousands except per share data) 09-2011 YTD 09-2010 YTD 2009 2008 2007 GAAP net income (loss) $16,554 $11,309 $2,670 $(3,315) $5,067 Impairment of collateralized debt obligations (all credit), net of tax - - 8,082
Slide 29: Appendix: Commercial RE Portfolio
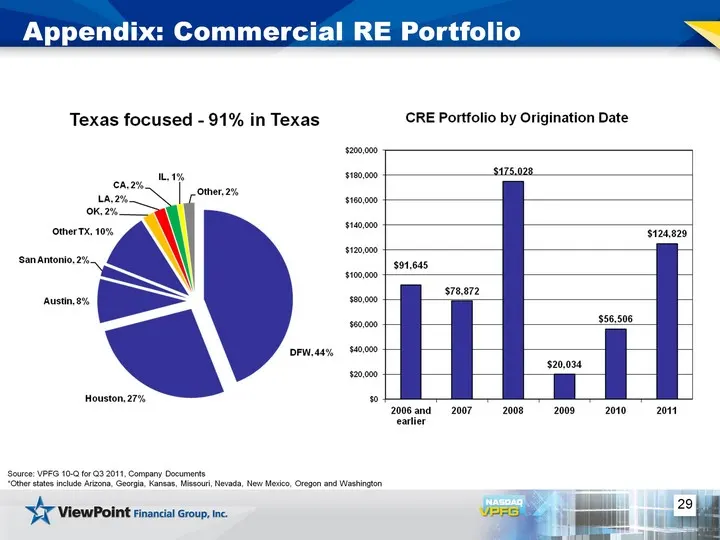
29 Appendix: Commercial RE Portfolio Source: VPFG 10-Q for Q3 2011, Company Documents *Other states include Arizona, Georgia, Kansas, Missouri, Nevada, New Mexico, Oregon and Washington
Slide 30: Appendix: Commercial RE Portfolio
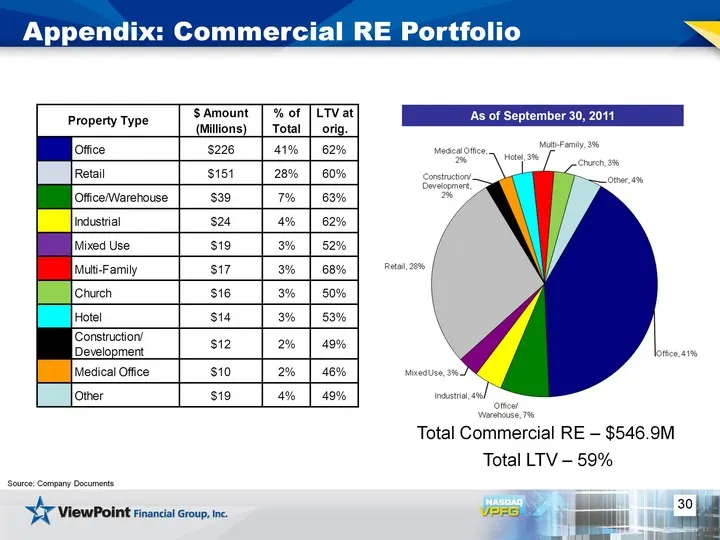
30 Total Commercial RE - $546.9M Total LTV - 59% Source: Company Documents As of September 30, 2011 Appendix: Commercial RE Portfolio
Slide 31: Appendix: Investment Portfolio Mix
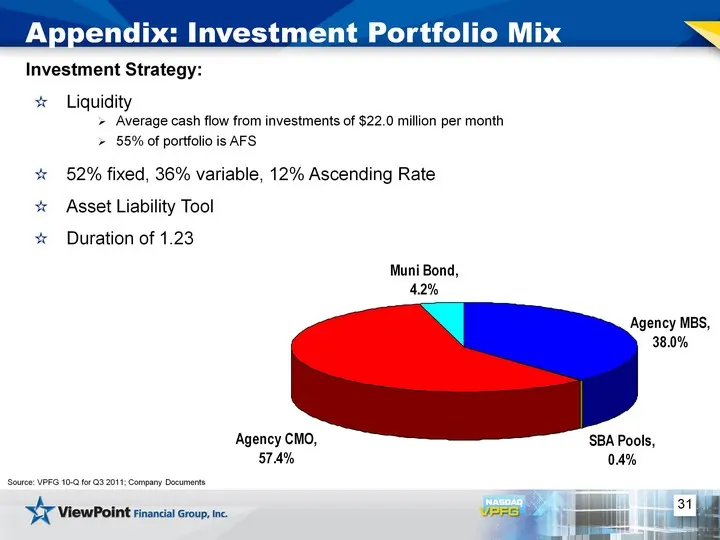
31 Appendix: Investment Portfolio Mix Source: VPFG 10-Q for Q3 2011; Company Documents Investment Strategy: Liquidity Average cash flow from investments of $22.0 million per month 55% of portfolio is AFS 52% fixed, 36% variable, 12% Ascending Rate Asset Liability Tool Duration of 1.23
Slide 32: Appendix: Schedule of Borrowings
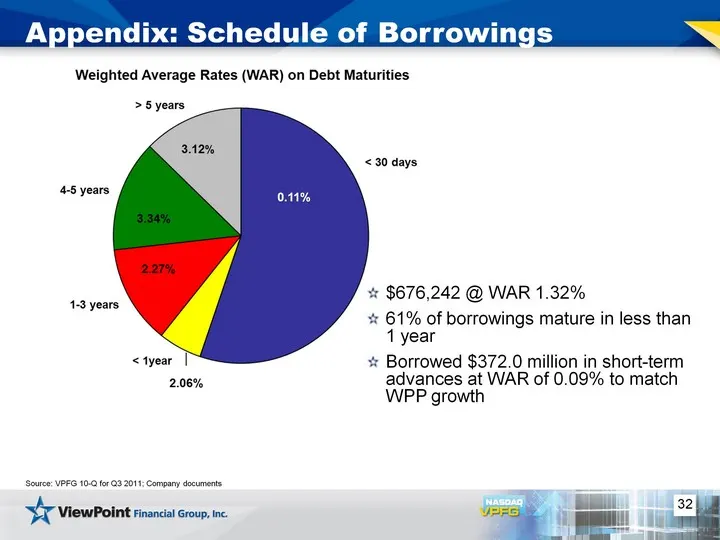
32 Appendix: Schedule of Borrowings $676,242 @ WAR 1.32% 61% of borrowings mature in less than 1 year Borrowed $372.0 million in short-term advances at WAR of 0.09% to match WPP growth Source: VPFG 10-Q for Q3 2011; Company documents 0.11%
Source: SEC EDGAR · 425 filed Feb 10, 2012
More decks from LegacyTexas Financial Group Inc
 Merger or Acquisition (June 2019)13 slides · Jun 17, 2019
 Shareholder Meeting (May 2019)14 slides · May 17, 2019
 Q1 2019 Earnings Presentation23 slides · Apr 23, 2019
 Q4 2018 Earnings Presentation25 slides · Jan 22, 2019
 Q3 2018 Earnings Presentation22 slides · Oct 16, 2018
 Q2 2018 Earnings Presentation22 slides · Jul 17, 2018