Adamas Trust, Inc. · NASDAQ:ADAM
Adamas Trust — New York Mortgage Trust — Q1 2025 Earnings Presentation
50 slides from Adamas Trust's earnings presentation, May 1, 2025

Slide 1: New York Mortgage Trust, Inc. 2025 First Quarter Financial Summary
New York Mortgage Trust, Inc. 2025 First Quarter Financial Summary
Slide 2: Forward Looking Statements
Forward Looking Statements This presentation contains forward-looking statements within the meaning of the safe harbor provisions of the Private Securities Litigation Reform Act of 1995. Forward-looking statements are based on our beliefs, assumptions and expectations of our future performance, taki
Slide 3: Table of Contents
Table of Contents • Company Overview • Financial Summary • Market & Strategy Update • Quarterly Financial Information • Appendix 3

Slide 4: Company Overview
Company Overview 4
Slide 5: NYMT Overview
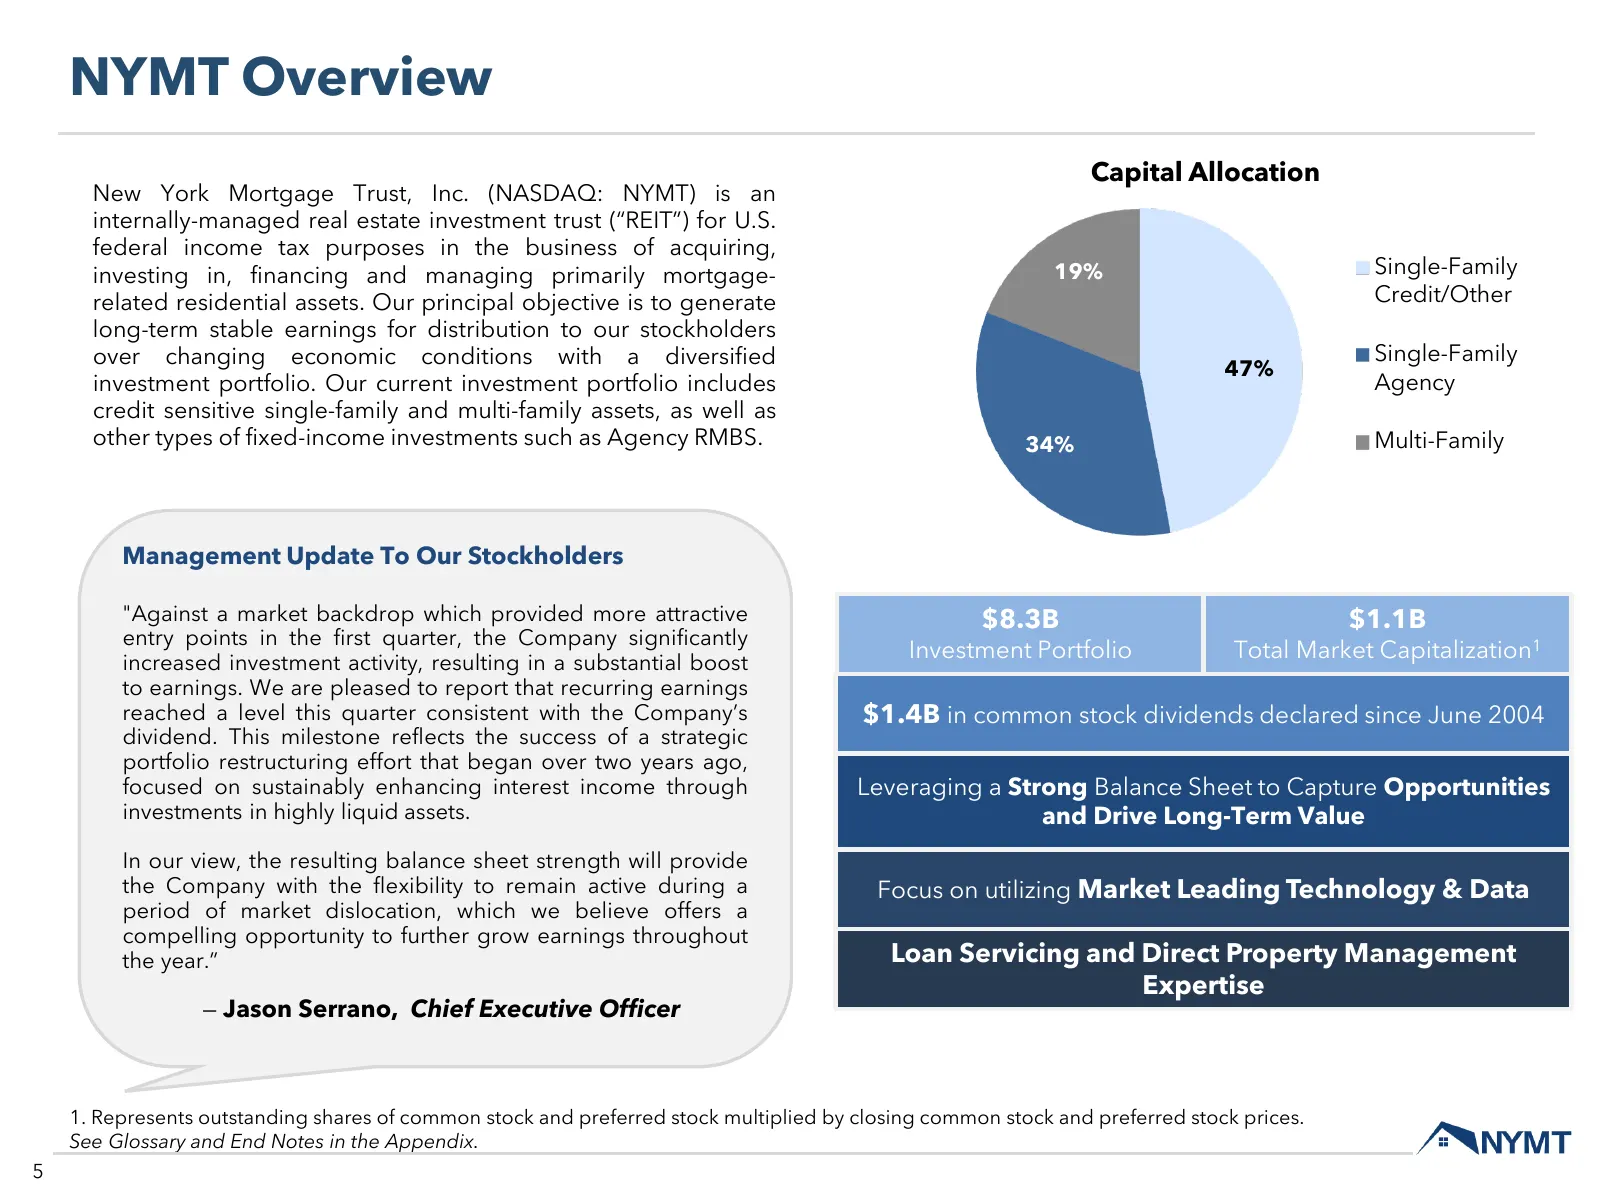
NYMT Overview Capital Allocation New York Mortgage Trust, Inc. (NASDAQ: NYMT) is an internally-managed real estate investment trust (“REIT”) for U.S. federal income tax purposes in the business of acquiring, investing in, financing and managing primarily mortgage- 19% Single-Family related residenti
Slide 6: Key Developments
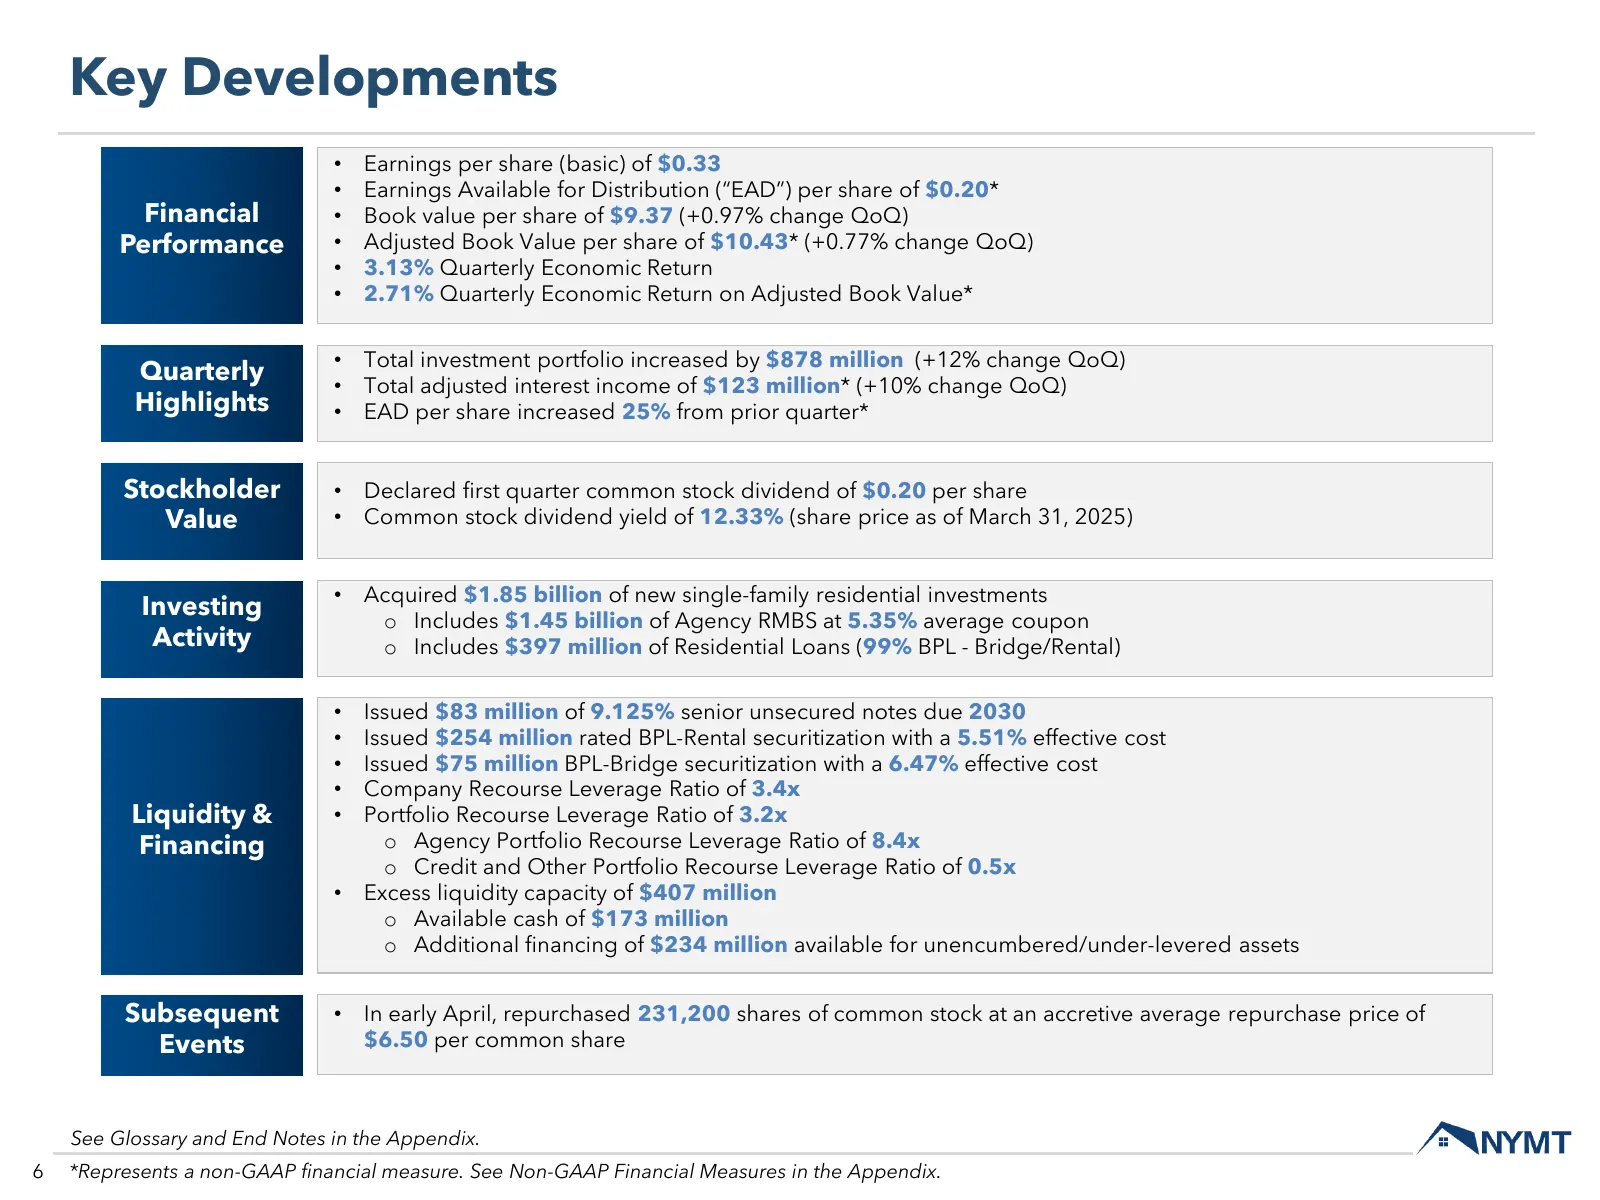
Key Developments • Earnings per share (basic) of $0.33 • Earnings Available for Distribution (“EAD”) per share of $0.20* Financial • Book value per share of $9.37 (+0.97% change QoQ) Performance • Adjusted Book Value per share of $10.43* (+0.77% change QoQ) • 3.13% Quarterly Economic Return • 2.71%
Slide 7: Entering 2025 from a Position of Strength
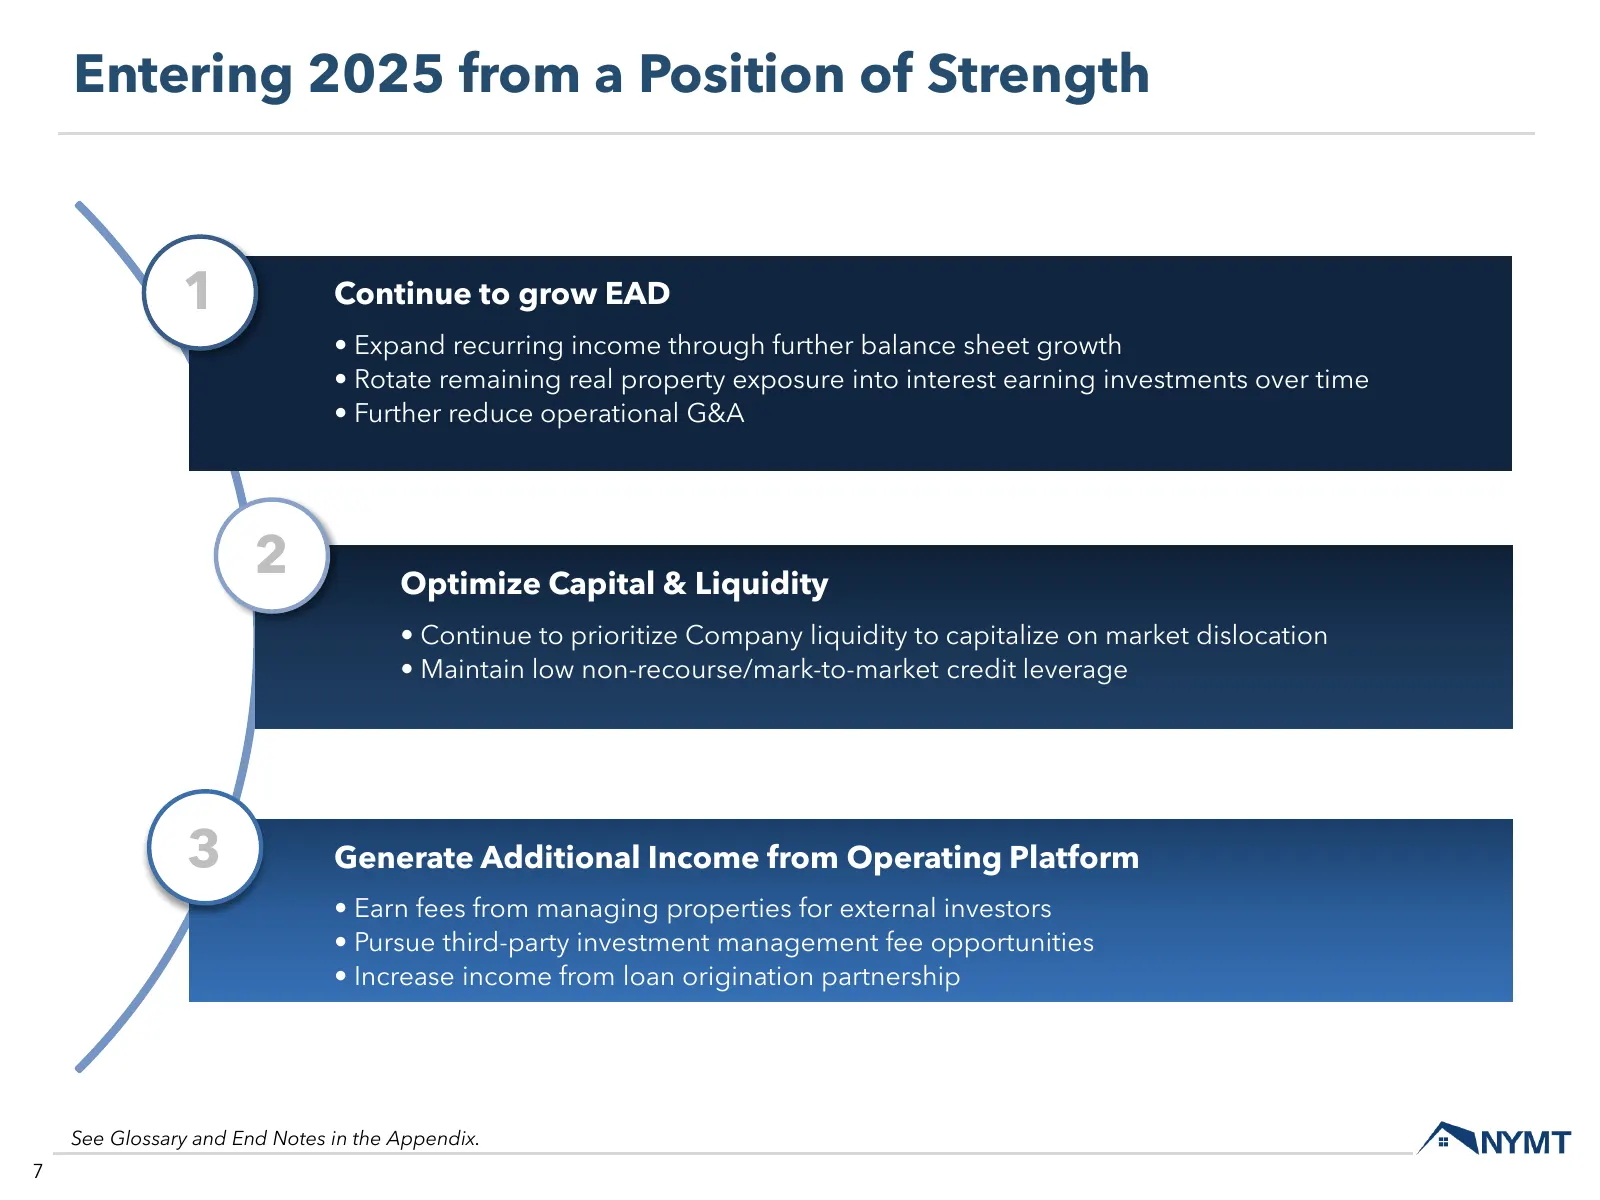
Entering 2025 from a Position of Strength 1 Continue to grow EAD • Expand recurring income through further balance sheet growth • Rotate remaining real property exposure into interest earning investments over time • Further reduce operational G&A 2 Optimize Capital & Liquidity • Continue to prioriti
Slide 8: 2025 Key Economic Factors
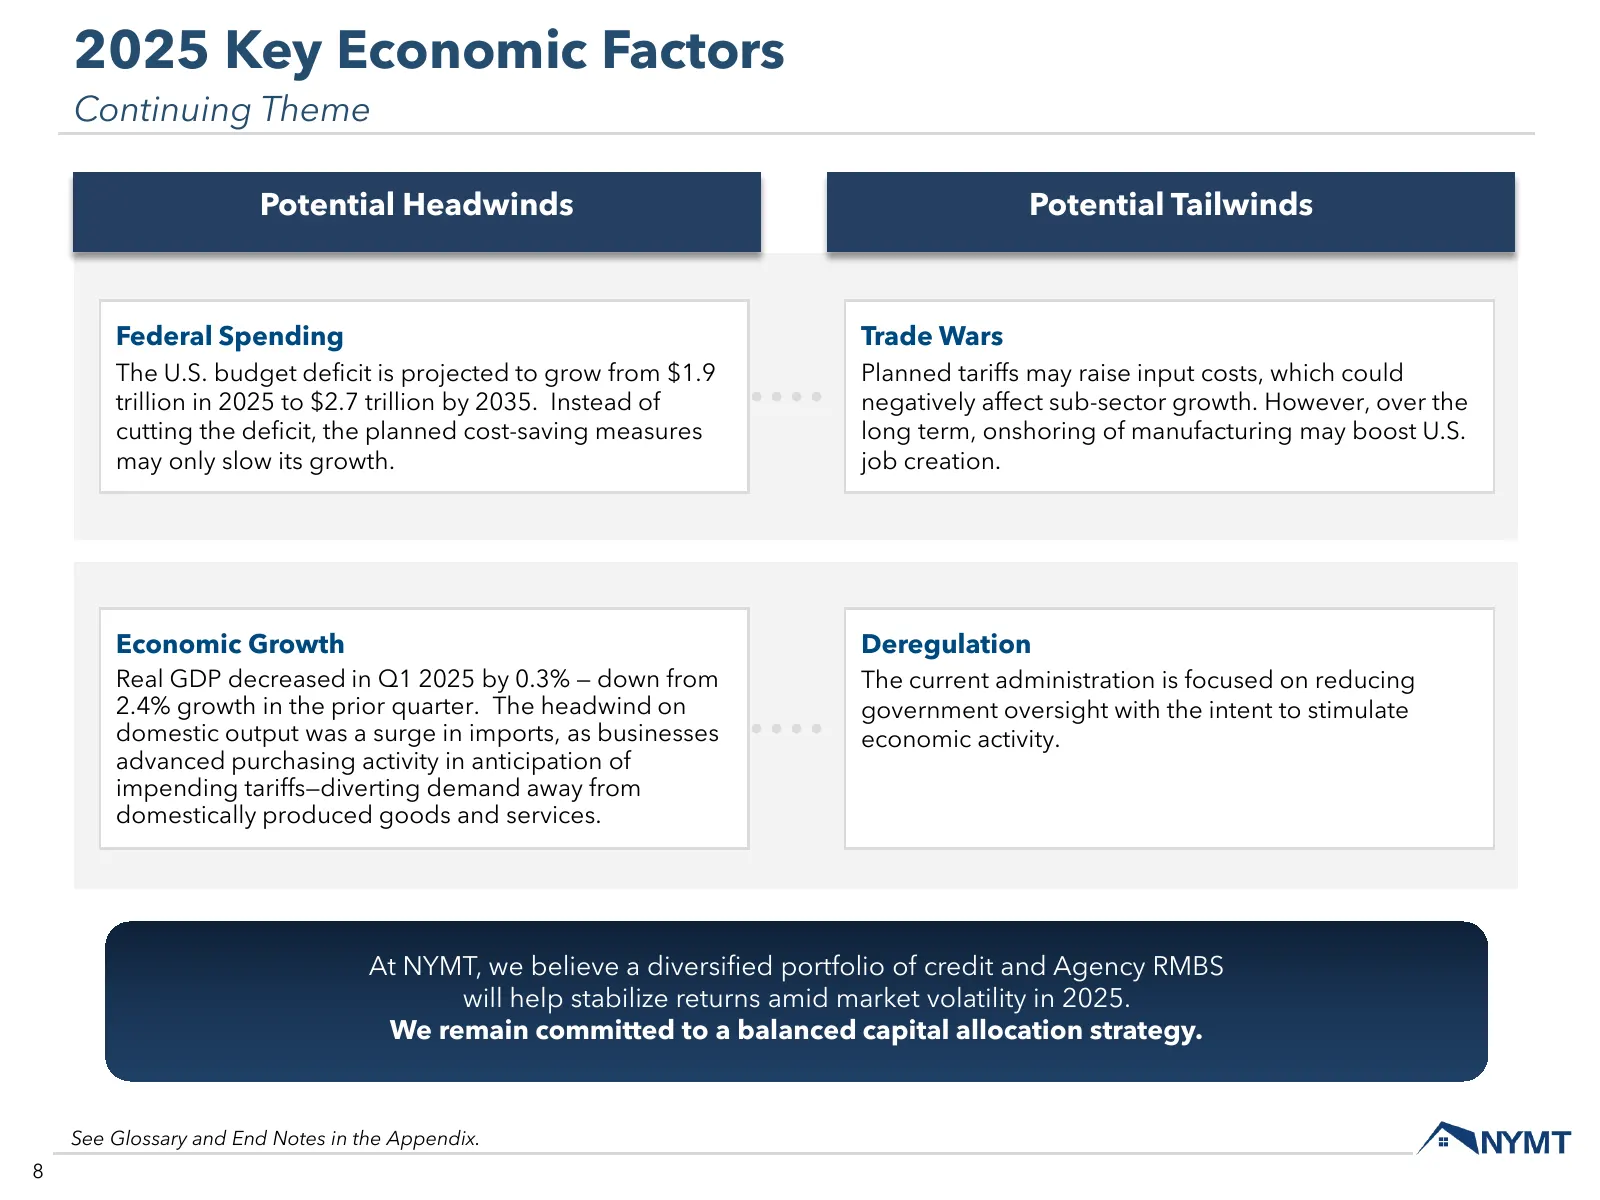
2025 Key Economic Factors Continuing Theme Potential Headwinds Potential Tailwinds Federal Spending Trade Wars The U.S. budget deficit is projected to grow from $1.9 Planned tariffs may raise input costs, which could trillion in 2025 to $2.7 trillion by 2035. Instead of negatively affect sub-sector
Slide 9: Balance Sheet Structured for Earnings Stability
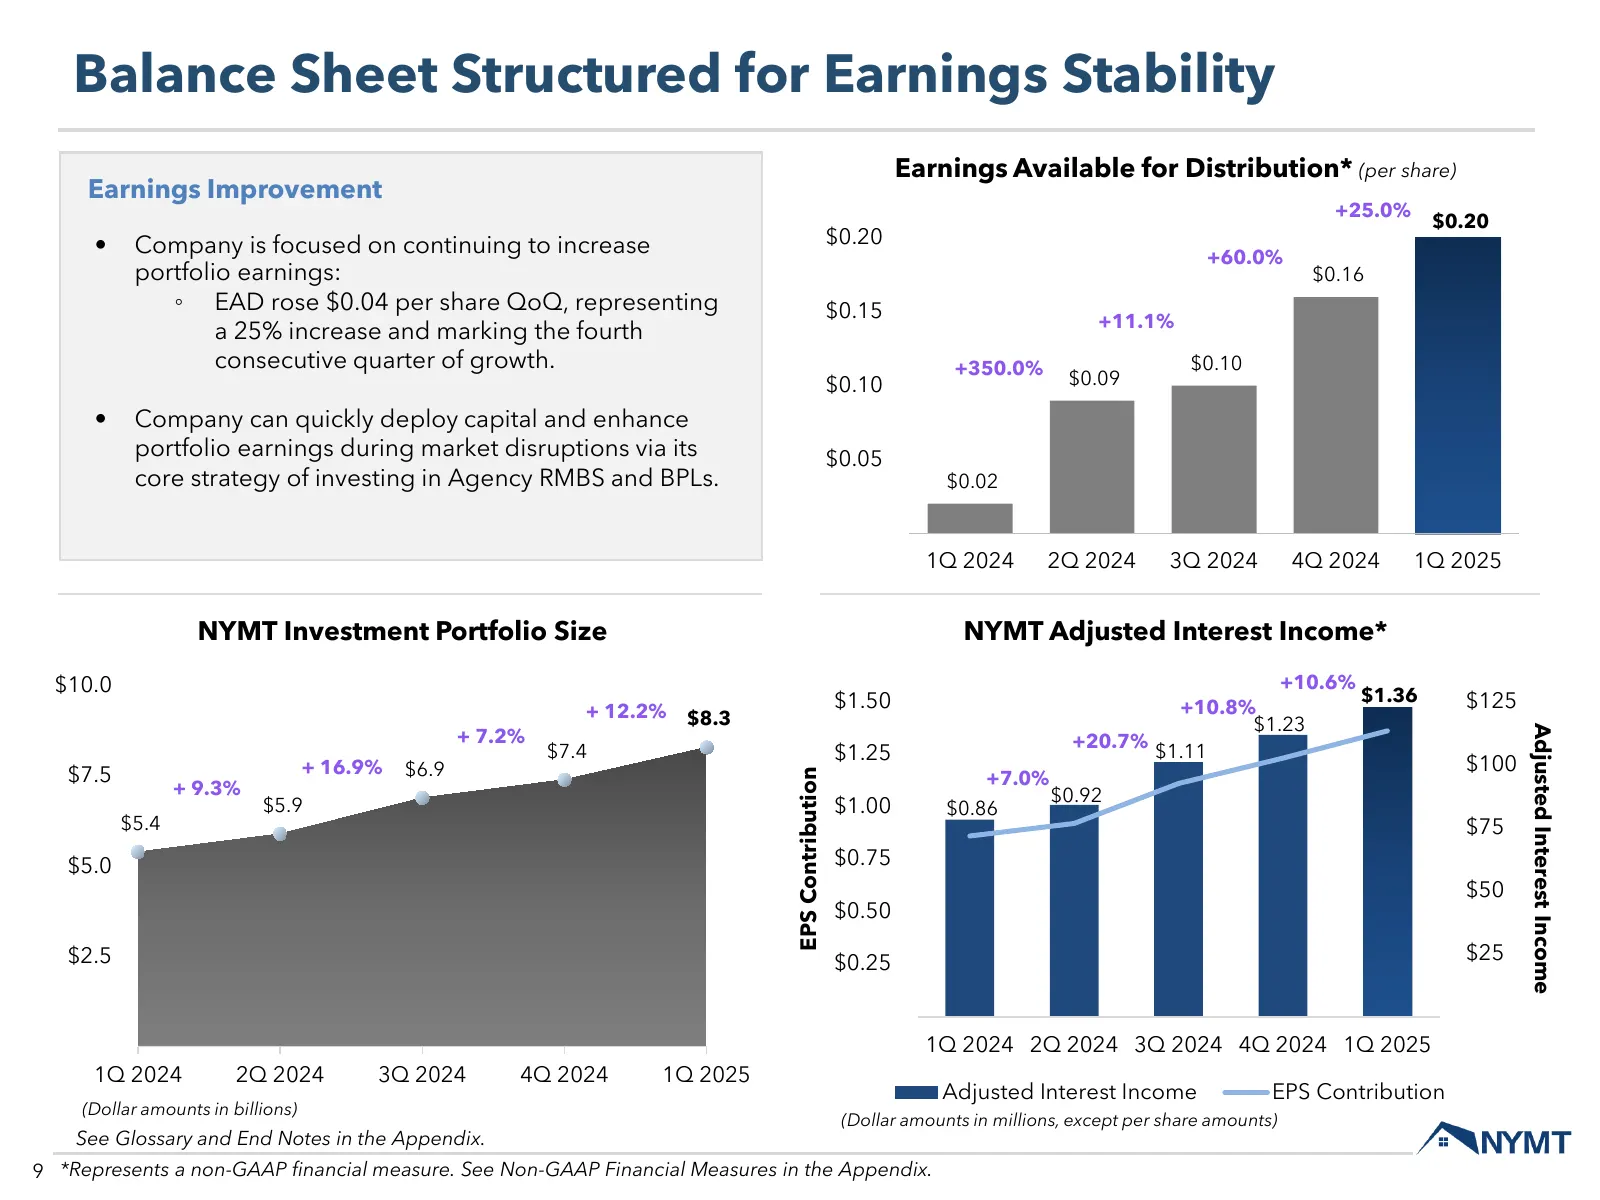
Balance Sheet Structured for Earnings Stability Earnings Available for Distribution* (per share) Earnings Improvement +25.0% $0.20 • Company is focused on continuing to increase $0.20 +60.0% portfolio earnings: $0.16 ◦ EAD rose $0.04 per share QoQ, representing $0.15 +11.1% a 25% increase and markin
Slide 10: NYMT Share Price Has Significant Potential Upside
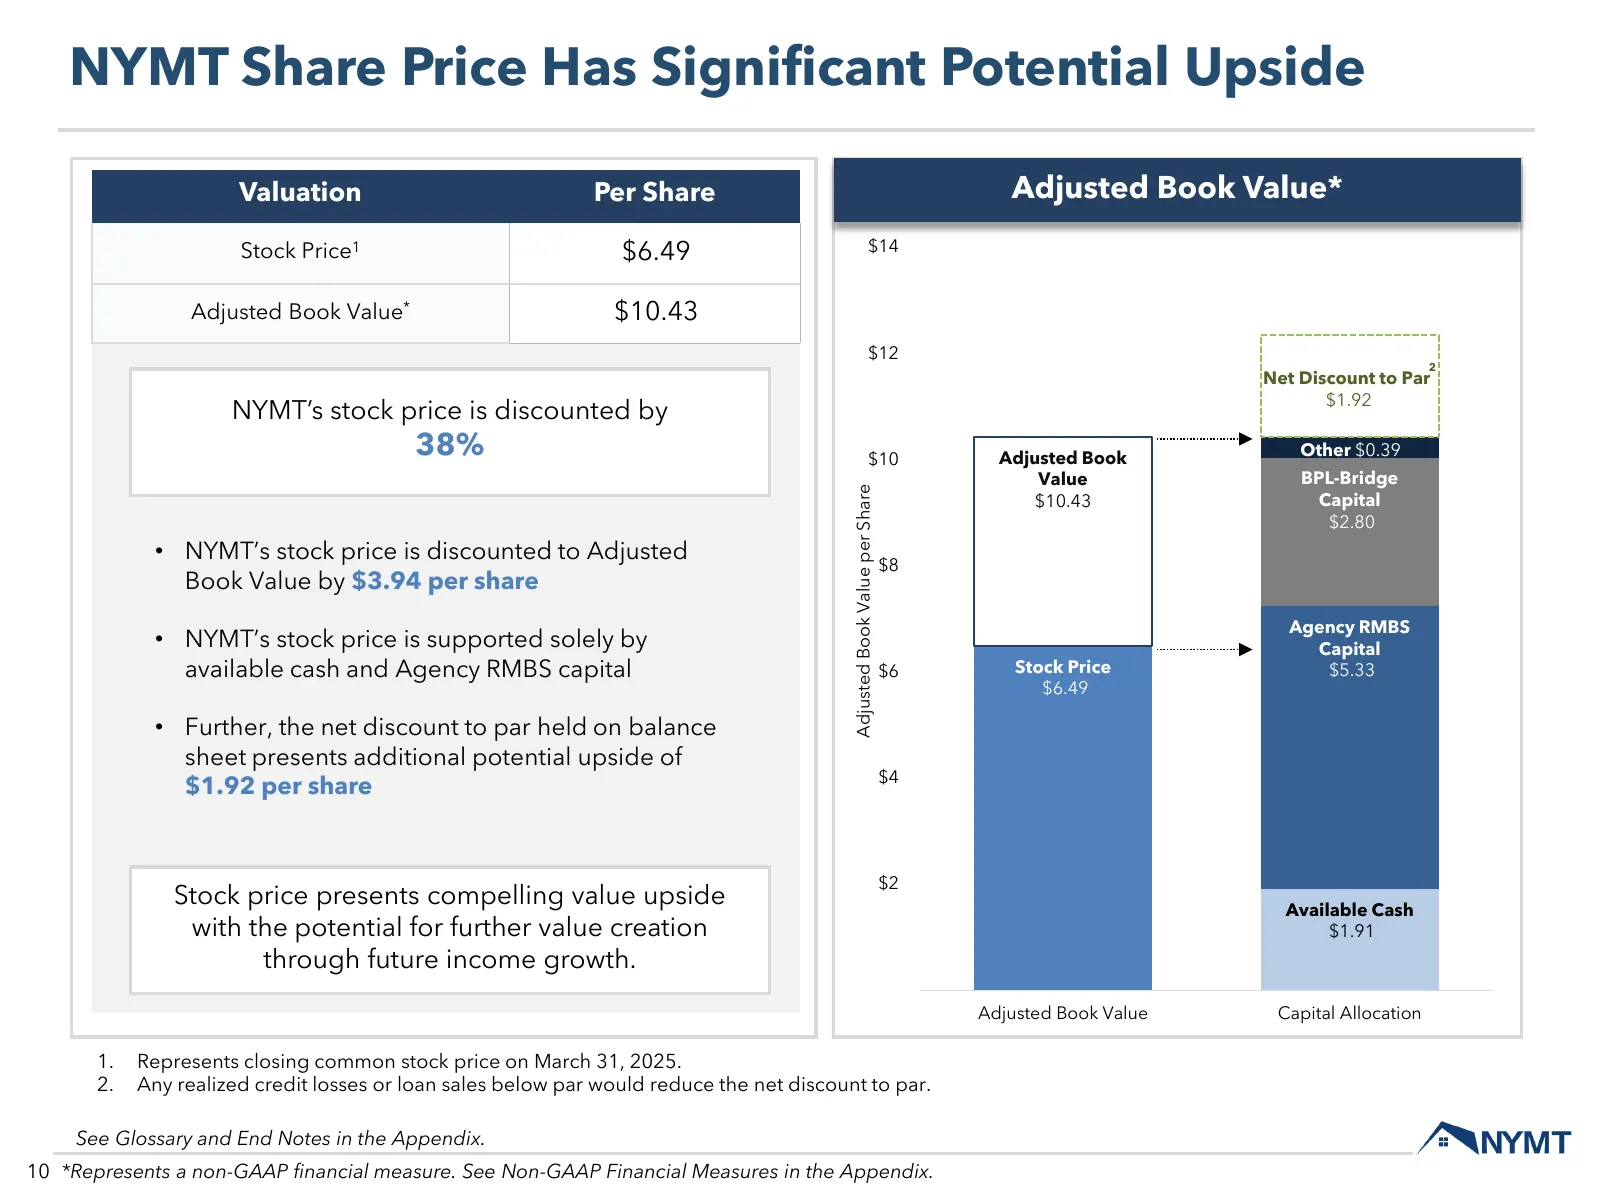
NYMT Share Price Has Significant Potential Upside Valuation Per Share Adjusted Book Value* Stock Price1 $6.49 $14 Adjusted Book Value* $10.43 $12 2 Net Discount to Par $1.92 NYMT’s stock price is discounted by 38% $10 Adjusted Book Other $0.39 Value BPL-Bridge Adjusted Book Value per Share $10.43 Ca

Slide 11: Financial Summary
11 Financial ) Summary y/ /mnyut (YJ s ZF, |
Slide 12: Financial Snapshot
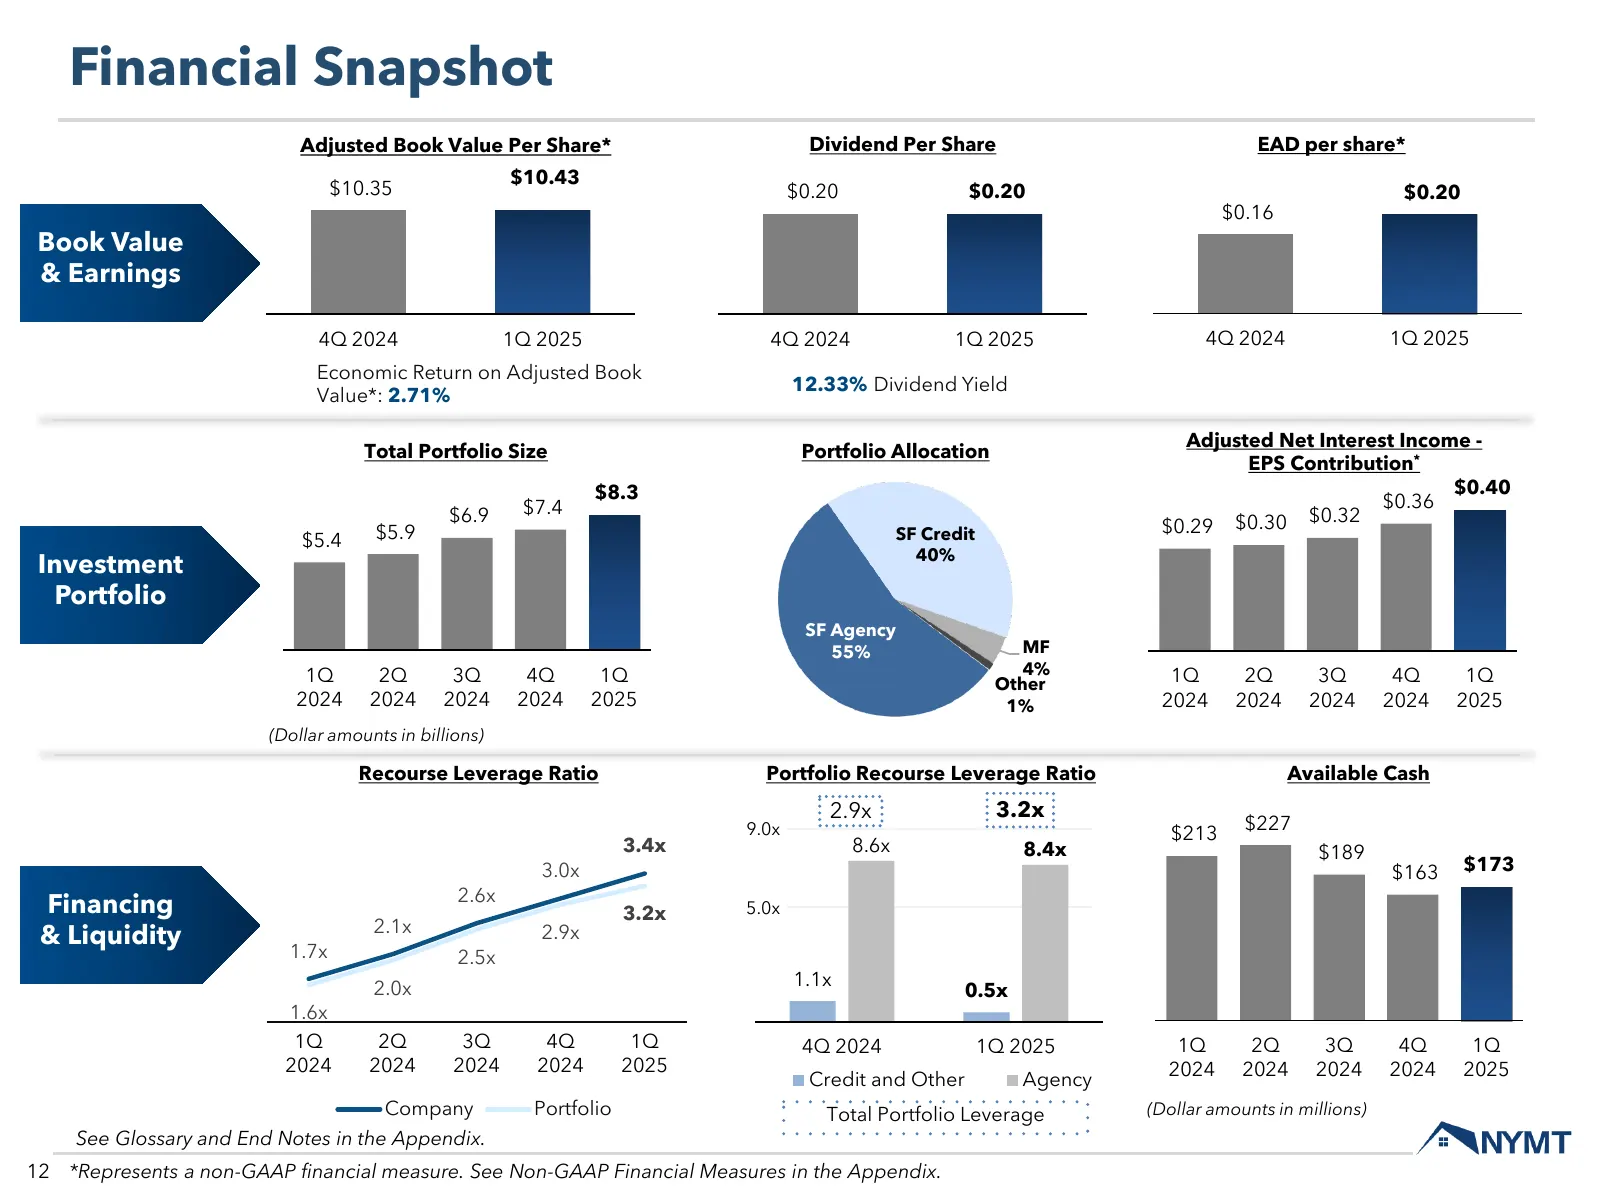
Financial Snapshot Adjusted Book Value Per Share* Dividend Per Share EAD per share* $10.43 $10.35 $0.20 $0.20 $0.20 $0.16 Book Value & Earnings 4Q 2024 1Q 2025 4Q 2024 1Q 2025 4Q 2024 1Q 2025 Economic Return on Adjusted Book 12.33% Dividend Yield Value*: 2.71% Adjusted Net Interest Income - Total Po
Slide 13: NYMT Debt Structure
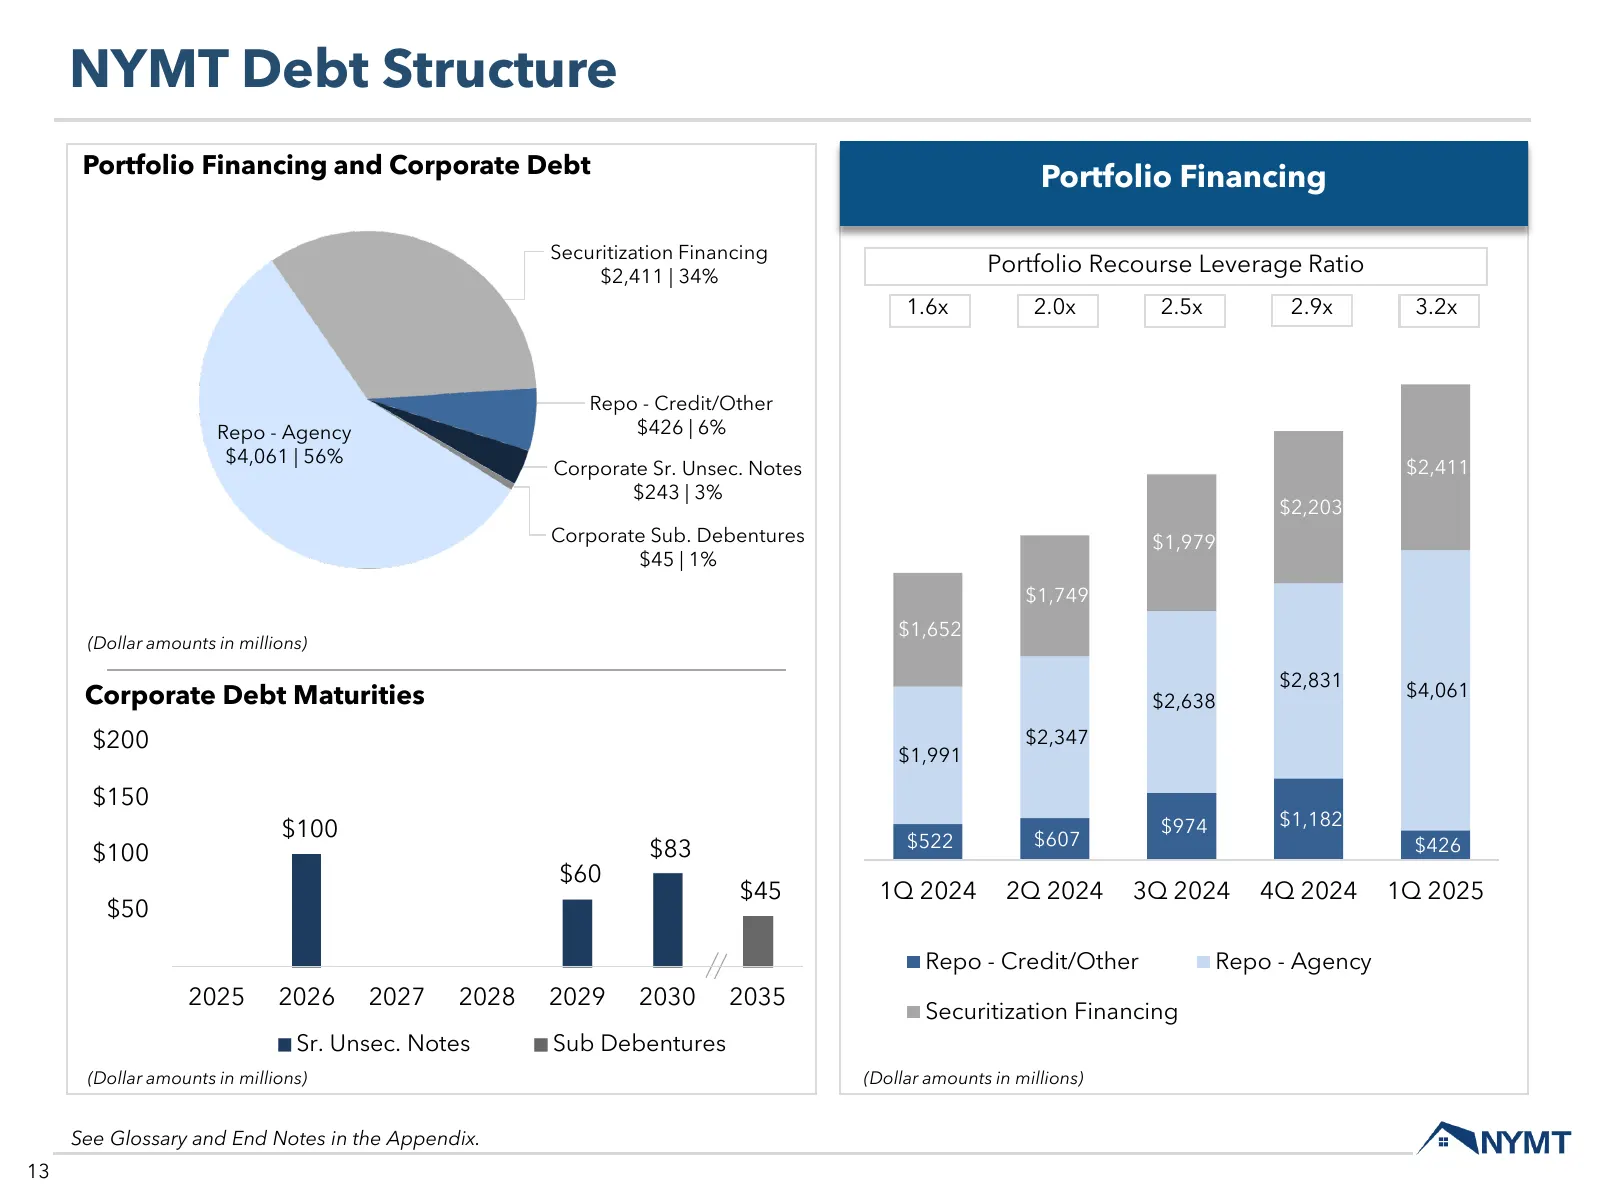
NYMT Debt Structure Portfolio Financing and Corporate Debt Portfolio Quarterly PortfolioFinancing Financing Exposure (Dollar amounts in millions) Securitization Financing $2,411 | 34% Portfolio Recourse Leverage Ratio 1.6x 2.0x 2.5x 2.9x 3.2x Repo - Credit/Other Repo - Agency $426 | 6% $4,061 | 56%
Slide 14: NYMT Holds a Diversified Portfolio of Assets
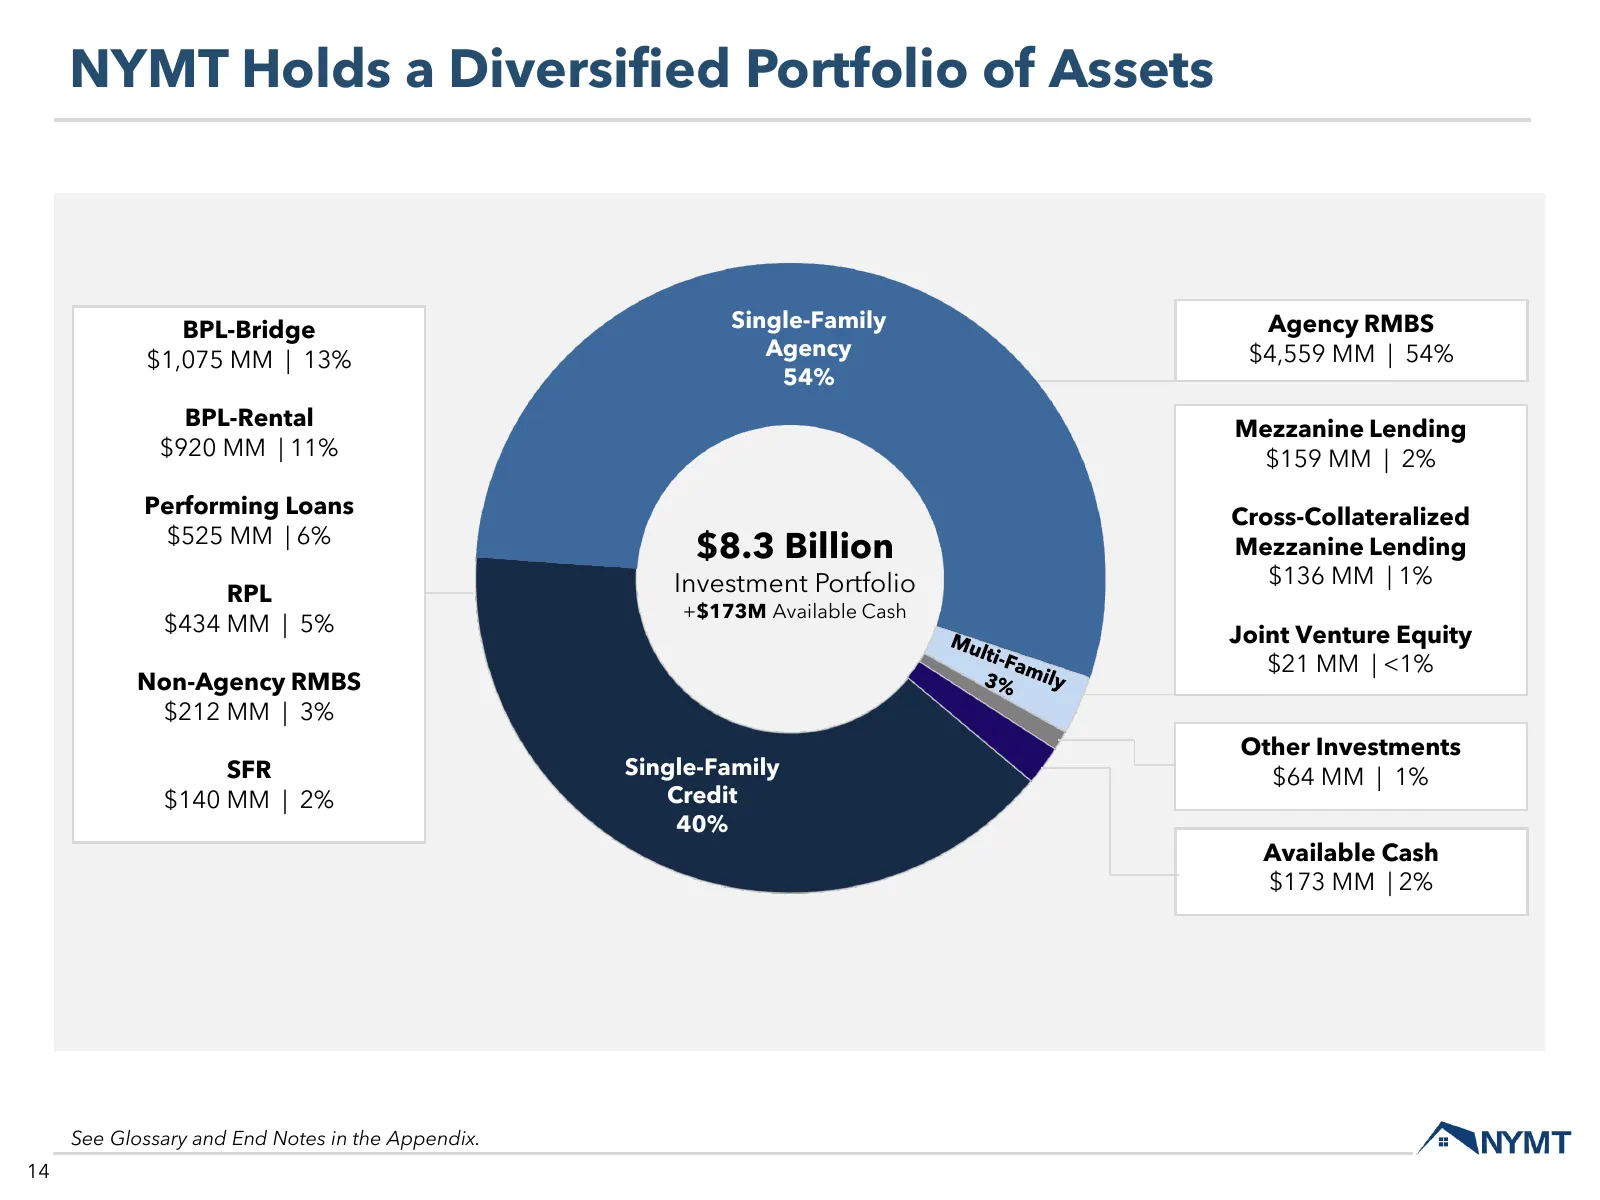
NYMT Holds a Diversified Portfolio of Assets BPL-Bridge Single-Family Agency RMBS $1,075 MM | 13% Agency $4,559 MM | 54% 54% BPL-Rental Mezzanine Lending $920 MM | 11% $159 MM | 2% Performing Loans Cross-Collateralized $525 MM | 6% $8.3 Billion Mezzanine Lending Investment Portfolio $136 MM | 1% RPL

Slide 15: Market & Strategy Update
Market & Strategy a — /SSNYMT
Slide 16: NYMT Strategy for Long-Term Shareholder Value
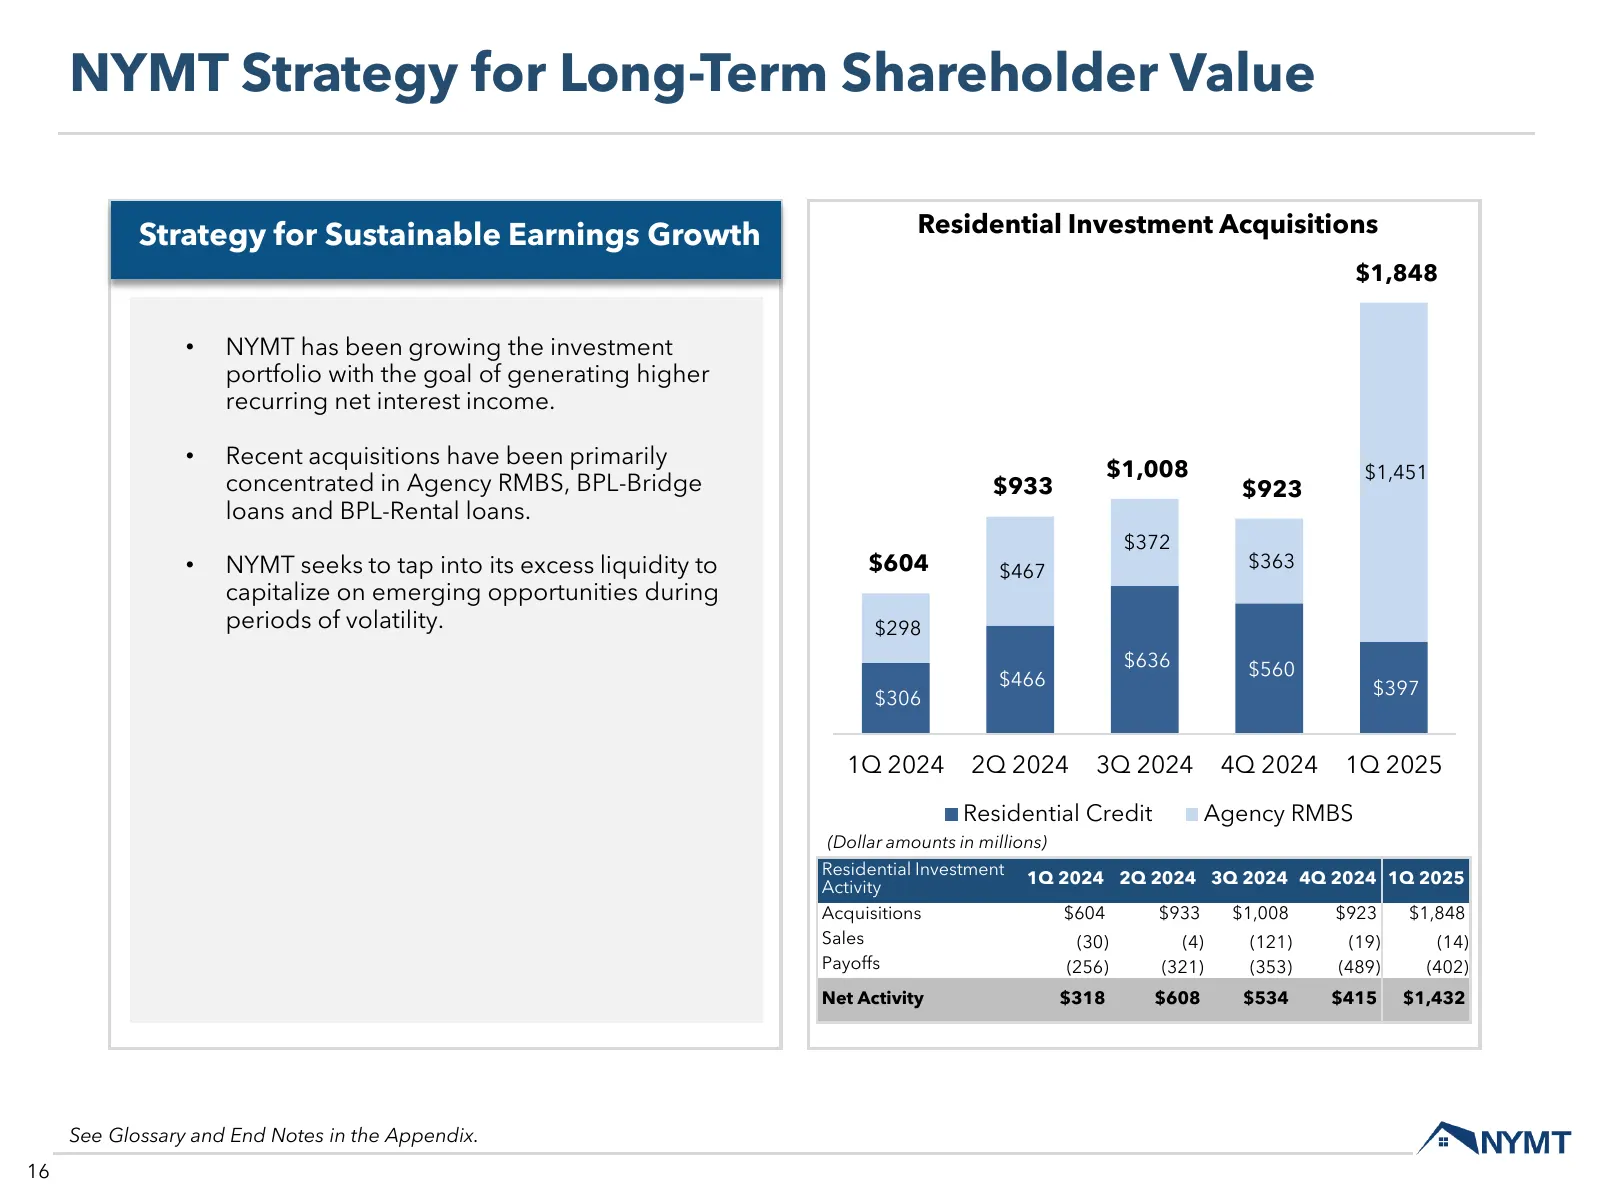
NYMT Strategy for Long-Term Shareholder Value Strategy for Sustainable Earnings Growth Residential Investment Acquisitions $1,848 • NYMT has been growing the investment portfolio with the goal of generating higher recurring net interest income. • Recent acquisitions have been primarily $1,008 $1,451
Slide 17: Single-Family Agency RMBS Market
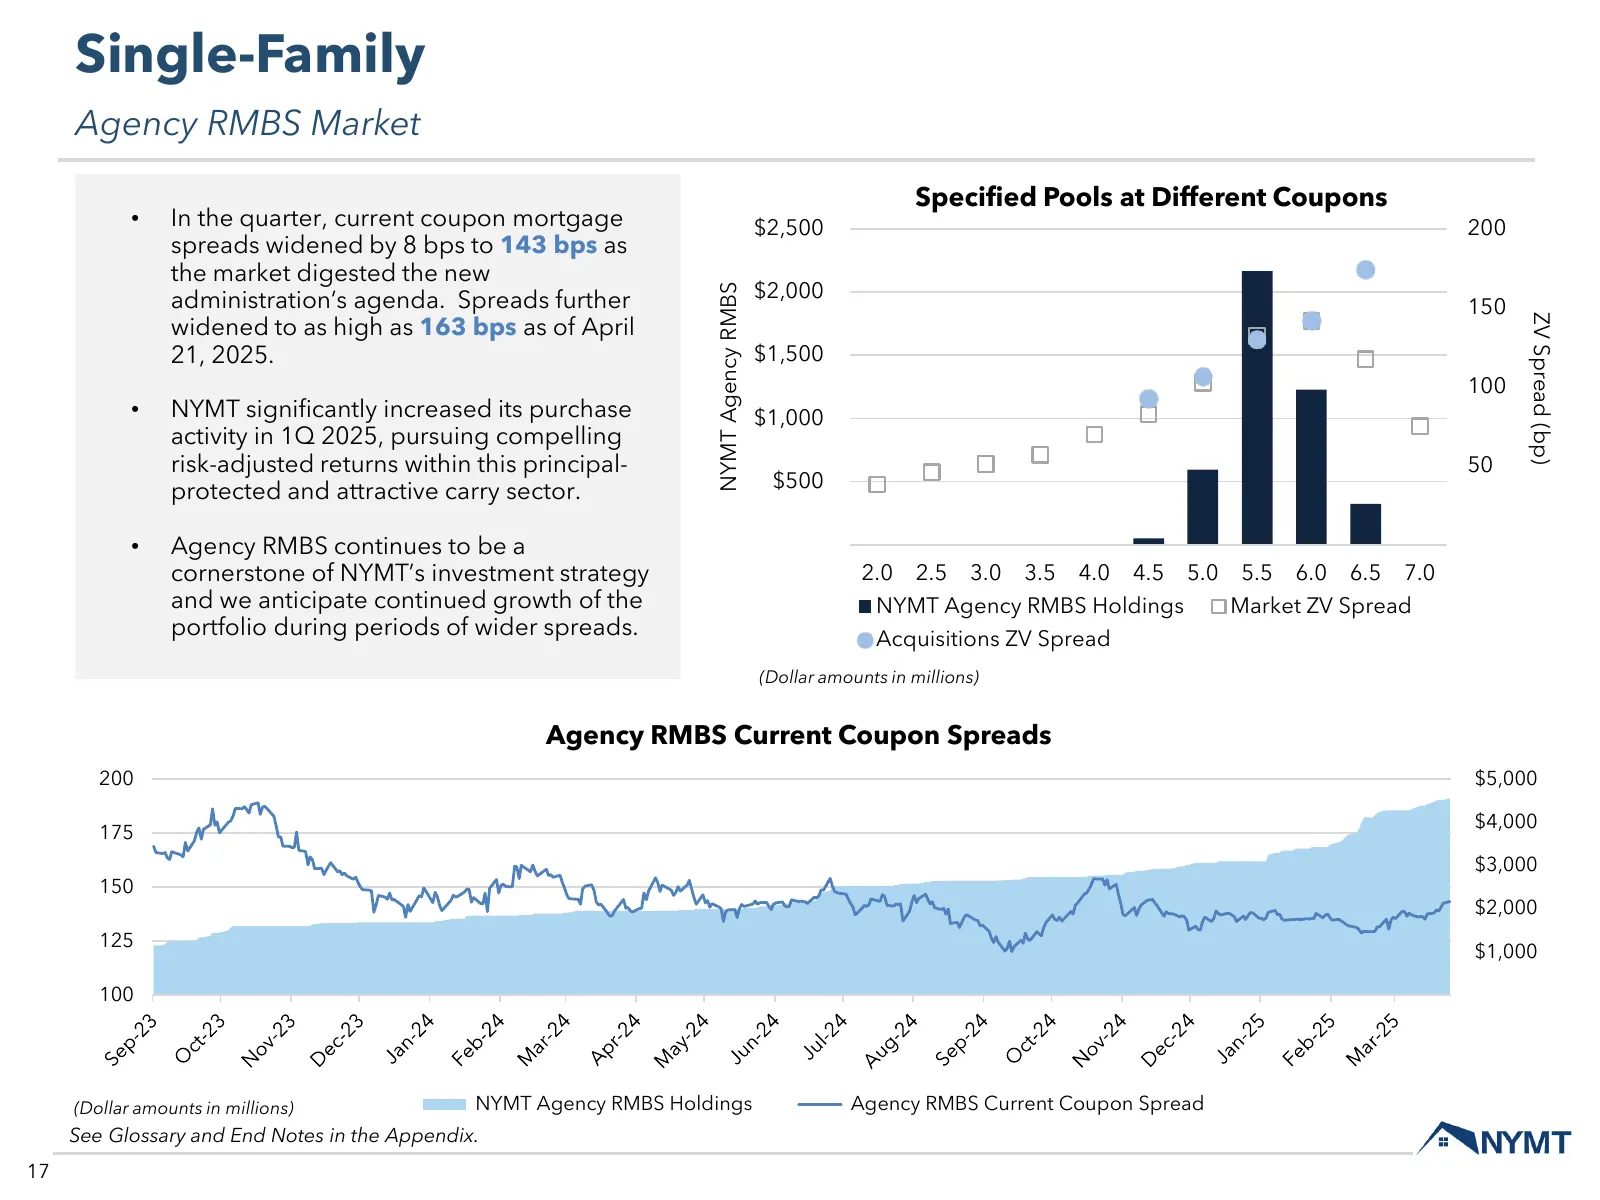
Single-Family Agency RMBS Market Specified Pools at Different Coupons • In the quarter, current coupon mortgage $2,500 200 spreads widened by 8 bps to 143 bps as the market digested the new $2,000 NYMT Agency RMBS administration’s agenda. Spreads further 150 widened to as high as 163 bps as of April
Slide 18: Single-Family Agency RMBS Strategy
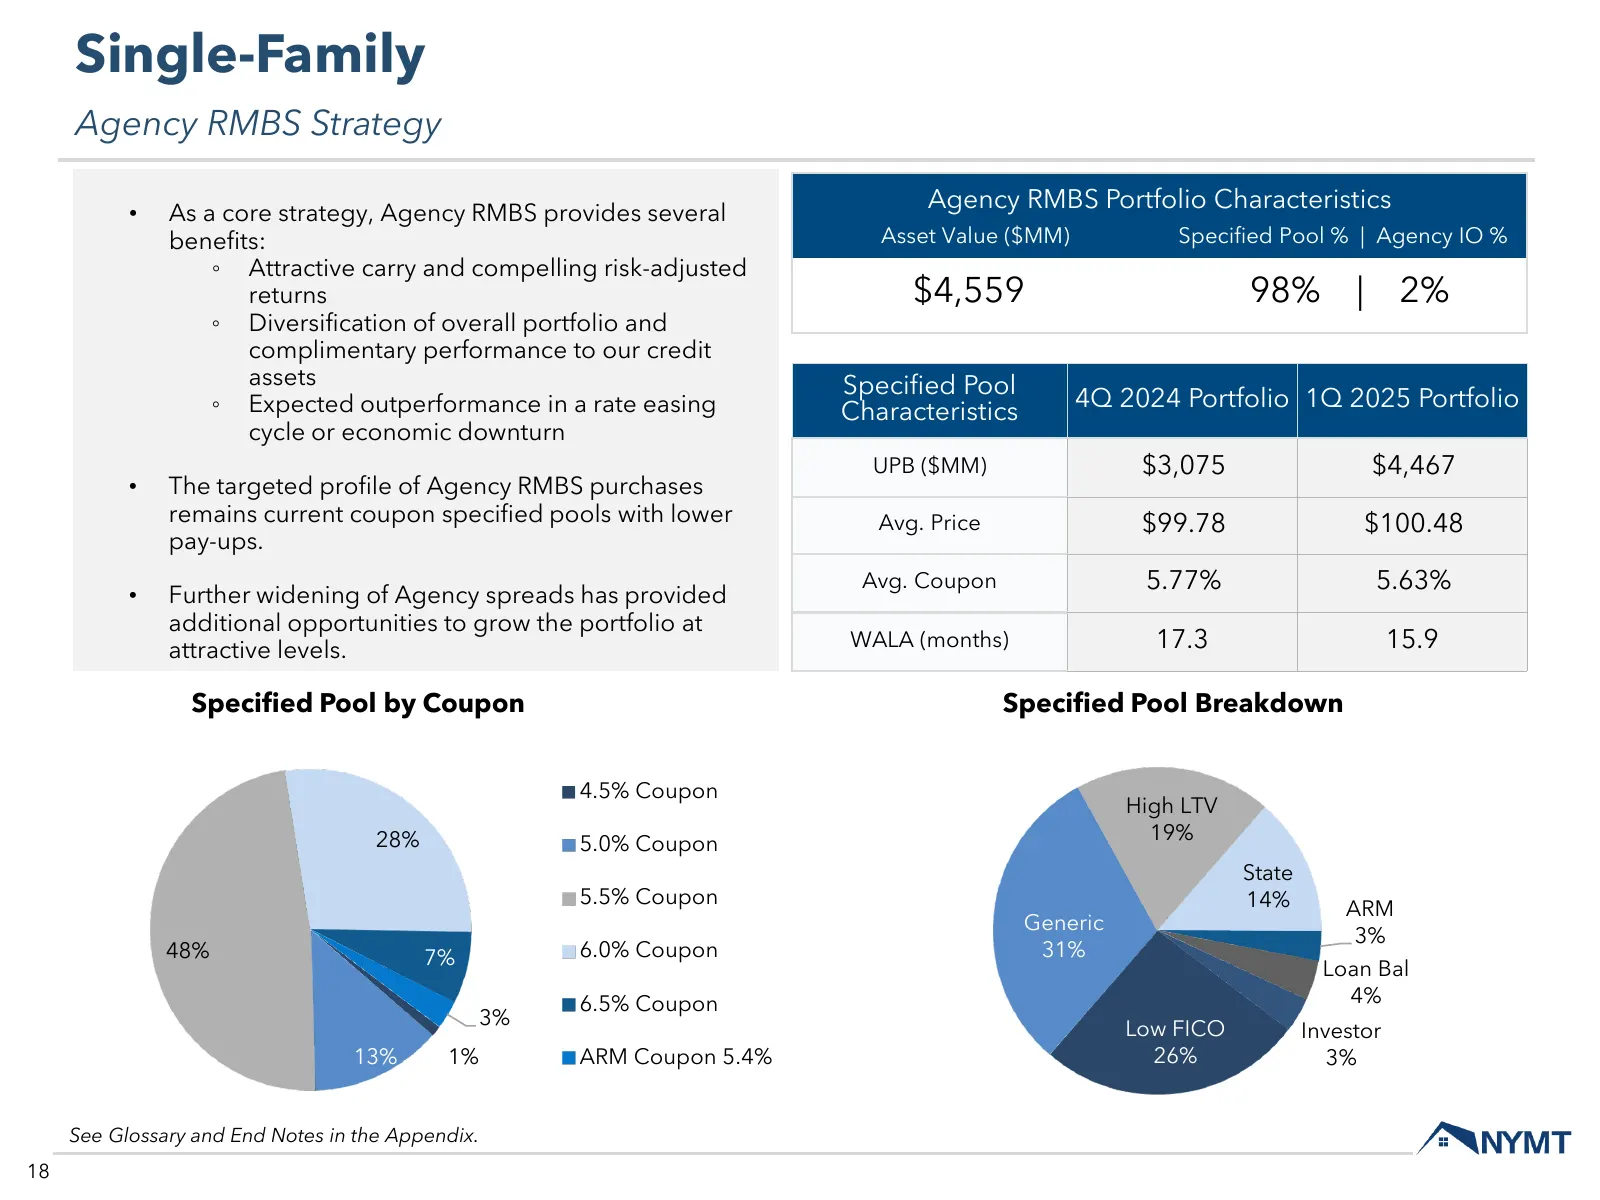
Single-Family Agency RMBS Strategy Agency RMBS Portfolio Characteristics • As a core strategy, Agency RMBS provides several benefits: Asset Value ($MM) Specified Pool % | Agency IO % ◦ Attractive carry and compelling risk-adjusted returns $4,559 98% | 2% ◦ Diversification of overall portfolio and co
Slide 19: Single-Family Business Purpose Loan-Bridge Strategy
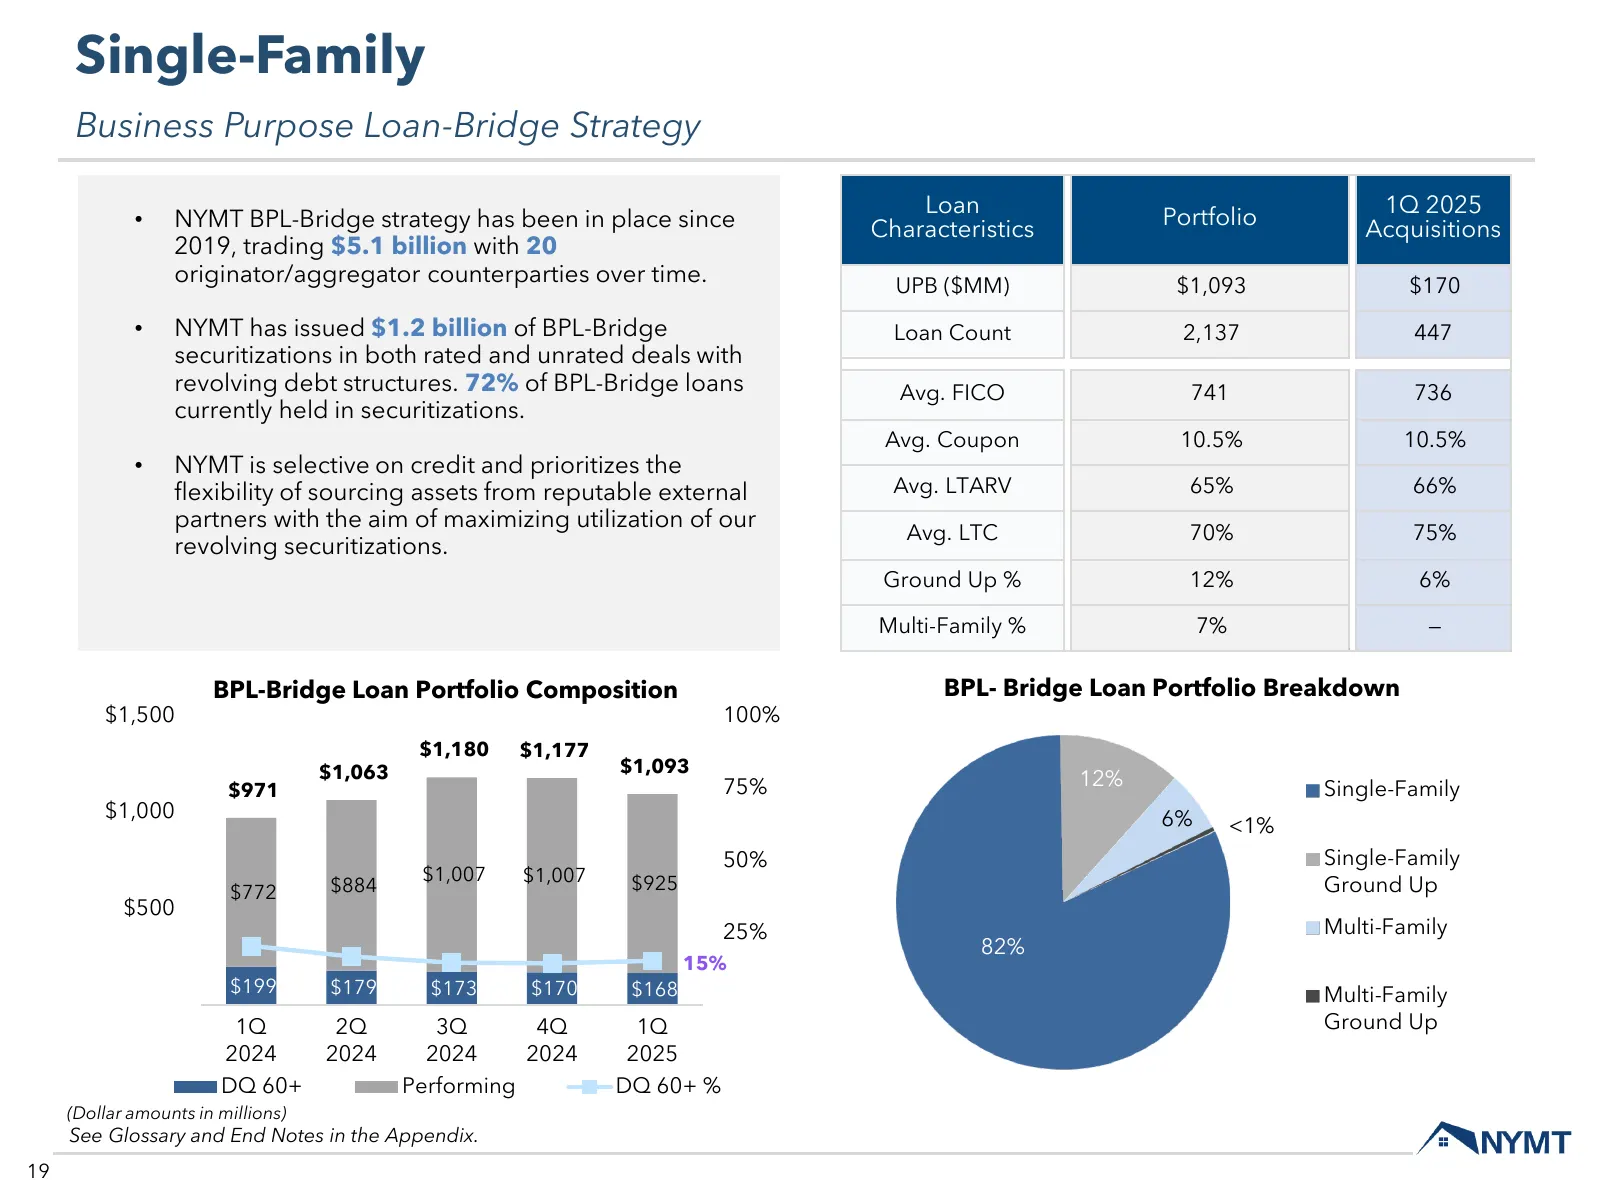
Single-Family Business Purpose Loan-Bridge Strategy Loan 1Q 2025 • NYMT BPL-Bridge strategy has been in place since Characteristics Portfolio Acquisitions 2019, trading $5.1 billion with 20 originator/aggregator counterparties over time. UPB ($MM) $1,093 $170 • NYMT has issued $1.2 billion of BPL-Br
Slide 20: Single-Family Portfolio Overview
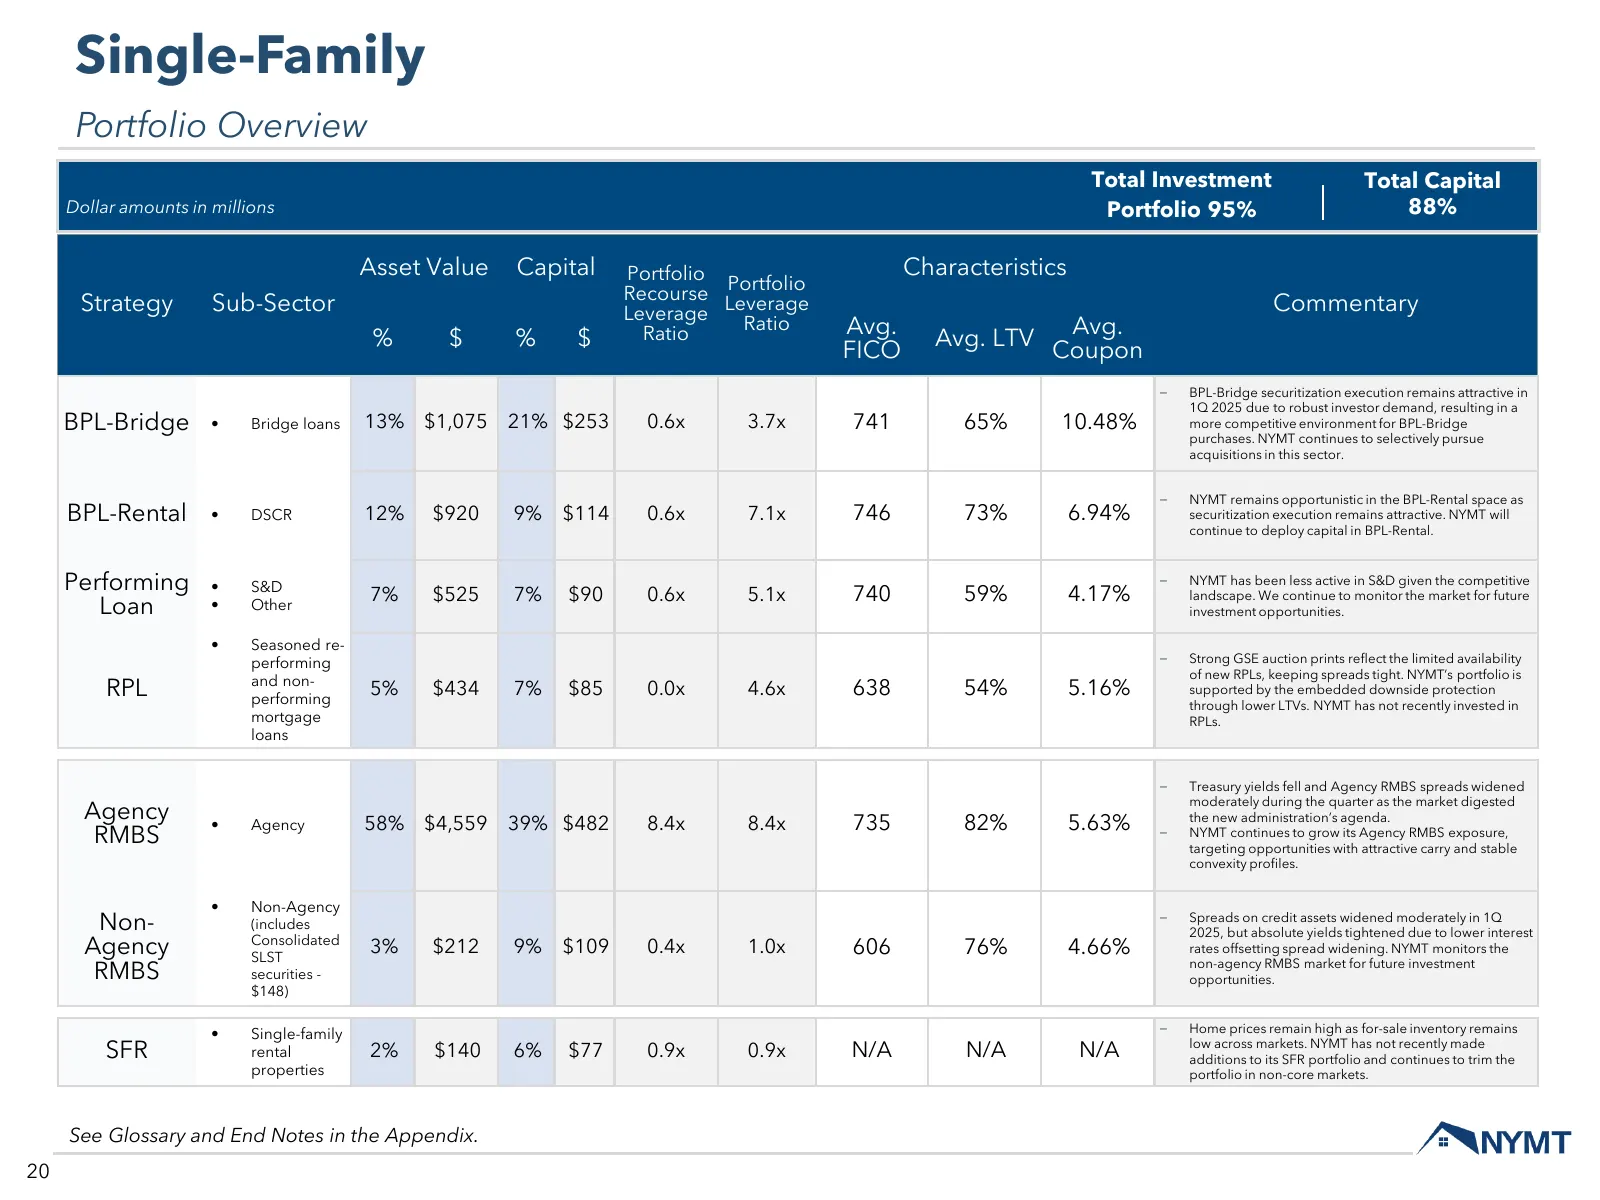
Single-Family Portfolio Overview Total Investment Total Capital Dollar amounts in millions Portfolio 95% 88% Asset Value Capital Portfolio Portfolio Characteristics Recourse Leverage Strategy Sub-Sector Leverage Commentary % $ % $ Ratio Ratio Avg. Avg. Avg. LTV Coupon FICO − BPL-Bridge securitizatio
Slide 21: Multi-Family Portfolio Overview
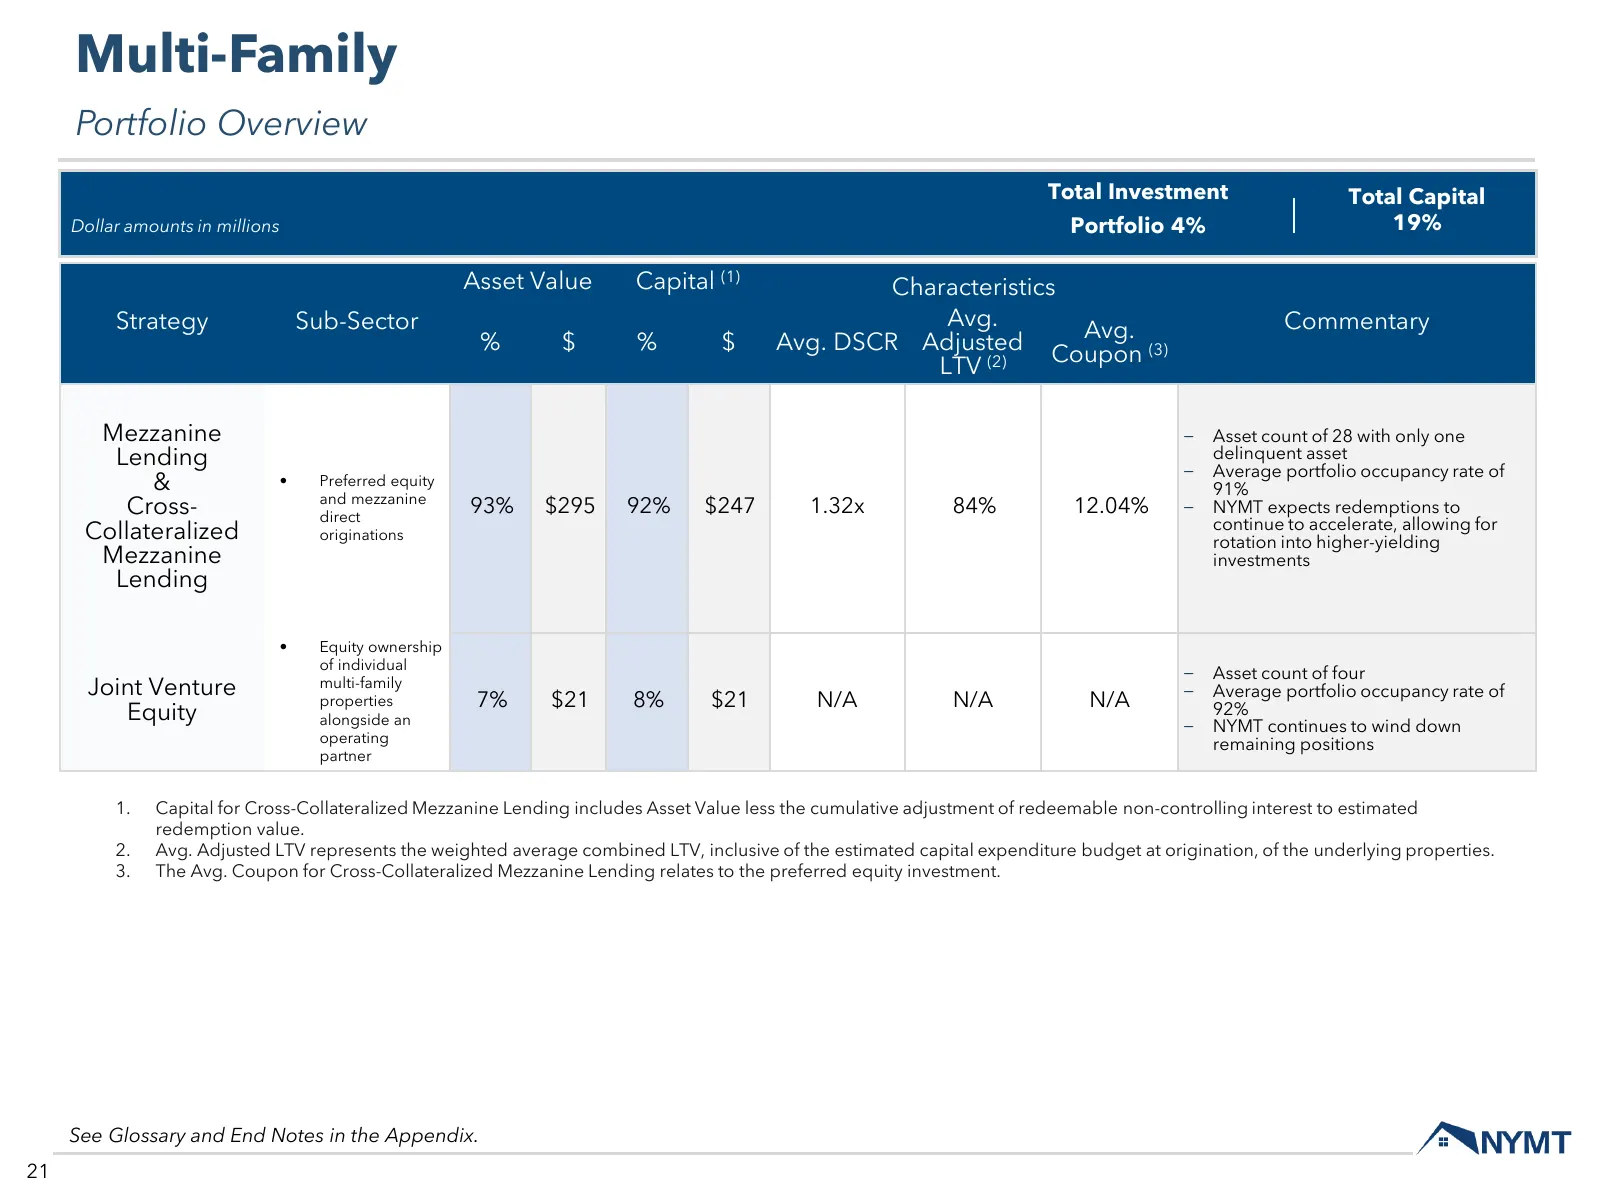
Multi-Family Portfolio Overview Total Investment Total Capital Dollar amounts in millions Portfolio 4% 19% Asset Value Capital (1) Characteristics Strategy Sub-Sector Avg. Avg. Commentary % $ % $ Avg. DSCR Adjusted Coupon (3) LTV (2) Mezzanine − Asset count of 28 with only one Lending − delinquent a

Slide 22: Quarterly Financial Information
Quarterly Financial Information 22
Slide 23: Financial Results
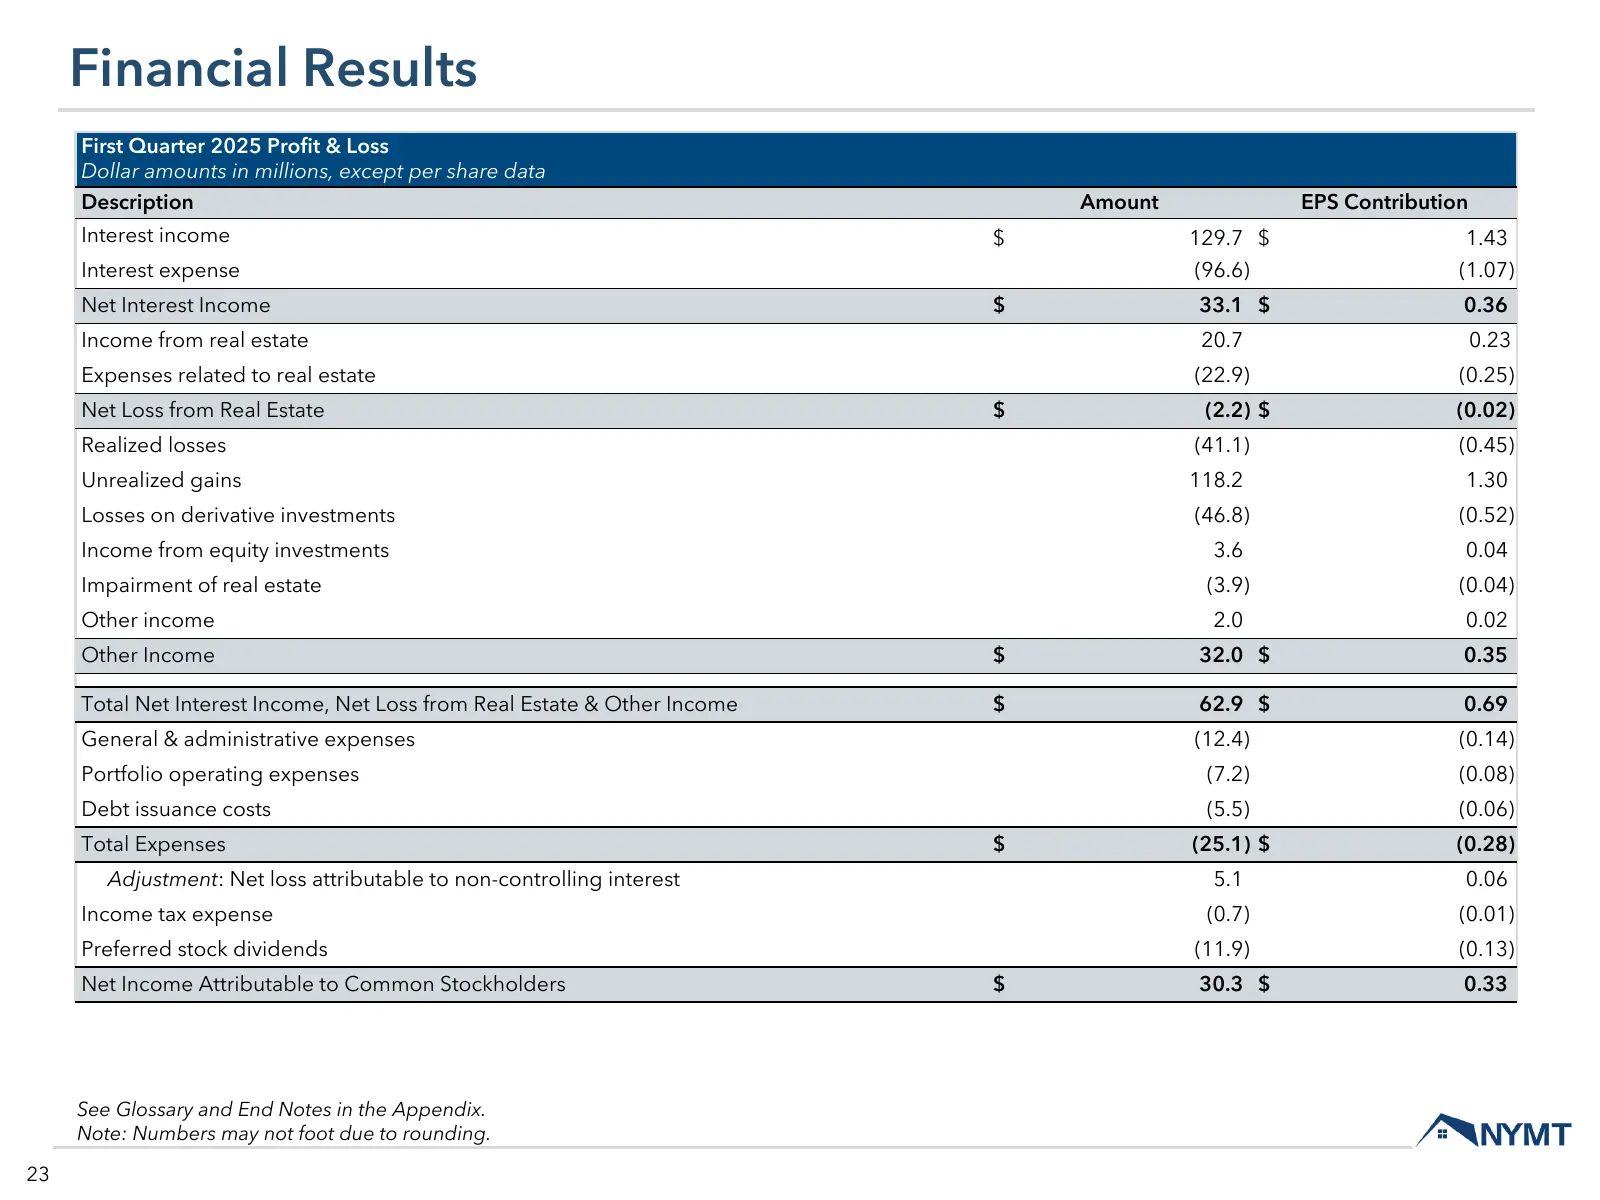
Financial Results First Quarter 2025 Profit & Loss Dollar amounts in millions, except per share data Description Amount EPS Contribution Interest income $ 129.7 $ 1.43 Interest expense (96.6) (1.07) Net Interest Income $ 33.1 $ 0.36 Income from real estate 20.7 0.23 Expenses related to real estate (
Slide 24: Yields By Strategy
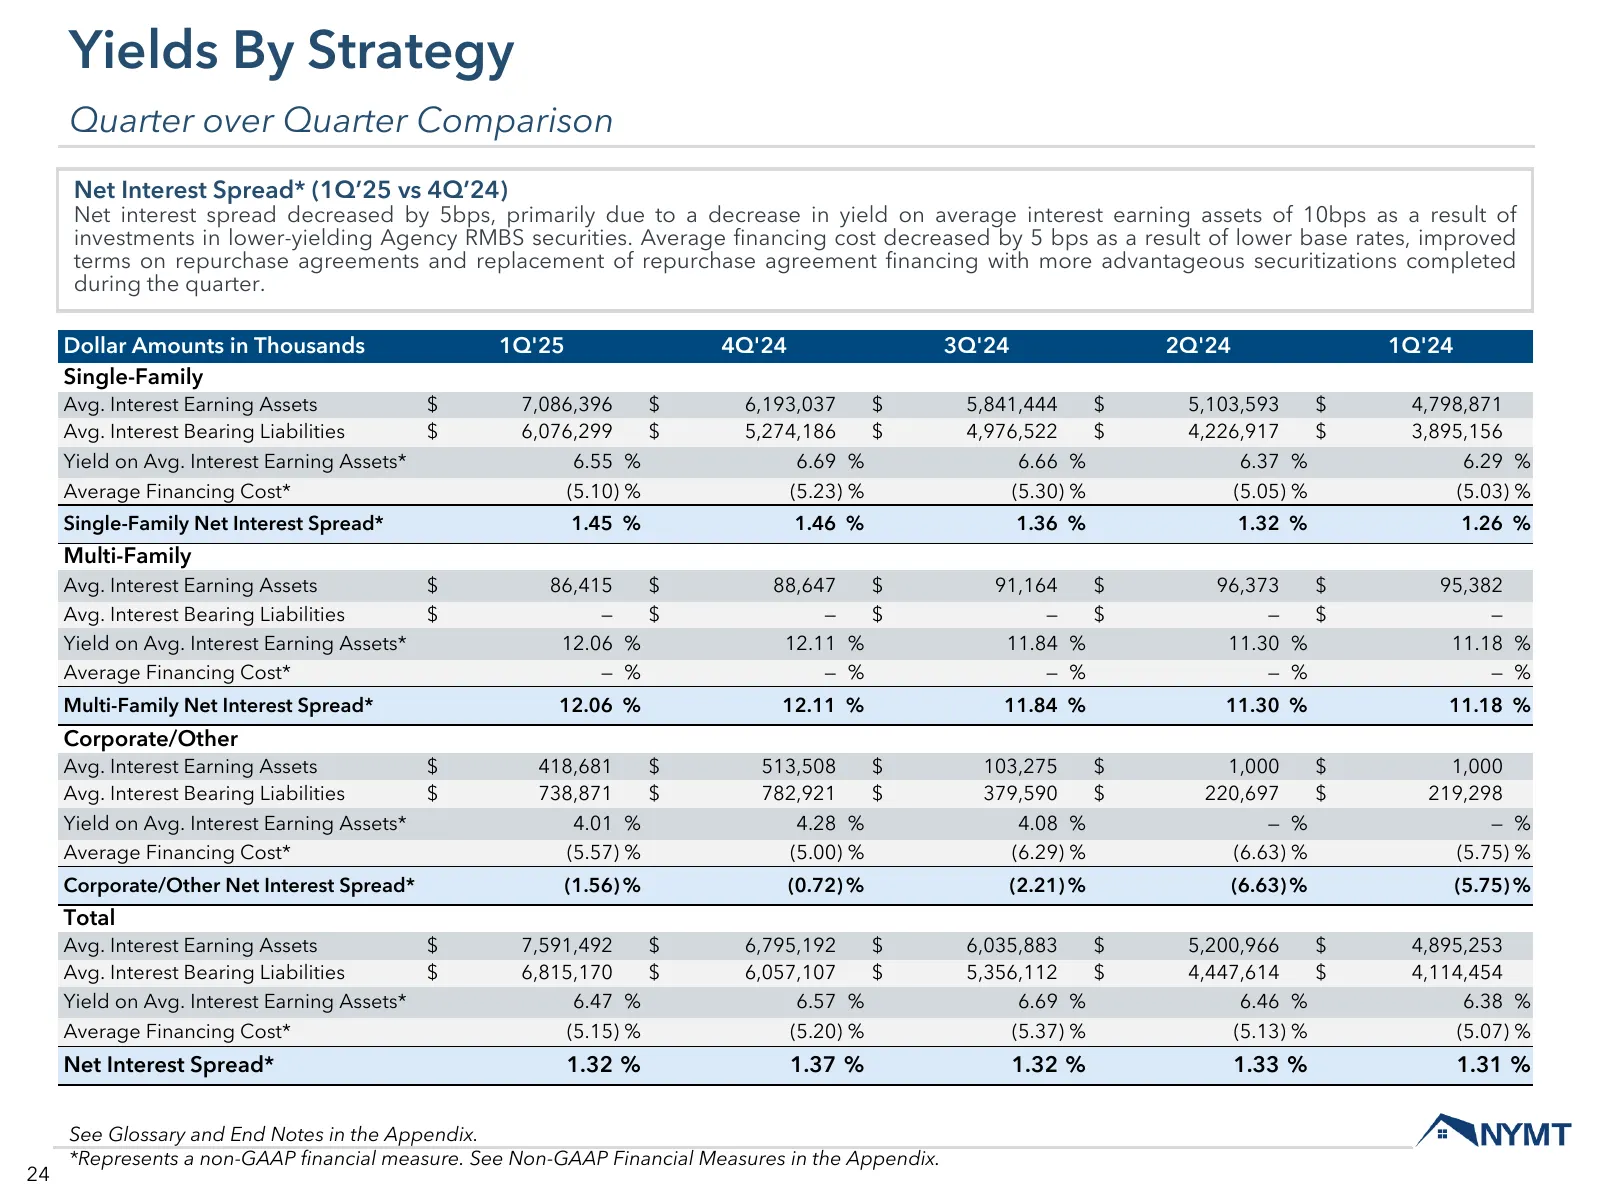
Yields By Strategy Quarter over Quarter Comparison Net Interest Spread* (1Q’25 vs 4Q’24) Net interest spread decreased by 5bps, primarily due to a decrease in yield on average interest earning assets of 10bps as a result of investments in lower-yielding Agency RMBS securities. Average financing cost
Slide 25: Adjusted Net Interest Income*
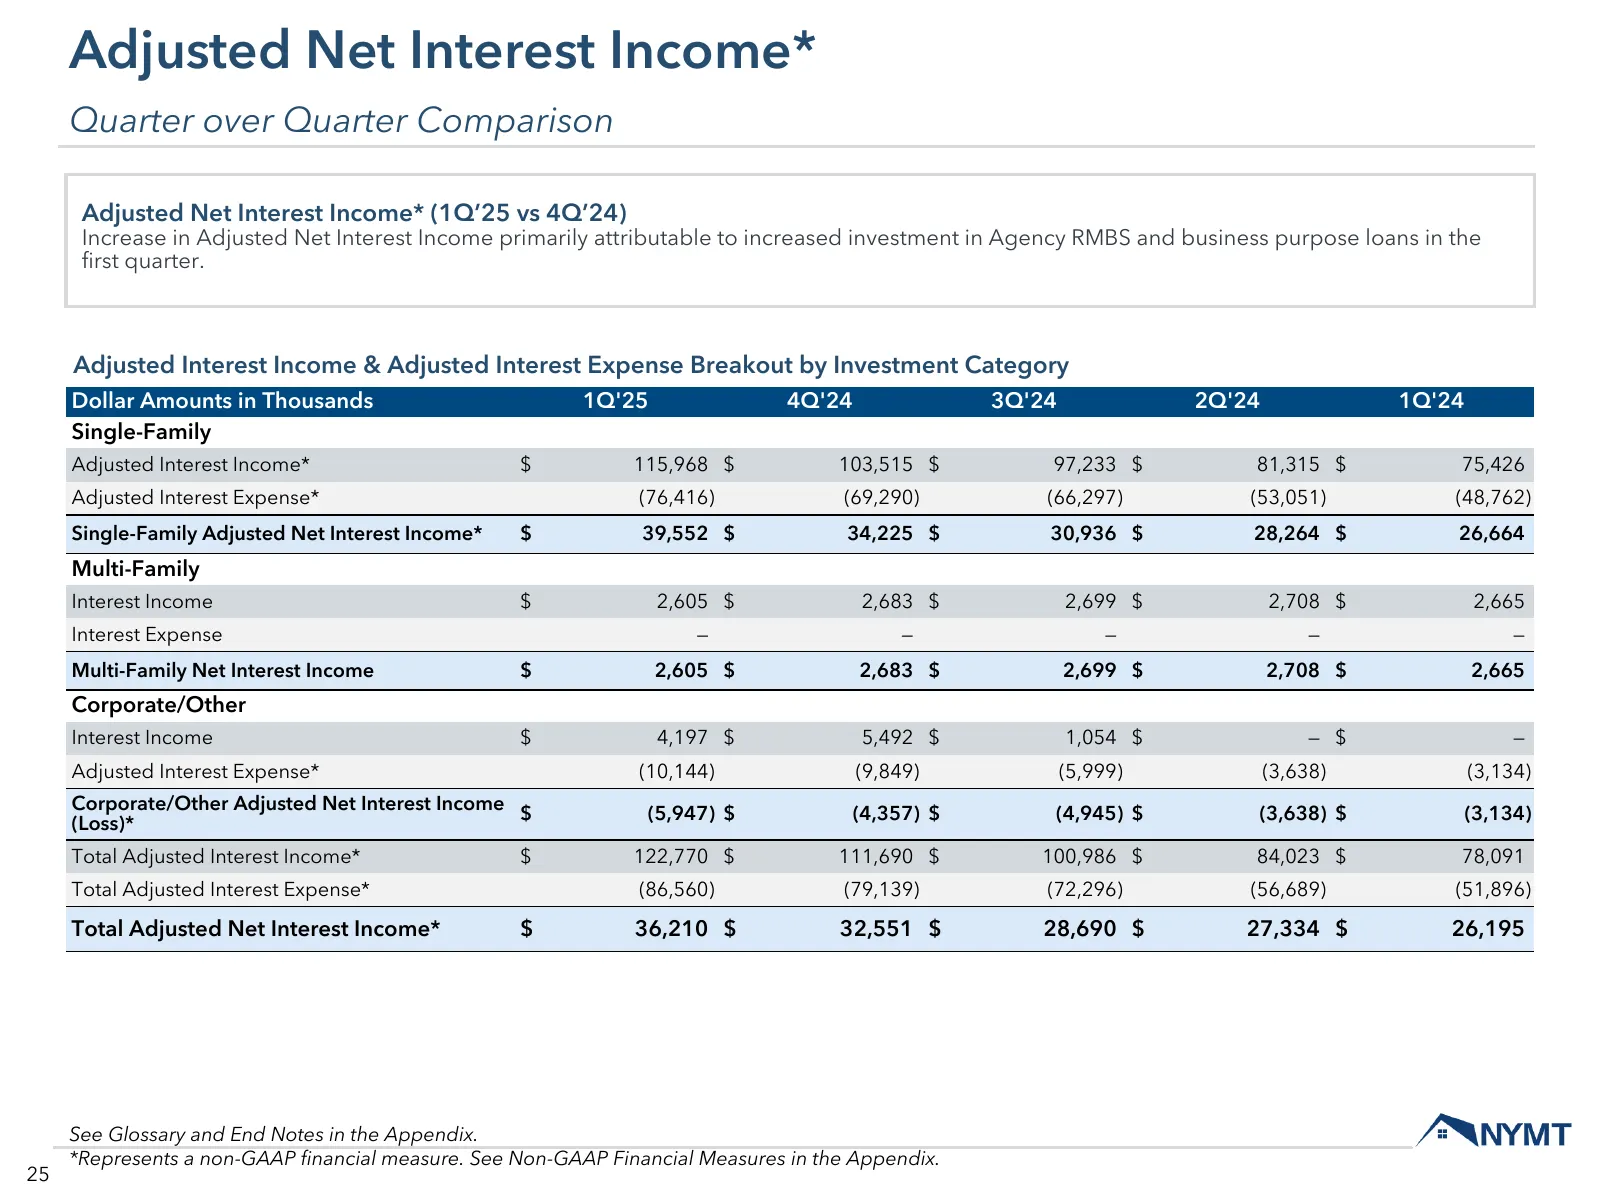
Adjusted Net Interest Income* Quarter over Quarter Comparison Adjusted Net Interest Income* (1Q’25 vs 4Q’24) Increase in Adjusted Net Interest Income primarily attributable to increased investment in Agency RMBS and business purpose loans in the first quarter. Adjusted Interest Income & Adjusted Int
Slide 26: Net Loss from Real Estate
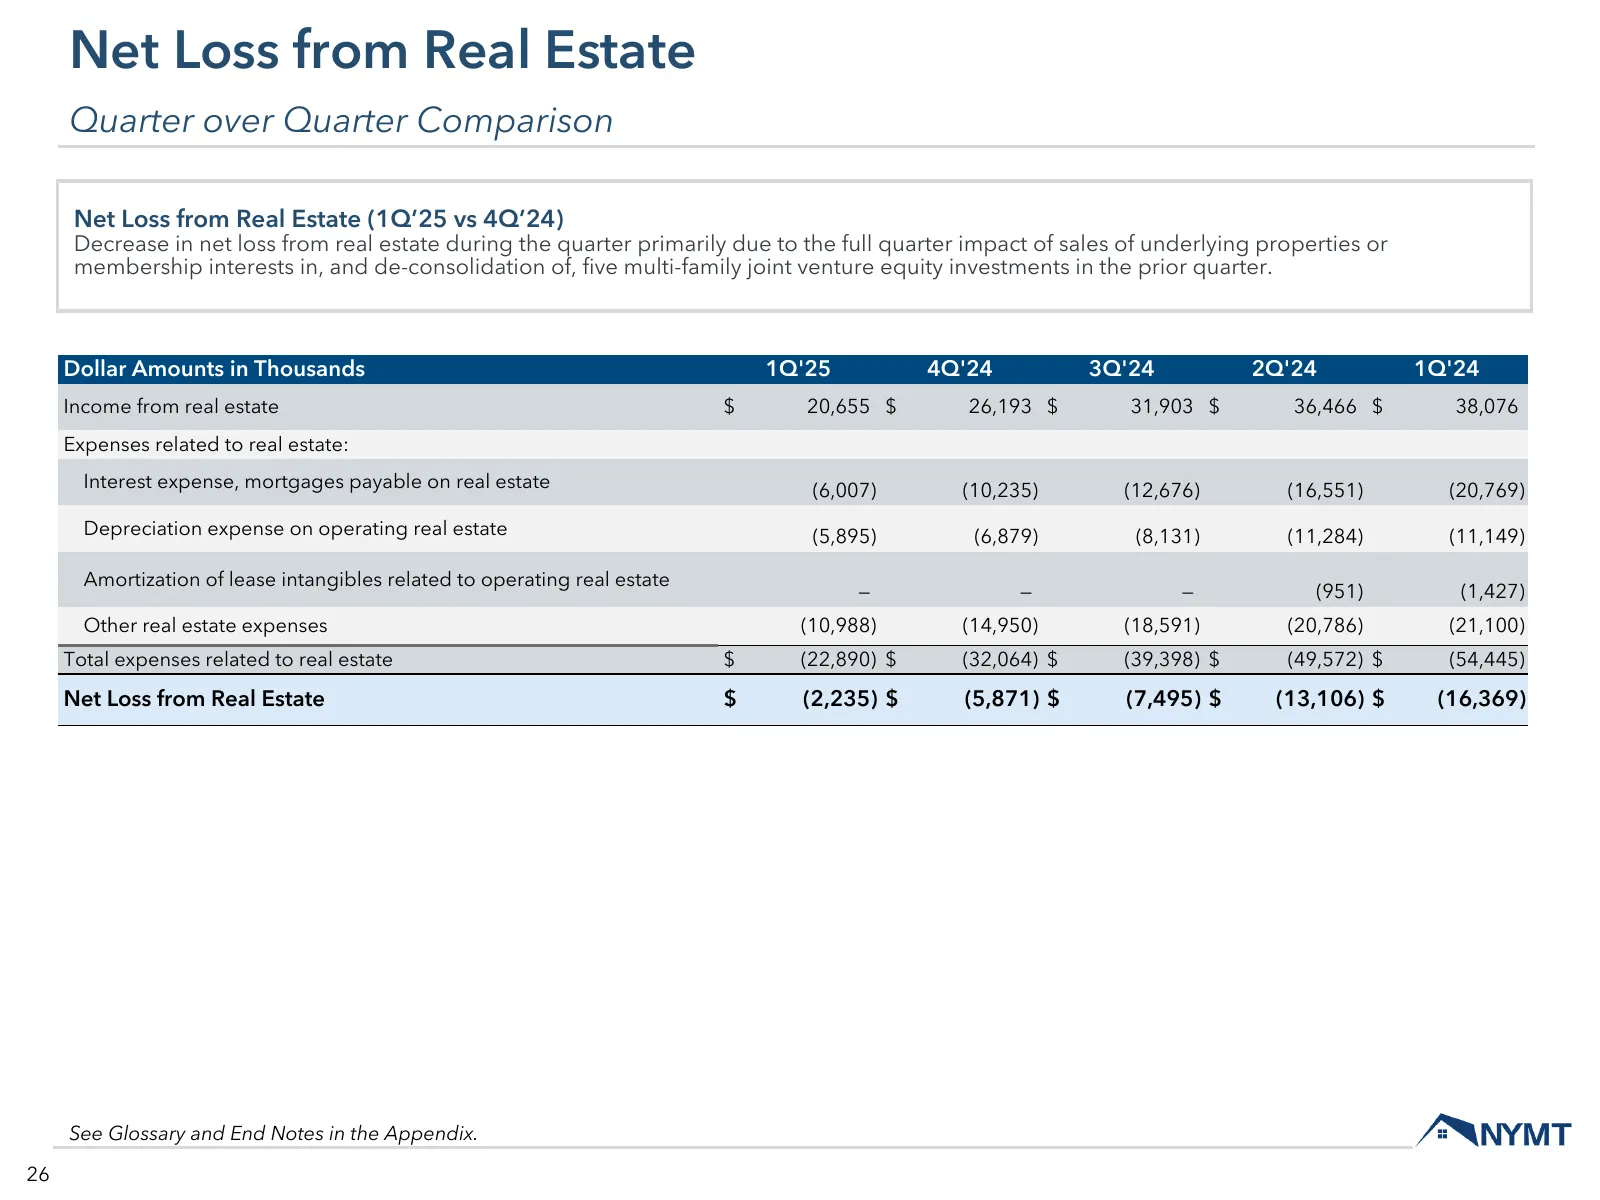
Net Loss from Real Estate Quarter over Quarter Comparison Net Loss from Real Estate (1Q’25 vs 4Q’24) Decrease in net loss from real estate during the quarter primarily due to the full quarter impact of sales of underlying properties or membership interests in, and de-consolidation of, five multi-fam
Slide 27: Other Income (Loss)
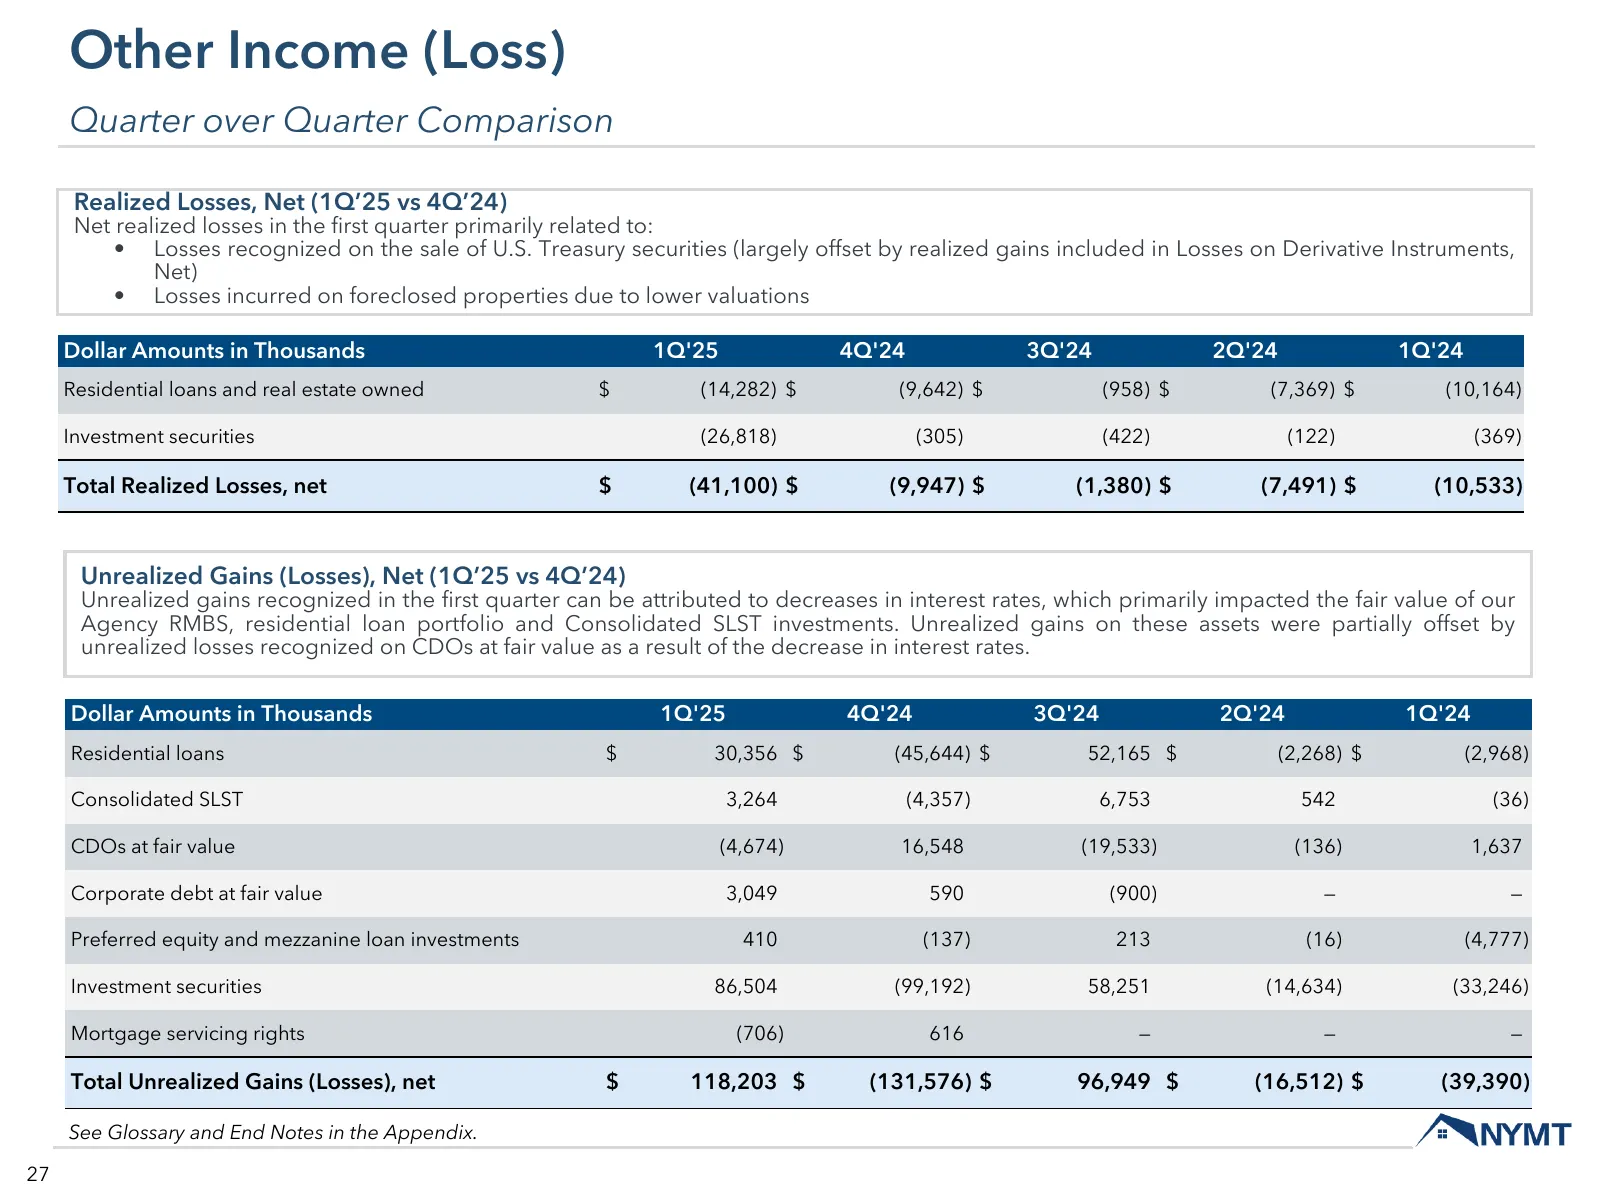
Other Income (Loss) Quarter over Quarter Comparison Realized Losses, Net (1Q’25 vs 4Q’24) Net realized losses in the first quarter primarily related to: • Losses recognized on the sale of U.S. Treasury securities (largely offset by realized gains included in Losses on Derivative Instruments, Net) •
Slide 28: Other Income (Loss)
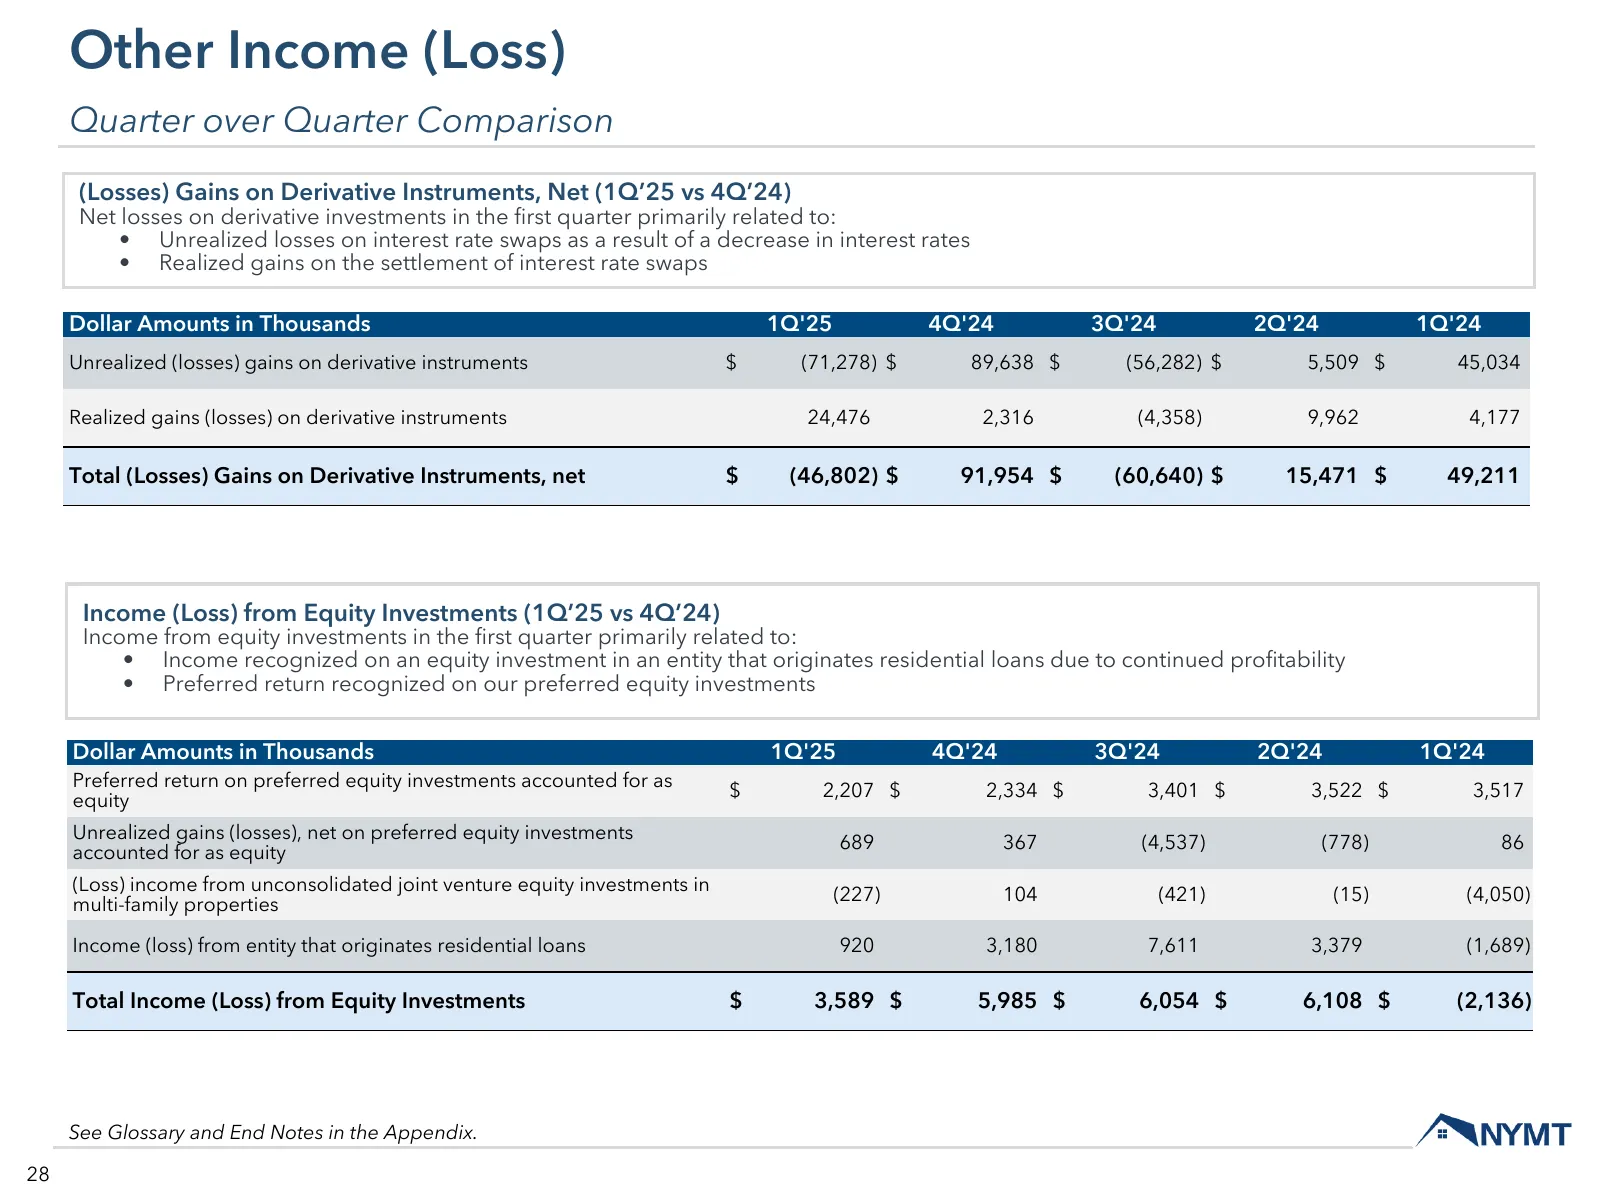
Other Income (Loss) Quarter over Quarter Comparison (Losses) Gains on Derivative Instruments, Net (1Q’25 vs 4Q’24) Net losses on derivative investments in the first quarter primarily related to: • Unrealized losses on interest rate swaps as a result of a decrease in interest rates • Realized gains o
Slide 29: Other Income (Loss)
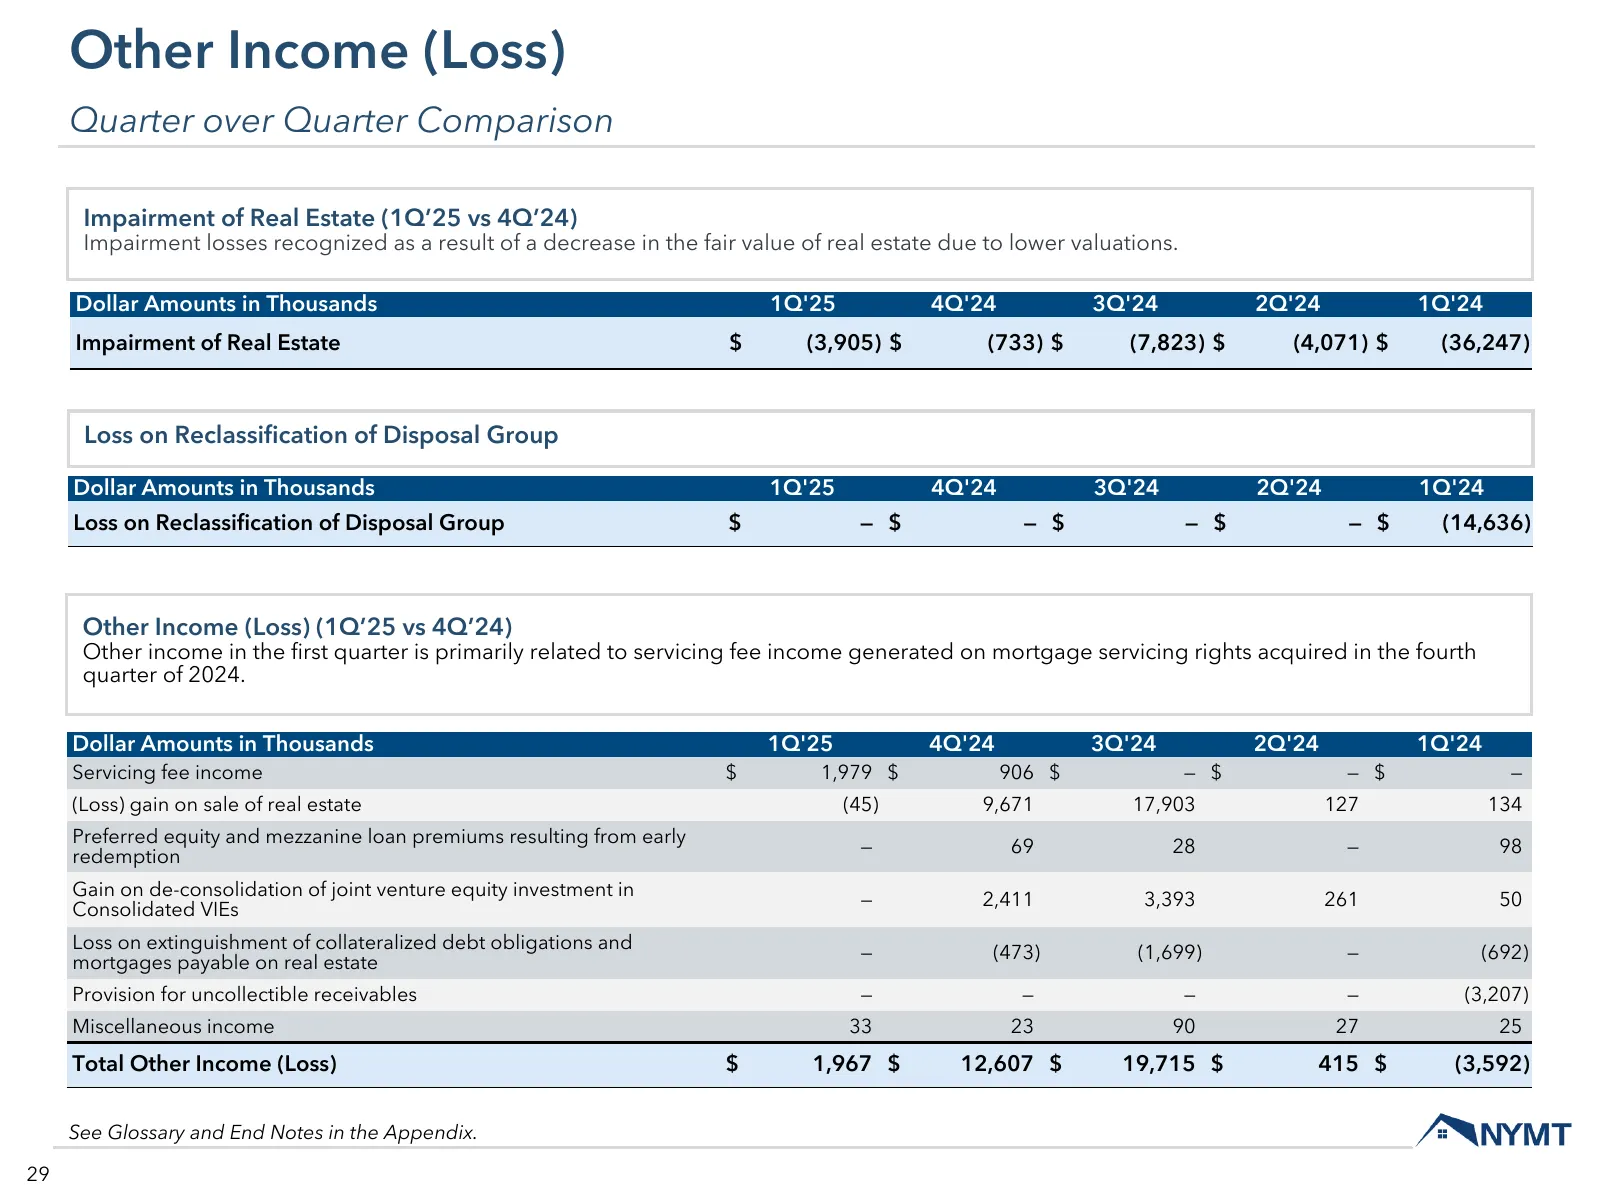
Other Income (Loss) Quarter over Quarter Comparison Impairment of Real Estate (1Q’25 vs 4Q’24) Impairment losses recognized as a result of a decrease in the fair value of real estate due to lower valuations. Dollar Amounts in Thousands 1Q'25 4Q'24 3Q'24 2Q'24 1Q'24 Impairment of Real Estate $ (3,905
Slide 30: Expenses
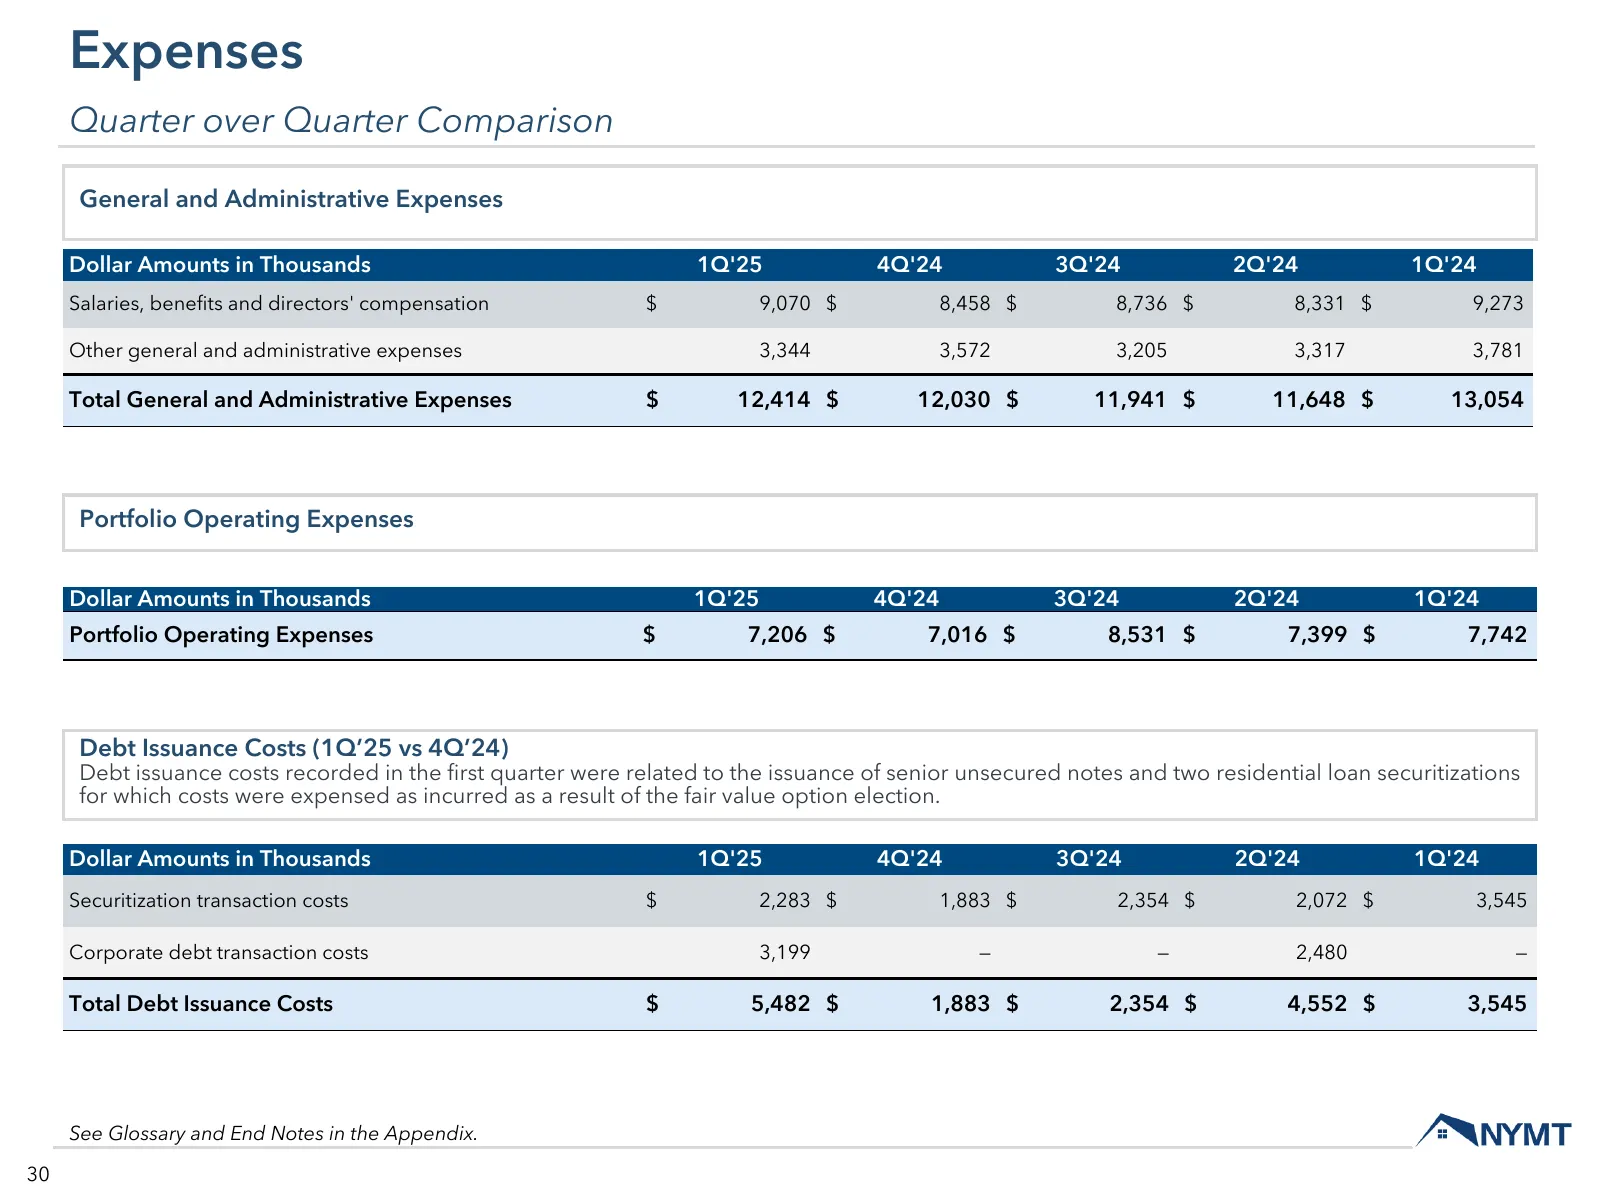
Expenses Quarter over Quarter Comparison General and Administrative Expenses Dollar Amounts in Thousands 1Q'25 4Q'24 3Q'24 2Q'24 1Q'24 Salaries, benefits and directors' compensation $ 9,070 $ 8,458 $ 8,736 $ 8,331 $ 9,273 Other general and administrative expenses 3,344 3,572 3,205 3,317 3,781 Total
Slide 31: Other Comprehensive Income (Loss)
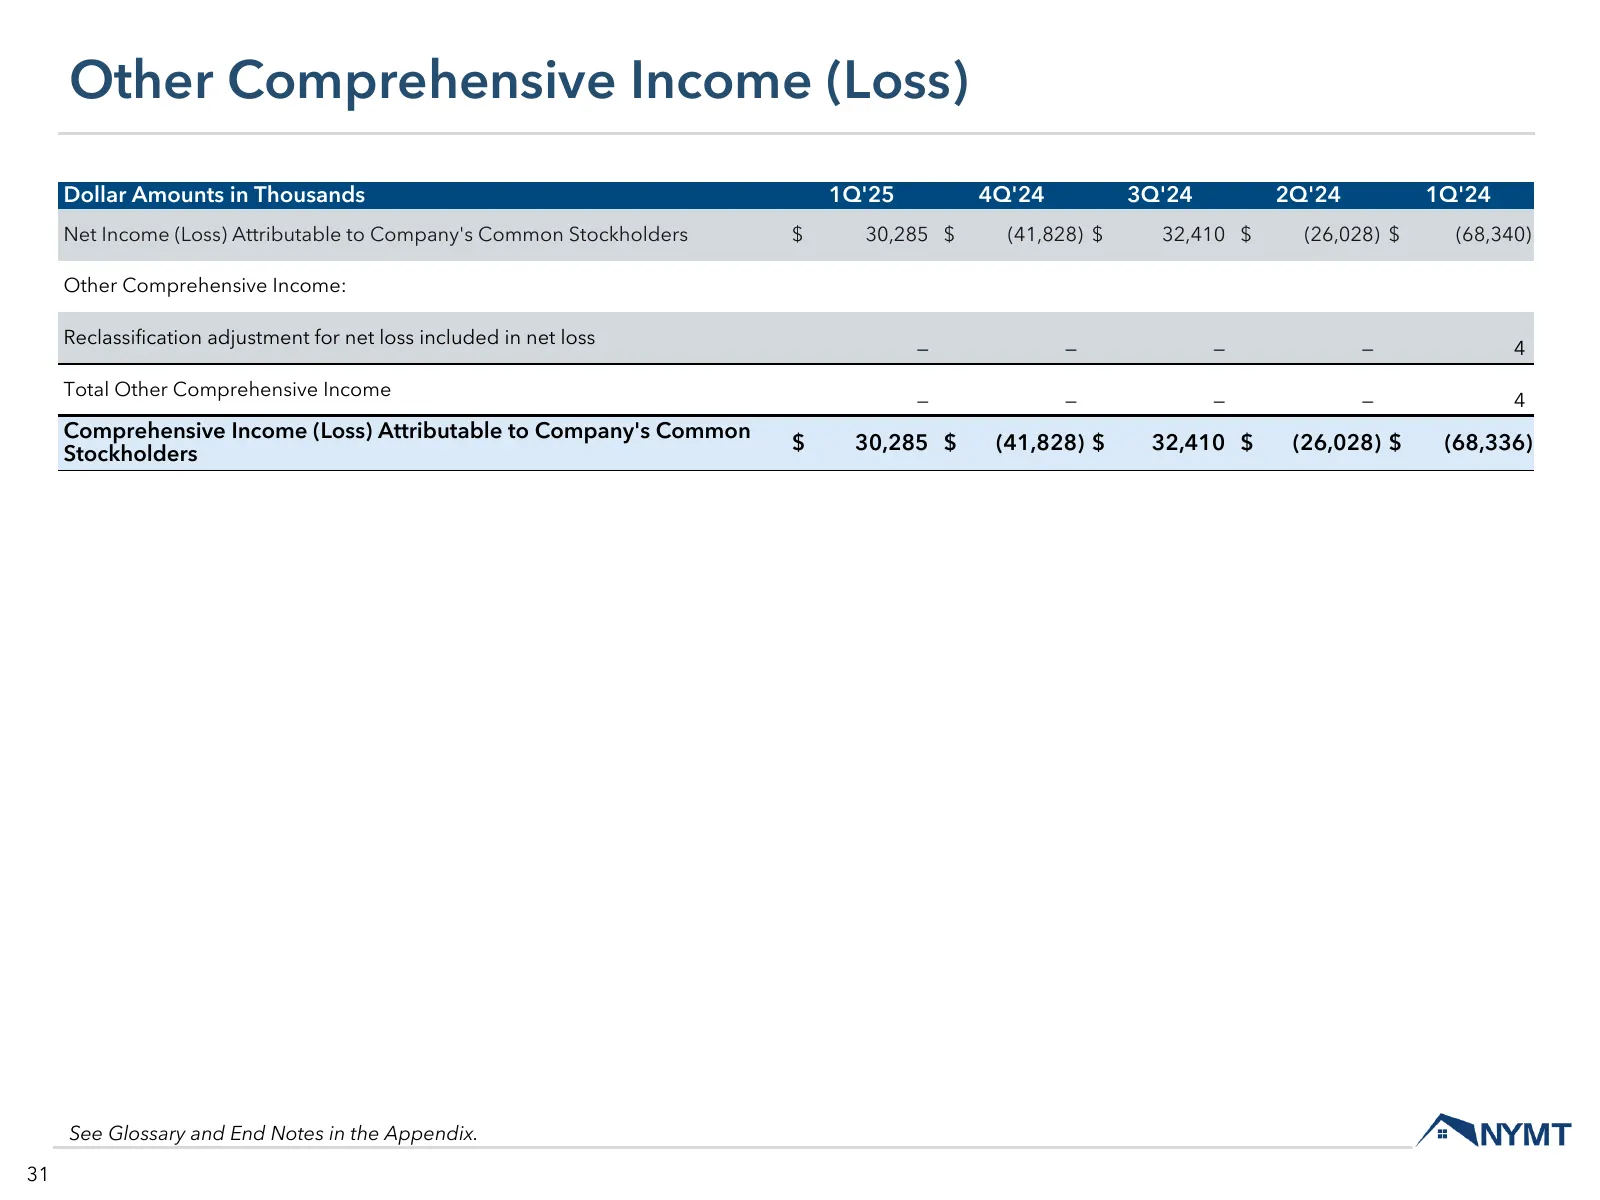
Other Comprehensive Income (Loss) Dollar Amounts in Thousands 1Q'25 4Q'24 3Q'24 2Q'24 1Q'24 Net Income (Loss) Attributable to Company's Common Stockholders $ 30,285 $ (41,828) $ 32,410 $ (26,028) $ (68,340) Other Comprehensive Income: Reclassification adjustment for net loss included in net loss — —
Slide 32: Book Value
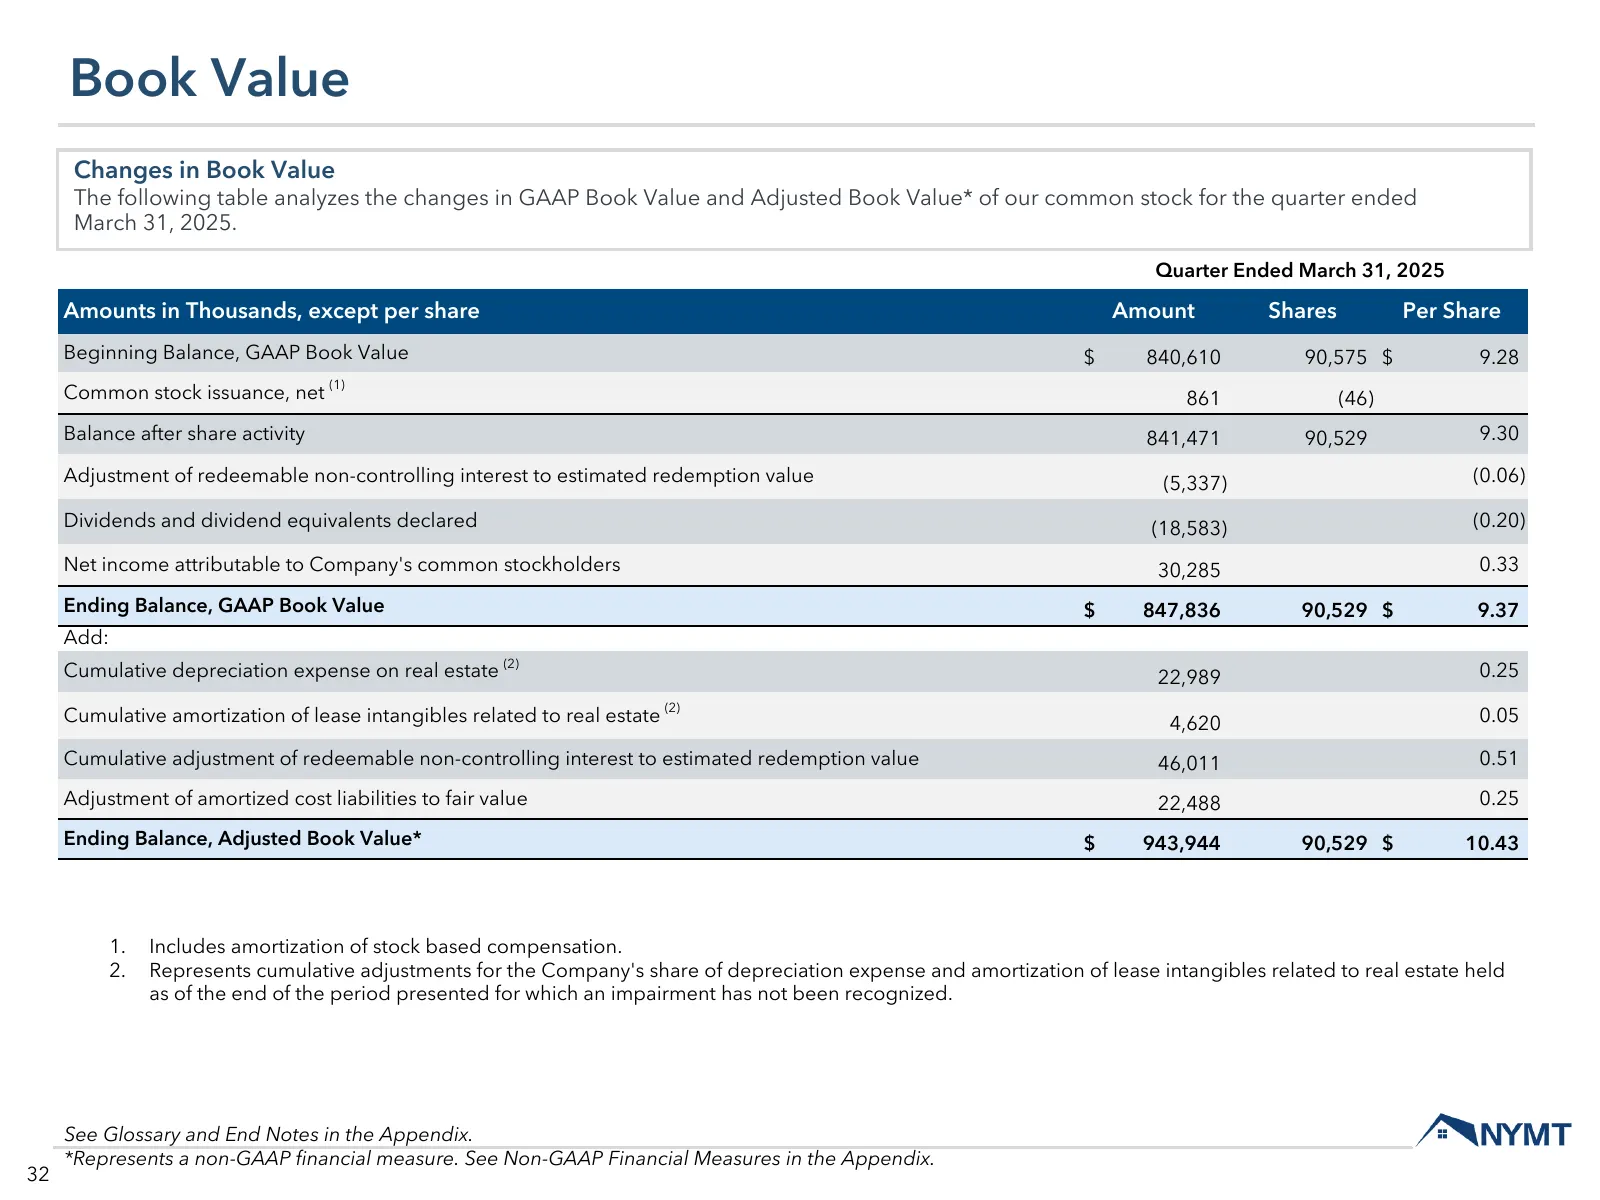
Book Value Changes in Book Value The following table analyzes the changes in GAAP Book Value and Adjusted Book Value* of our common stock for the quarter ended March 31, 2025. Quarter Ended March 31, 2025 Amounts in Thousands, except per share Amount Shares Per Share Beginning Balance, GAAP Book Val
Slide 33: Annual and Quarterly Returns
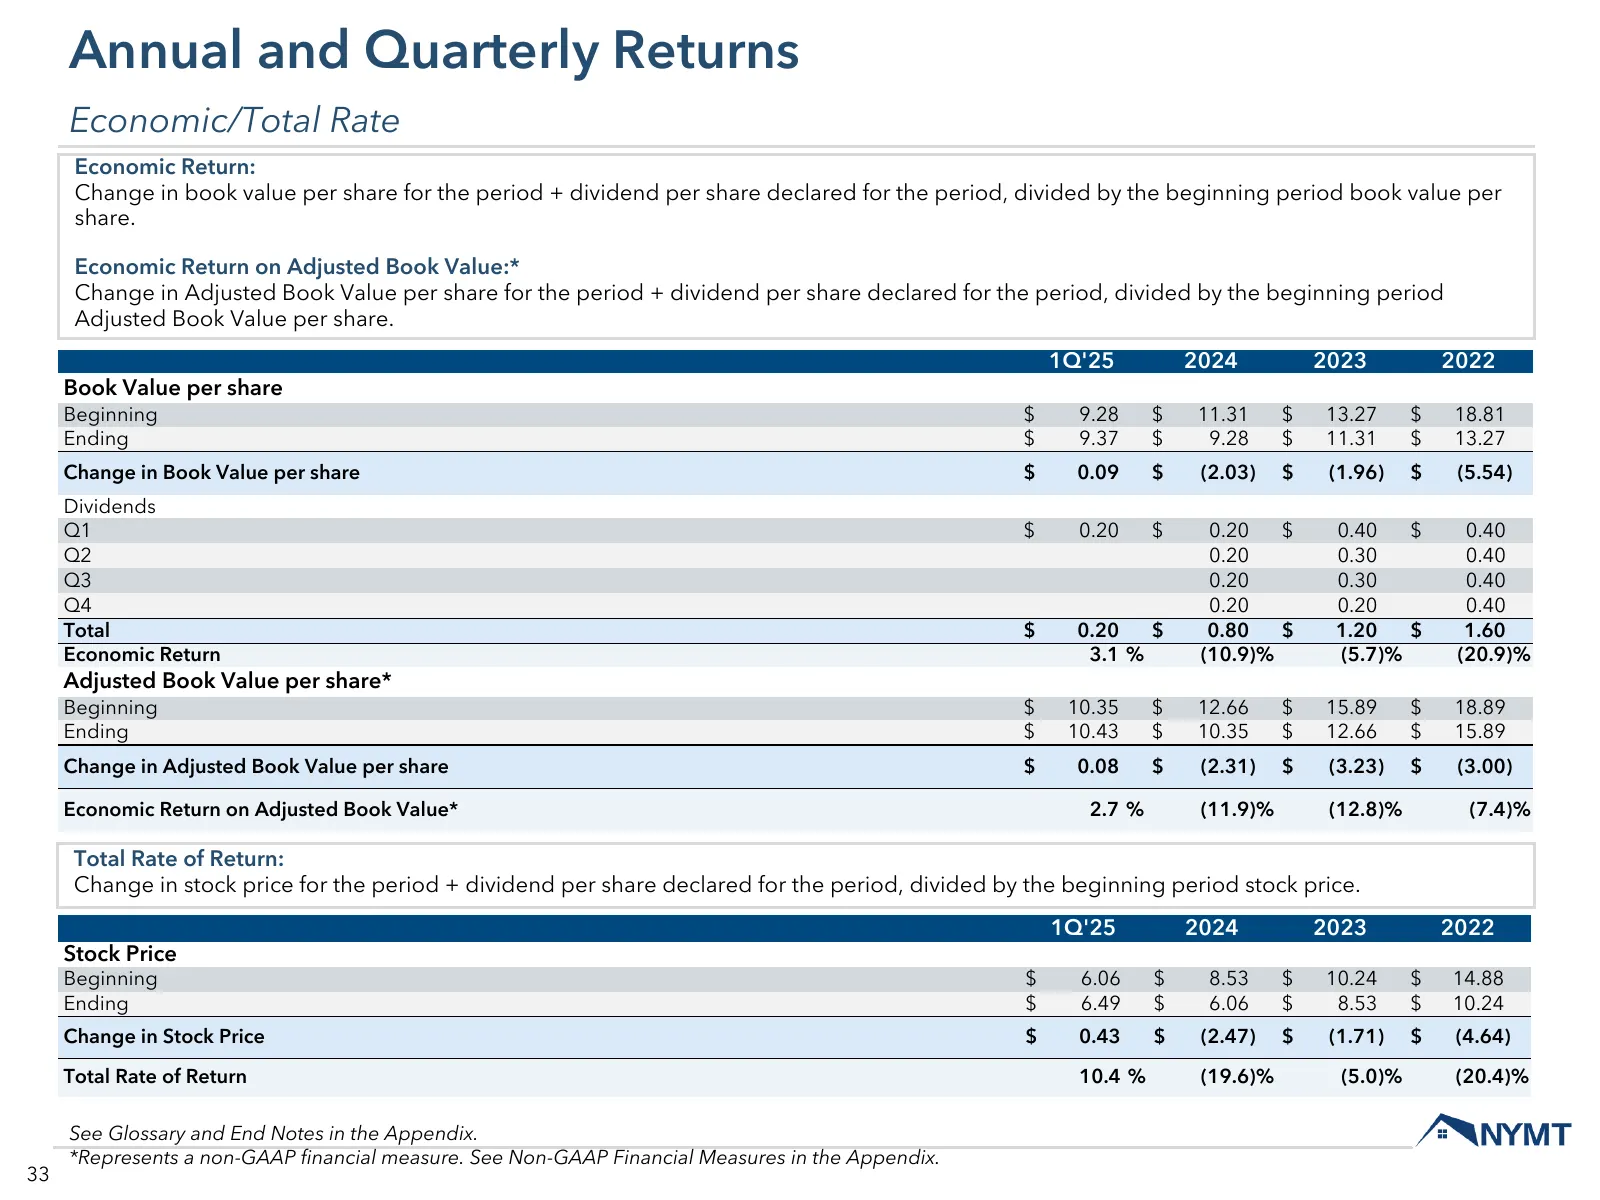
Annual and Quarterly Returns Economic/Total Rate Economic Return: Change in book value per share for the period + dividend per share declared for the period, divided by the beginning period book value per share. Economic Return on Adjusted Book Value:* Change in Adjusted Book Value per share for the

Slide 34: Appendix
Appendix 34
Slide 35: Non-GAAP Financial Measures
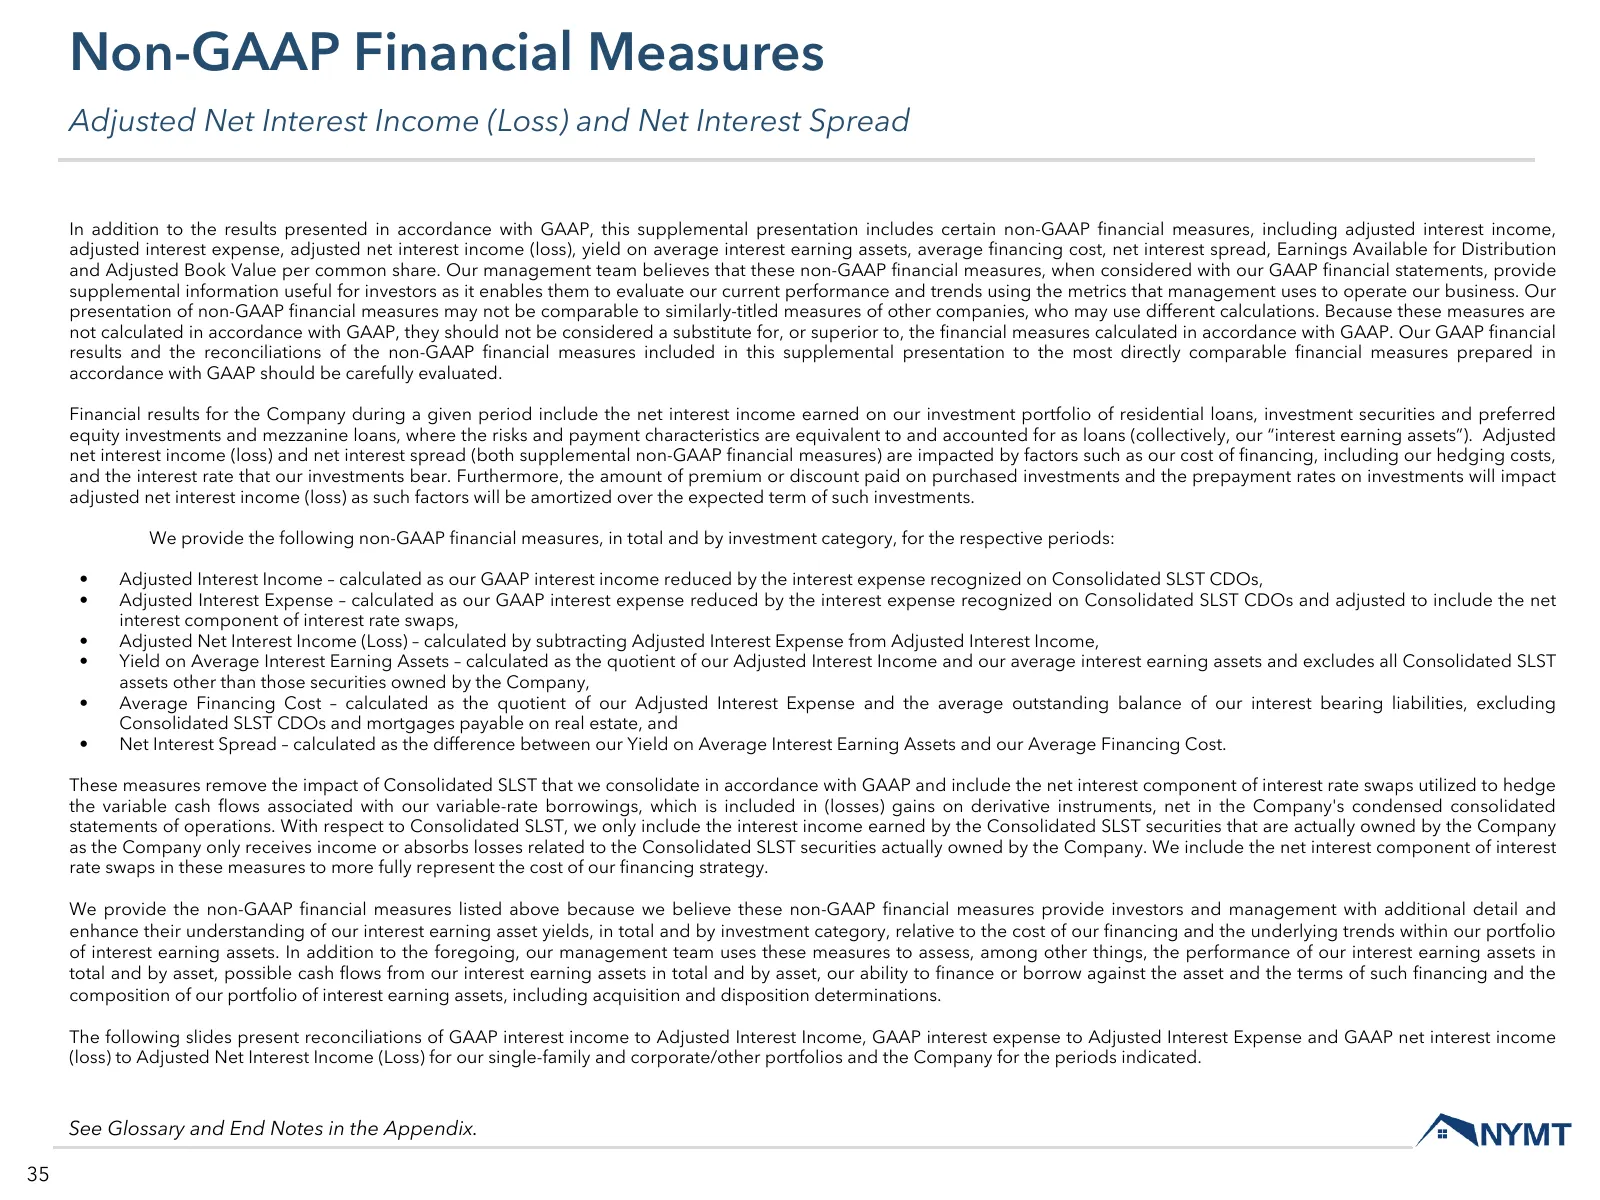
Non-GAAP Financial Measures Adjusted Net Interest Income (Loss) and Net Interest Spread In addition to the results presented in accordance with GAAP, this supplemental presentation includes certain non-GAAP financial measures, including adjusted interest income, adjusted interest expense, adjusted n
Slide 36: Non-GAAP Financial Measures
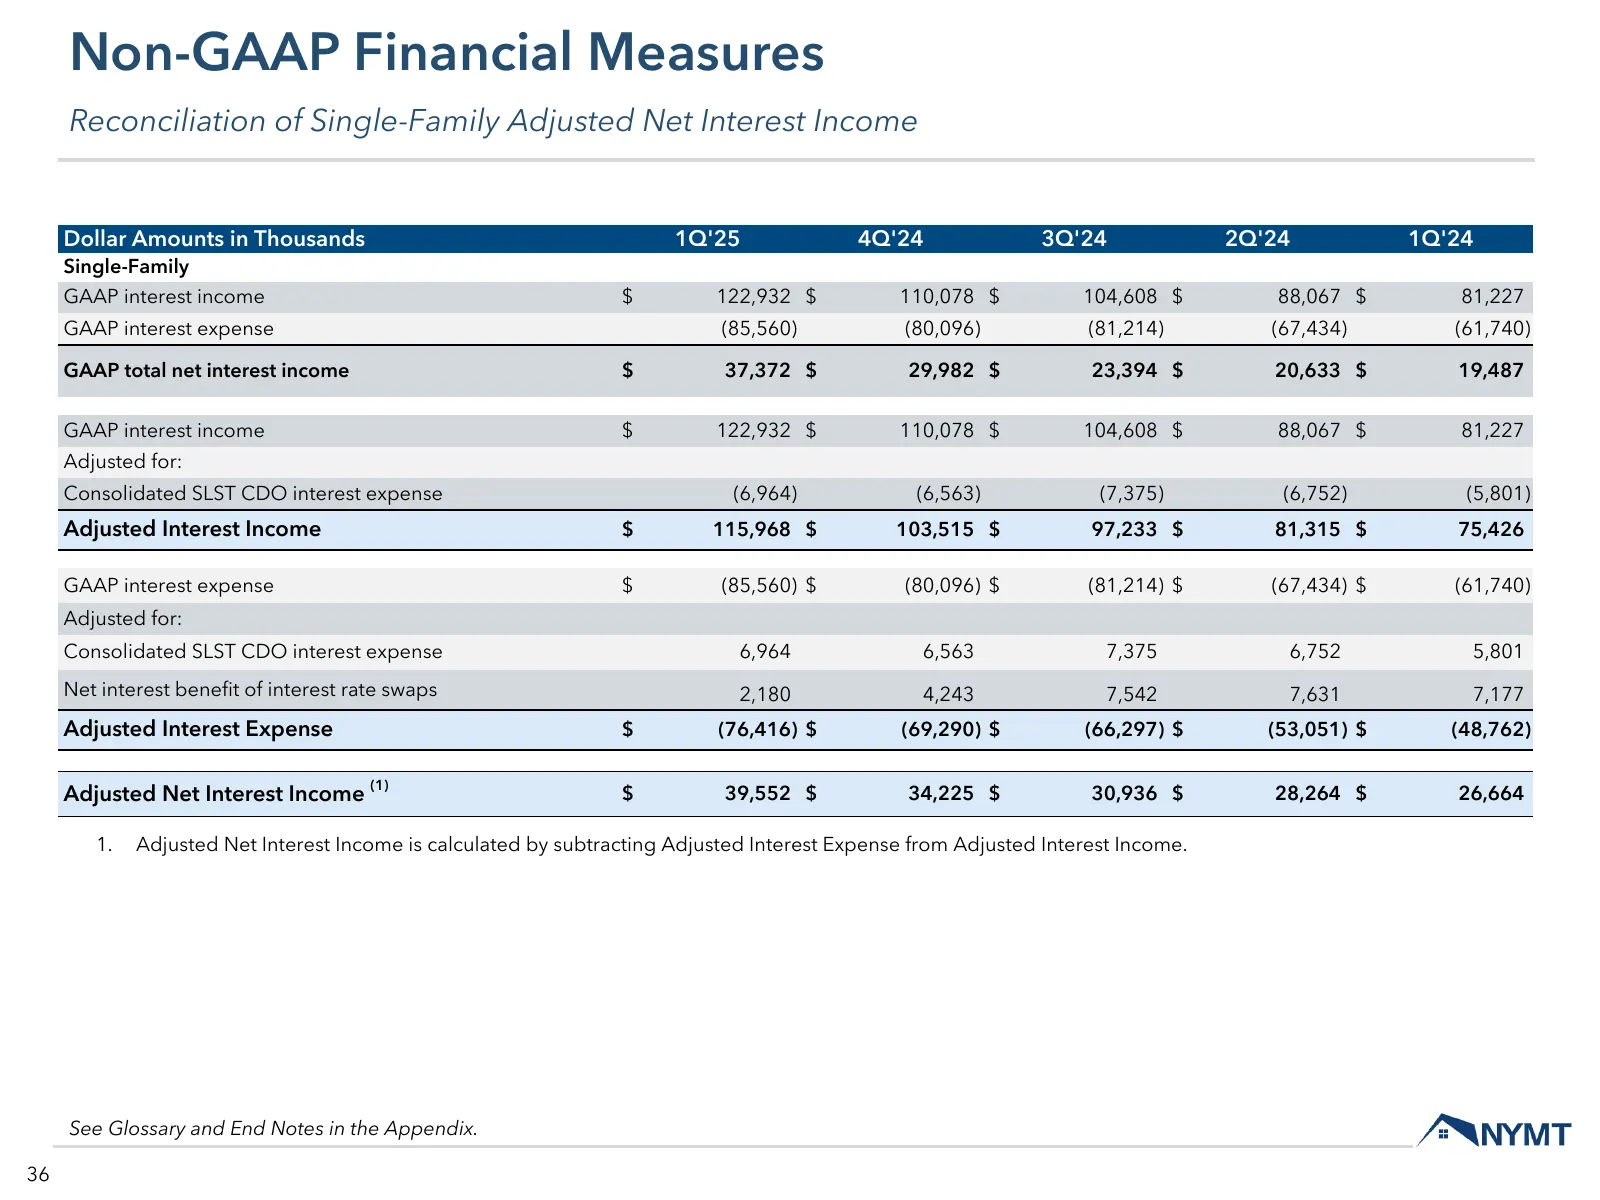
Non-GAAP Financial Measures Reconciliation of Single-Family Adjusted Net Interest Income Dollar Amounts in Thousands 1Q'25 4Q'24 3Q'24 2Q'24 1Q'24 Single-Family GAAP interest income $ 122,932 $ 110,078 $ 104,608 $ 88,067 $ 81,227 GAAP interest expense (85,560) (80,096) (81,214) (67,434) (61,740) GAA
Slide 37: Non-GAAP Financial Measures
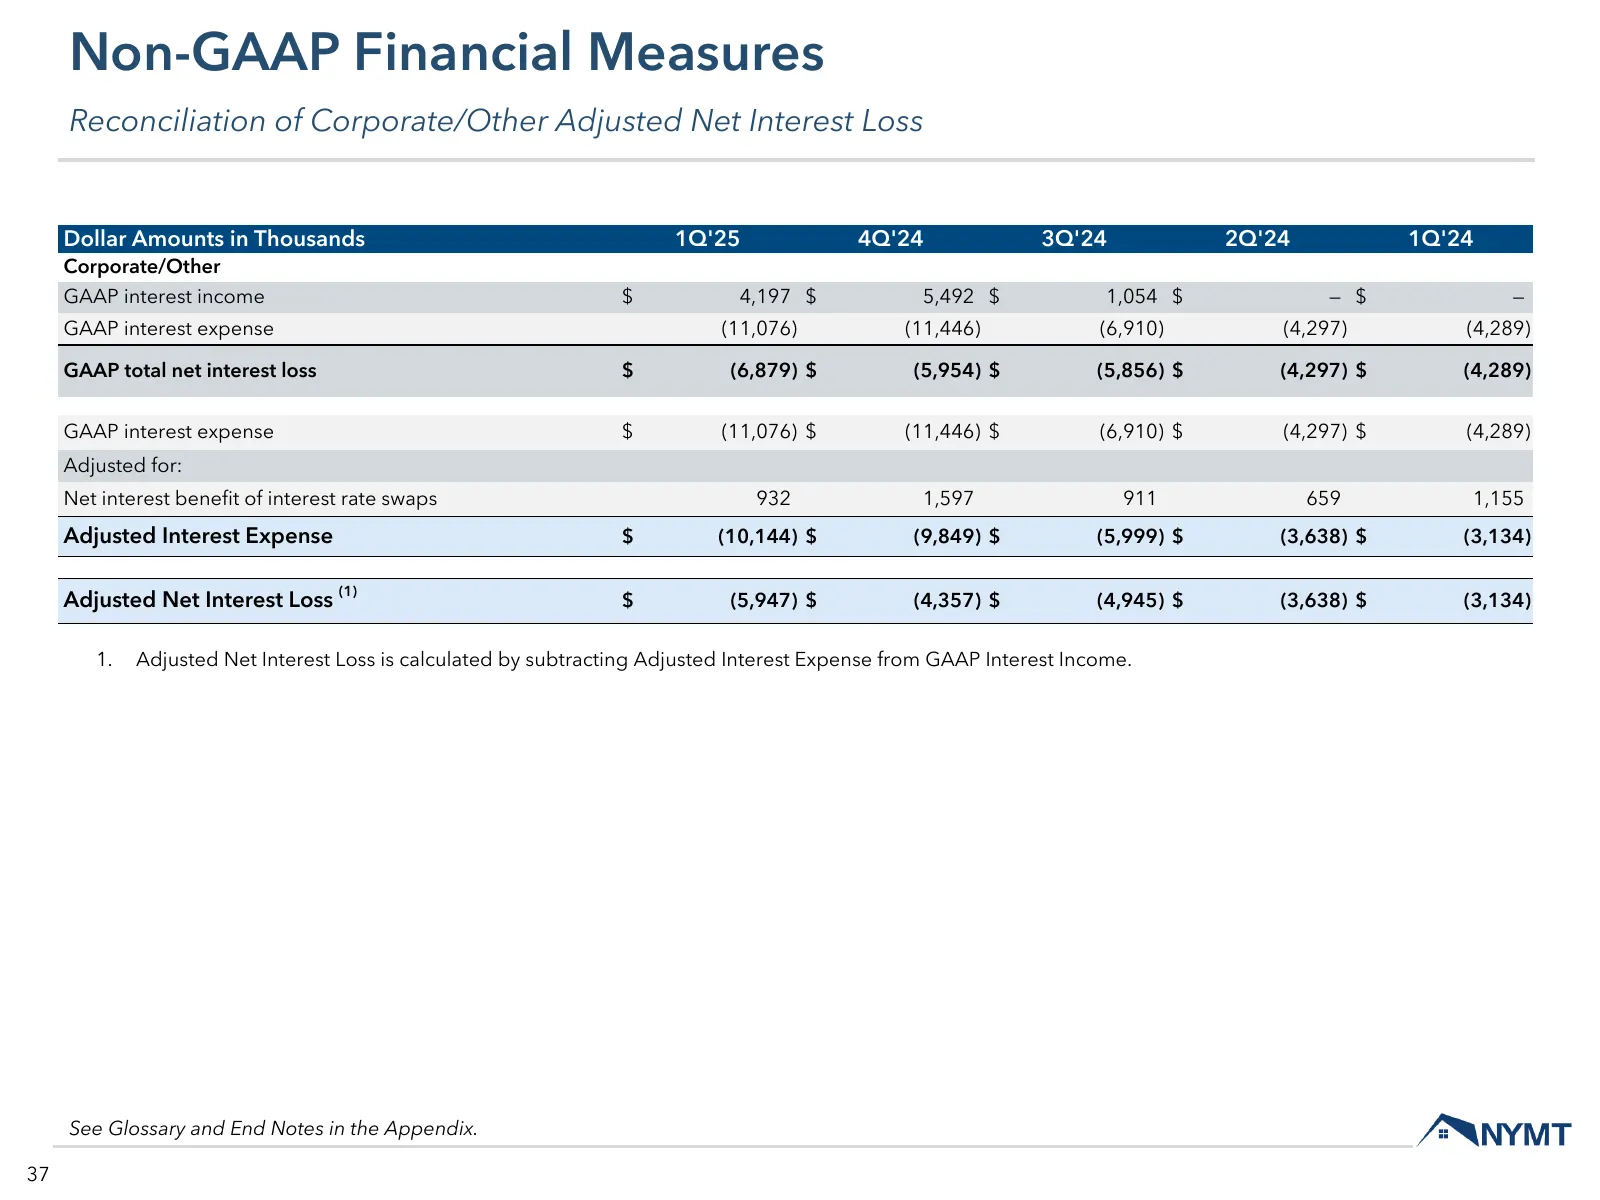
Non-GAAP Financial Measures Reconciliation of Corporate/Other Adjusted Net Interest Loss Dollar Amounts in Thousands 1Q'25 4Q'24 3Q'24 2Q'24 1Q'24 Corporate/Other GAAP interest income $ 4,197 $ 5,492 $ 1,054 $ — $ — GAAP interest expense (11,076) (11,446) (6,910) (4,297) (4,289) GAAP total net inter
Slide 38: Non-GAAP Financial Measures
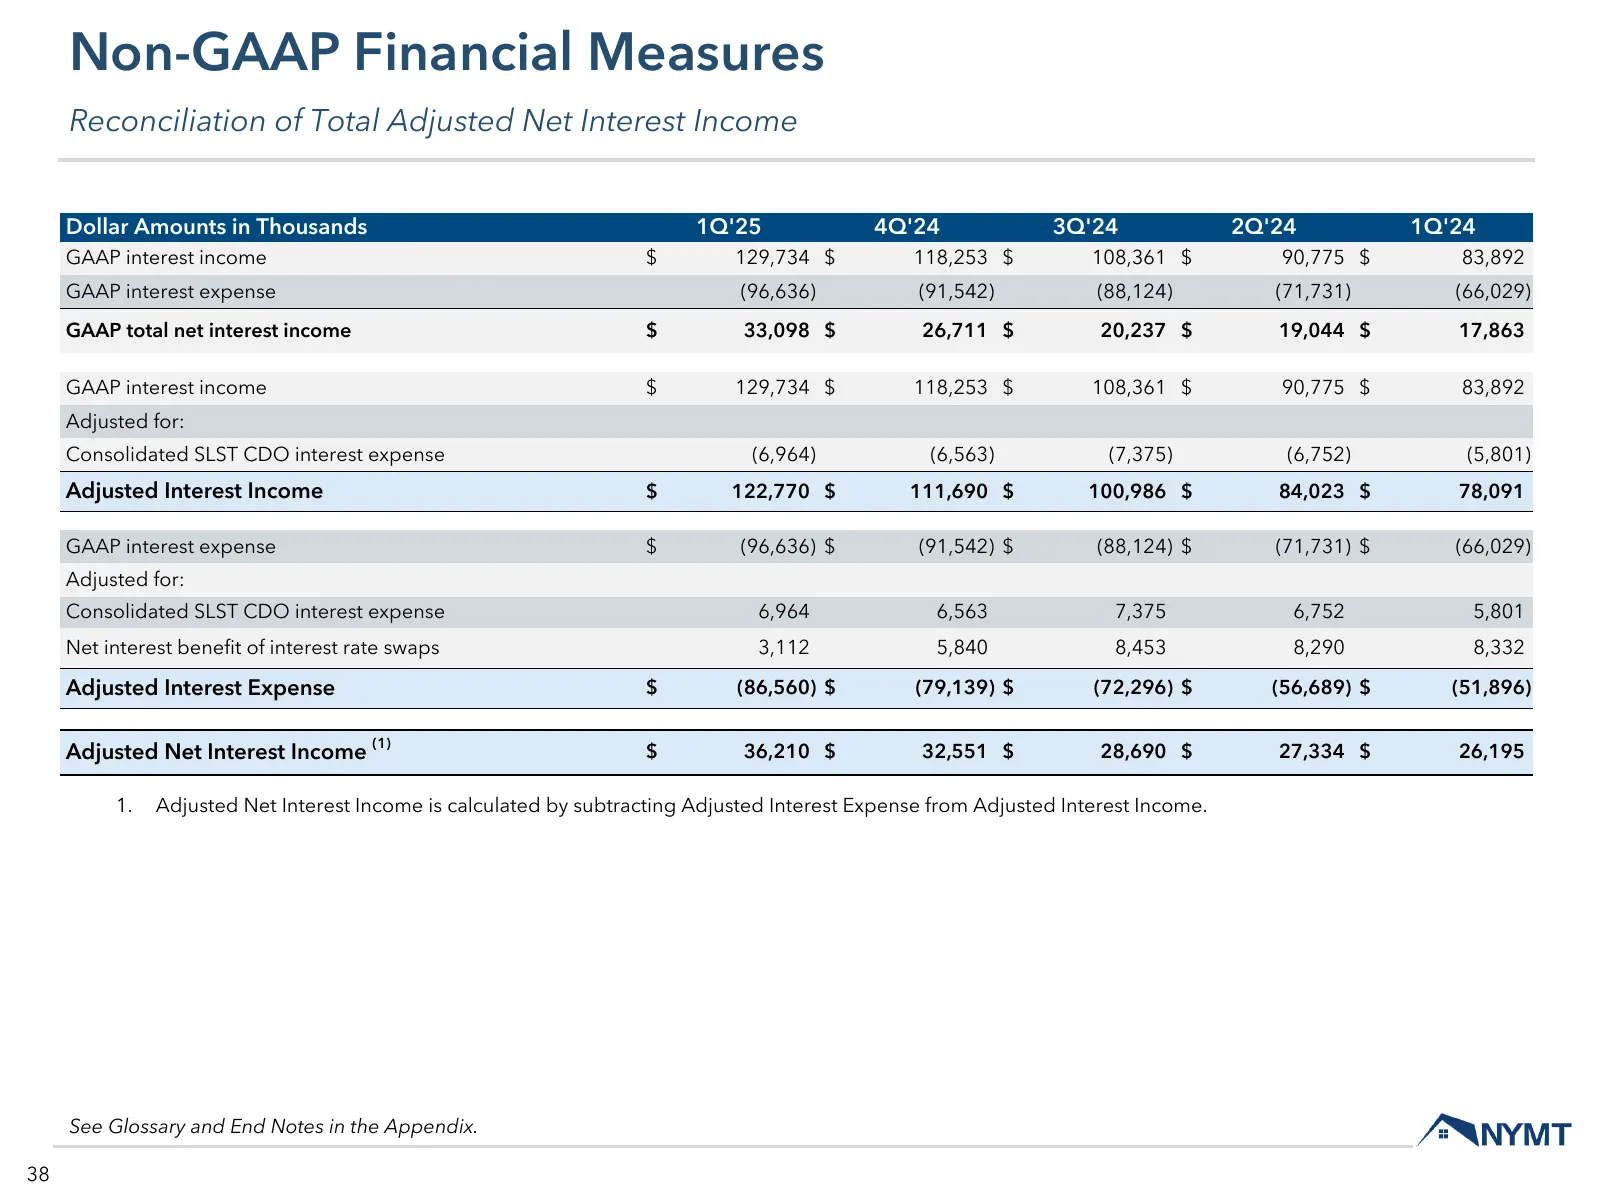
Non-GAAP Financial Measures Reconciliation of Total Adjusted Net Interest Income Dollar Amounts in Thousands 1Q'25 4Q'24 3Q'24 2Q'24 1Q'24 GAAP interest income $ 129,734 $ 118,253 $ 108,361 $ 90,775 $ 83,892 GAAP interest expense (96,636) (91,542) (88,124) (71,731) (66,029) GAAP total net interest i
Slide 39: Non-GAAP Financial Measures
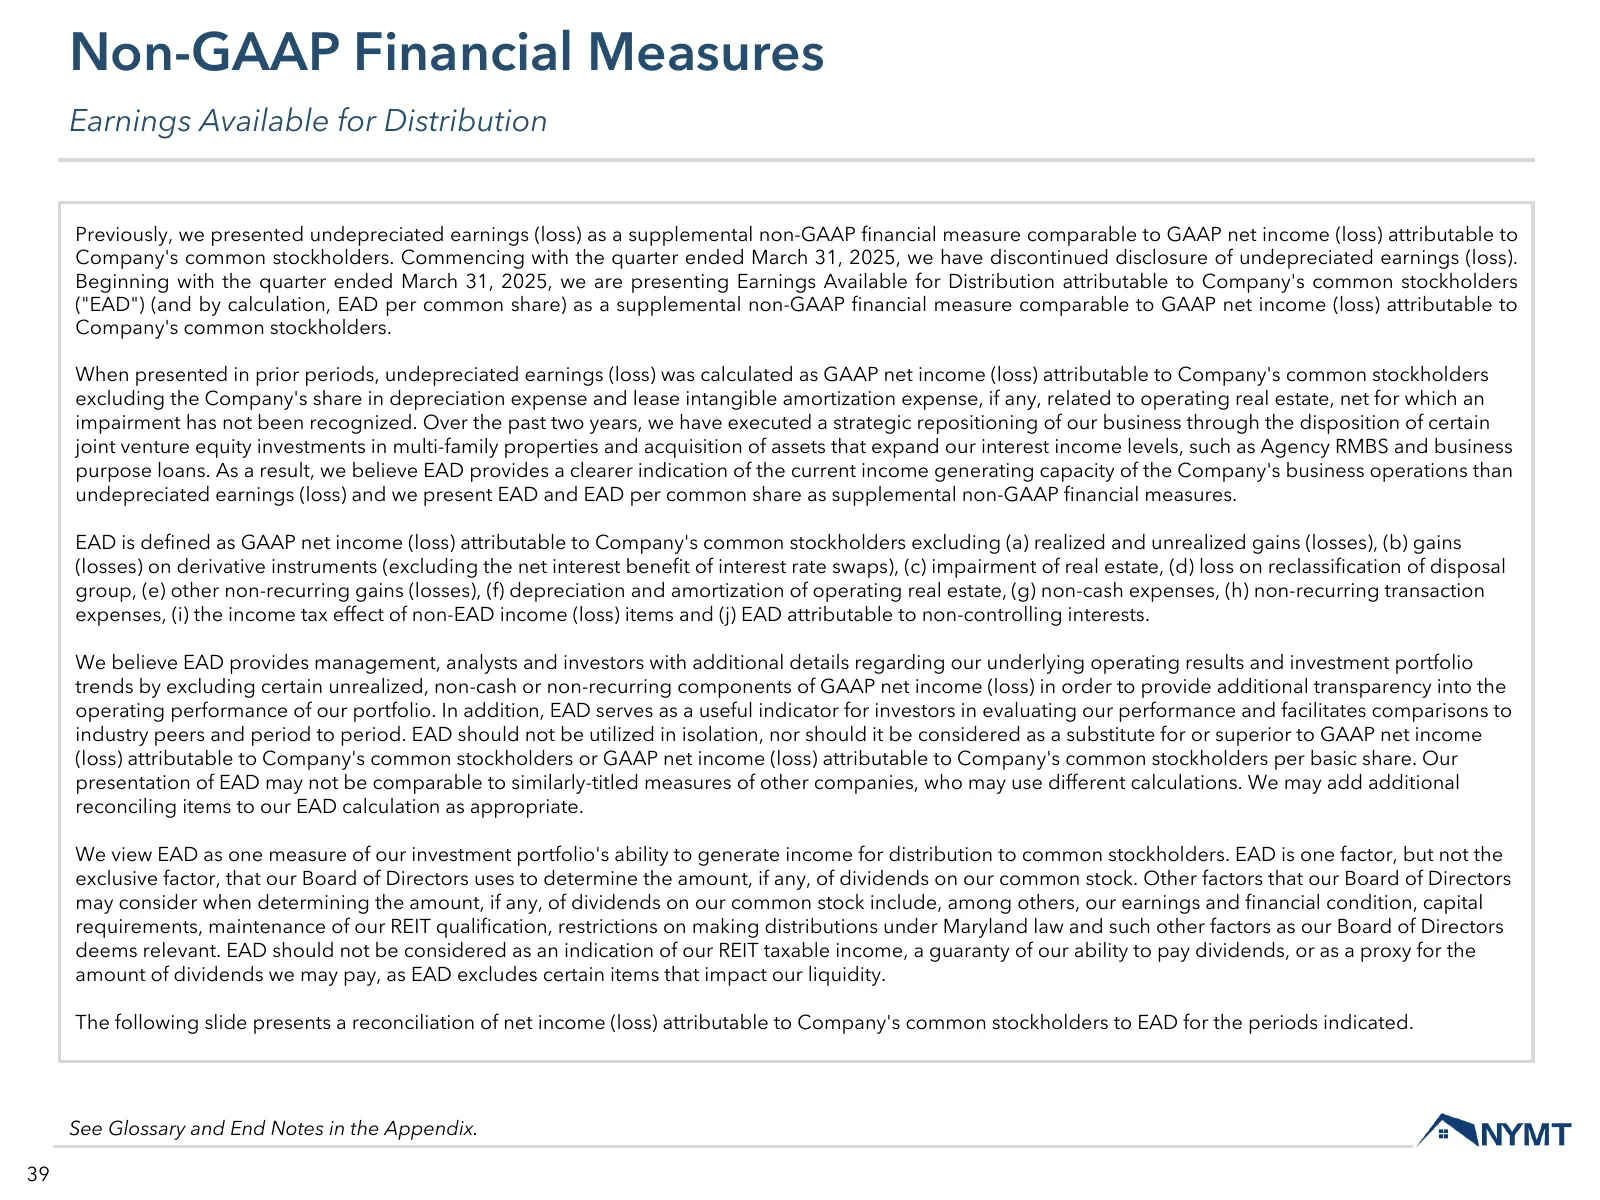
Non-GAAP Financial Measures Earnings Available for Distribution Previously, we presented undepreciated earnings (loss) as a supplemental non-GAAP financial measure comparable to GAAP net income (loss) attributable to Company's common stockholders. Commencing with the quarter ended March 31, 2025, we
Slide 40: Non-GAAP Financial Measures
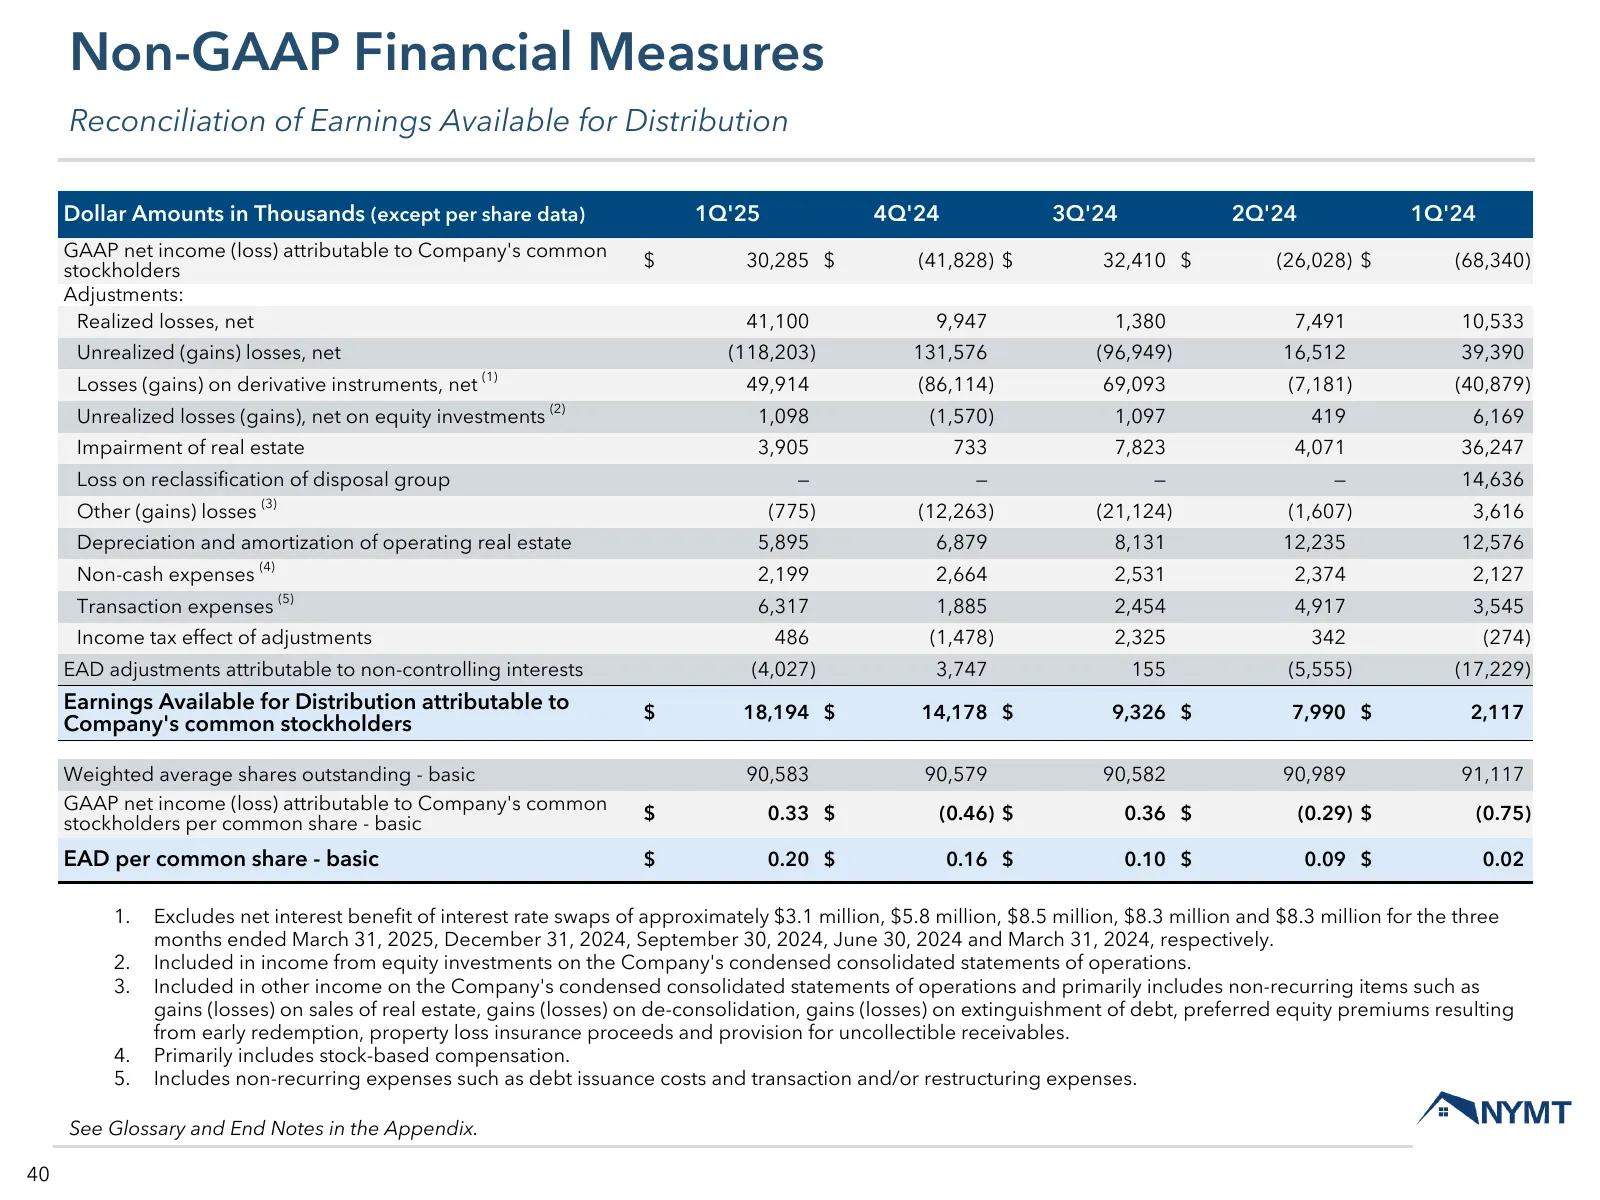
Non-GAAP Financial Measures Reconciliation of Earnings Available for Distribution Dollar Amounts in Thousands (except per share data) 1Q'25 4Q'24 3Q'24 2Q'24 1Q'24 GAAP net income (loss) attributable to Company's common $ 30,285 $ (41,828) $ 32,410 $ (26,028) $ (68,340) stockholders Adjustments: Rea
Slide 41: Non-GAAP Financial Measures
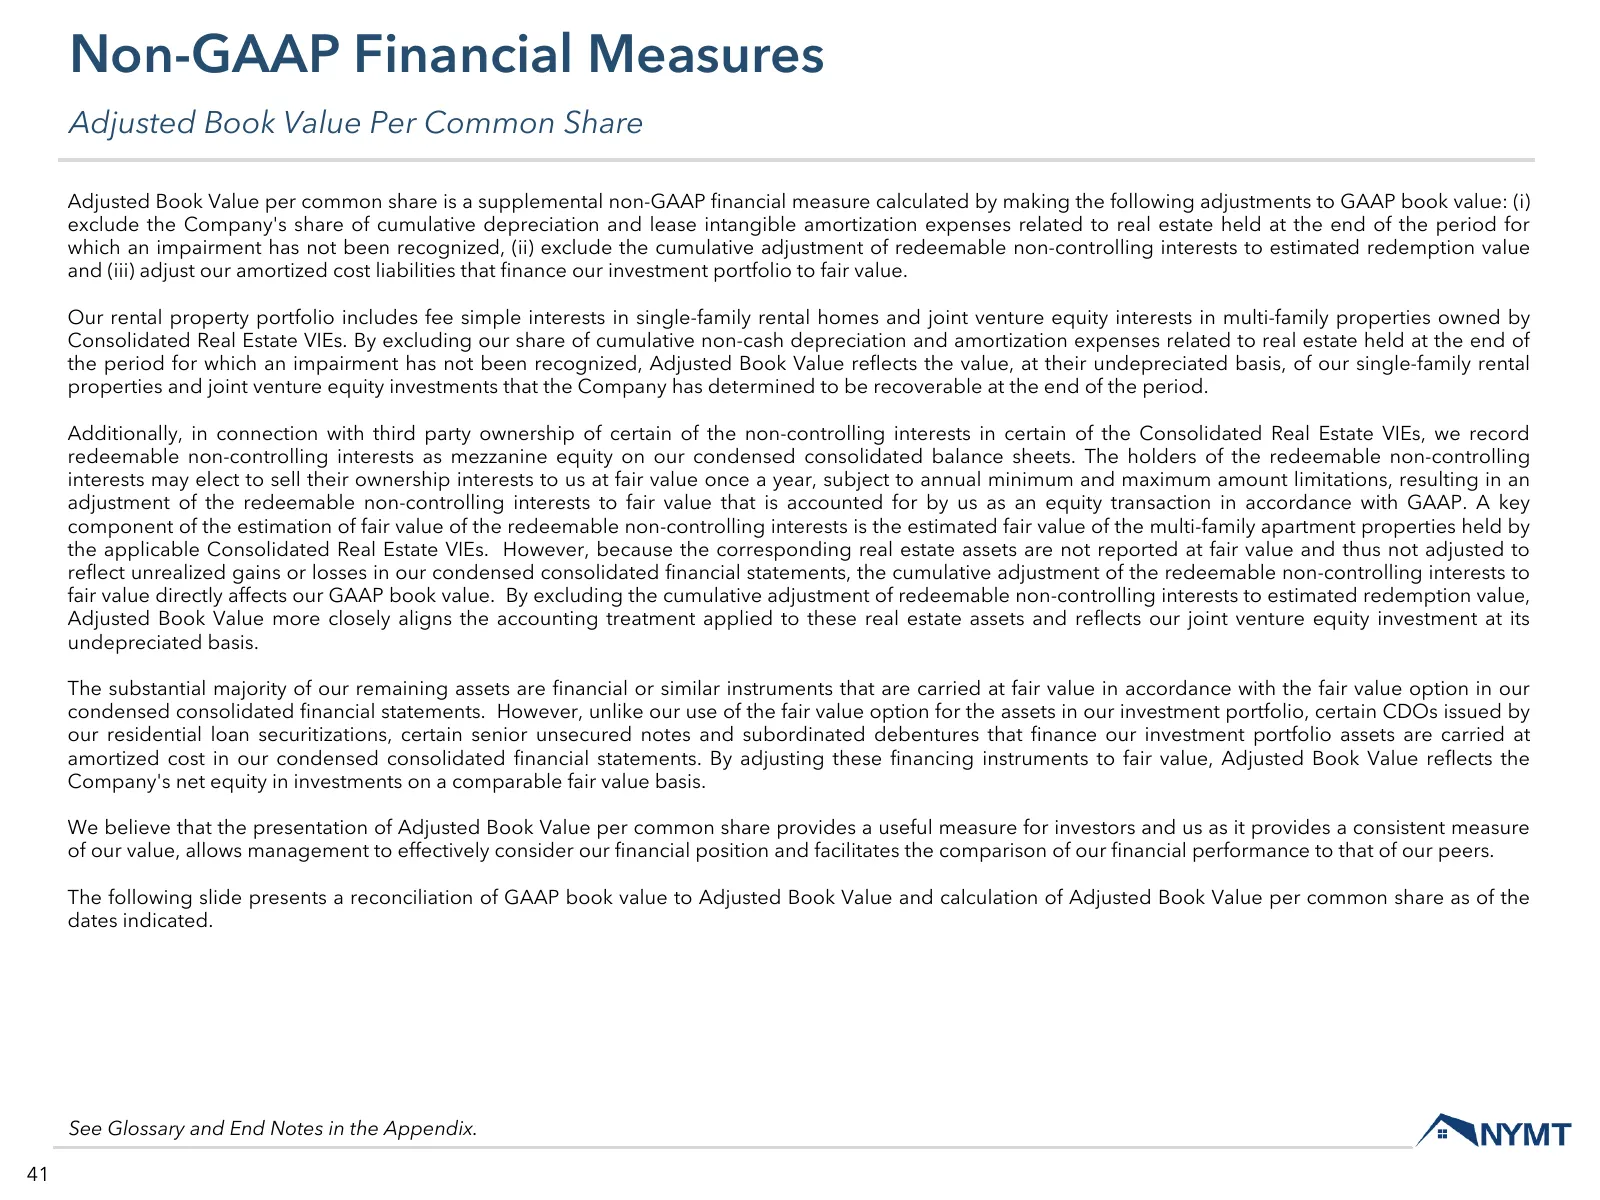
Non-GAAP Financial Measures Adjusted Book Value Per Common Share Adjusted Book Value per common share is a supplemental non-GAAP financial measure calculated by making the following adjustments to GAAP book value: (i) exclude the Company's share of cumulative depreciation and lease intangible amorti
Slide 42: Non-GAAP Financial Measures
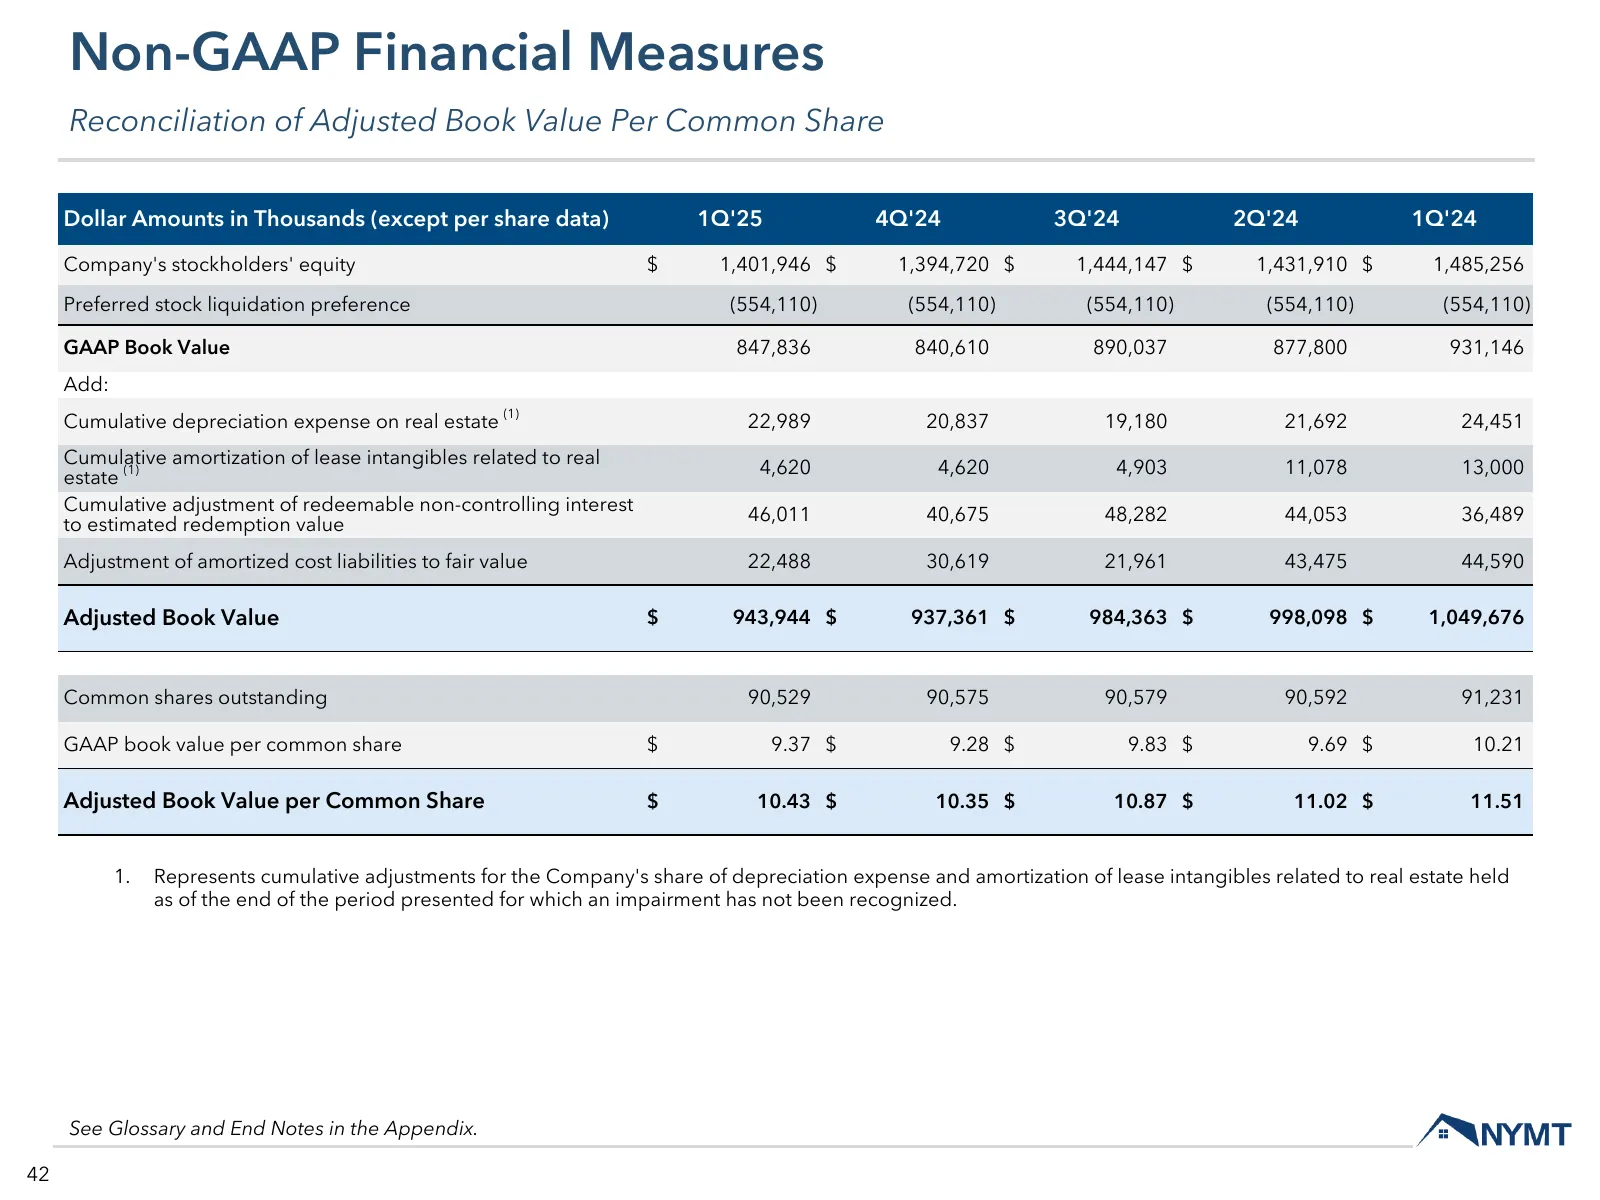
Non-GAAP Financial Measures Reconciliation of Adjusted Book Value Per Common Share Dollar Amounts in Thousands (except per share data) 1Q'25 4Q'24 3Q'24 2Q'24 1Q'24 Company's stockholders' equity $ 1,401,946 $ 1,394,720 $ 1,444,147 $ 1,431,910 $ 1,485,256 Preferred stock liquidation preference (554,
Slide 43: Glossary
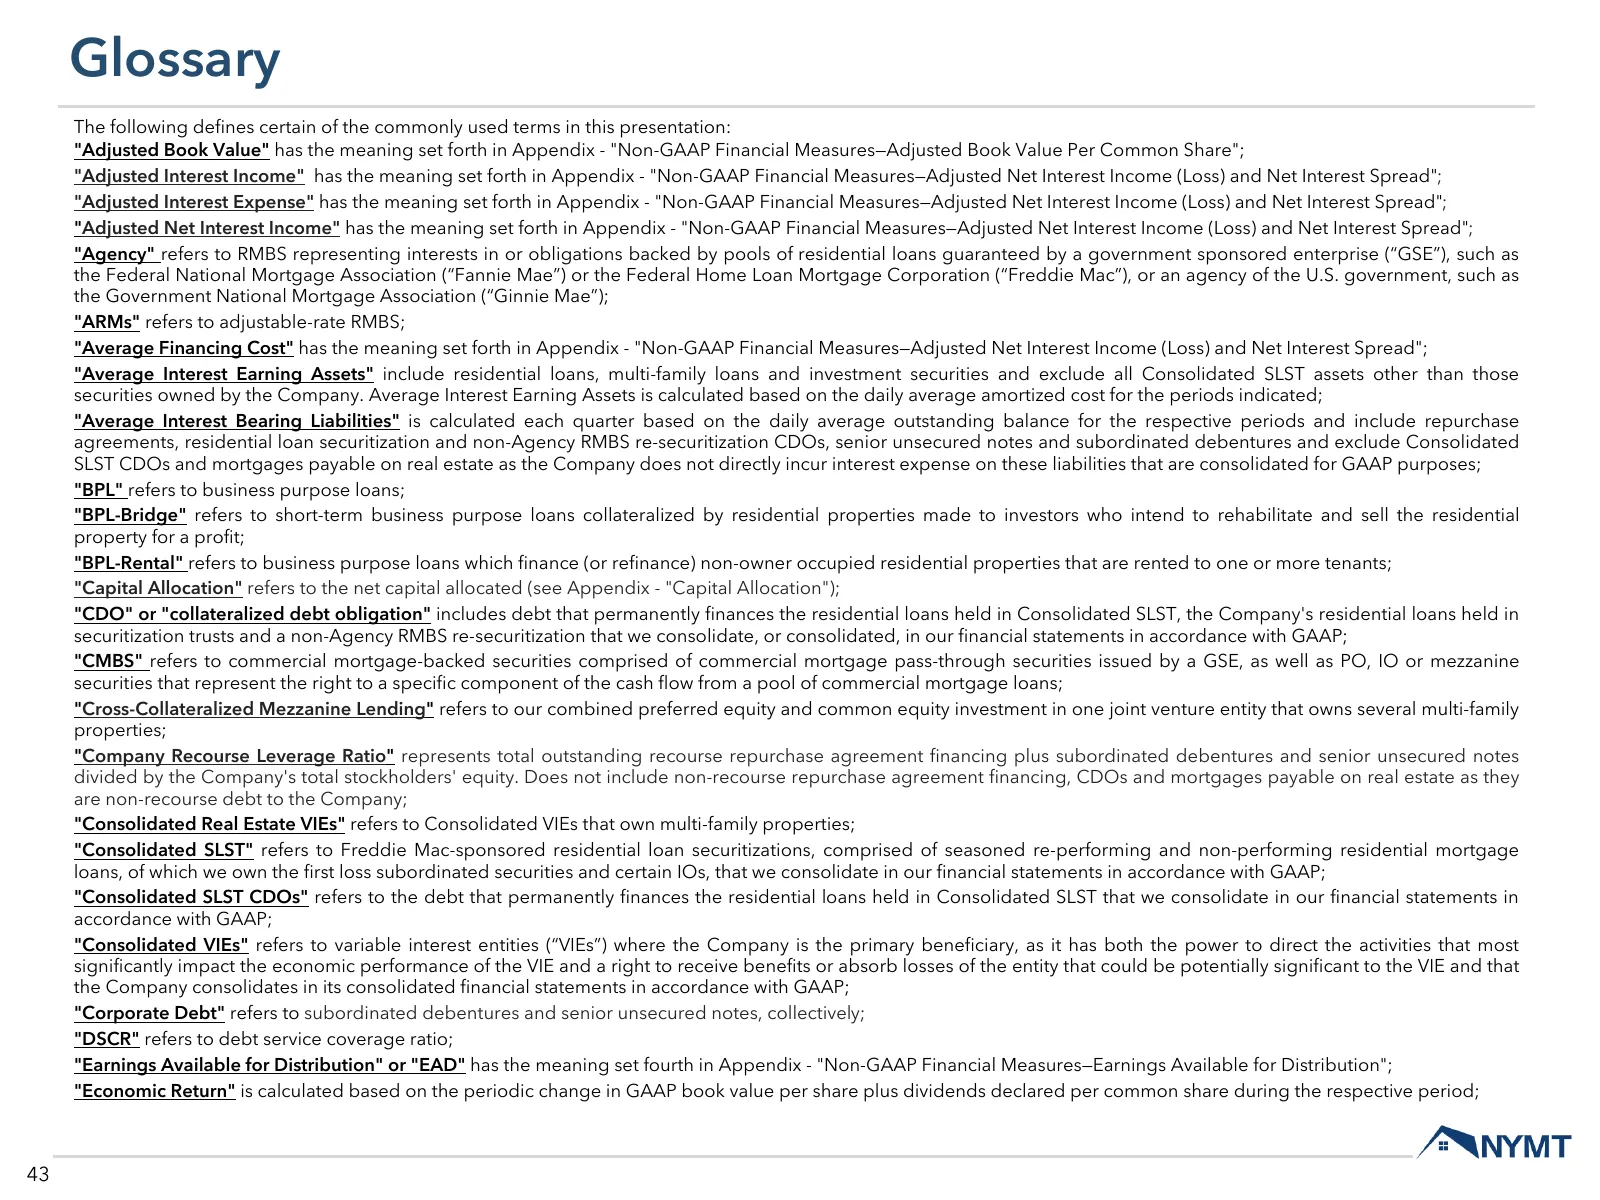
Glossary The following defines certain of the commonly used terms in this presentation: "Adjusted Book Value" has the meaning set forth in Appendix - "Non-GAAP Financial Measures—Adjusted Book Value Per Common Share"; "Adjusted Interest Income" has the meaning set forth in Appendix - "Non-GAAP Finan
Slide 44: Glossary
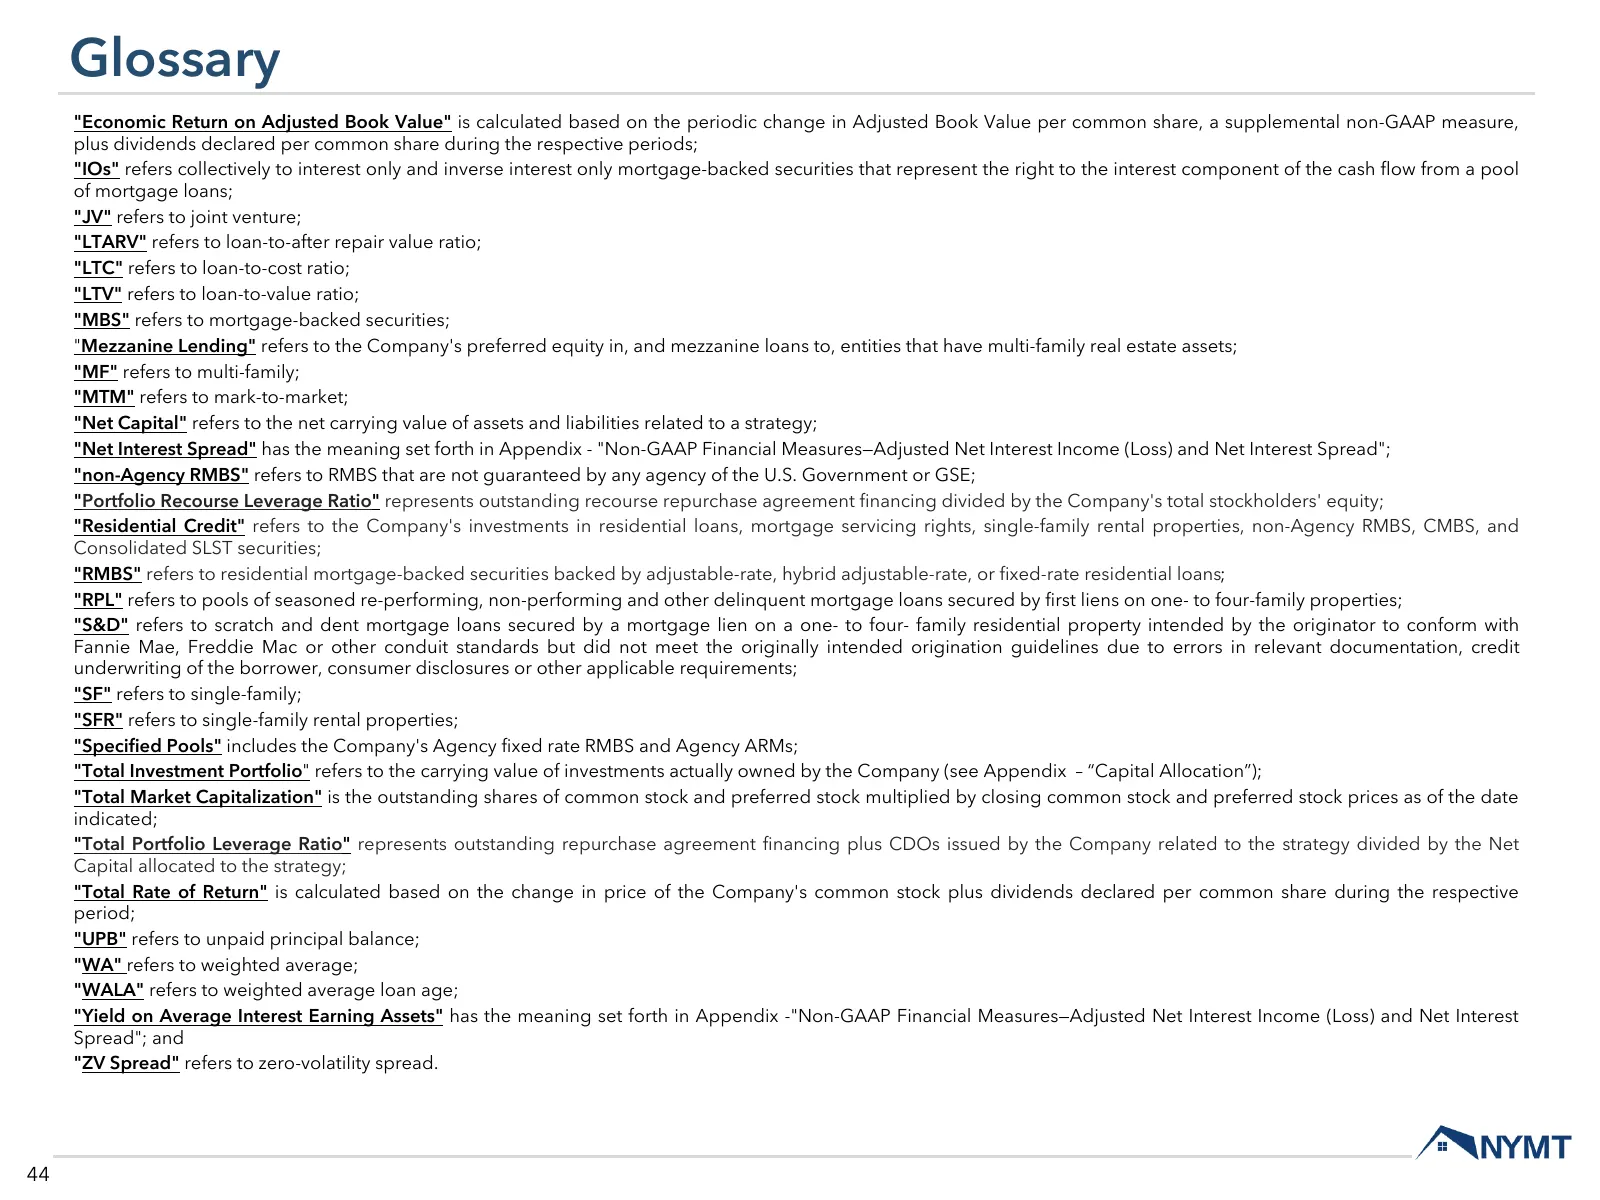
Glossary "Economic Return on Adjusted Book Value" is calculated based on the periodic change in Adjusted Book Value per common share, a supplemental non-GAAP measure, plus dividends declared per common share during the respective periods; "IOs" refers collectively to interest only and inverse intere
Slide 45: End Notes
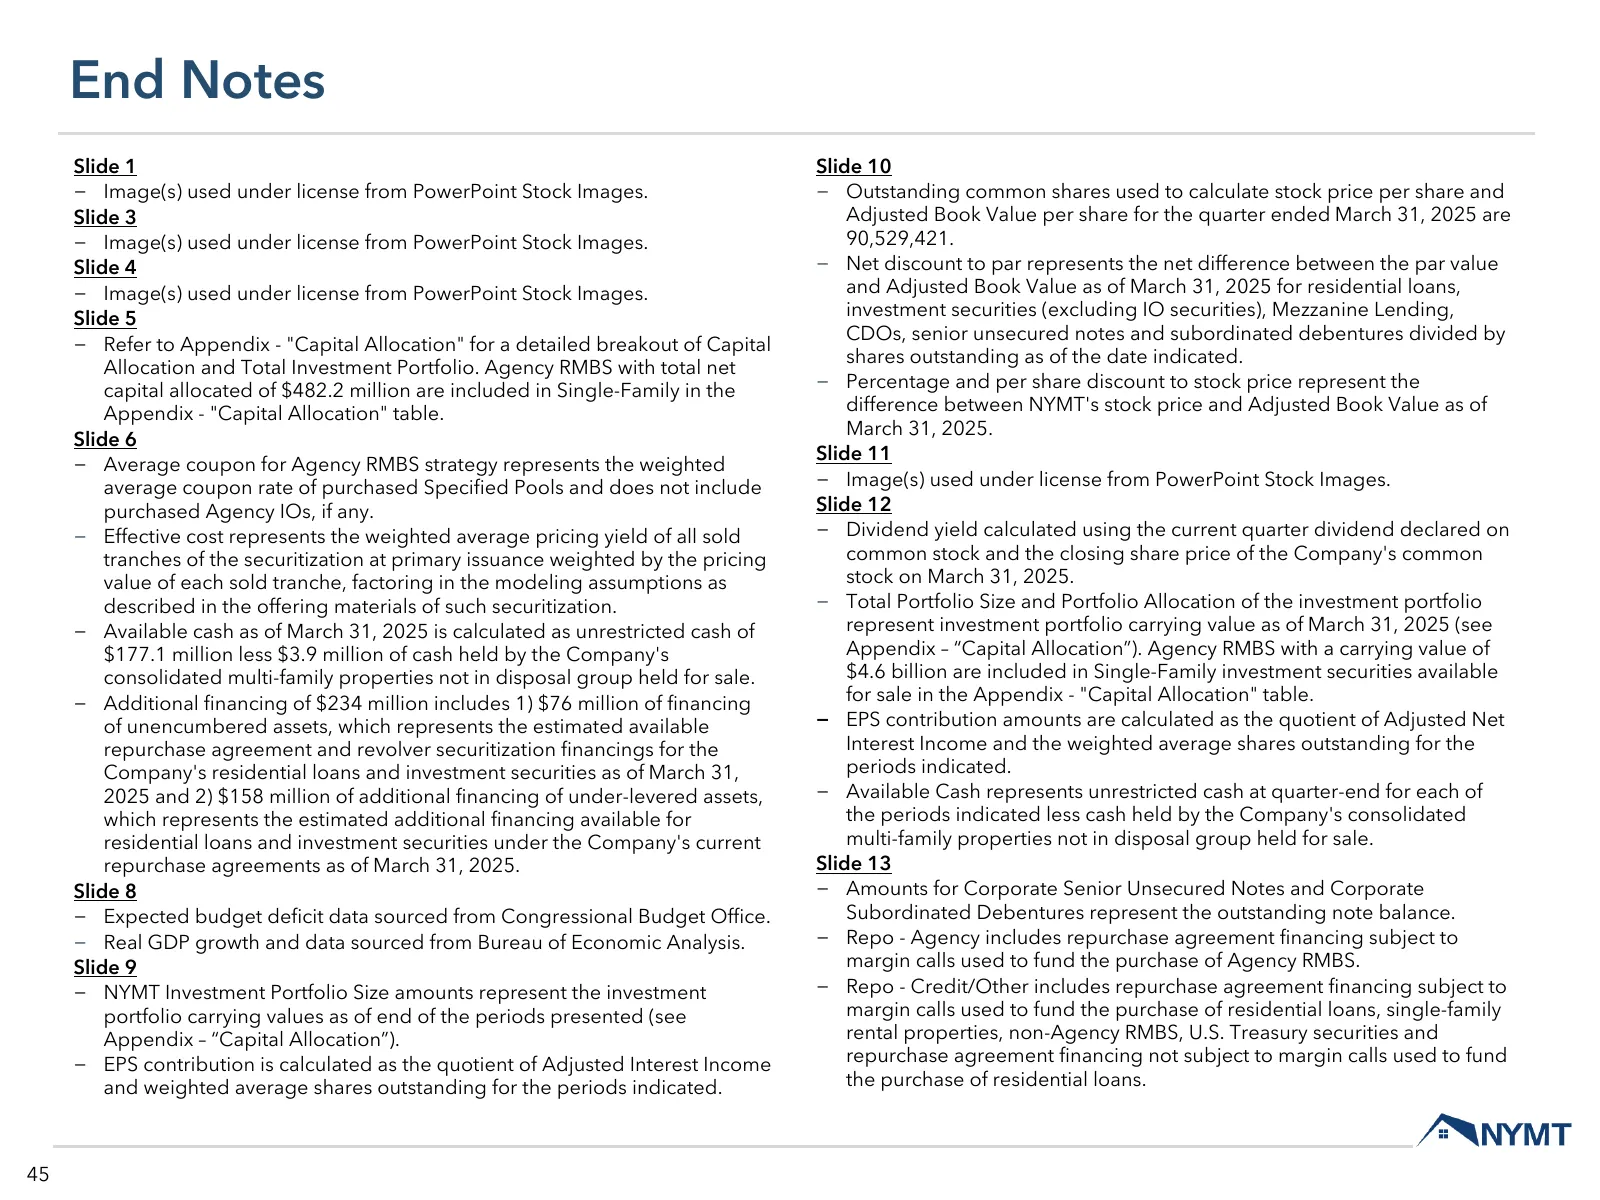
End Notes Slide 1 Slide 10 − Image(s) used under license from PowerPoint Stock Images. − Outstanding common shares used to calculate stock price per share and Slide 3 Adjusted Book Value per share for the quarter ended March 31, 2025 are − Image(s) used under license from PowerPoint Stock Images. 90
Slide 46: End Notes
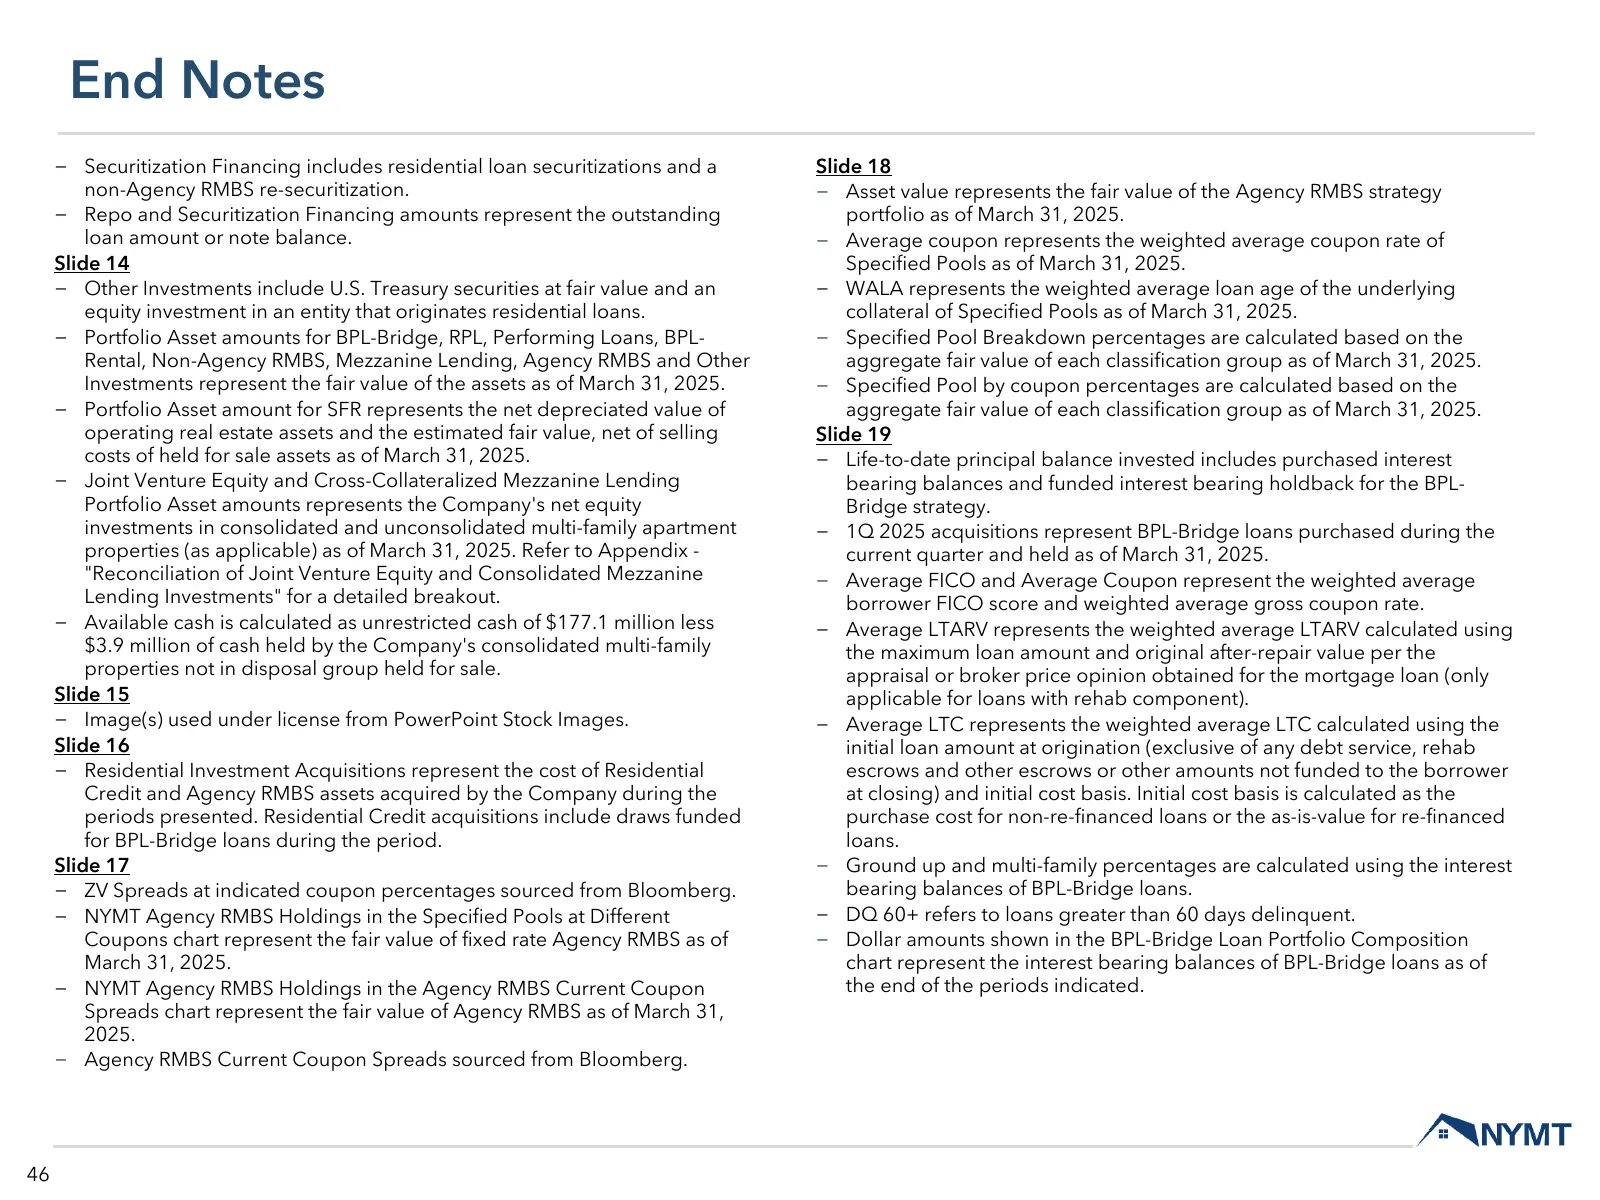
End Notes − Securitization Financing includes residential loan securitizations and a Slide 18 non-Agency RMBS re-securitization. − Asset value represents the fair value of the Agency RMBS strategy − Repo and Securitization Financing amounts represent the outstanding portfolio as of March 31, 2025. l
Slide 47: End Notes
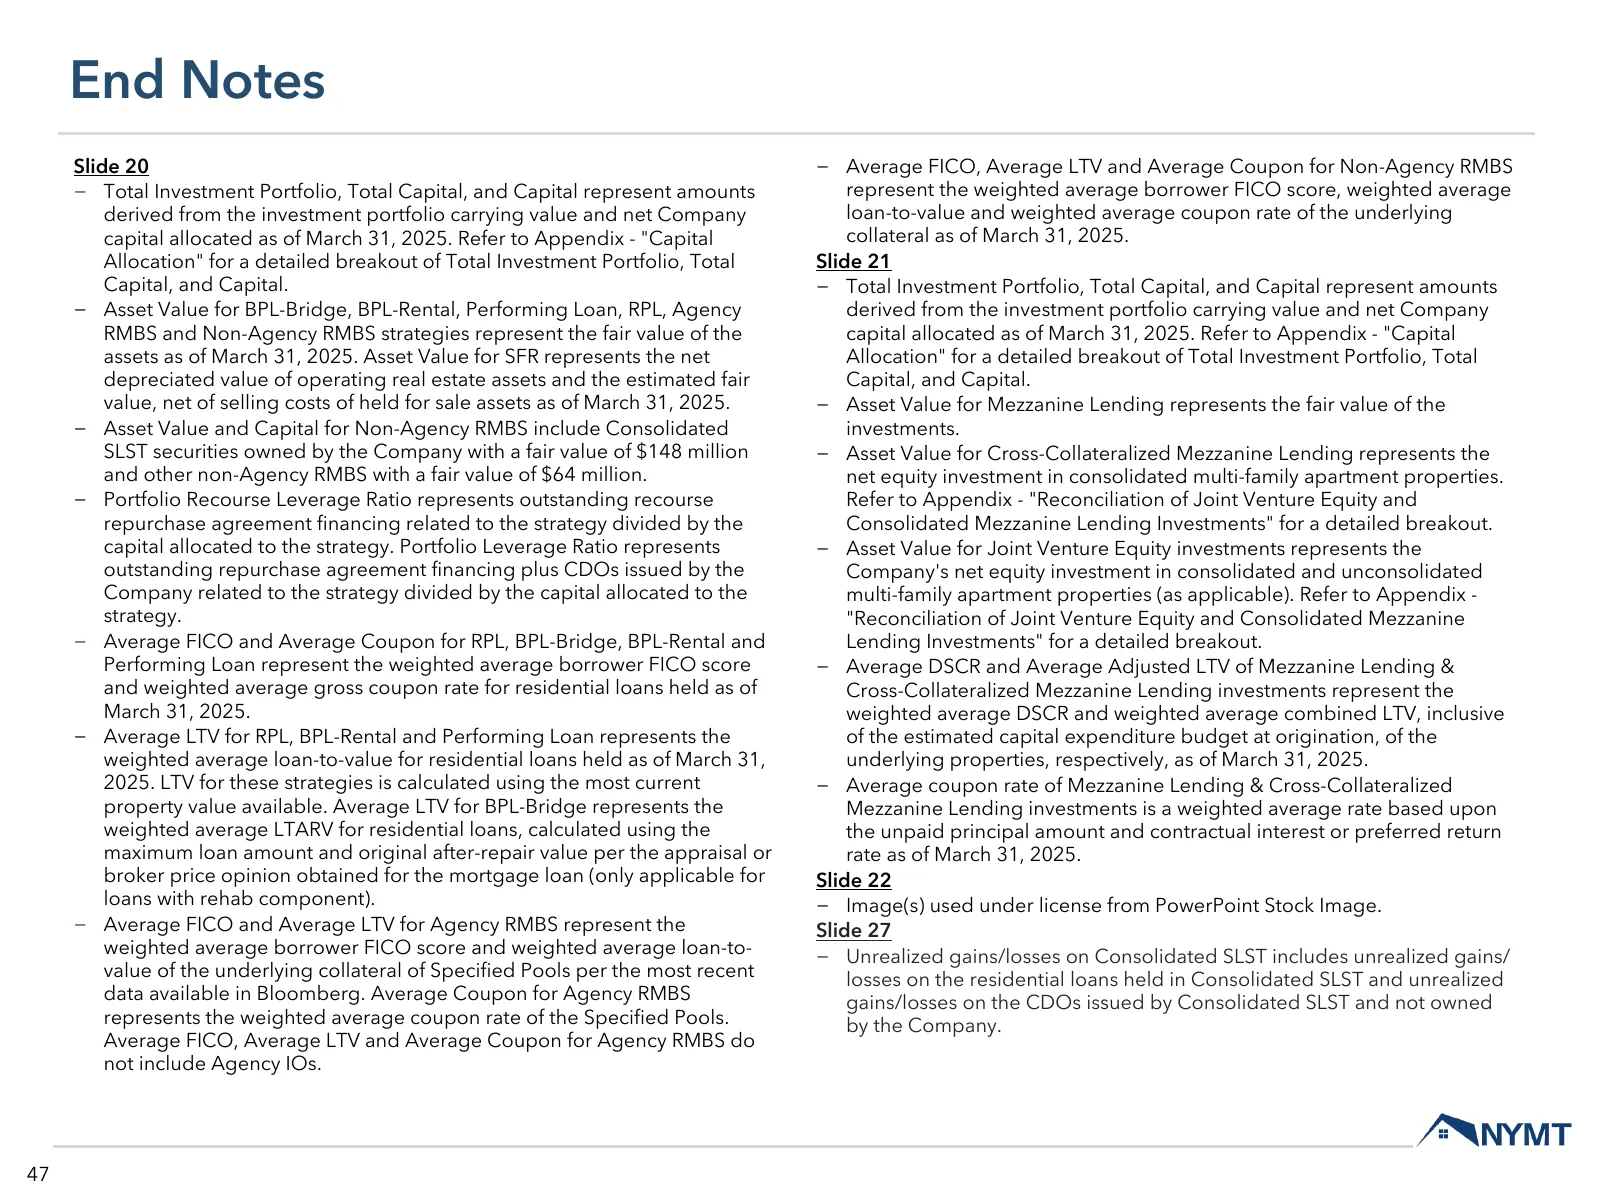
End Notes Slide 20 − Average FICO, Average LTV and Average Coupon for Non-Agency RMBS − Total Investment Portfolio, Total Capital, and Capital represent amounts represent the weighted average borrower FICO score, weighted average derived from the investment portfolio carrying value and net Company l
Slide 48: End Notes
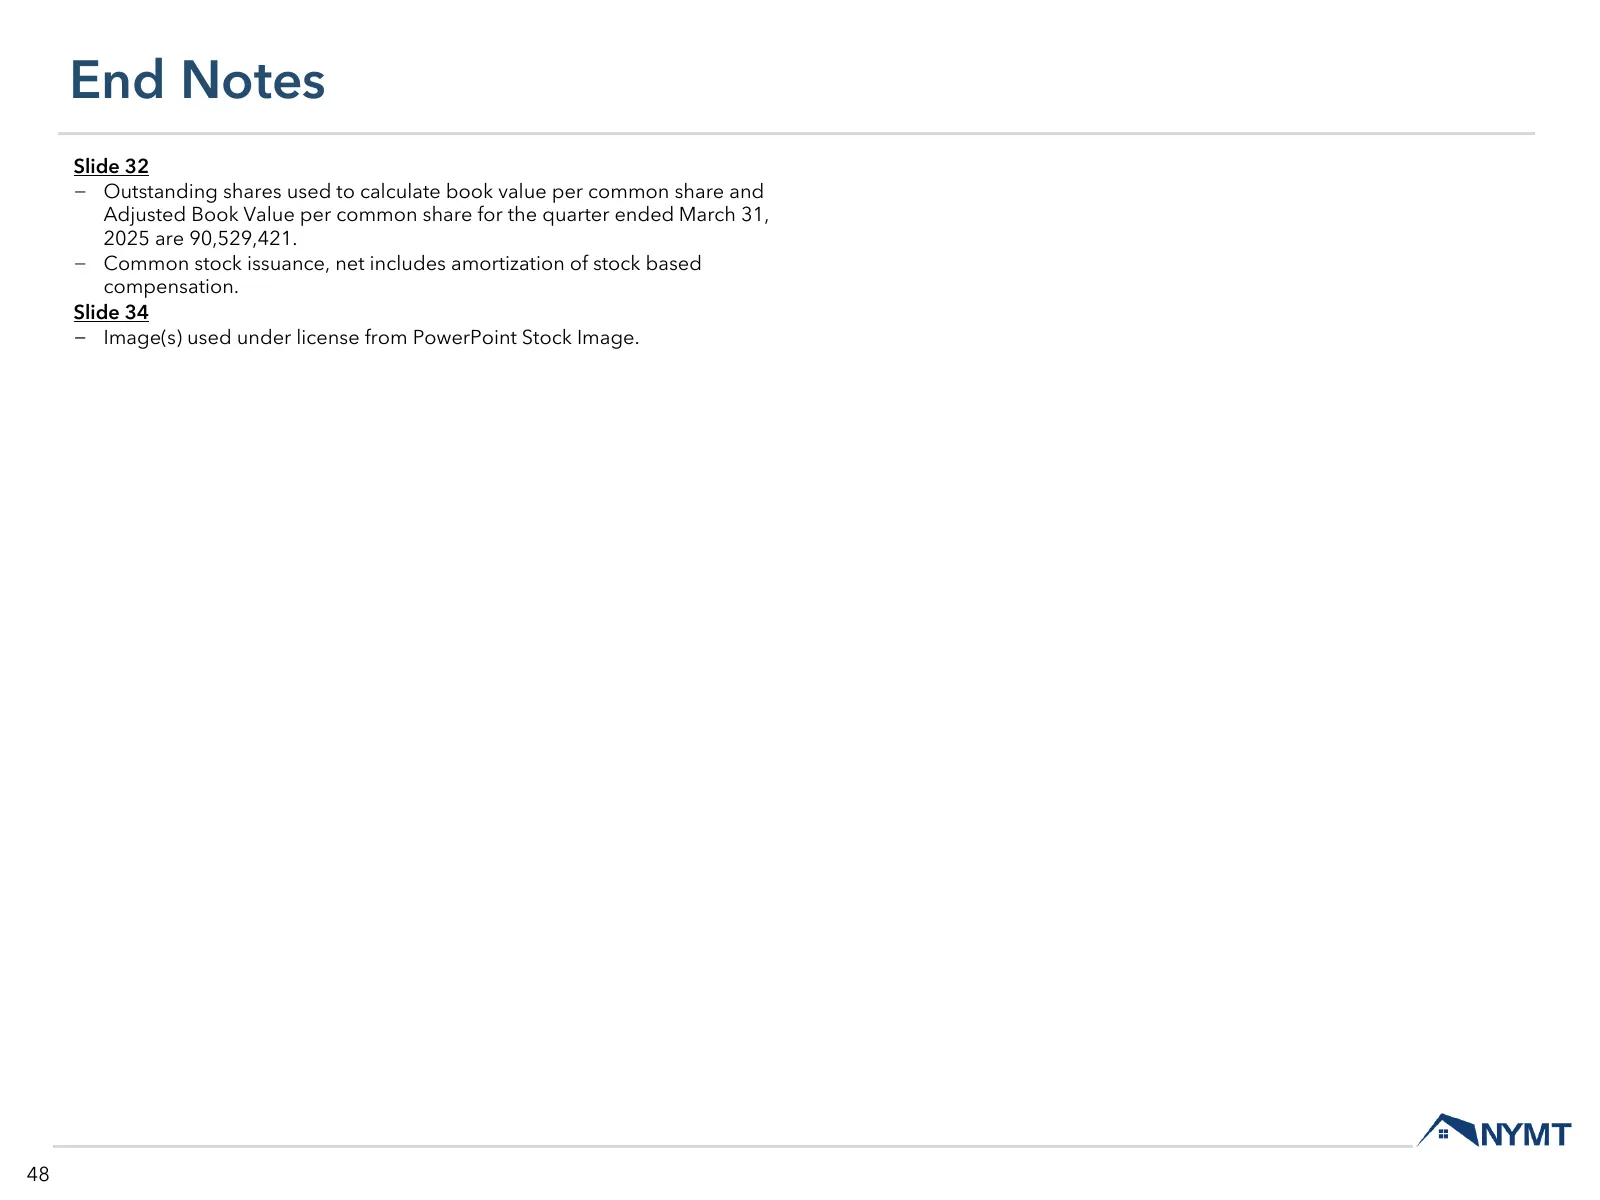
End Notes Slide 32 − Outstanding shares used to calculate book value per common share and Adjusted Book Value per common share for the quarter ended March 31, 2025 are 90,529,421. − Common stock issuance, net includes amortization of stock based compensation. Slide 34 − Image(s) used under license f
Slide 49: Capital Allocation
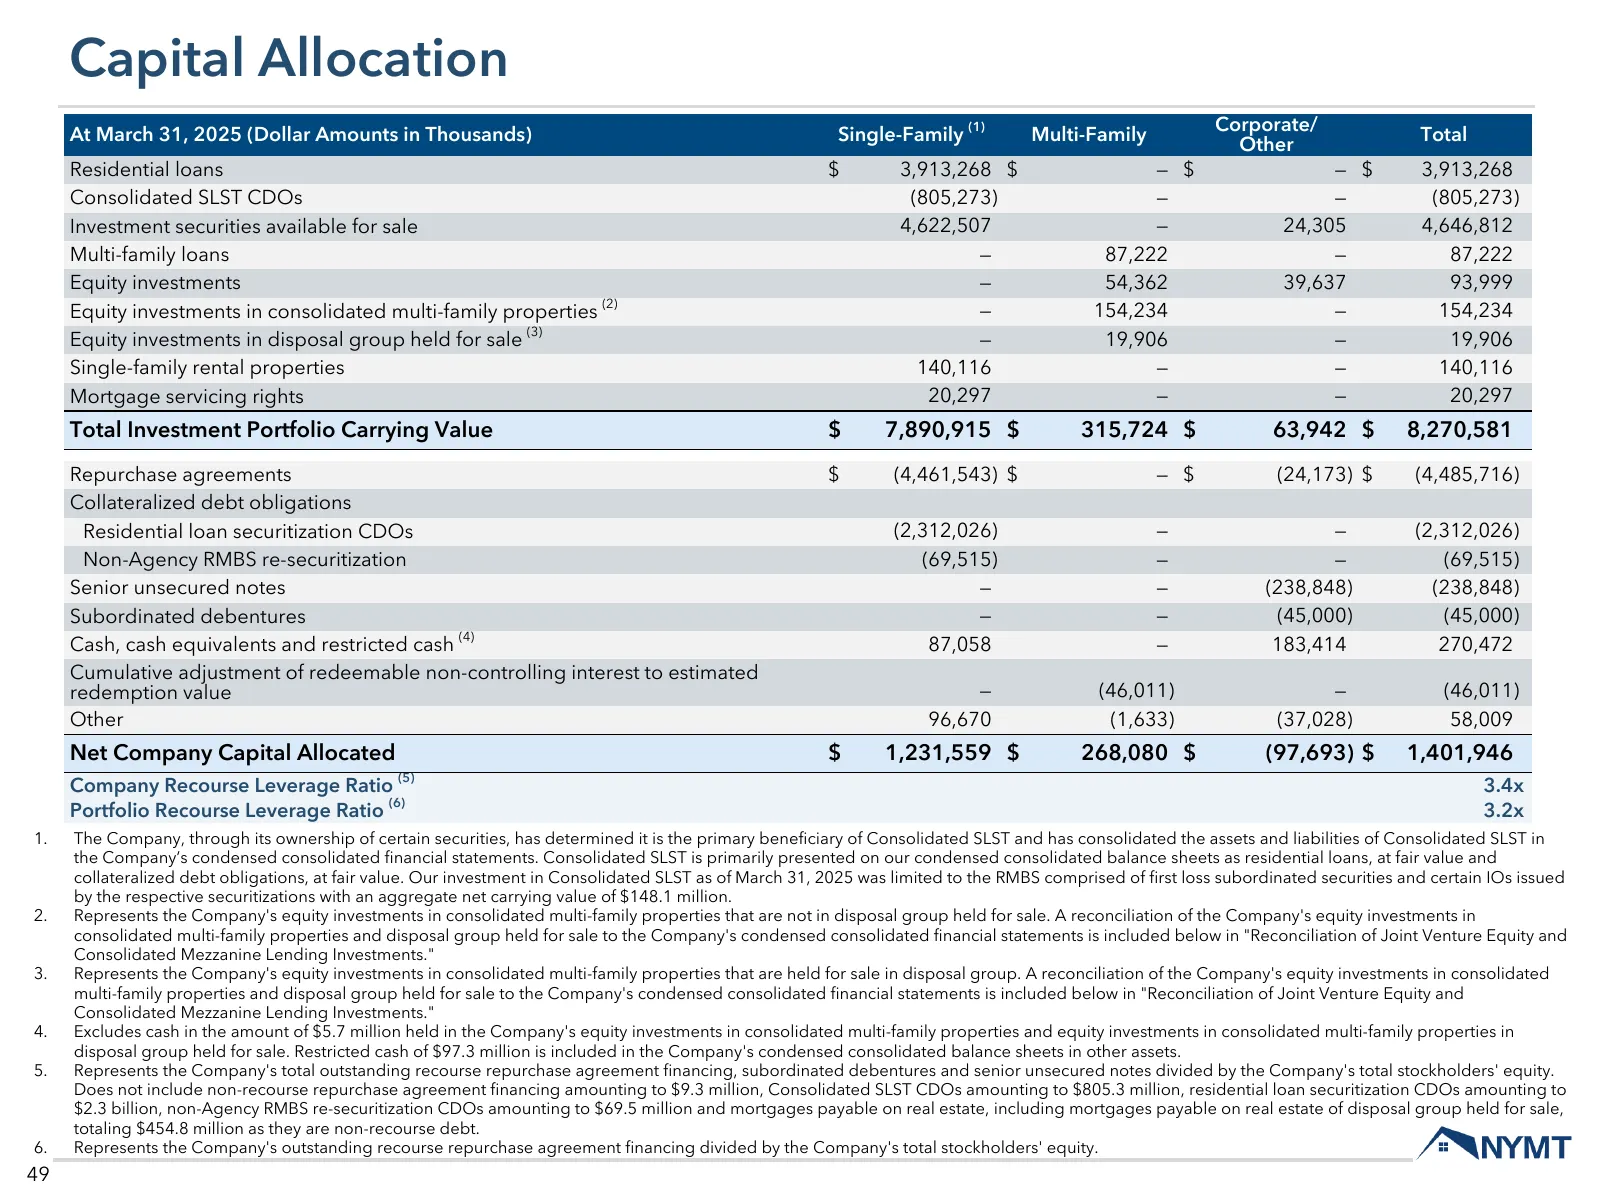
Capital Allocation At March 31, 2025 (Dollar Amounts in Thousands) Single-Family (1) Multi-Family Corporate/ Total Other Residential loans $ 3,913,268 $ — $ — $ 3,913,268 Consolidated SLST CDOs (805,273) — — (805,273) Investment securities available for sale 4,622,507 — 24,305 4,646,812 Multi-family
Slide 50: Reconciliation of Joint Venture Equity and Consolidated Mezzanine Lending Investments
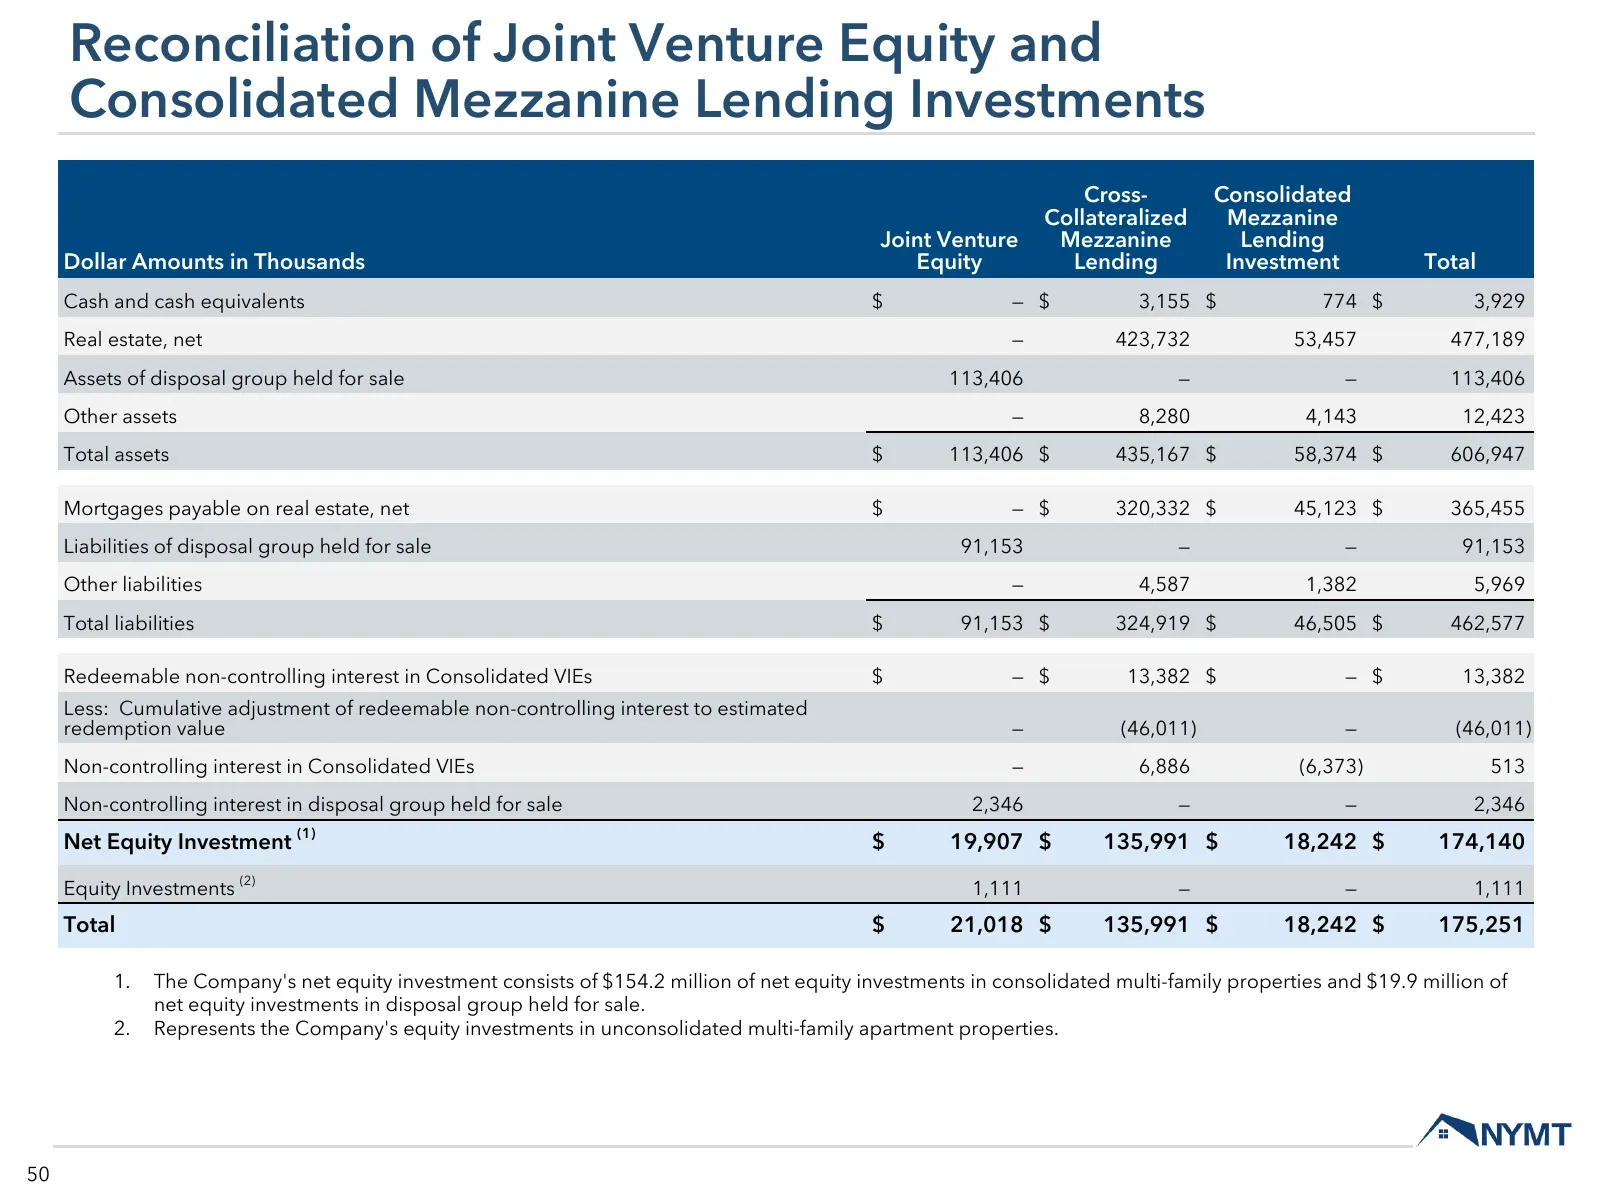
Reconciliation of Joint Venture Equity and Consolidated Mezzanine Lending Investments Cross- Consolidated Collateralized Mezzanine Joint Venture Mezzanine Lending Dollar Amounts in Thousands Equity Lending Investment Total Cash and cash equivalents $ — $ 3,155 $ 774 $ 3,929 Real estate, net — 423,73
Source: 6ix earnings call
More decks from Adamas Trust, Inc.
 Q3 2026 Earnings Presentation58 slides · Oct 29, 2026
 Q2 2026 Earnings Presentation57 slides · Jul 30, 2026
 Q1 2026 Earnings Presentation58 slides · Apr 30, 2026
 Q4 2025 Earnings Presentation59 slides · Feb 19, 2026
 Q3 2025 Earnings Presentation59 slides · Oct 30, 2025
 Corporate Update (September 2025)16 slides · Sep 2, 2025