Air Transport Services Group Inc
Air Transport Services — Non-Deal Roadshow (June 2009)
22 slides from Air Transport Services's roadshow presentation, Jun 10, 2009
Slide 1: Investor Meetings June 2009
June 2009 Investor Meetings Exhibit 99.1
Slide 2: Safe Harbor Statement
2 Safe Harbor Statement • Except for historical information contained herein, the matters discussed in this presentation contain forward - looking statements that involve risks and uncertainties. There are a number of important factors that could cause Air Transport Services Group’s ("ATSG’s") actua
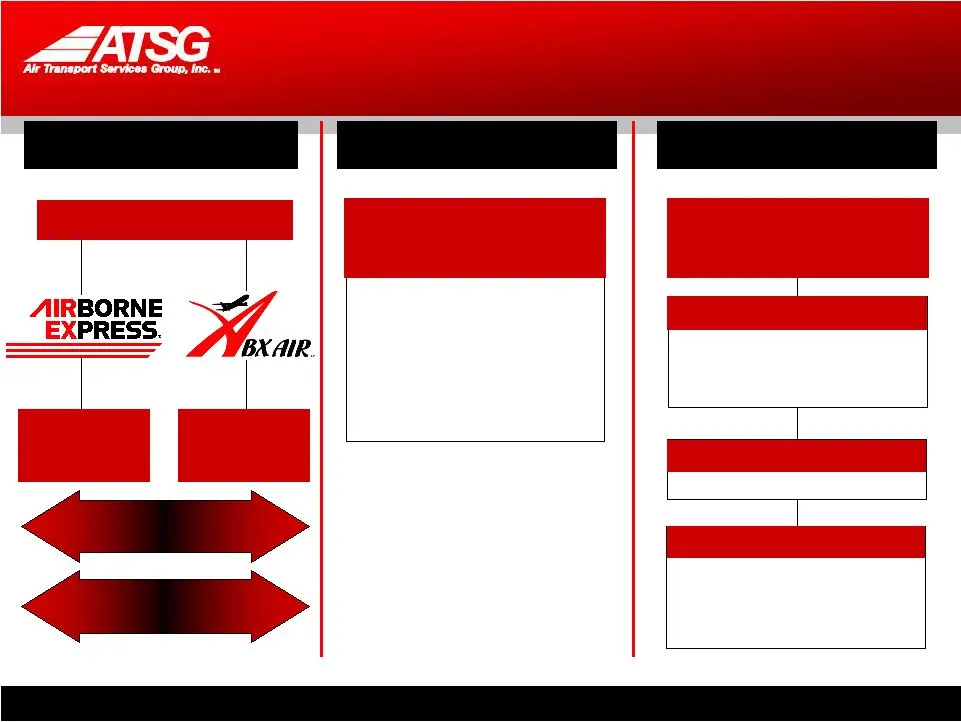
Slide 3: Corporate structure: 2003 separation, 2007 acquisition, today
3 2003 Separation 2007 Acquisition Airborne, Inc. ACMI Agreement Hub Services Agreement ABX Air Holders Today ACMI / Charter Air Transport Services Group Leasing Other DHL Cargo Holdings International • Airborne Maintenance and Engineering Services (AMES) • ABX Cargo Services • LGSTX Services Airbor
Slide 4: Facing Challenges of Change-2008
4 Facing Challenges of Change-2008 Expanded portfolio of services Downsized fleet, operations, and workforce Preserved financial flexibility while increasing cash flow • Assimilate new businesses • Adapt for DHL restructuring • Respond to credit crisis, soft economy
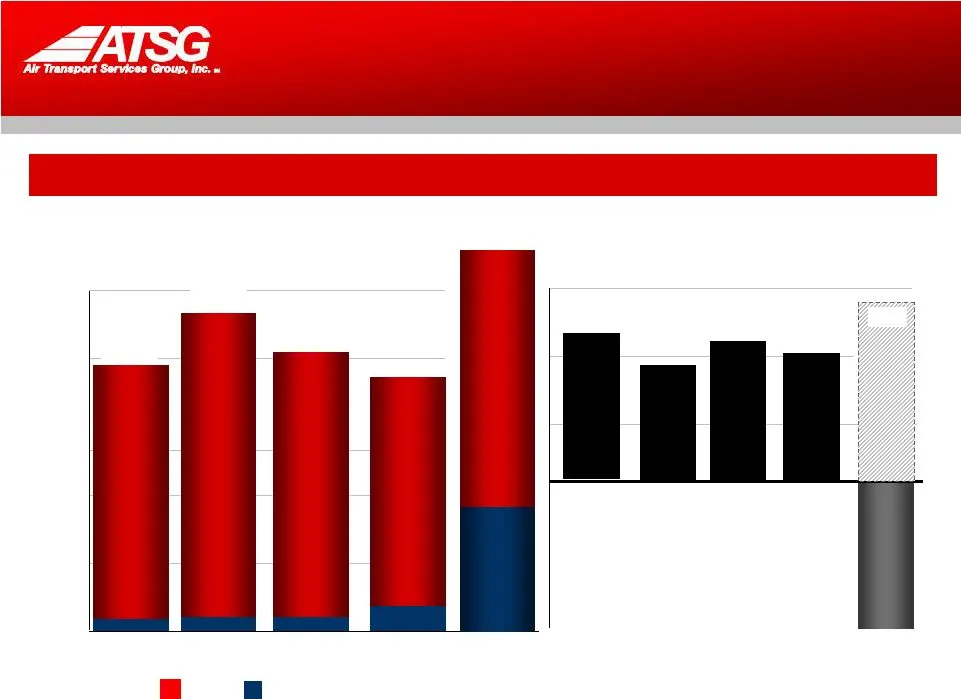
Slide 5: Financial Performance 2004-2008 Results
$34 $48 Financial Performance 2004-2008 Results $s in millions $27 $91 $1,176 $1,430 $1,212 $1,083 $1,152 $459 -$46 Non-DHL DHL Pre-tax Earnings $37 $36 $33 $30 Revenues $1,203 $1,464 $1,260 $1,174 $1,611 $45* * Excluding goodwill and intangible impairment charges
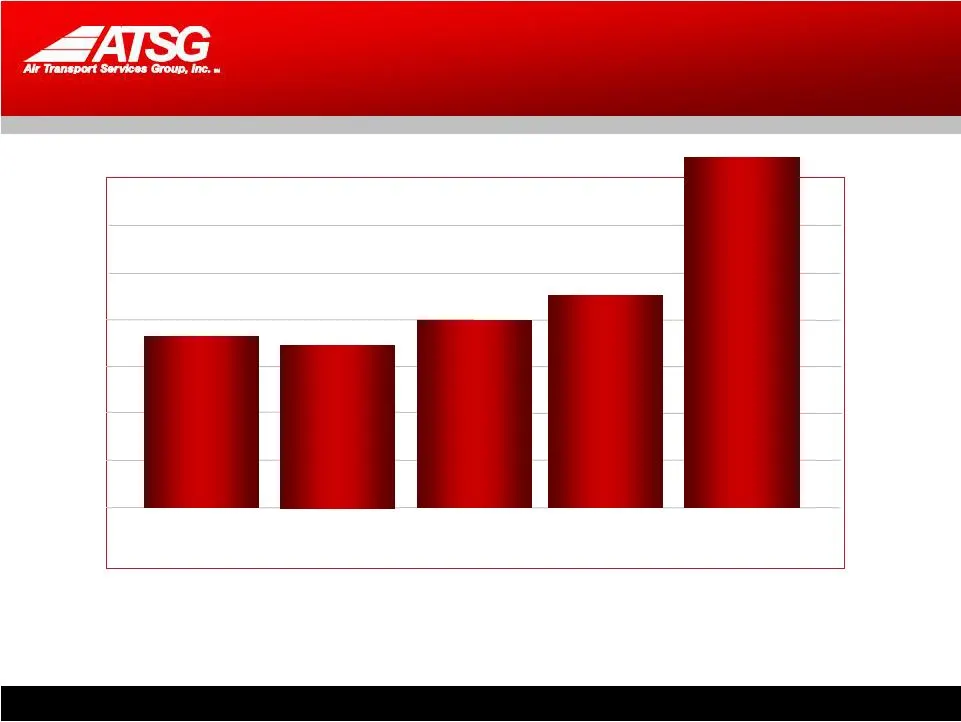
Slide 6: EBITDA
6 EBITDA* $81.8 M $79.9 M $88.4 M $94.5 M $174.5 M *EBITDA and Adjusted EBITDA are non-GAAP financial measures and should not be considered as an alternative to net income (loss) or any other performance measure derived in accordance with GAAP. The Company’s management uses this adjusted financial m
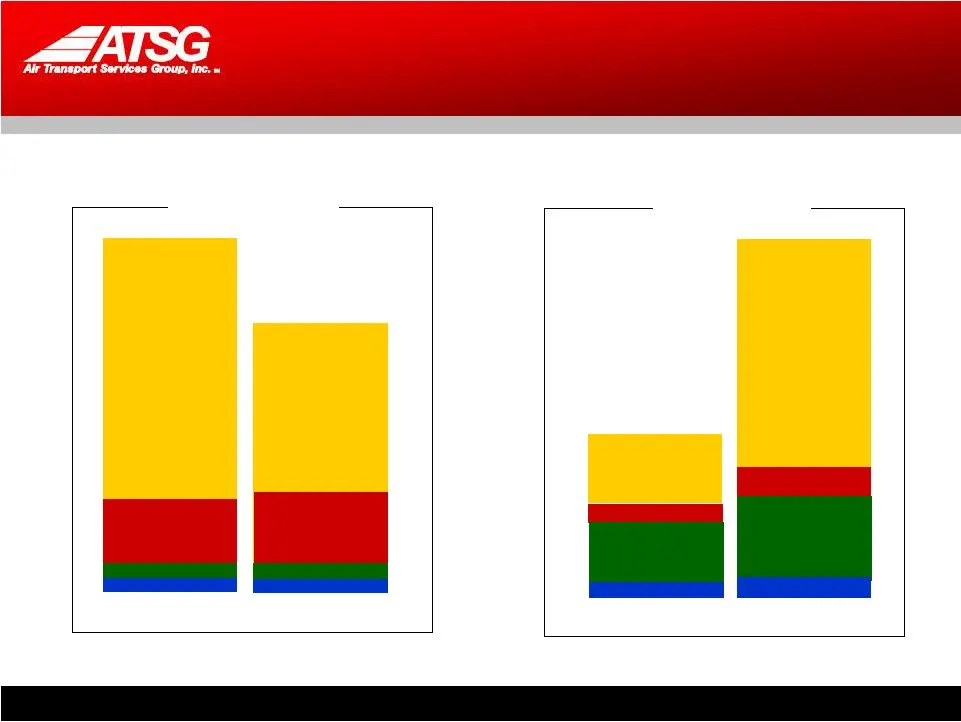
Slide 7: 1Q Financial Results
7 ACMI $93 M 1Q Financial Results Other $9 M ACMI $86 M Other $11 M CAM $13 M CAM $10 M ACMI $1 M CAM $4 M ACMI $2 M CAM $5 M Other $1 M Other $0.4 M 1Q 2008 Revenues DHL $281 M 1Q 2009 DHL $183 M Segments and Other Earnings 1Q 2008 DHL $4 M 1Q 2009 DHL $13 M

Slide 8: Facing Challenges of Change-2009
8 Facing Challenges of Change-2009 Goals for 2009 • Restructure DHL promissory note and capital leases • Continue to support DHL transition • Reconfigure non-standard B767-PC fleet to serve broader customer base • Seek long-term commitments for B767 fleet • Further strengthen balance sheet • Leverag

Slide 9: 2009 Actions to Date
9 2009 Actions to Date • Debt to be reduced approximately $113 million as result of: – DHL note balance reduced $46 million principal reduction, $15 million prepayment – $52 million capital lease transfer to DHL • Downsized DHL-related workforce by more than 7,500 people, reduced fleet by 65 aircraf
Slide 10: Our Business
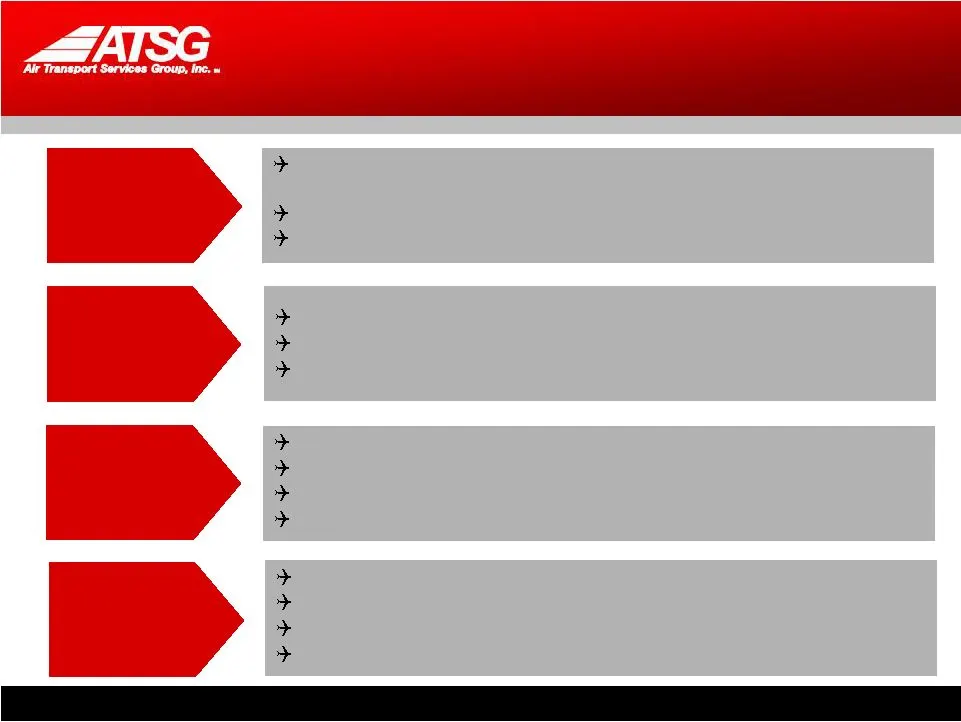
10 Our Business Market Dynamics Diversified Portfolio of Assets & Services Significant Customer Relationships Attractive Freighter Aircraft Weak demand grounds inefficient fleets, single-mode operators Customers seeking full-service, low-cost providers Win factors: Experience, service quality, broad

Slide 11: Strategy for Profitable Growth
11 Strategy for Profitable Growth • Organic Strategy – Grow ACMI and leasing business using 767-200 fleet as the platform – Grow maintenance and technical services for higher margin returns – Leverage capabilities and resources in sort management and support services – Provide principal customers wi
Slide 12: Diversification Progress
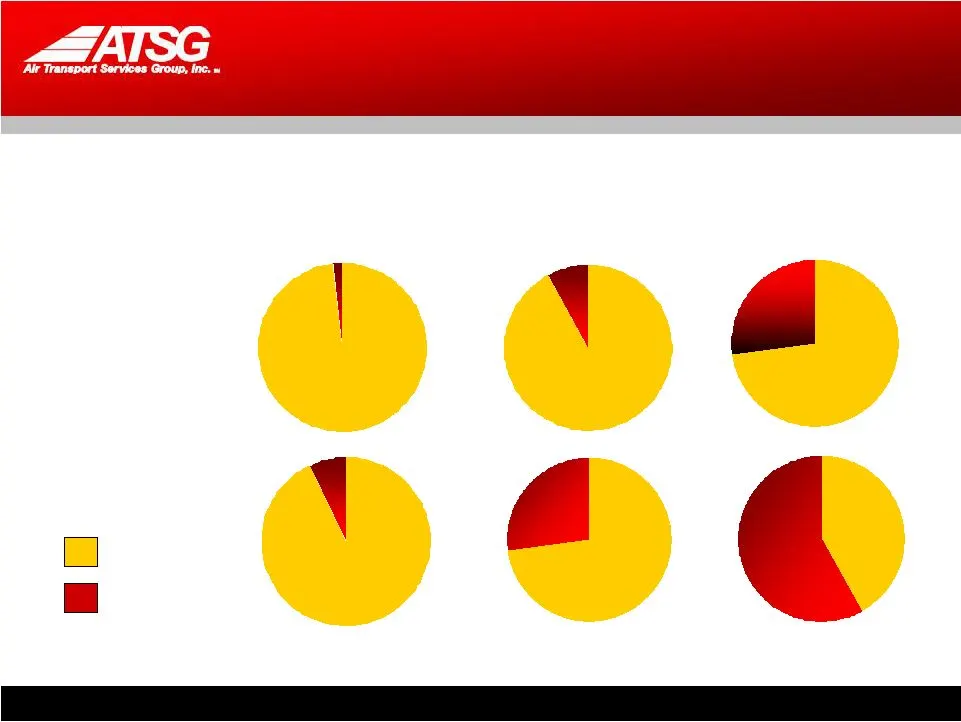
12 Diversification Progress DHL OTHER* EBITDA $76M $6M $1,176B $27M $69M $26M $1,083B $91M Revenues * Excluding goodwill and intangible impairment charges $459M $97M $78M $1,152B
Slide 13: Our Fleet
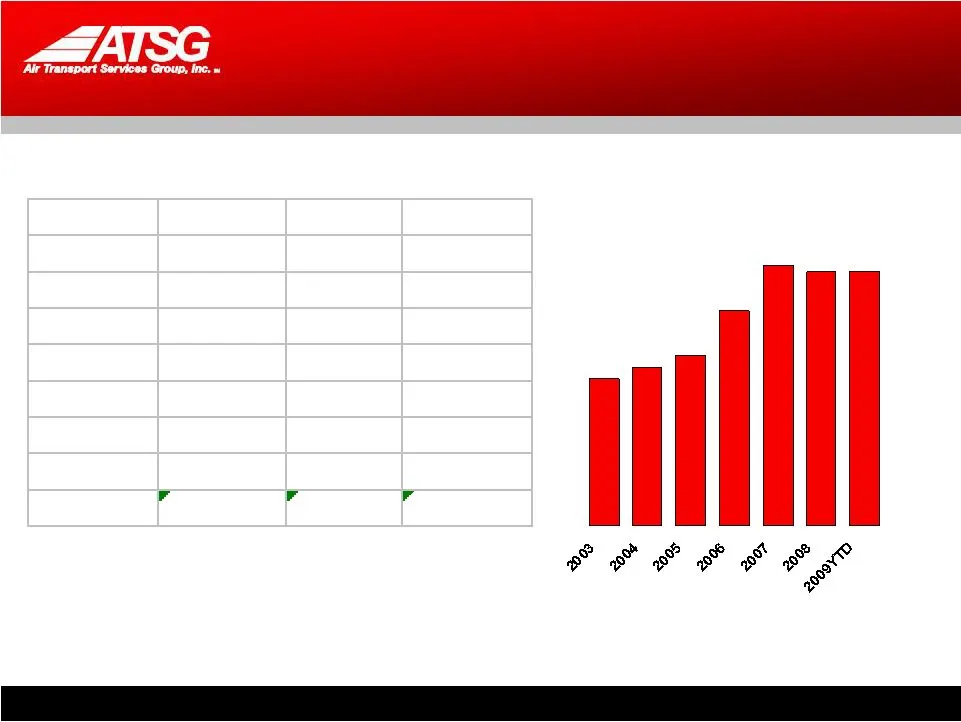
13 Our Fleet 12/31/2007 6/1/2009 12/31/2010 DC-8 DC-9 B727 B757 B767-PC B767-SF In mod Total World’s Largest Fleet of Cost-Efficient Boeing 767-200 Cargo Aircraft
Slide 14: Five-Year Freighter Forecast
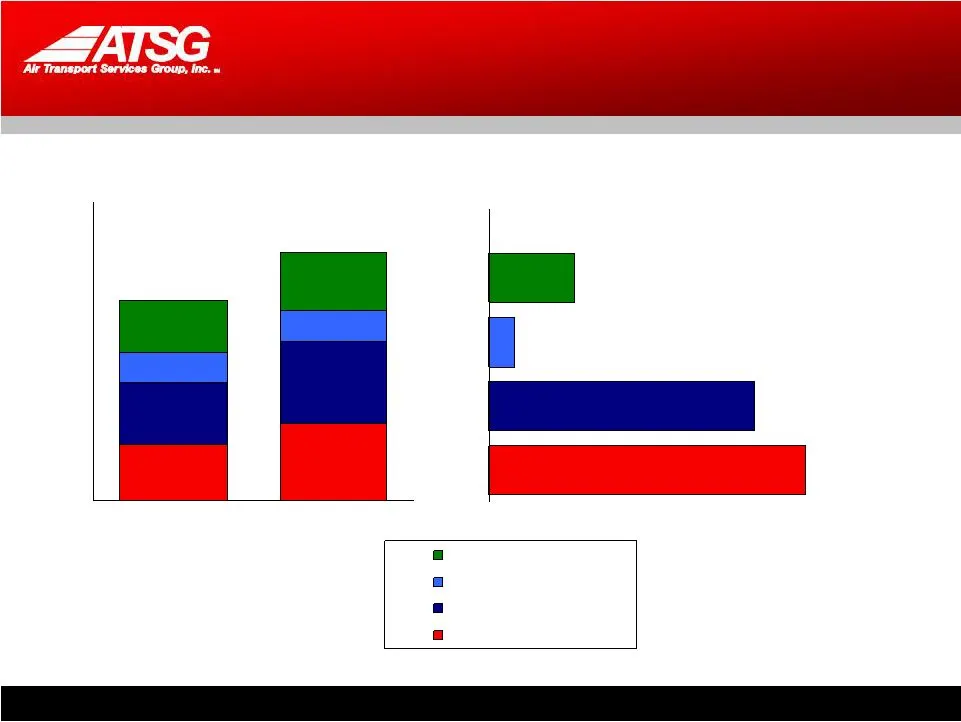
14 470 654 528 683 247 260 433 481 Five-Year Freighter Forecast 10 31 37 Standard Medium Narrowbody Large Widebody Medium Widebody Available Freighters Average Annual Net Adds 2008-2013 Source: ACMG Baseline Forecast – April 1,678 2,058
Slide 15: Midsize Freighter Forecast
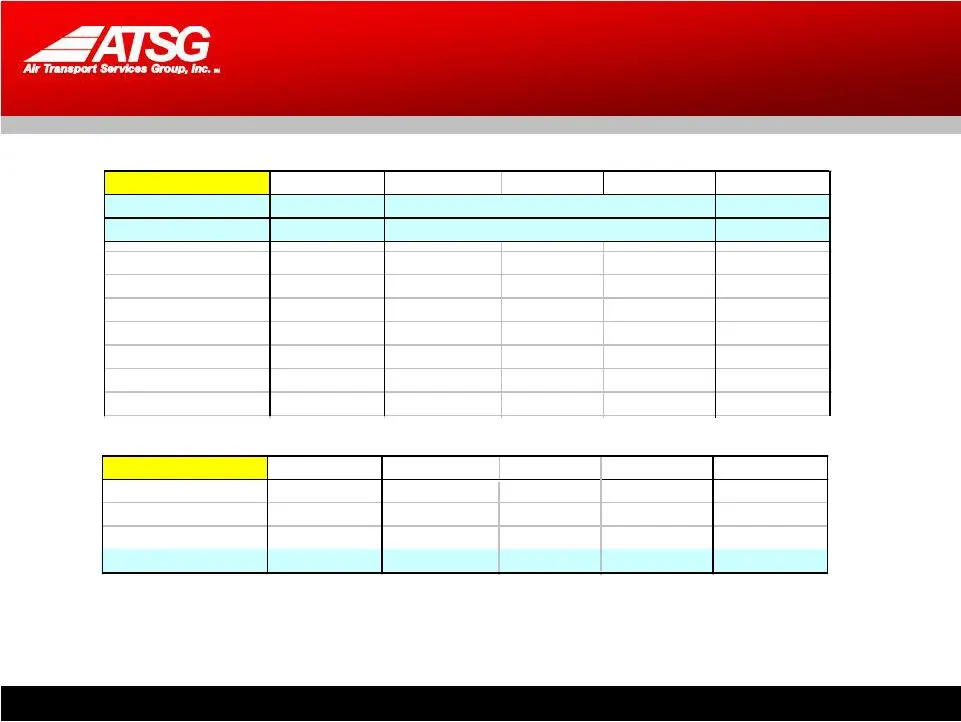
15 Midsize Freighter Forecast Source: Air Cargo Management Group (ACMG) Annual Twenty-Year Freighter Forecast - WIDE-BODY 1Q/2009 Retirements New Converted 2013 Total 767-200 & ER 767-300 & ER A300B4 A300-600 & -600R A310-200 A310-300 A330 DC-10-10 L-1011 NARROW-BODY 1Q/2009 Retirements New Converte
Slide 16: Redeploying Our DHL 767s
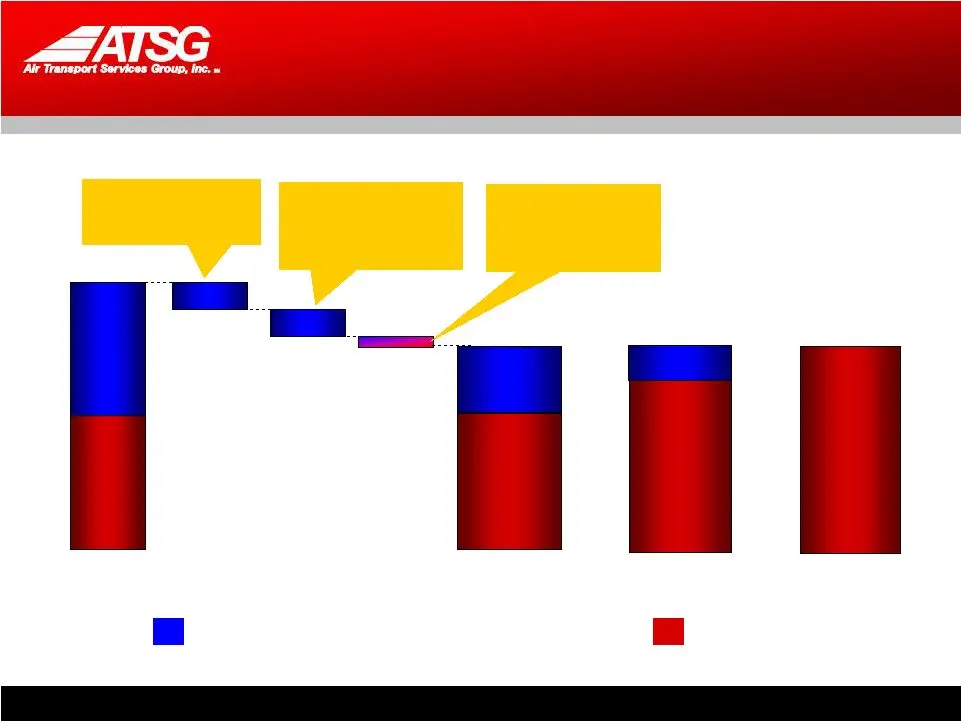
16 Redeploying Our DHL 767s 24 21 27-30* 5-8* 36 24 11 5 767-PCs put to DHL DHL assumes cap leases for 5 767-PCs 767-200 PCs, including PCs in mod program 767-200 SFs *Pace of 767 modifications could be affected by possible assignment of early modification slots to DHL. 767-PCs modified to 767-SFs*
Slide 17: Deployment Options: Lease, Sell, ACMI
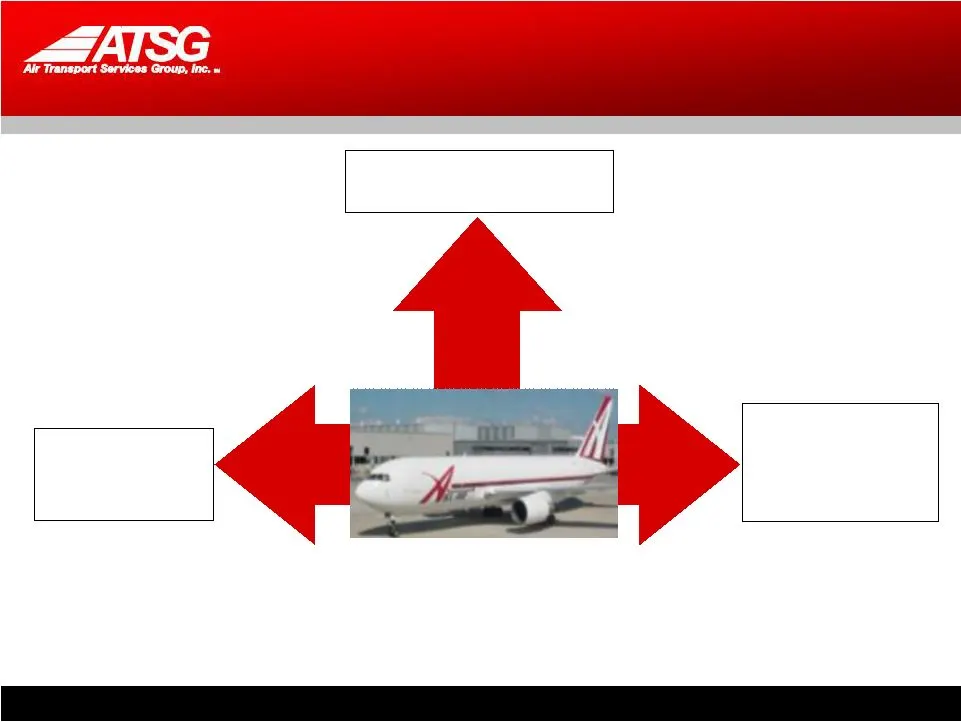
17 Deployment Options Lease Sell ACMI $250K-$275K / mo., 90%+ EBITDA Margins $18-22 Mill. avg. for 767-200SF $3-$4K per B/H, 175-200hrs/ mo, 20-25% EBITDA Margins* •Assumes renegotiated CBA with ABX Air pilots effective 1Q/2010
Slide 18: 767-PC Investment
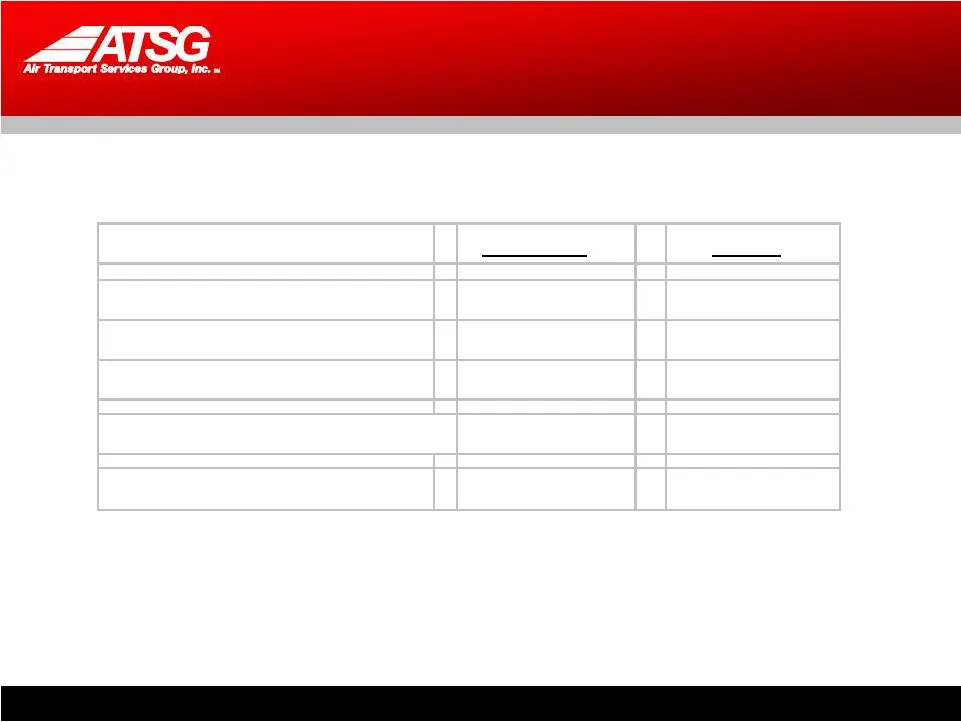
18 767-PC Investment (in millions) Avg Per 767 14 767s Current Book Value $4.5 $63.0 Current Market Value $5.0 $70.0 Modification Cost $12.0 $168.0 Market Value After Conversion $18-22 $250-300 Lease Revenue Potential/yr $3.0-3.25 $42.0-46.0
Slide 19: Capital Expenditure Trends
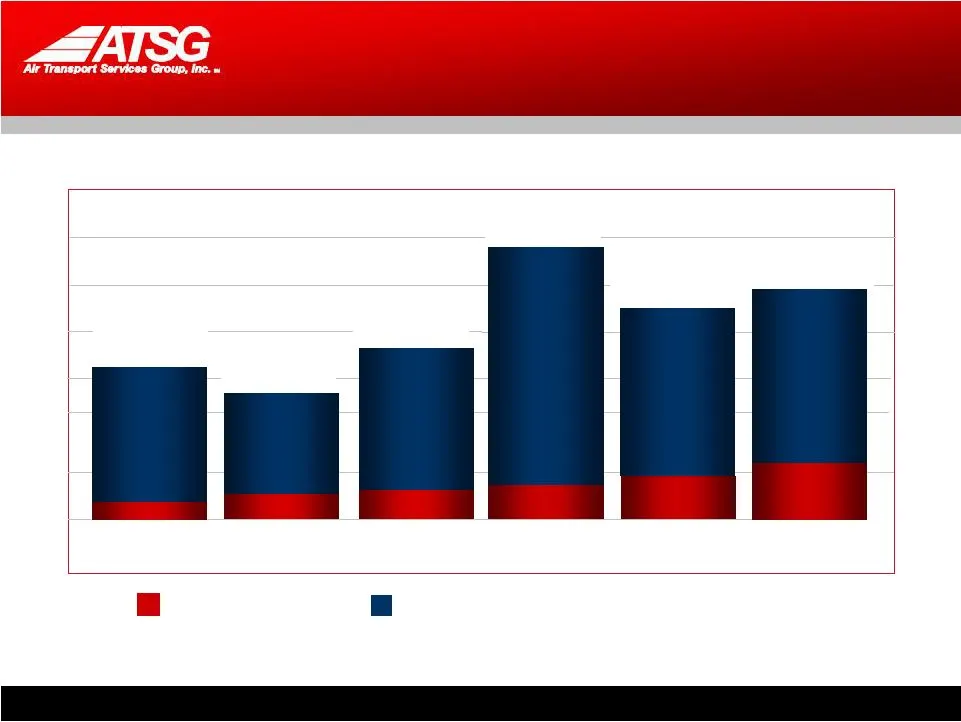
19 Capital Expenditure Trends $65 $49 $86 $142 $14 $12 $9 $18 $90 $22 $92 $34 Maintenance Growth $74 M $61 M $100 M $160 M $112 M 2009E $126 M
Slide 20: Leverage Ratios
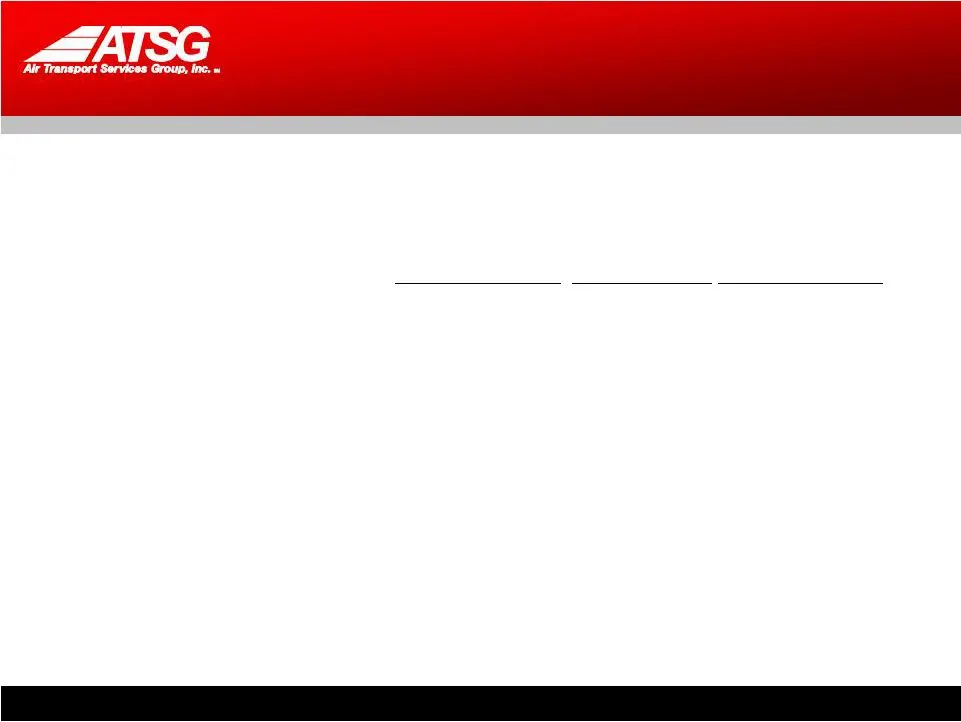
20 Leverage Ratios 1Q09 1Q09 Actual Note/Cap Lease Covenant Results Resolution First Lien Debt / EBITDA* < 3.00 2.38 2.11 Total Debt / EBITDA* < 3.50 2.63 2.28 Fixed Charge Coverage > 1.50 2.49 2.96 1Q09 Actual Positive Outcome »»» reported results inclusive of DHL Note forgiveness »»» First Lien Ra

Slide 21: Our Value Proposition
21 Our Value Proposition • Strong cash flow from high-profile strategic customers, including DHL, BAX/Schenker, U.S. Military, USPS, UPS. • Global presence • Federal tax liability offset by deferred tax assets through 2011. • Nominal fuel-cost exposure via either ACMI or dry-leases. • World’s larges
Slide 22: Attractive Opportunity
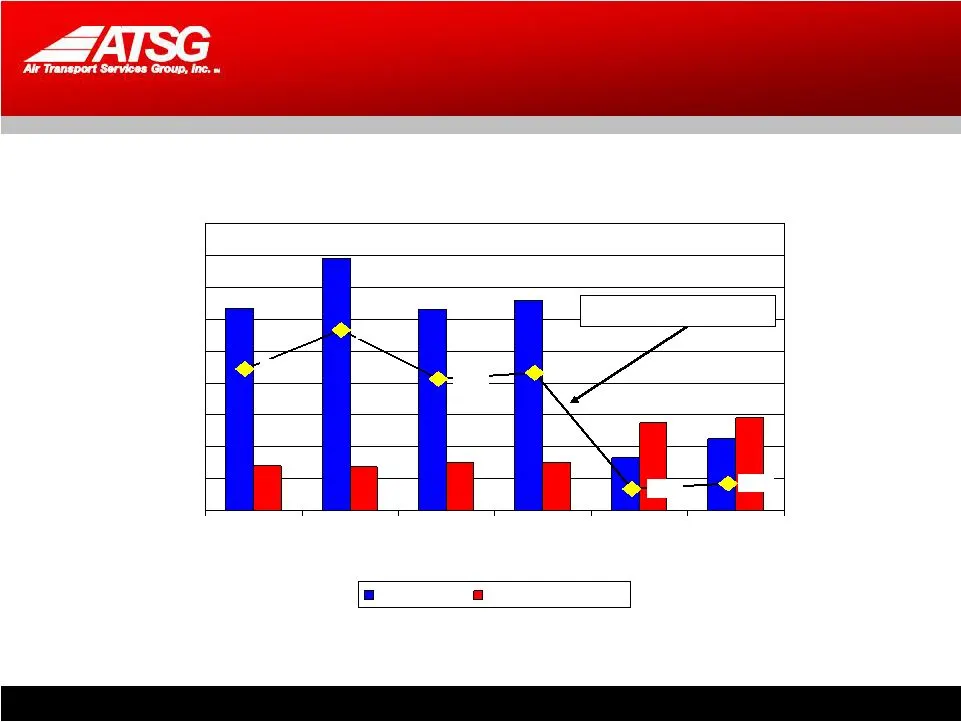
22 Attractive Opportunity 2008 Adj. Adj. TTM 3/31/09 Stock Price EBITDA per share 4.51 5.77 4.19 4.39 0.60 0.77 Stock price/EBITDA
Source: SEC EDGAR · 8-K filed Jun 10, 2009
More decks from Air Transport Services Group Inc
 Shareholder Meeting (May 2024)26 slides · May 23, 2024
 Stephens Annual Investment Conference 202321 slides · Nov 14, 2023
 Investor Day (September 2023)68 slides · Sep 27, 2023
 Shareholder Meeting (May 2023)25 slides · May 26, 2023
 Stifel conference (February 2023)15 slides · Feb 6, 2023
 Stifel 2020 Transportation & Logistics Conference18 slides · Feb 11, 2020