Evonik Industries AG · XETR:EVK
Evonik Industries — Q3 2016 Earnings Presentation
32 slides from Evonik Industries's earnings presentation, Nov 4, 2016
Slide 1: Evonik Q3 2016 Earnings Conference Call
Evonik Power to create. Q3 2016 Earnings Conference Call 4 November 2016 Klaus Engel, Chief Executive Officer Ute Wolf, Chief Financial Officer 1
Slide 2: Table of contents
Table of contents 1. Highlights Q3 2016 2. Financial performance Q3 2016 3. Outlook FY 2016 2 4 November 2016 | Evonik Q3 2016 Earnings Conference Call
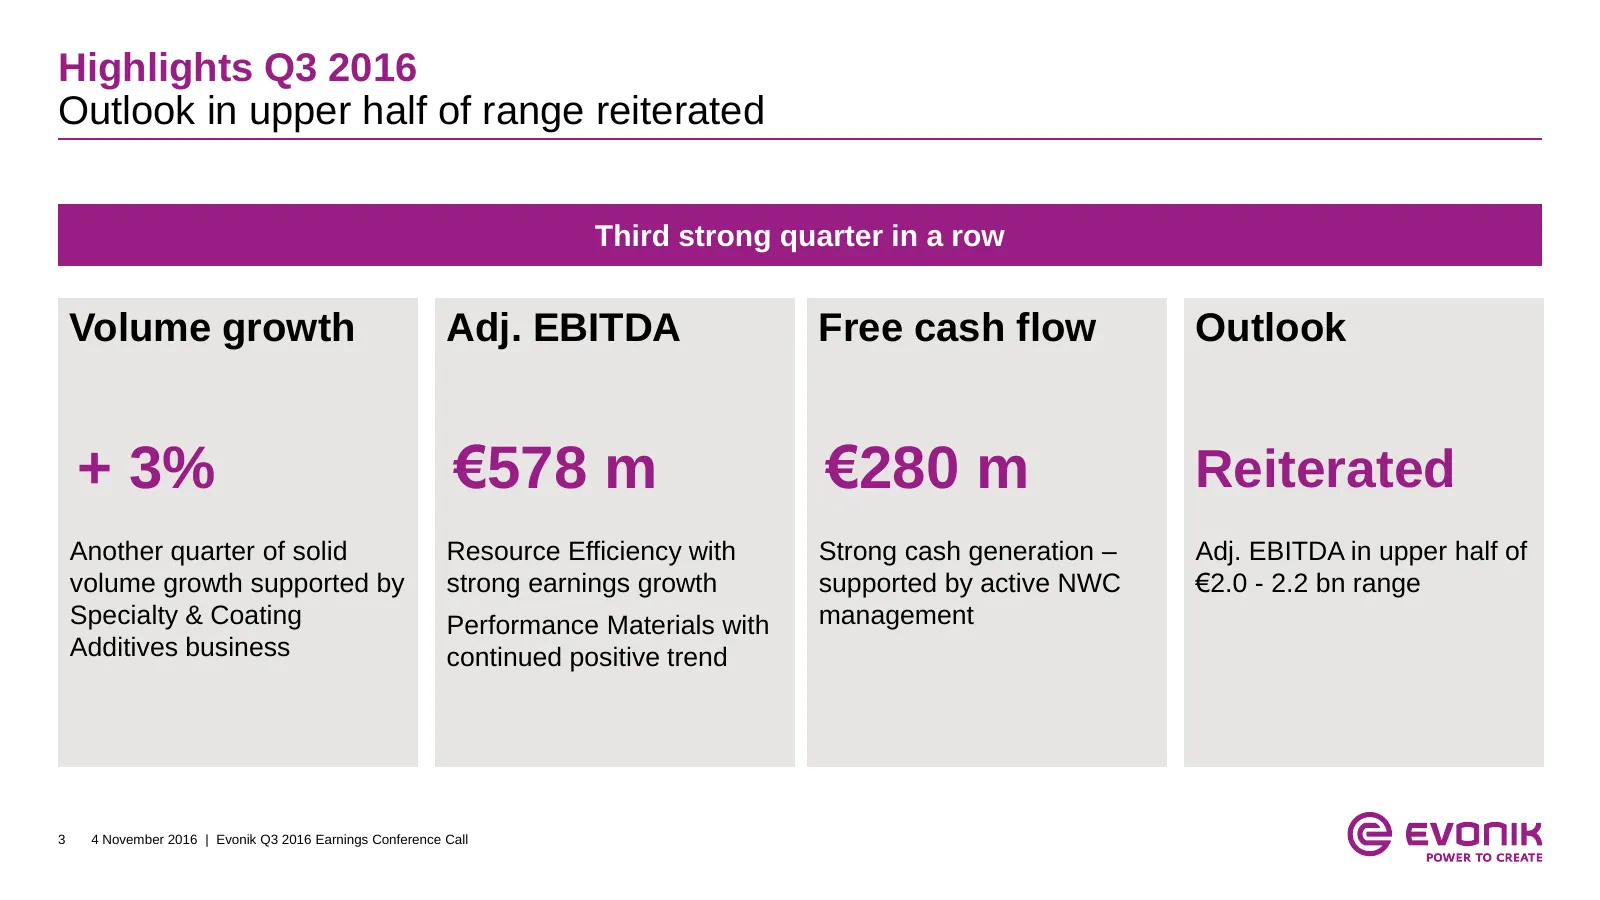
Slide 3: Highlights Q3 2016
Highlights Q3 2016 Outlook in upper half of range reiterated Third strong quarter in a row Volume growth Adj. EBITDA Free cash flow Outlook + 3% €578 m €280 m Reiterated (yoy) (vs. €653 m) (vs. €208 m in H1) Another quarter of solid Resource Efficiency with Strong cash generation – Adj. EBITDA in up
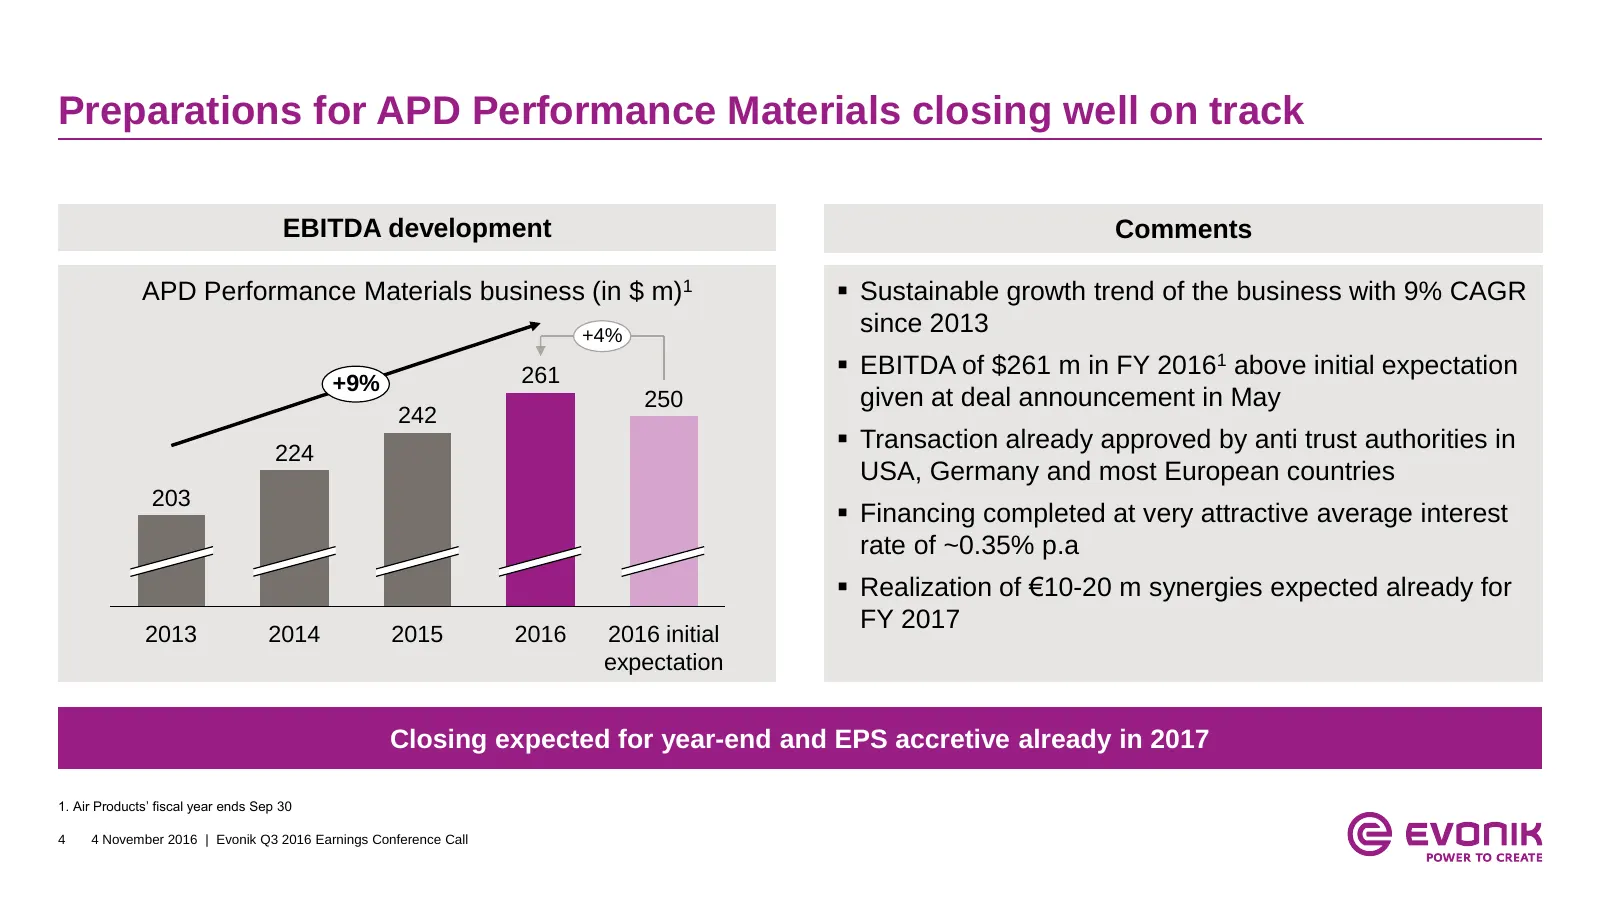
Slide 4: Preparations for APD Performance Materials closing well on track
Preparations for APD Performance Materials closing well on track EBITDA development Comments APD Performance Materials business (in $ m)1 Sustainable growth trend of the business with 9% CAGR +4% since 2013 261 EBITDA of $261 m in FY 20161 above initial expectation +9% 250 given at deal announce
Slide 5: Consistent execution of differentiated segment strategy
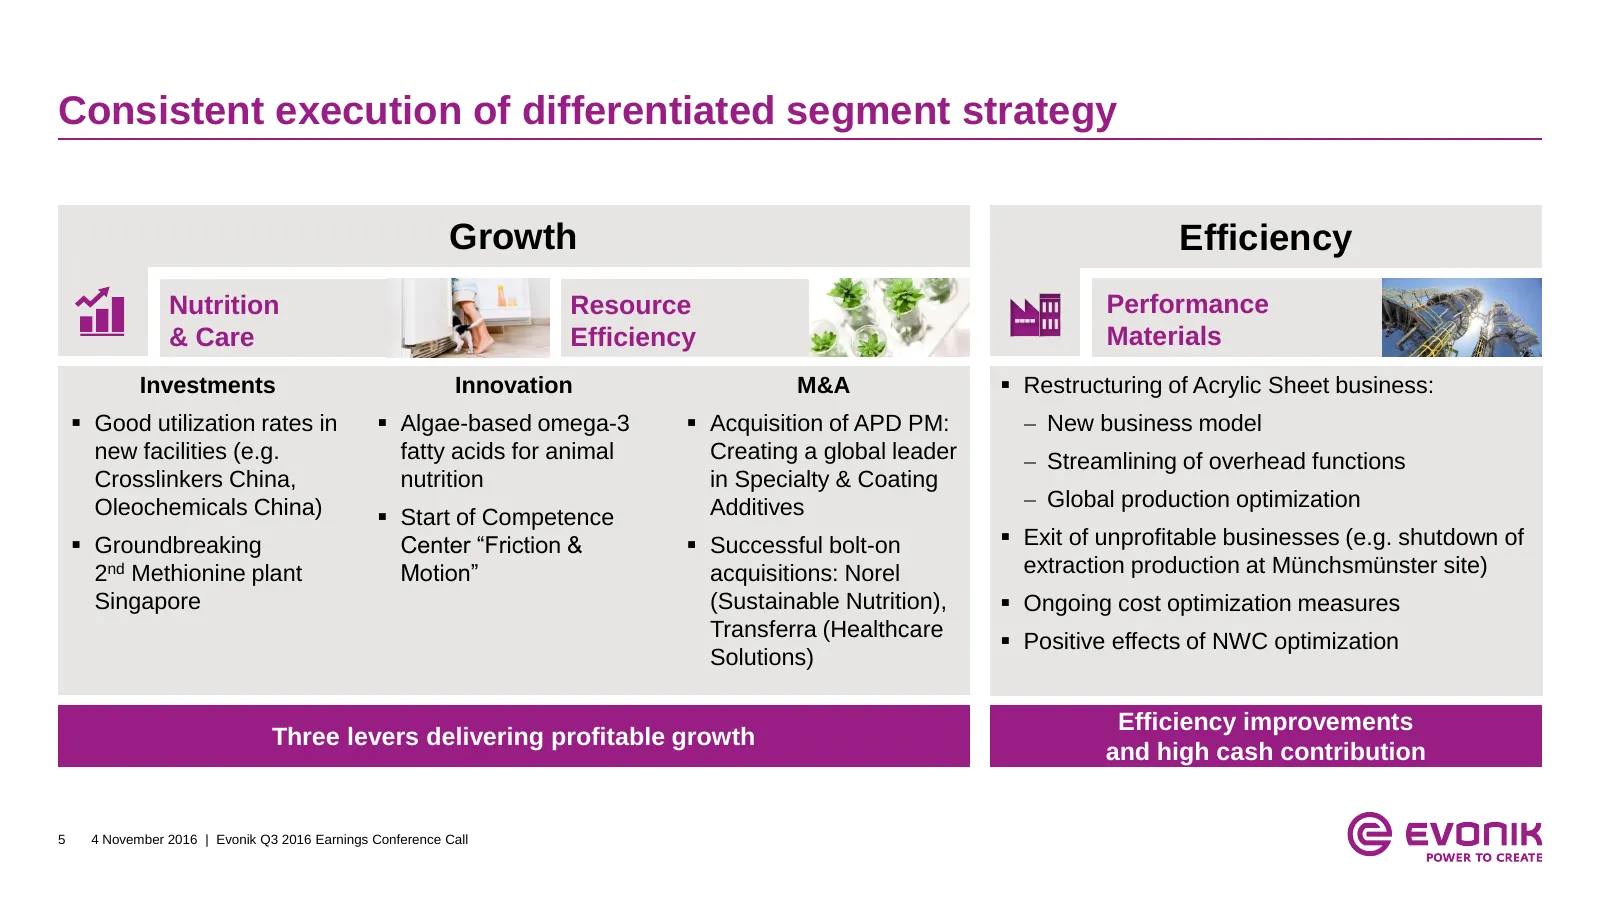
Consistent execution of differentiated segment strategy Growth Efficiency Nutrition Resource Performance & Care Efficiency Materials Investments Innovation M&A Restructuring of Acrylic Sheet business: Good utilization rates in Algae-based omega-3 Acquisition of APD PM: New business model n
Slide 6: Evonik's sustainability performance publicly recognized
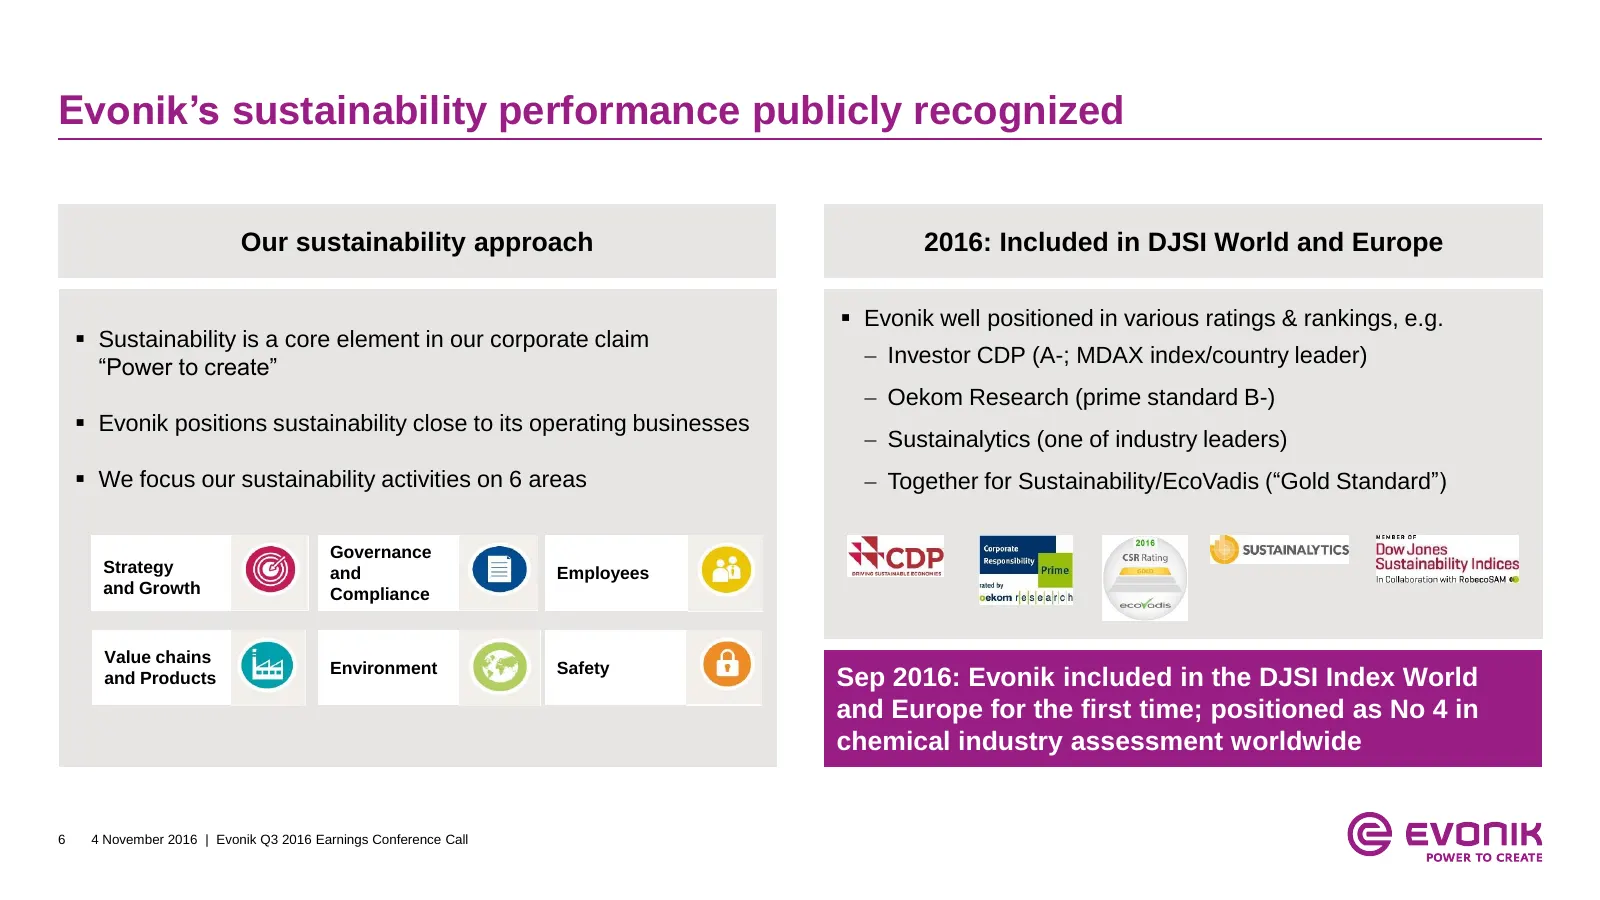
Evonik’s sustainability performance publicly recognized Our sustainability approach 2016: Included in DJSI World and Europe Evonik well positioned in various ratings & rankings, e.g. Sustainability is a core element in our corporate claim Investor CDP (A-; MDAX index/country leader) “Power to
Slide 7: Table of contents
Table of contents 1. Highlights Q3 2016 2. Financial performance Q3 2016 3. Outlook FY 2016 7 4 November 2016 | Evonik Q3 2016 Earnings Conference Call
Slide 8: Financial highlights Q3 2016
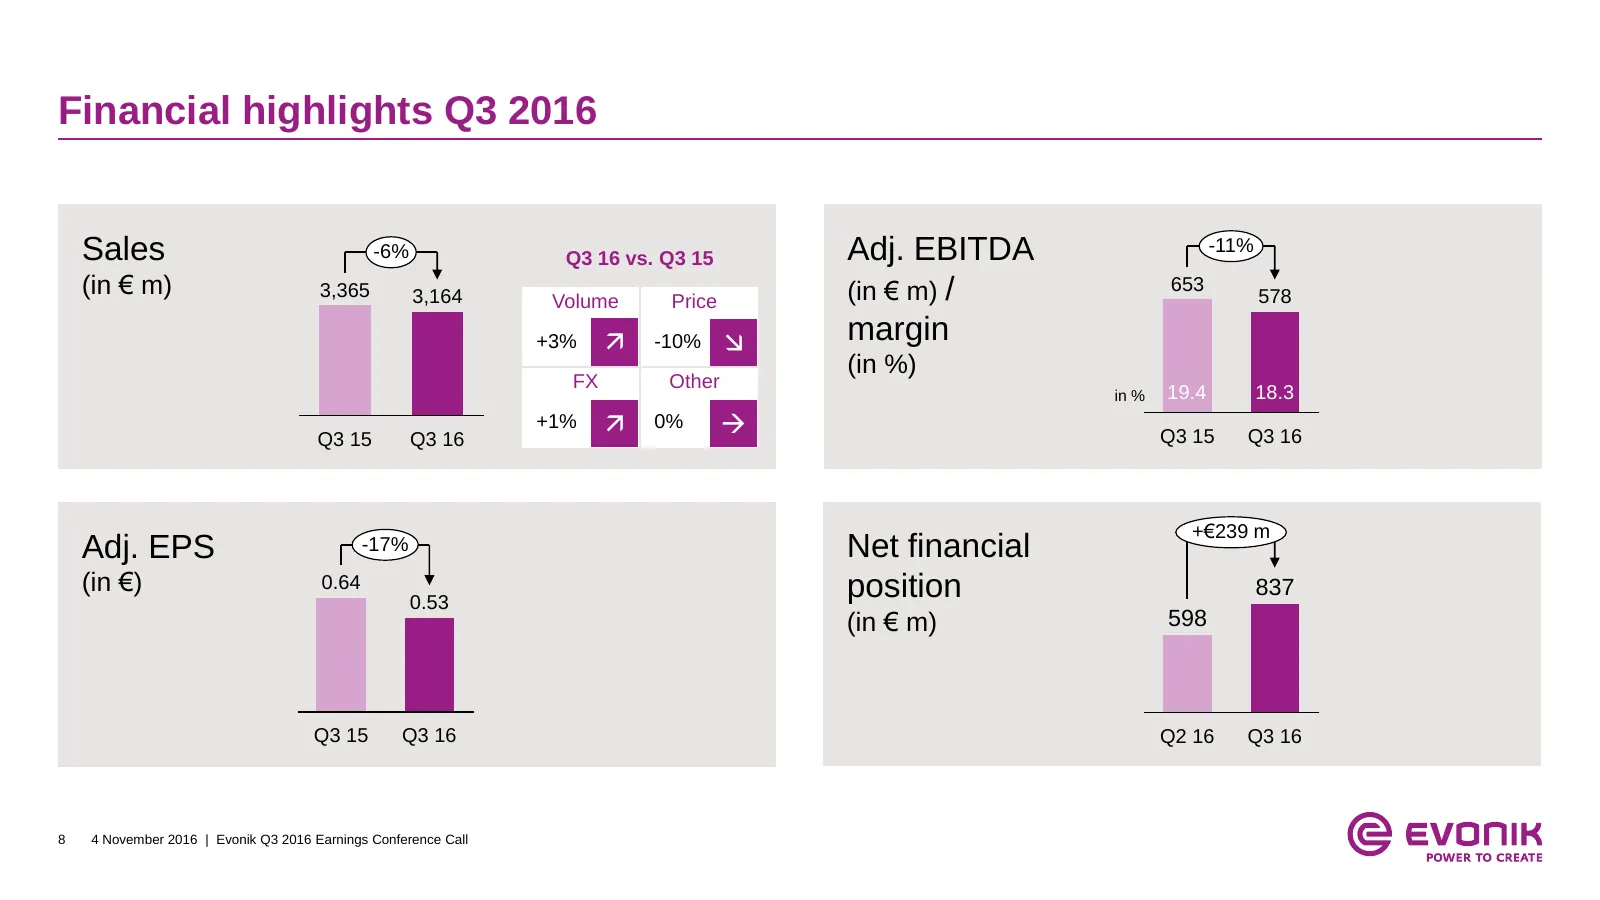
Financial highlights Q3 2016 Sales -6% Q3 16 vs. Q3 15 Adj. EBITDA -11% (in € m) 3,365 3,164 (in € m) / 653 578 Volume Price +3% -10% margin (in %) FX Other in % 19.4 18.3 Q3 15 Q3 16 +1% 0% Q3 15 Q3 16 +€239 m Adj. EPS -17% Net financial (in €) 0.64 position 837 0.53 (in € m) 598 Q3 15 Q3
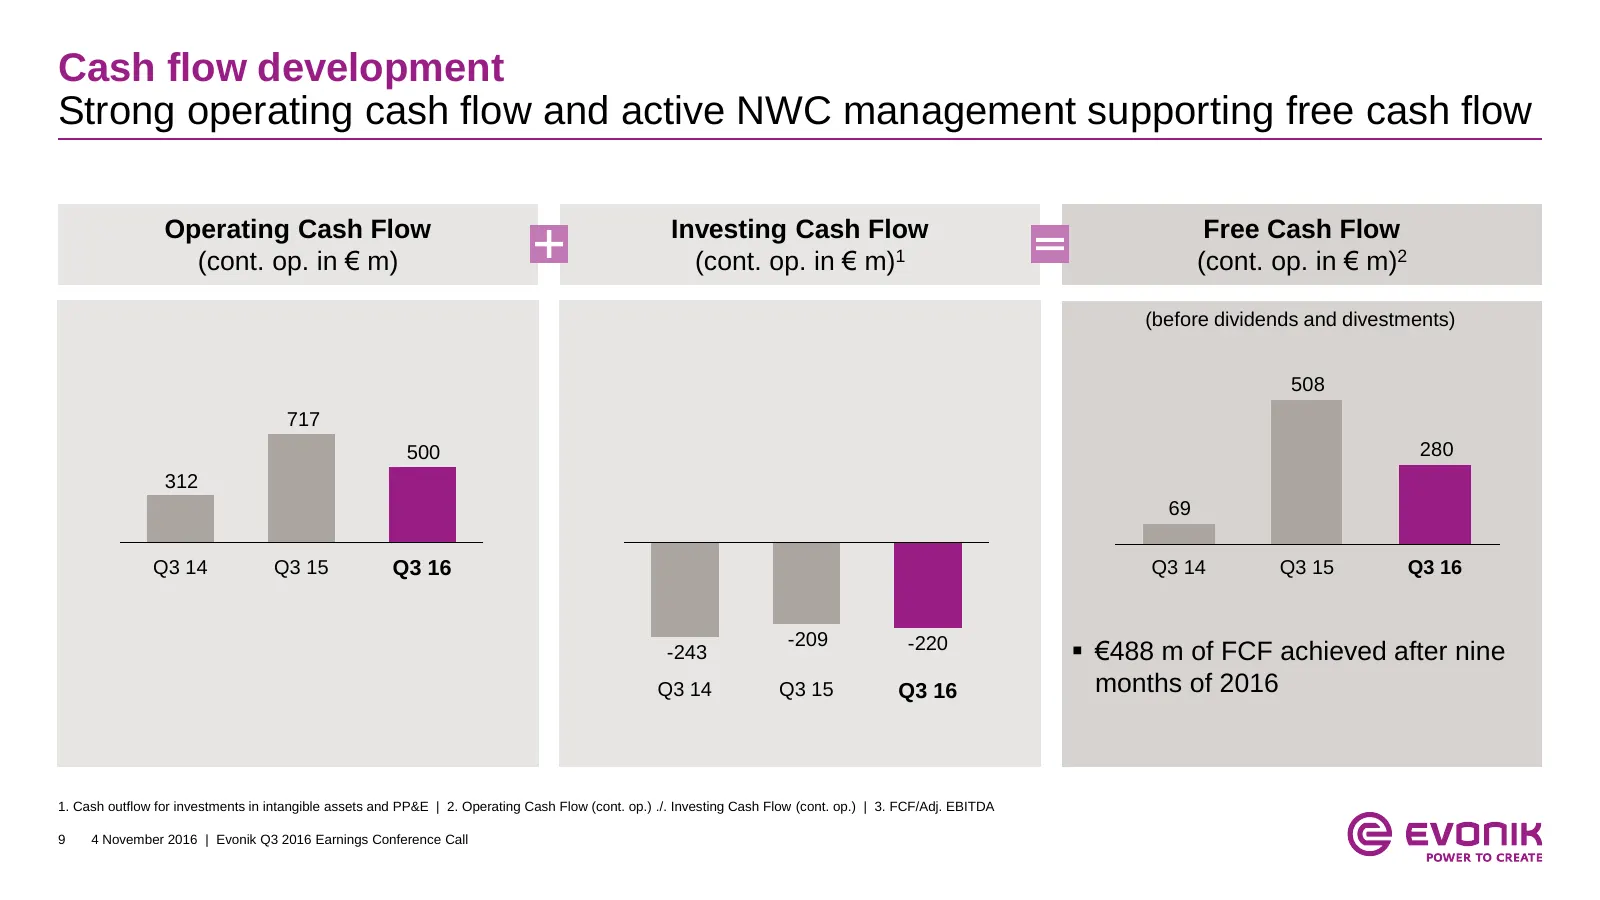
Slide 9: Cash flow development
Cash flow development Strong operating cash flow and active NWC management supporting free cash flow Operating Cash Flow Investing Cash Flow Free Cash Flow (cont. op. in € m) (cont. op. in € m)1 (cont. op. in € m)2 (before dividends and divestments) 508 717 500 280 312 69 Q3 14 Q3 15 Q3 16 Q3 14 Q3
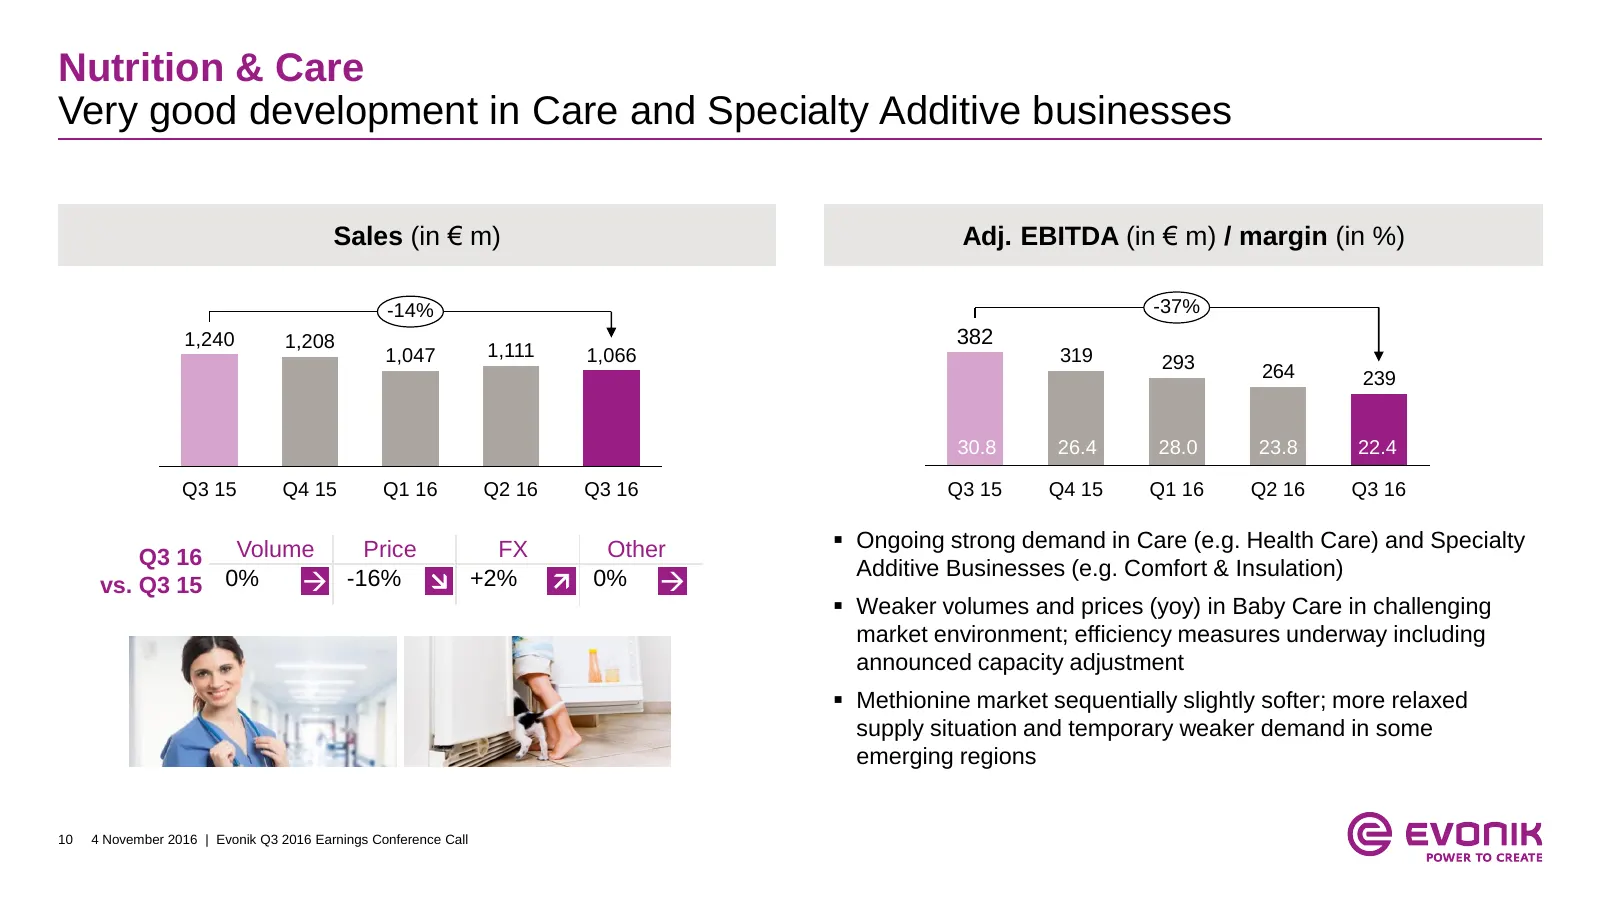
Slide 10: Nutrition & Care
Nutrition & Care Very good development in Care and Specialty Additive businesses Sales (in € m) Adj. EBITDA (in € m) / margin (in %) -14% -37% 1,240 1,208 382 1,047 1,111 1,066 319 293 264 239 30.8 26.4 28.0 23.8 22.4 Q3 15 Q4 15 Q1 16 Q2 16 Q3 16 Q3 15 Q4 15 Q1 16 Q2 16 Q3 16 Ongoing strong deman
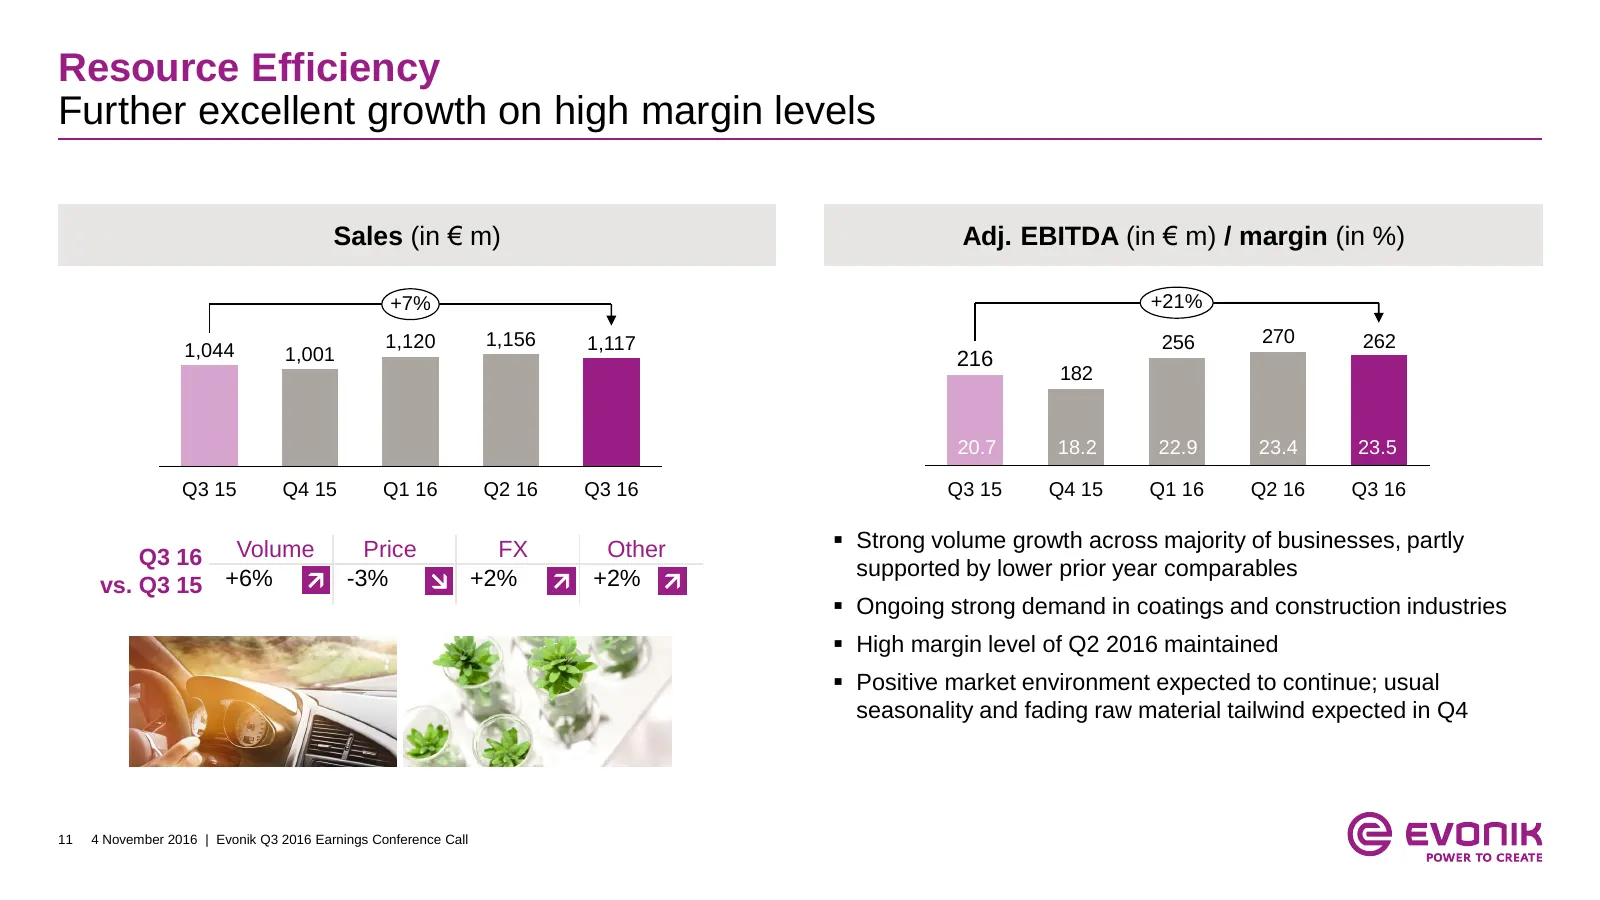
Slide 11: Resource Efficiency
Resource Efficiency Further excellent growth on high margin levels Sales (in € m) Adj. EBITDA (in € m) / margin (in %) +7% +21% 1,120 1,156 1,117 256 270 262 1,044 1,001 216 182 20.7 18.2 22.9 23.4 23.5 Q3 15 Q4 15 Q1 16 Q2 16 Q3 16 Q3 15 Q4 15 Q1 16 Q2 16 Q3 16 Strong volume growth across majorit
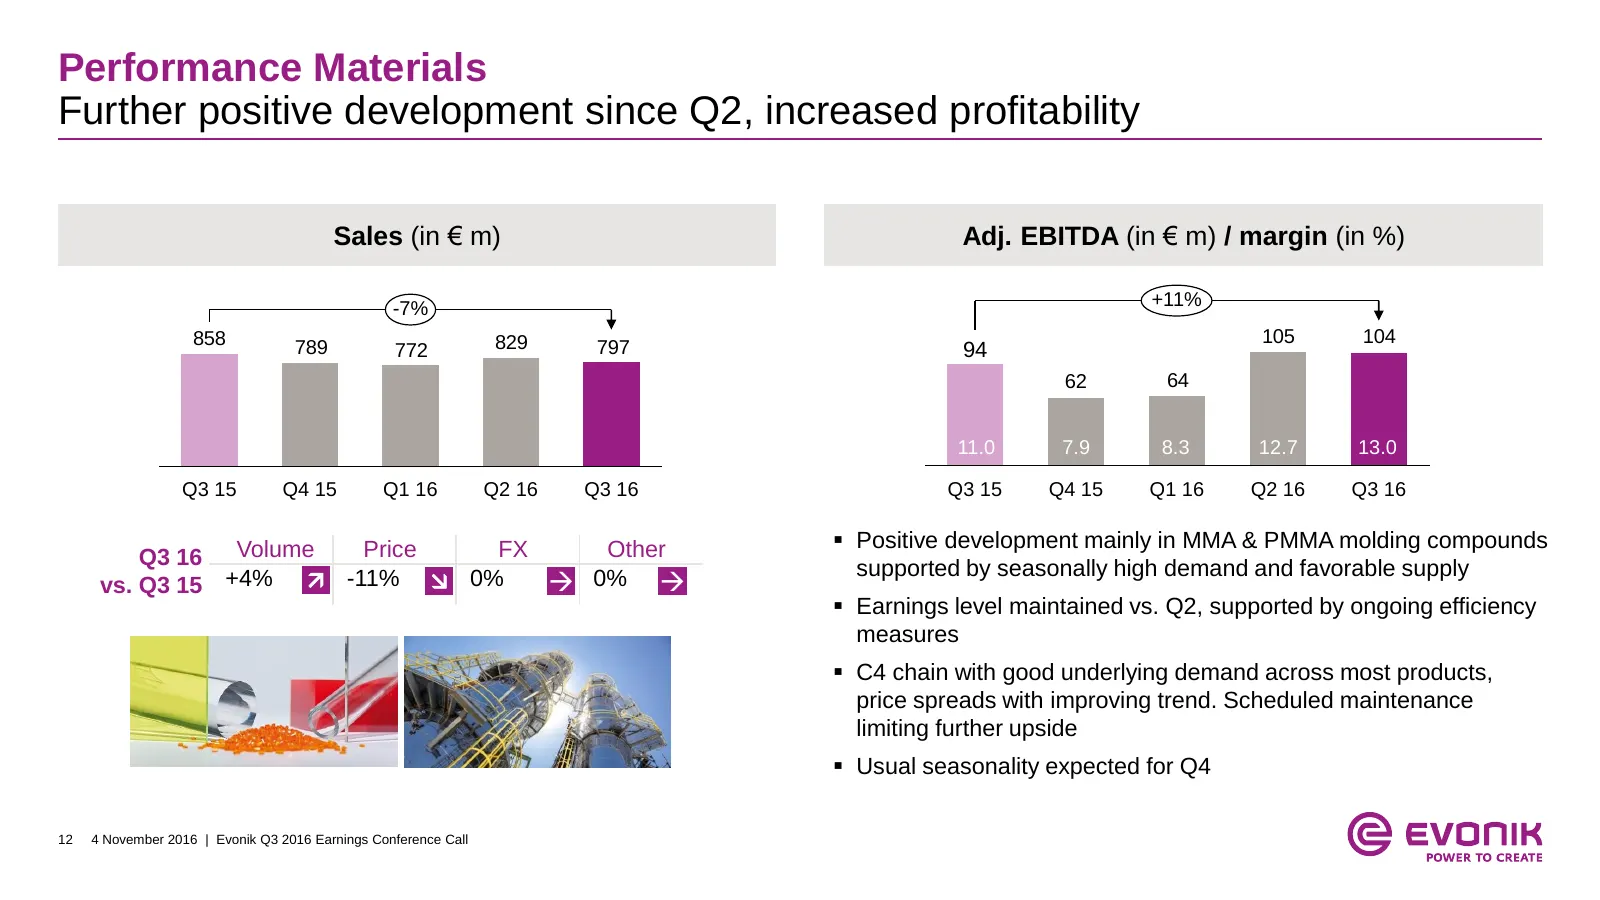
Slide 12: Performance Materials
Performance Materials Further positive development since Q2, increased profitability Sales (in € m) Adj. EBITDA (in € m) / margin (in %) -7% +11% 858 829 105 104 789 772 797 94 62 64 11.0 7.9 8.3 12.7 13.0 Q3 15 Q4 15 Q1 16 Q2 16 Q3 16 Q3 15 Q4 15 Q1 16 Q2 16 Q3 16 Positive development mainly in M
Slide 13: Spotlight pension accounting
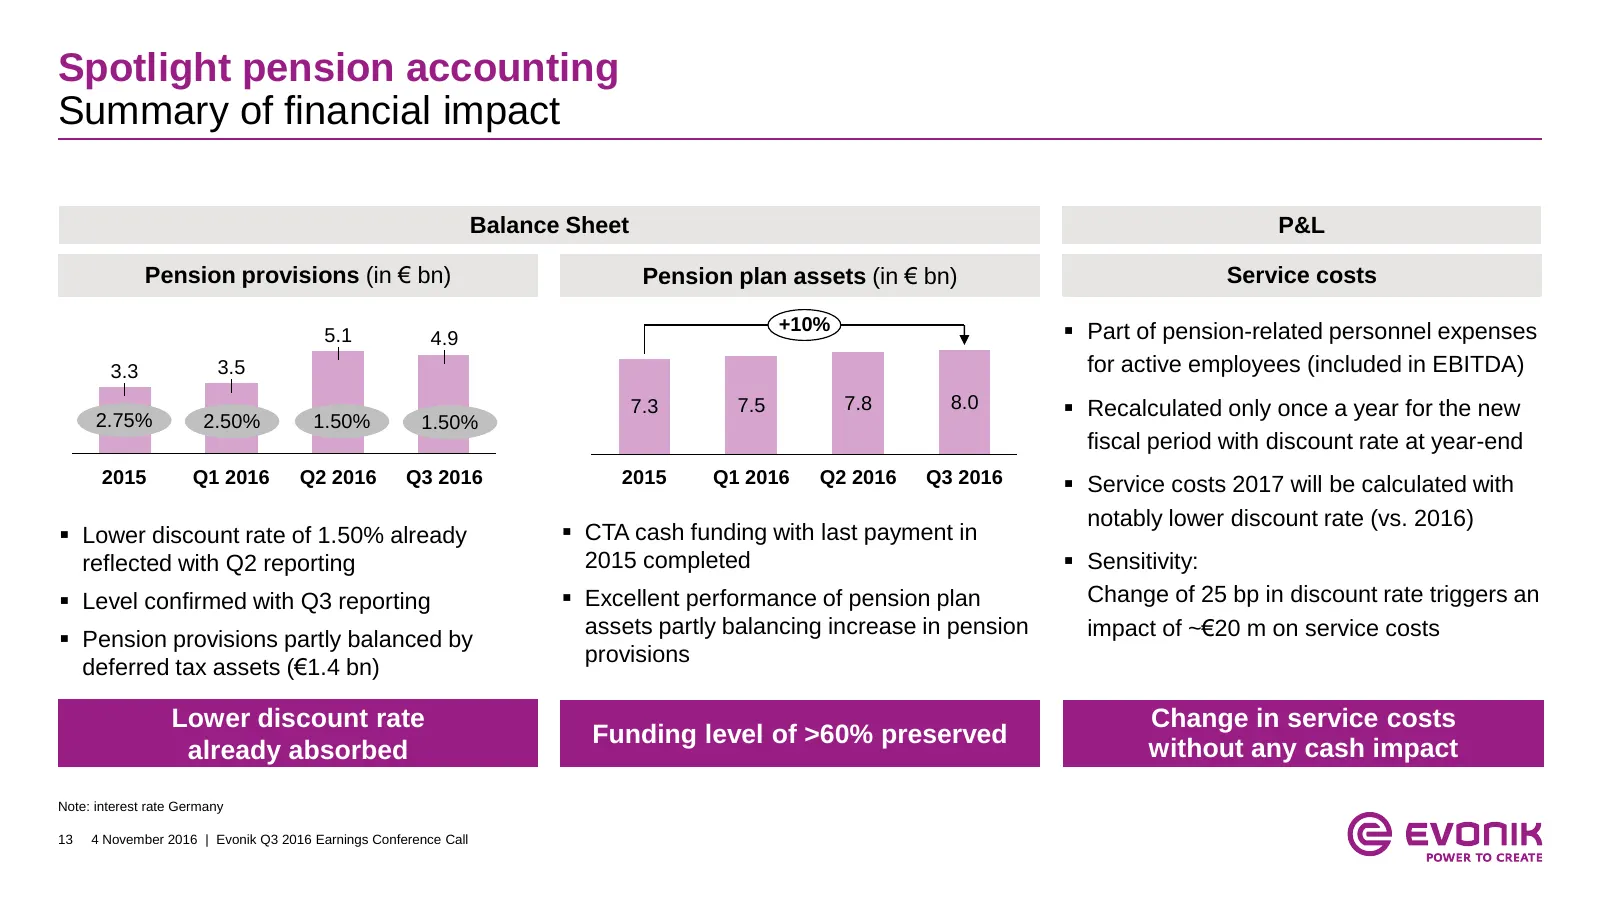
Spotlight pension accounting Summary of financial impact Balance Sheet P&L Pension provisions (in € bn) Pension plan assets (in € bn) Service costs +10% Part of pension-related personnel expenses 5.1 4.9 3.3 3.5 for active employees (included in EBITDA) 2.75% 7.3 7.5 7.8 8.0 Recalculated only on
Slide 14: Table of contents
Table of contents 1. Highlights Q3 2016 2. Financial performance Q3 2016 3. Outlook FY 2016 14 4 November 2016 | Evonik Q3 2016 Earnings Conference Call
Slide 15: Outlook for 2016 reiterated
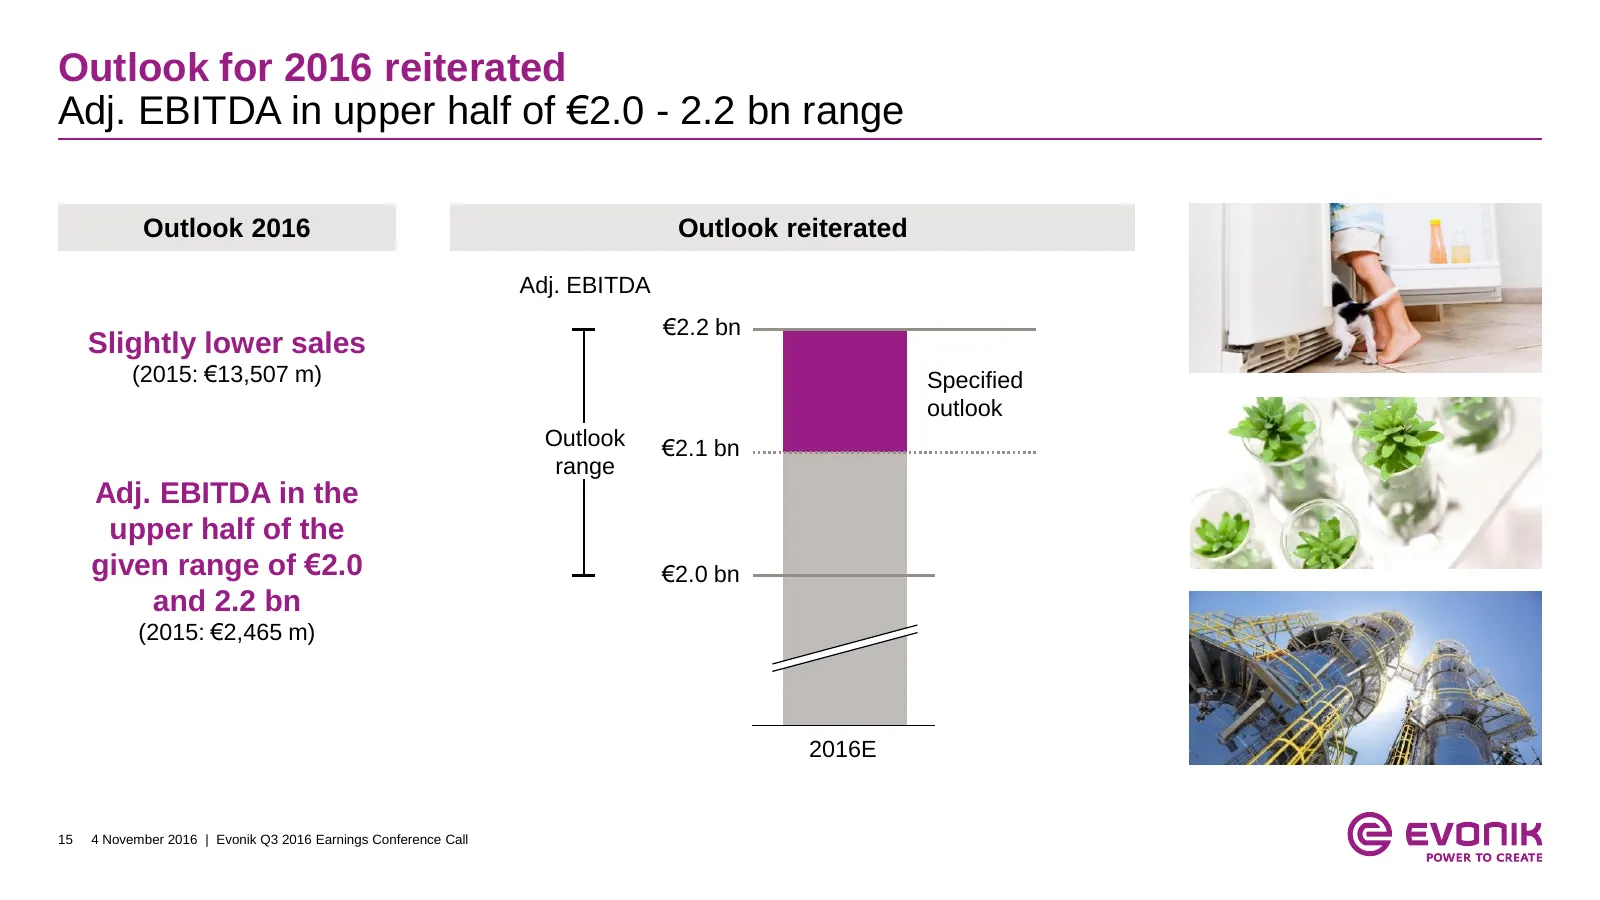
Outlook for 2016 reiterated Adj. EBITDA in upper half of €2.0 - 2.2 bn range Outlook 2016 Outlook reiterated Adj. EBITDA €2.2 bn Slightly lower sales (2015: €13,507 m) Specified outlook Outlook €2.1 bn range Adj. EBITDA in the upper half of the given range of €2.0 €2.0 bn and 2.2 bn (2015: €2,465 m)
Slide 16: Strong business fundamentals to be further strengthened by integration of Air Products
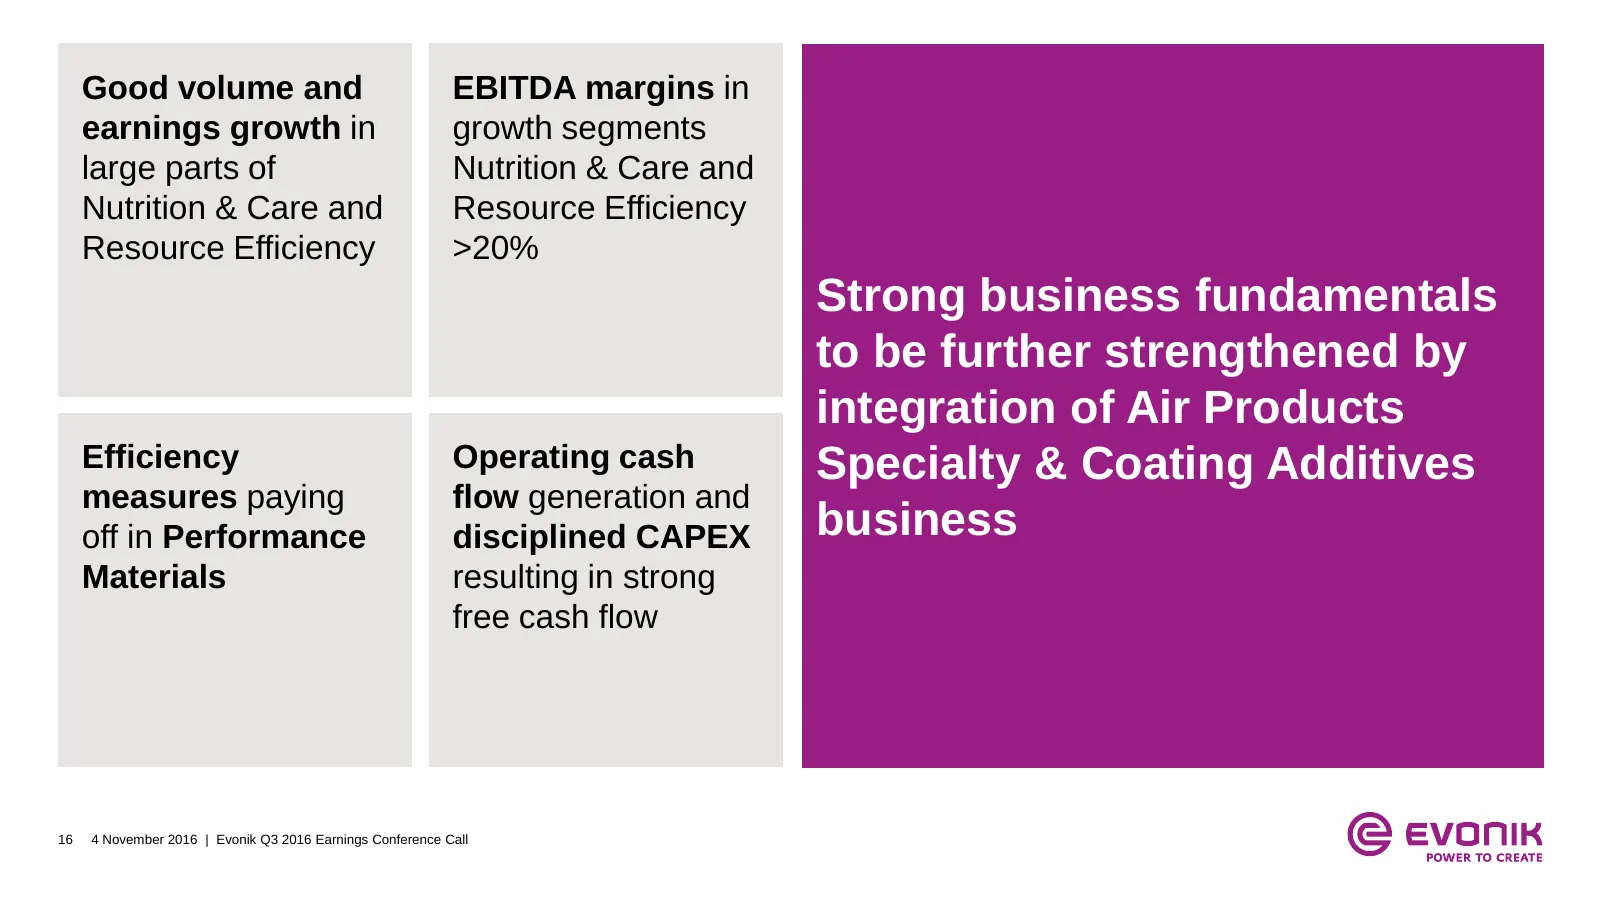
Good volume and EBITDA margins in earnings growth in growth segments large parts of Nutrition & Care and Nutrition & Care and Resource Efficiency Resource Efficiency >20% Strong business fundamentals to be further strengthened by integration of Air Products Efficiency Operating cash Specialty & Coat
Slide 17: © evonik
© evonik
Slide 18: Additional indications for 2016
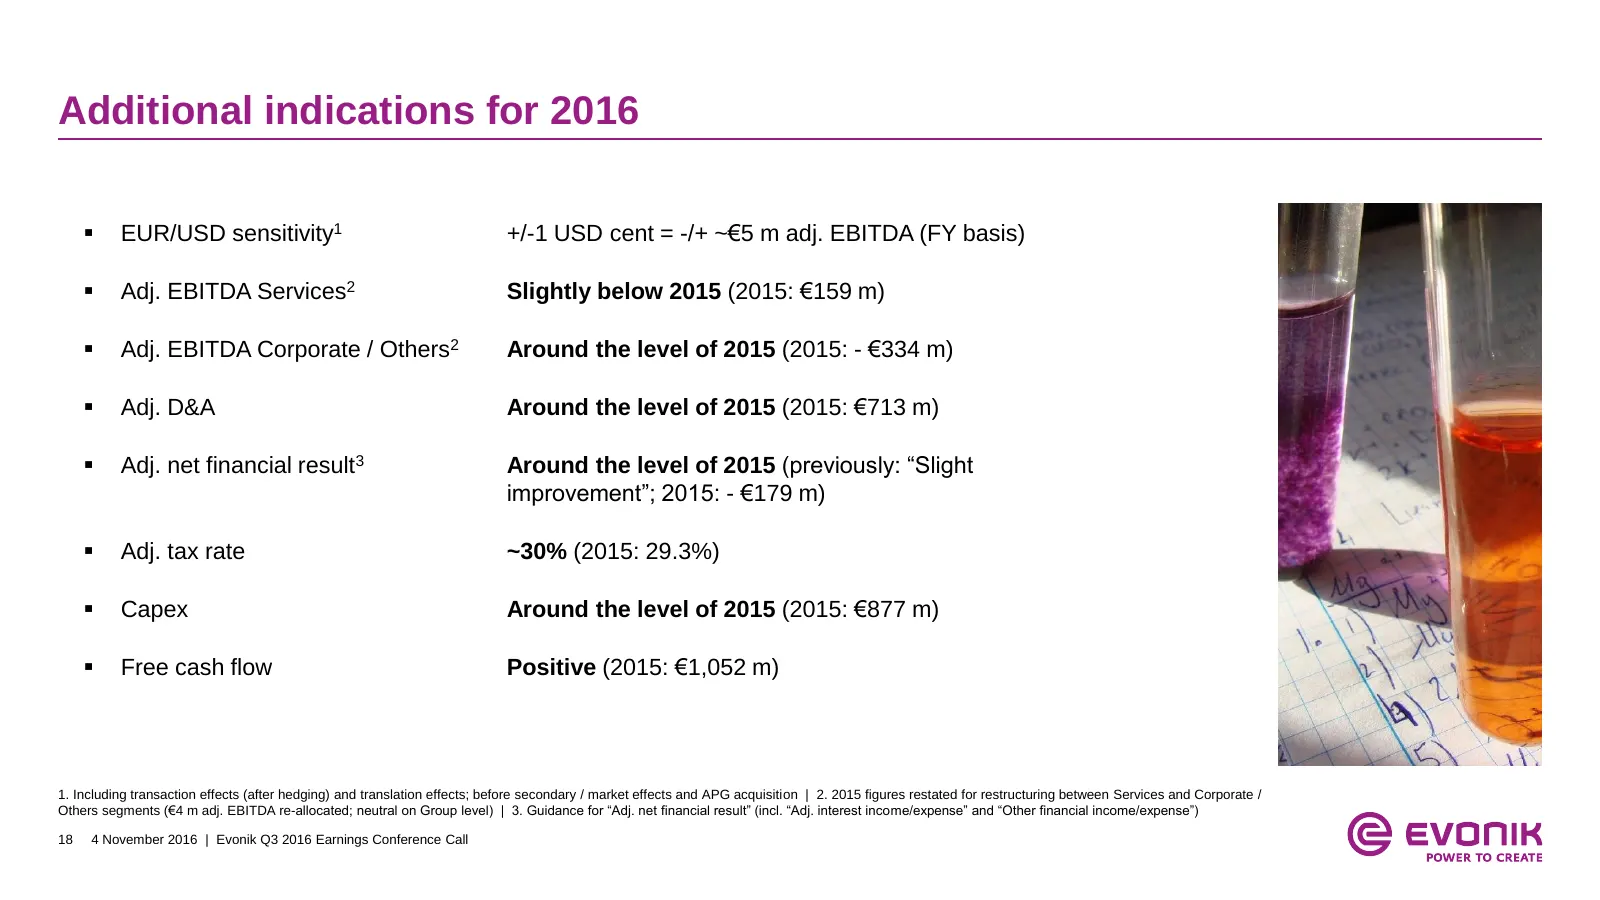
Additional indications for 2016 EUR/USD sensitivity1 +/-1 USD cent = -/+ ~€5 m adj. EBITDA (FY basis) Adj. EBITDA Services2 Slightly below 2015 (2015: €159 m) Adj. EBITDA Corporate / Others2 Around the level of 2015 (2015: - €334 m) Adj. D&A Around the level of 2015 (2015: €713 m) Adj. net
Slide 19: Nutrition & Care Q3 2016 Business Line comments
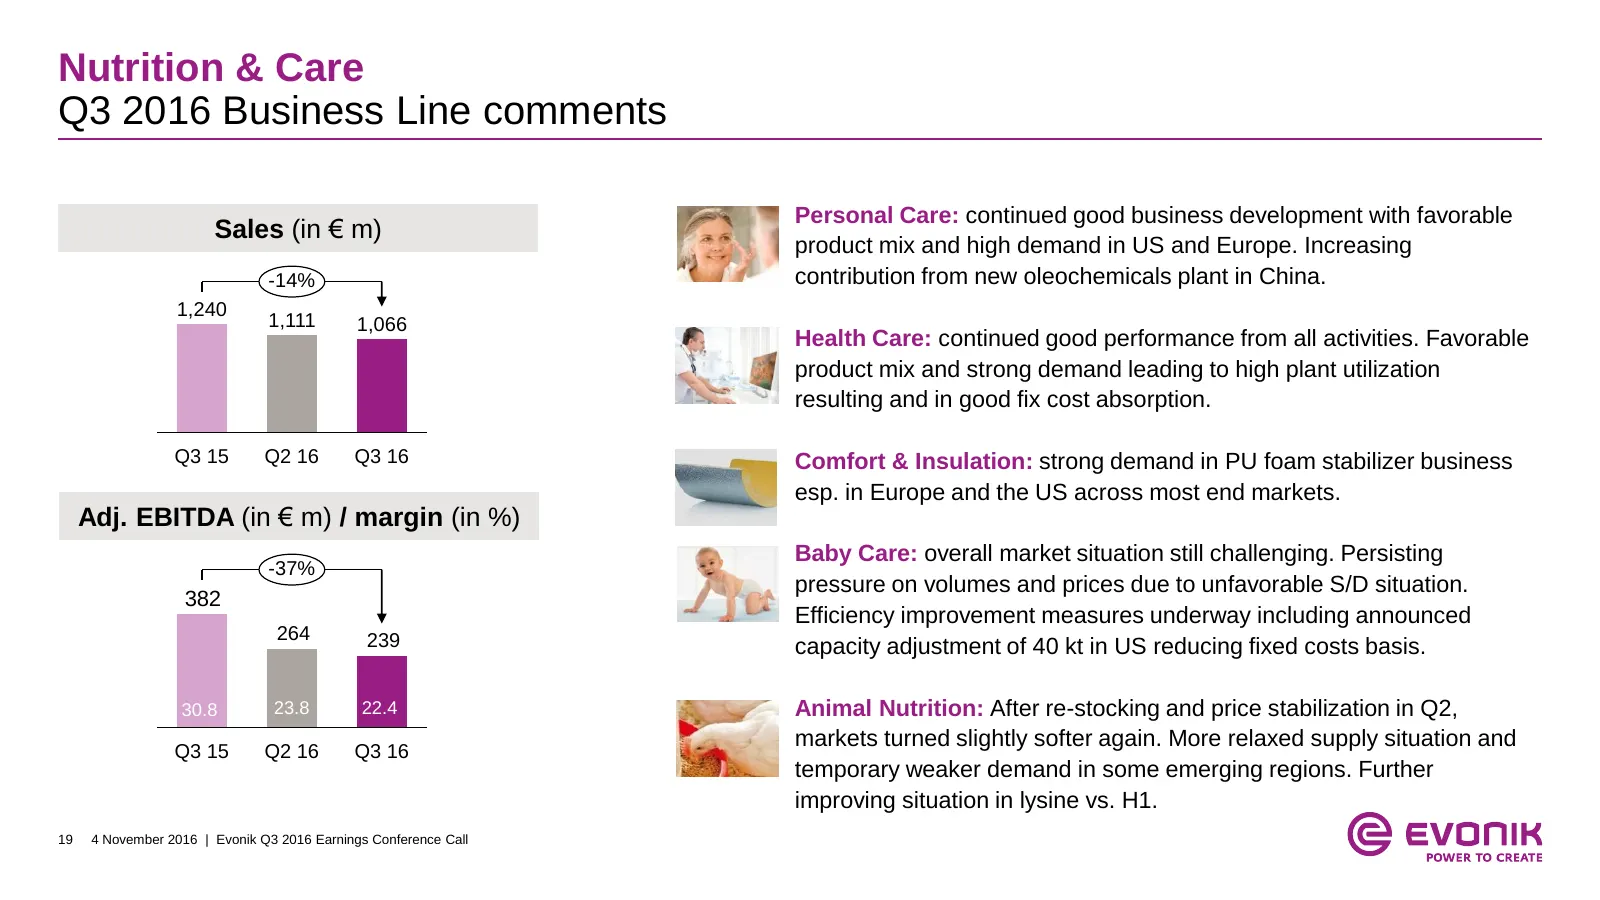
Nutrition & Care Q3 2016 Business Line comments Personal Care: continued good business development with favorable Sales (in € m) product mix and high demand in US and Europe. Increasing -14% contribution from new oleochemicals plant in China. 1,240 1,111 1,066 Health Care: continued good performance
Slide 20: Resource Efficiency Q3 2016 Business Line comments
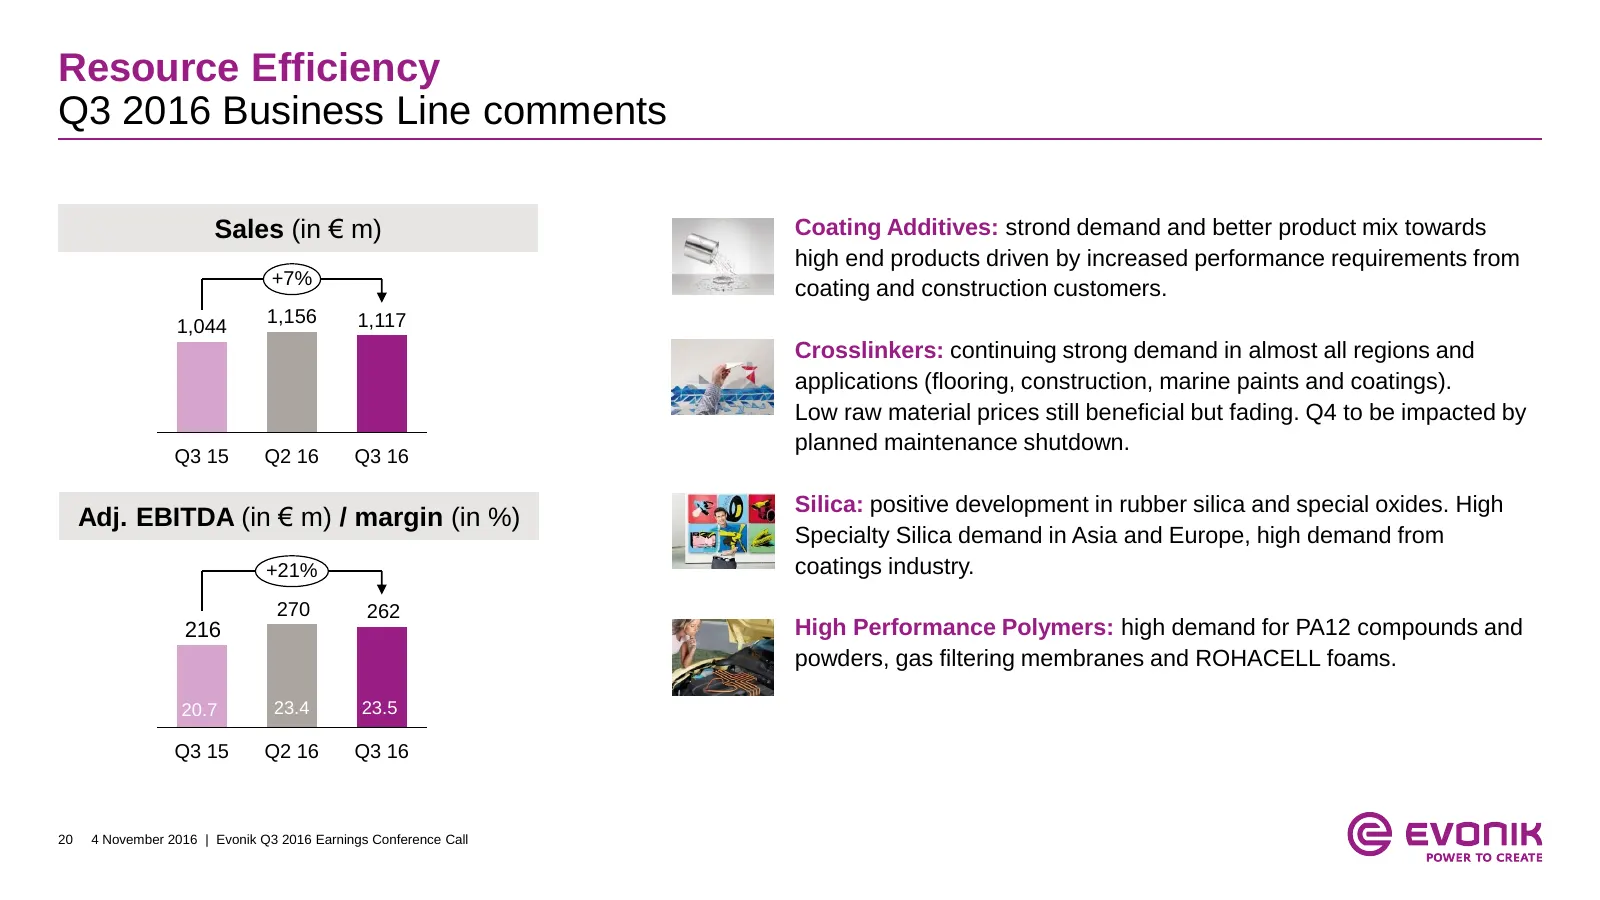
Resource Efficiency Q3 2016 Business Line comments Sales (in € m) Coating Additives: strond demand and better product mix towards high end products driven by increased performance requirements from +7% coating and construction customers. 1,156 1,117 1,044 Crosslinkers: continuing strong demand in al
Slide 21: Performance Materials Q3 2016 Business Line comments
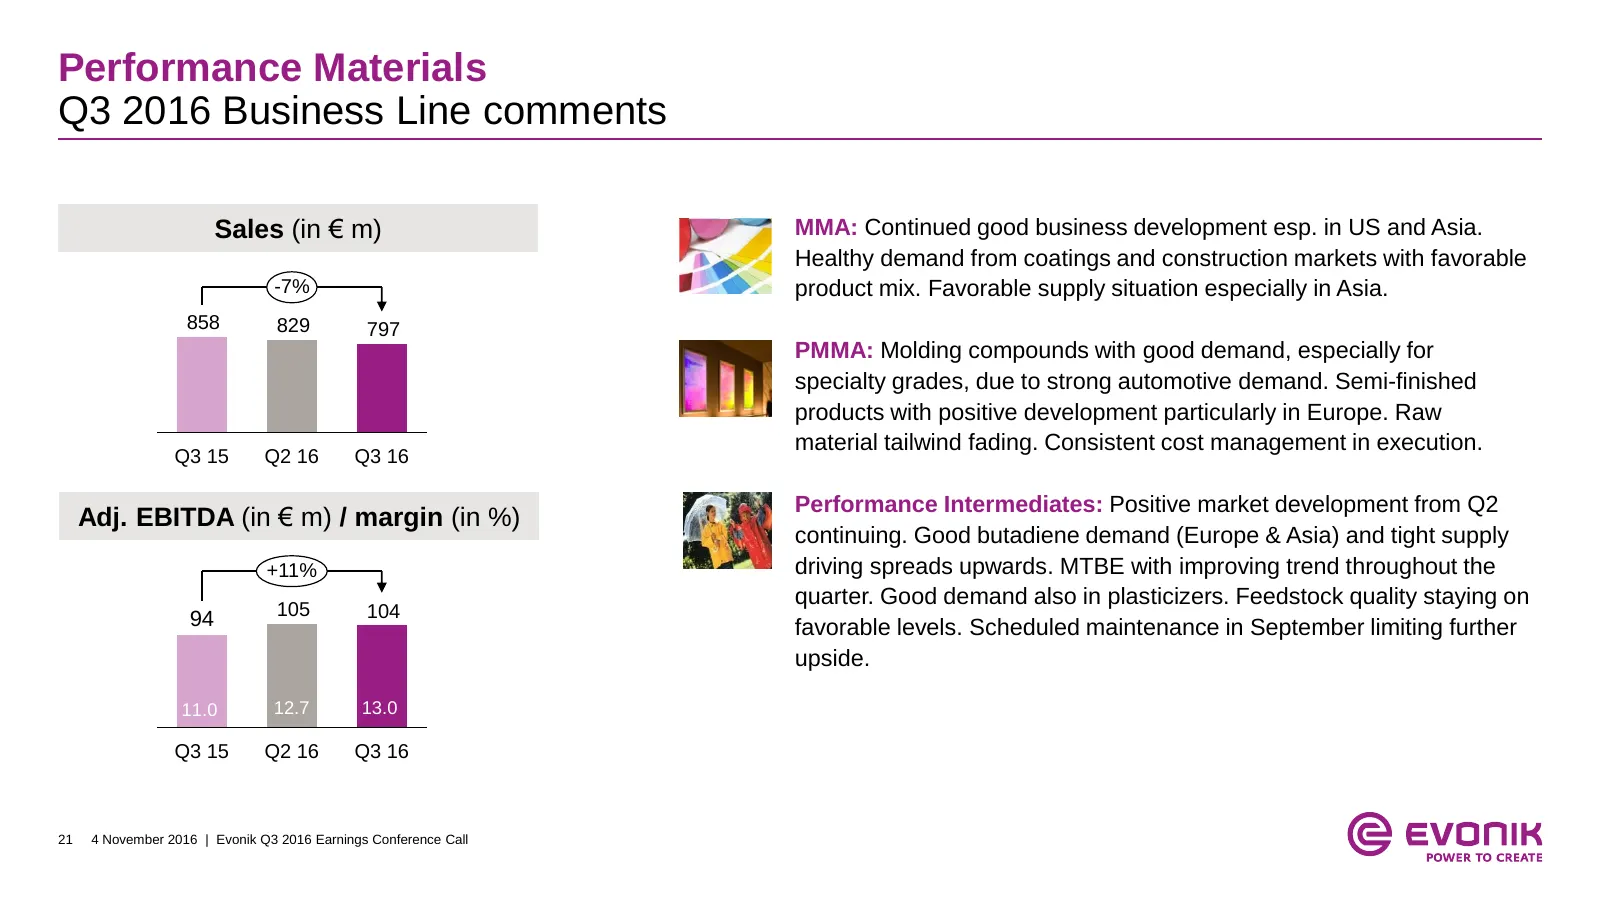
Performance Materials Q3 2016 Business Line comments Sales (in € m) MMA: Continued good business development esp. in US and Asia. Healthy demand from coatings and construction markets with favorable -7% product mix. Favorable supply situation especially in Asia. 858 829 797 PMMA: Molding compounds w
Slide 22: Services and Corporate / Others Q3 2016 segment comments
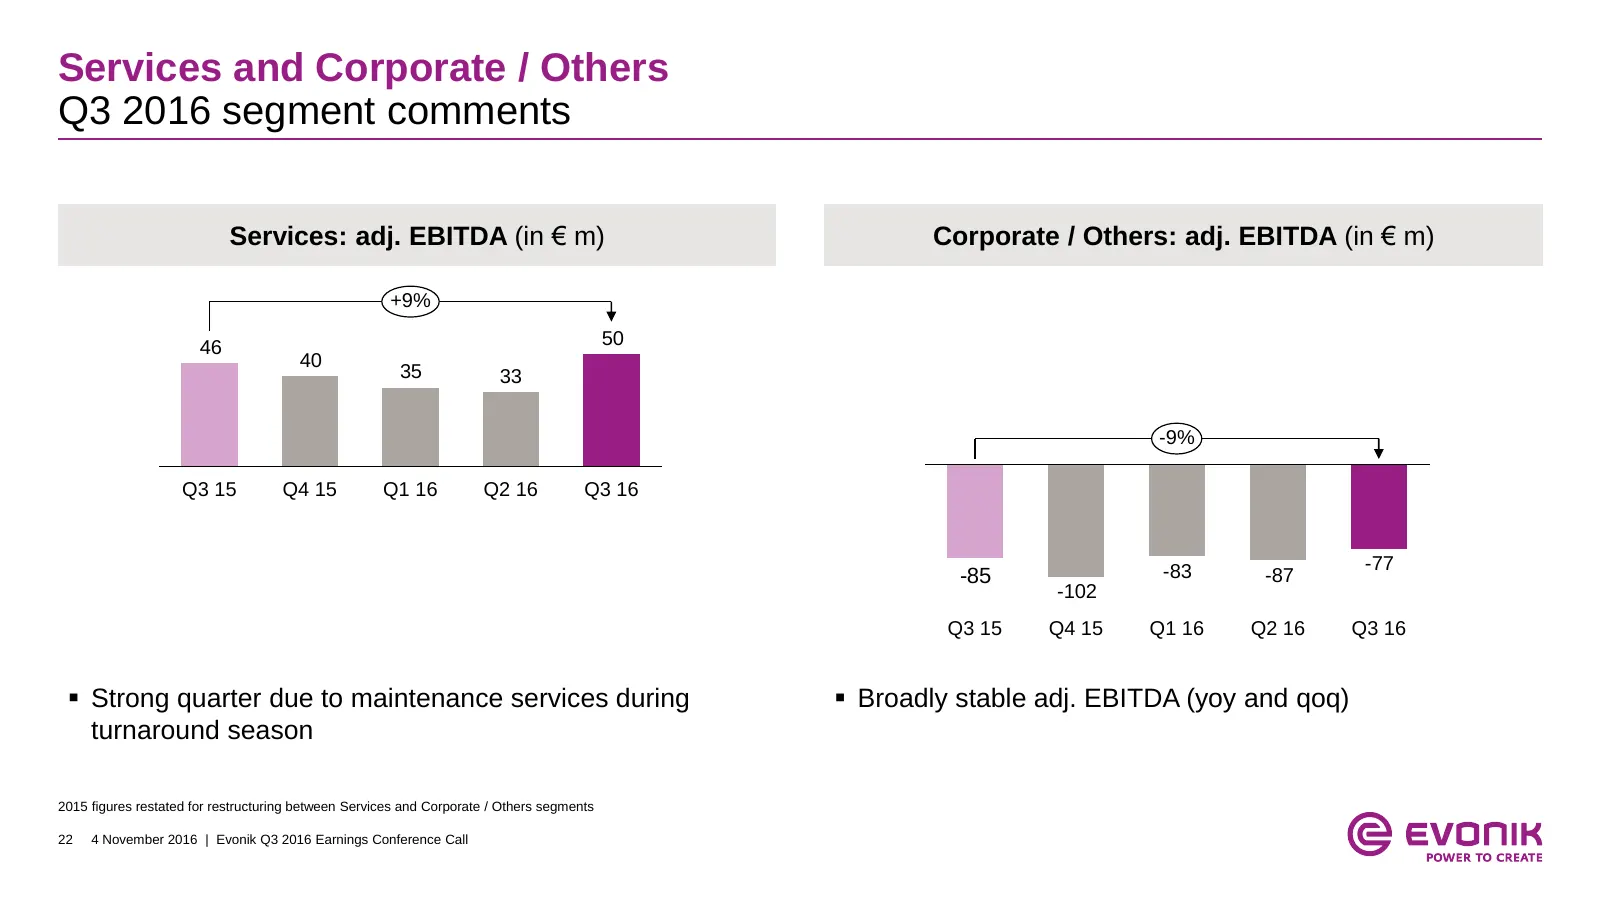
Services and Corporate / Others Q3 2016 segment comments Services: adj. EBITDA (in € m) Corporate / Others: adj. EBITDA (in € m) +9% 46 50 40 35 33 -9% Q3 15 Q4 15 Q1 16 Q2 16 Q3 16 -83 -77 -85 -87 -102 Q3 15 Q4 15 Q1 16 Q2 16 Q3 16 Strong quarter due to maintenance services during Broadly stabl
Slide 23: Net financial position
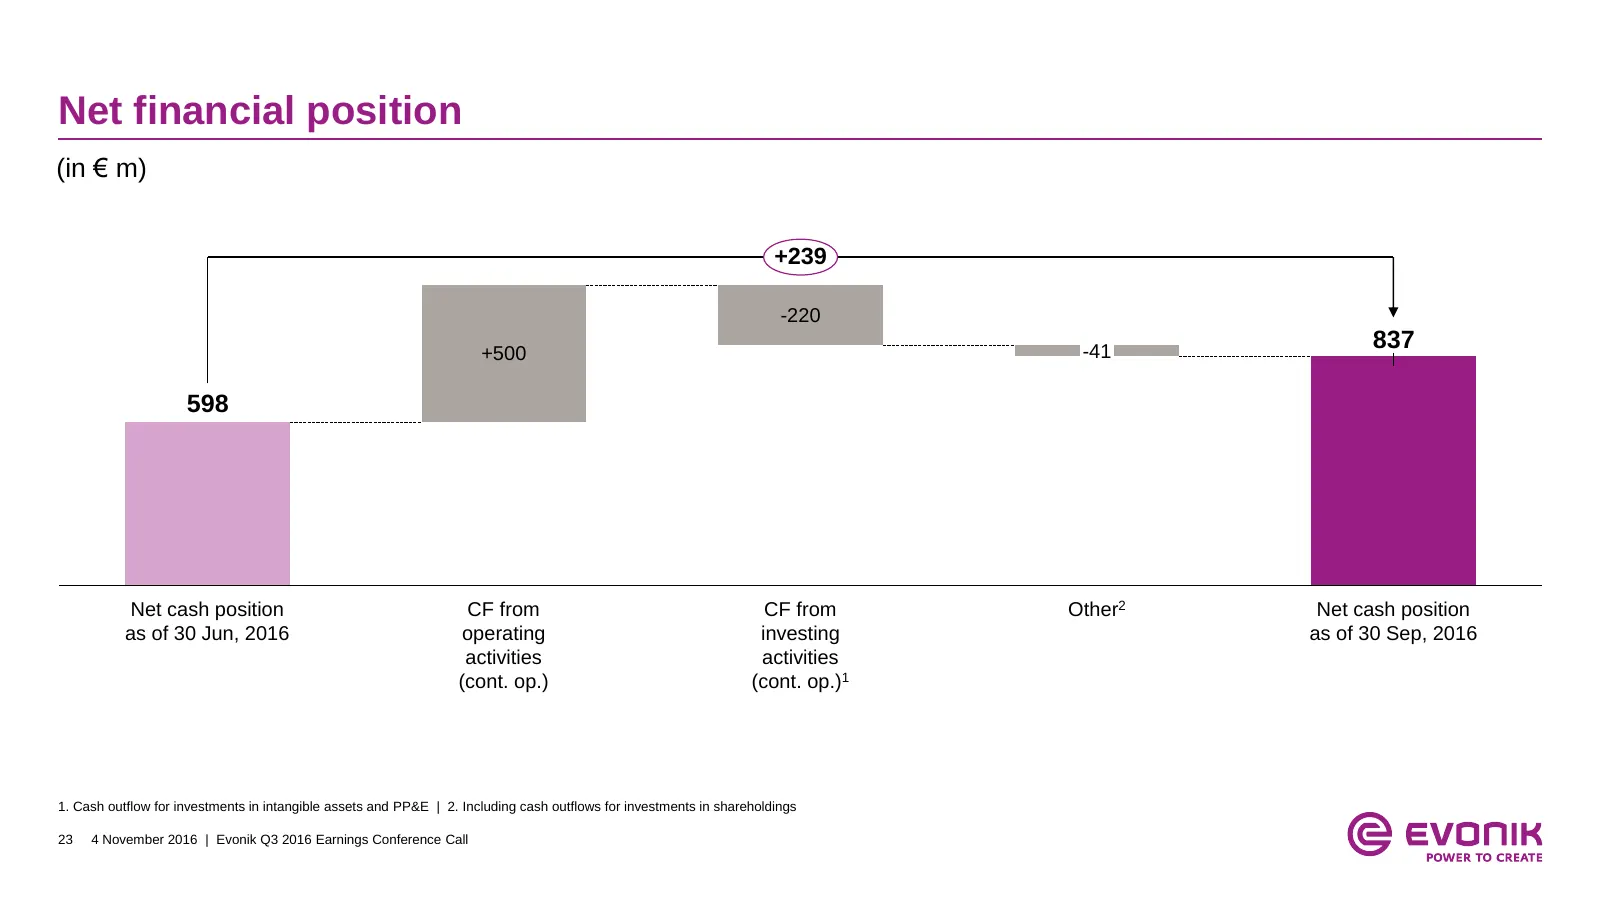
Net financial position (in € m) +239 -220 -41 837 +500 598 Net cash position CF from CF from Other2 Net cash position as of 30 Jun, 2016 operating investing as of 30 Sep, 2016 activities activities (cont. op.) (cont. op.)1 1. Cash outflow for investments in intangible assets and PP&E | 2. Including
Slide 24: Net debt development
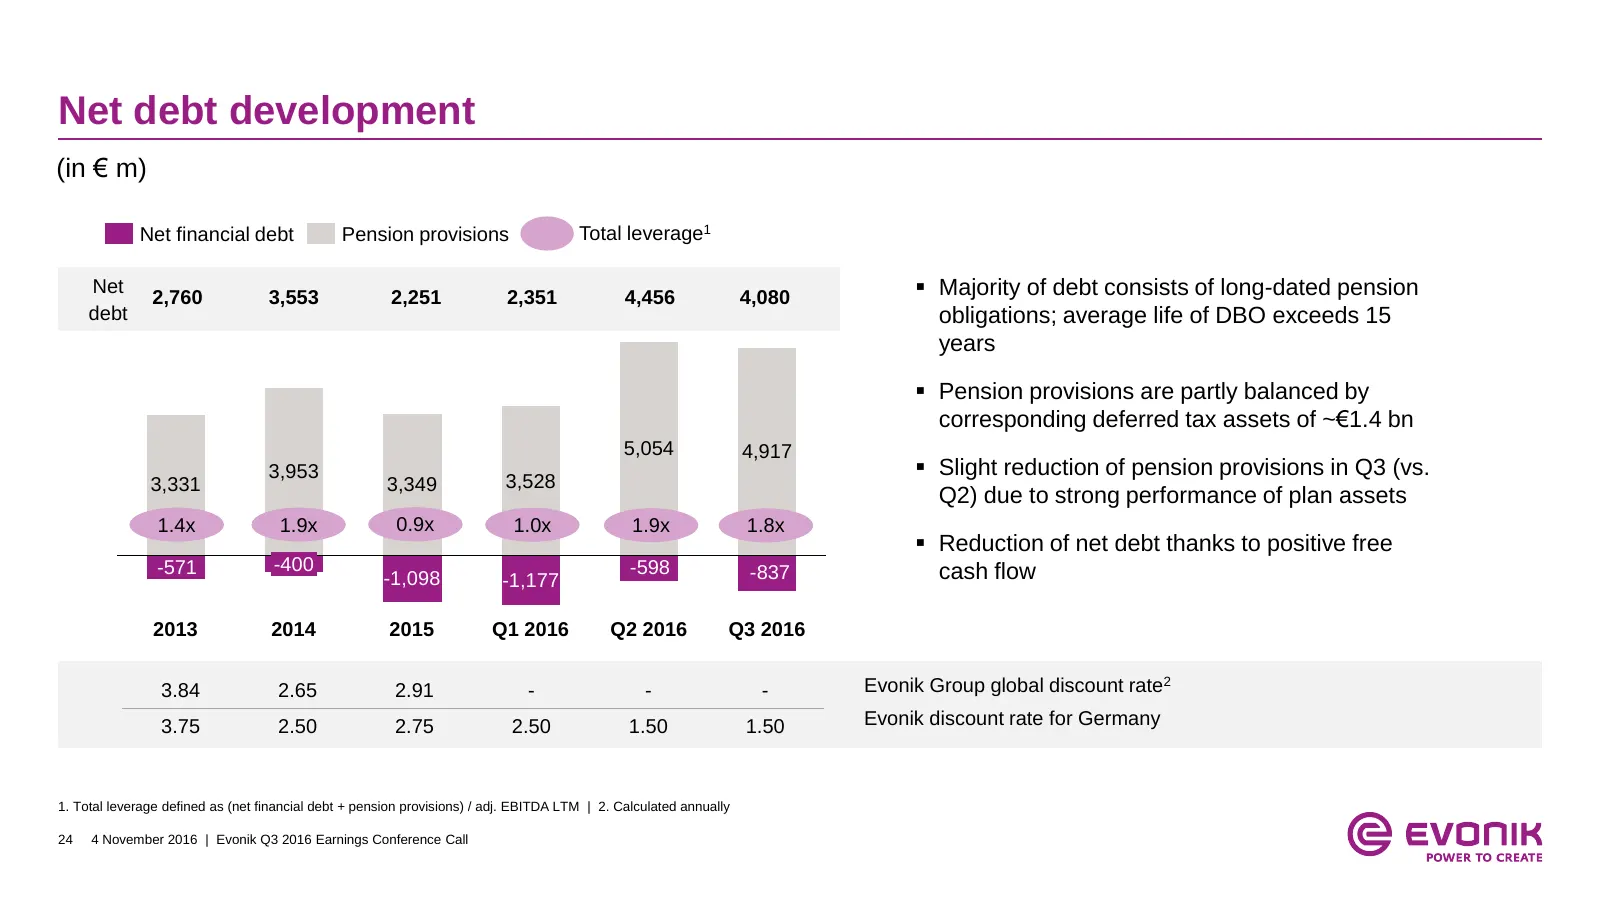
Net debt development (in € m) Net financial debt Pension provisions Total leverage1 Net 2,760 3,553 2,251 2,351 4,456 4,080 Majority of debt consists of long-dated pension debt obligations; average life of DBO exceeds 15 years Pension provisions are partly balanced by corresponding deferred tax
Slide 25: Pension accounting: reconciliation of pension provision
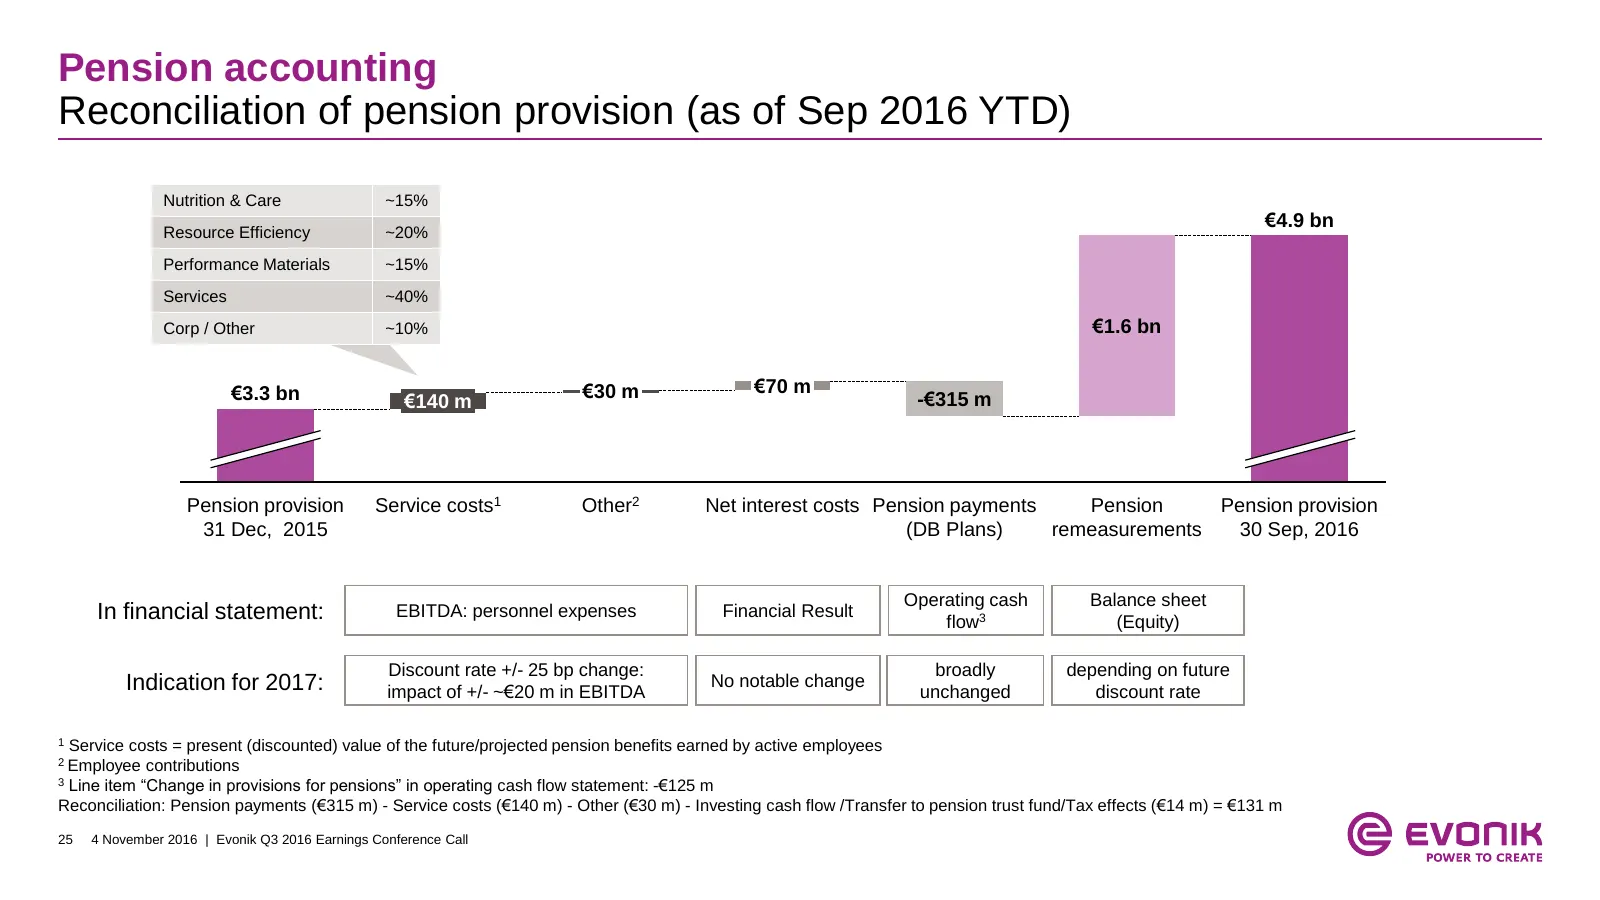
Pension accounting Reconciliation of pension provision (as of Sep 2016 YTD) Nutrition & Care ~15% €4.9 bn Resource Efficiency ~20% Performance Materials ~15% Services ~40% Corp / Other ~10% €1.6 bn €3.3 bn €30 m €70 m €140 m -€315 m Pension provision Service costs1 Other2 Net interest costs Pension
Slide 26: Adjusted income statement
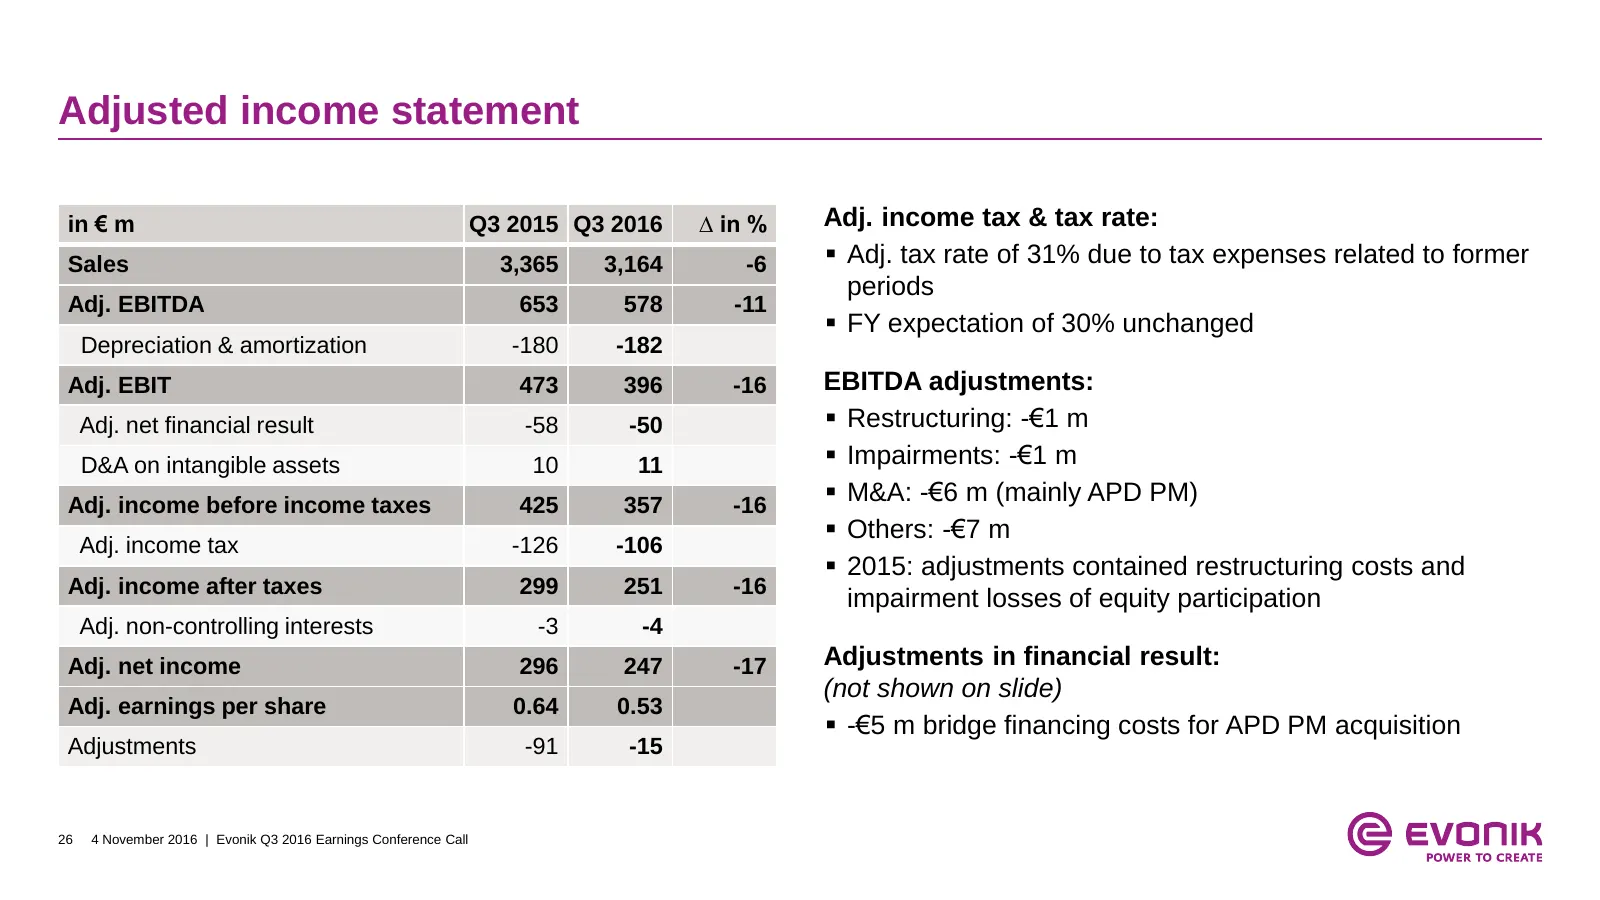
Adjusted income statement in € m Q3 2015 Q3 2016 ∆ in % Adj. income tax & tax rate: Sales 3,365 3,164 -6 Adj. tax rate of 31% due to tax expenses related to former periods Adj. EBITDA 653 578 -11 FY expectation of 30% unchanged Depreciation & amortization -180 -182 Adj. EBIT 473 396 -16 EBITDA a
Slide 27: Cash flow statement
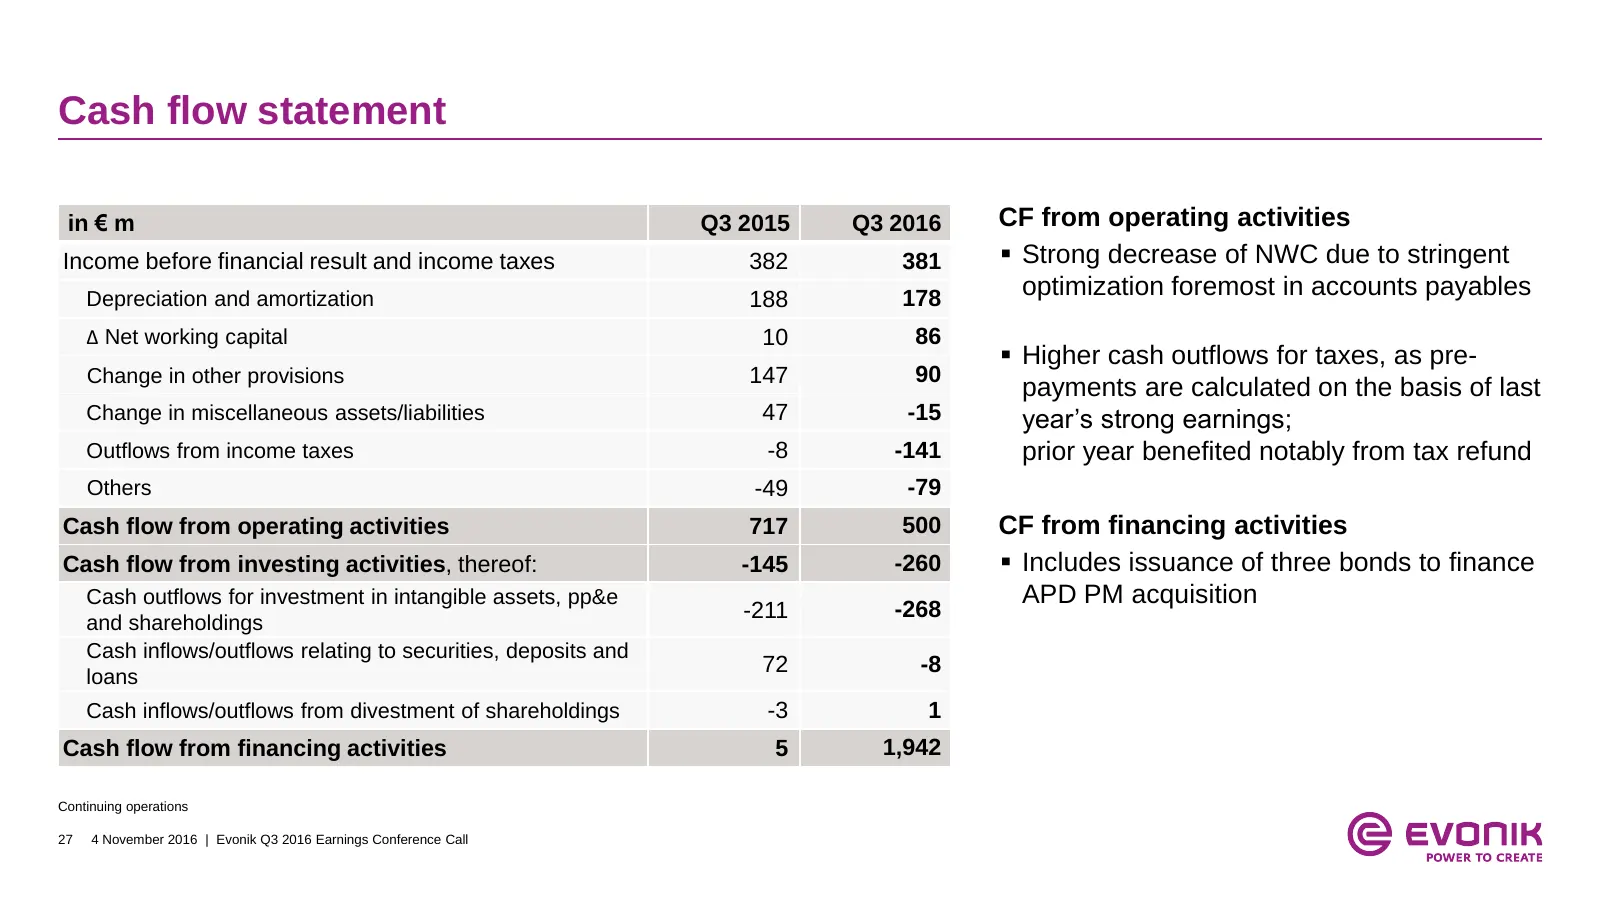
Cash flow statement in € m Q3 2015 Q3 2016 CF from operating activities Income before financial result and income taxes 382 381 Strong decrease of NWC due to stringent Depreciation and amortization 188 178 optimization foremost in accounts payables ∆ Net working capital 10 86 Higher cash outflow
Slide 28: Segment overview by quarter
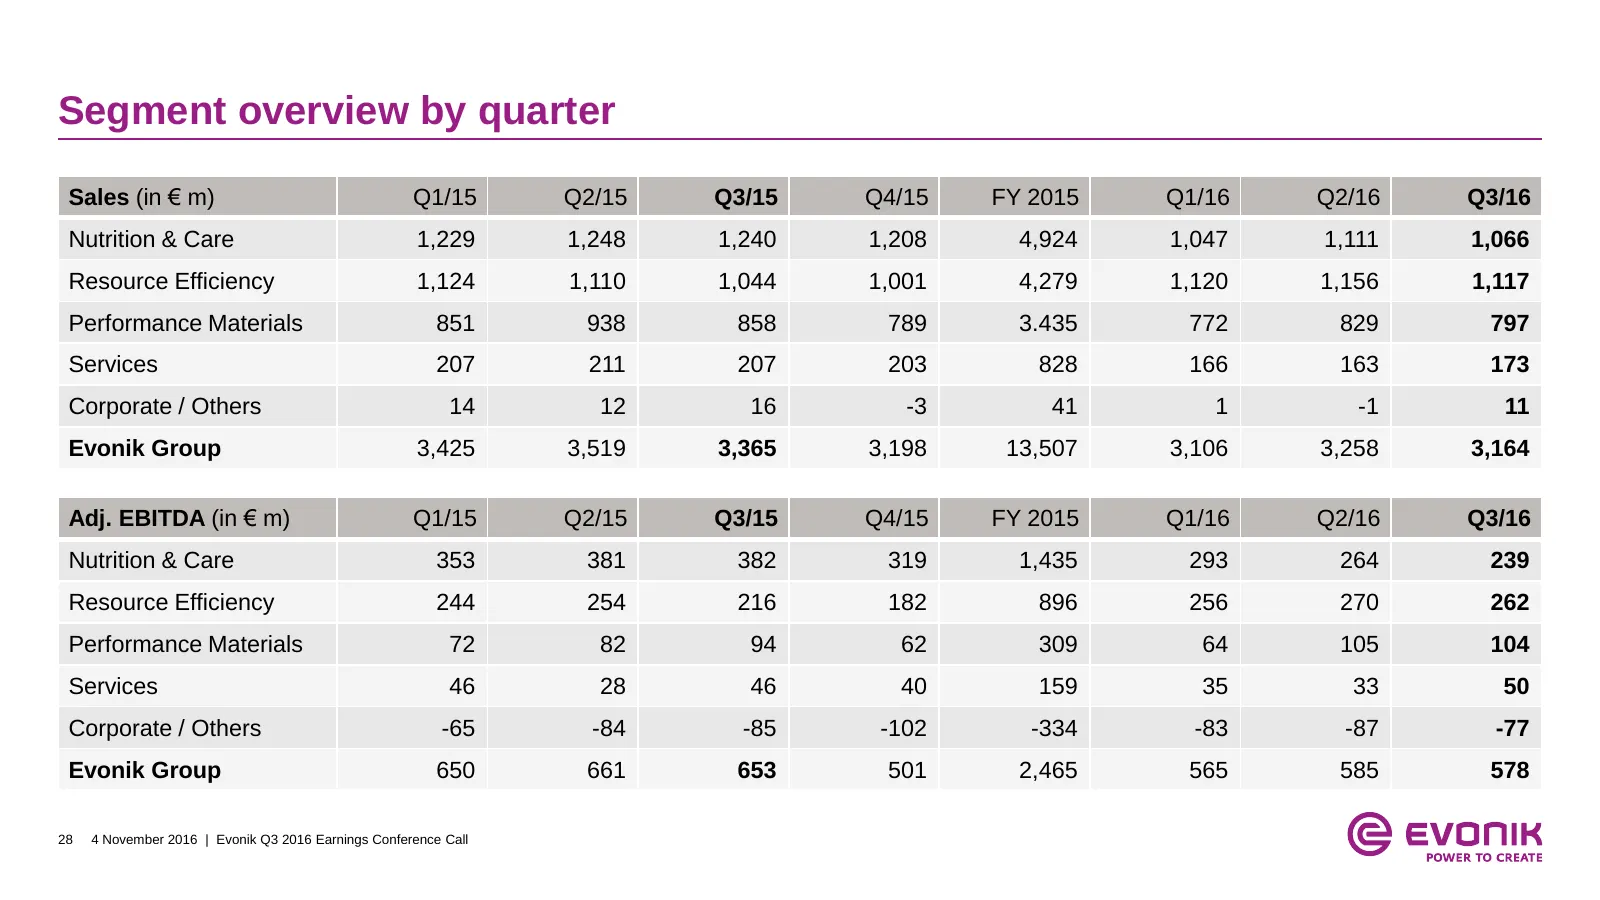
Segment overview by quarter Sales (in € m) Q1/15 Q2/15 Q3/15 Q4/15 FY 2015 Q1/16 Q2/16 Q3/16 Nutrition & Care 1,229 1,248 1,240 1,208 4,924 1,047 1,111 1,066 Resource Efficiency 1,124 1,110 1,044 1,001 4,279 1,120 1,156 1,117 Performance Materials 851 938 858 789 3.435 772 829 797 Services 207 211 2
Slide 29: Upcoming IR events
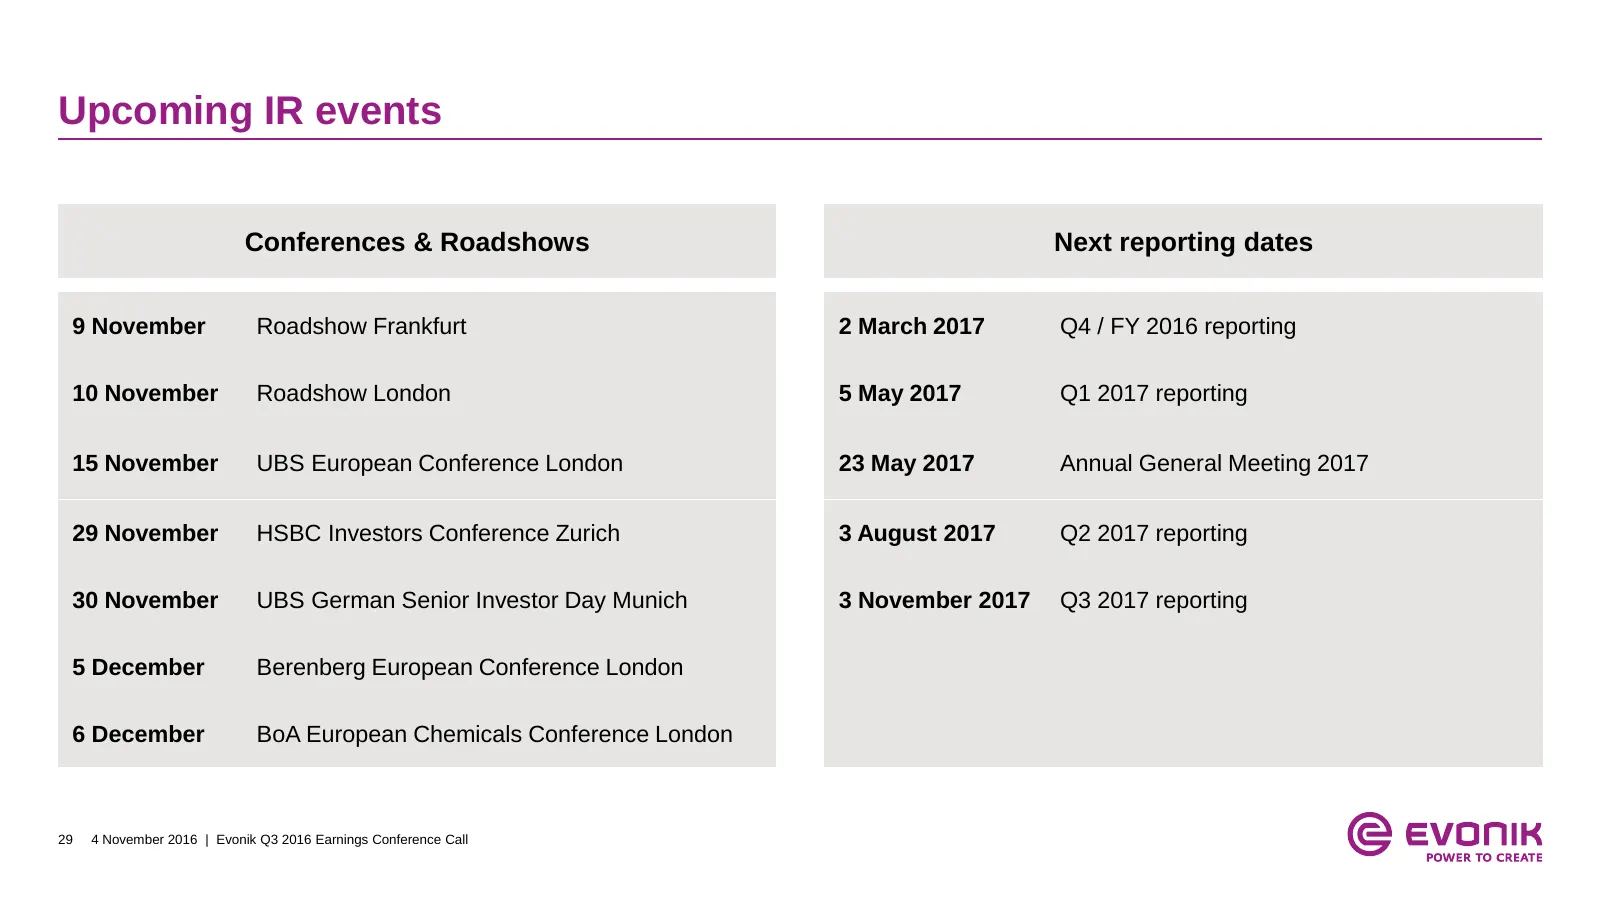
Upcoming IR events Conferences & Roadshows Next reporting dates 9 November Roadshow Frankfurt 2 March 2017 Q4 / FY 2016 reporting 10 November Roadshow London 5 May 2017 Q1 2017 reporting 15 November UBS European Conference London 23 May 2017 Annual General Meeting 2017 29 November HSBC Investors Con
Slide 30: Evonik Investor Relations team
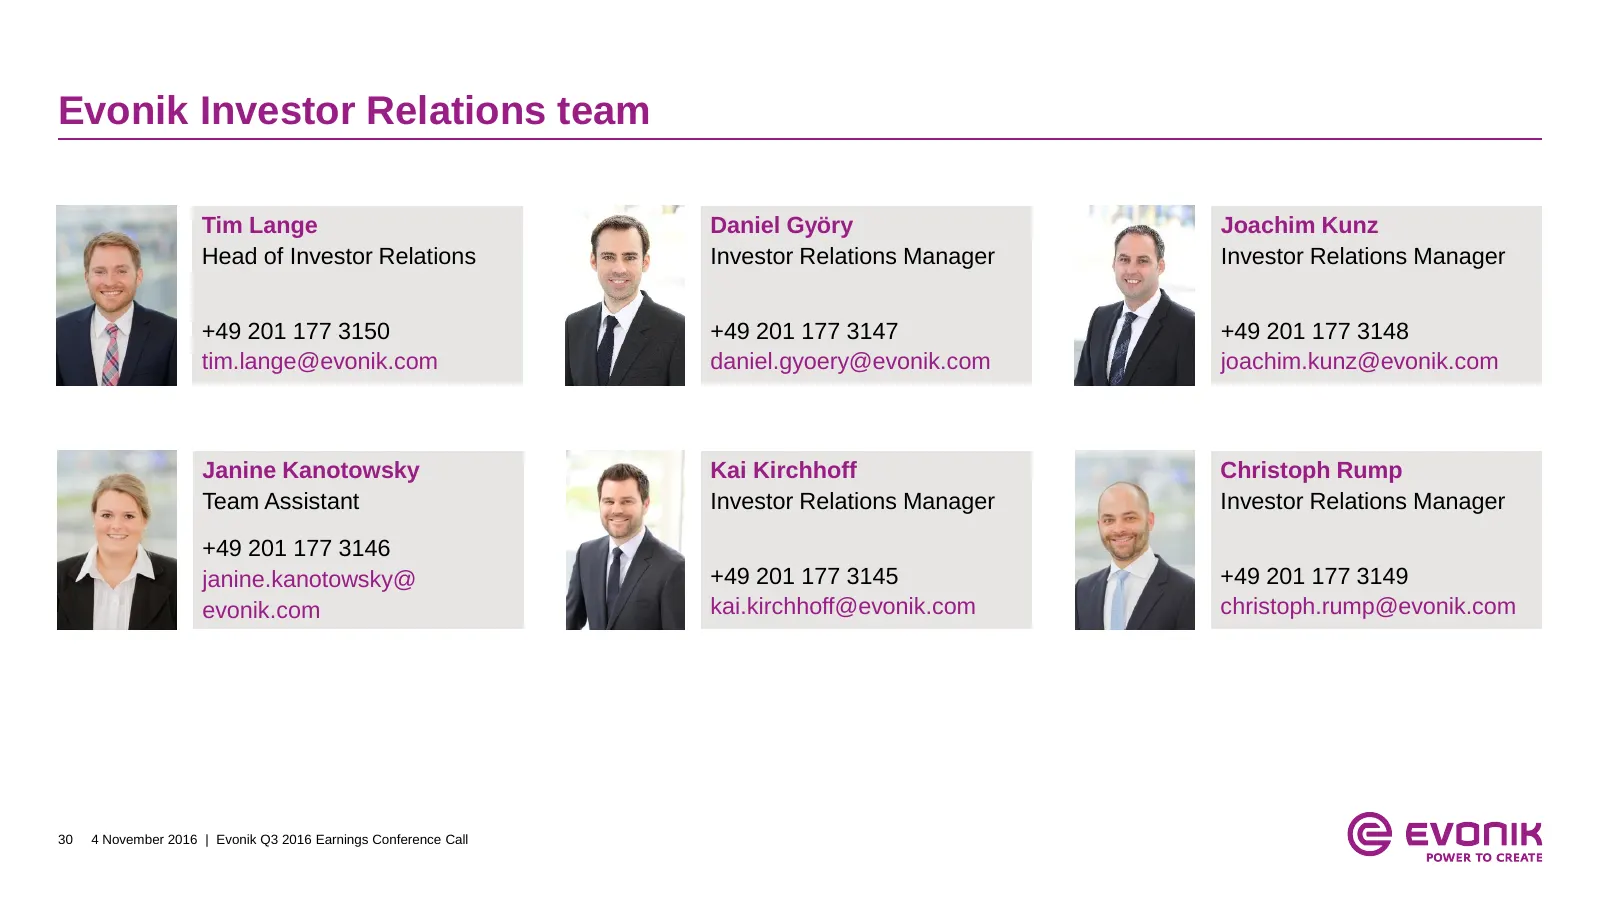
Evonik Investor Relations team Tim Lange Daniel Györy Joachim Kunz Head of Investor Relations Investor Relations Manager Investor Relations Manager +49 201 177 3150 +49 201 177 3147 +49 201 177 3148 tim.lange@evonik.com daniel.gyoery@evonik.com joachim.kunz@evonik.com Janine Kanotowsky Kai Kirchhoff
Slide 31: Disclaimer
Disclaimer In so far as forecasts or expectations are expressed in this presentation or where our statements concern the future, these forecasts, expectations or statements may involve known or unknown risks and uncertainties. Actual results or developments may vary, depending on changes in the oper
Slide 32: © evonik
© evonik
Source: Internet Archive copy of corporate.evonik.de
More decks from Evonik Industries AG
 Q3 2026 Earnings Presentation34 slides · Nov 3, 2026
 Q2 2026 Earnings Presentation27 slides · Aug 4, 2026
 Q2 2026 Earnings Presentation39 slides · August 2026
 Q1 2026 Earnings Presentation26 slides · May 8, 2026
 Q4 2025 Earnings Presentation44 slides · Feb 5, 2026
 Q3 2025 Earnings Presentation35 slides · Nov 4, 2025