Barratt Redrow plc · LSE:BTRW
Barratt Redrow — Barratt Developments — FY2016 Earnings Presentation
48 slides from Barratt Redrow's earnings presentation, Sep 7, 2016
Slide 1: Results presentation Year ended 30 June 2016
Full Year 2016 1 Results presentation Year ended 30 June 2016 7 September 2016
Slide 2: Another year of strong performance
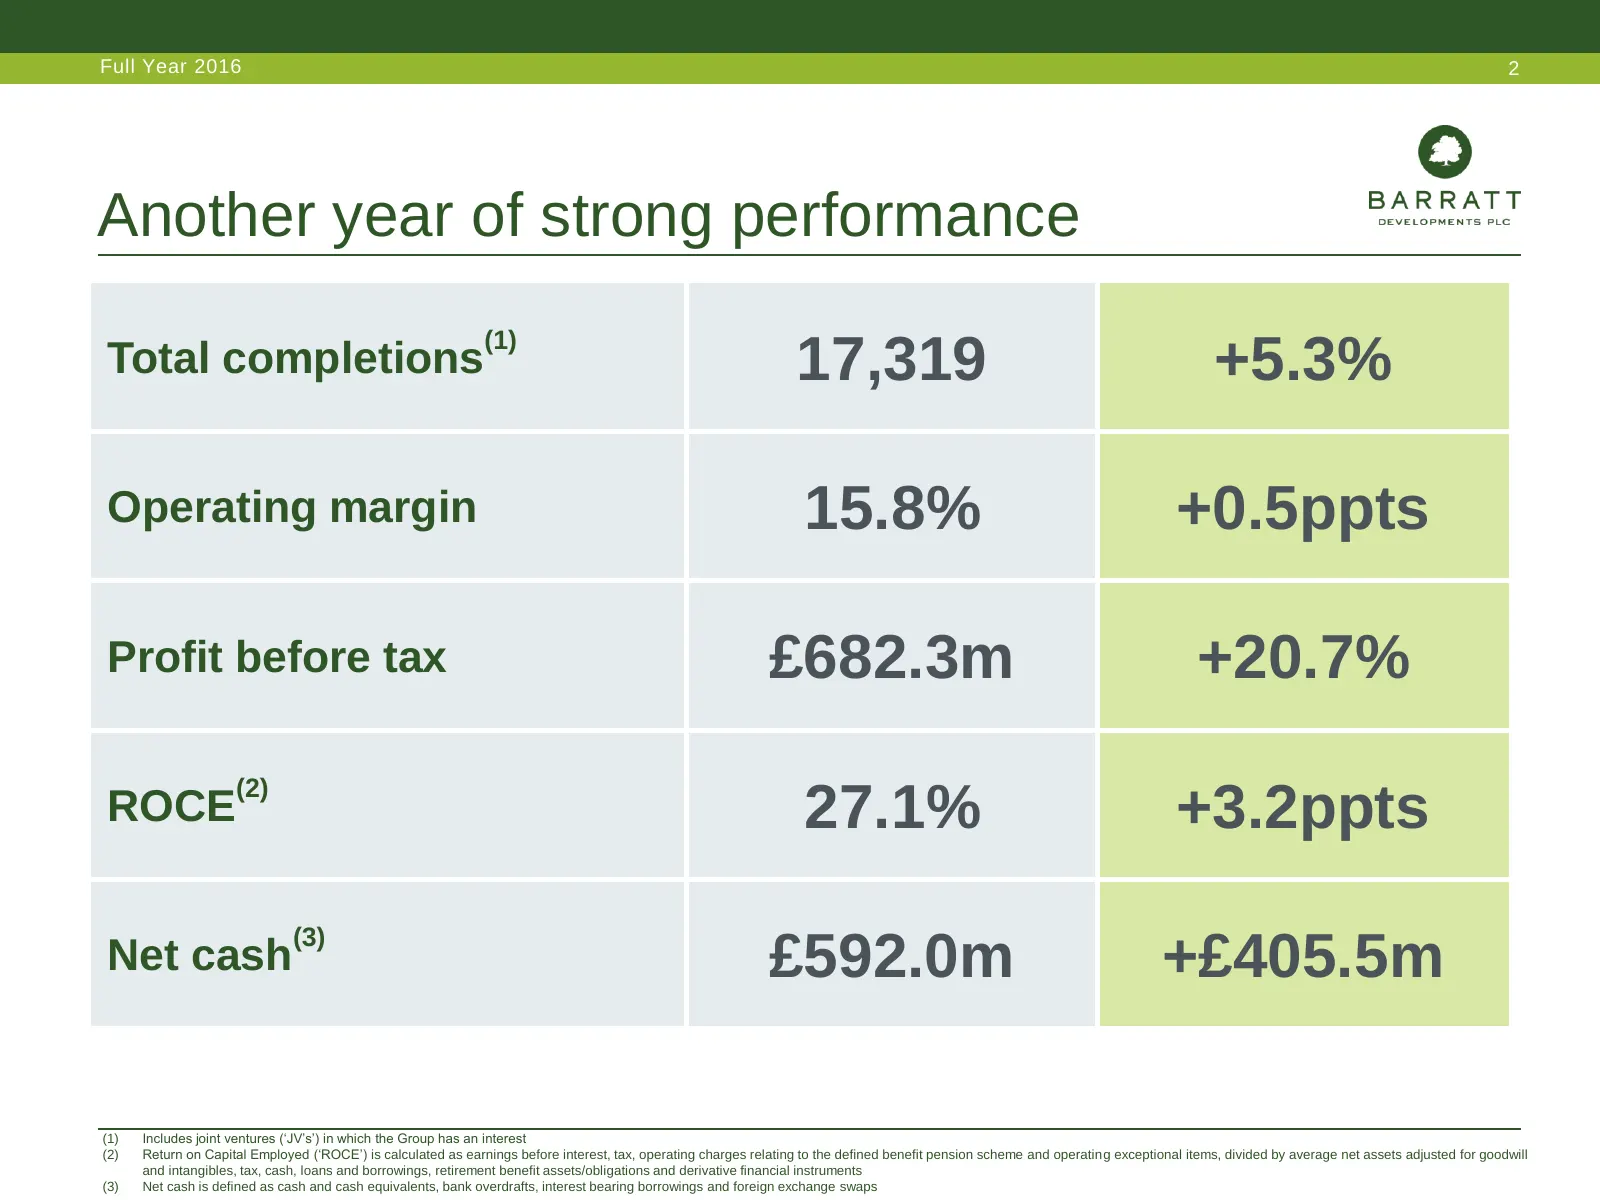
Full Year 2016 2 Another year of strong performance (1) Total completions 17,319 +5.3% Operating margin 15.8% +0.5ppts Profit before tax £682.3m +20.7% (2) ROCE 27.1% +3.2ppts (3) Net cash £592.0m +£405.5m (1) Includes joint ventures (‘JV’s’) in which the Group has an interest (2) Return on Capital
Slide 3: Driving value
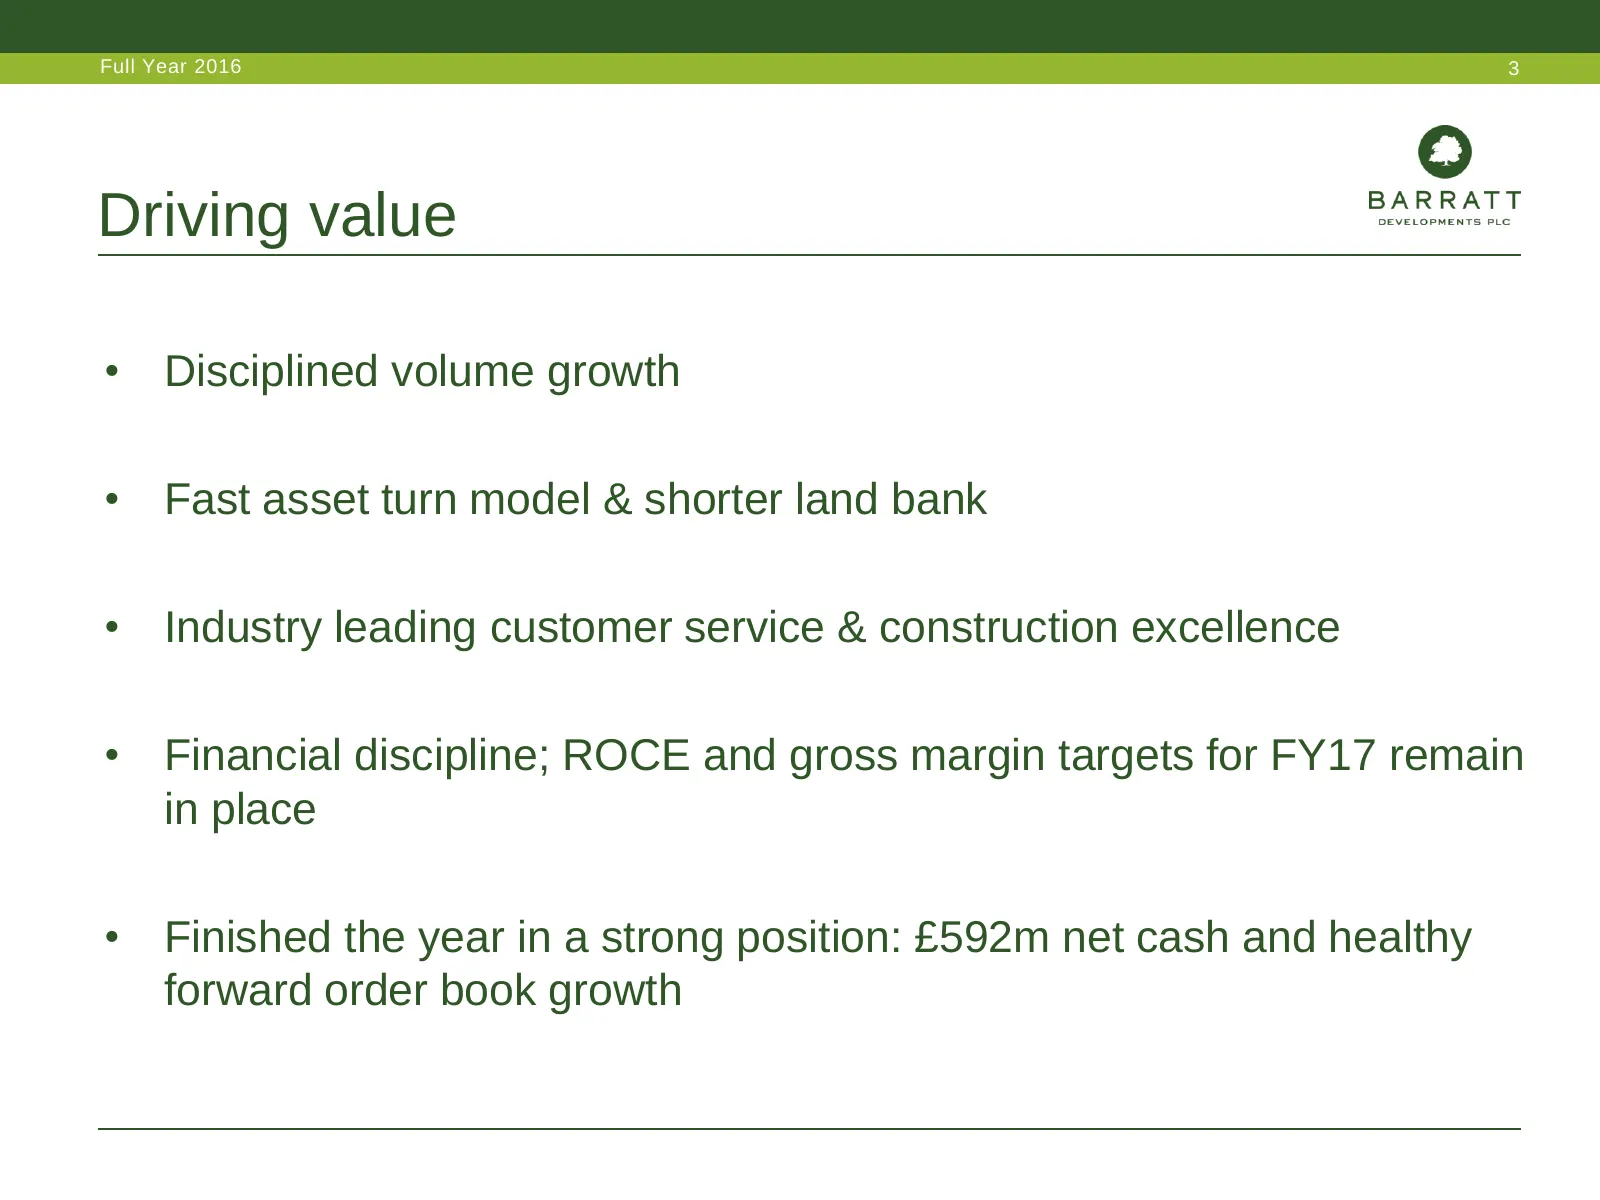
Full Year 2016 3 Driving value • Disciplined volume growth • Fast asset turn model & shorter land bank • Industry leading customer service & construction excellence • Financial discipline; ROCE and gross margin targets for FY17 remain in place • Finished the year in a strong position: £592m net cash
Slide 4: Neil Cooper, Chief Financial Officer
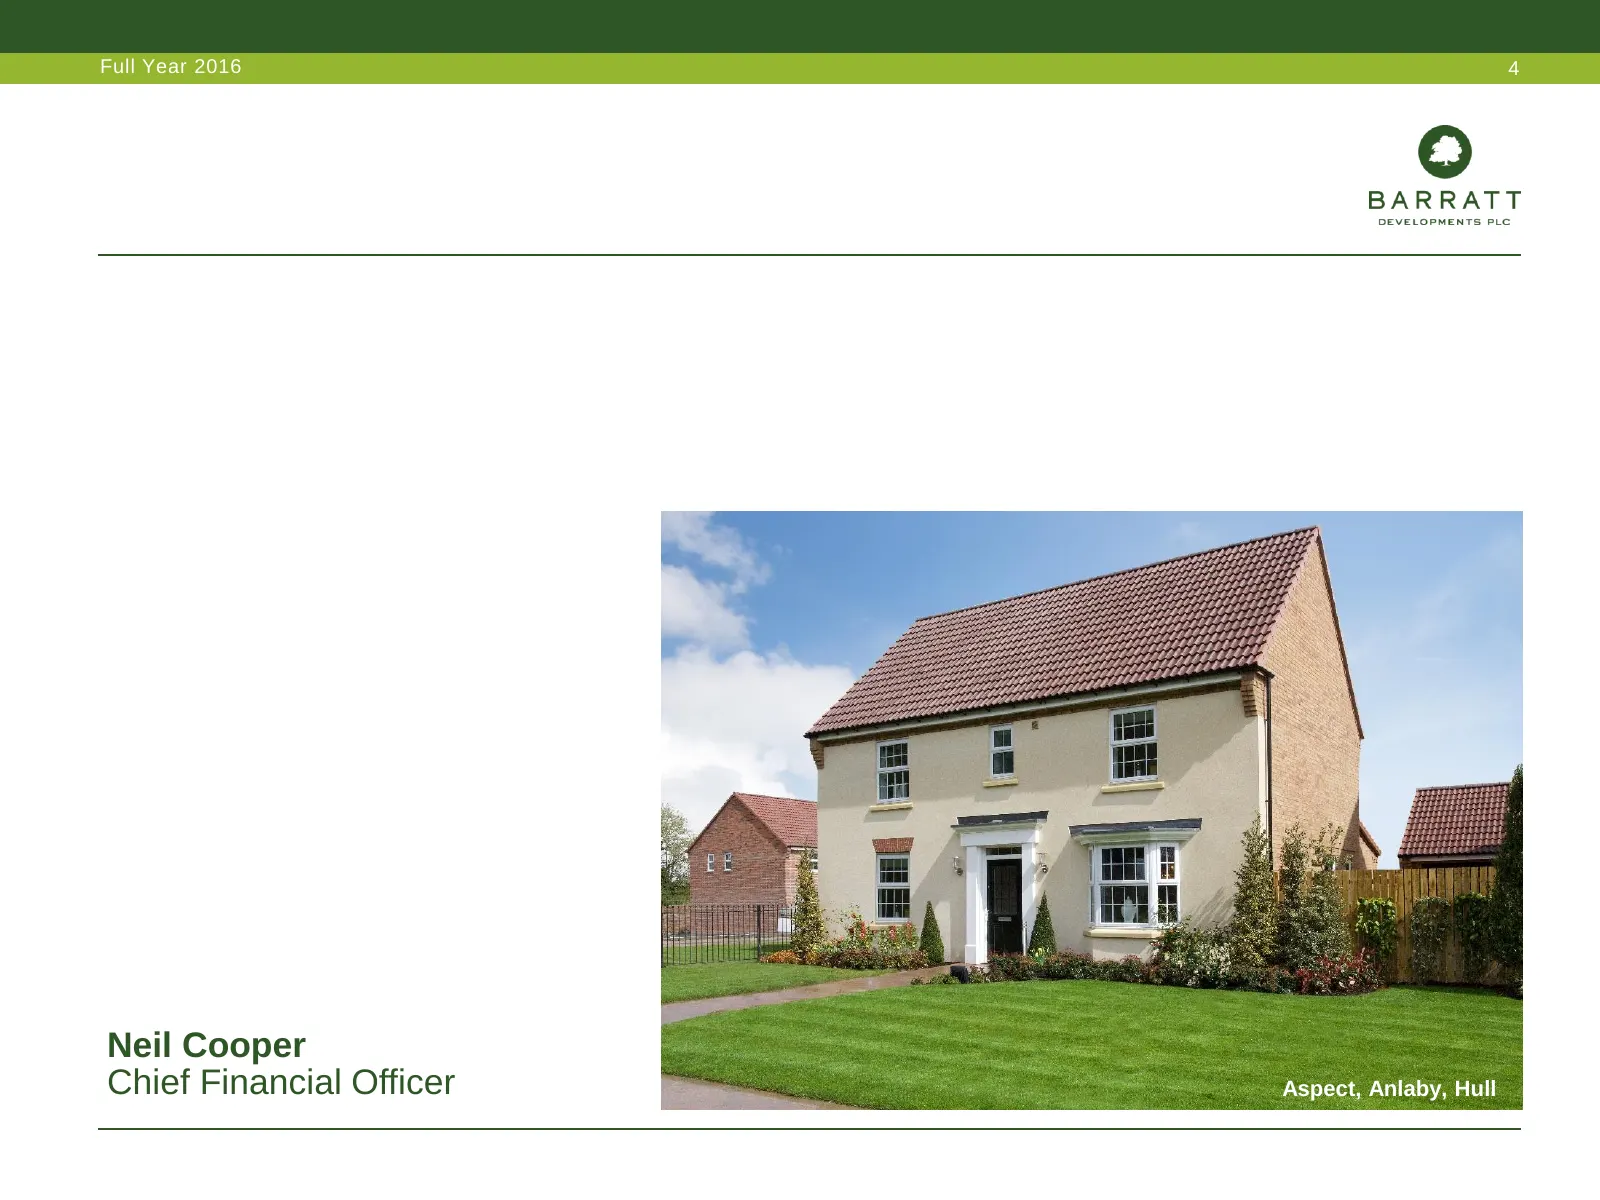
Full Year 2016 4 Neil Cooper Chief Financial Officer Aspect, Anlaby, Hull
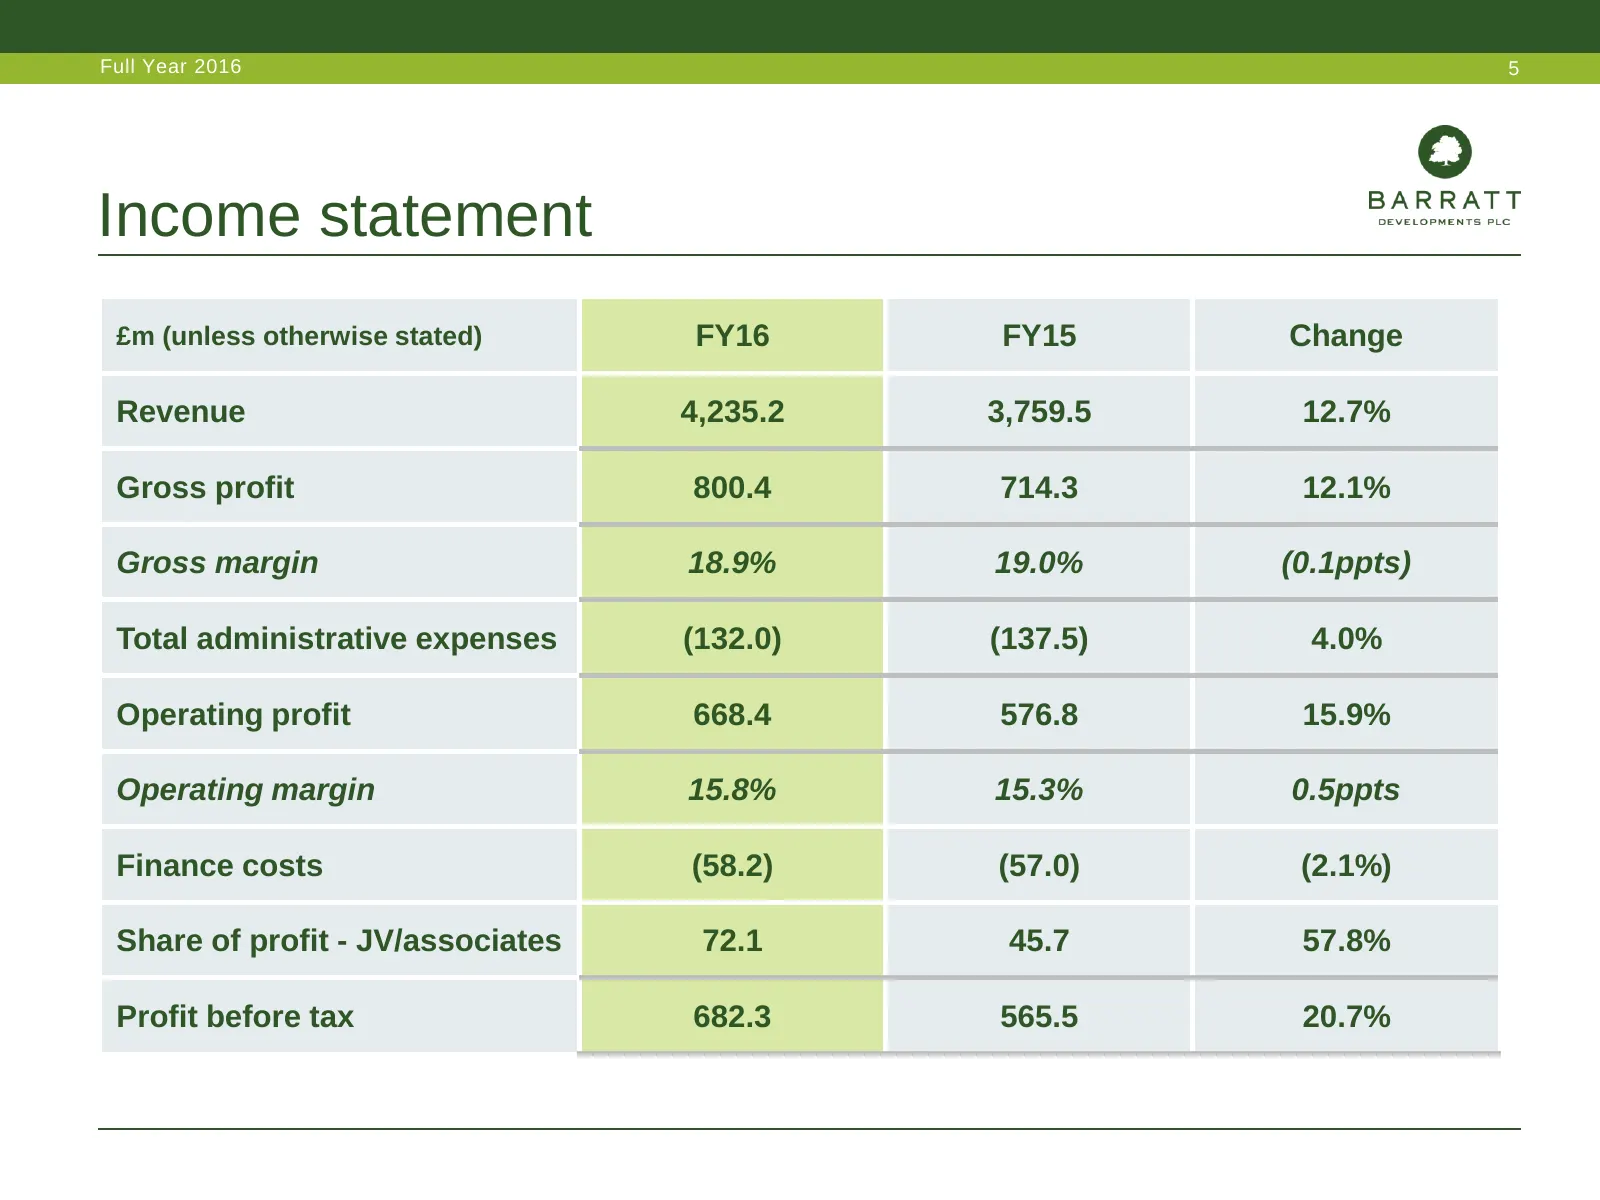
Slide 5: Income statement
Full Year 2016 5 Income statement £m (unless otherwise stated) FY16 FY15 Change Revenue 4,235.2 3,759.5 12.7% Gross profit 800.4 714.3 12.1% Gross margin 18.9% 19.0% (0.1ppts) Total administrative expenses (132.0) (137.5) 4.0% Operating profit 668.4 576.8 15.9% Operating margin 15.8% 15.3% 0.5ppts F
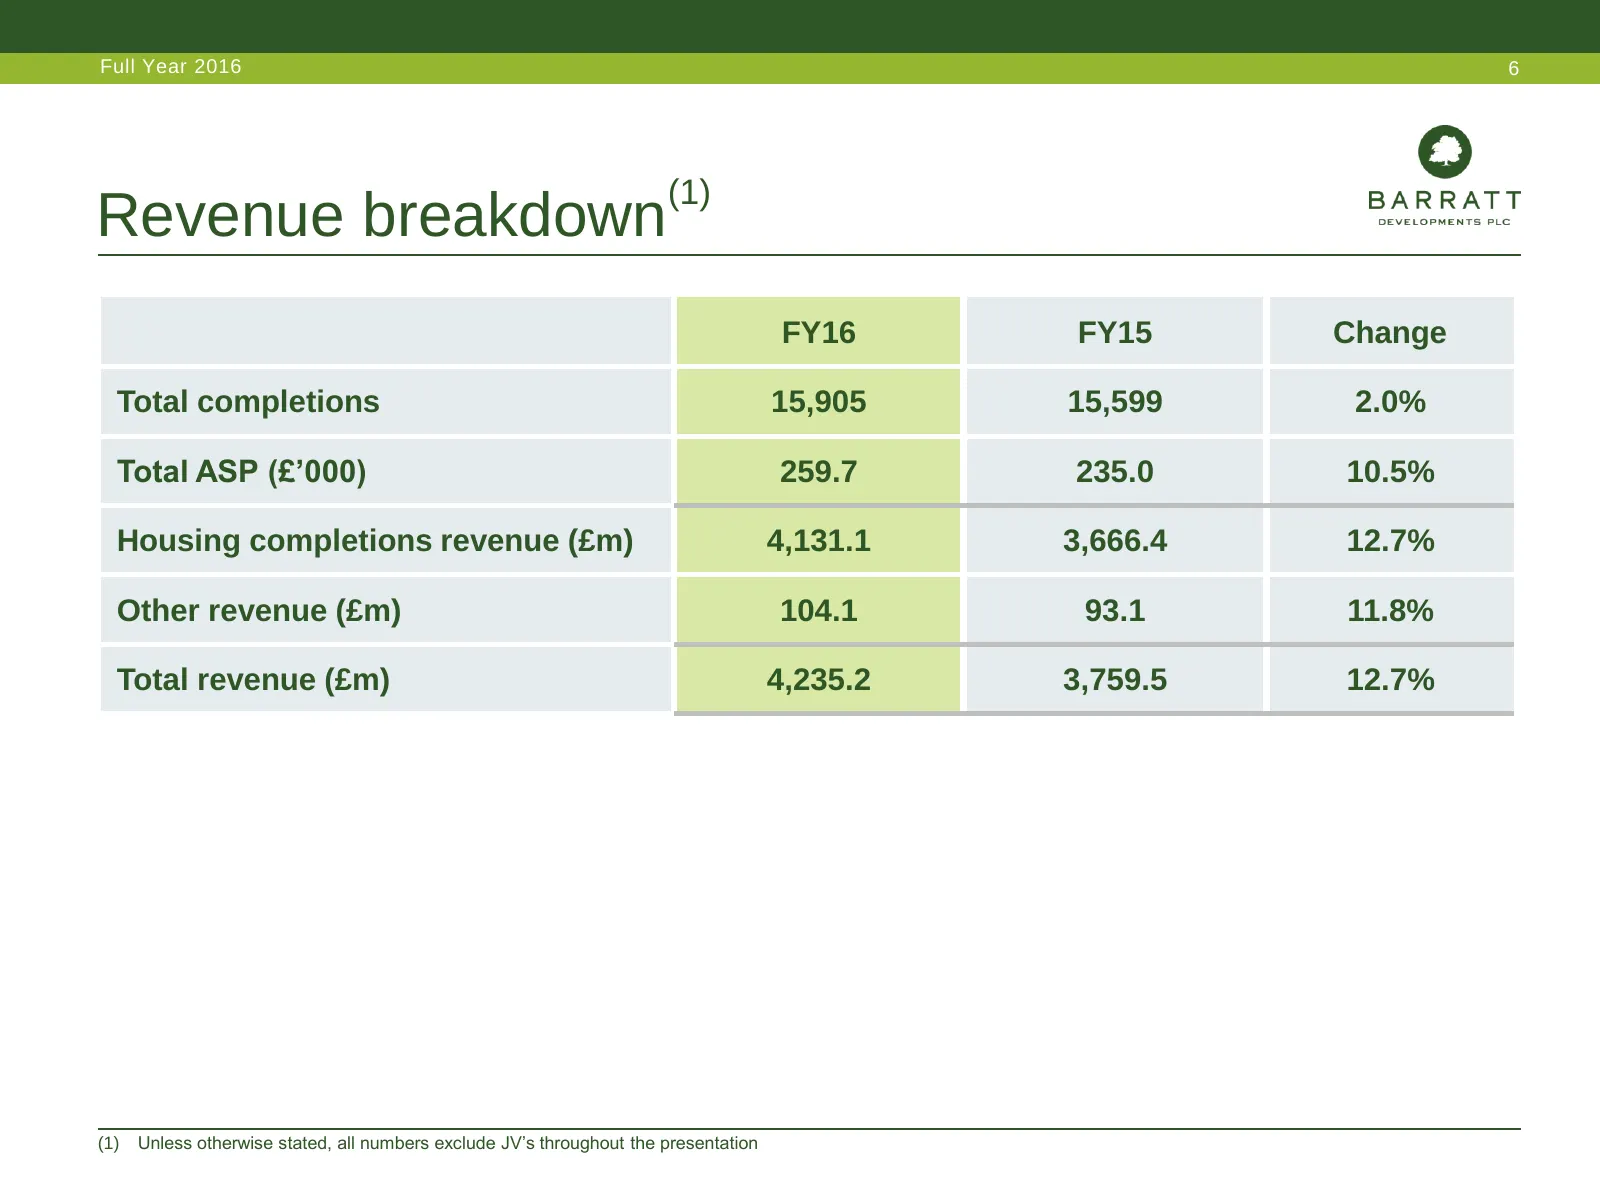
Slide 6: Revenue breakdown
Full Year 2016 6 (1) Revenue breakdown FY16 FY15 Change Total completions 15,905 15,599 2.0% Total ASP (£’000) 259.7 235.0 10.5% Housing completions revenue (£m) 4,131.1 3,666.4 12.7% Other revenue (£m) 104.1 93.1 11.8% Total revenue (£m) 4,235.2 3,759.5 12.7% (1) Unless otherwise stated, all number
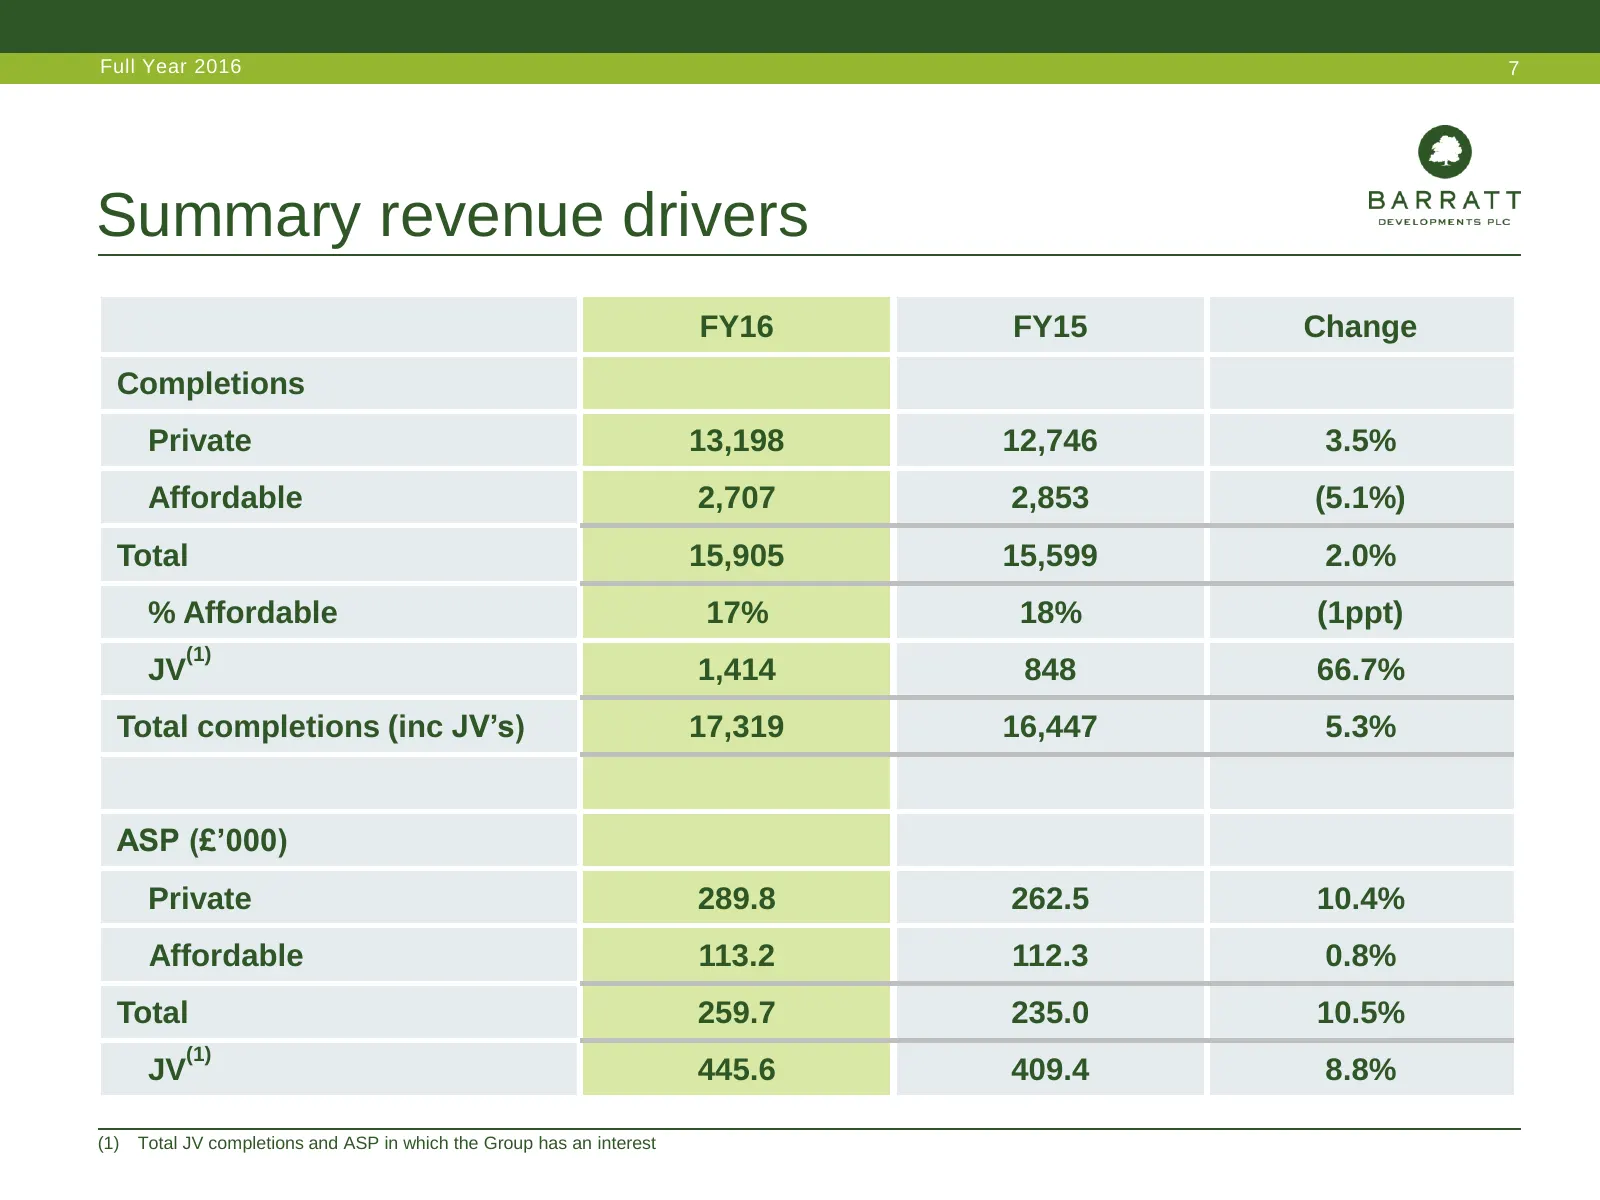
Slide 7: Summary revenue drivers
Full Year 2016 7 Summary revenue drivers FY16 FY15 Change Completions Private 13,198 12,746 3.5% Affordable 2,707 2,853 (5.1%) Total 15,905 15,599 2.0% % Affordable 17% 18% (1ppt) (1) JV 1,414 848 66.7% Total completions (inc JV’s) 17,319 16,447 5.3% ASP (£’000) Private 289.8 262.5 10.4% Affordable
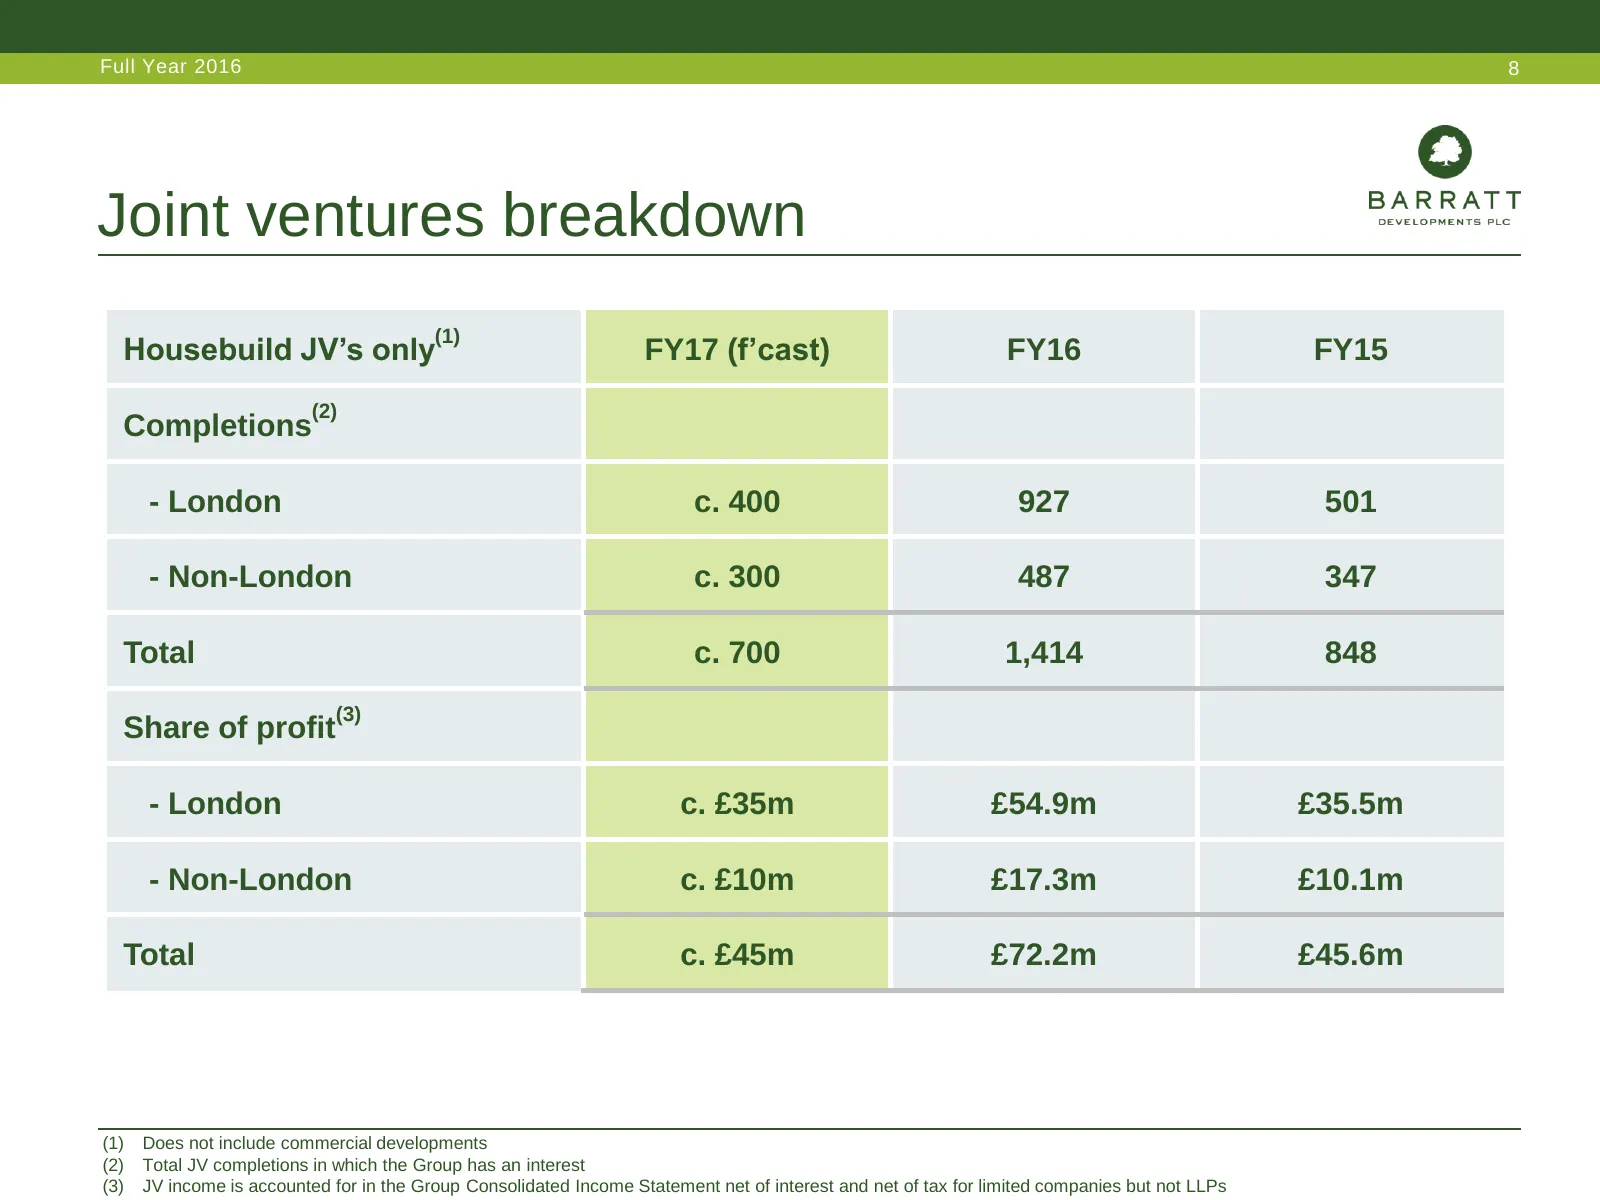
Slide 8: Joint ventures breakdown
Full Year 2016 8 Joint ventures breakdown (1) Housebuild JV’s only FY17 (f’cast) FY16 FY15 (2) Completions - London c. 400 927 501 - Non-London c. 300 487 347 Total c. 700 1,414 848 (3) Share of profit - London c. £35m £54.9m £35.5m - Non-London c. £10m £17.3m £10.1m Total c. £45m £72.2m £45.6m (1)
Slide 9: Operating margin bridge
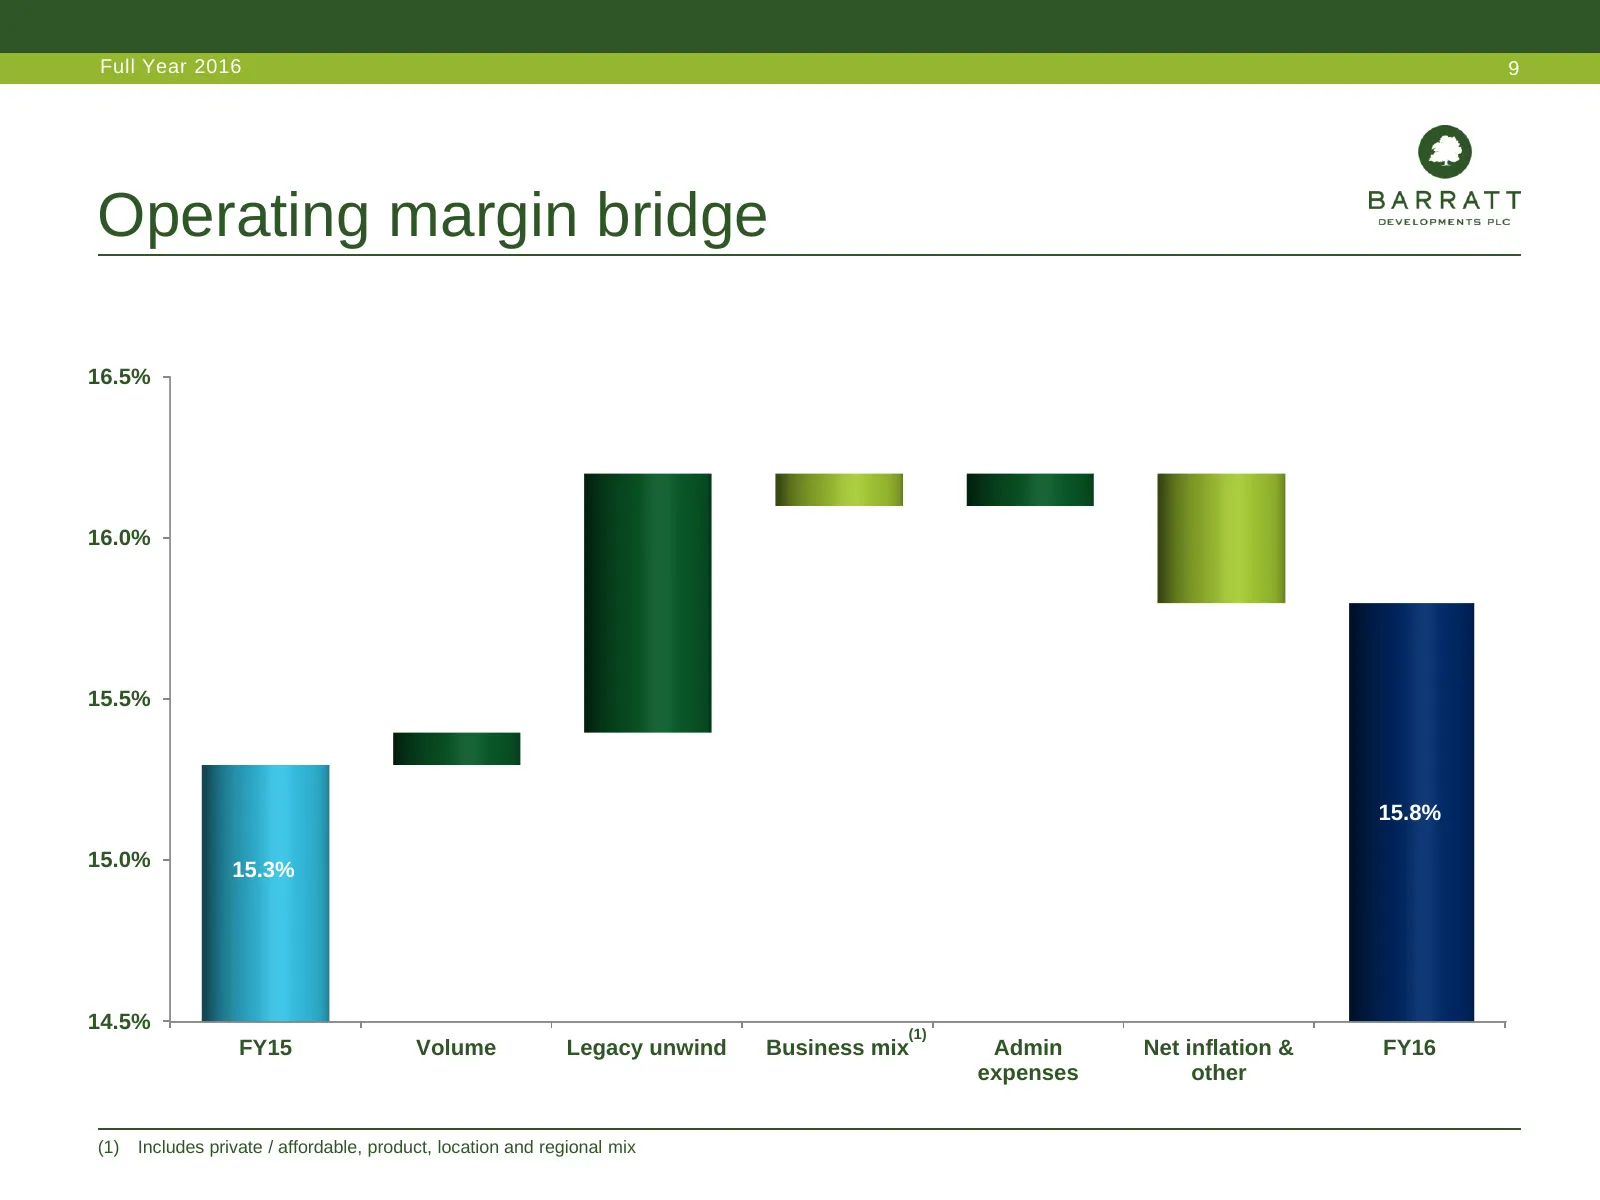
Full Year 2016 9 Operating margin bridge 16.5% 16.7% 16.0% 15.5% 15.8% 15.0% 15.3% 14.5% (1) FY15 Volume Legacy unwind Business mix Admin Net inflation & FY16 expenses other (1) Includes private / affordable, product, location and regional mix
Slide 10: Cash flow
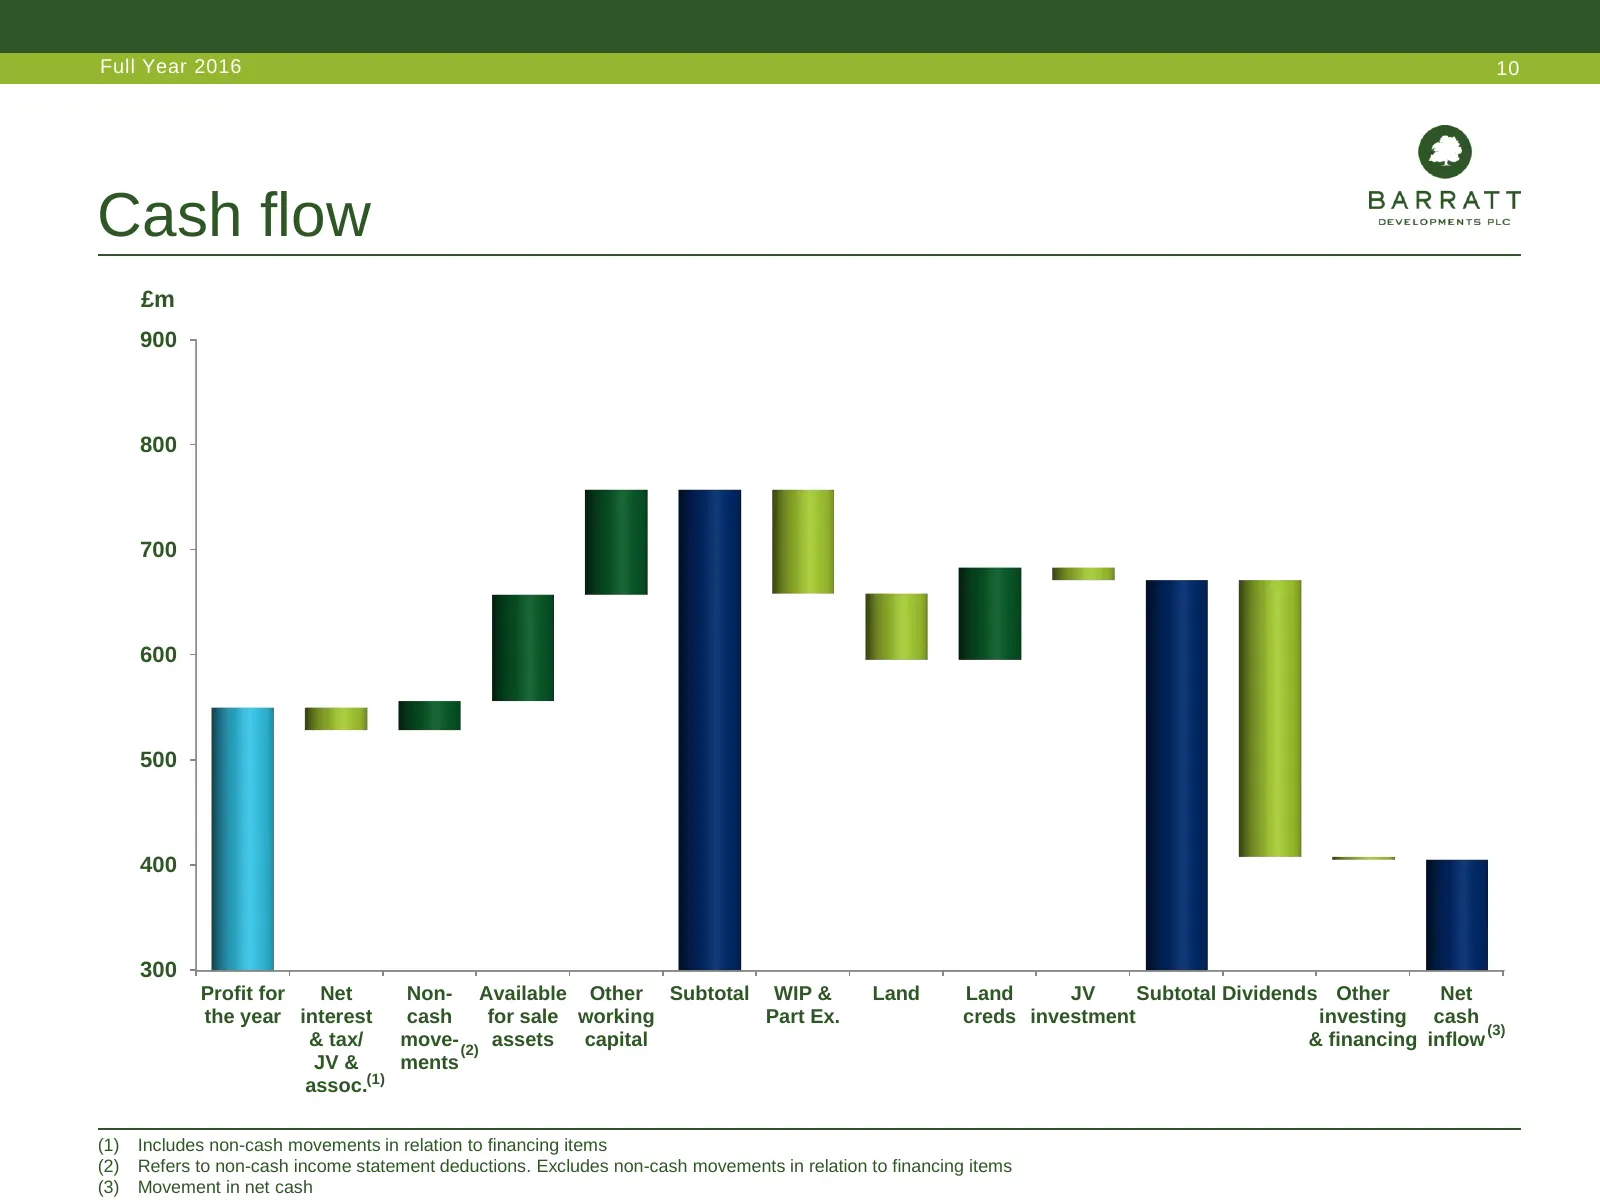
Full Year 2016 10 Cash flow £m 900 800 700 600 500 400 300 Profit for Net Non- Available Other Subtotal WIP & Land Land JV Subtotal Dividends Other Net the year interest cash for sale working Part Ex. creds investment investing cash (3) & tax/ move- (2) assets capital & financing inflow JV & ments a
Slide 11: Net cash and average debt
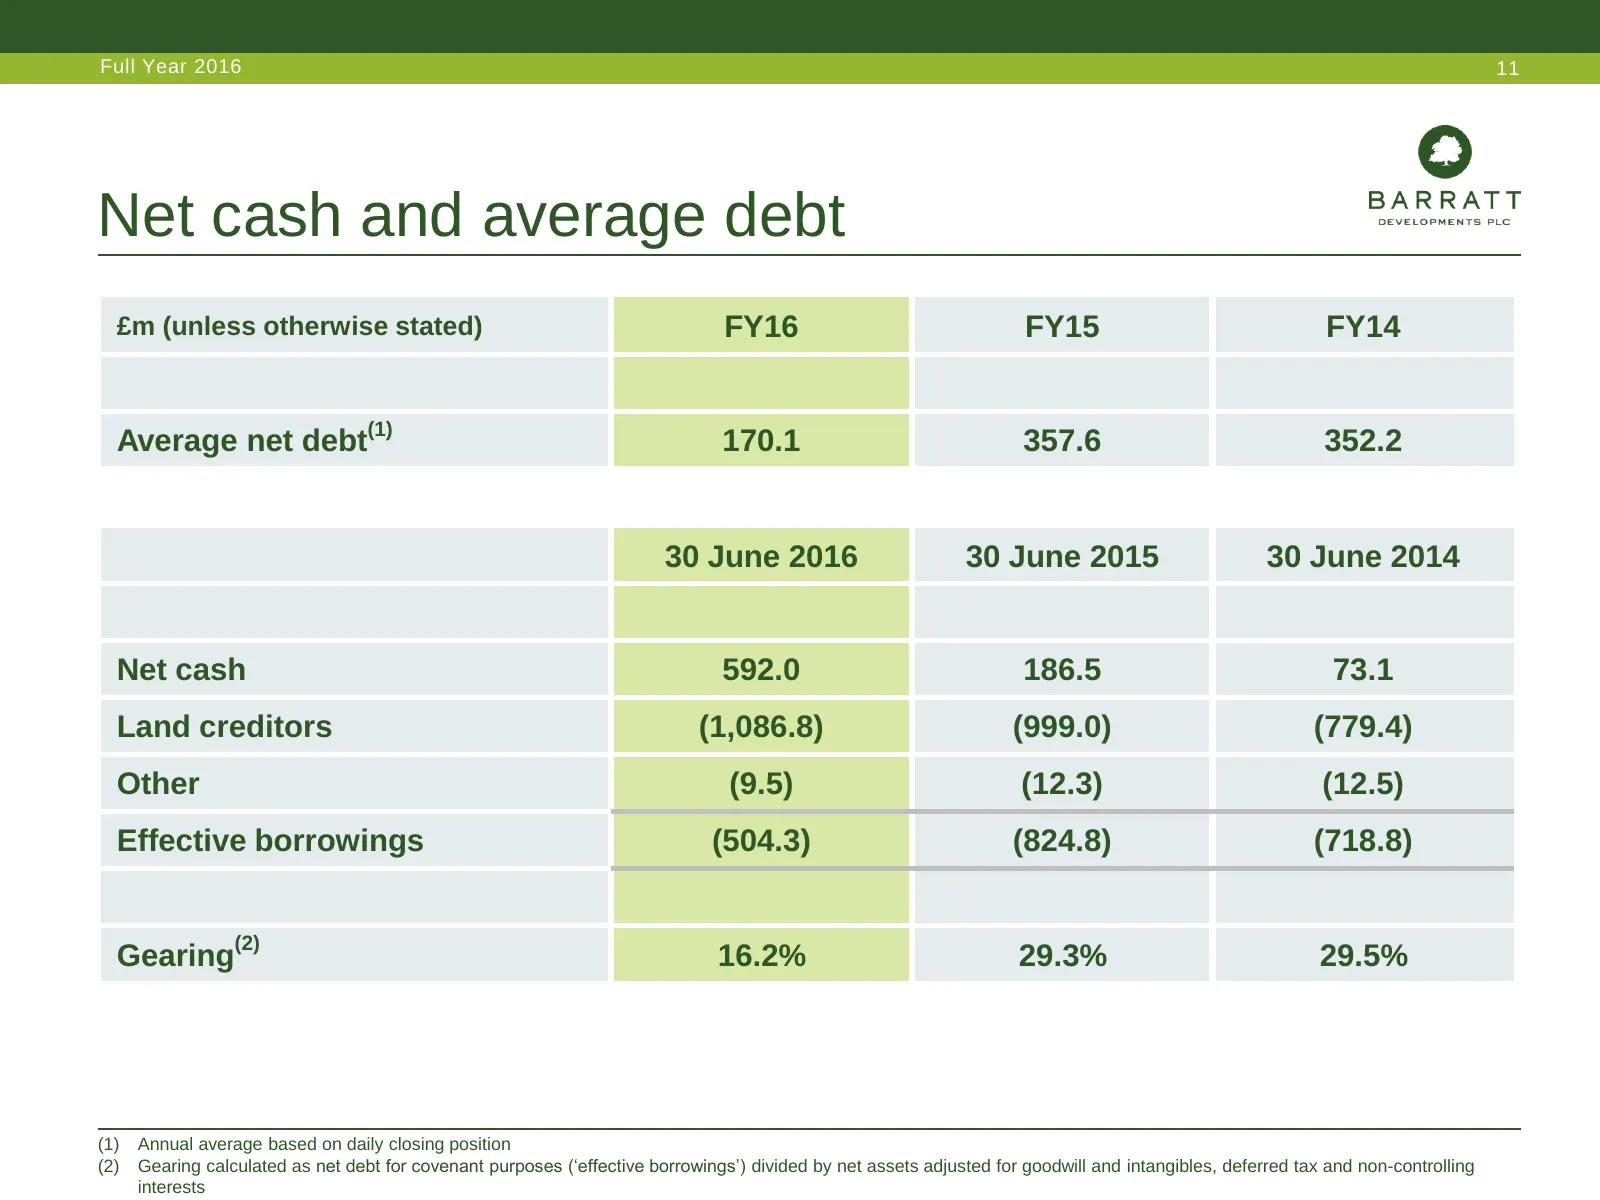
Full Year 2016 11 Net cash and average debt £m (unless otherwise stated) FY16 FY15 FY14 Average net debt(1) 170.1 357.6 352.2 30 June 2016 30 June 2015 30 June 2014 Net cash 592.0 186.5 73.1 Land creditors (1,086.8) (999.0) (779.4) Other (9.5) (12.3) (12.5) Effective borrowings (504.3) (824.8) (718.
Slide 12: Land creditors payment profile
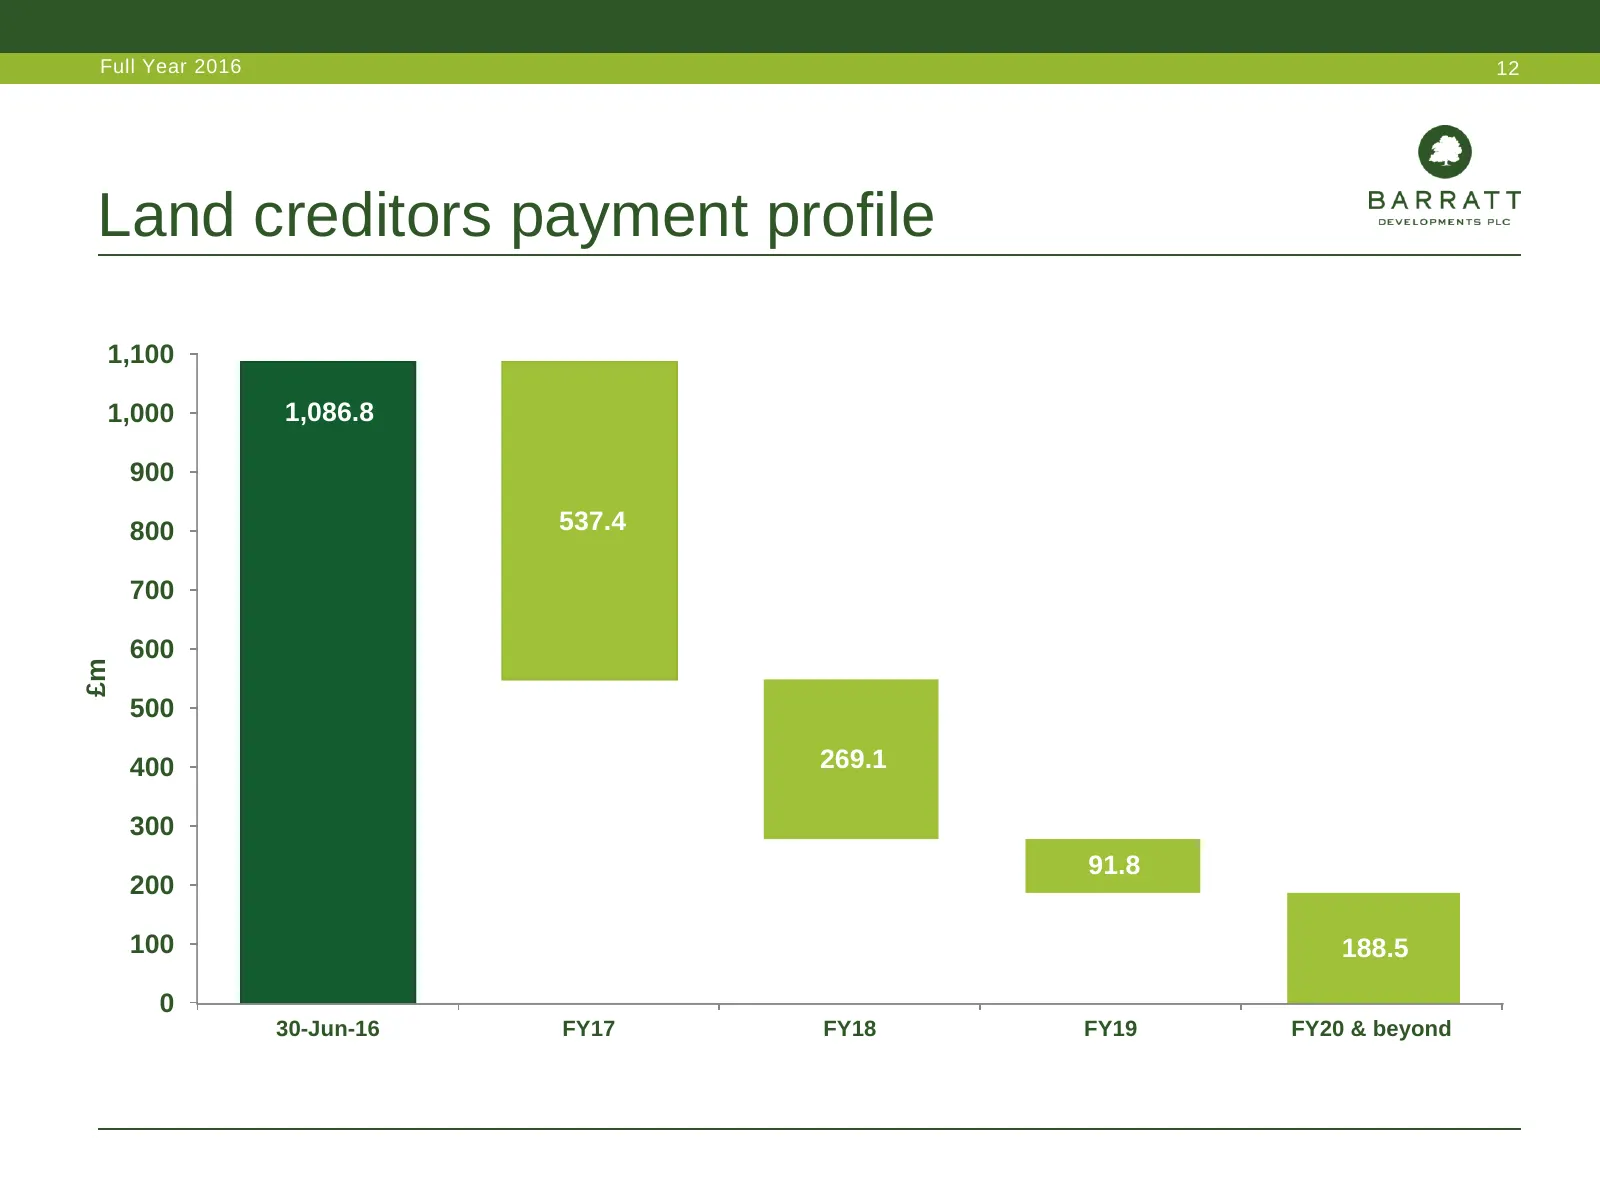
Full Year 2016 12 Land creditors payment profile 1,100 1,000 1,086.8 900 800 537.4 700 600 £m 500 400 269.1 300 91.8 200 100 188.5 0 30-Jun-16 FY17 FY18 FY19 FY20 & beyond
Slide 13: Legacy assets reduce by 42%
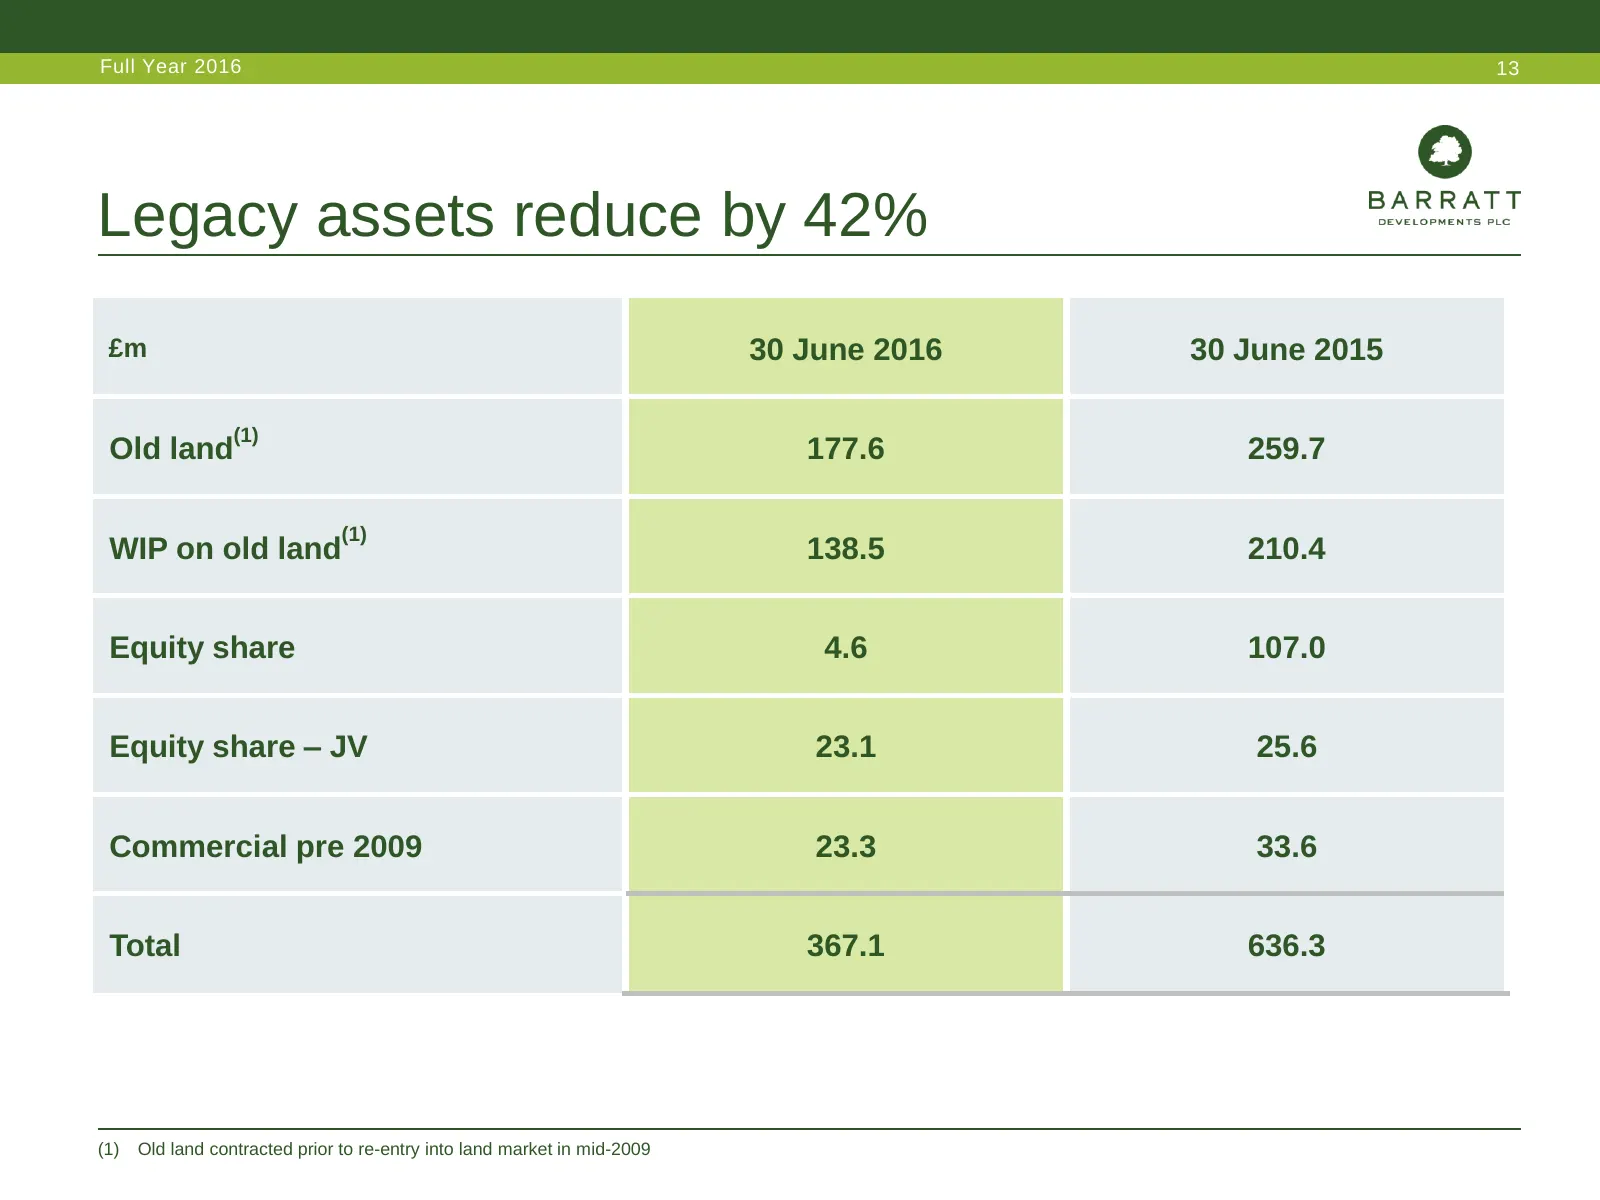
Full Year 2016 13 Legacy assets reduce by 42% £m 30 June 2016 30 June 2015 (1) Old land 177.6 259.7 (1) WIP on old land 138.5 210.4 Equity share 4.6 107.0 Equity share – JV 23.1 25.6 Commercial pre 2009 23.3 33.6 Total 367.1 636.3 (1) Old land contracted prior to re-entry into land market in mid-200
Slide 14: Land bank by land type
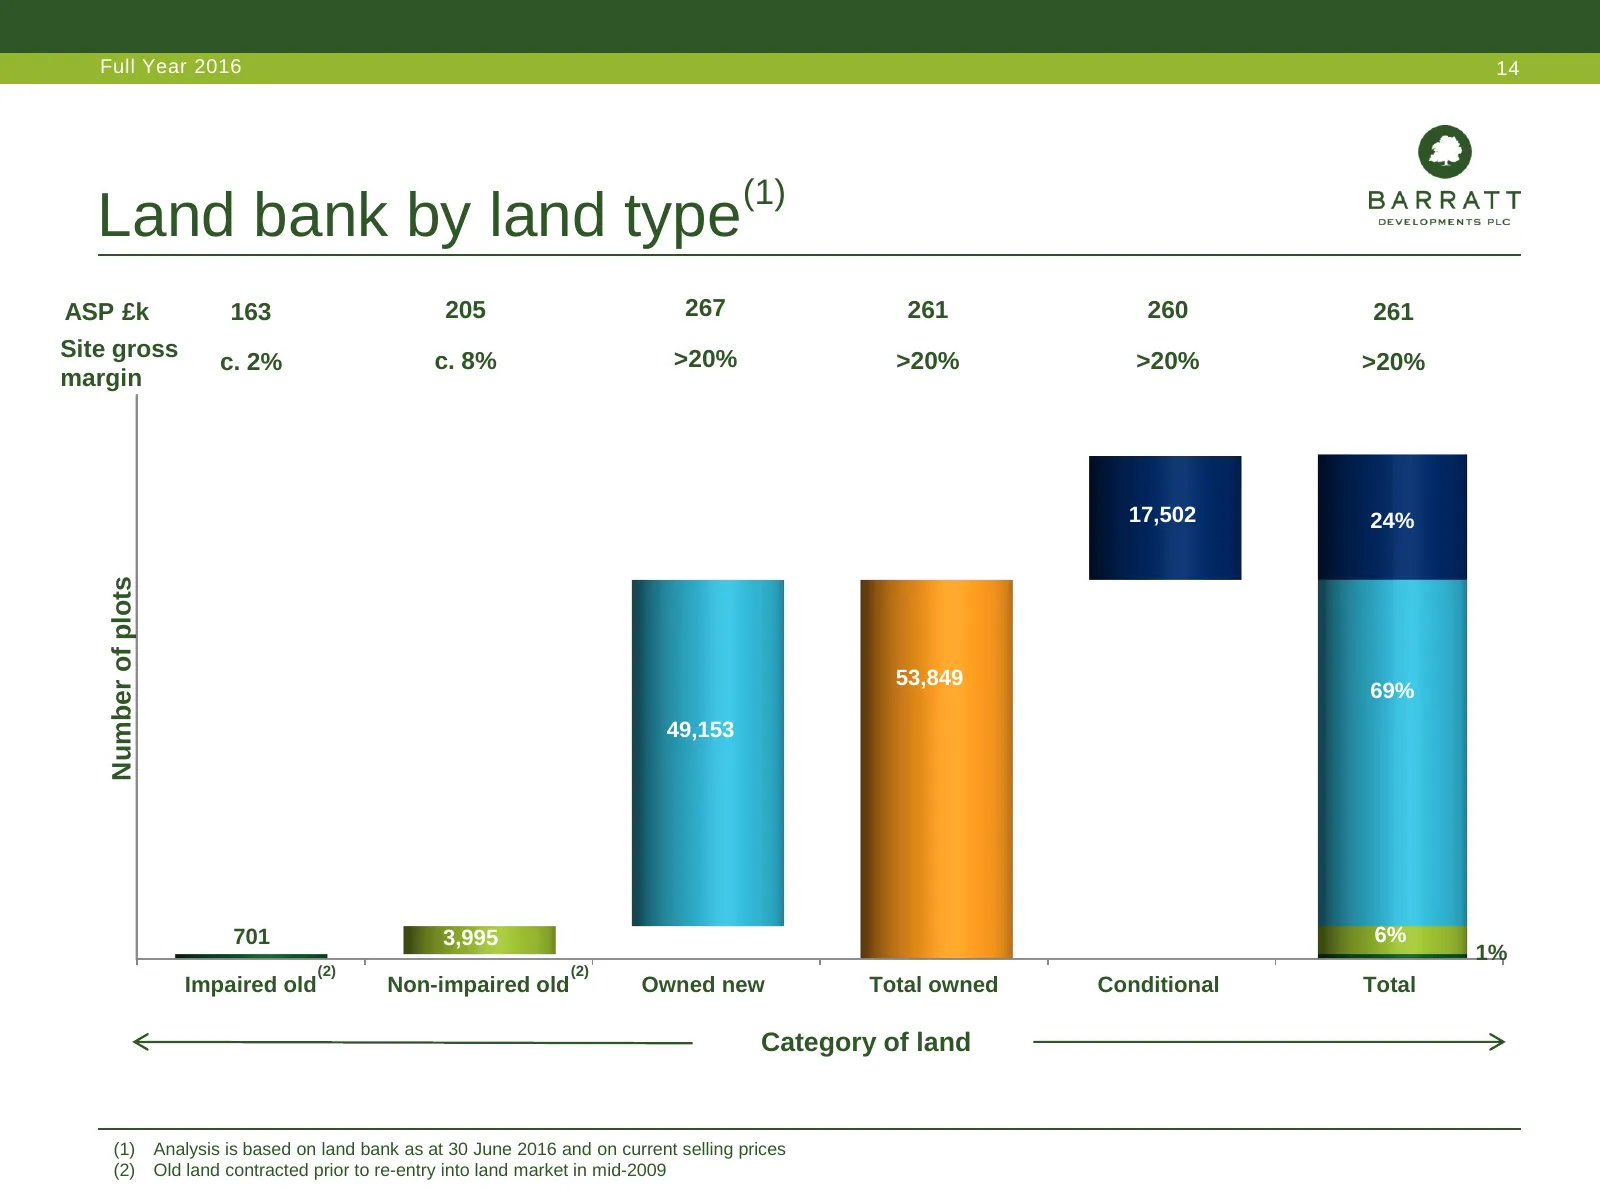
Full Year 2016 14 (1) Land bank by land type ASP £k 163 205 267 261 260 261 Site gross c. 8% >20% >20% >20% c. 2% >20% margin 17,502 24% Number of plots 53,849 69% 49,153 701 3,995 6% 1% (2) (2) Impaired old Non-impaired old Owned new Total owned Conditional Total Category of land (1) Analysis is ba
Slide 15: Other finance matters
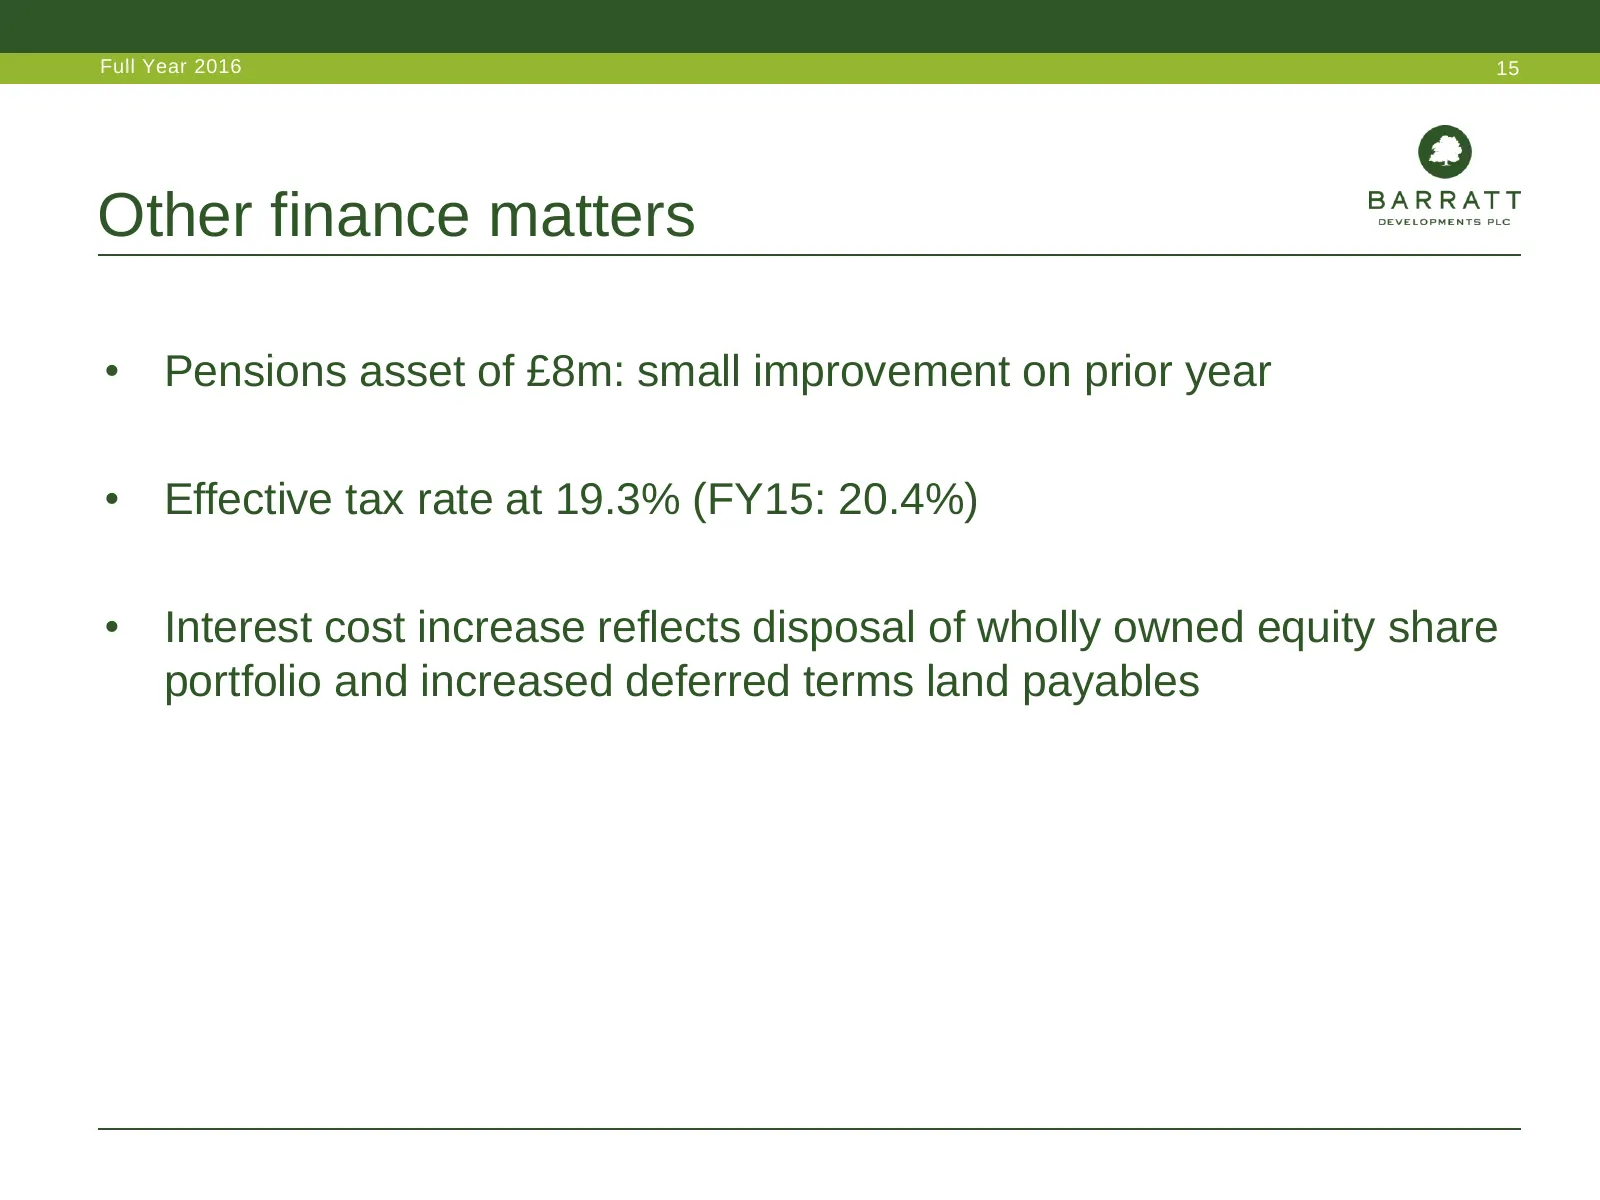
Full Year 2016 15 Other finance matters • Pensions asset of £8m: small improvement on prior year • Effective tax rate at 19.3% (FY15: 20.4%) • Interest cost increase reflects disposal of wholly owned equity share portfolio and increased deferred terms land payables
Slide 16: Guidance for FY17
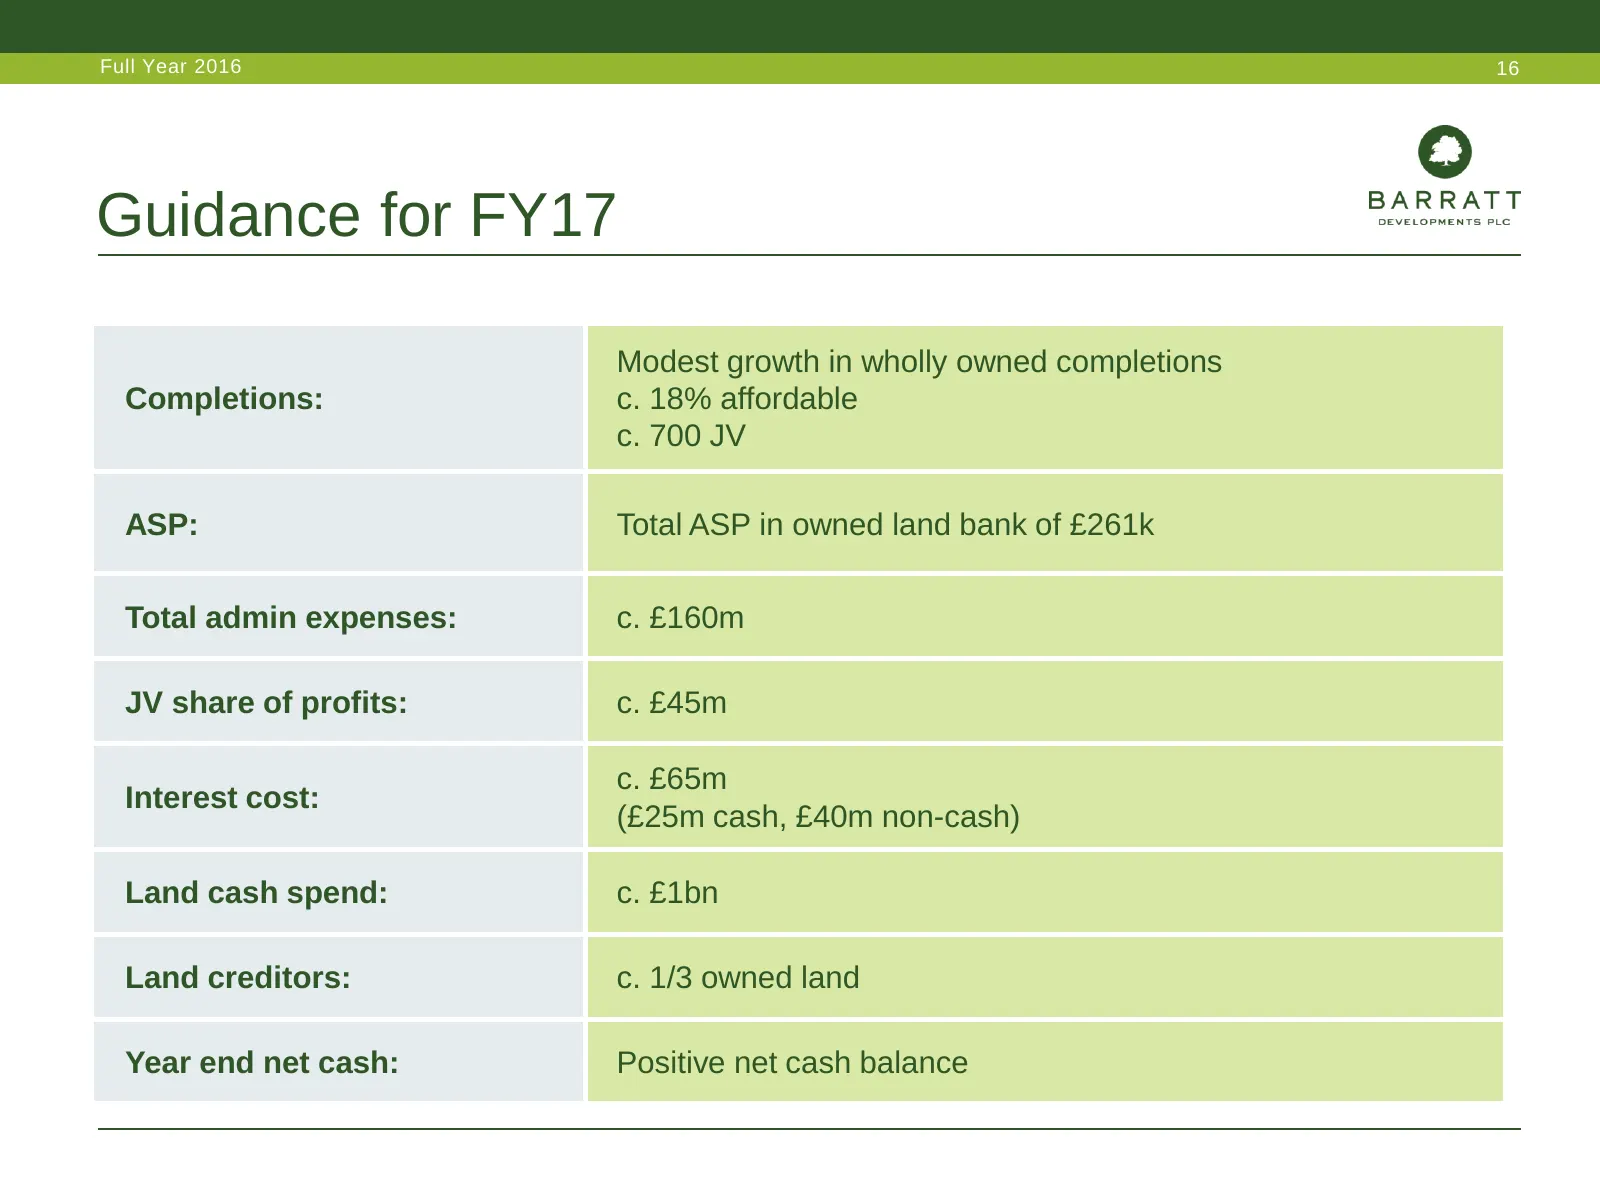
Full Year 2016 16 Guidance for FY17 Modest growth in wholly owned completions Completions: c. 18% affordable c. 700 JV ASP: Total ASP in owned land bank of £261k Total admin expenses: c. £160m JV share of profits: c. £45m c. £65m Interest cost: (£25m cash, £40m non-cash) Land cash spend: c. £1bn Lan
Slide 17: Steven Boyes, Chief Operating Officer
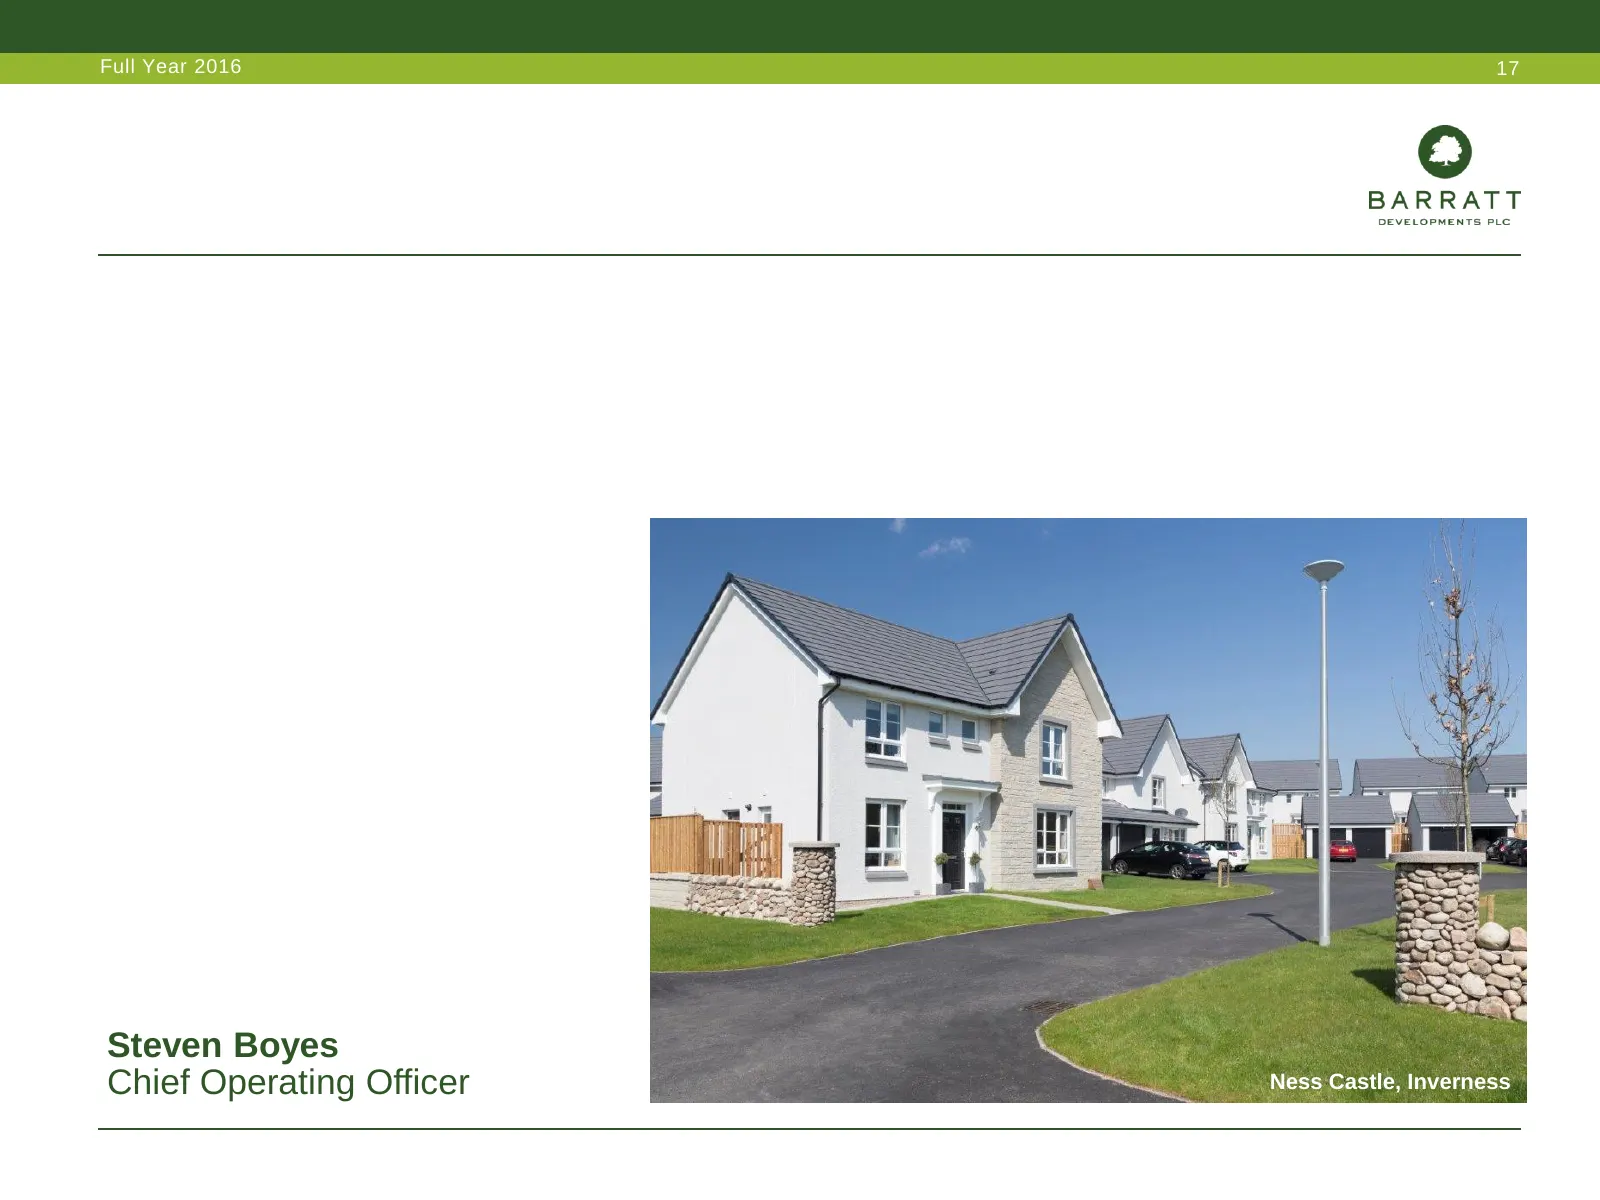
Full Year 2016 17 Steven Boyes Chief Operating Officer Ness Castle, Inverness
Slide 18: Strong uplift in Group sales performance
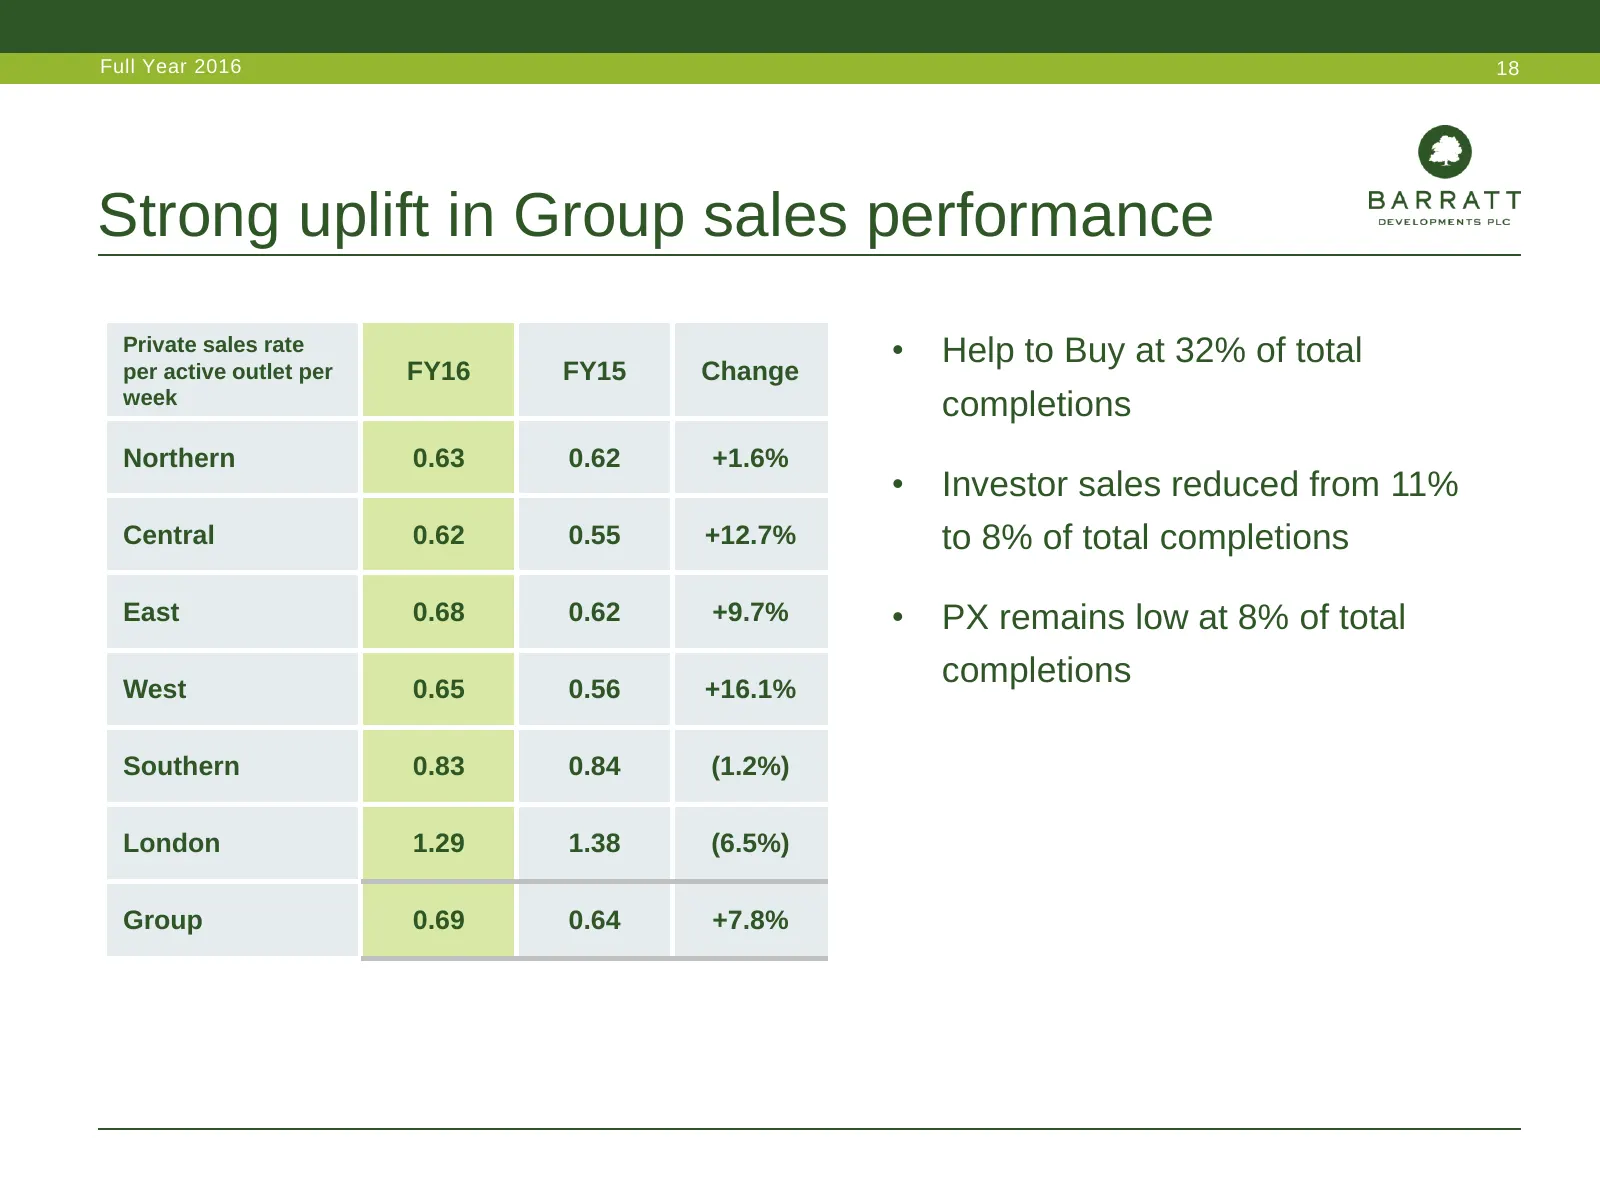
Full Year 2016 18 Strong uplift in Group sales performance Private sales rate • Help to Buy at 32% of total per active outlet per FY16 FY15 Change week completions Northern 0.63 0.62 +1.6% • Investor sales reduced from 11% Central 0.62 0.55 +12.7% to 8% of total completions East 0.68 0.62 +9.7% • PX
Slide 19: Pricing trends remain positive
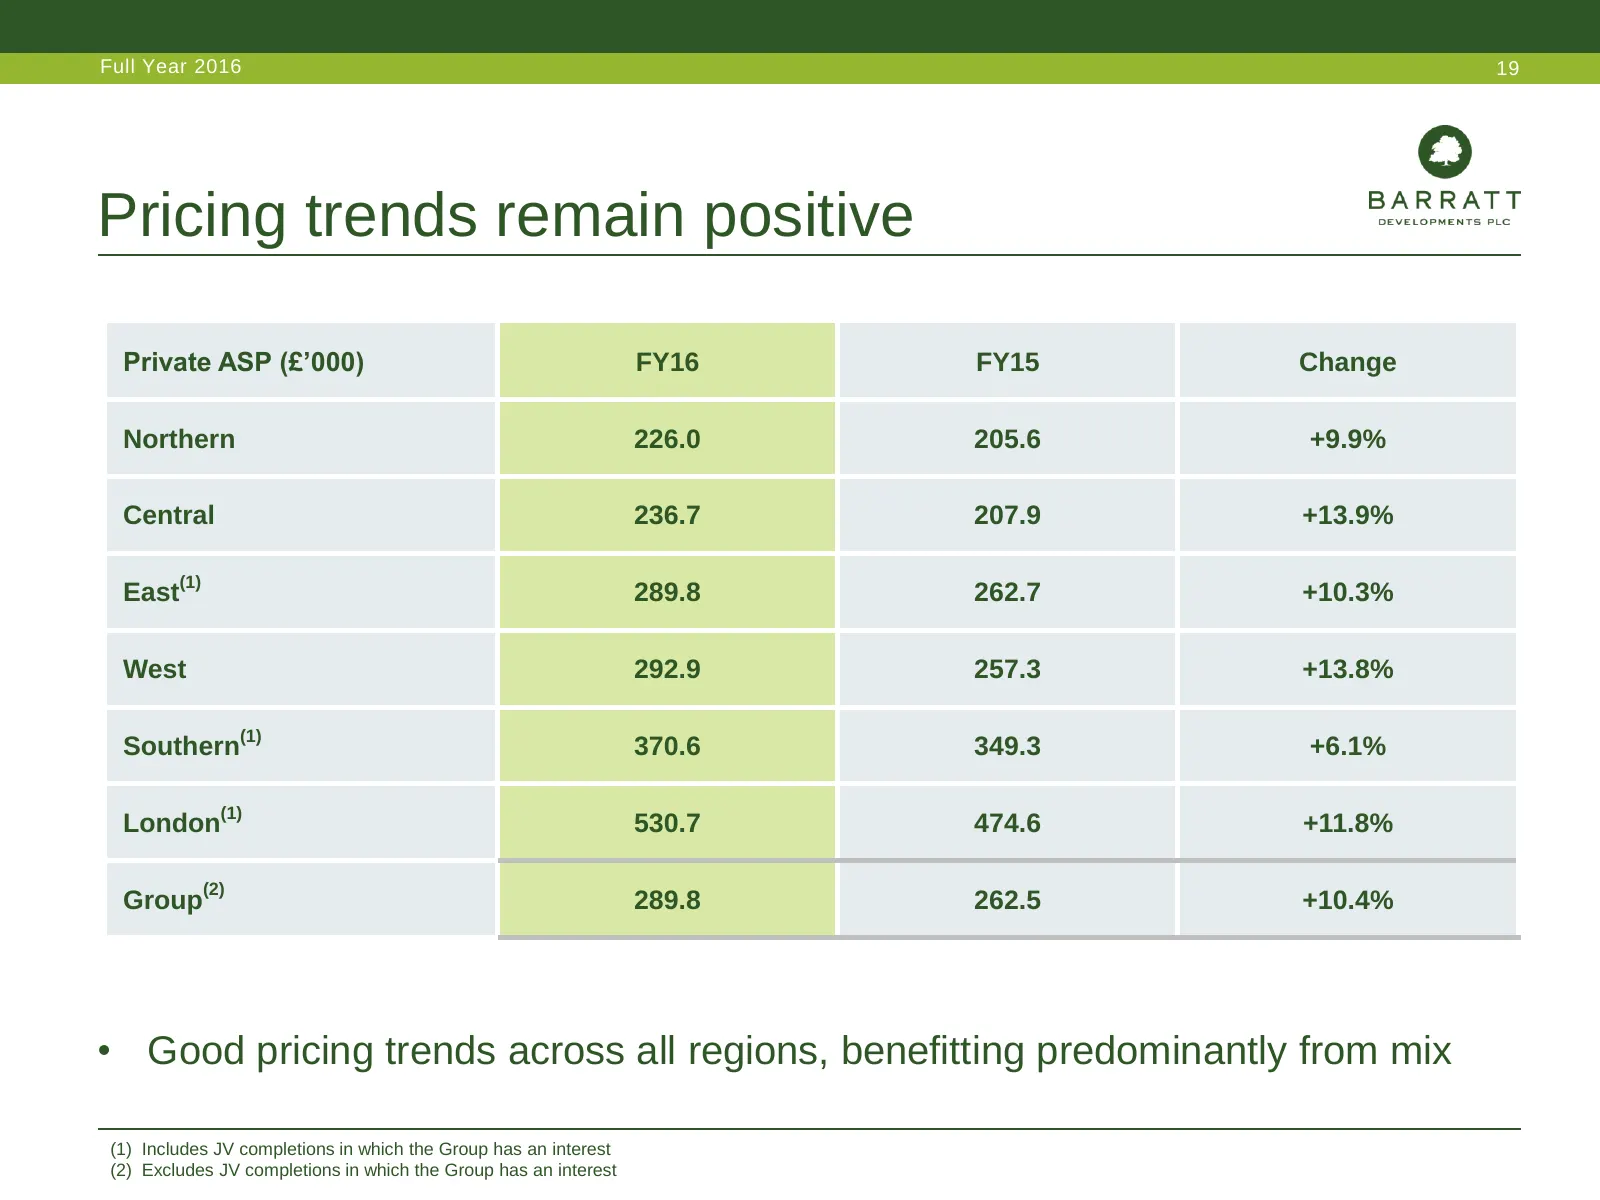
Full Year 2016 19 Pricing trends remain positive Private ASP (£’000) FY16 FY15 Change Northern 226.0 205.6 +9.9% Central 236.7 207.9 +13.9% East(1) 289.8 262.7 +10.3% West 292.9 257.3 +13.8% Southern(1) 370.6 349.3 +6.1% London(1) 530.7 474.6 +11.8% Group(2) 289.8 262.5 +10.4% • Good pricing trends
Slide 20: Barratt London Help to Buy reservations
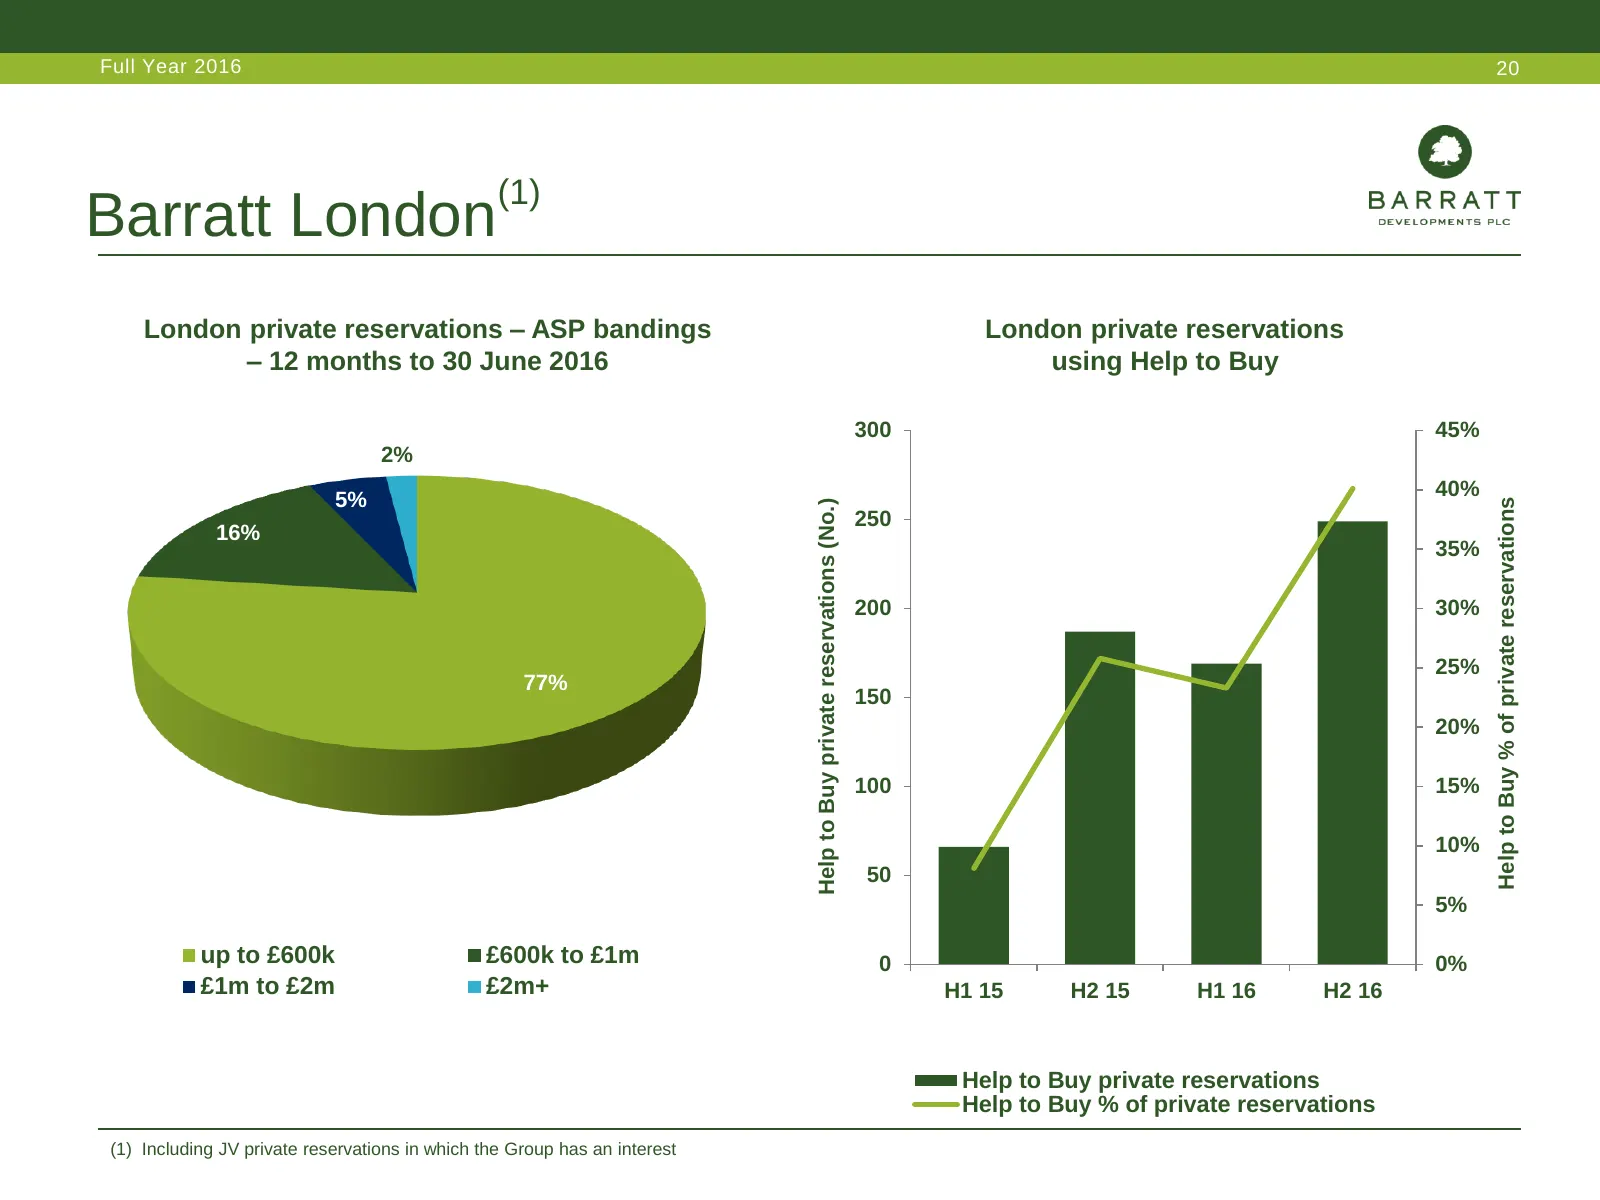
Full Year 2016 20 (1) Barratt London London private reservations – ASP bandings London private reservations – 12 months to 30 June 2016 using Help to Buy 300 45% 2% 5% 40% Help to Buy % of private reservations Help to Buy private reservations (No.) 250 16% 35% 200 30% 25% 77% 150 20% 100 15% 10% 50
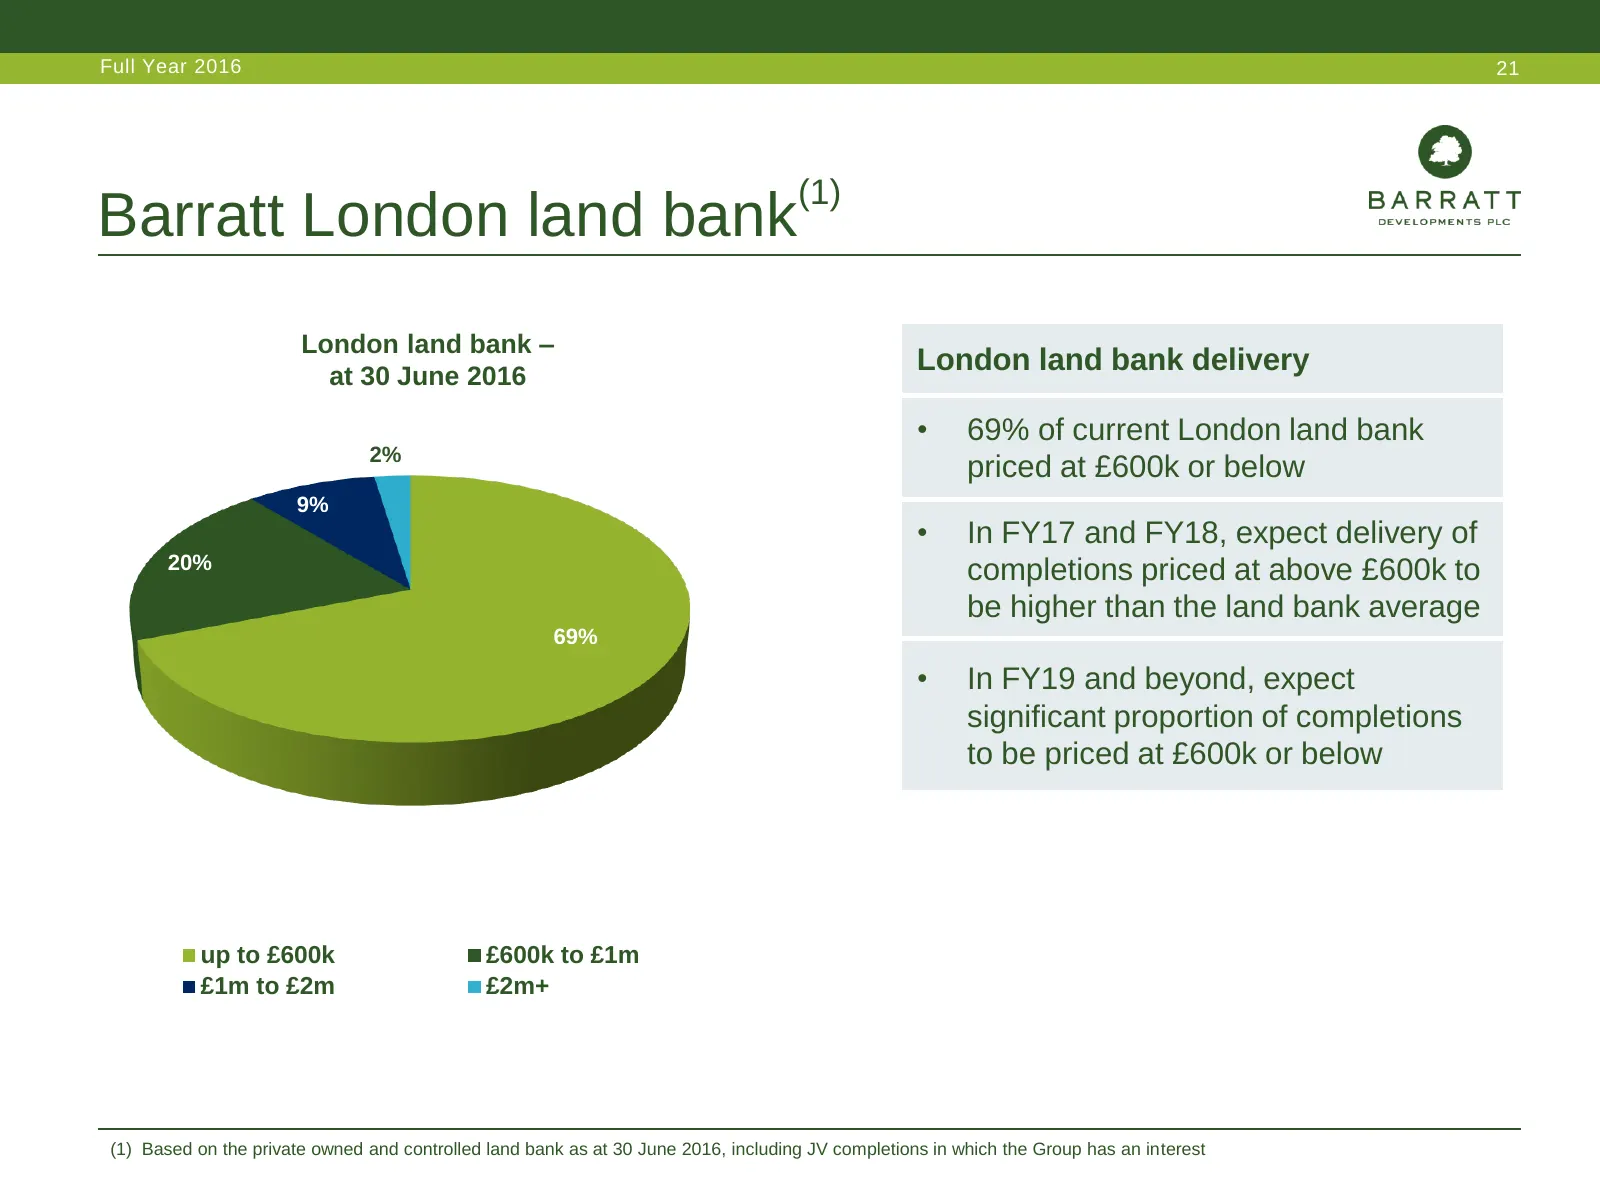
Slide 21: Barratt London land bank
Full Year 2016 21 (1) Barratt London land bank London land bank – at 30 June 2016 London land bank delivery • 69% of current London land bank 2% priced at £600k or below 9% • In FY17 and FY18, expect delivery of 20% completions priced at above £600k to be higher than the land bank average 69% • In F
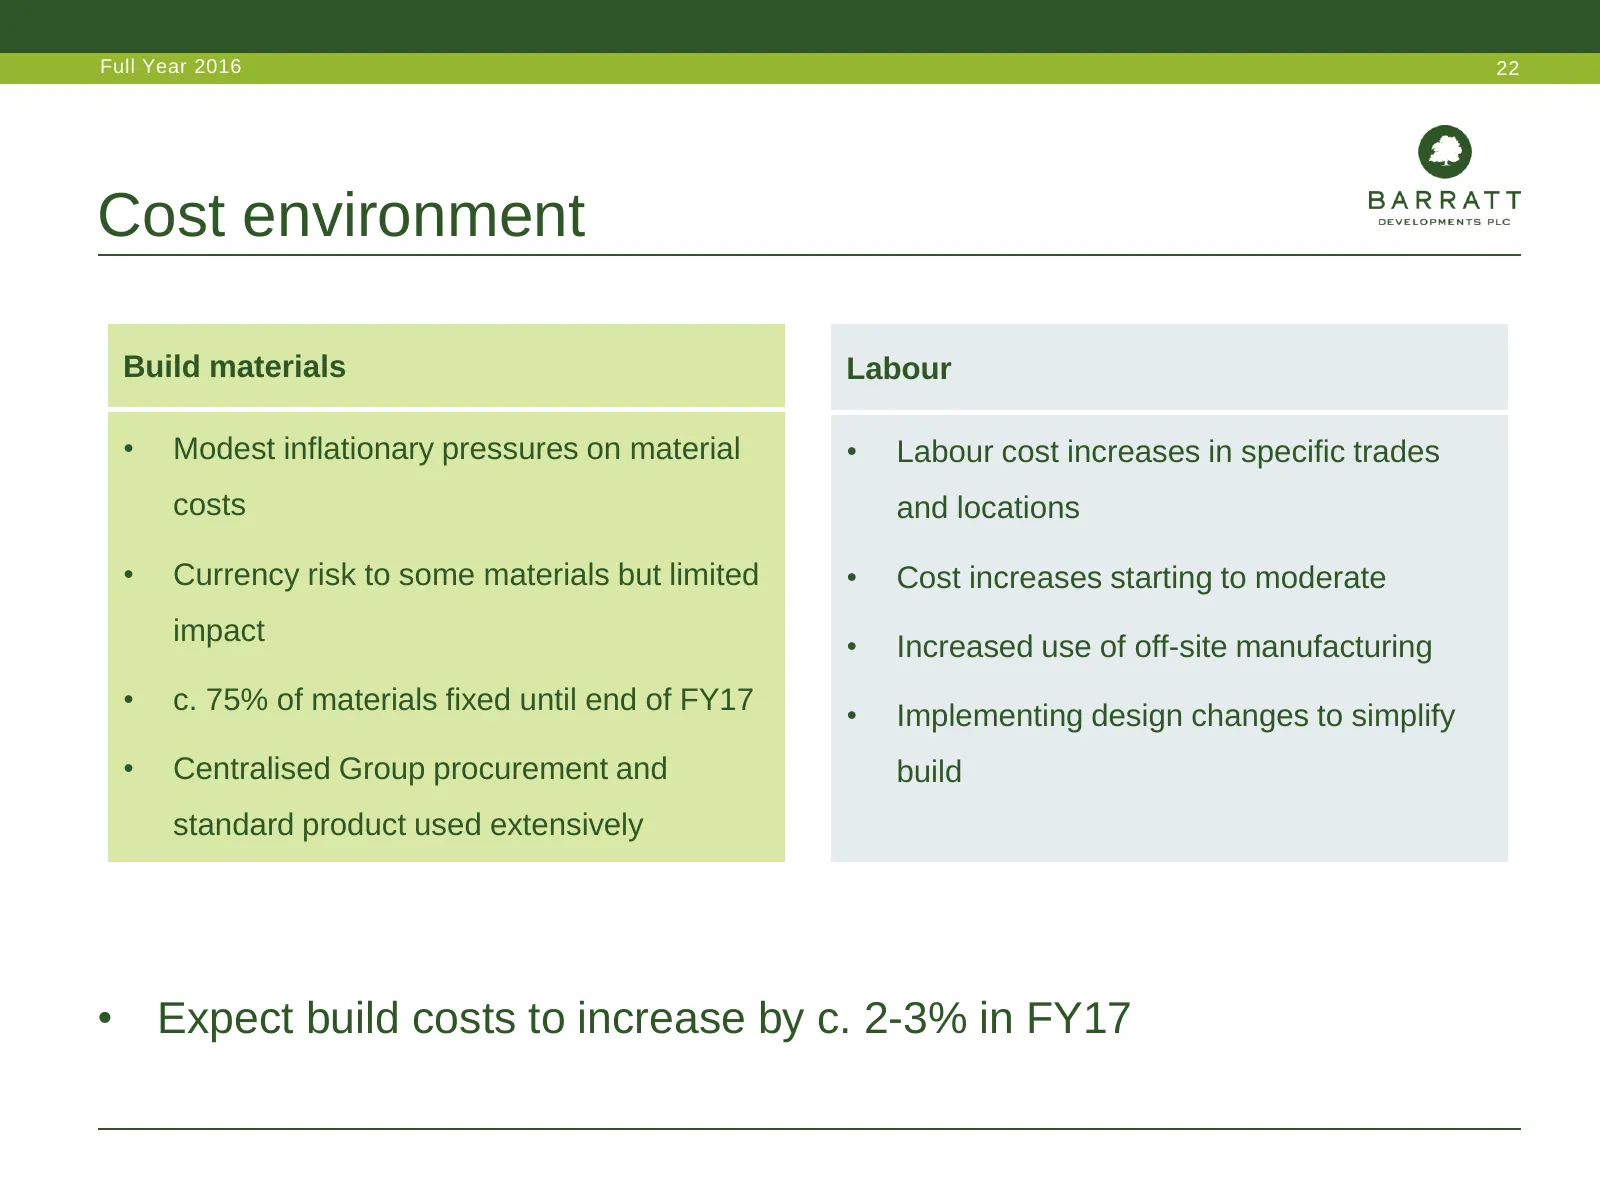
Slide 22: Cost environment
Full Year 2016 22 Cost environment Build materials Labour • Modest inflationary pressures on material • Labour cost increases in specific trades costs and locations • Currency risk to some materials but limited • Cost increases starting to moderate impact • Increased use of off-site manufacturing •
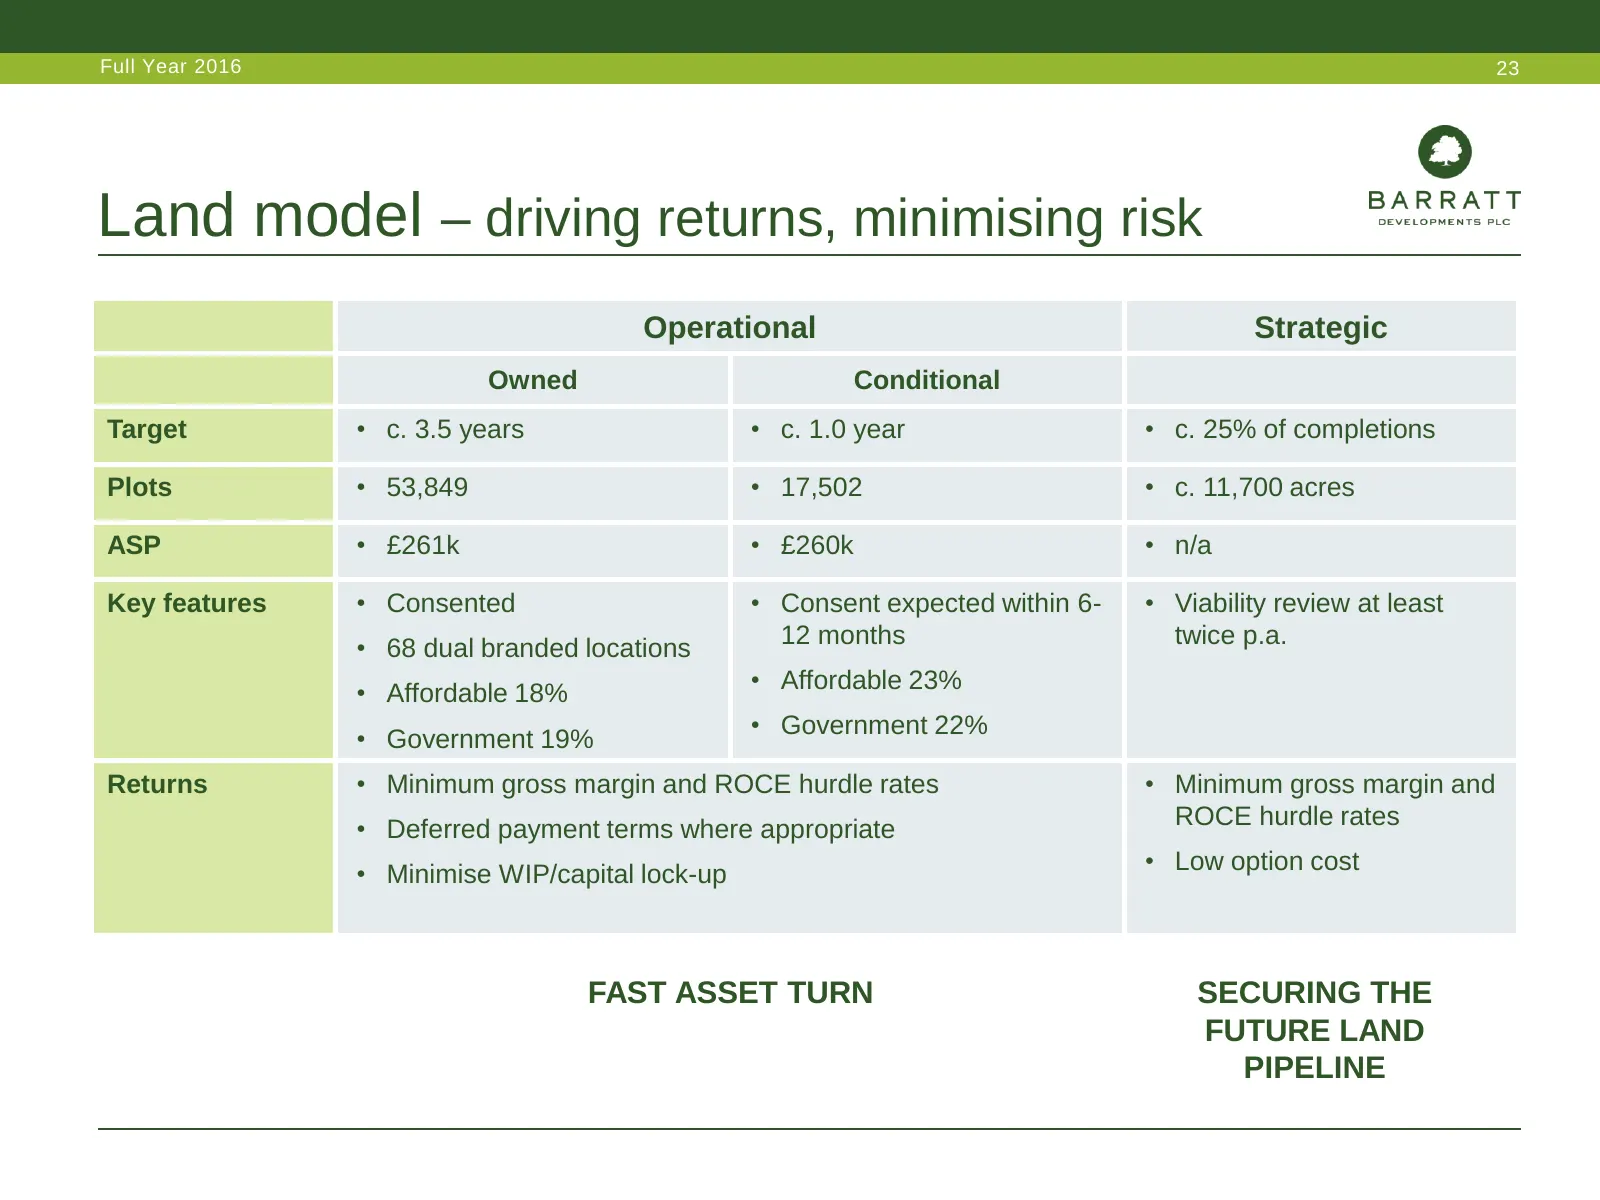
Slide 23: Land model – driving returns, minimising risk
Full Year 2016 23 Land model – driving returns, minimising risk Operational Strategic Owned Conditional Target • c. 3.5 years • c. 1.0 year • c. 25% of completions Plots • 53,849 • 17,502 • c. 11,700 acres ASP • £261k • £260k • n/a Key features • Consented • Consent expected within 6- • Viability re
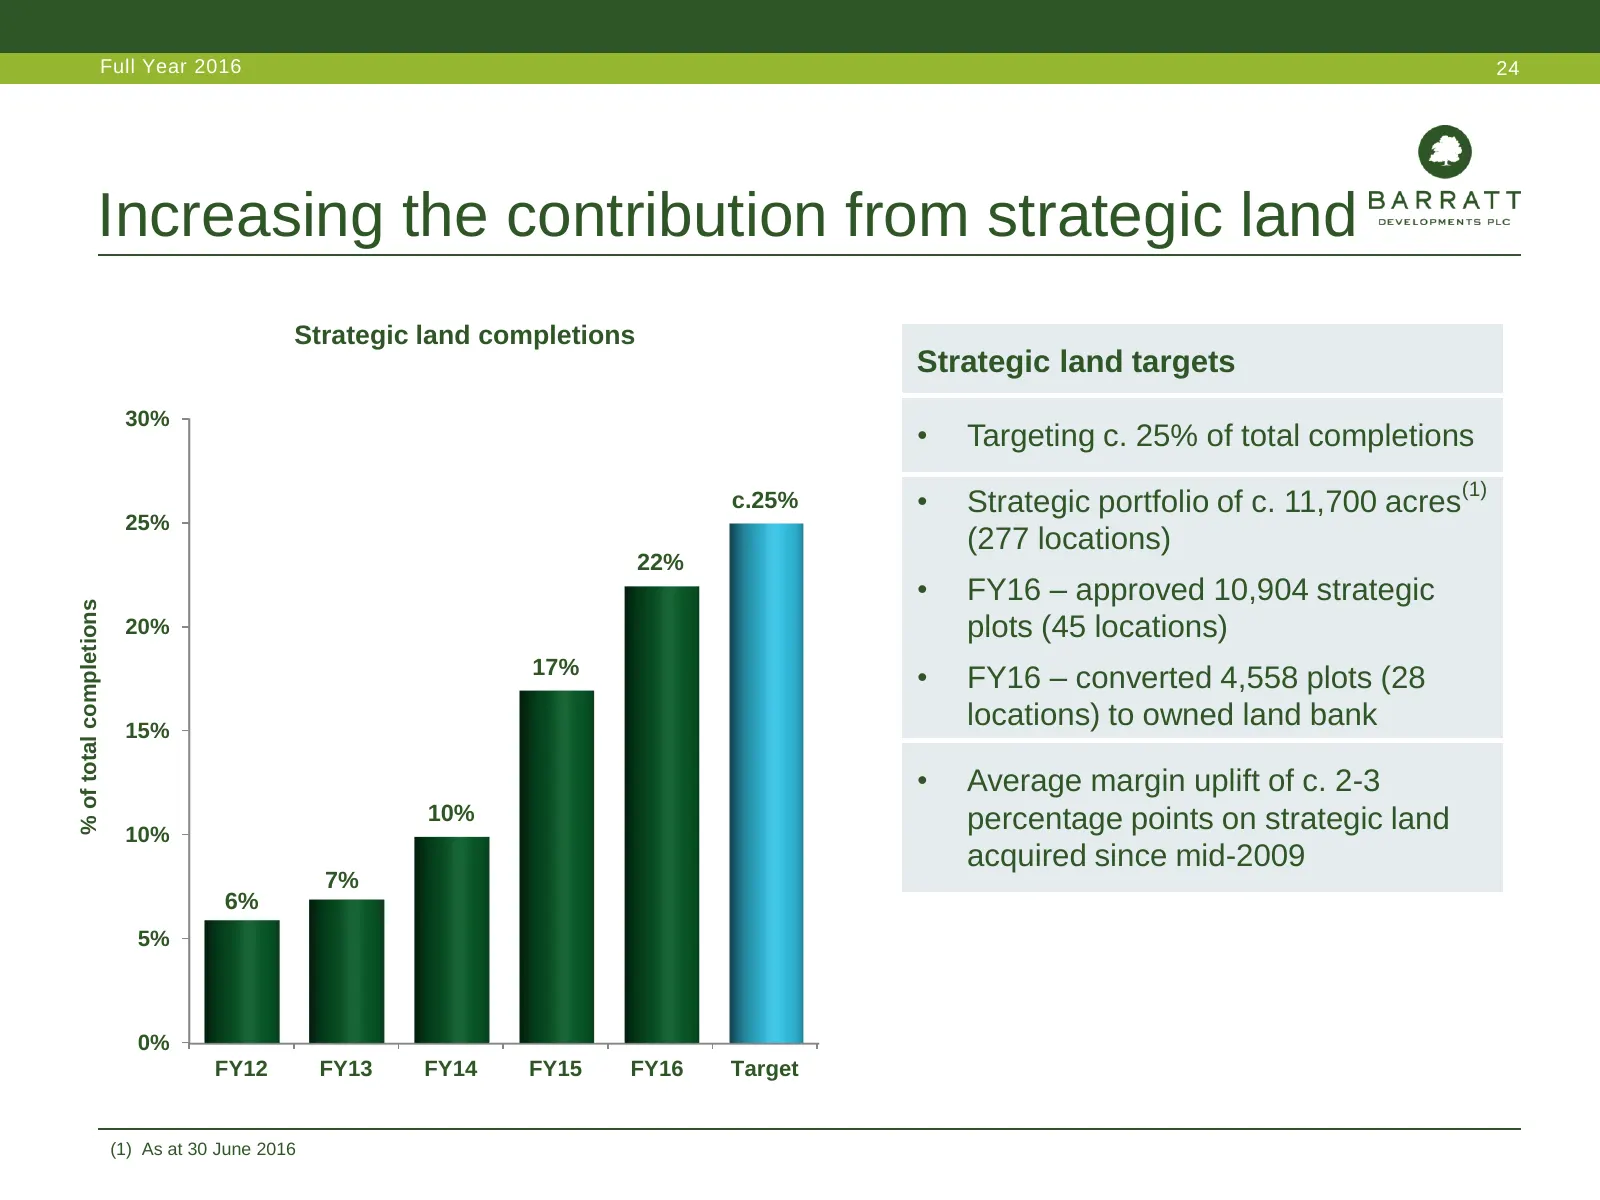
Slide 24: Increasing the contribution from strategic land
Full Year 2016 24 Increasing the contribution from strategic land Strategic land completions Strategic land targets 30% • Targeting c. 25% of total completions c.25% • Strategic portfolio of c. 11,700 acres(1) 25% (277 locations) 22% • FY16 – approved 10,904 strategic % of total completions 20% plot
Slide 25: An excellent performance in the year
Full Year 2016 25 An excellent performance in the year • Strong Group sales rate • Positive pricing trends across all regions • Fast asset turn operational land model • Increased contribution from strategic land • Operating model driving higher returns
Slide 26: David Thomas, Chief Executive
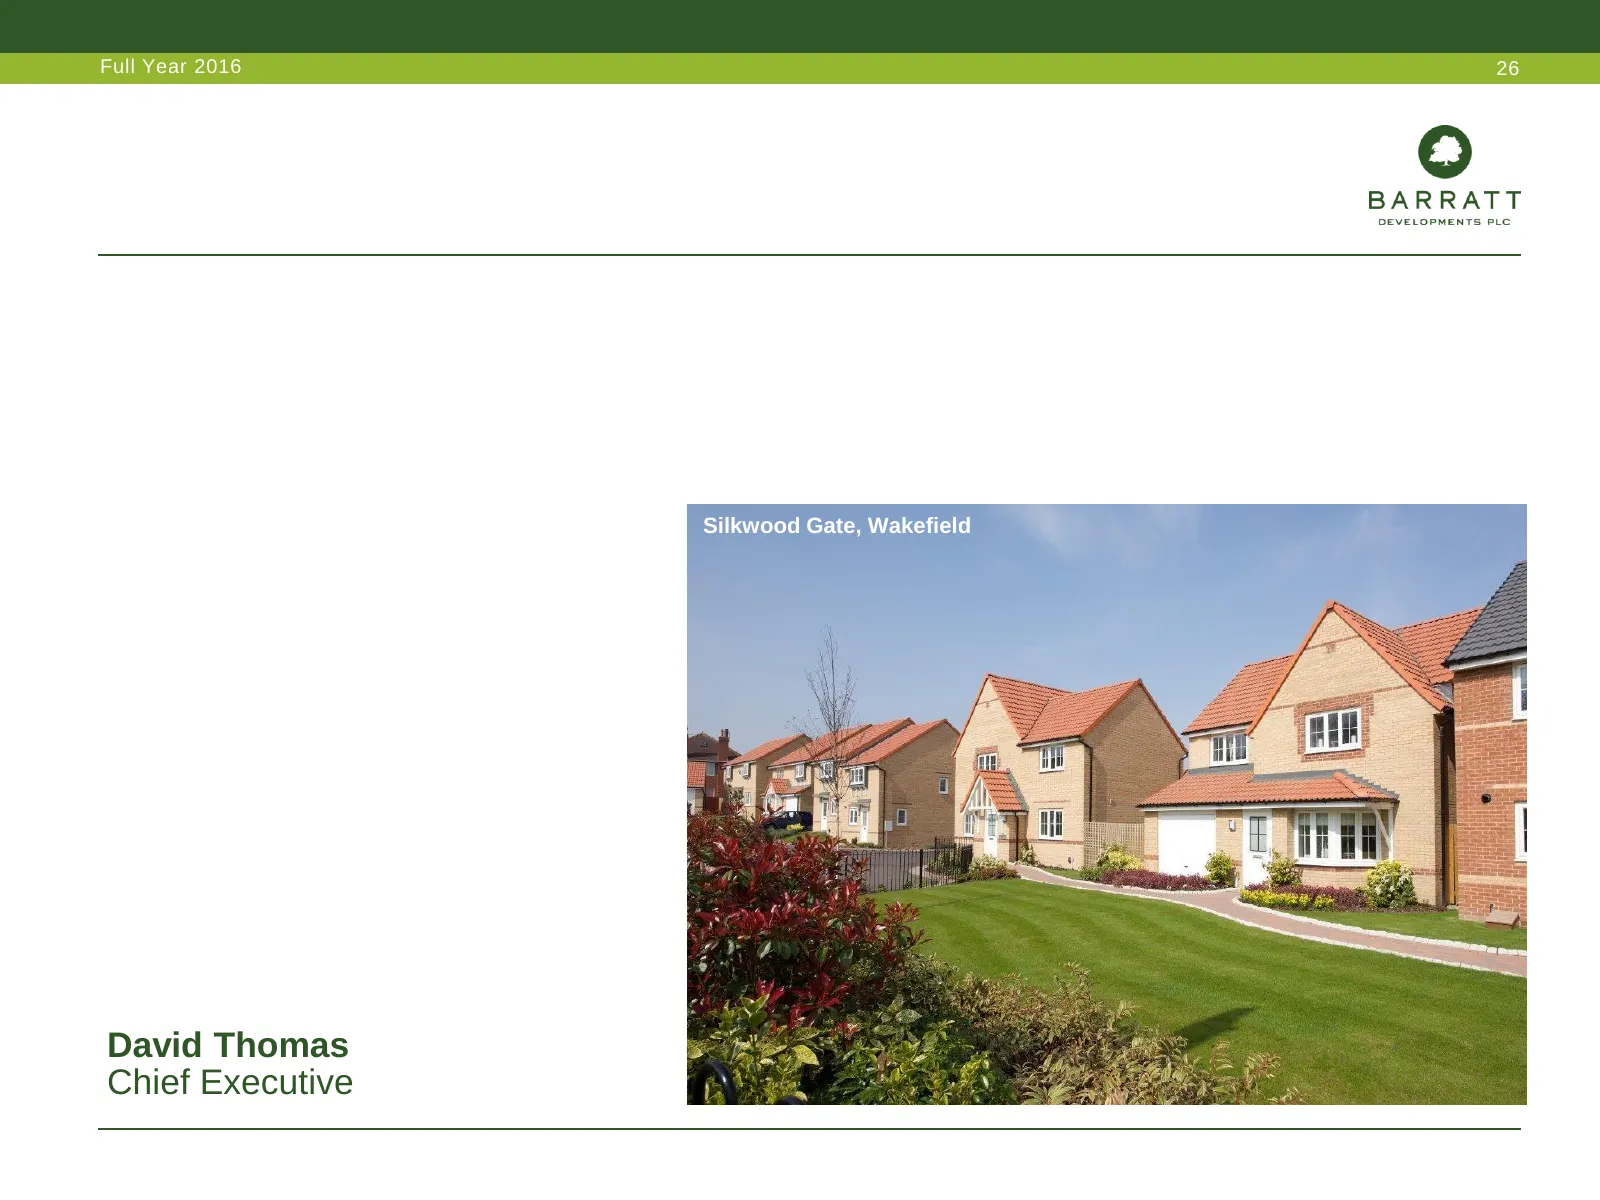
Full Year 2016 26 Silkwood Gate, Wakefield David Thomas The Gateway, Pickering, North Yorkshire Chief Executive
Slide 27: Market fundamentals remain attractive
Full Year 2016 27 Market fundamentals remain attractive • Demand continues to exceed supply • Strong Government support • Positive lending environment • Attractive land market Old Merchant Taylors, Croxley Green
Slide 28: Investment proposition
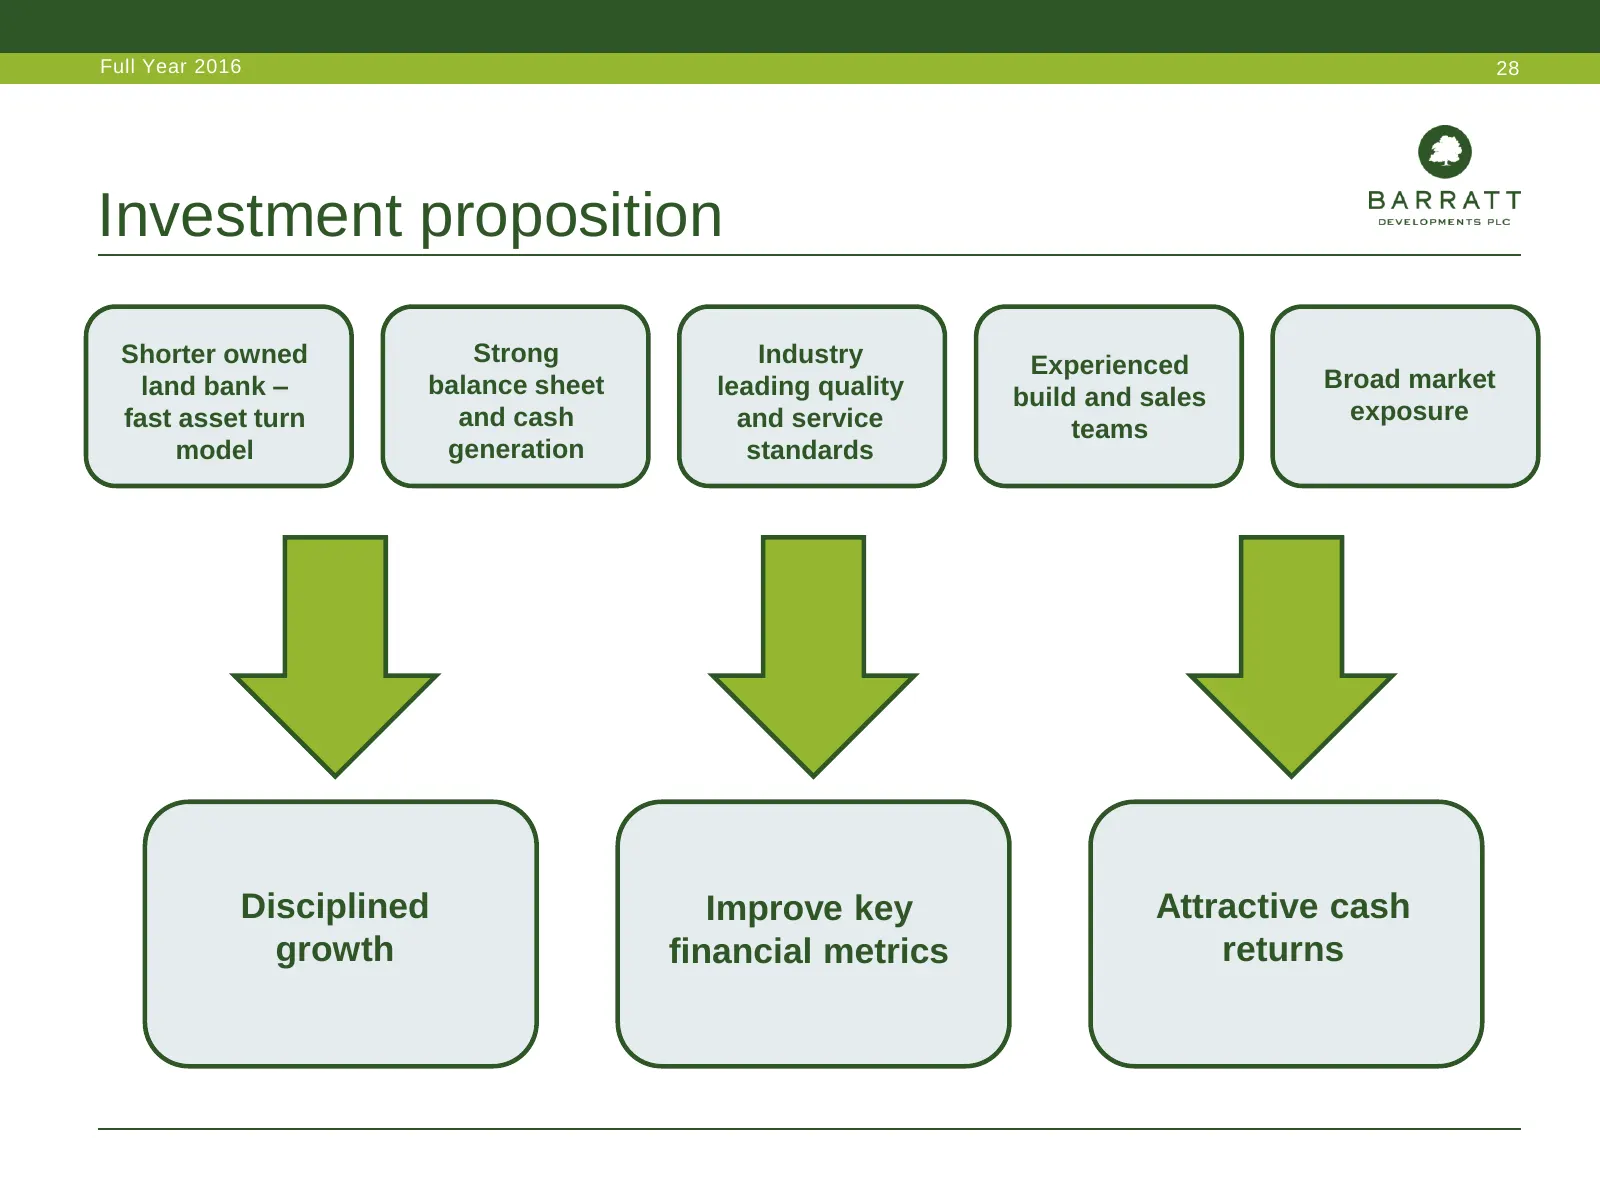
Full Year 2016 28 Investment proposition Shorter owned Strong Industry Experienced land bank – balance sheet leading quality Broad market build and sales fast asset turn and cash and service exposure teams model generation standards Disciplined Improve key Attractive cash growth financial metrics re
Slide 29: Our focus
Full Year 2016 29 Our focus • Product profile • Strong margin management • Quality and service • Capital structure • Cash returns
Slide 30: Our operating framework
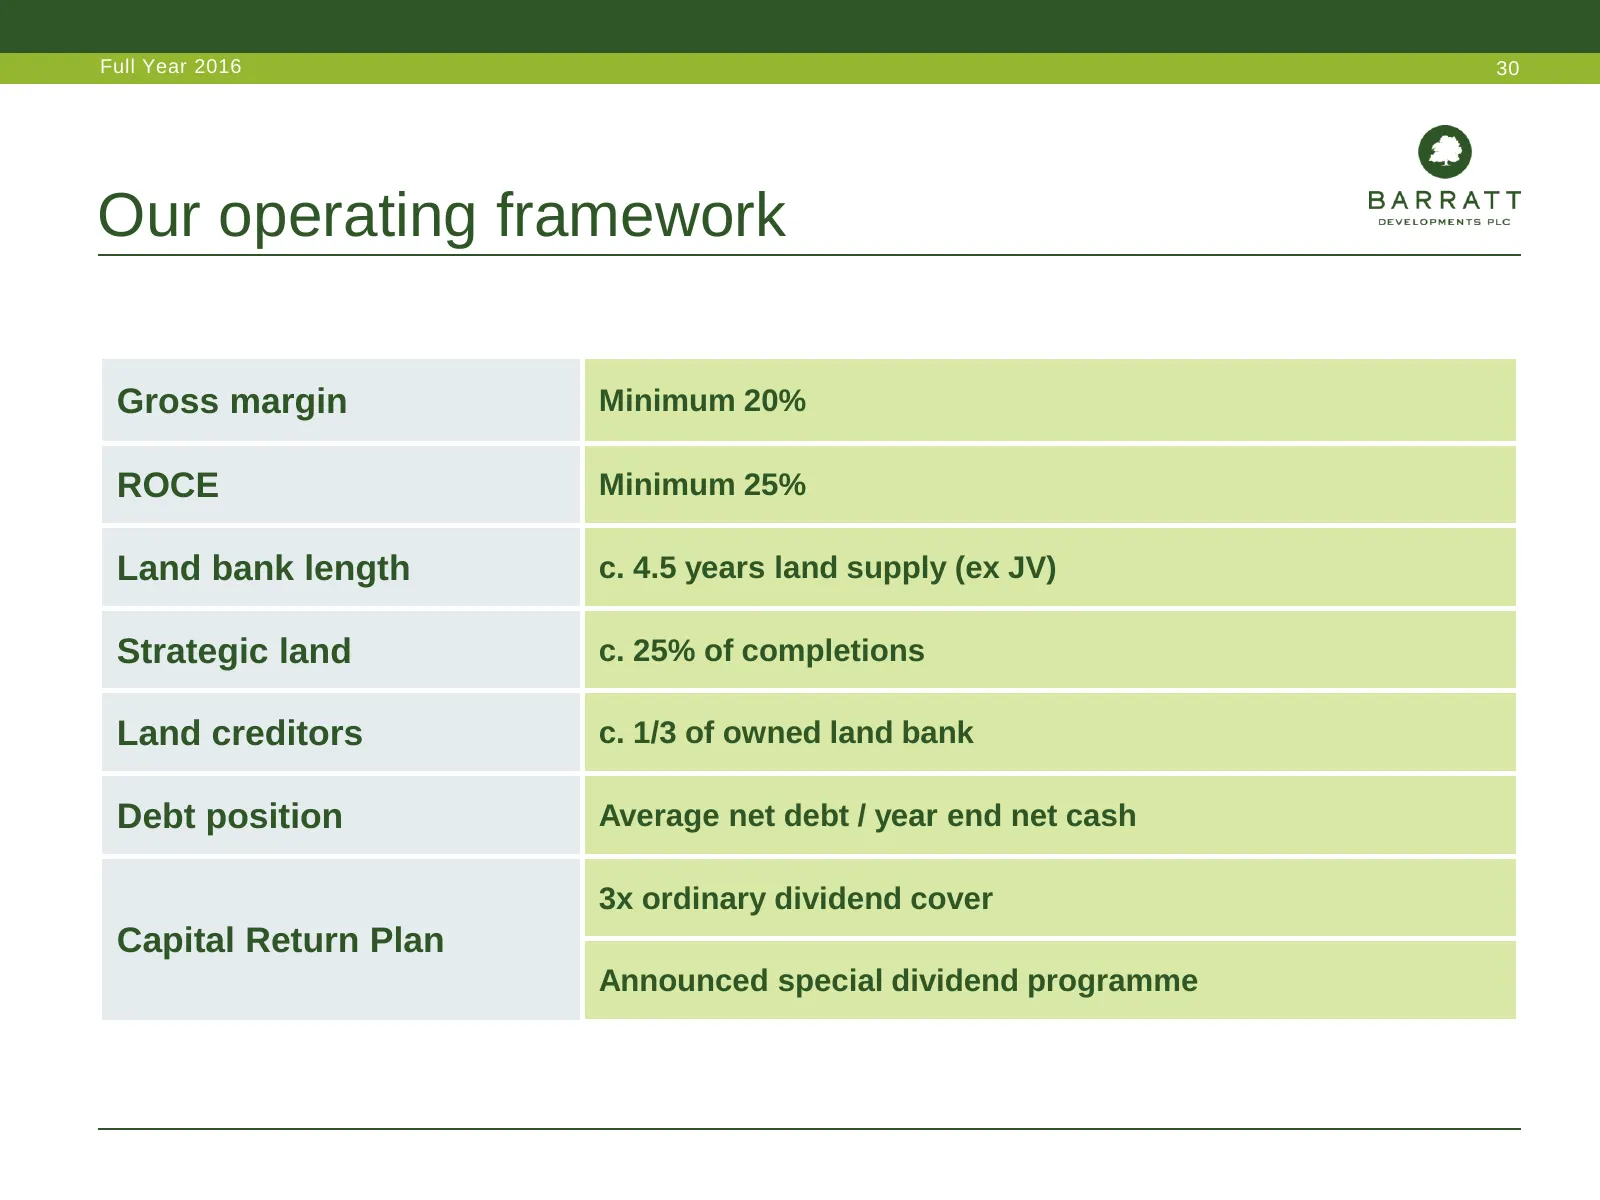
Full Year 2016 30 Our operating framework Gross margin Minimum 20% ROCE Minimum 25% Land bank length c. 4.5 years land supply (ex JV) Strategic land c. 25% of completions Land creditors c. 1/3 of owned land bank Debt position Average net debt / year end net cash 3x ordinary dividend cover Capital Re
Slide 31: Cash return framework
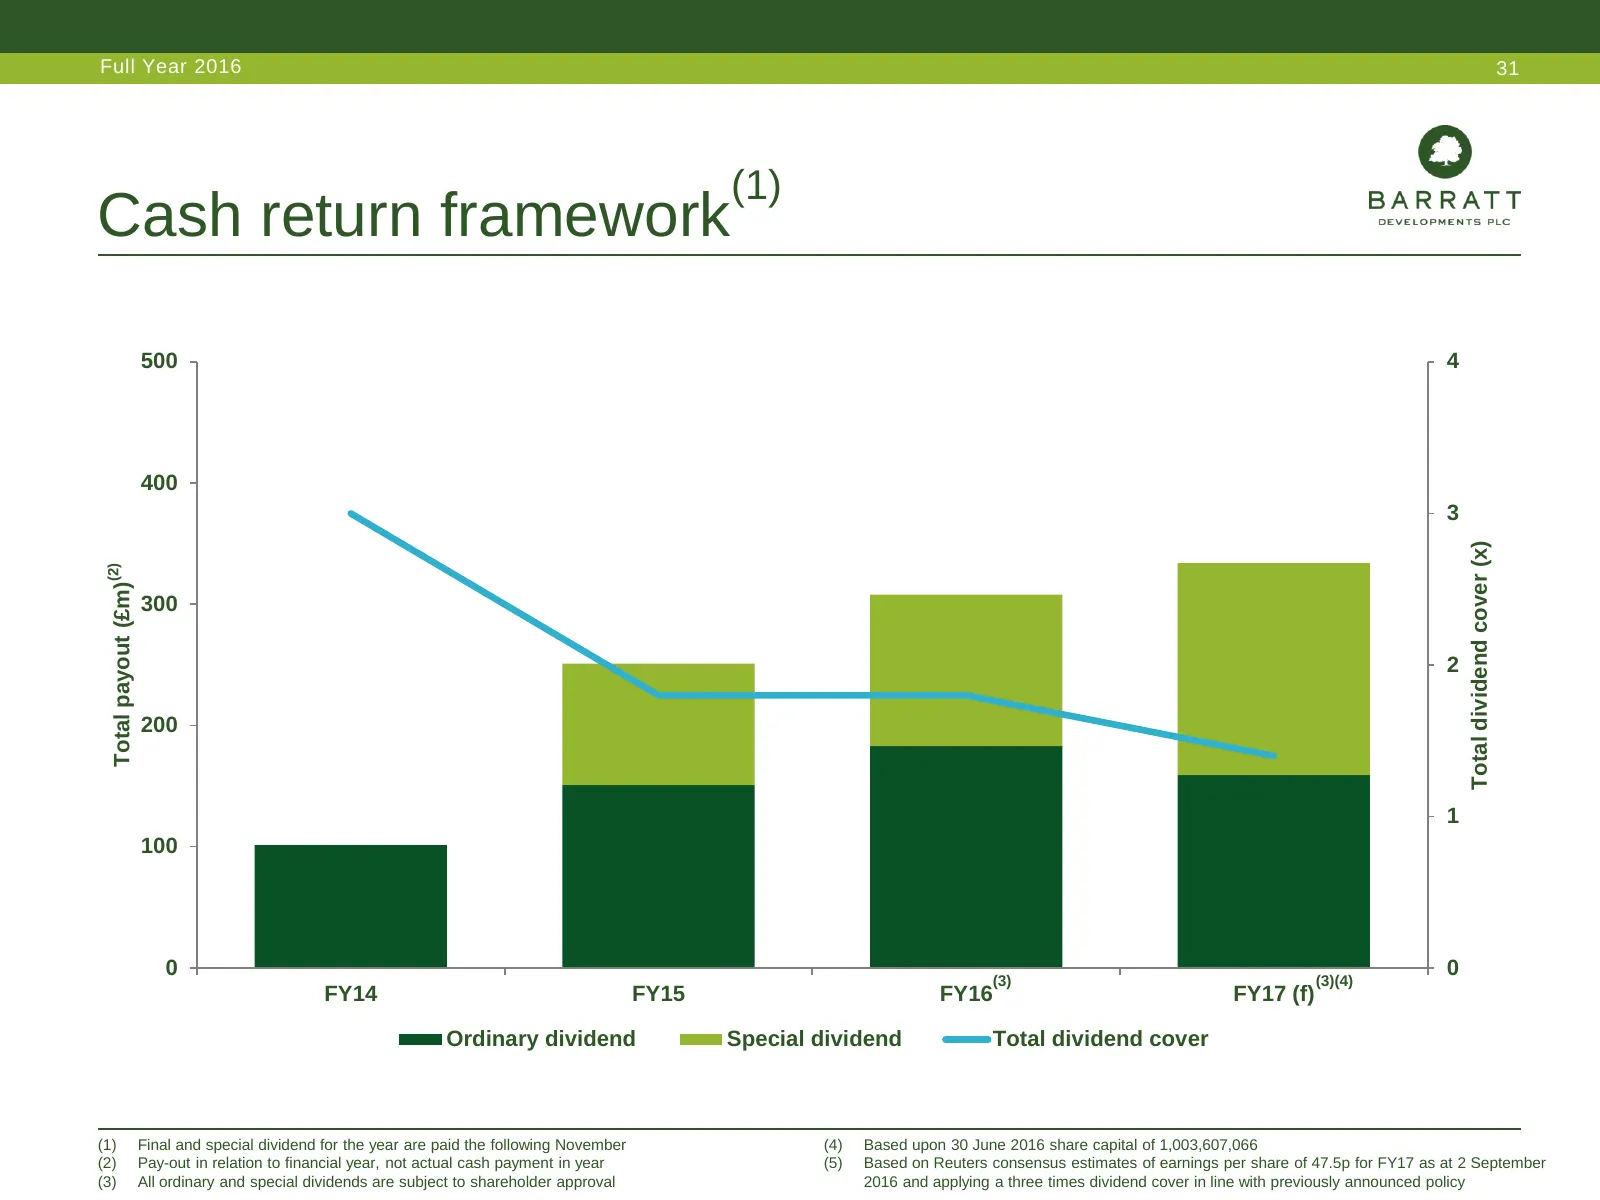
Full Year 2016 31 (1) Cash return framework 500 4 400 3 Total dividend cover (x) (2) Total payout (£m) 300 2 200 1 100 0 (3) (3)(4) 0 FY14 FY15 FY16 FY17 (f) Ordinary dividend Special dividend Total dividend cover (1) Final and special dividend for the year are paid the following November (4) Based
Slide 32: Current trading remains healthy
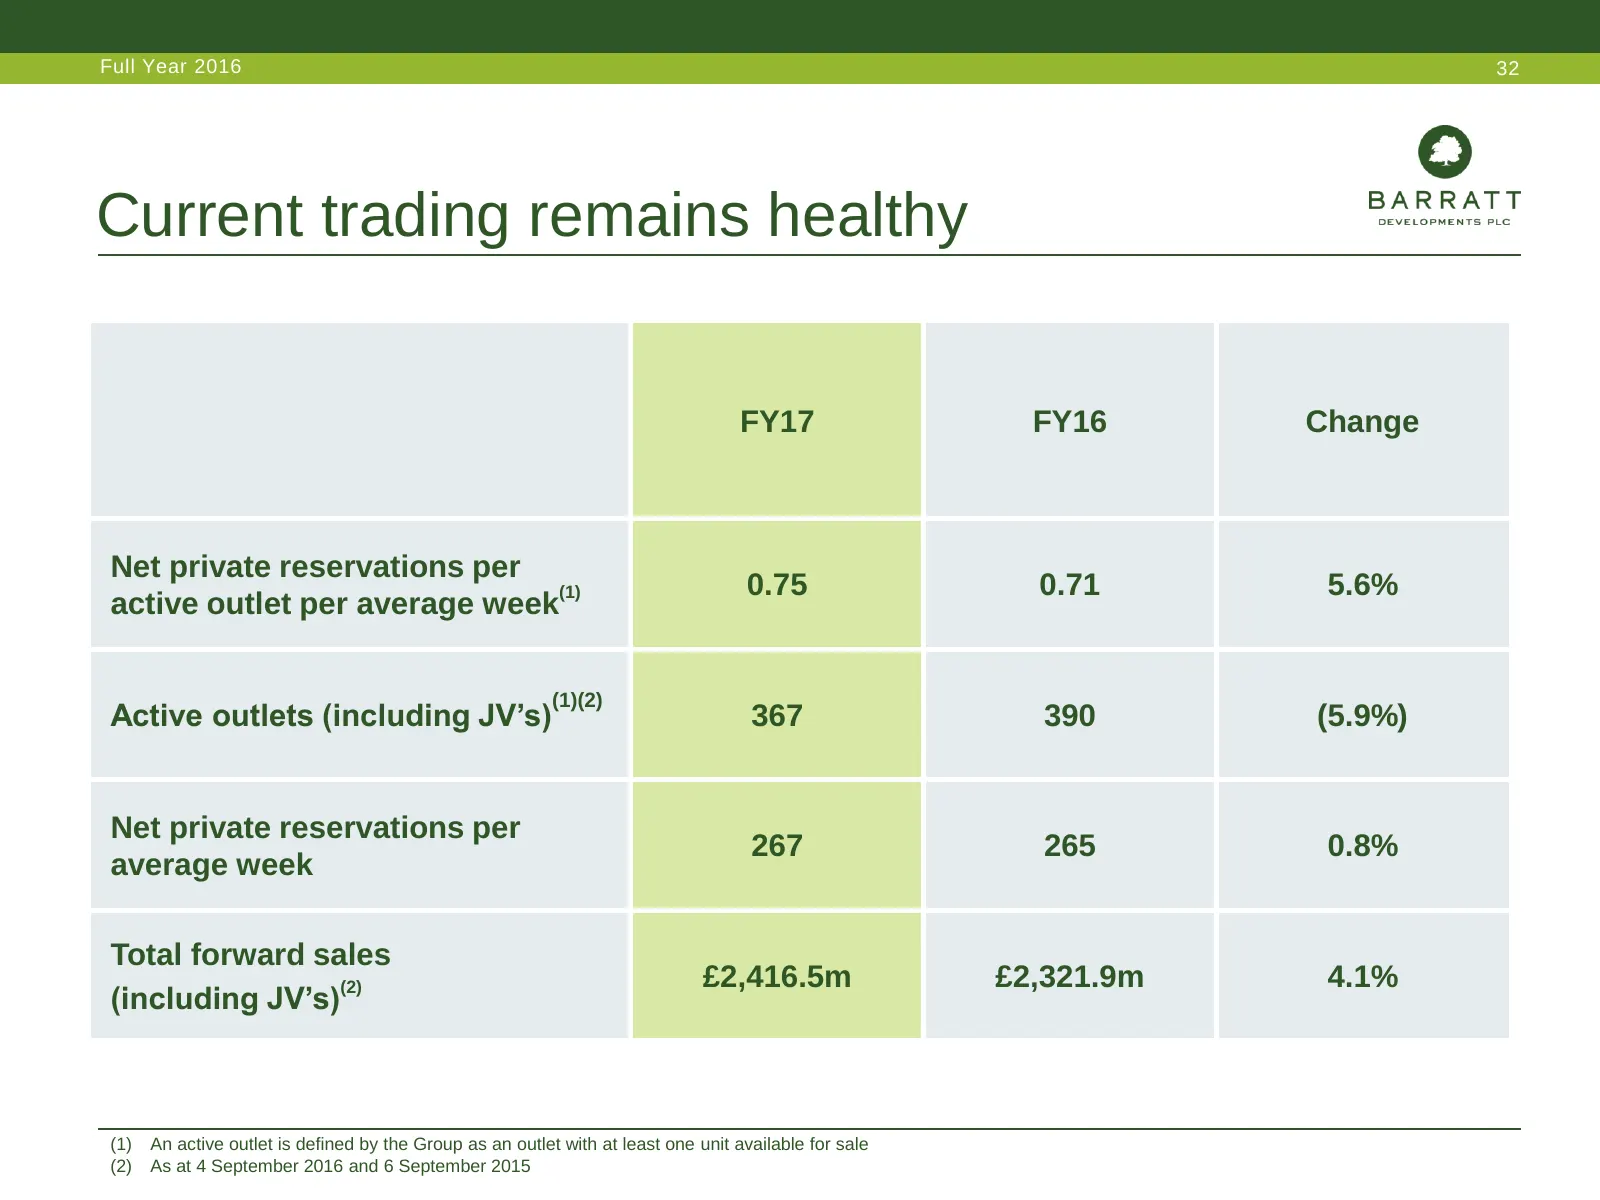
Full Year 2016 32 Current trading remains healthy FY17 FY16 Change Net private reservations per (1) 0.75 0.71 5.6% active outlet per average week (1)(2) Active outlets (including JV’s) 367 390 (5.9%) Net private reservations per 267 265 0.8% average week Total forward sales (2) £2,416.5m £2,321.9m 4
Slide 33: Positive on outlook
Full Year 2016 33 Positive on outlook • Robust balance sheet • Strong market backdrop • Continue to monitor market conditions following EU referendum • Investment proposition leaves Group well placed • Current trading remains healthy
Slide 34: Q&A
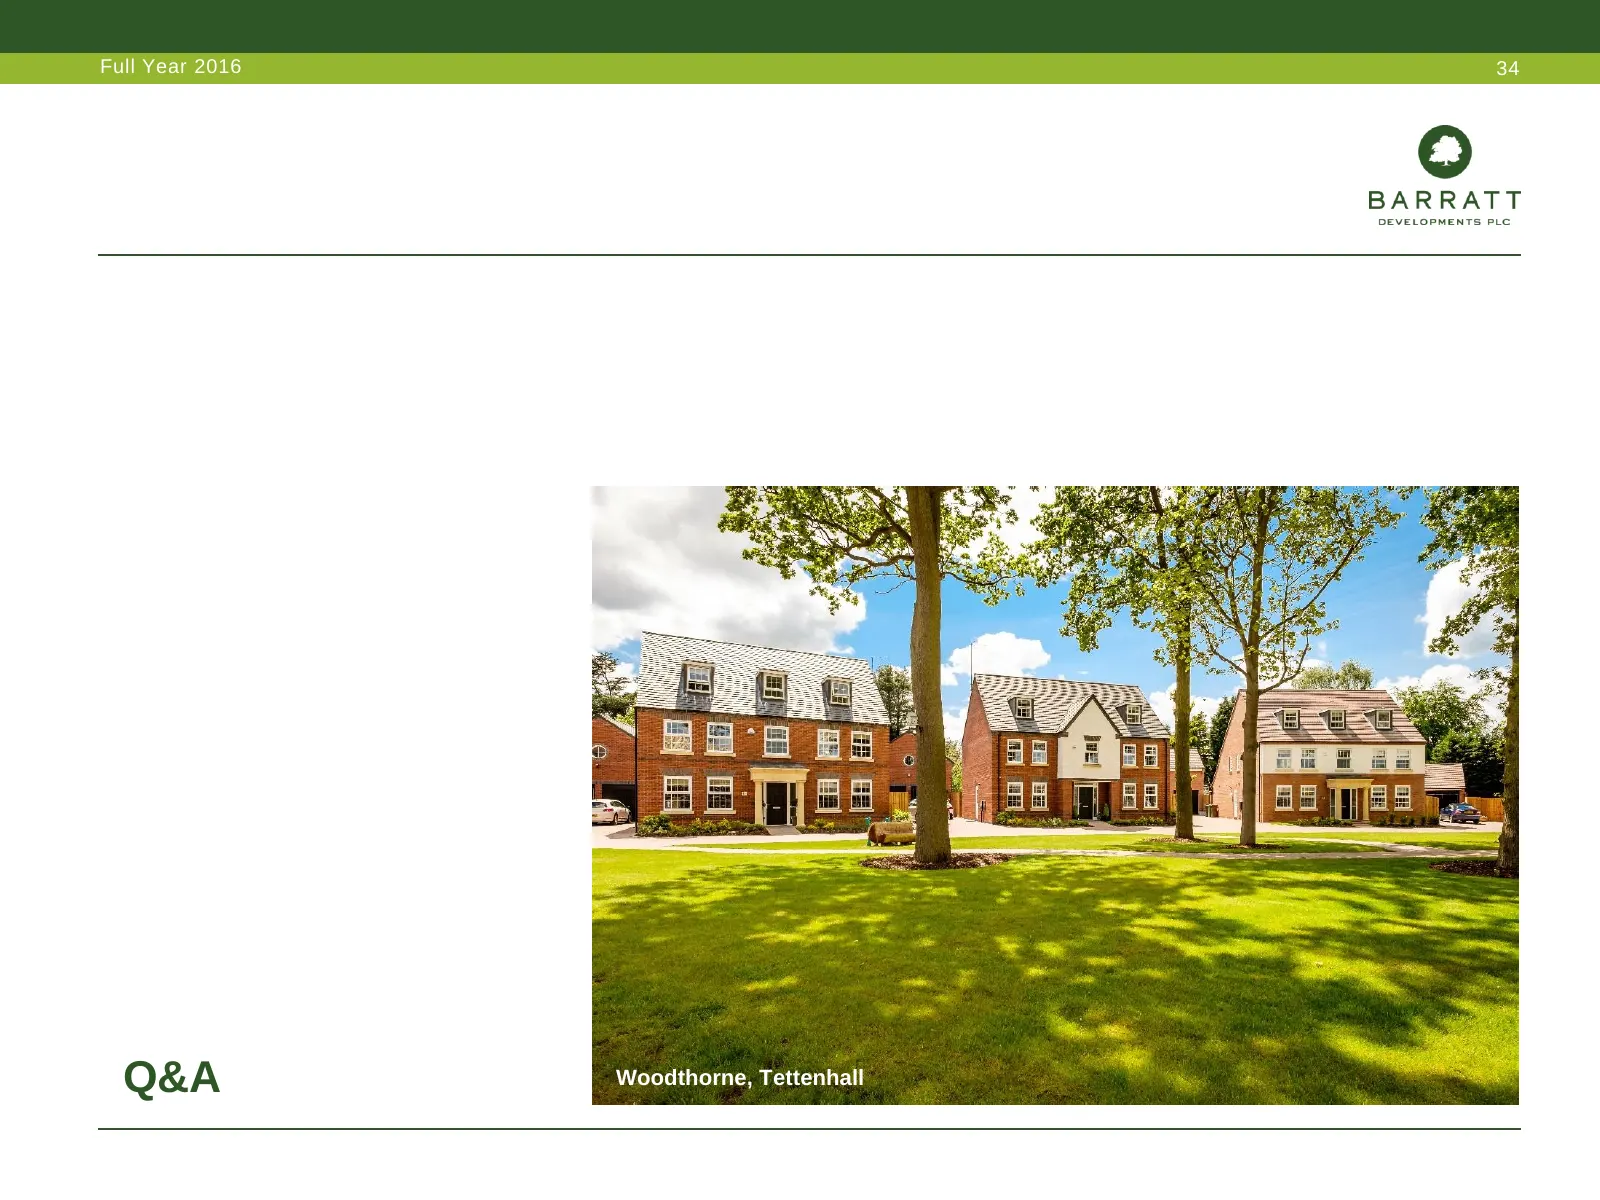
Full Year 2016 34 Q&A Woodthorne, Tettenhall Old Merchant Taylors, Croxley Green
Slide 35: Appendices
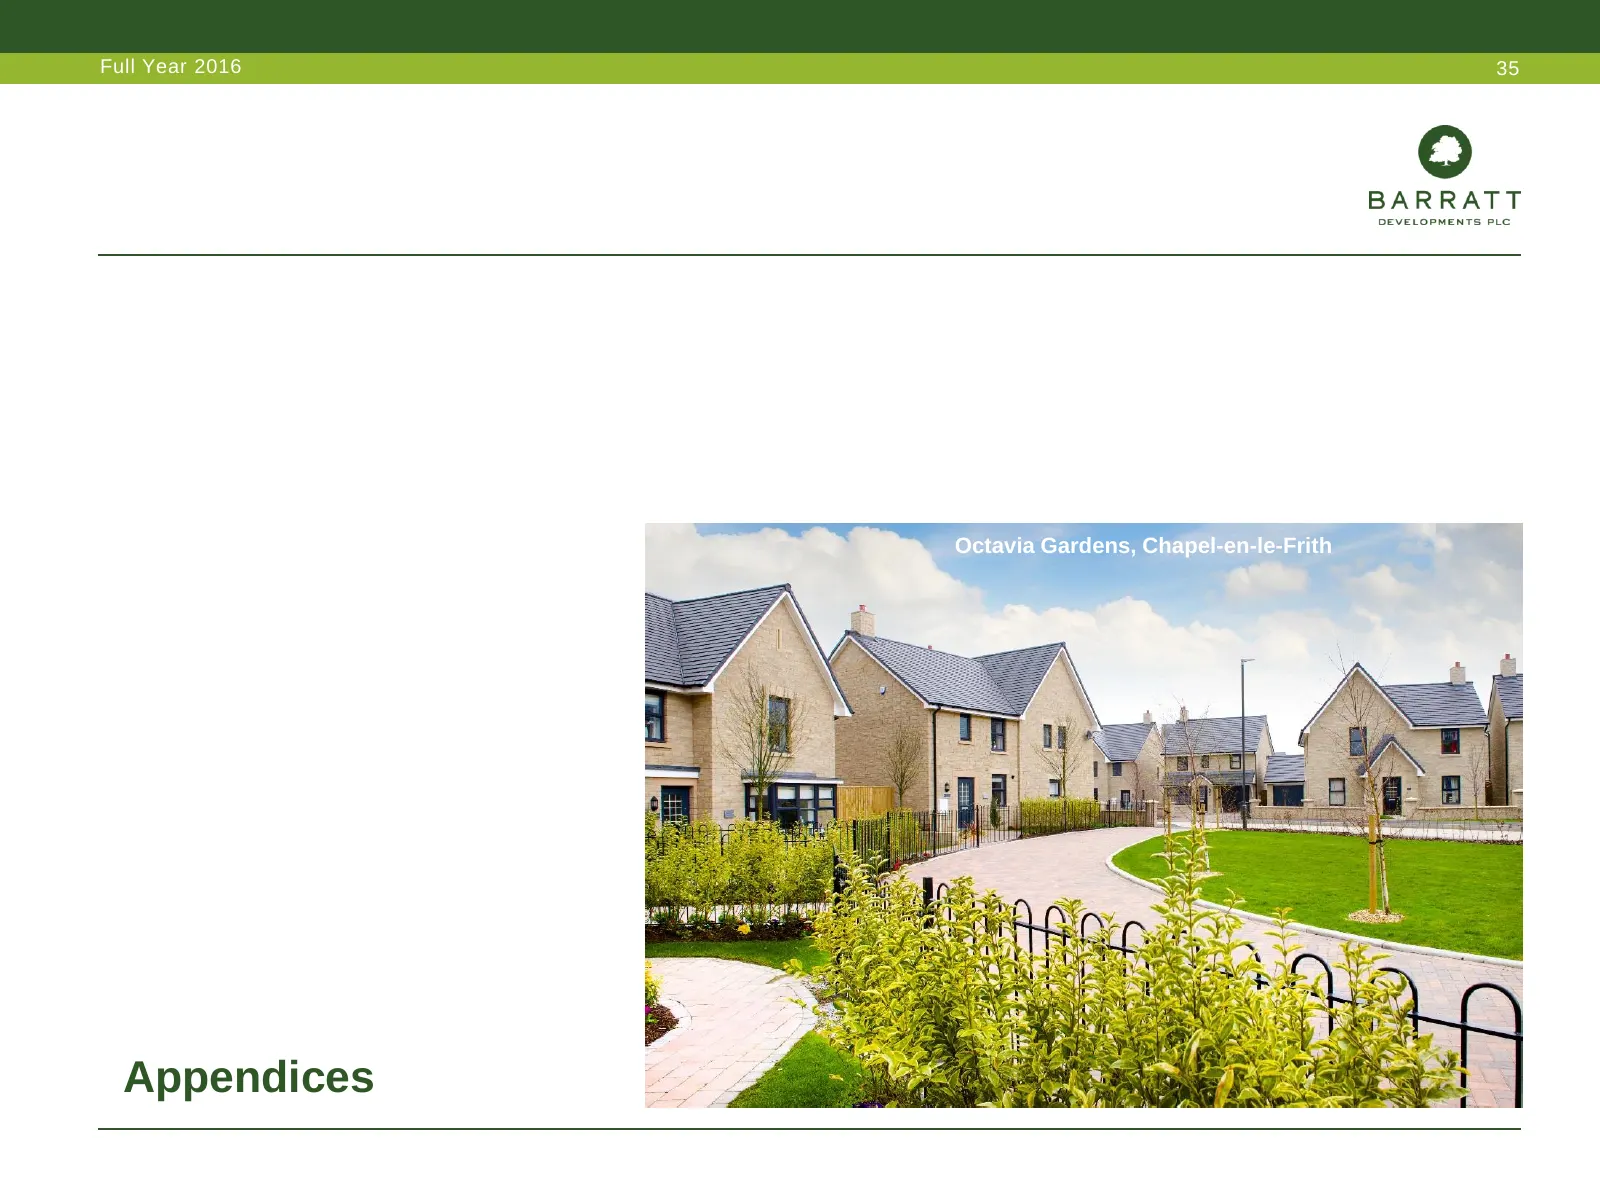
Full Year 2016 35 Octavia Gardens, Chapel-en-le-Frith Appendices Old Merchant Taylors, Croxley Green
Slide 36: Appendices
Full Year 2016 36 Appendices Page • Capital Return Plan 37 • Completions analysis 38 • Balance sheet 39 • Balance sheet – land bank 40 • Approved land payment profile 41 • Balance sheet – stock & WIP 42 • Investment in joint ventures and associates 43 • Net interest charge analysis 44 • Financing ar
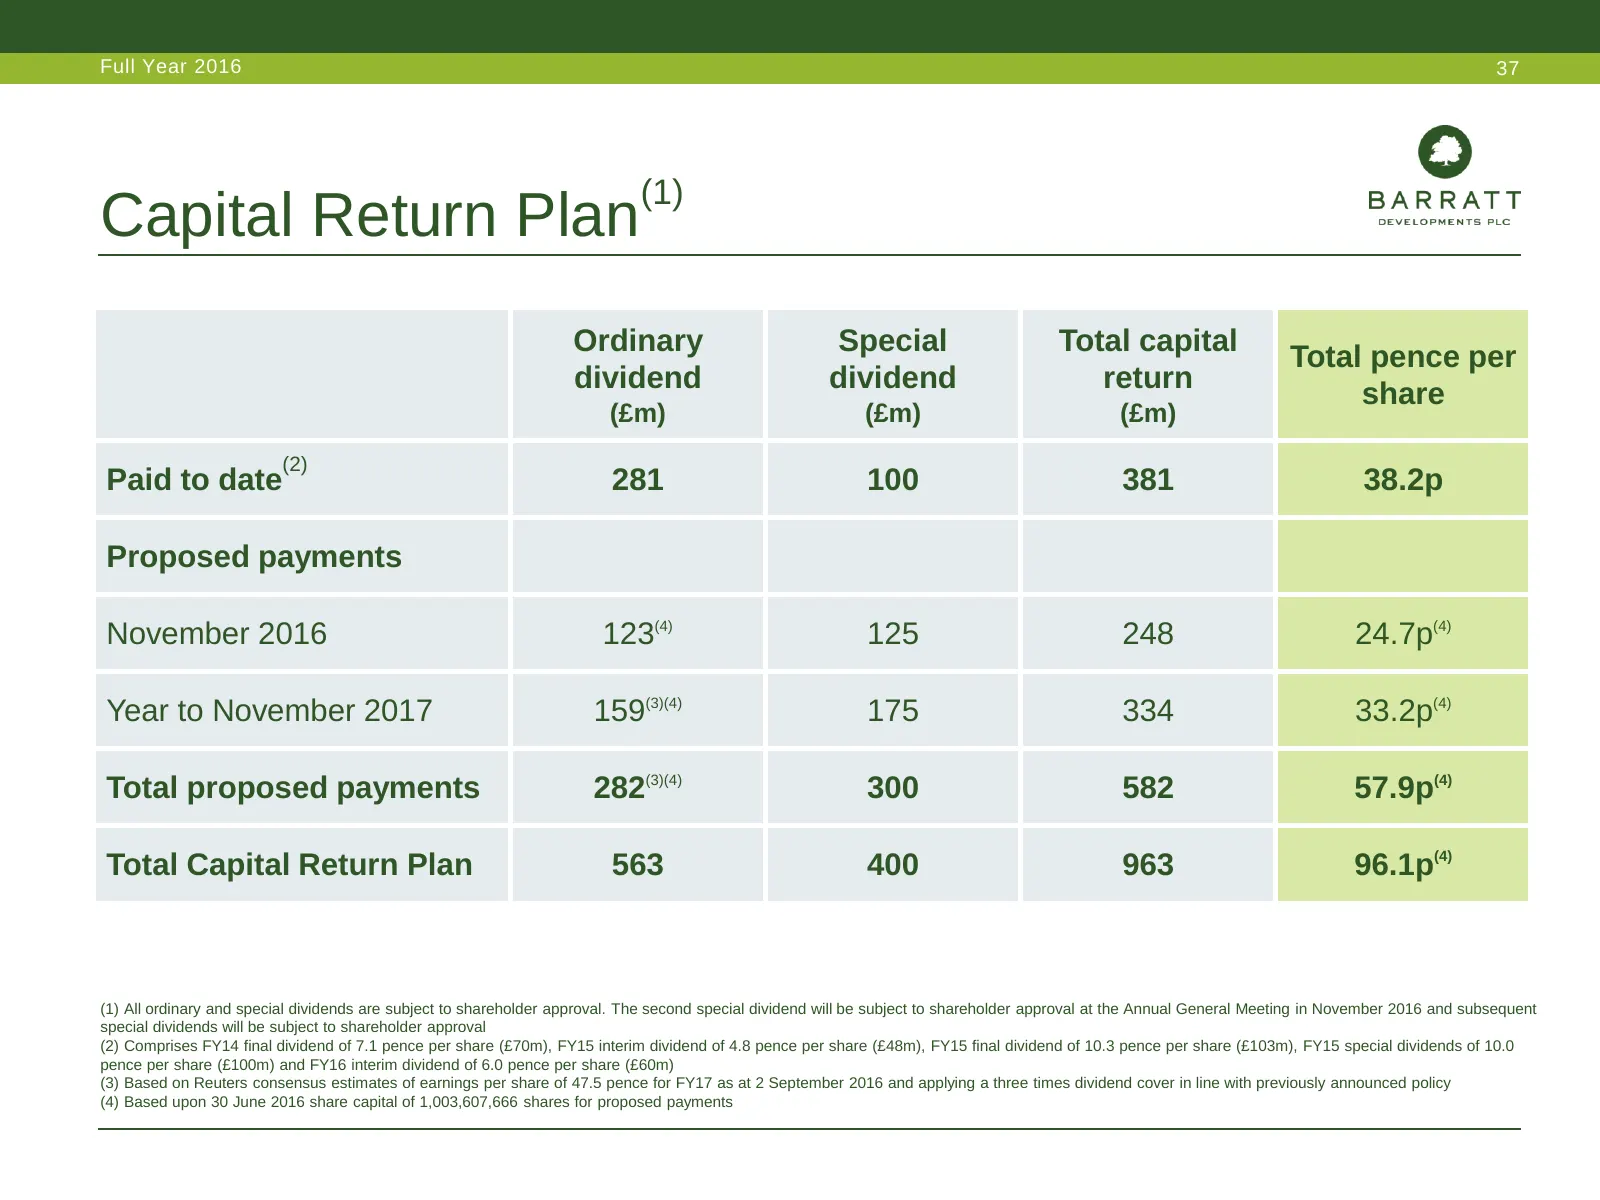
Slide 37: Capital Return Plan
Full Year 2016 37 (1) Capital Return Plan Ordinary Special Total capital Total pence per dividend dividend return share (£m) (£m) (£m) (2) Paid to date 281 100 381 38.2p Proposed payments November 2016 123(4) 125 248 24.7p(4) Year to November 2017 159(3)(4) 175 334 33.2p(4) Total proposed payments 2
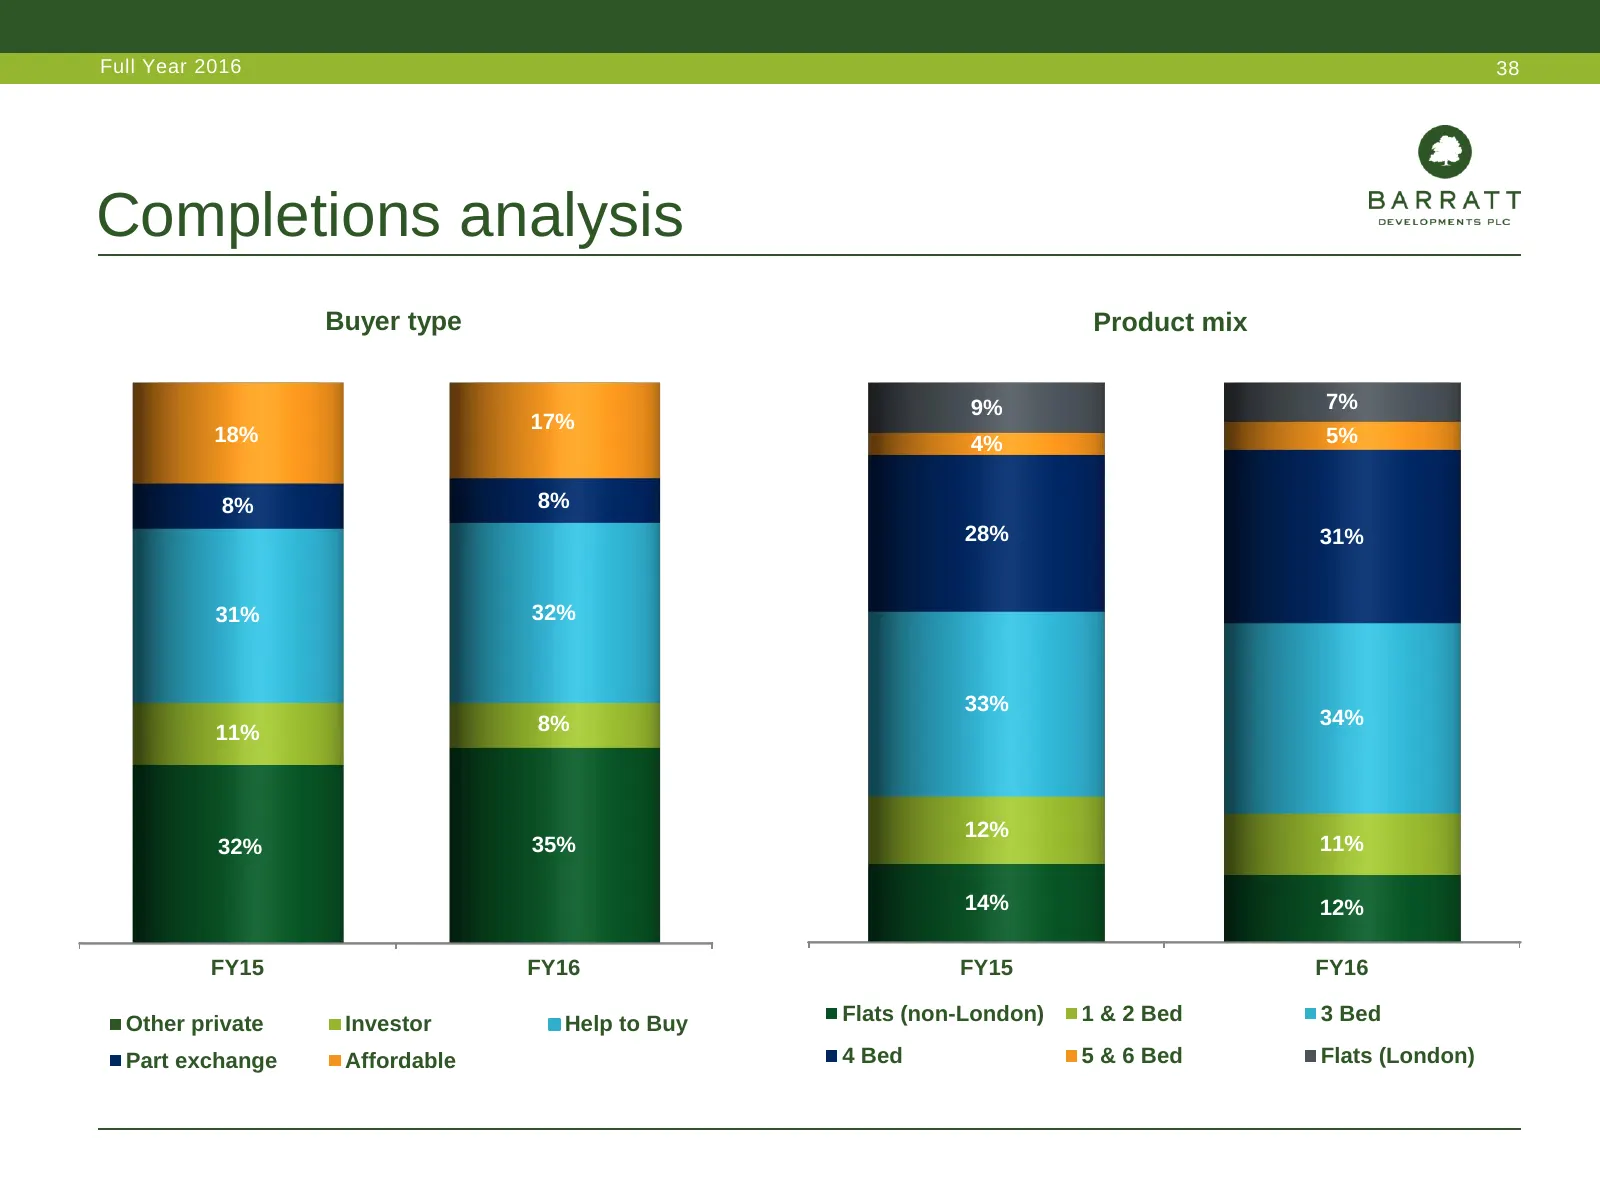
Slide 38: Completions analysis
Full Year 2016 38 Completions analysis Buyer type Product mix 9% 7% 17% 18% 4% 5% 8% 8% 28% 31% 31% 32% 33% 8% 34% 11% 12% 32% 35% 11% 14% 12% FY15 FY16 FY15 FY16 Other private Investor Help to Buy Flats (non-London) 1 & 2 Bed 3 Bed Part exchange Affordable 4 Bed 5 & 6 Bed Flats (London)
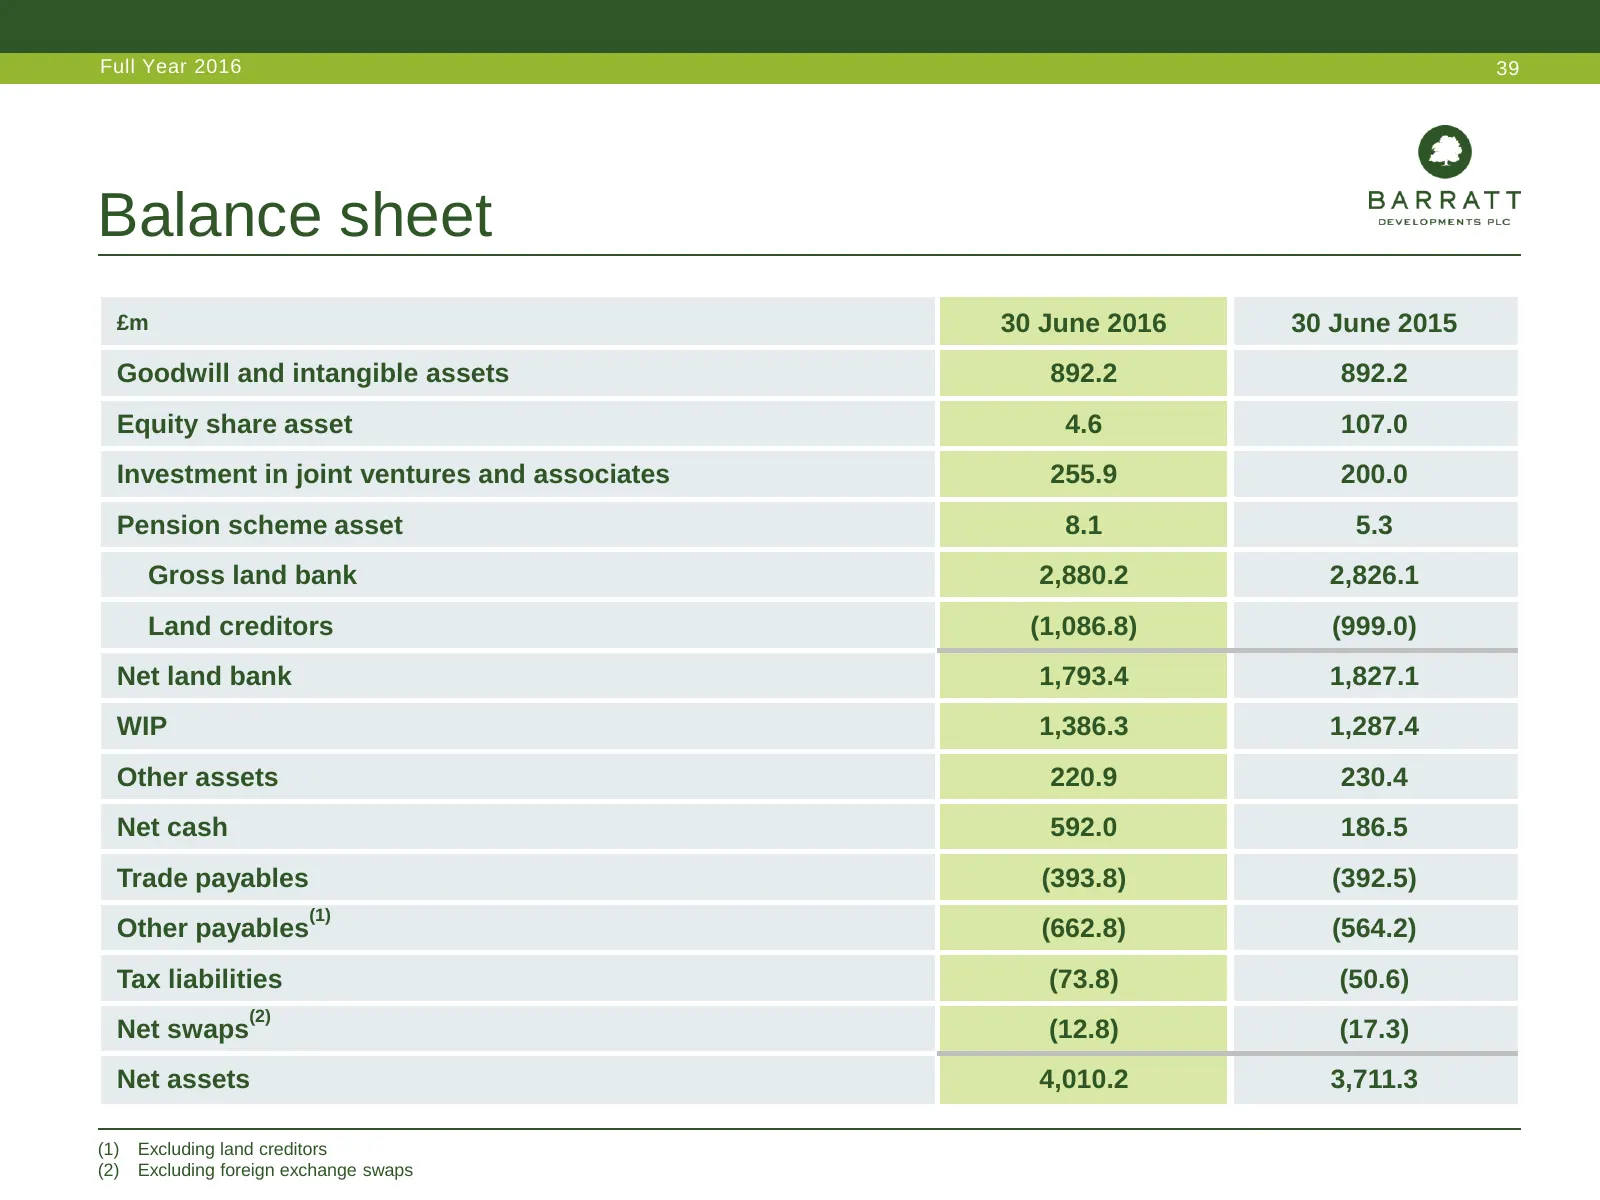
Slide 39: Balance sheet
Full Year 2016 39 Balance sheet £m 30 June 2016 30 June 2015 Goodwill and intangible assets 892.2 892.2 Equity share asset 4.6 107.0 Investment in joint ventures and associates 255.9 200.0 Pension scheme asset 8.1 5.3 Gross land bank 2,880.2 2,826.1 Land creditors (1,086.8) (999.0) Net land bank 1,7
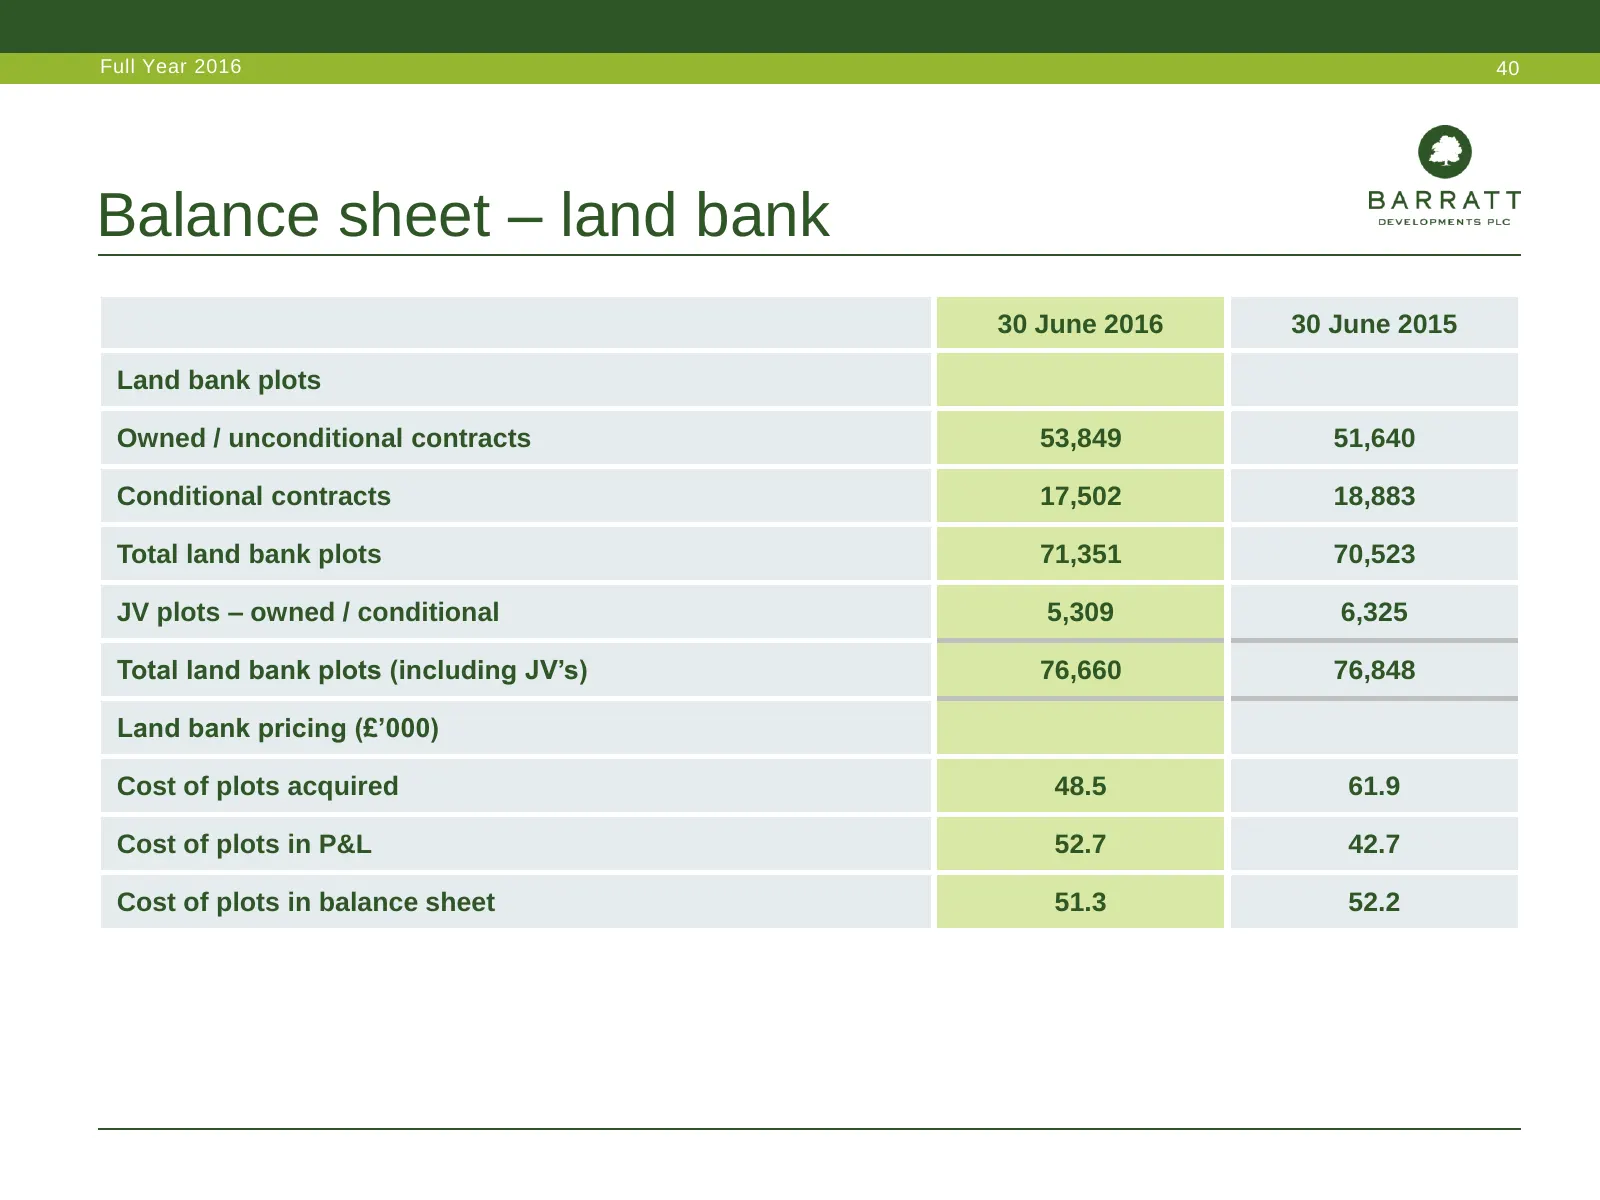
Slide 40: Balance sheet – land bank
Full Year 2016 40 Balance sheet – land bank 30 June 2016 30 June 2015 Land bank plots Owned / unconditional contracts 53,849 51,640 Conditional contracts 17,502 18,883 Total land bank plots 71,351 70,523 JV plots – owned / conditional 5,309 6,325 Total land bank plots (including JV’s) 76,660 76,848
Slide 41: Approved land payment profile
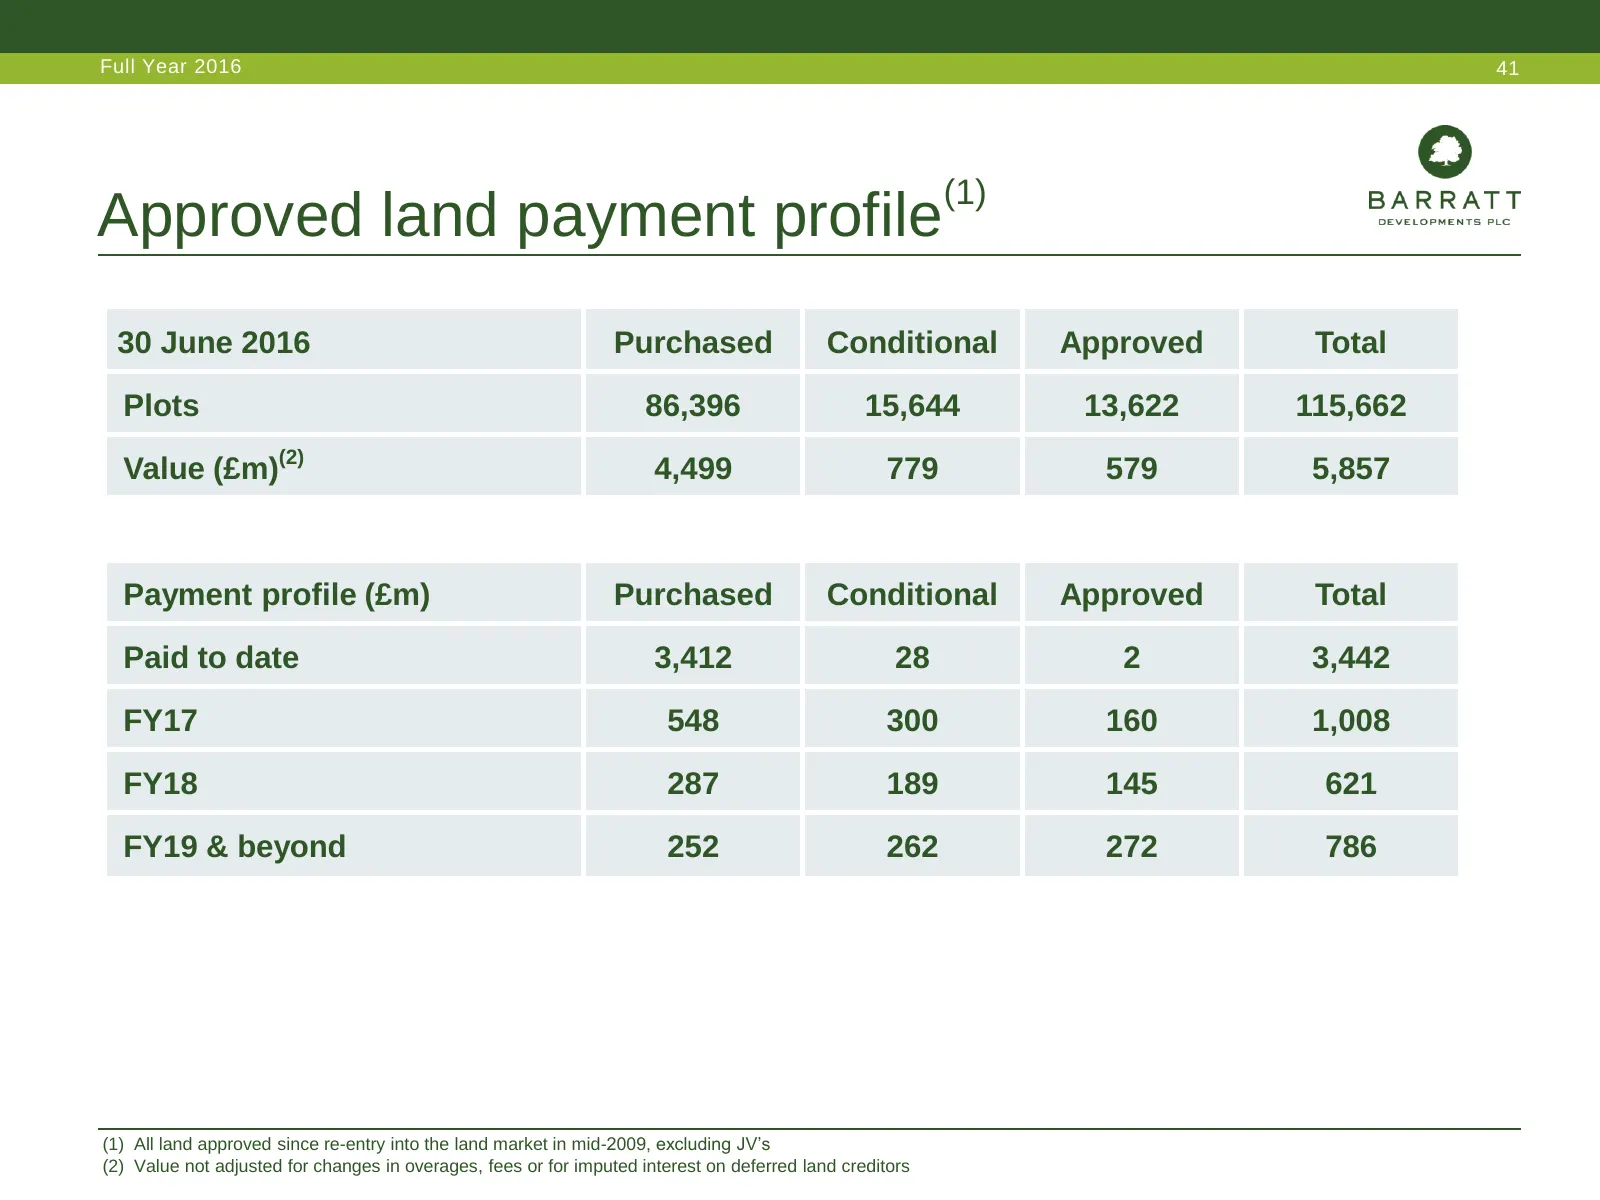
Full Year 2016 41 (1) Approved land payment profile 30 June 2016 Purchased Conditional Approved Total Plots 86,396 15,644 13,622 115,662 Value (£m)(2) 4,499 779 579 5,857 Payment profile (£m) Purchased Conditional Approved Total Paid to date 3,412 28 2 3,442 FY17 548 300 160 1,008 FY18 287 189 145 6
Slide 42: Balance sheet – stock & WIP
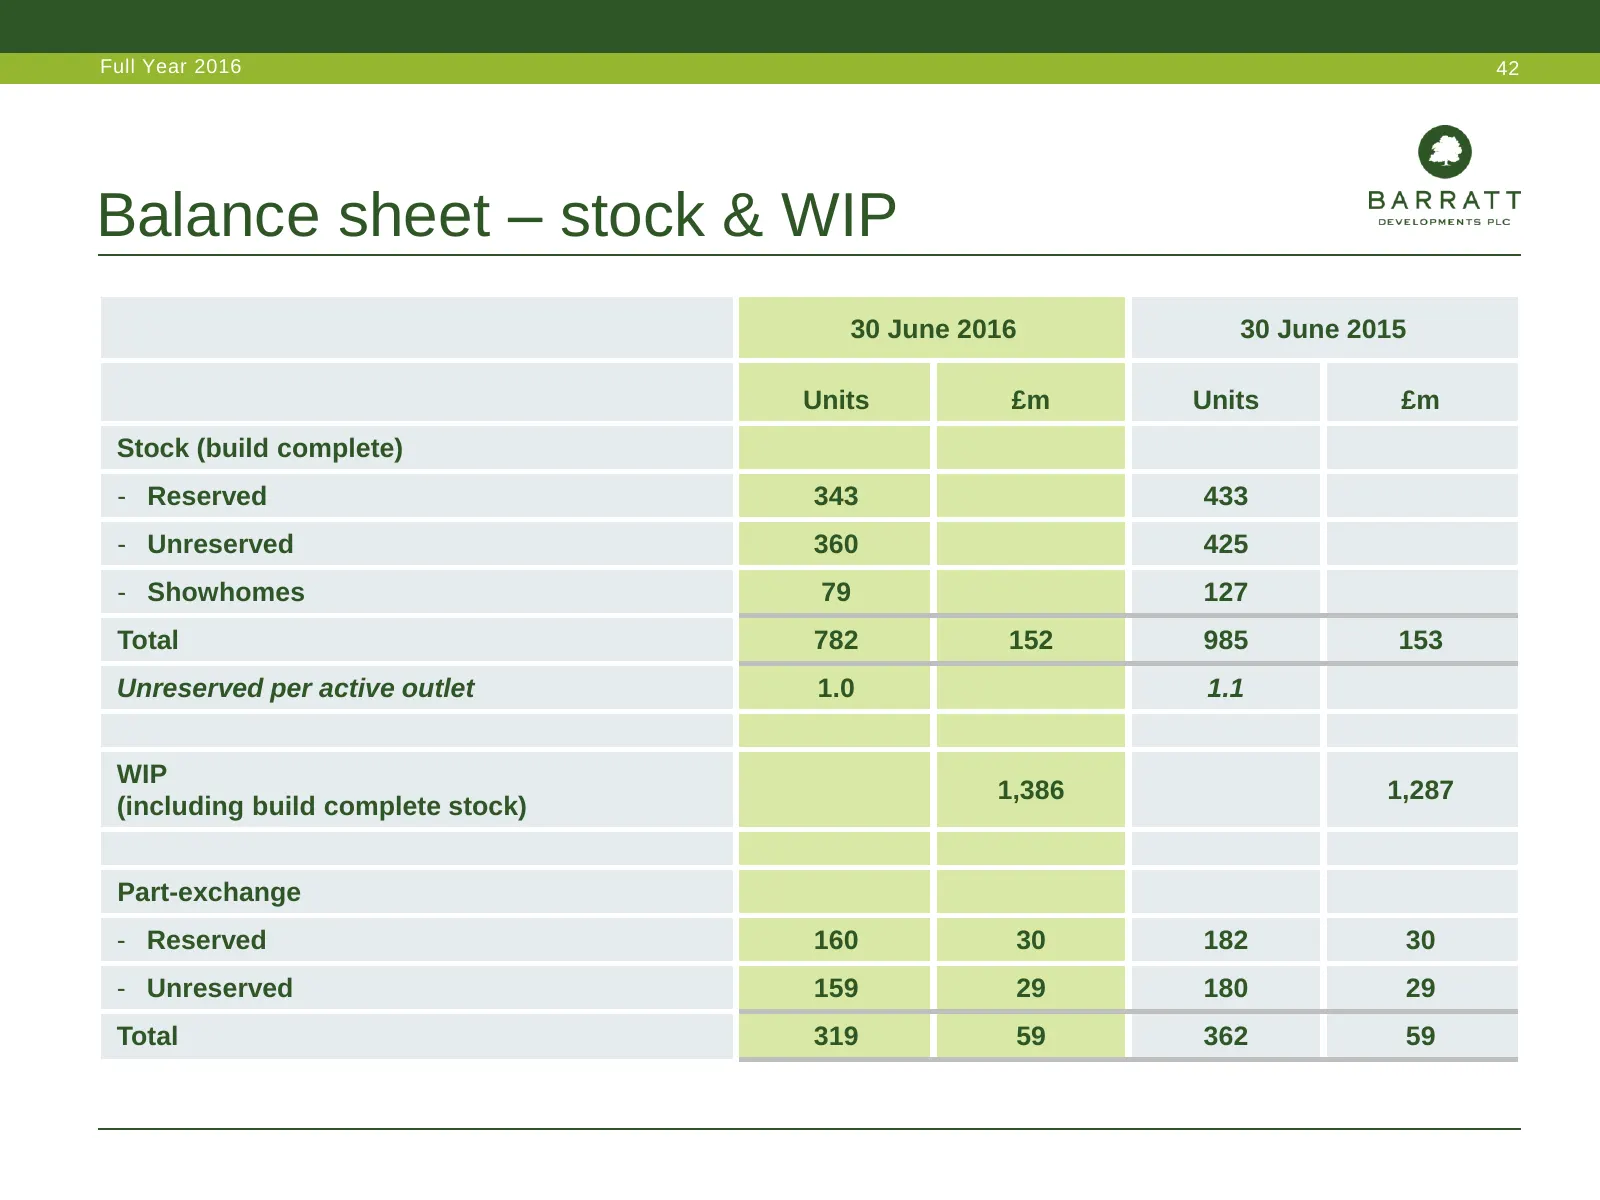
Full Year 2016 42 Balance sheet – stock & WIP 30 June 2016 30 June 2015 Units £m Units £m Stock (build complete) - Reserved 343 433 - Unreserved 360 425 - Showhomes 79 127 Total 782 152 985 153 Unreserved per active outlet 1.0 1.1 WIP 1,386 1,287 (including build complete stock) Part-exchange - Rese
Slide 43: Investment in joint ventures and associates
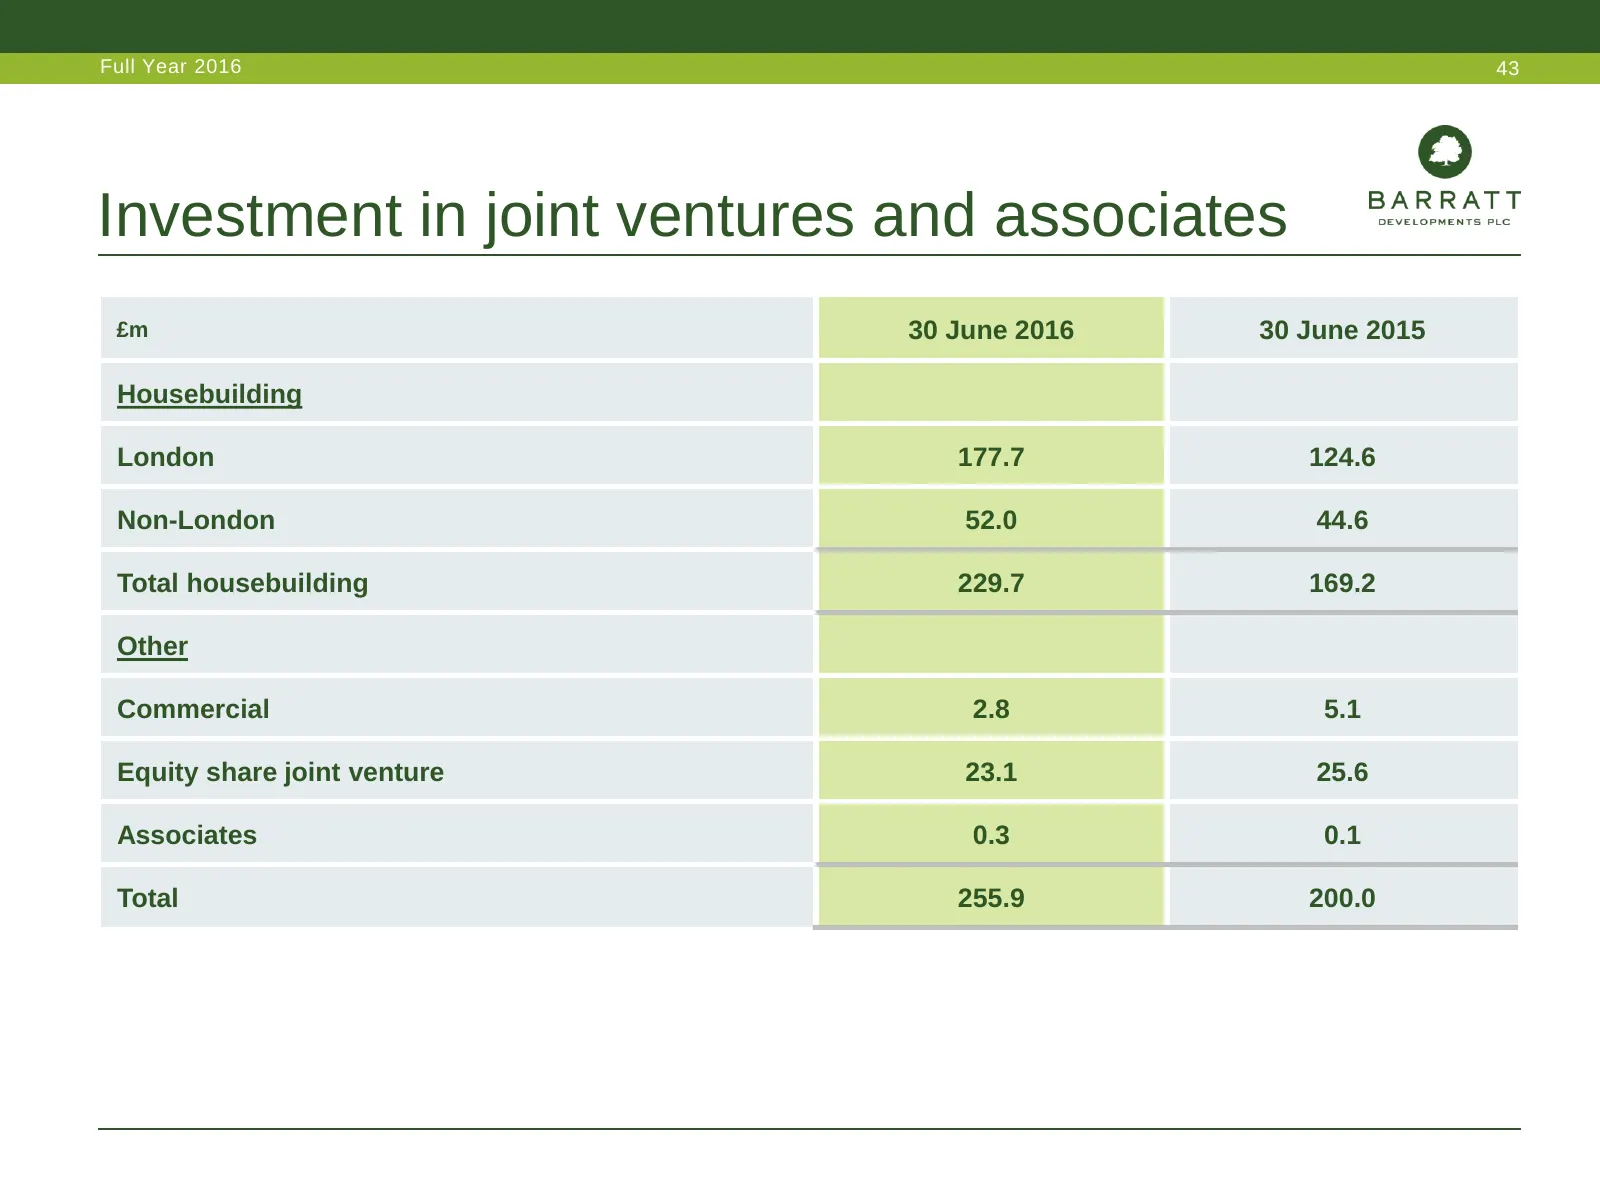
Full Year 2016 43 Investment in joint ventures and associates £m 30 June 2016 30 June 2015 Housebuilding London 177.7 124.6 Non-London 52.0 44.6 Total housebuilding 229.7 169.2 Other Commercial 2.8 5.1 Equity share joint venture 23.1 25.6 Associates 0.3 0.1 Total 255.9 200.0
Slide 44: Net interest charge analysis
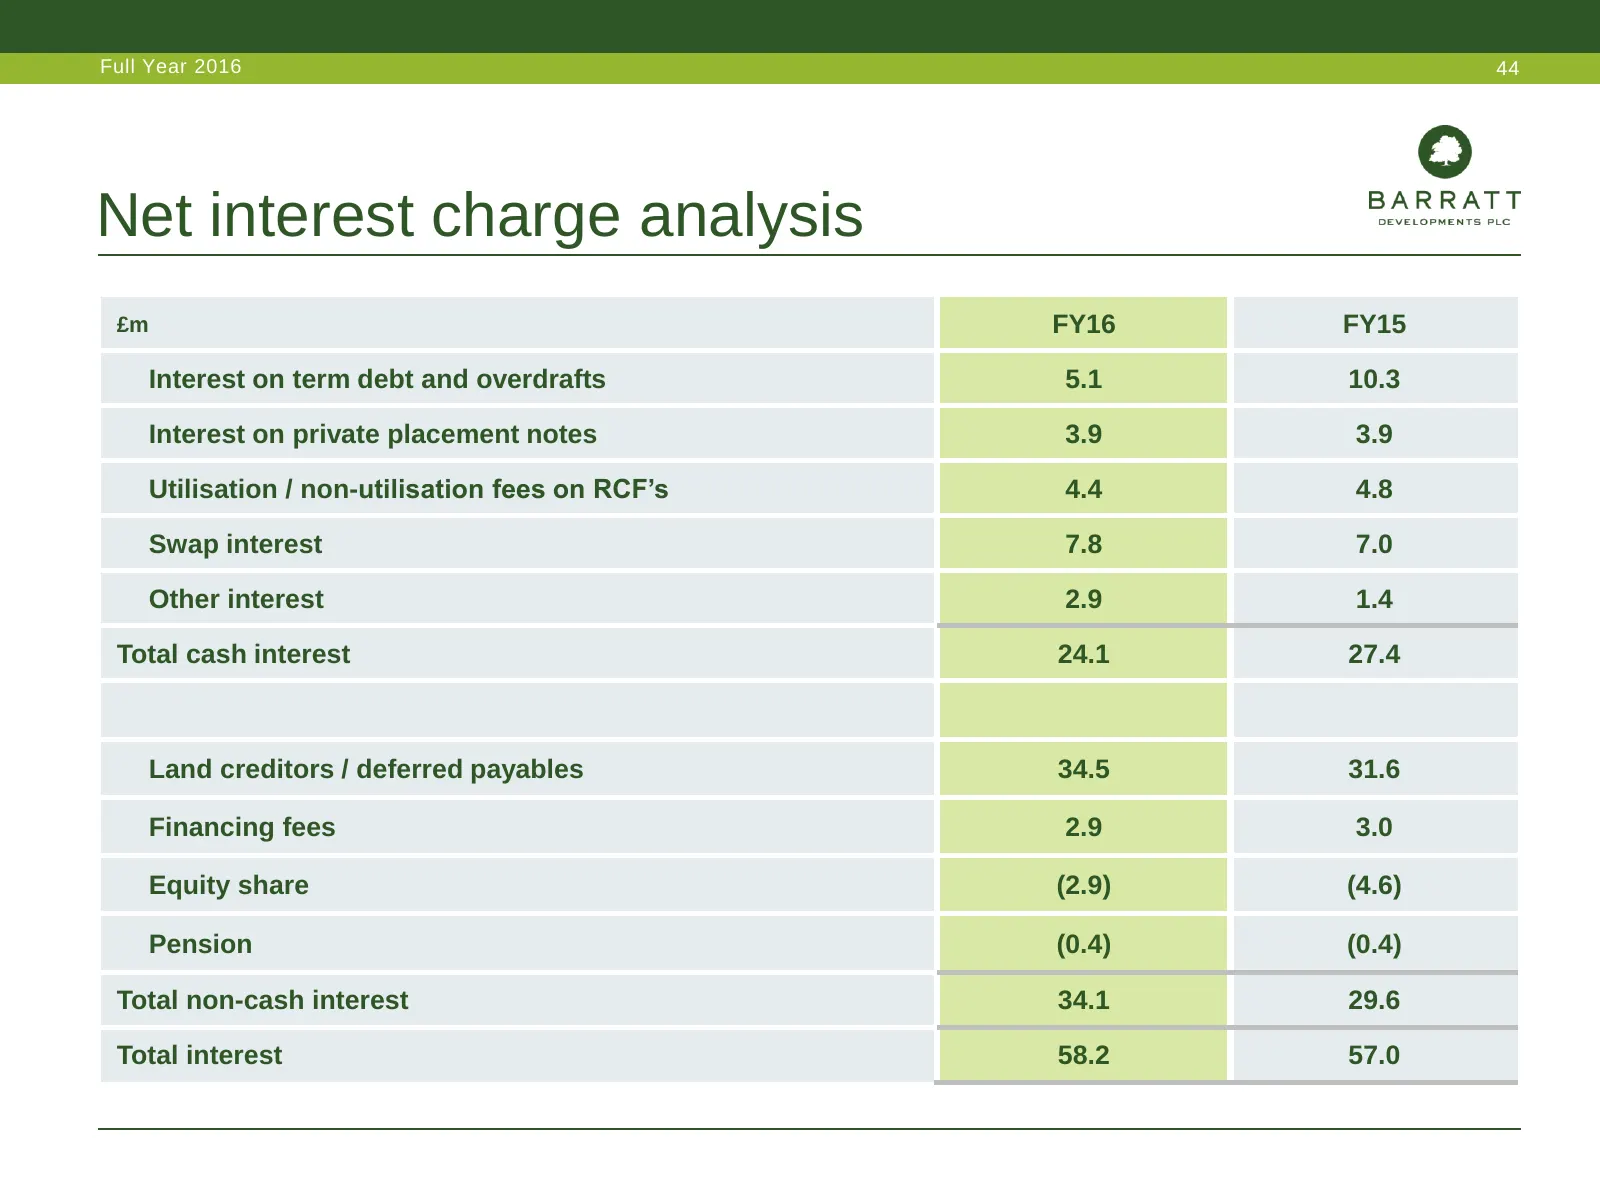
Full Year 2016 44 Net interest charge analysis £m FY16 FY15 Interest on term debt and overdrafts 5.1 10.3 Interest on private placement notes 3.9 3.9 Utilisation / non-utilisation fees on RCF’s 4.4 4.8 Swap interest 7.8 7.0 Other interest 2.9 1.4 Total cash interest 24.1 27.4 Land creditors / deferr
Slide 45: Financing arrangements
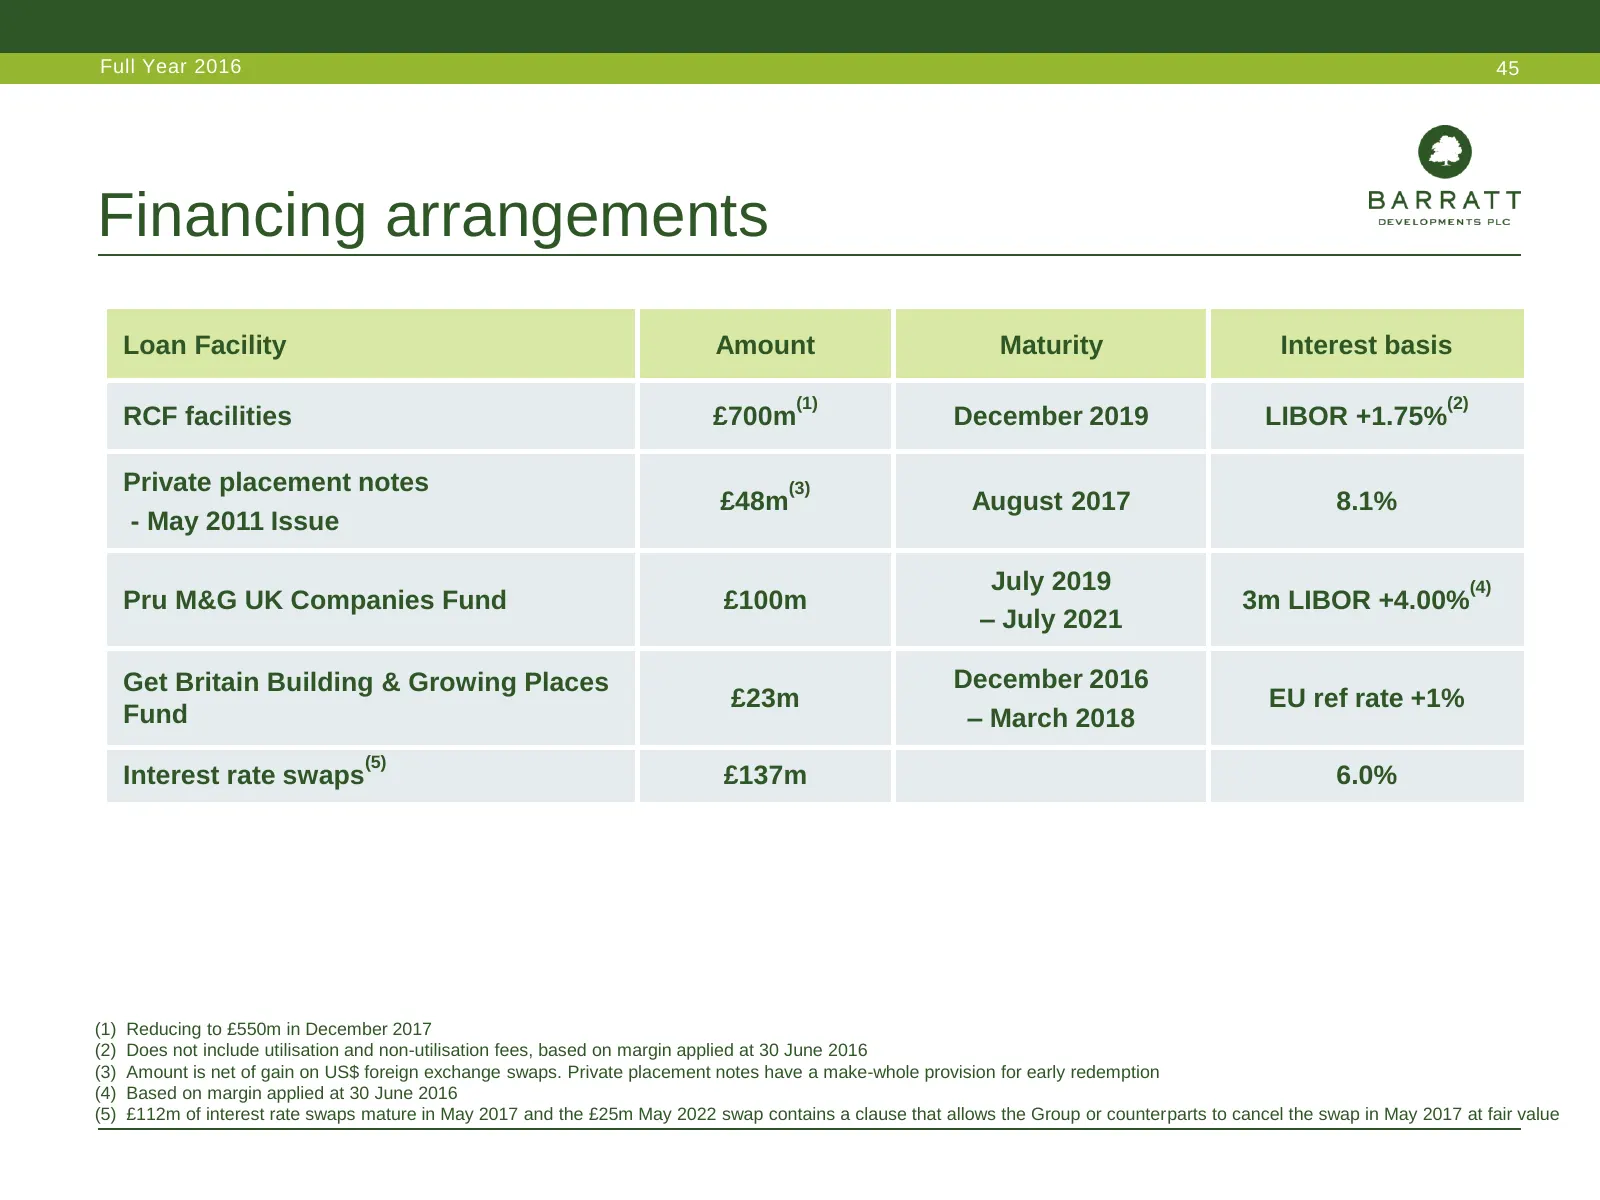
Full Year 2016 45 Financing arrangements Loan Facility Amount Maturity Interest basis (1) (2) RCF facilities £700m December 2019 LIBOR +1.75% Private placement notes (3) £48m August 2017 8.1% - May 2011 Issue July 2019 (4) Pru M&G UK Companies Fund £100m 3m LIBOR +4.00% – July 2021 Get Britain Build
Slide 46: Tax
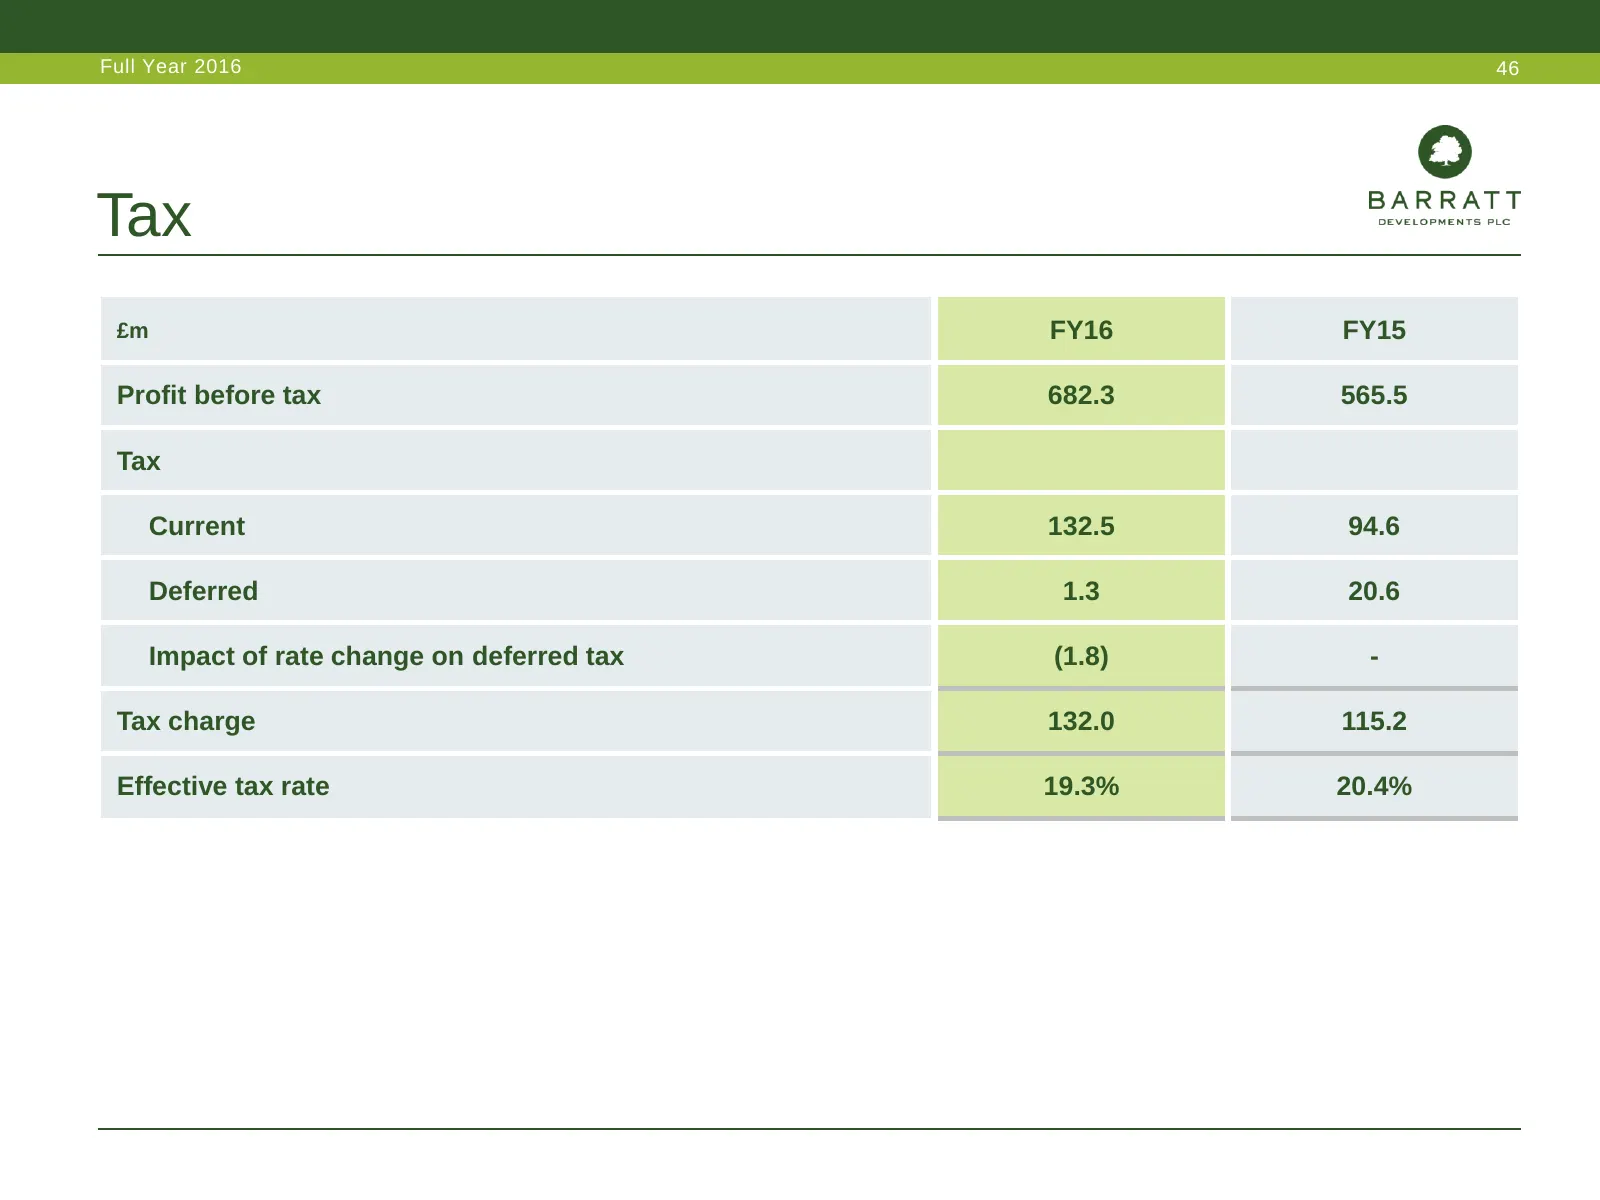
Full Year 2016 46 Tax £m FY16 FY15 Profit before tax 682.3 565.5 Tax Current 132.5 94.6 Deferred 1.3 20.6 Impact of rate change on deferred tax (1.8) - Tax charge 132.0 115.2 Effective tax rate 19.3% 20.4%
Slide 47: Forward sales position
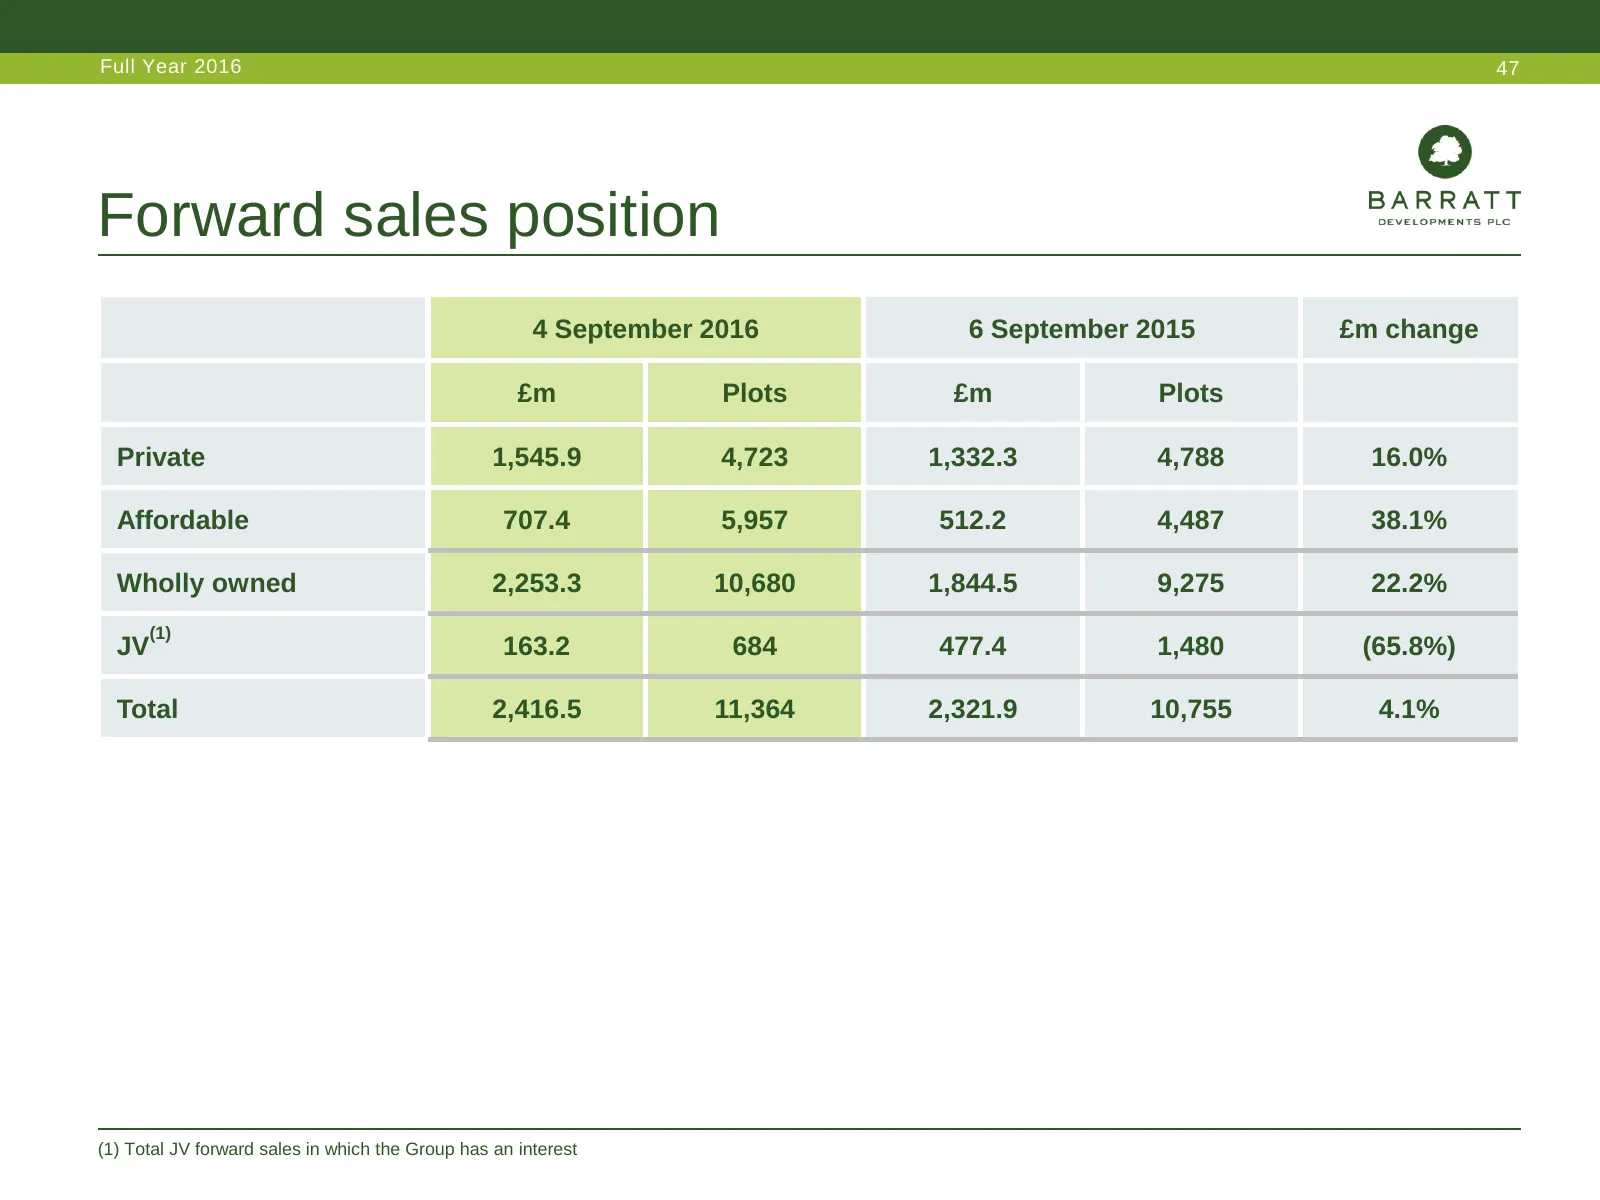
Full Year 2016 47 Forward sales position 4 September 2016 6 September 2015 £m change £m Plots £m Plots Private 1,545.9 4,723 1,332.3 4,788 16.0% Affordable 707.4 5,957 512.2 4,487 38.1% Wholly owned 2,253.3 10,680 1,844.5 9,275 22.2% (1) JV 163.2 684 477.4 1,480 (65.8%) Total 2,416.5 11,364 2,321.9
Slide 48: Disclaimer
Full Year 2016 48 Disclaimer This document has been prepared by Barratt Developments PLC (the “Company”) solely for use at a presentation in connection with the Company's Full Year Results Announcement in respect of the year ended 30 June 2016. For the purposes of this notice, the presentation (the
Source: Internet Archive copy of barrattdevelopments.co.uk
More decks from Barratt Redrow plc
 FY2026 Earnings Presentation59 slides · Sep 16, 2026
 HY26 Earnings Presentation59 slides · Feb 11, 2026
 FY2025 Earnings Presentation60 slides · Sep 17, 2025
 Corporate Update (May 2025)30 slides · May 1, 2025
 Investor Day (February 2025)40 slides · Feb 12, 2025
 HY25 Earnings Presentation51 slides · Feb 12, 2025