The Dow Chemical — Q1 2014 Earnings Presentation
40 slides from The Dow Chemical's earnings presentation, Apr 23, 2014
Slide 1: 1Q 2014 Earnings Conference Call
The Dow Chemical Company 1Q 2014 Earnings Conference Call April 23, 2014 The Dow Chemical Company
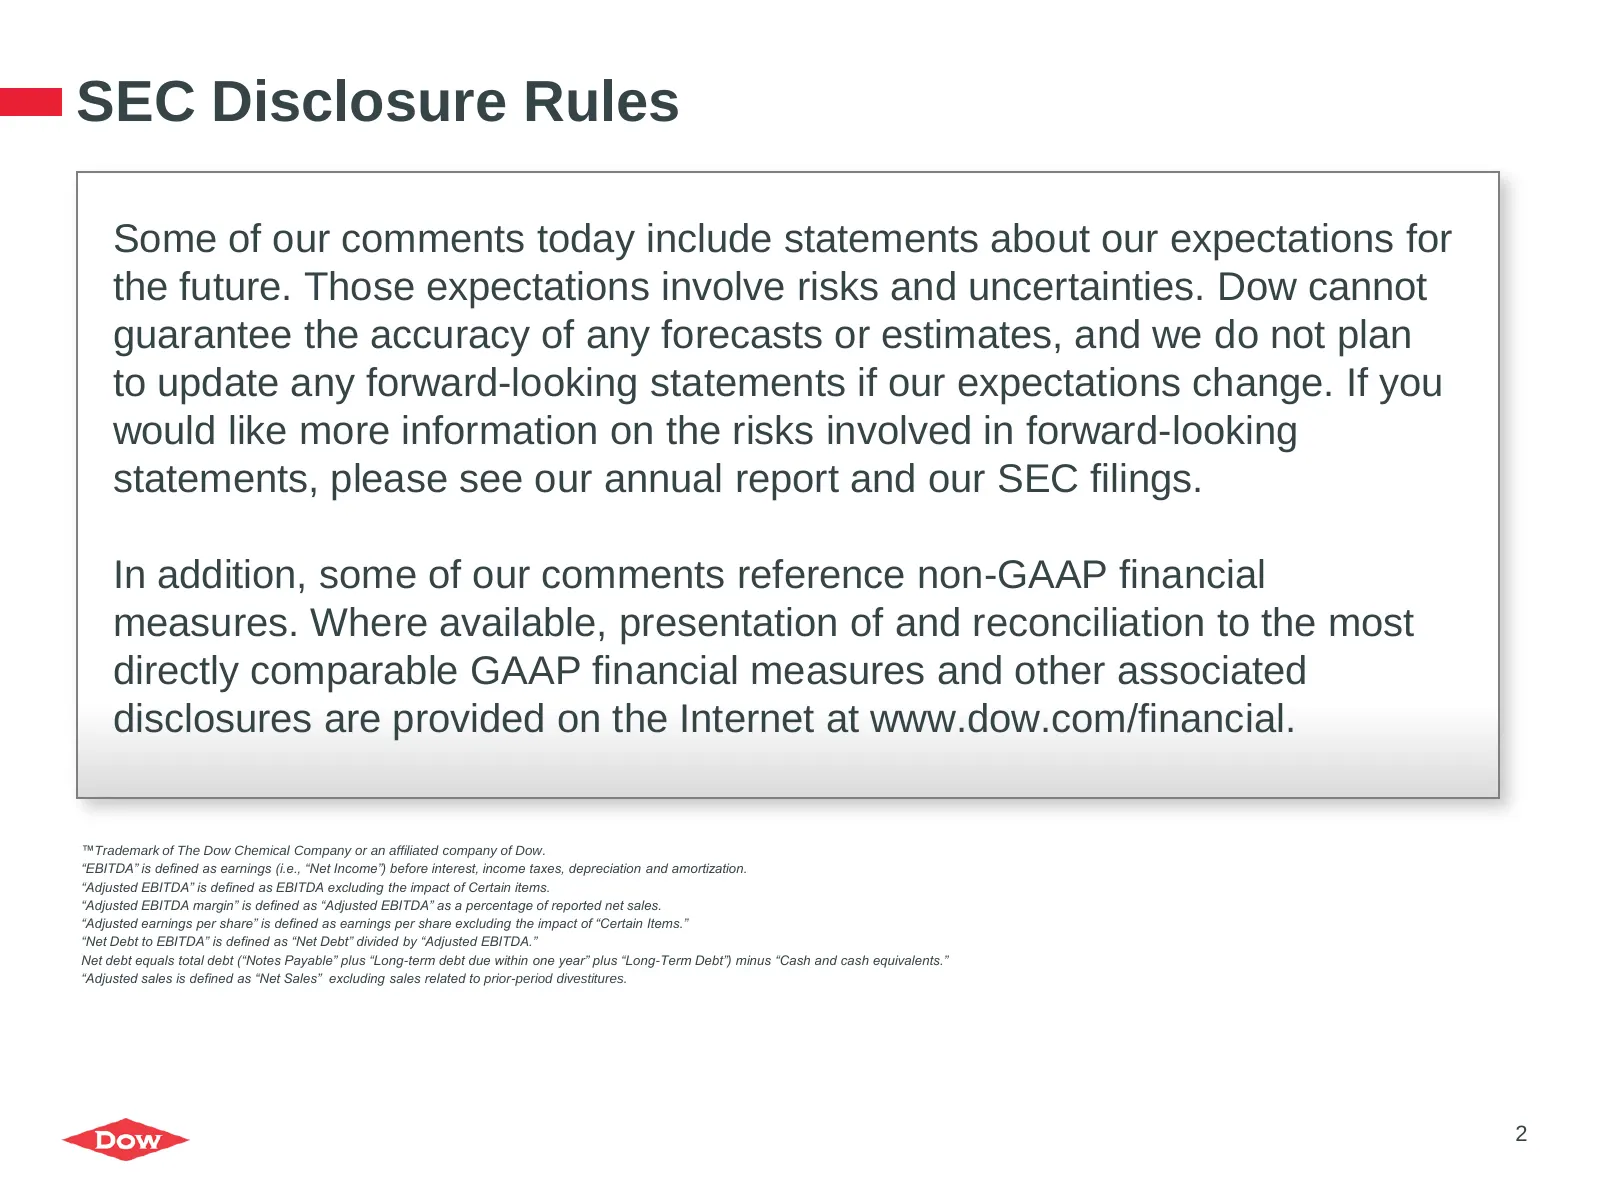
Slide 2: SEC Disclosure Rules
SEC Disclosure Rules Some of our comments today include statements about our expectations for the future. Those expectations involve risks and uncertainties. Dow cannot guarantee the accuracy of any forecasts or estimates, and we do not plan to update any forward-looking statements if our expectatio
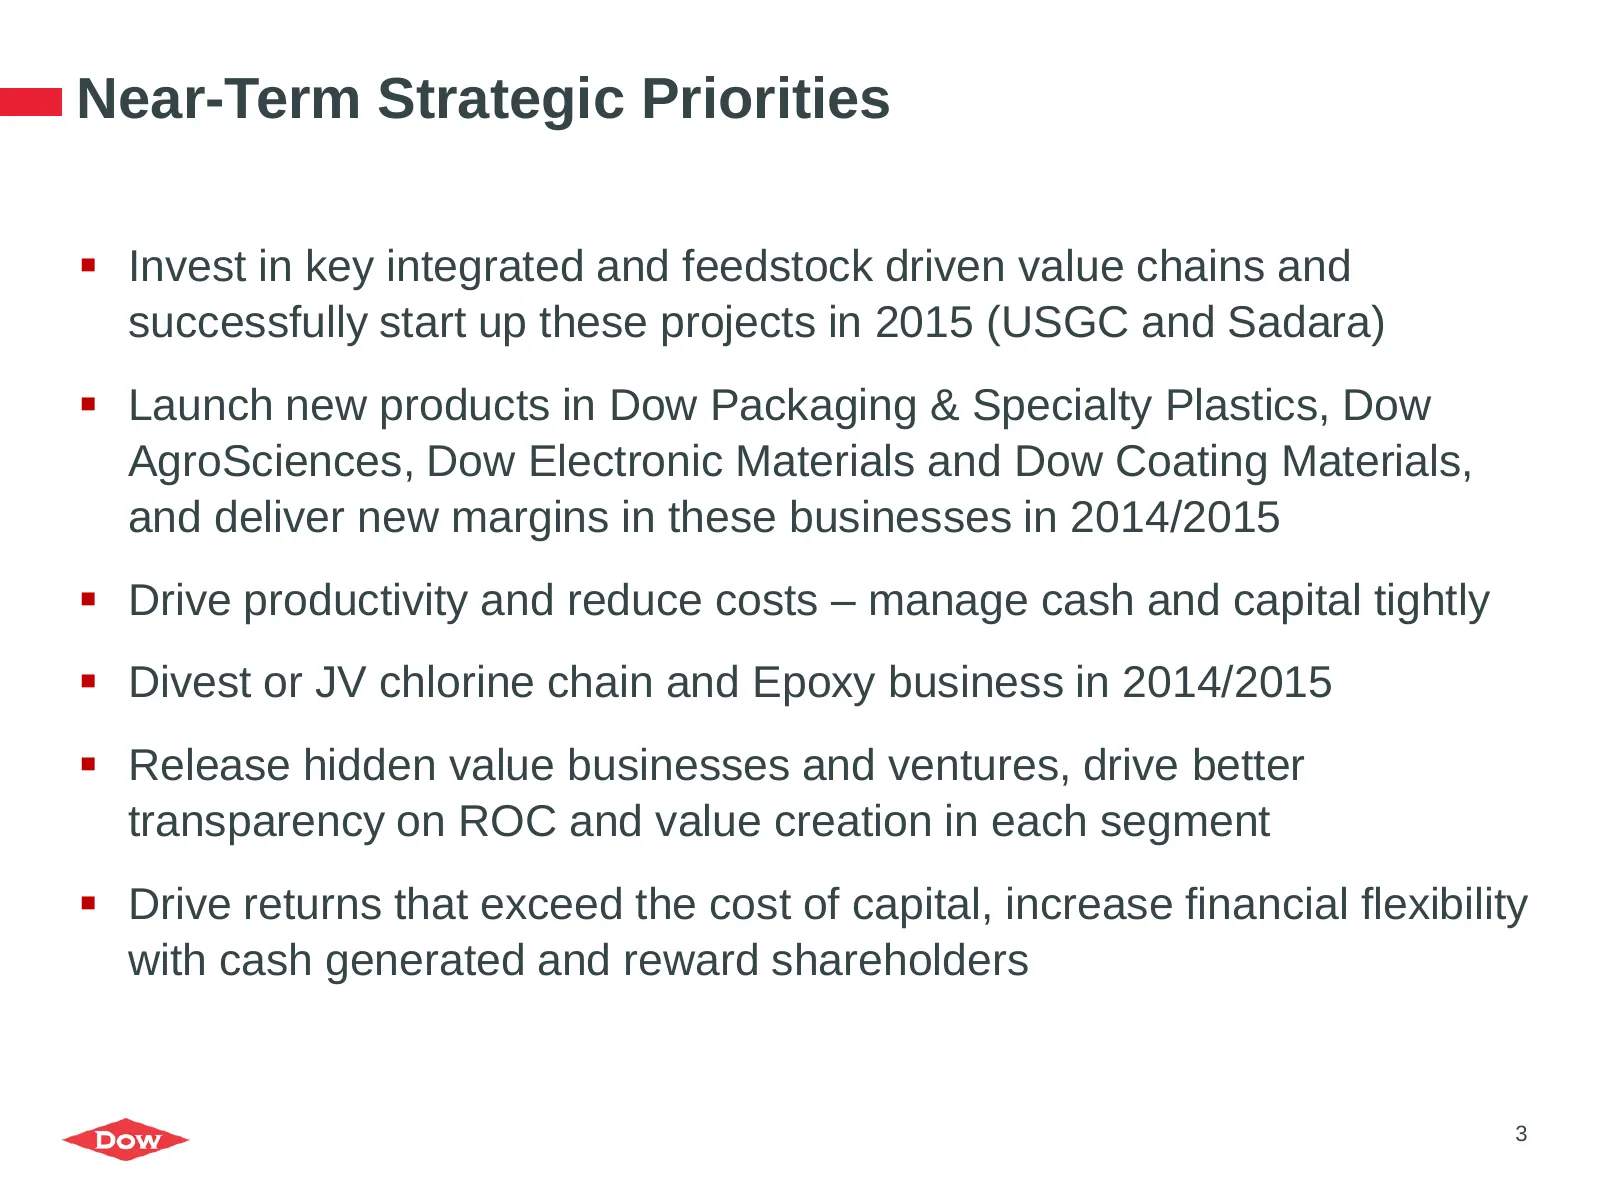
Slide 3: Near-Term Strategic Priorities
Near-Term Strategic Priorities Invest in key integrated and feedstock driven value chains and successfully start up these projects in 2015 (USGC and Sadara) Launch new products in Dow Packaging & Specialty Plastics, Dow AgroSciences, Dow Electronic Materials and Dow Coating Materials, and delive
Slide 4: Agenda
Agenda 1Q 2014 Overview & Financial Update Segment Overview & Market Trends Driving Near-Term Shareholder Value 4
Slide 5: Dow Delivers Earnings Growth and Margin Expansion
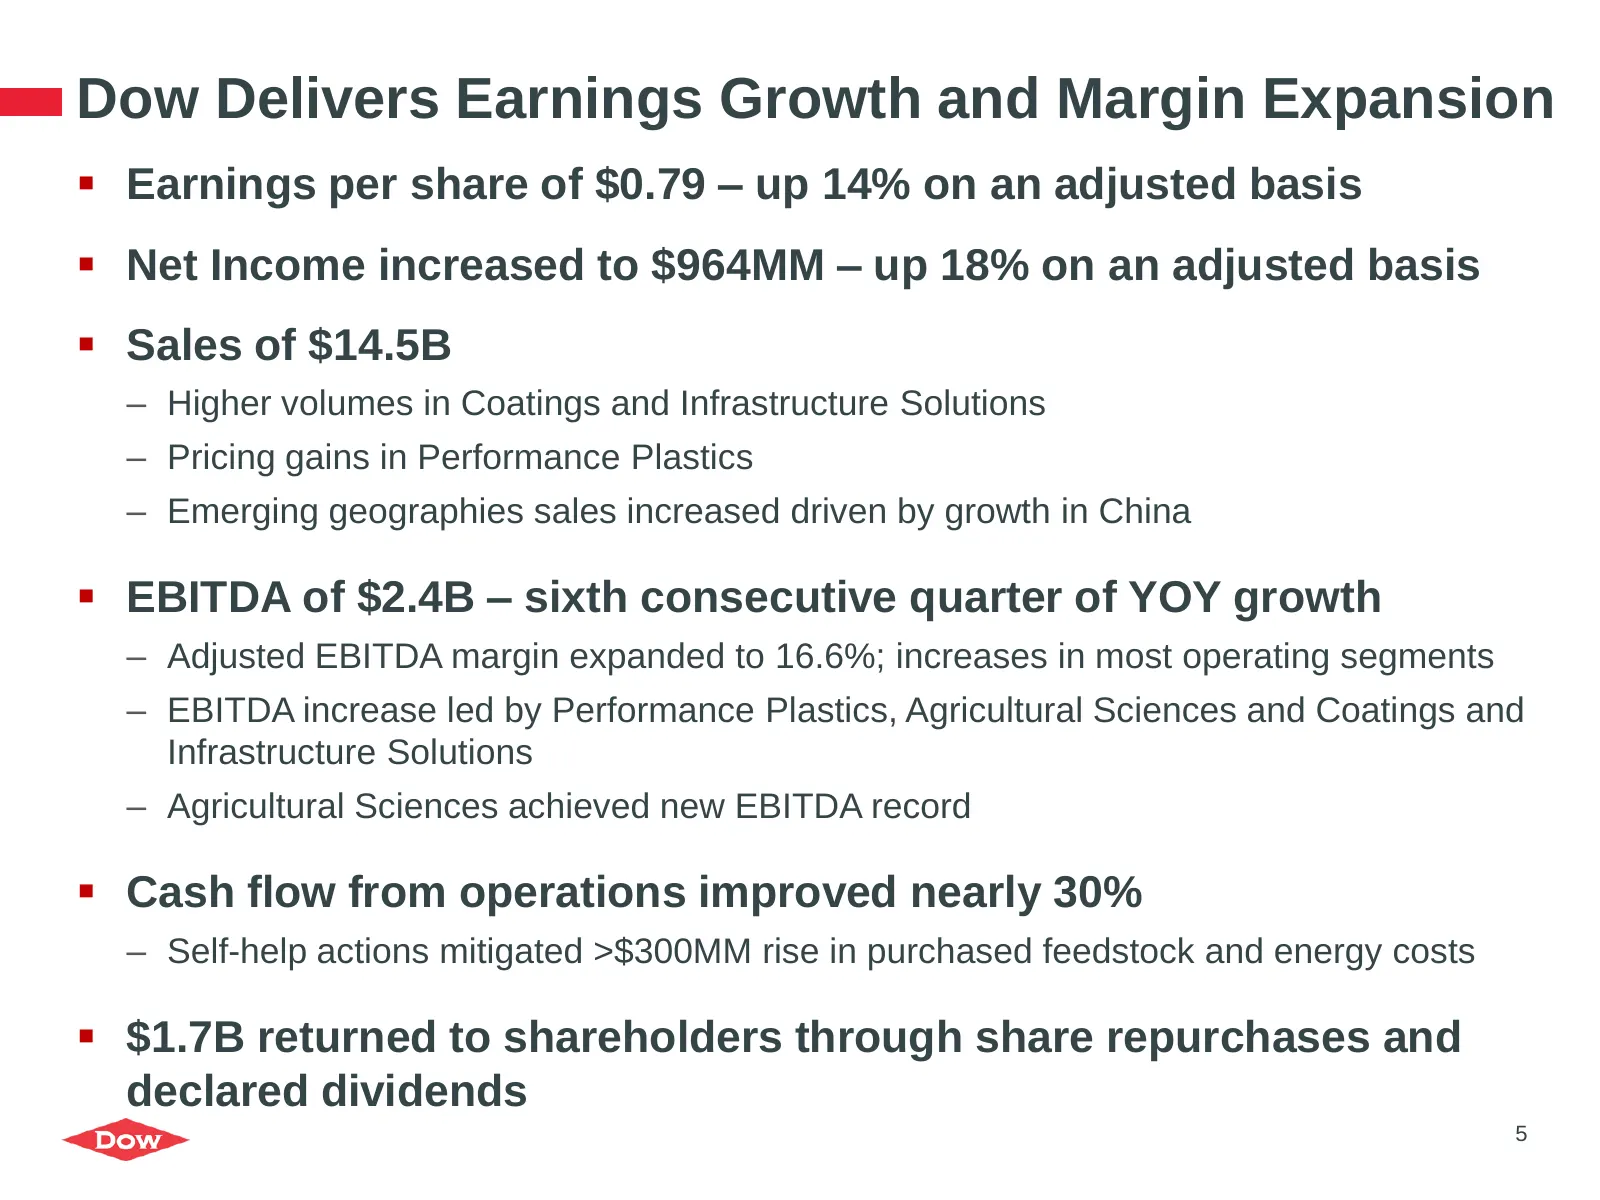
Dow Delivers Earnings Growth and Margin Expansion Earnings per share of $0.79 – up 14% on an adjusted basis Net Income increased to $964MM – up 18% on an adjusted basis Sales of $14.5B – Higher volumes in Coatings and Infrastructure Solutions – Pricing gains in Performance Plastics – Emerging
Slide 6: Drivers of 1Q14 Financial Performance
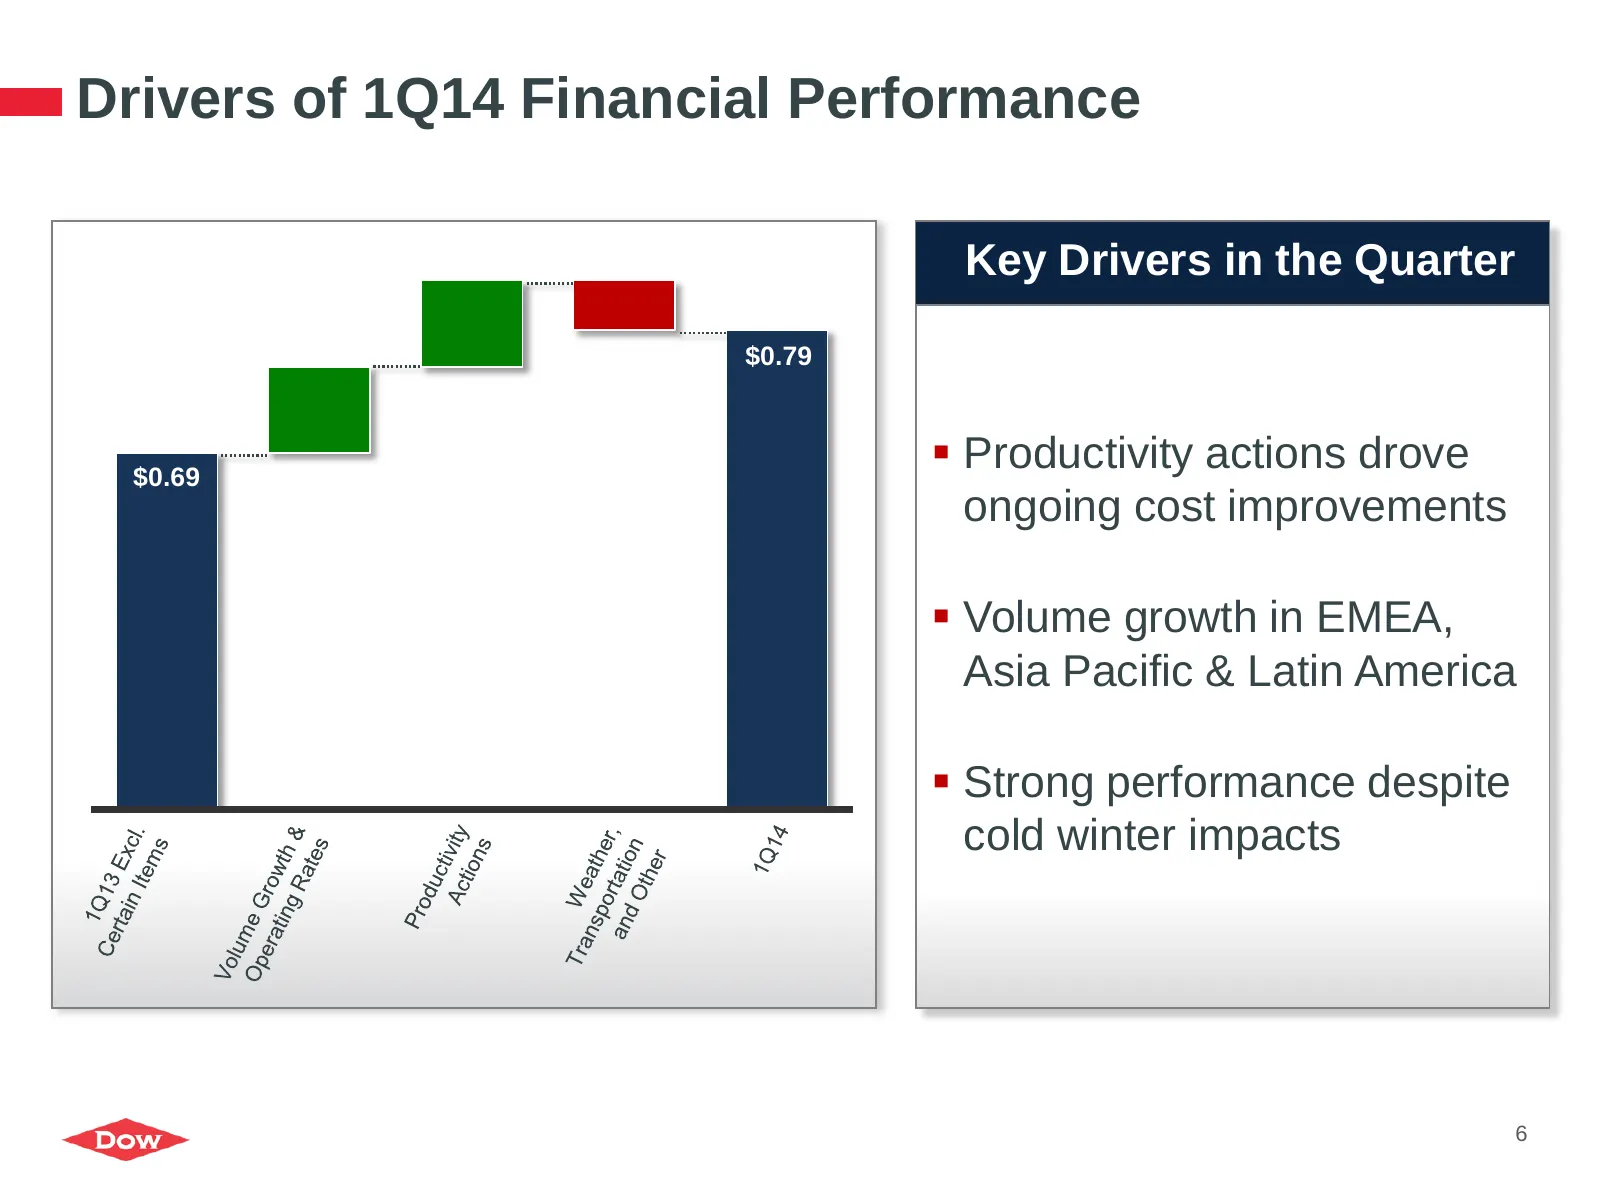
Drivers of 1Q14 Financial Performance Key Drivers in the Quarter $0.79 $0.69 Productivity actions drove ongoing cost improvements Volume growth in EMEA, Asia Pacific & Latin America Strong performance despite cold winter impacts 6
Slide 7: Agenda
Agenda 1Q 2014 Overview & Financial Update Segment Overview & Market Trends Driving Near-Term Shareholder Value 7
Slide 8: Electronic & Functional Materials Market Trends and Near-Term Outlook
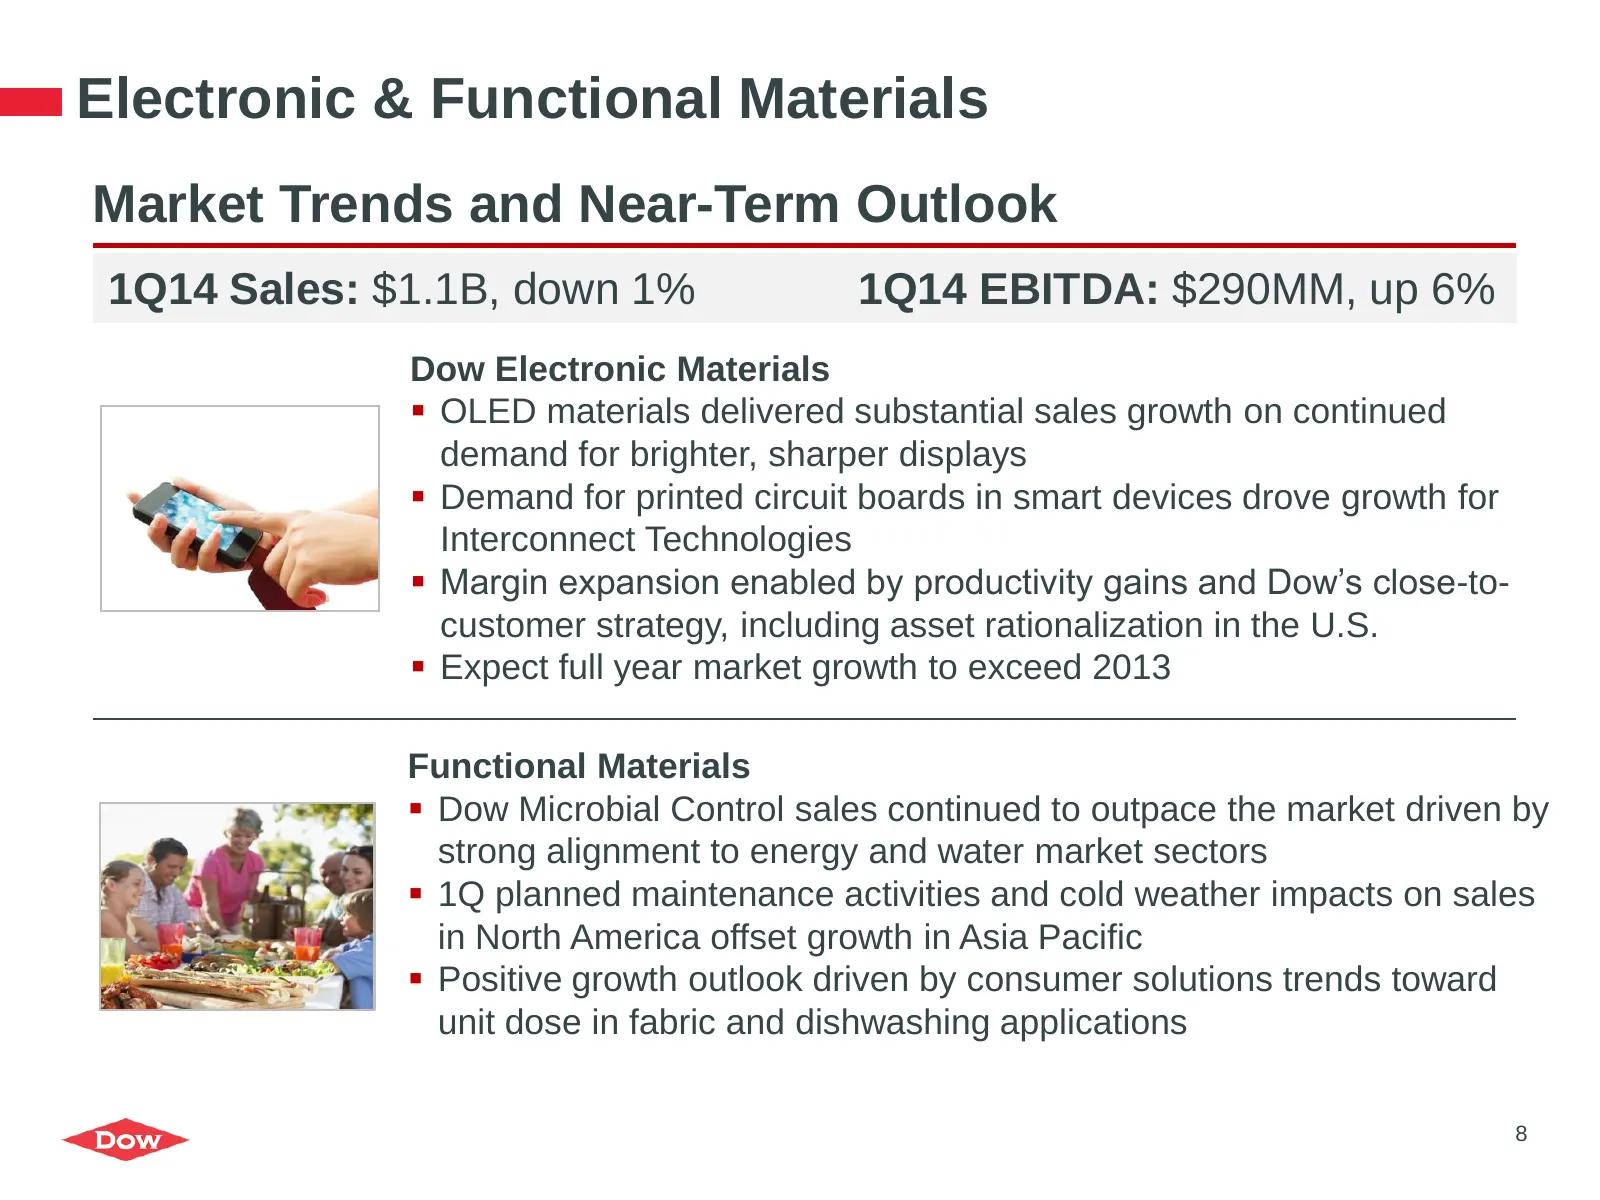
Electronic & Functional Materials Market Trends and Near-Term Outlook 1Q14 Sales: $1.1B, down 1% 1Q14 EBITDA: $290MM, up 6% Dow Electronic Materials OLED materials delivered substantial sales growth on continued demand for brighter, sharper displays Demand for printed circuit boards in smart dev
Slide 9: Coatings & Infrastructure Solutions Market Trends and Near-Term Outlook
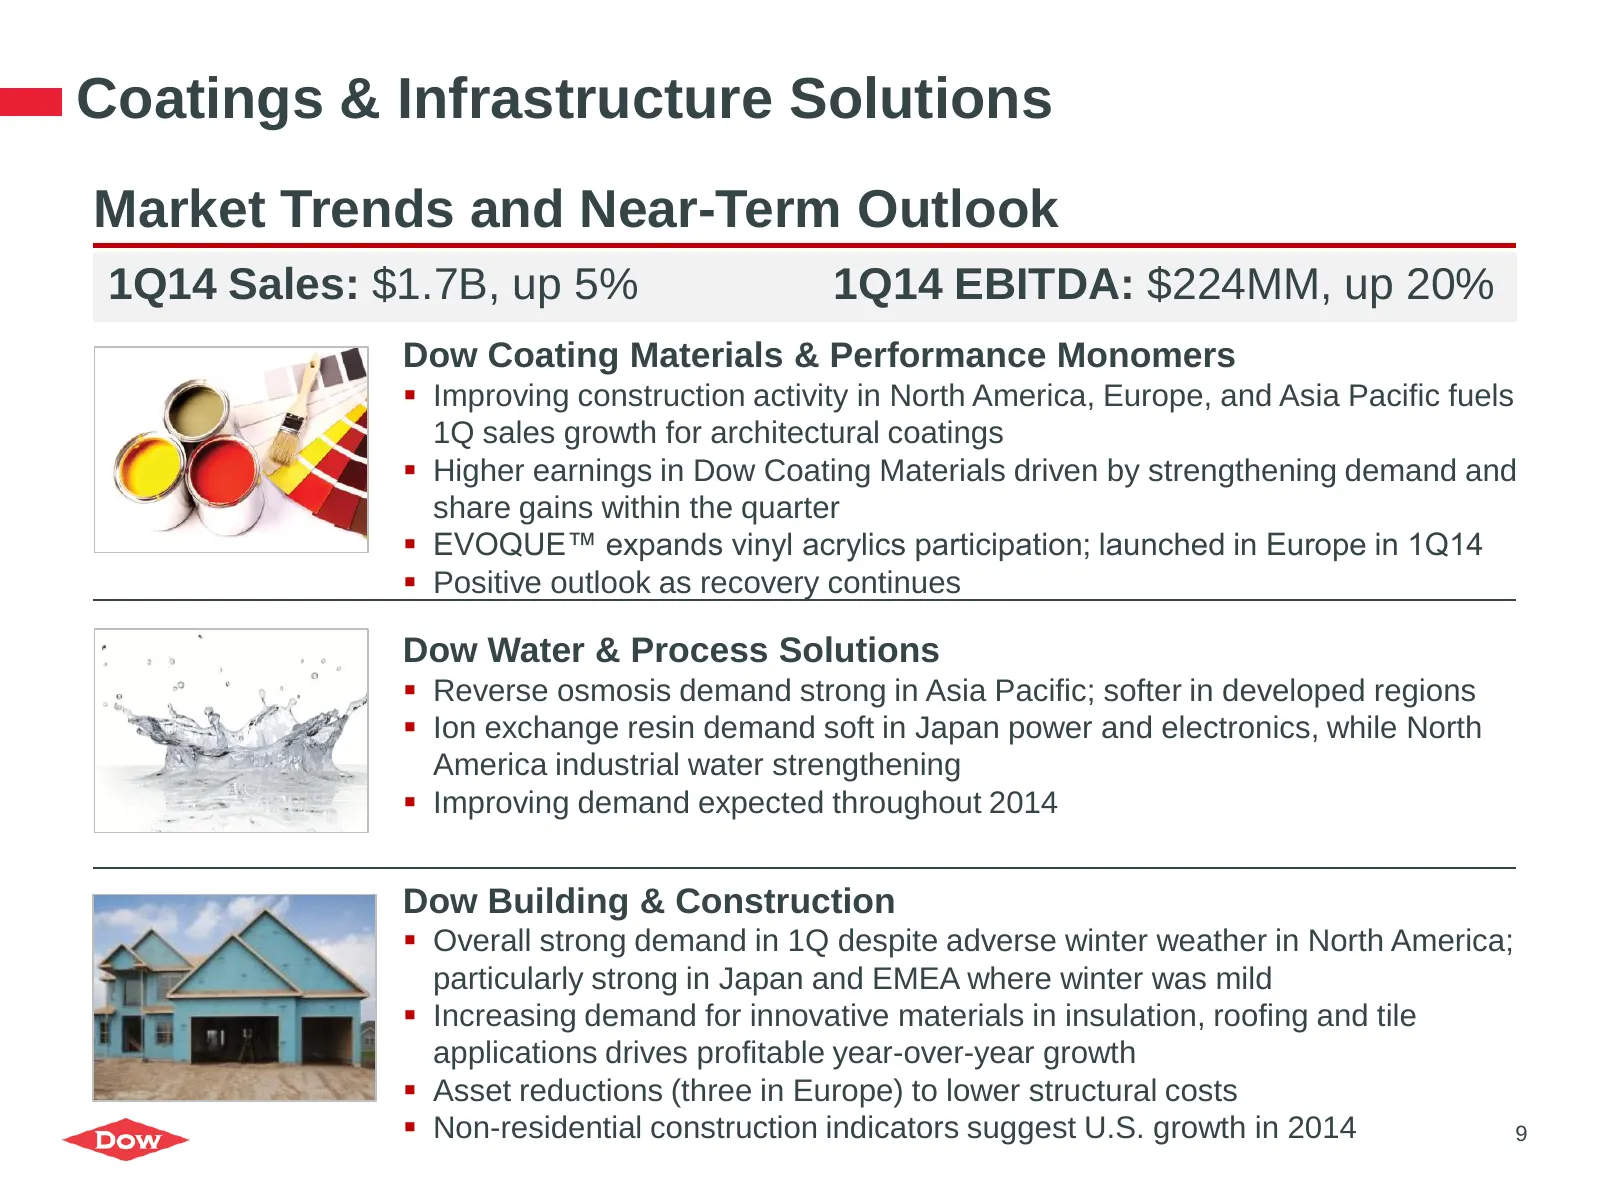
Coatings & Infrastructure Solutions Market Trends and Near-Term Outlook 1Q14 Sales: $1.7B, up 5% 1Q14 EBITDA: $224MM, up 20% Dow Coating Materials & Performance Monomers Improving construction activity in North America, Europe, and Asia Pacific fuels 1Q sales growth for architectural coatings Hi
Slide 10: Agricultural Sciences Market Trends and Near-Term Outlook
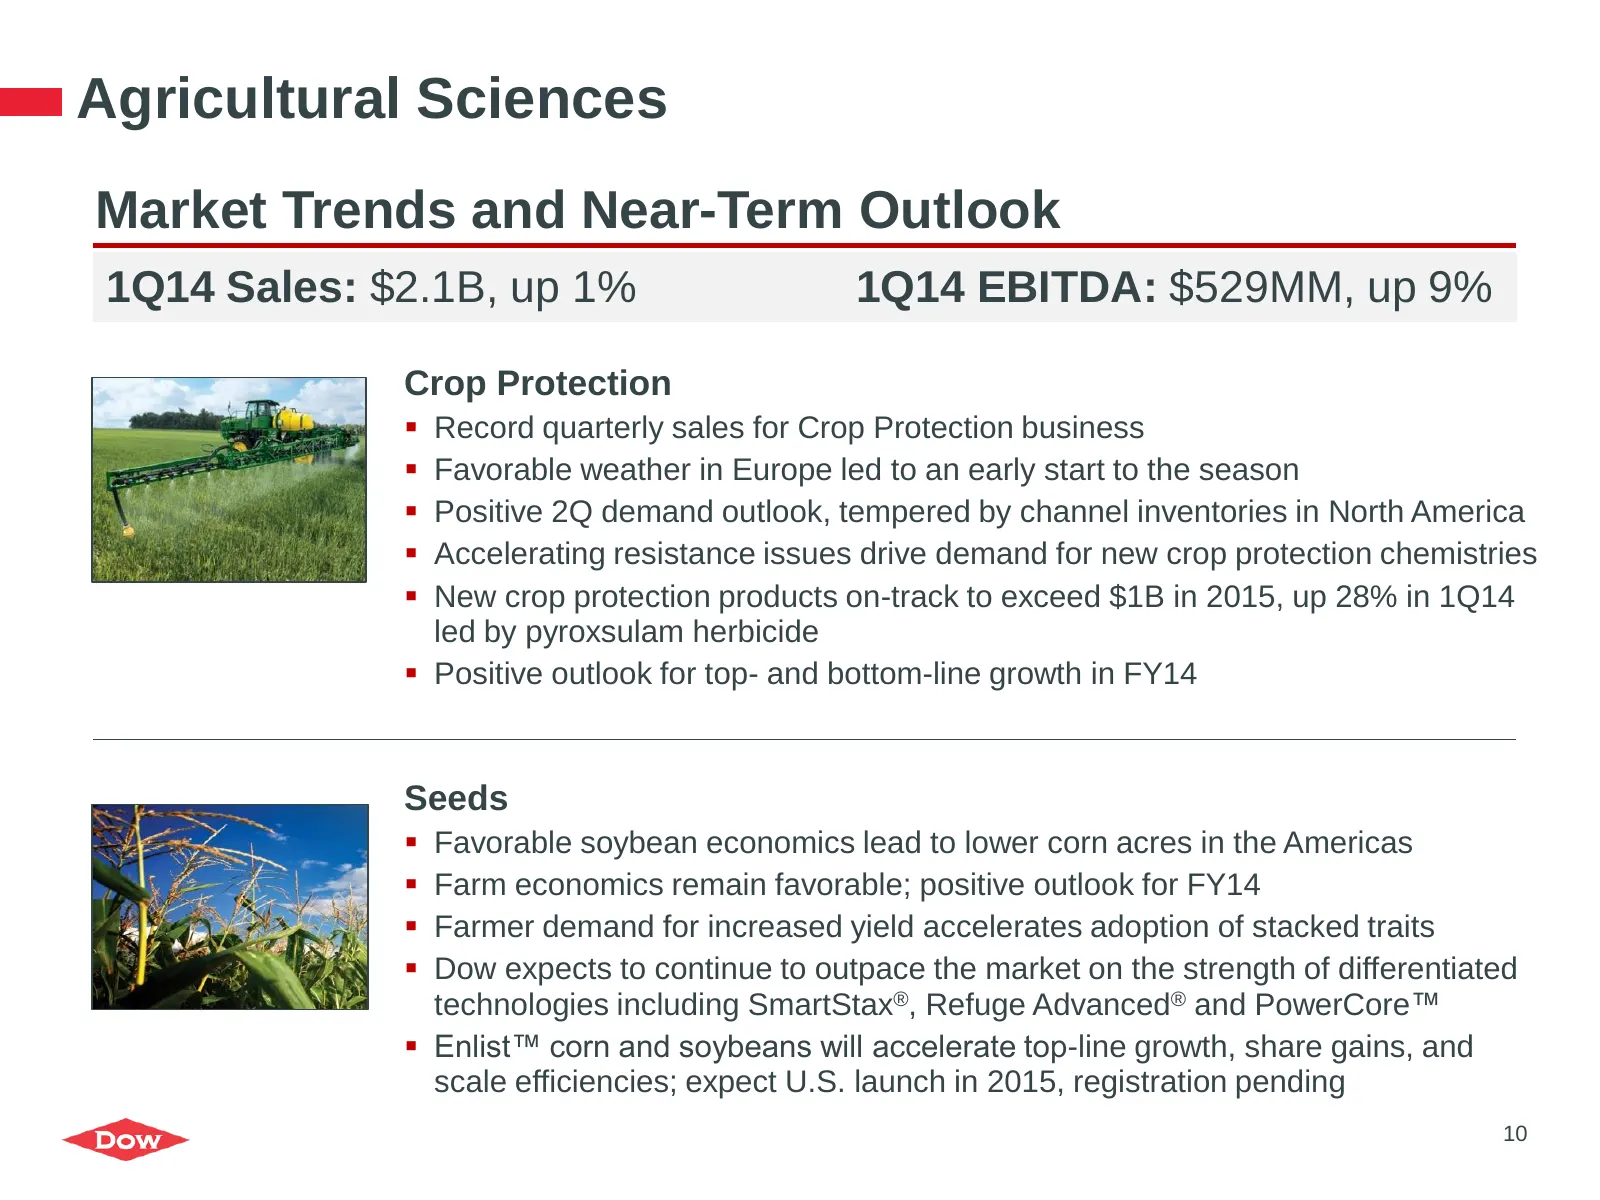
Agricultural Sciences Market Trends and Near-Term Outlook 1Q14 Sales: $2.1B, up 1% 1Q14 EBITDA: $529MM, up 9% Crop Protection Record quarterly sales for Crop Protection business Favorable weather in Europe led to an early start to the season Positive 2Q demand outlook, tempered by channel inve
Slide 11: Performance Materials Market Trends and Near-Term Outlook
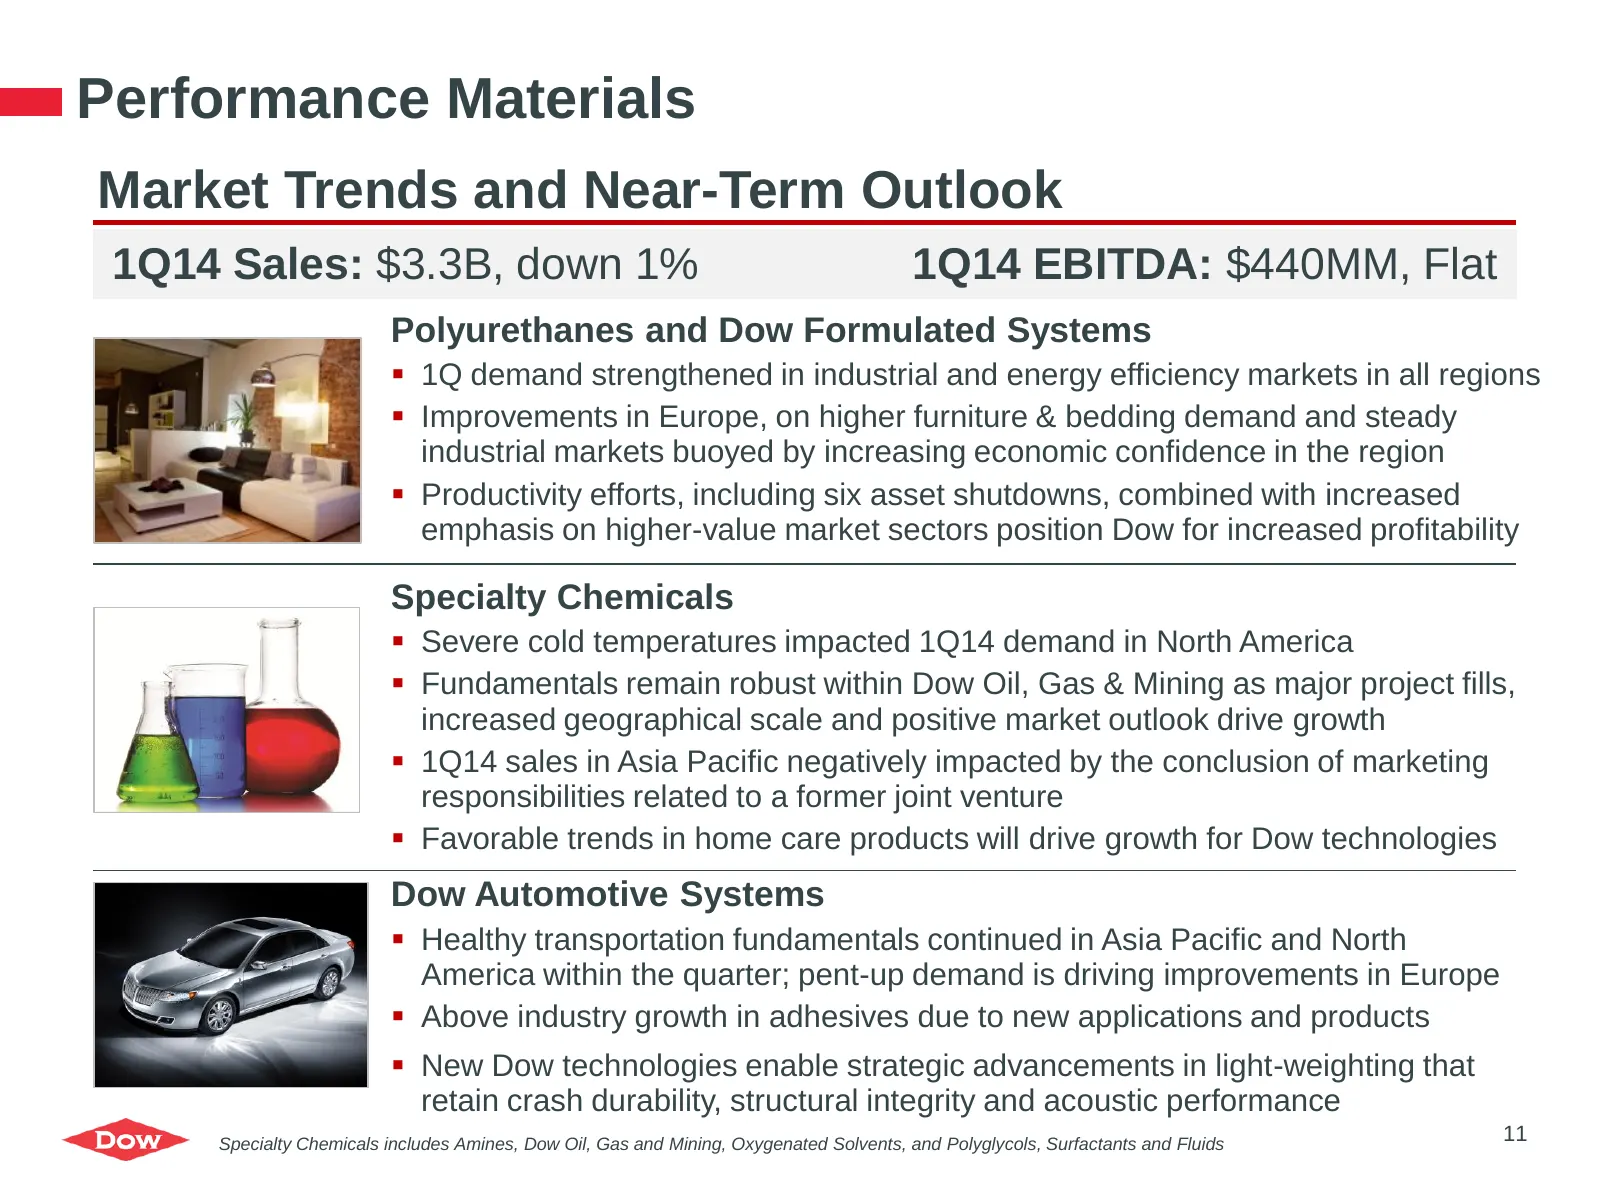
Performance Materials Market Trends and Near-Term Outlook 1Q14 Sales: $3.3B, down 1% 1Q14 EBITDA: $440MM, Flat Polyurethanes and Dow Formulated Systems 1Q demand strengthened in industrial and energy efficiency markets in all regions Improvements in Europe, on higher furniture & bedding demand a
Slide 12: Performance Plastics Market Trends and Near-Term Outlook
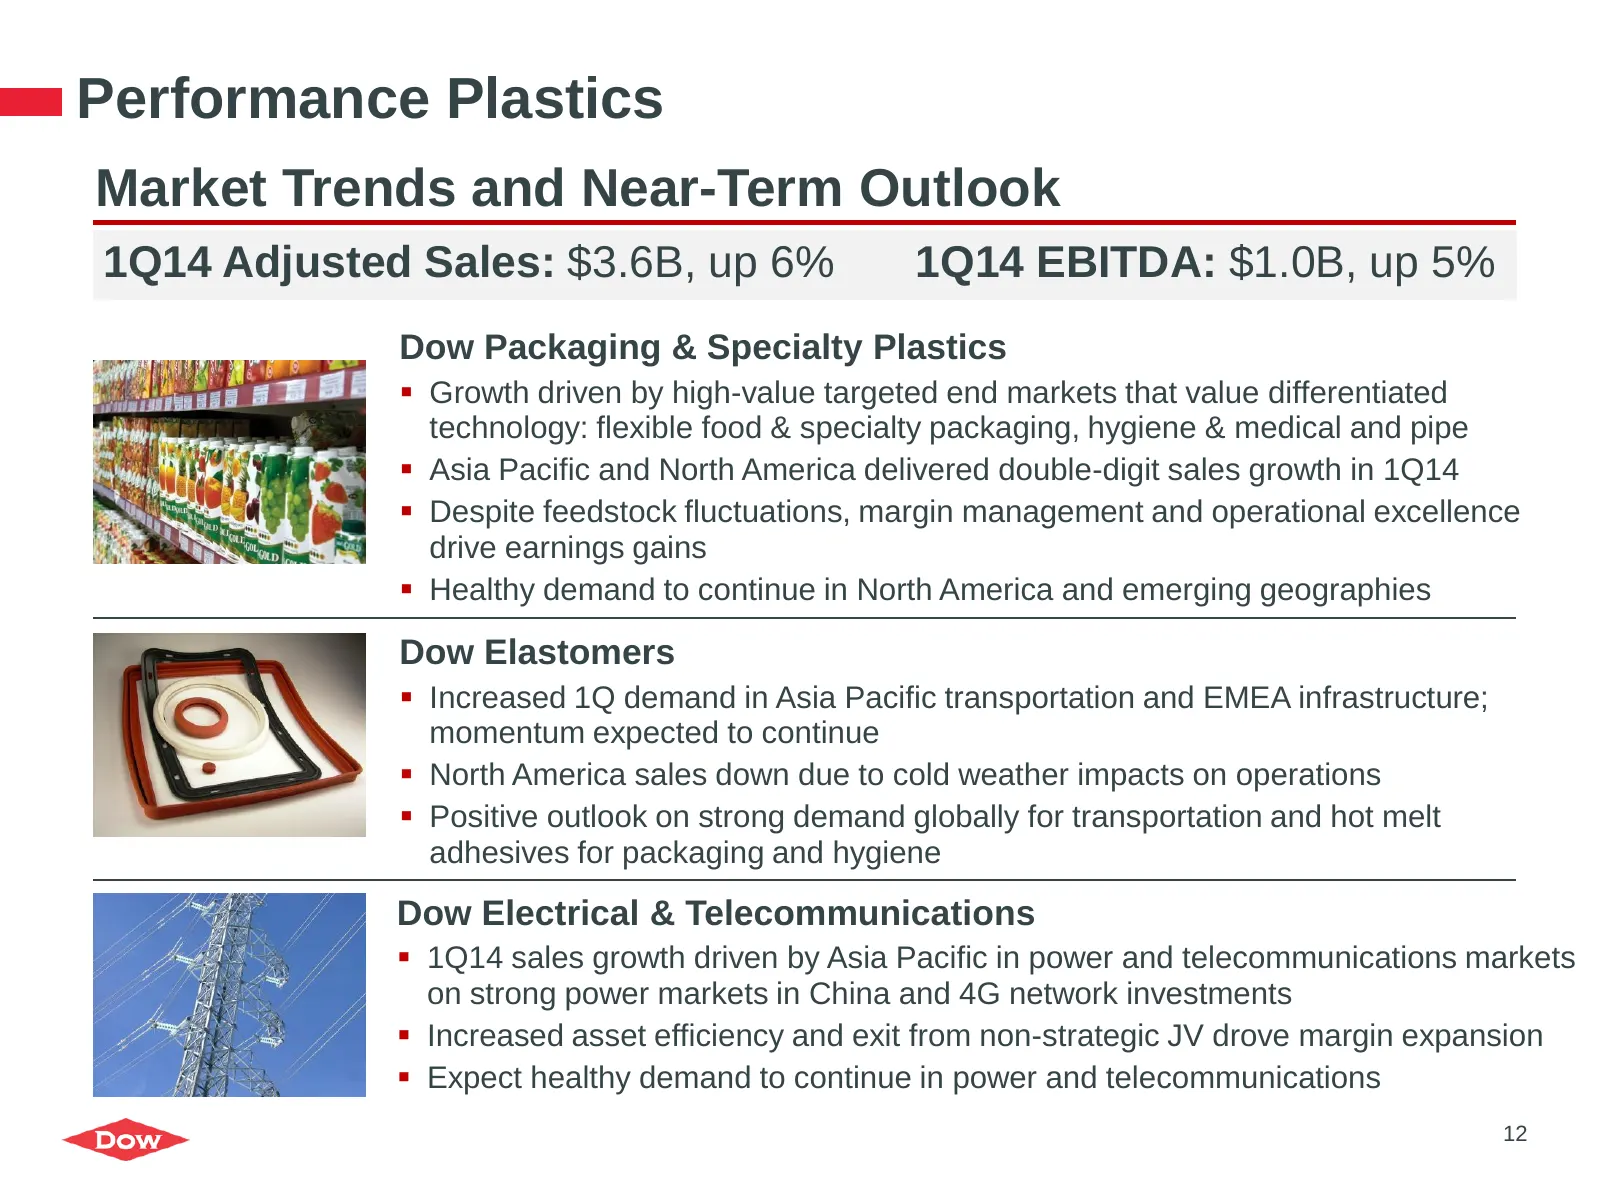
Performance Plastics Market Trends and Near-Term Outlook 1Q14 Adjusted Sales: $3.6B, up 6% 1Q14 EBITDA: $1.0B, up 5% Dow Packaging & Specialty Plastics Growth driven by high-value targeted end markets that value differentiated technology: flexible food & specialty packaging, hygiene & medical and
Slide 13: Actions Fuel Earnings Momentum
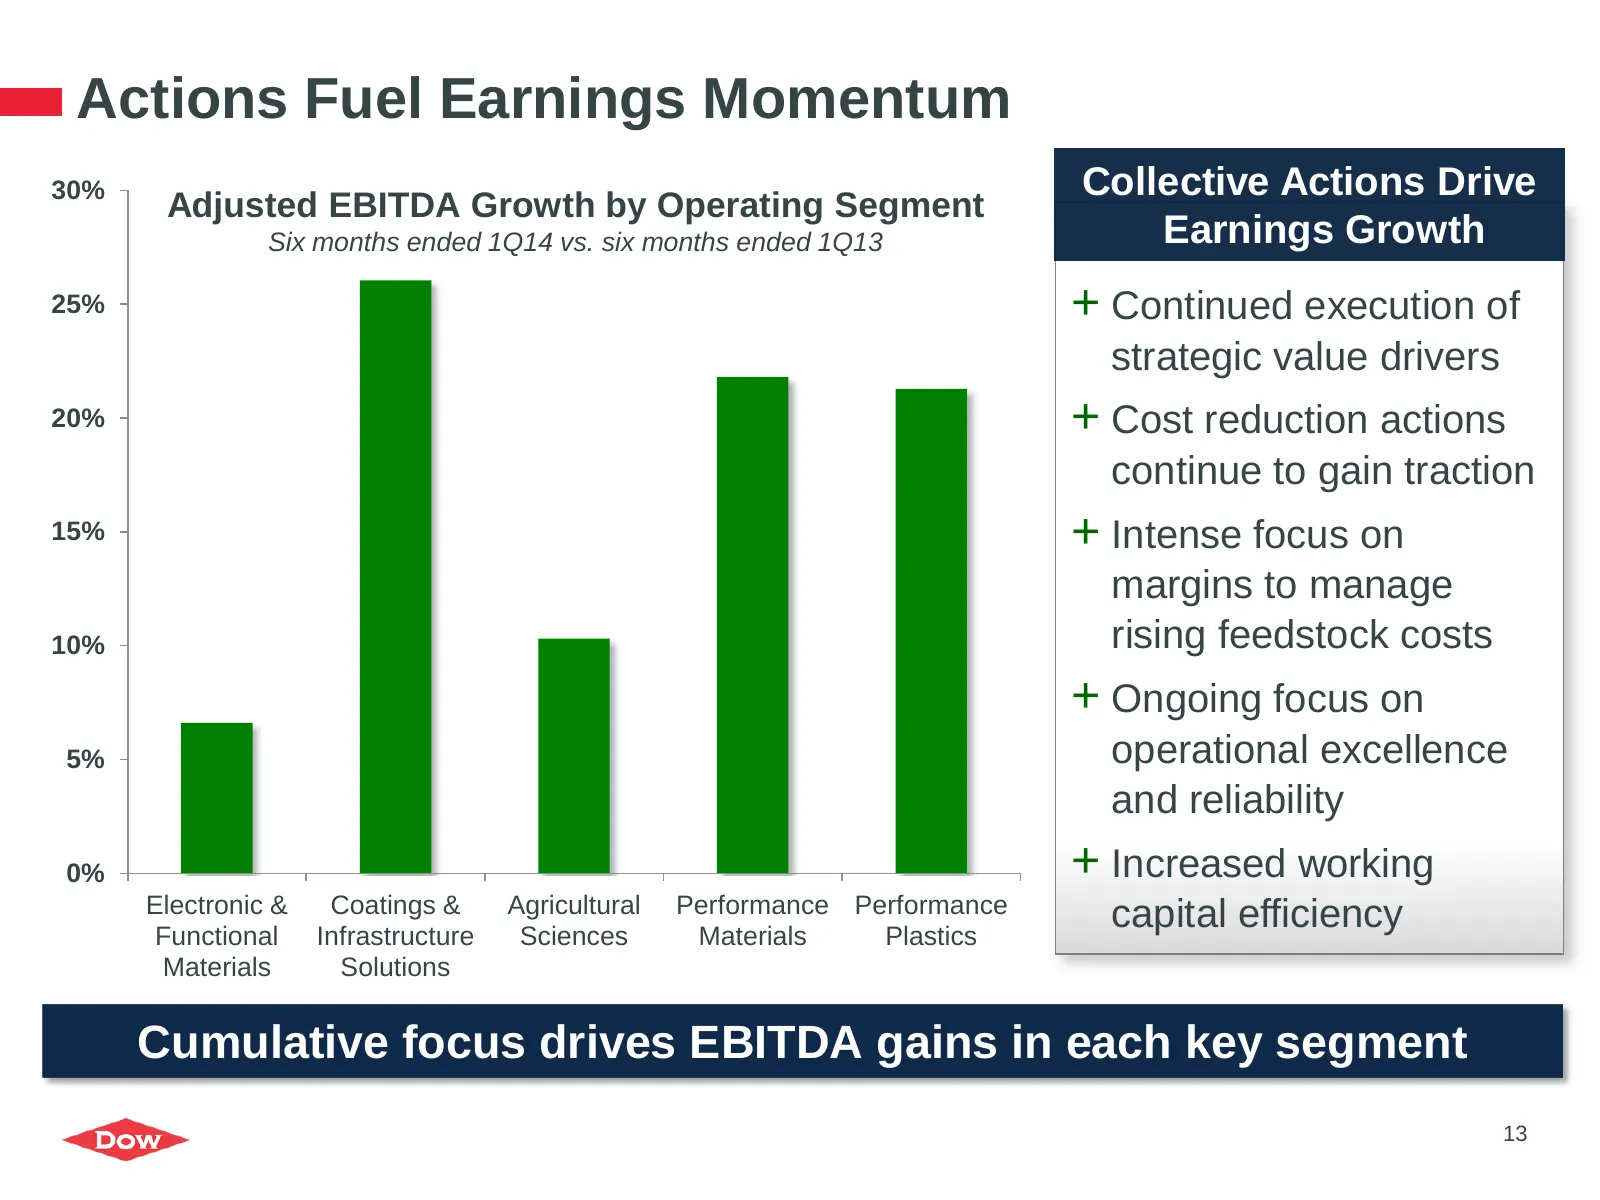
Actions Fuel Earnings Momentum 30% Collective Actions Drive Adjusted EBITDA Growth by Operating Segment Six months ended 1Q14 vs. six months ended 1Q13 Earnings Growth 25% + Continued execution of strategic value drivers 20% + Cost reduction actions continue to gain traction 15% + Intense focus on m
Slide 14: Driving Near-Term Margin Expansion and Growth
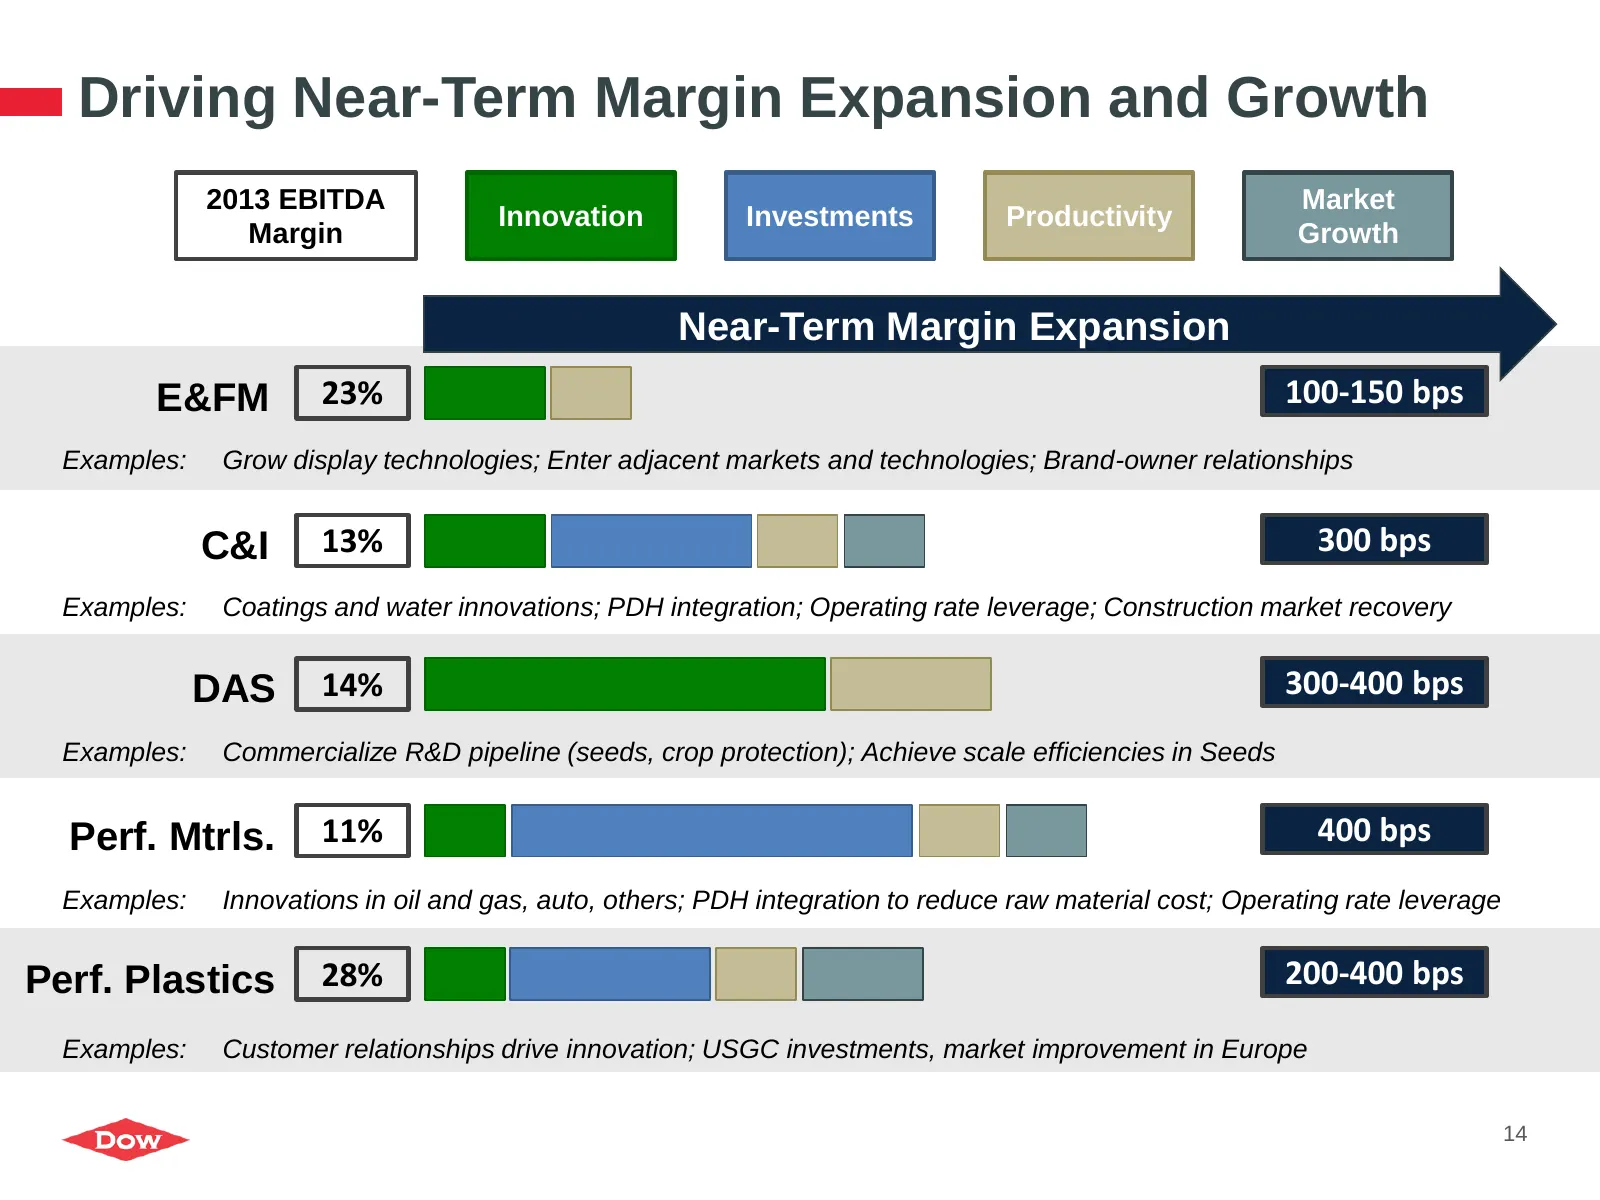
Driving Near-Term Margin Expansion and Growth 2013 EBITDA Market Innovation Investments Productivity Margin Growth Near-Term Margin Expansion E&FM 23% 100-150 bps Examples: Grow display technologies; Enter adjacent markets and technologies; Brand-owner relationships C&I 13% 300 bps Examples: Coating
Slide 15: Agenda
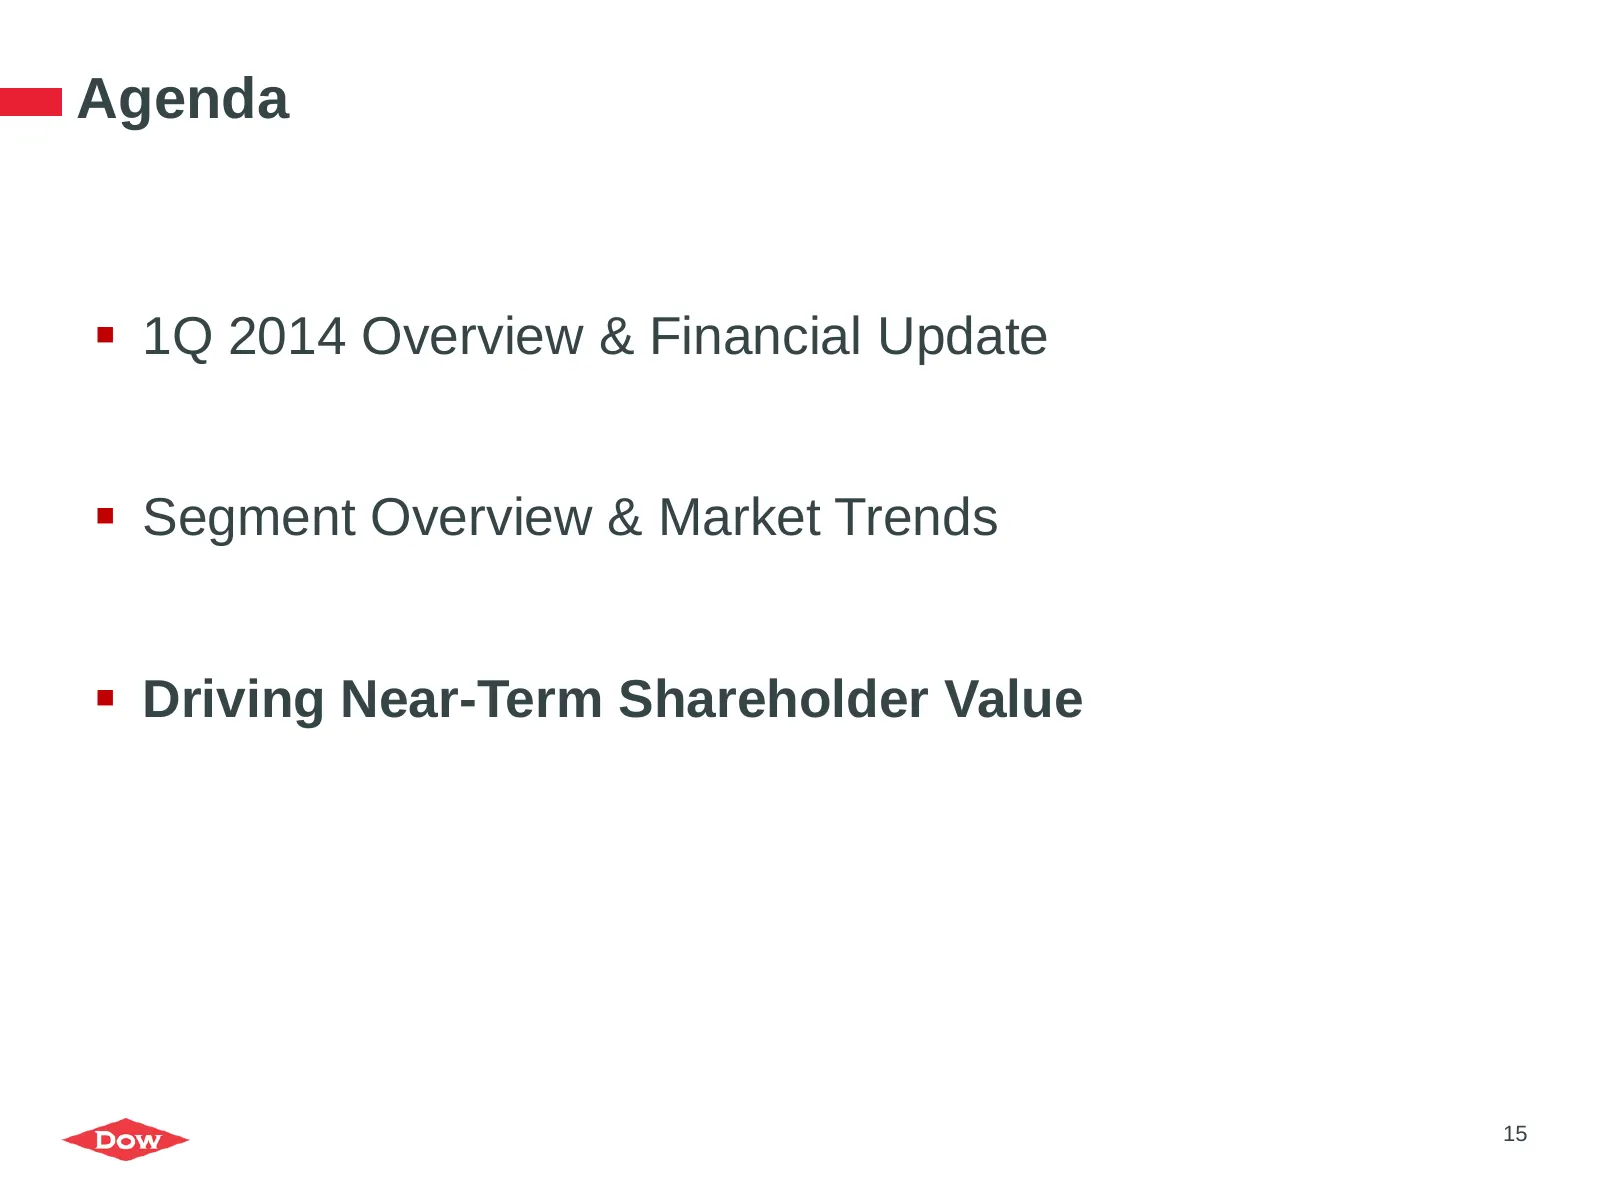
Agenda 1Q 2014 Overview & Financial Update Segment Overview & Market Trends Driving Near-Term Shareholder Value 15
Slide 16: Near-Term Strategic Priorities
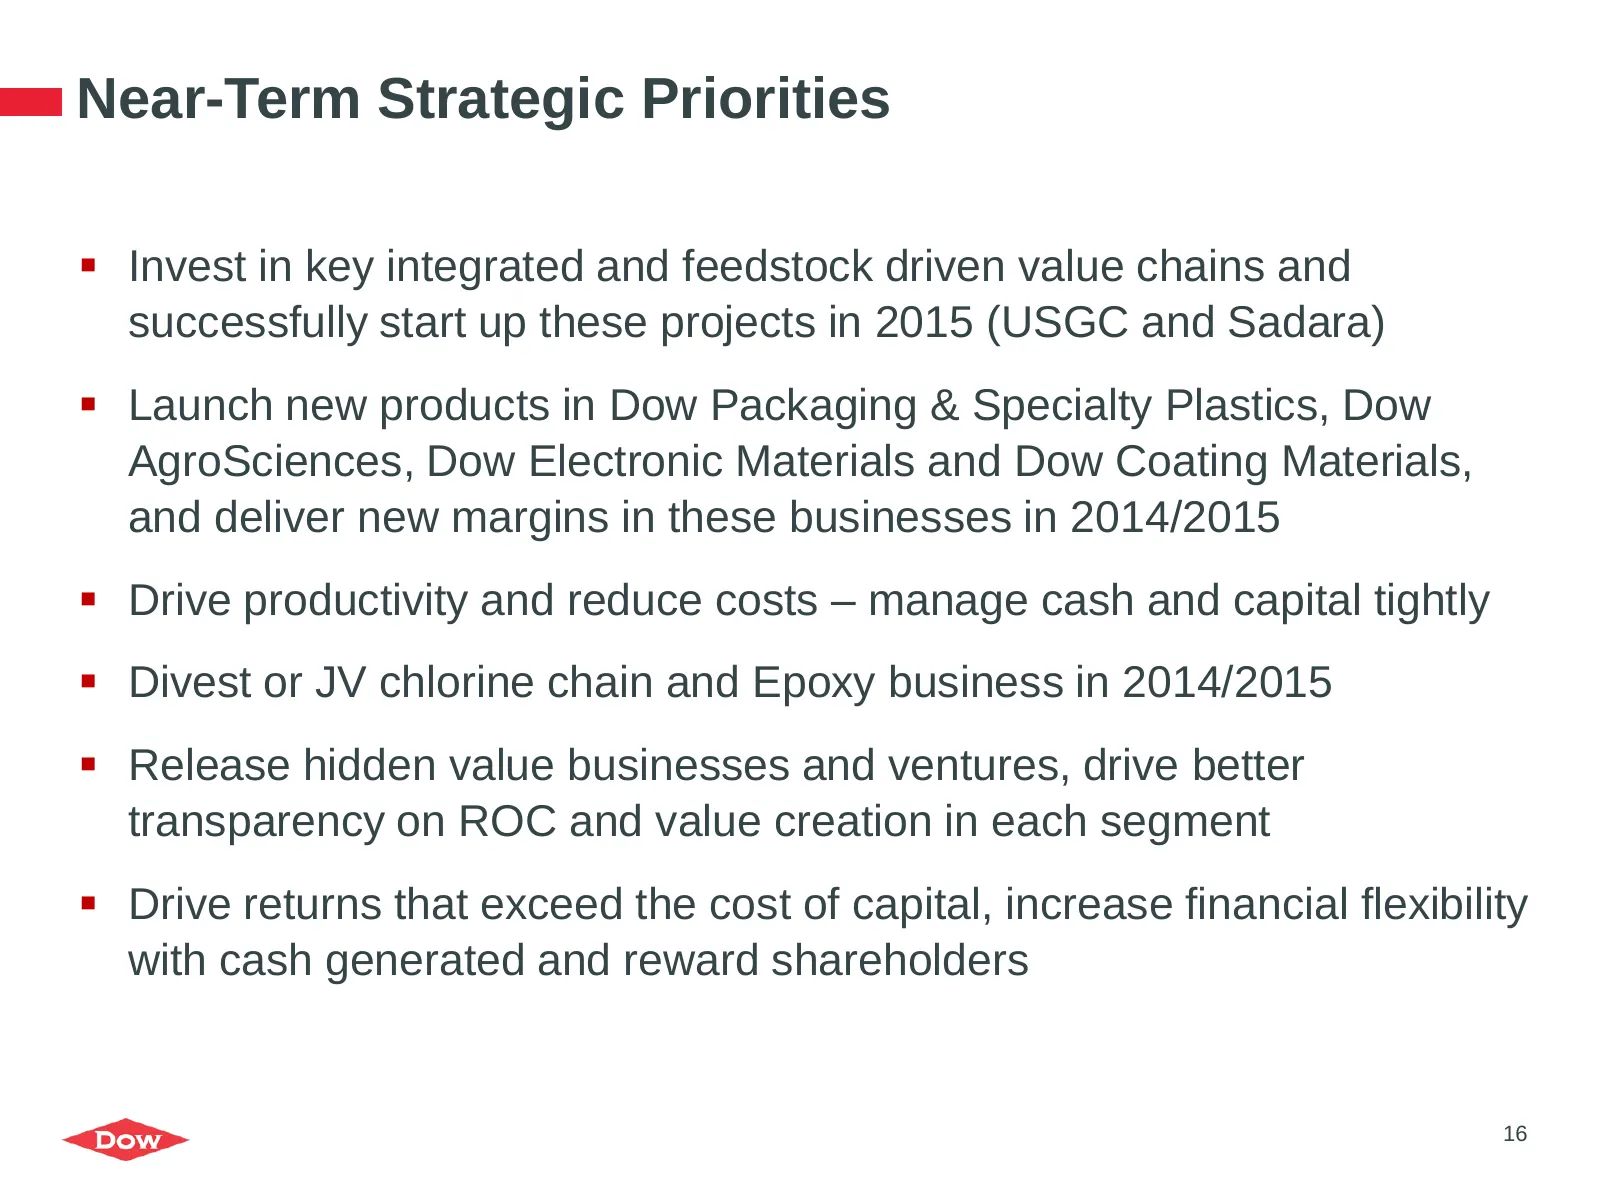
Near-Term Strategic Priorities Invest in key integrated and feedstock driven value chains and successfully start up these projects in 2015 (USGC and Sadara) Launch new products in Dow Packaging & Specialty Plastics, Dow AgroSciences, Dow Electronic Materials and Dow Coating Materials, and delive
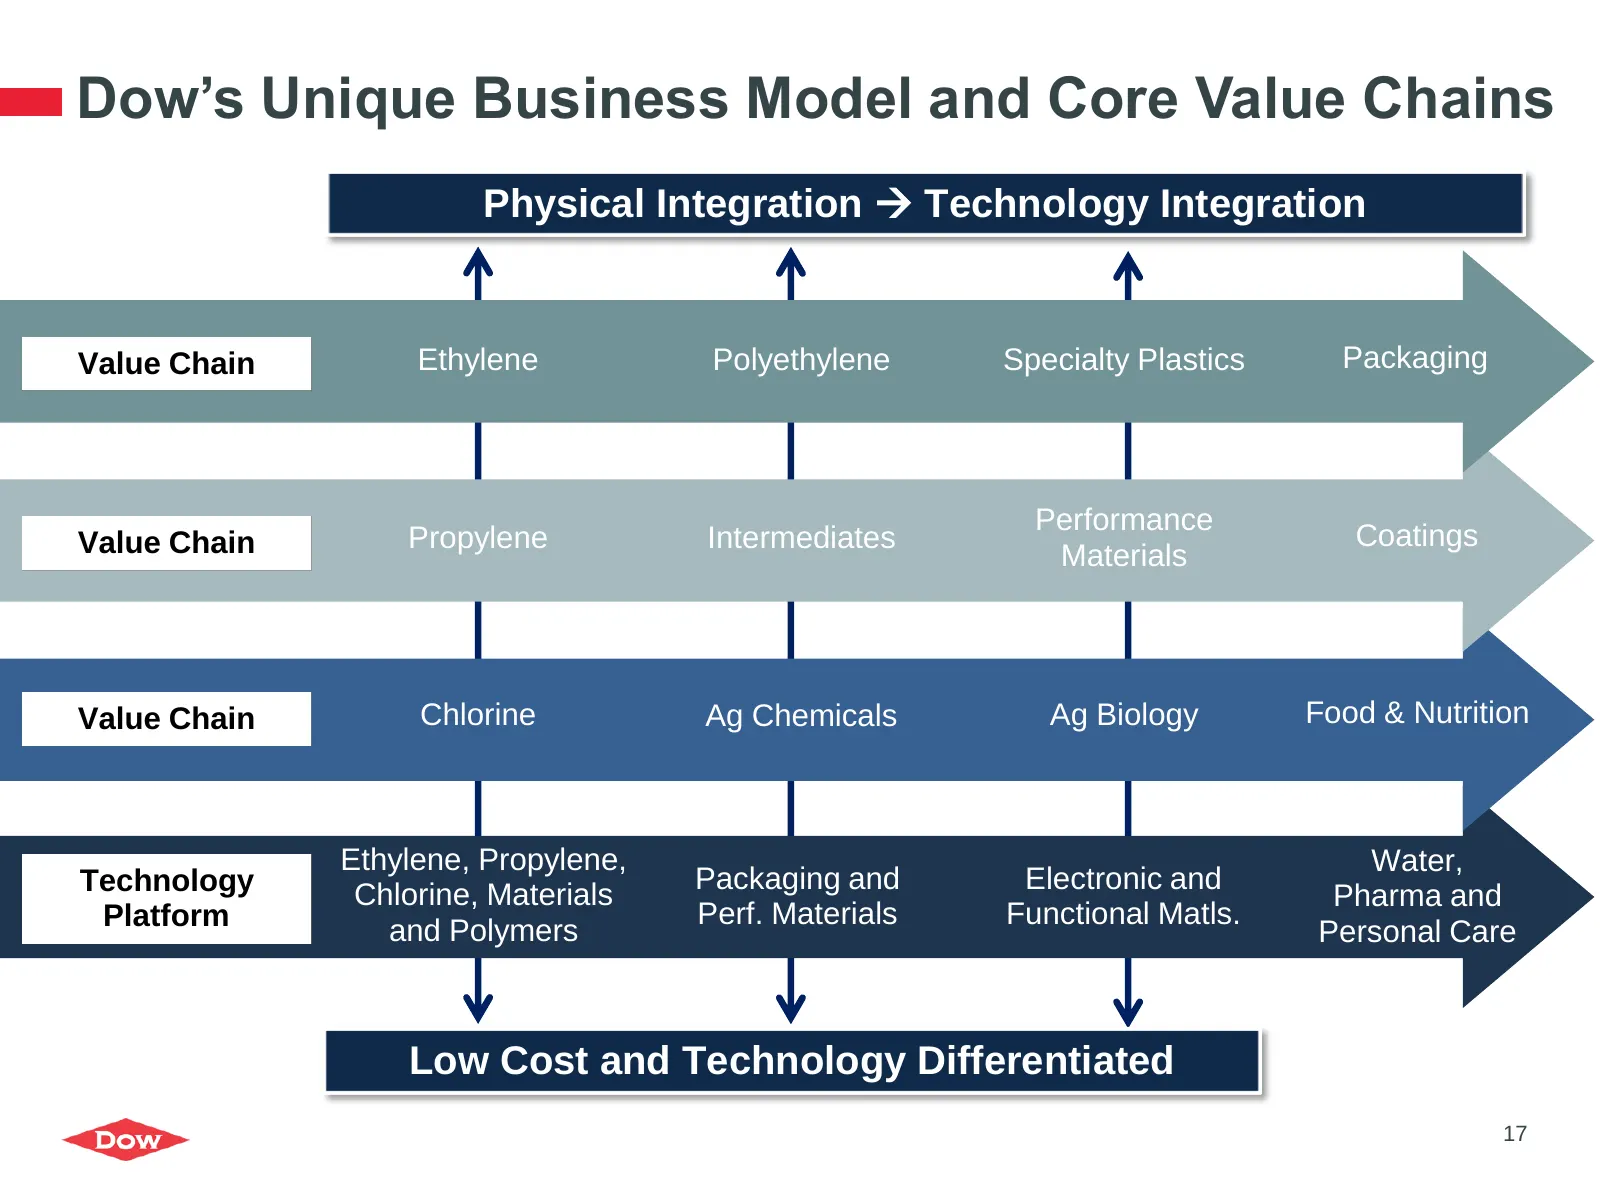
Slide 17: Dow's Unique Business Model and Core Value Chains
Dow’s Unique Business Model and Core Value Chains Physical Integration Technology Integration Value Chain Ethylene Polyethylene Specialty Plastics Packaging Performance Value Chain Propylene Intermediates Coatings Materials Value Chain Chlorine Ag Chemicals Ag Biology Food & Nutrition Ethylene, Pr
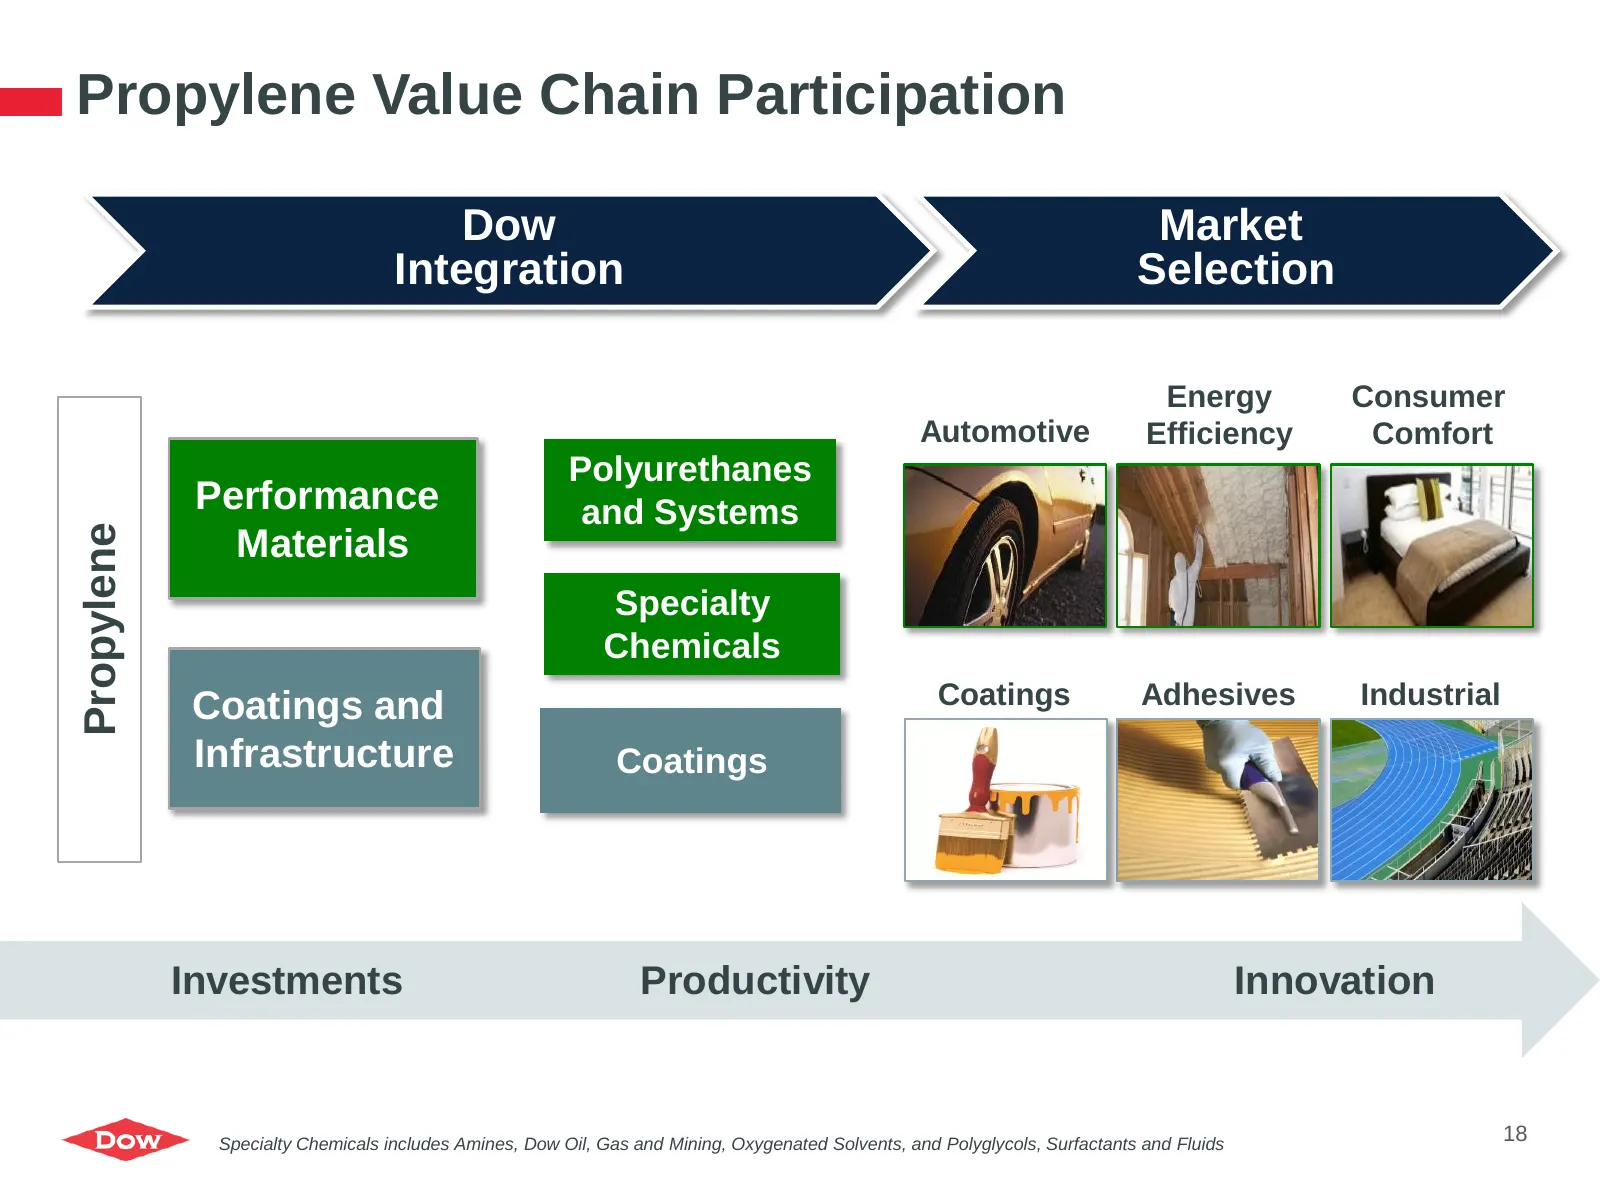
Slide 18: Propylene Value Chain Participation
Propylene Value Chain Participation Dow Market Integration Selection Energy Consumer Automotive Efficiency Comfort Polyurethanes Performance and Systems Propylene Materials Specialty Chemicals Coatings and Coatings Adhesives Industrial Infrastructure Coatings Investments Productivity Innovation Spec
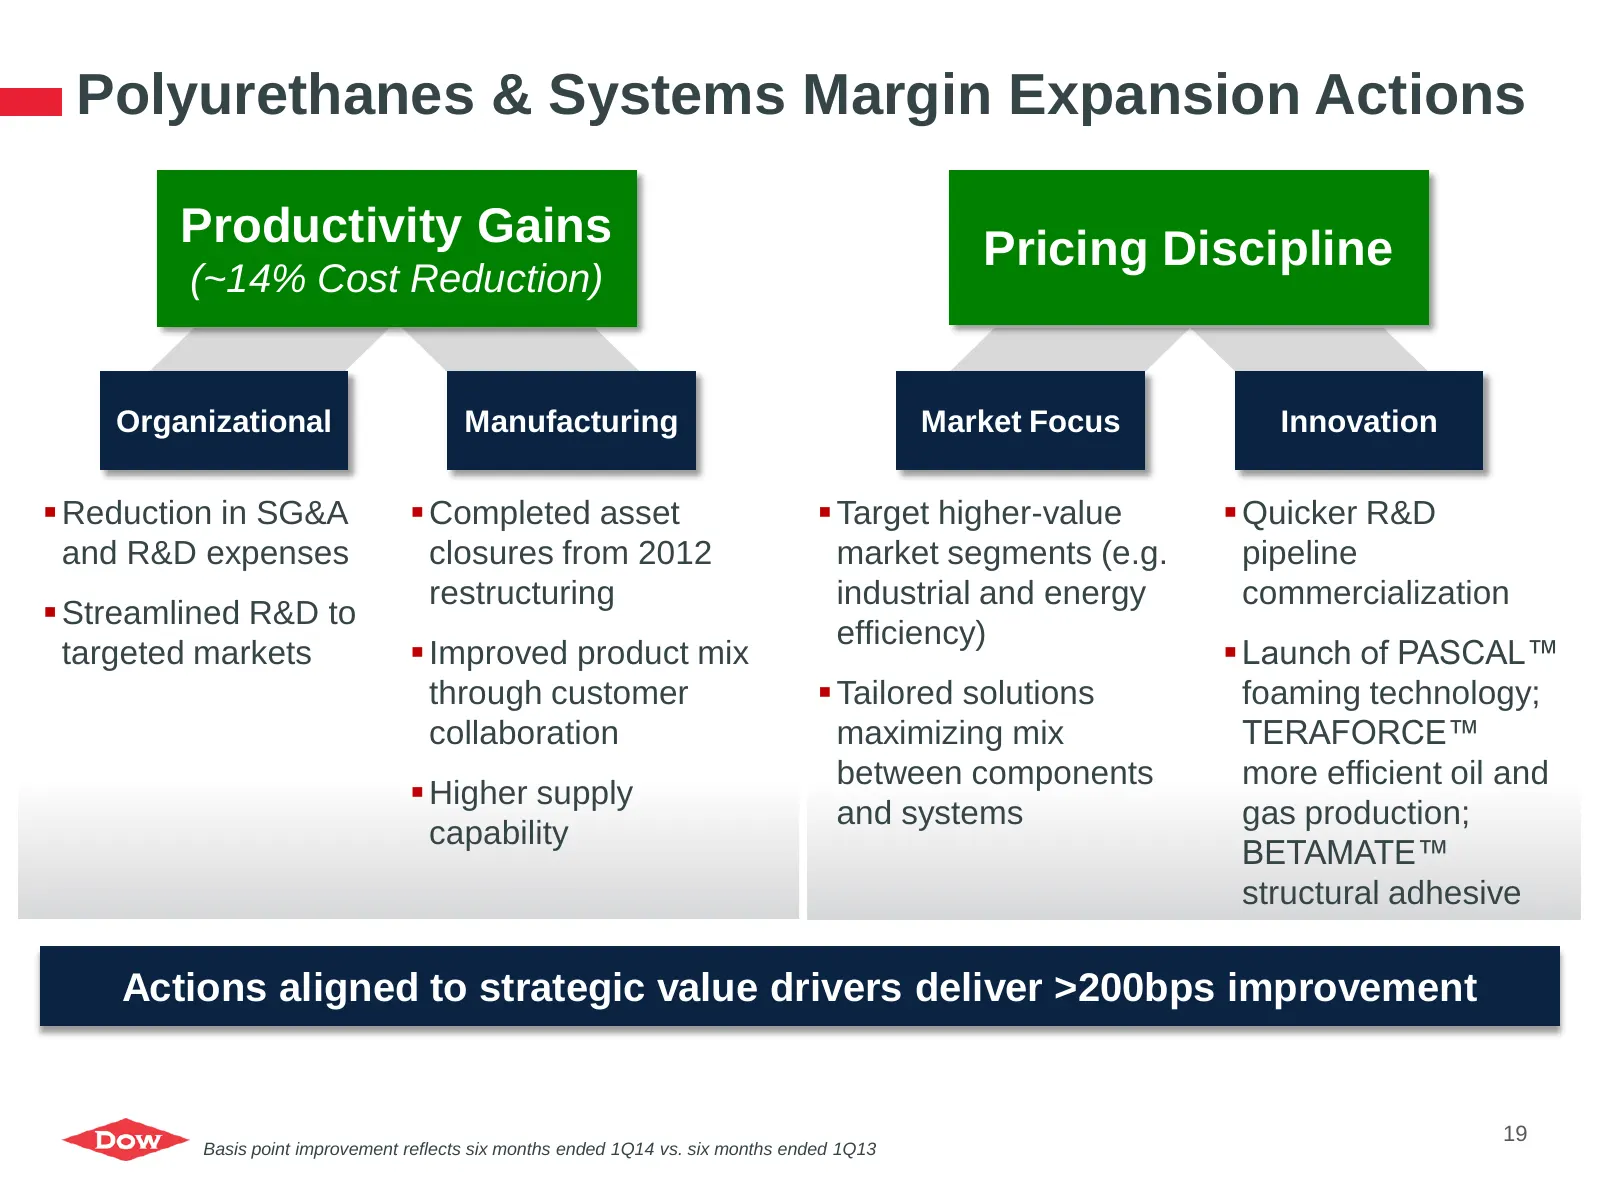
Slide 19: Polyurethanes & Systems Margin Expansion Actions
Polyurethanes & Systems Margin Expansion Actions Productivity Gains Pricing Discipline (~14% Cost Reduction) Organizational Manufacturing Market Focus Innovation Reduction in SG&A Completed asset Target higher-value Quicker R&D and R&D expenses closures from 2012 market segments (e.g. pipeli
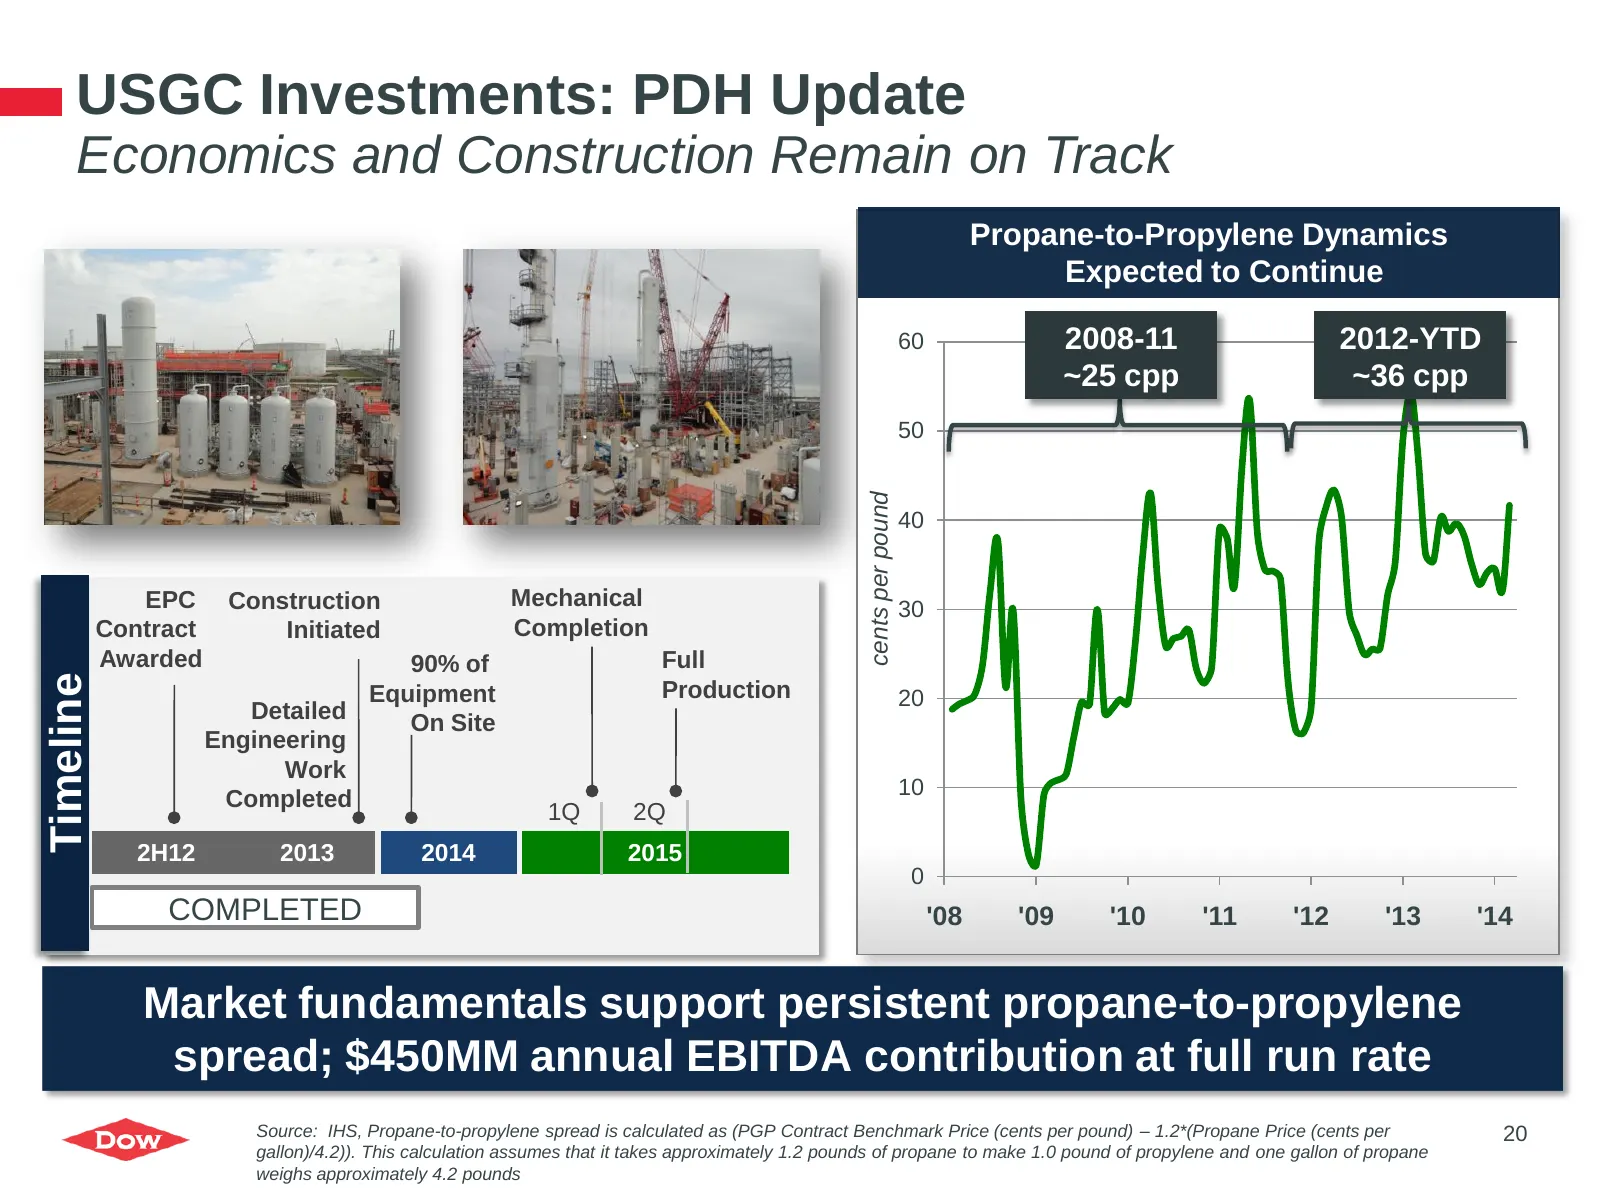
Slide 20: USGC Investments: PDH Update
USGC Investments: PDH Update Economics and Construction Remain on Track Propane-to-Propylene Dynamics Expected to Continue 60 2008-11 2012-YTD ~25 cpp ~36 cpp 50 cents per pound 40 EPC Construction Mechanical 30 Contract Initiated Completion Awarded 90% of Full Timeline Equipment Production 20 Detai
Slide 21: On the Path to $10B+ EBITDA Near Term
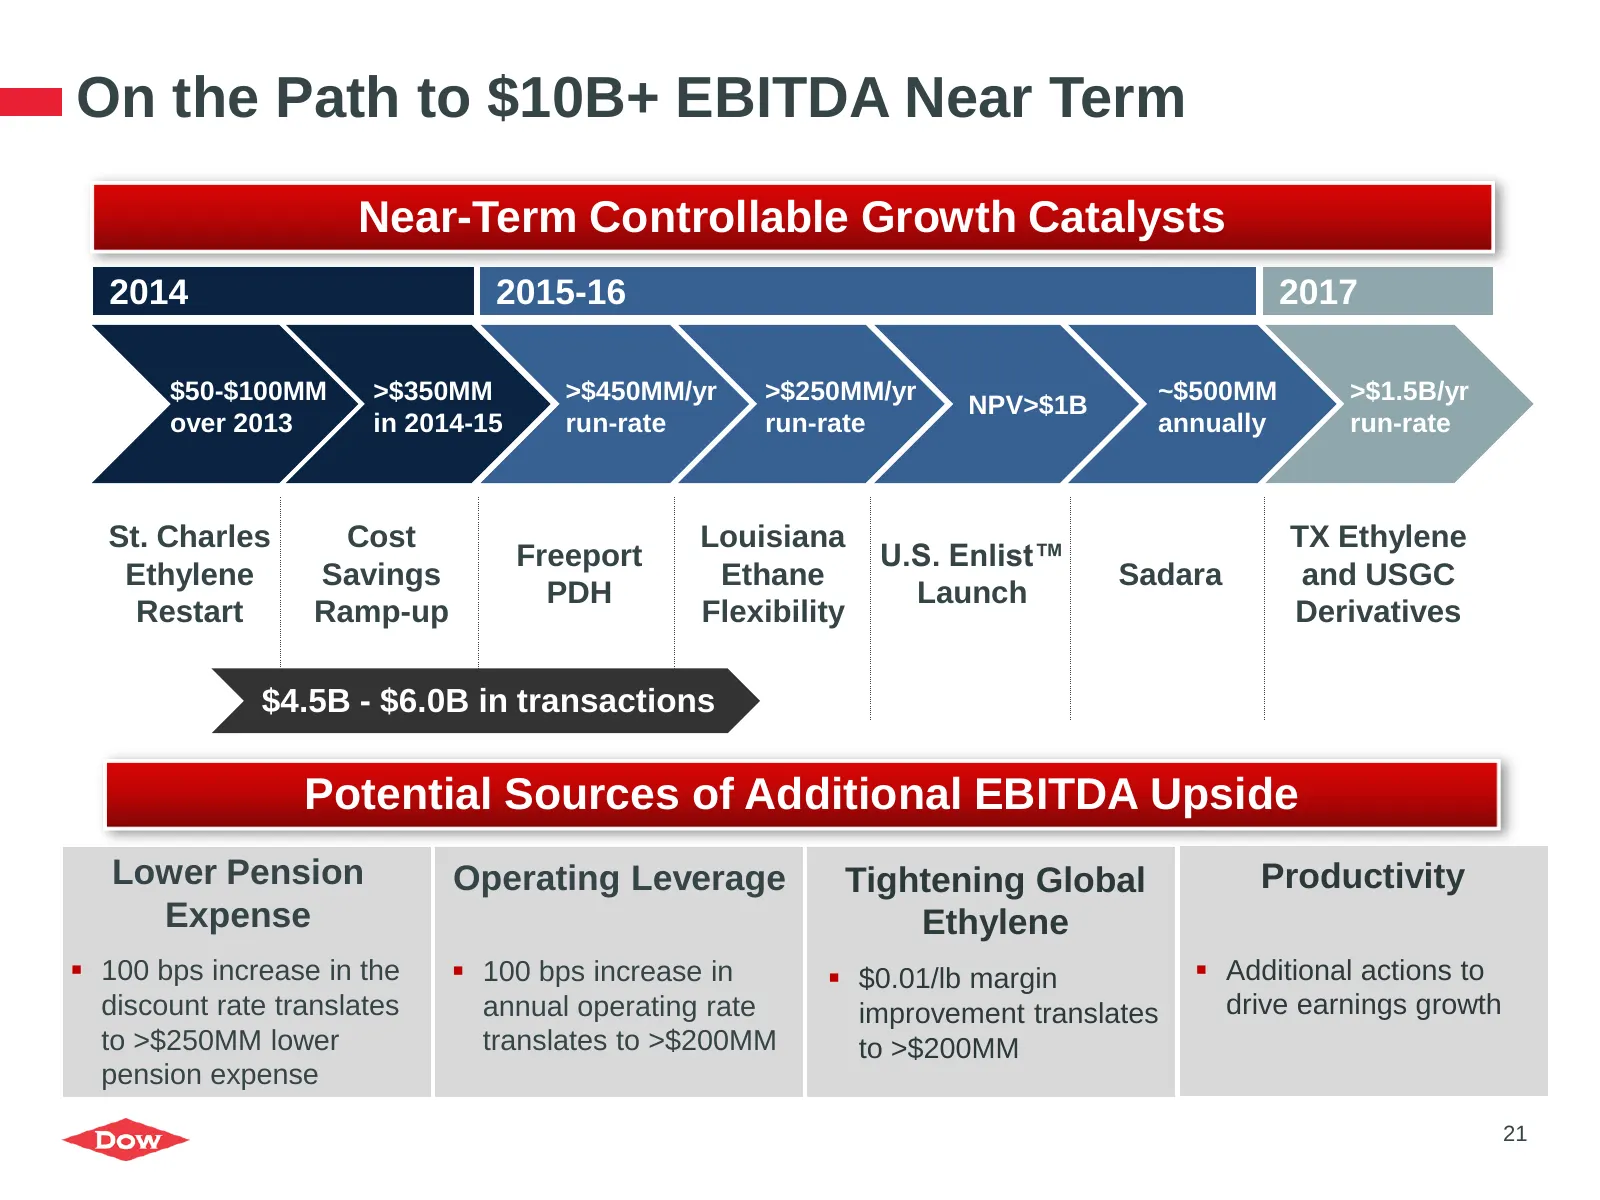
On the Path to $10B+ EBITDA Near Term Near-Term Controllable Growth Catalysts 2014 2015-16 2017 $50-$100MM >$350MM >$450MM/yr >$250MM/yr ~$500MM >$1.5B/yr NPV>$1B over 2013 in 2014-15 run-rate run-rate annually run-rate St. Charles Cost Louisiana TX Ethylene Freeport U.S. Enlist™ Ethylene Savings Et
Slide 22: Strategic Choices to Narrow Our Portfolio
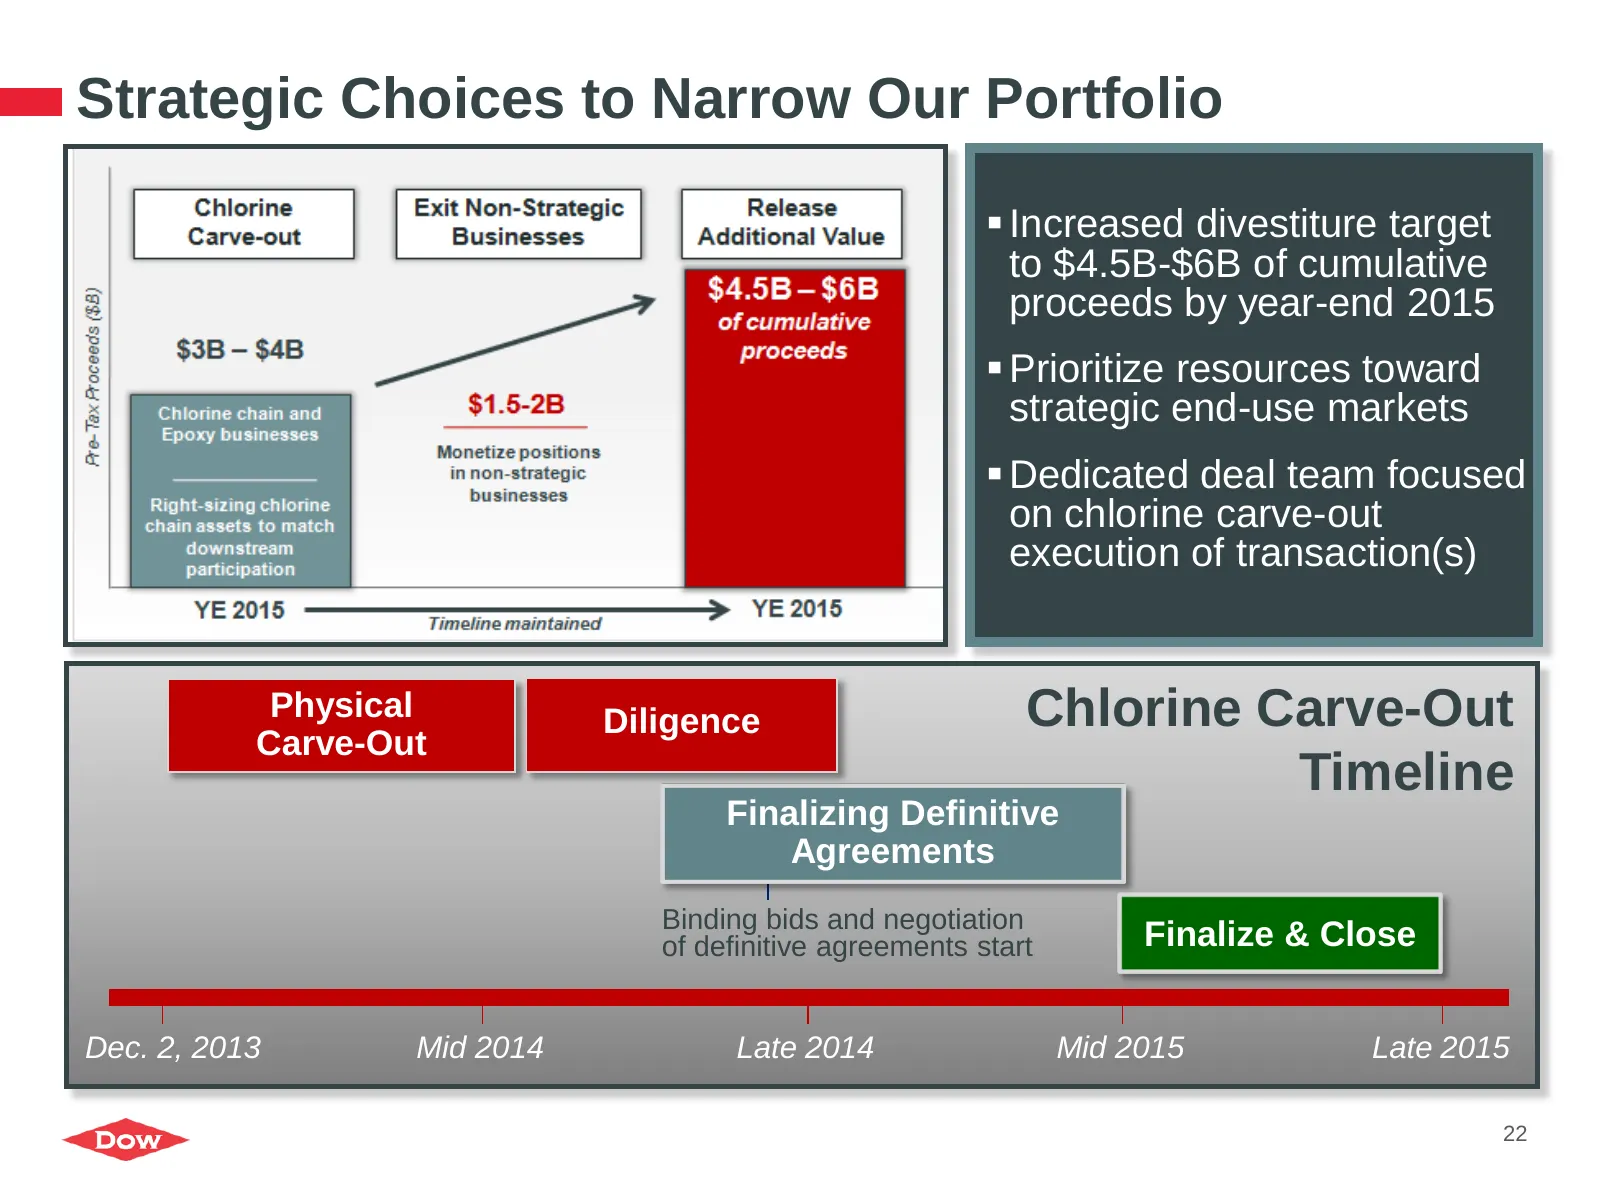
Strategic Choices to Narrow Our Portfolio Increased divestiture target to $4.5B-$6B of cumulative proceeds by year-end 2015 Prioritize resources toward strategic end-use markets Dedicated deal team focused on chlorine carve-out execution of transaction(s) Physical Diligence Chlorine Carve-Out
Slide 23: Increasing Shareholder Remuneration
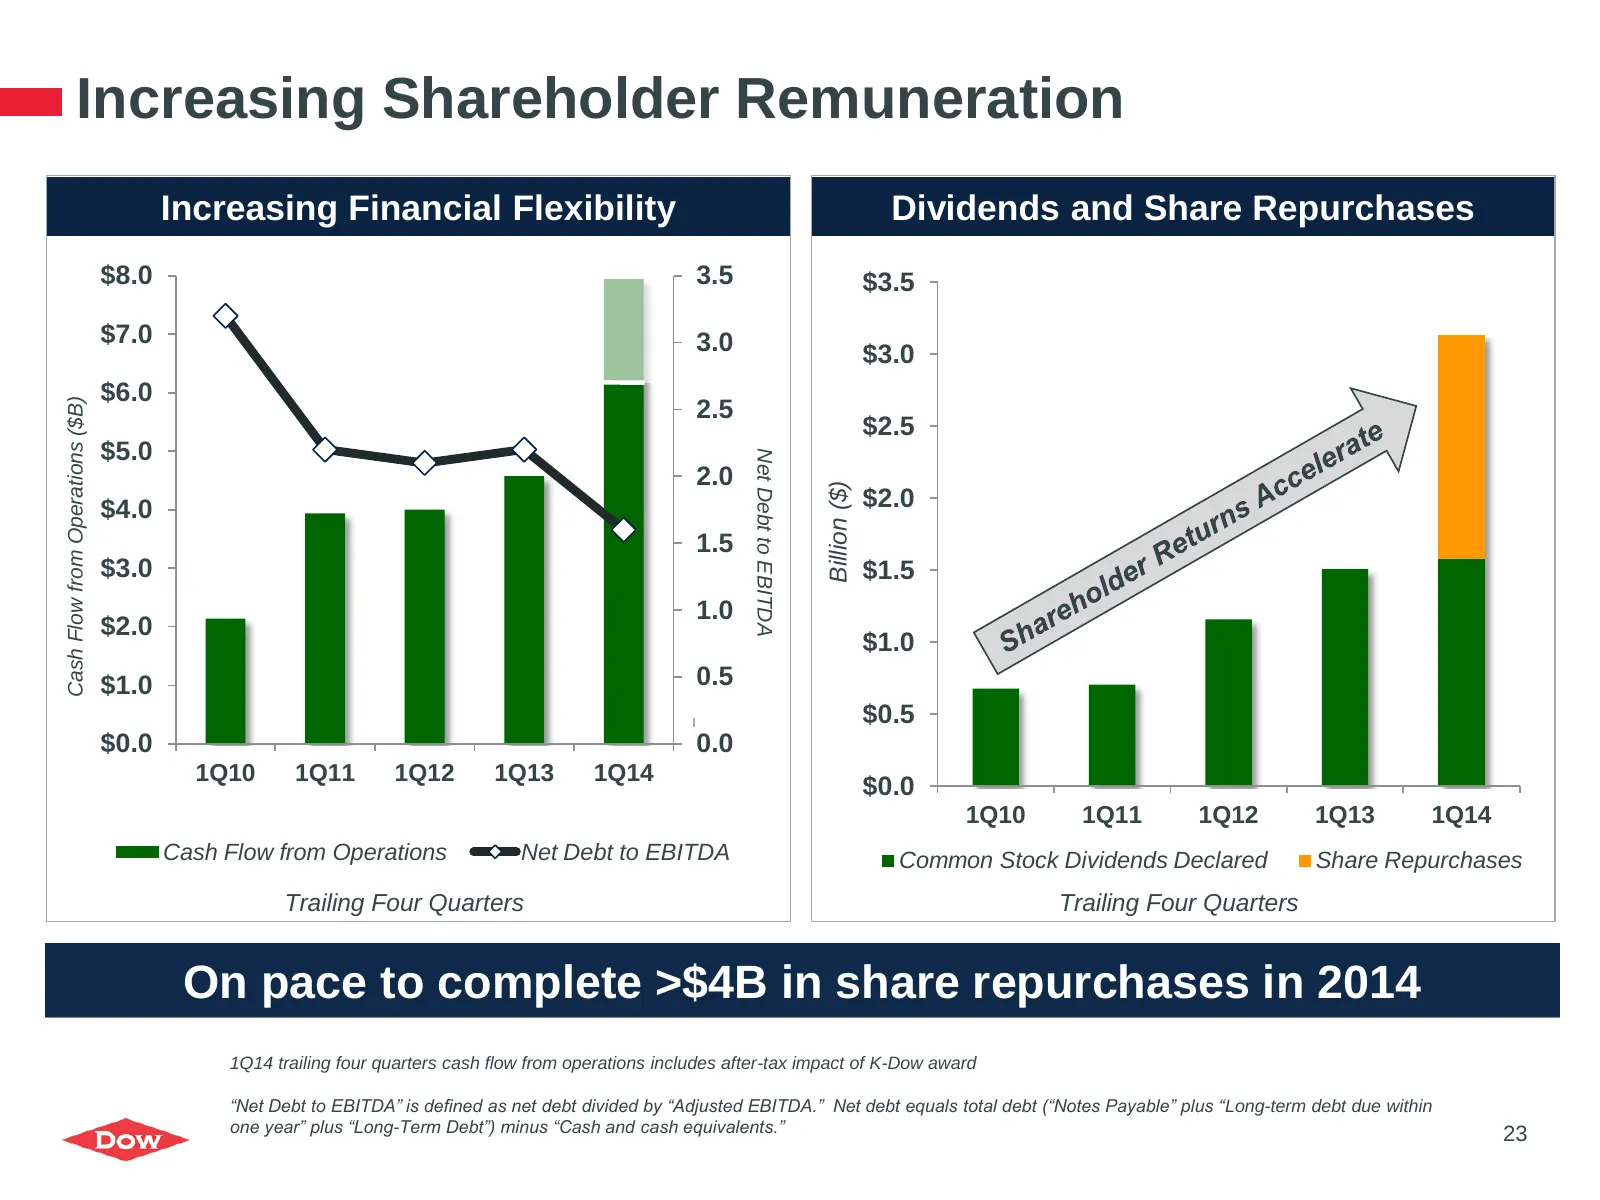
Increasing Shareholder Remuneration Increasing Financial Flexibility Dividends and Share Repurchases $8.0 3.5 $3.5 $7.0 3.0 $3.0 $6.0 Cash Flow from Operations ($B) 2.5 $2.5 $5.0 Net Debt to EBITDA 2.0 Billion ($) $4.0 $2.0 1.5 $3.0 $1.5 1.0 $2.0 $1.0 $1.0 0.5 $0.5 $0.0 0.0 1Q10 1Q11 1Q12 1Q13 1Q14
Slide 24: Near-Term Strategic Priorities
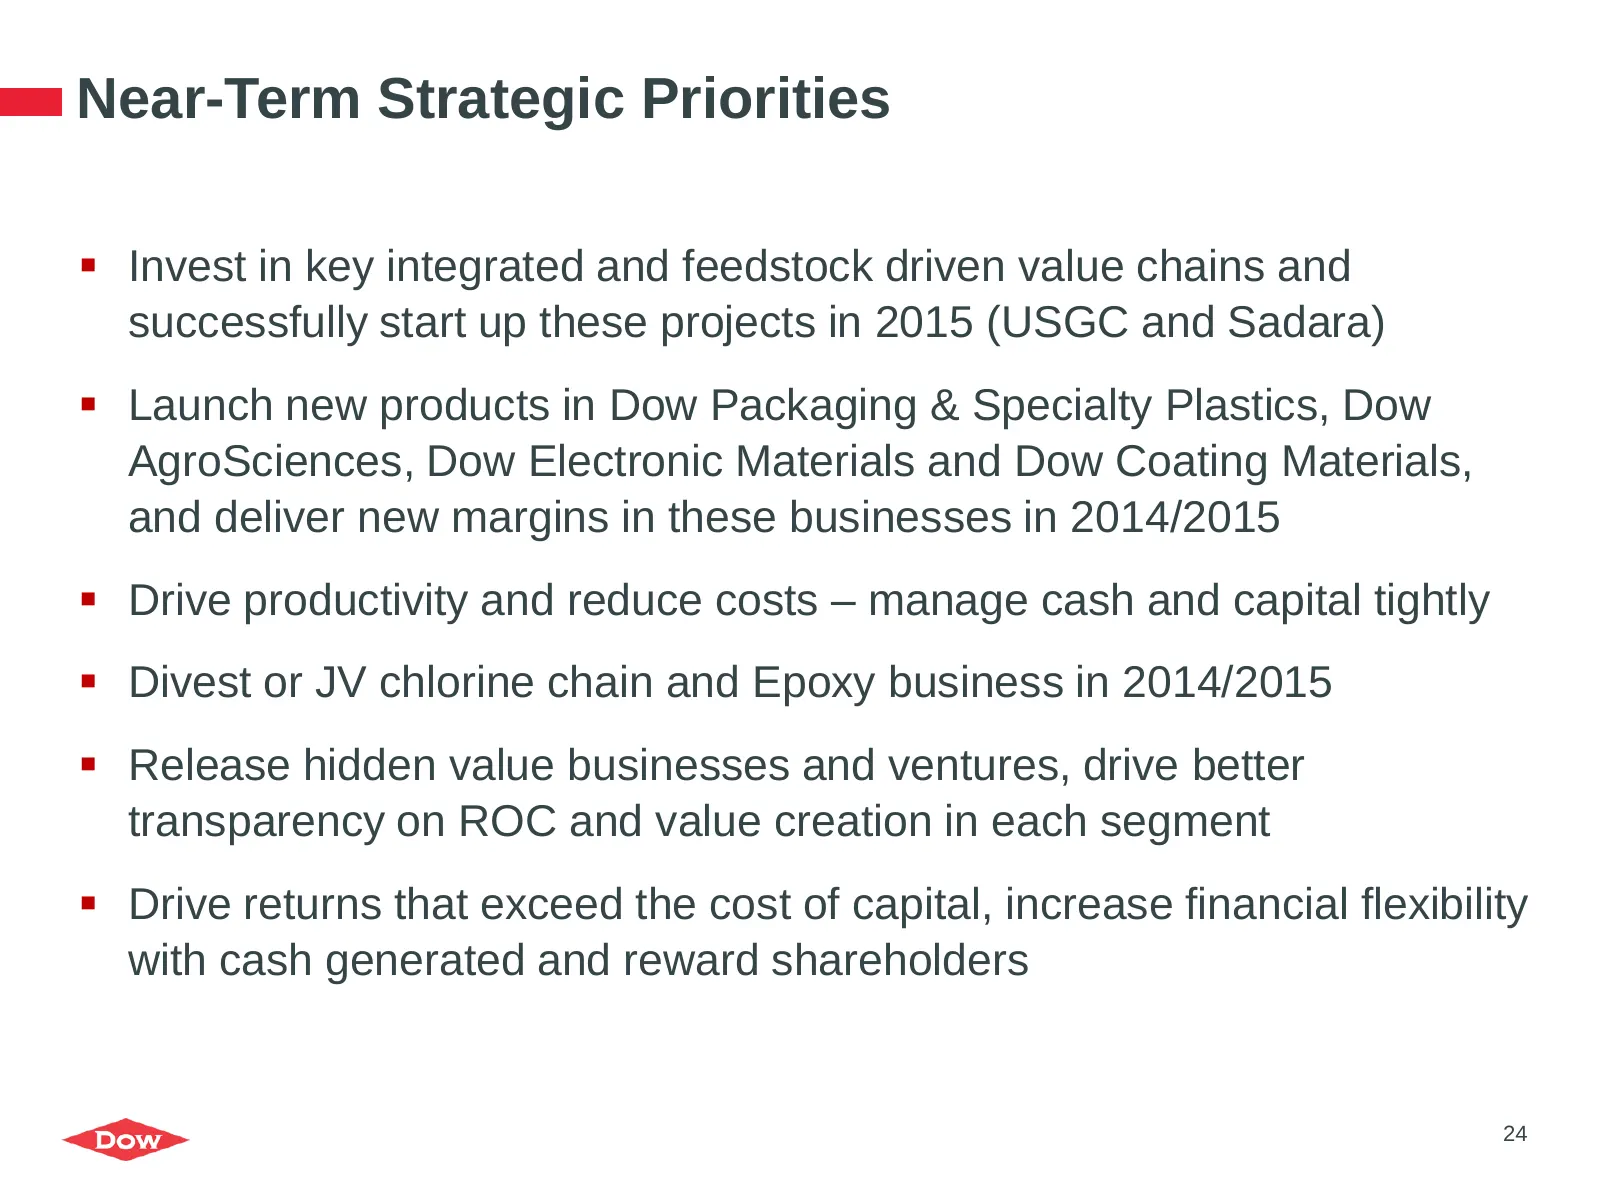
Near-Term Strategic Priorities Invest in key integrated and feedstock driven value chains and successfully start up these projects in 2015 (USGC and Sadara) Launch new products in Dow Packaging & Specialty Plastics, Dow AgroSciences, Dow Electronic Materials and Dow Coating Materials, and delive
Slide 25
Slide 26: Electronic and Functional Materials
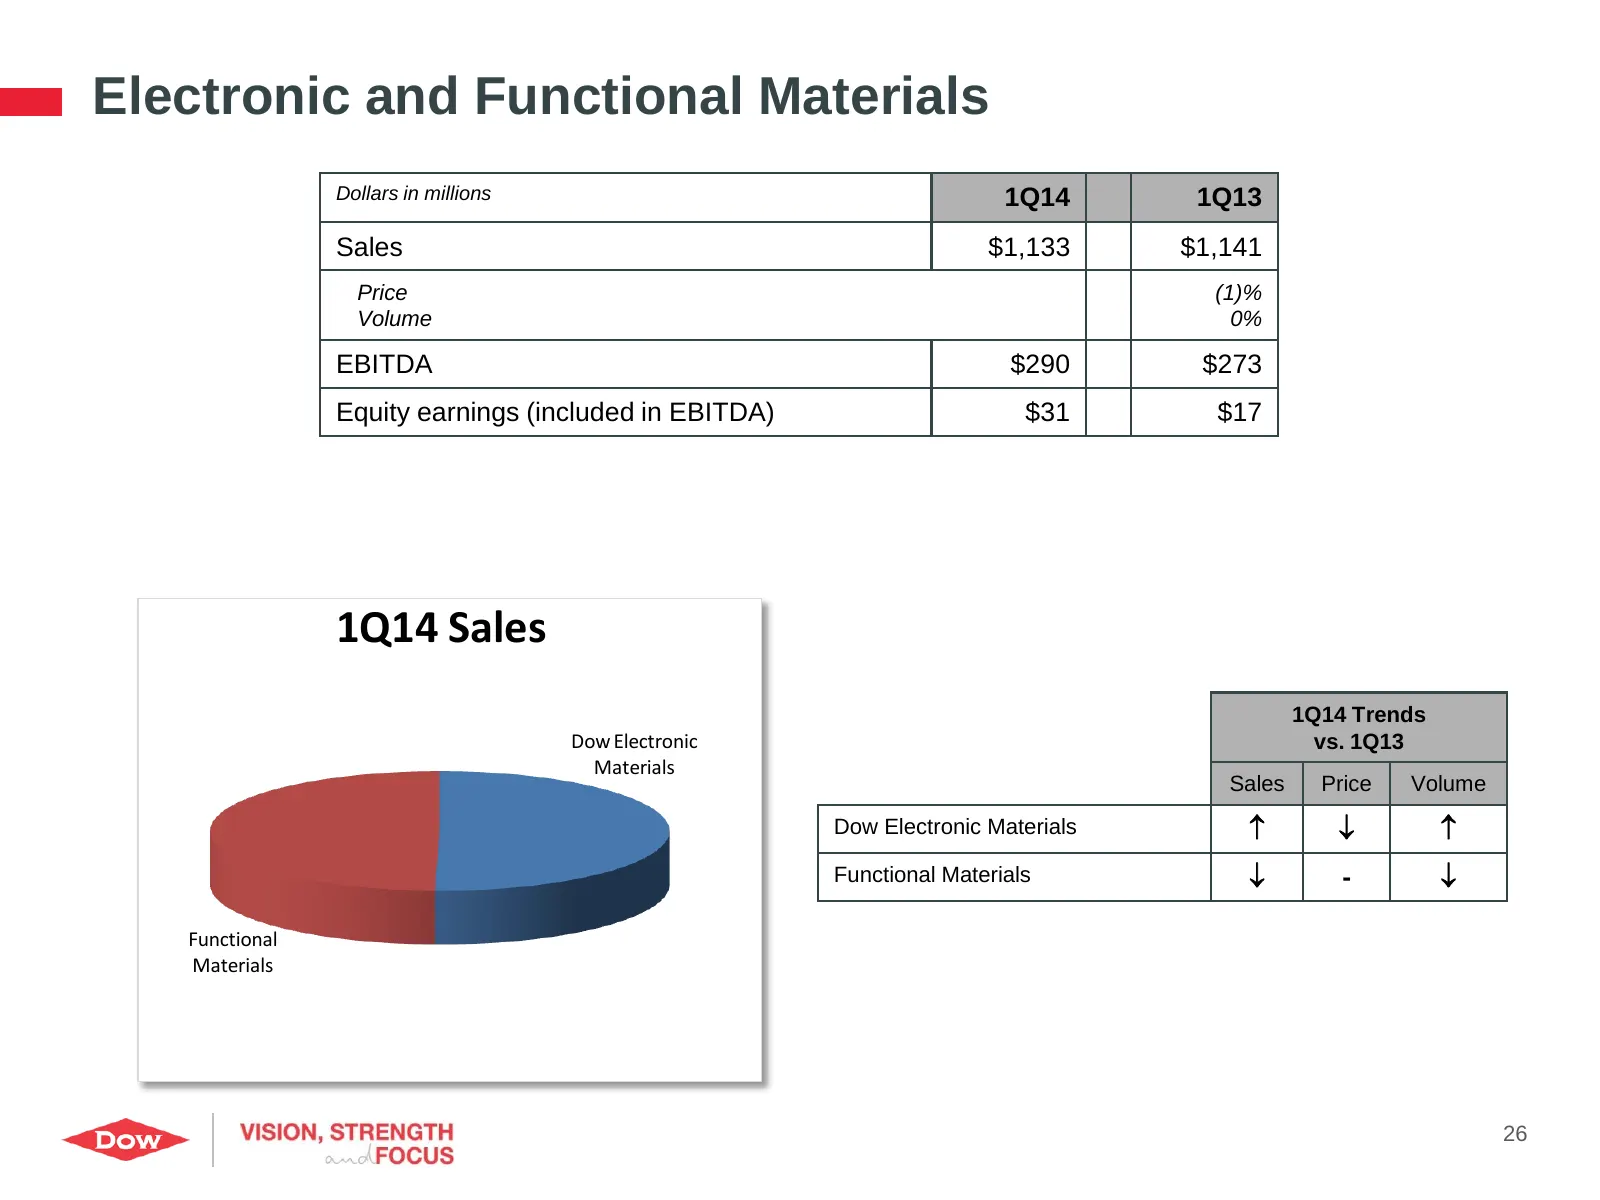
Electronic and Functional Materials Dollars in millions 1Q14 1Q13 Sales $1,133 $1,141 Price (1)% Volume 0% EBITDA $290 $273 Equity earnings (included in EBITDA) $31 $17 1Q14 Sales 1Q14 Trends Dow Electronic vs. 1Q13 Materials Sales Price Volume Dow Electronic Materials Functional Materials -
Slide 27: Coatings and Infrastructure Solutions
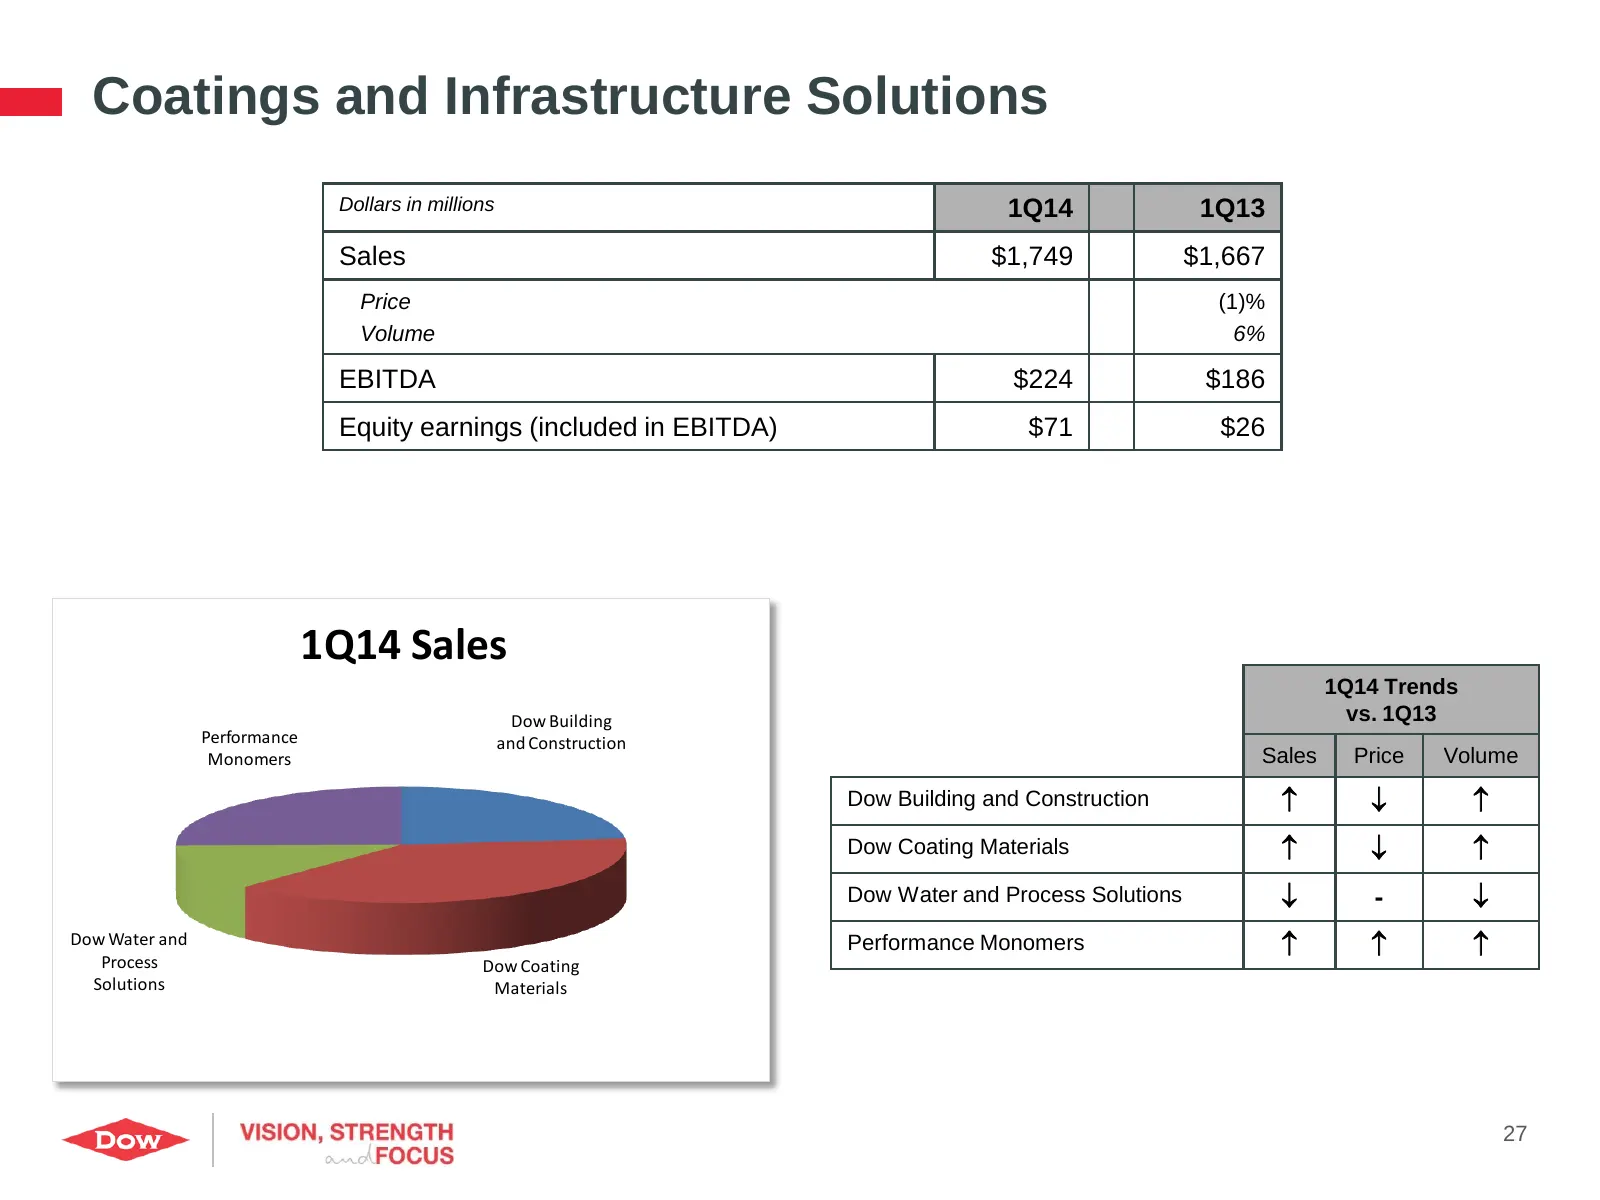
Coatings and Infrastructure Solutions Dollars in millions 1Q14 1Q13 Sales $1,749 $1,667 Price (1)% Volume 6% EBITDA $224 $186 Equity earnings (included in EBITDA) $71 $26 1Q14 Sales 1Q14 Trends Dow Building vs. 1Q13 Performance and Construction Monomers Sales Price Volume Dow Building and Constructi
Slide 28: Agricultural Sciences
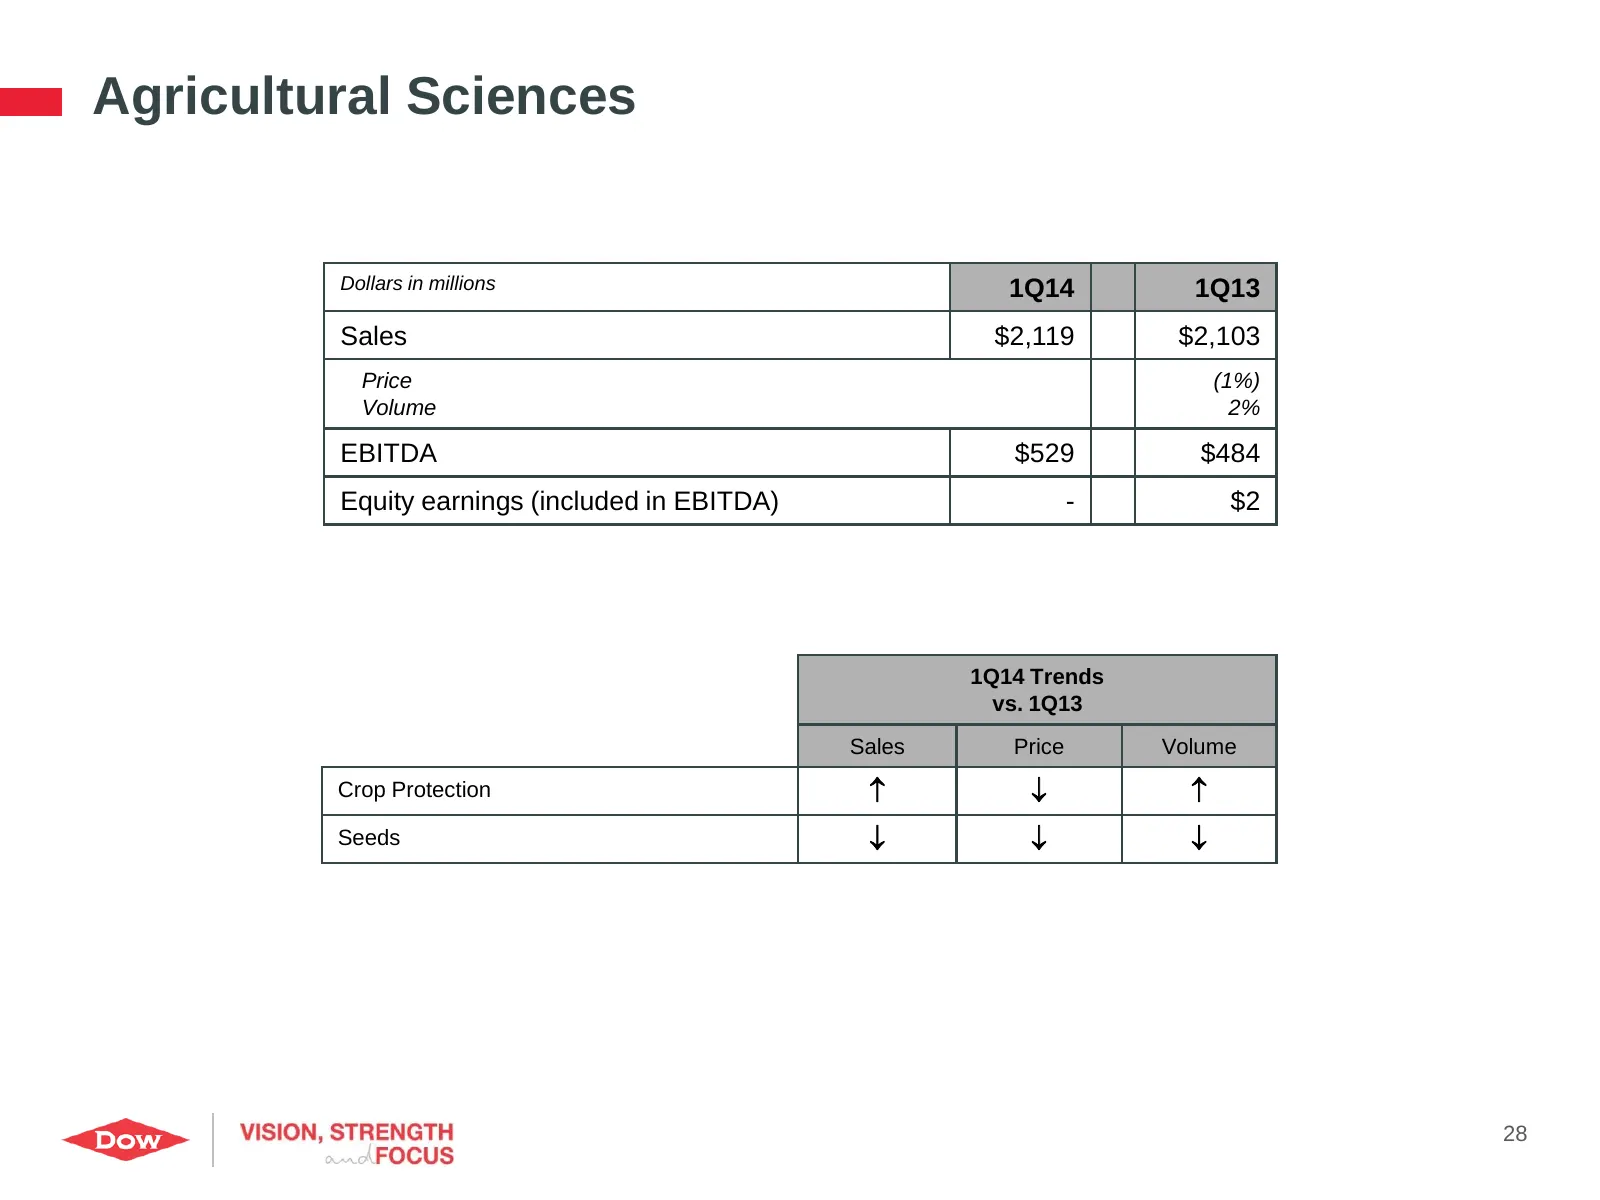
Agricultural Sciences Dollars in millions 1Q14 1Q13 Sales $2,119 $2,103 Price (1%) Volume 2% EBITDA $529 $484 Equity earnings (included in EBITDA) - $2 1Q14 Trends vs. 1Q13 Sales Price Volume Crop Protection Seeds 28
Slide 29: Performance Materials
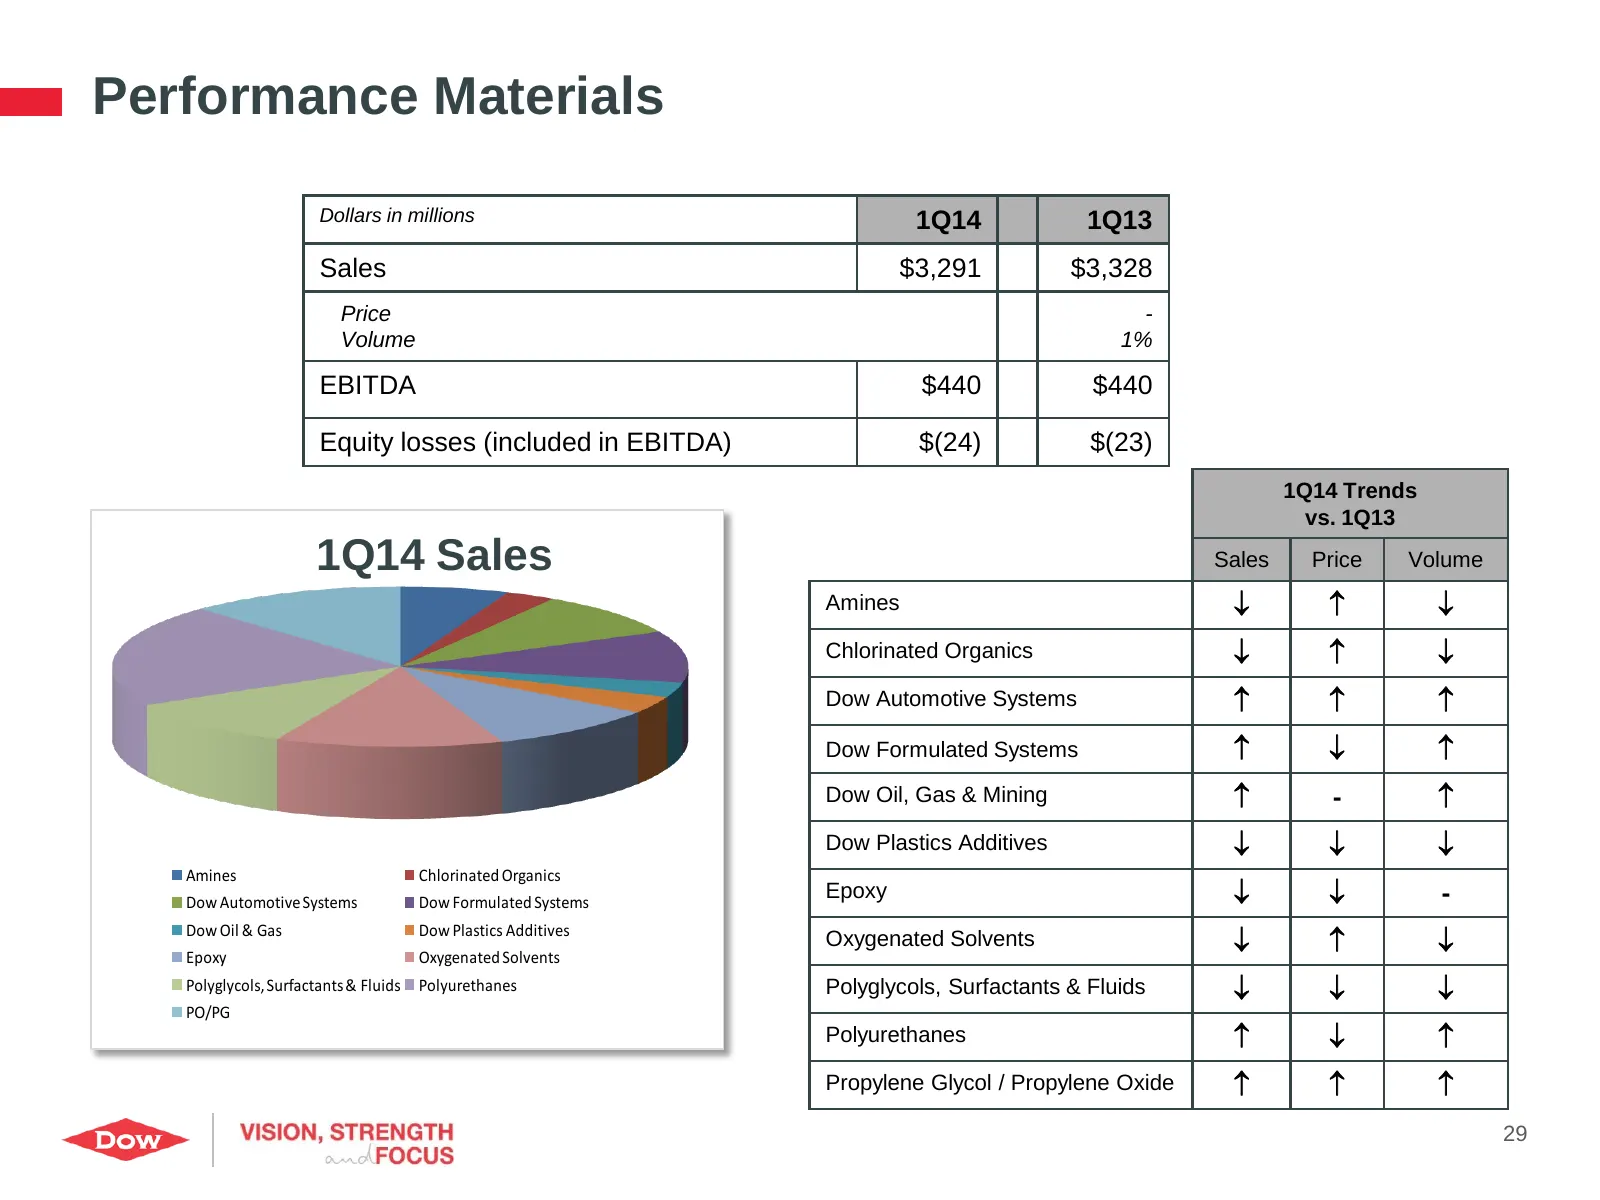
Performance Materials Dollars in millions 1Q14 1Q13 Sales $3,291 $3,328 Price - Volume 1% EBITDA $440 $440 Equity losses (included in EBITDA) $(24) $(23) 1Q14 Trends vs. 1Q13 1Q14 Sales Sales Price Volume Amines Chlorinated Organics Dow Automotive Systems Dow Formulated Systems
Slide 30: Performance Plastics
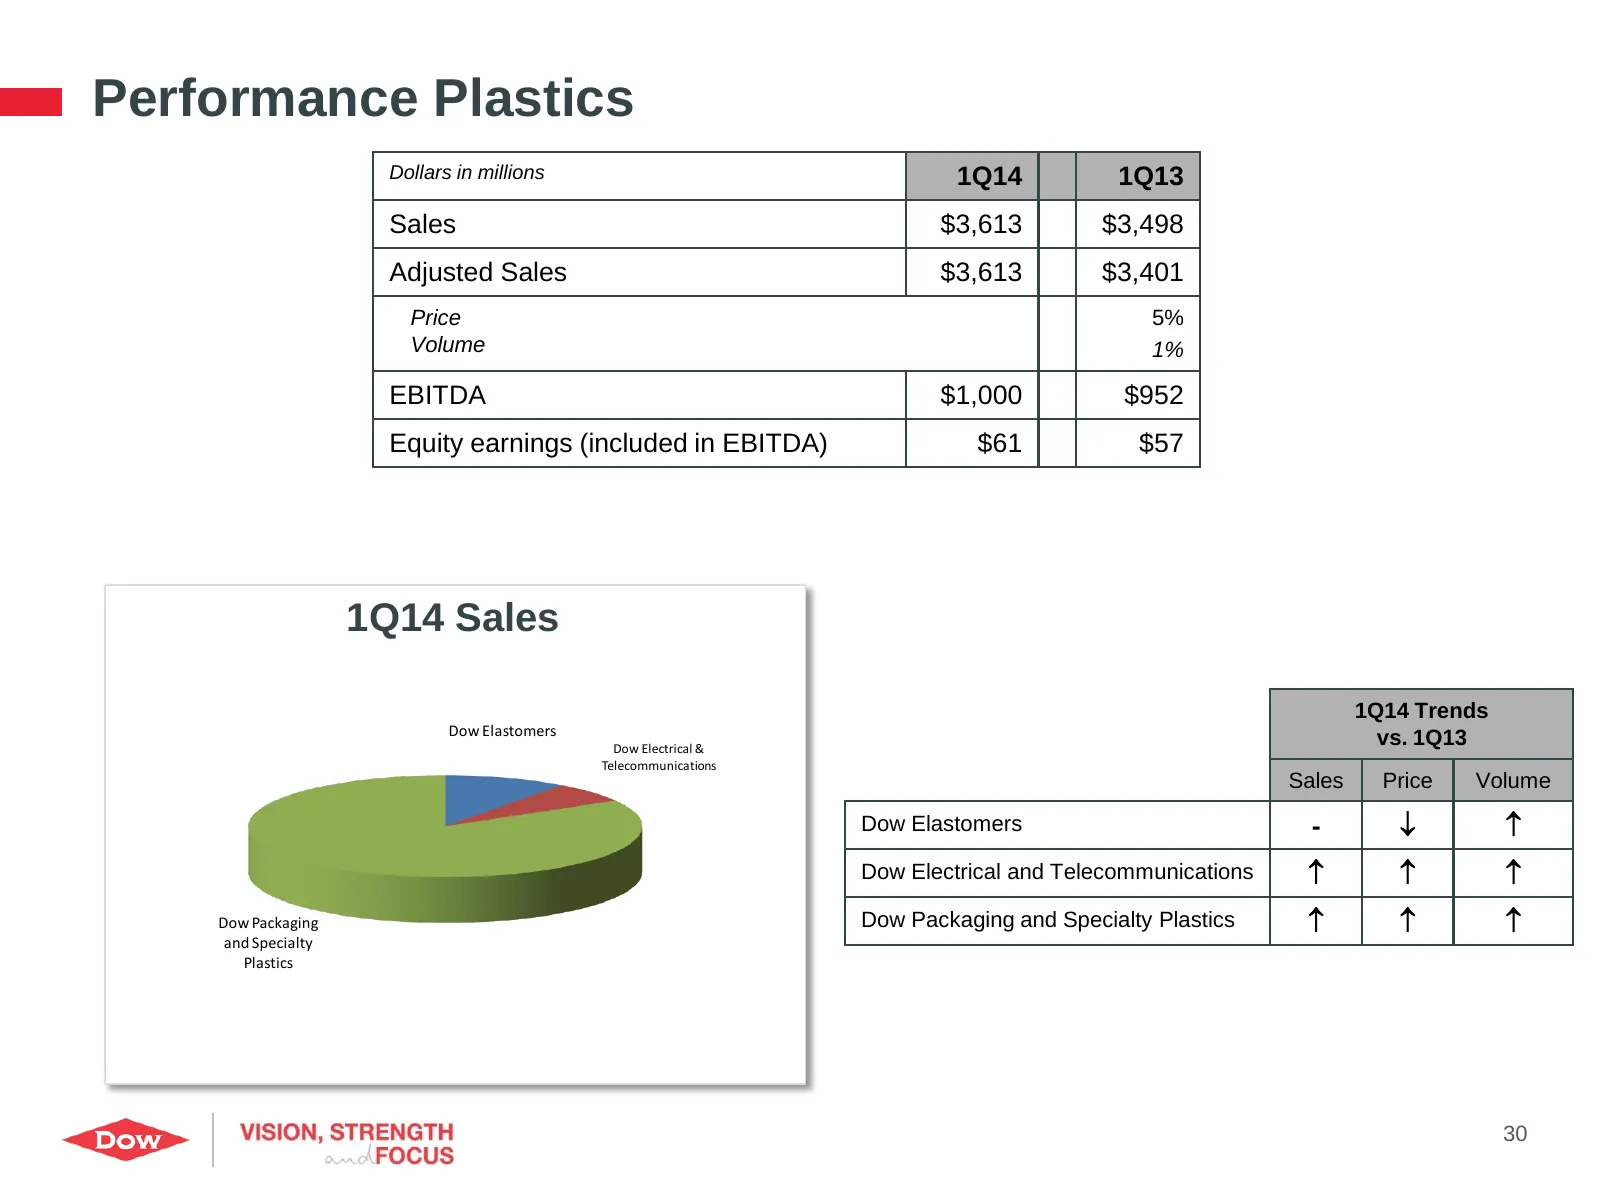
Performance Plastics Dollars in millions 1Q14 1Q13 Sales $3,613 $3,498 Adjusted Sales $3,613 $3,401 Price 5% Volume 1% EBITDA $1,000 $952 Equity earnings (included in EBITDA) $61 $57 1Q14 Sales 1Q14 Trends Dow Elastomers Dow Electrical & vs. 1Q13 Telecommunications Sales Price Volume Dow Elastomers
Slide 31: Feedstocks and Energy
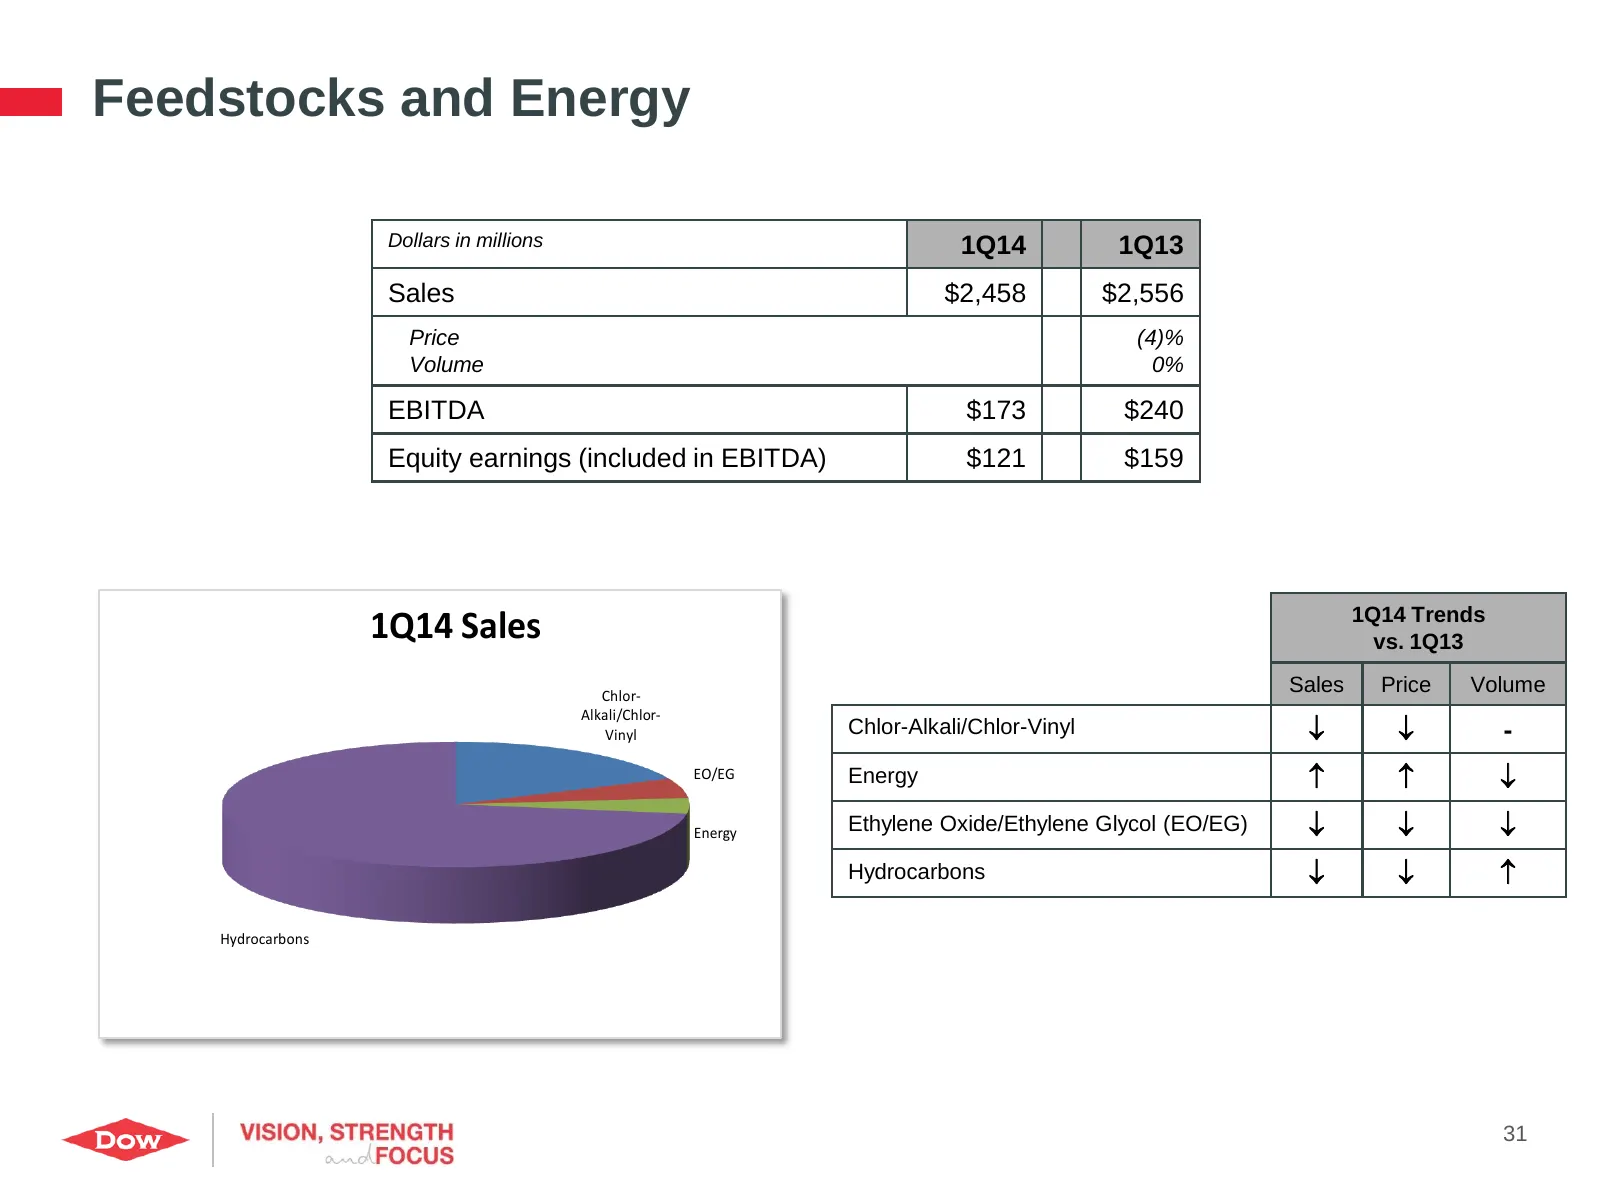
Feedstocks and Energy Dollars in millions 1Q14 1Q13 Sales $2,458 $2,556 Price (4)% Volume 0% EBITDA $173 $240 Equity earnings (included in EBITDA) $121 $159 1Q14 Trends 1Q14 Sales vs. 1Q13 Chlor- Sales Price Volume Alkali/Chlor- Vinyl Chlor-Alkali/Chlor-Vinyl - EO/EG Energy Energy Ethylene
Slide 32: Reconciliation of Non-GAAP Financial Measures
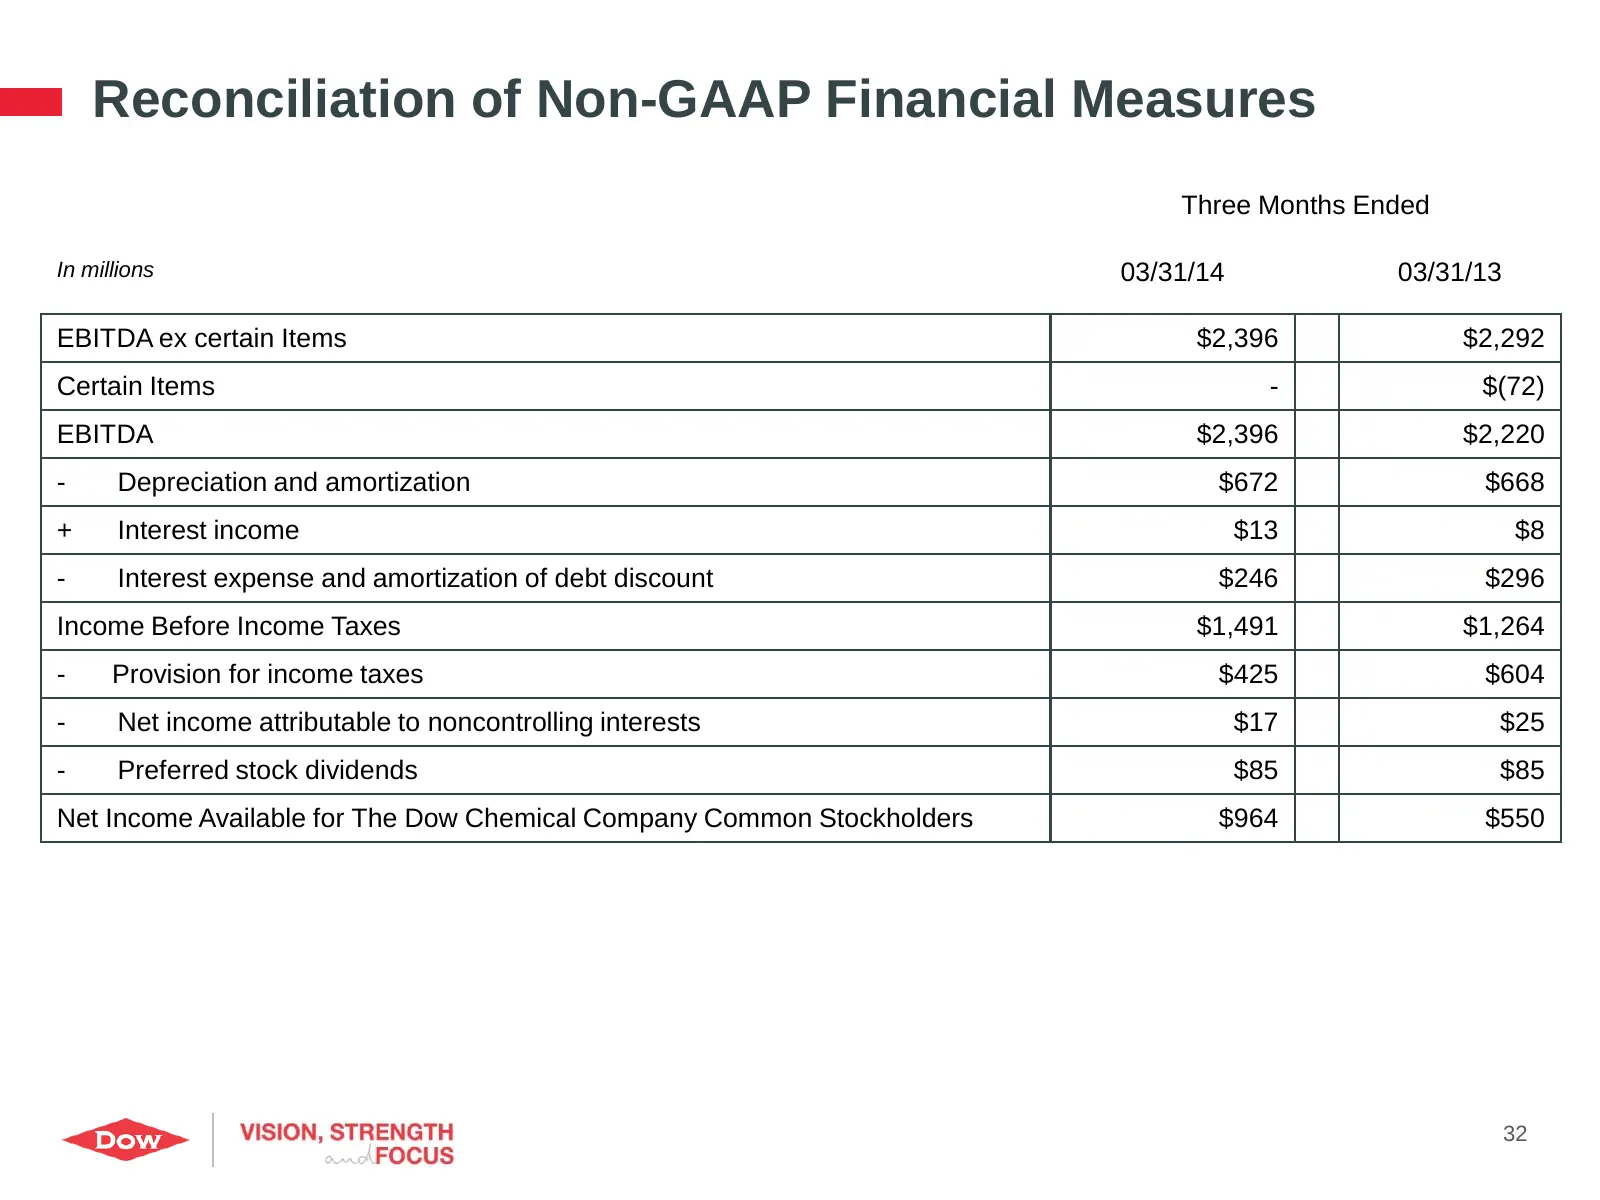
Reconciliation of Non-GAAP Financial Measures Three Months Ended In millions 03/31/14 03/31/13 EBITDA ex certain Items $2,396 $2,292 Certain Items - $(72) EBITDA $2,396 $2,220 - Depreciation and amortization $672 $668 + Interest income $13 $8 - Interest expense and amortization of debt discount $246
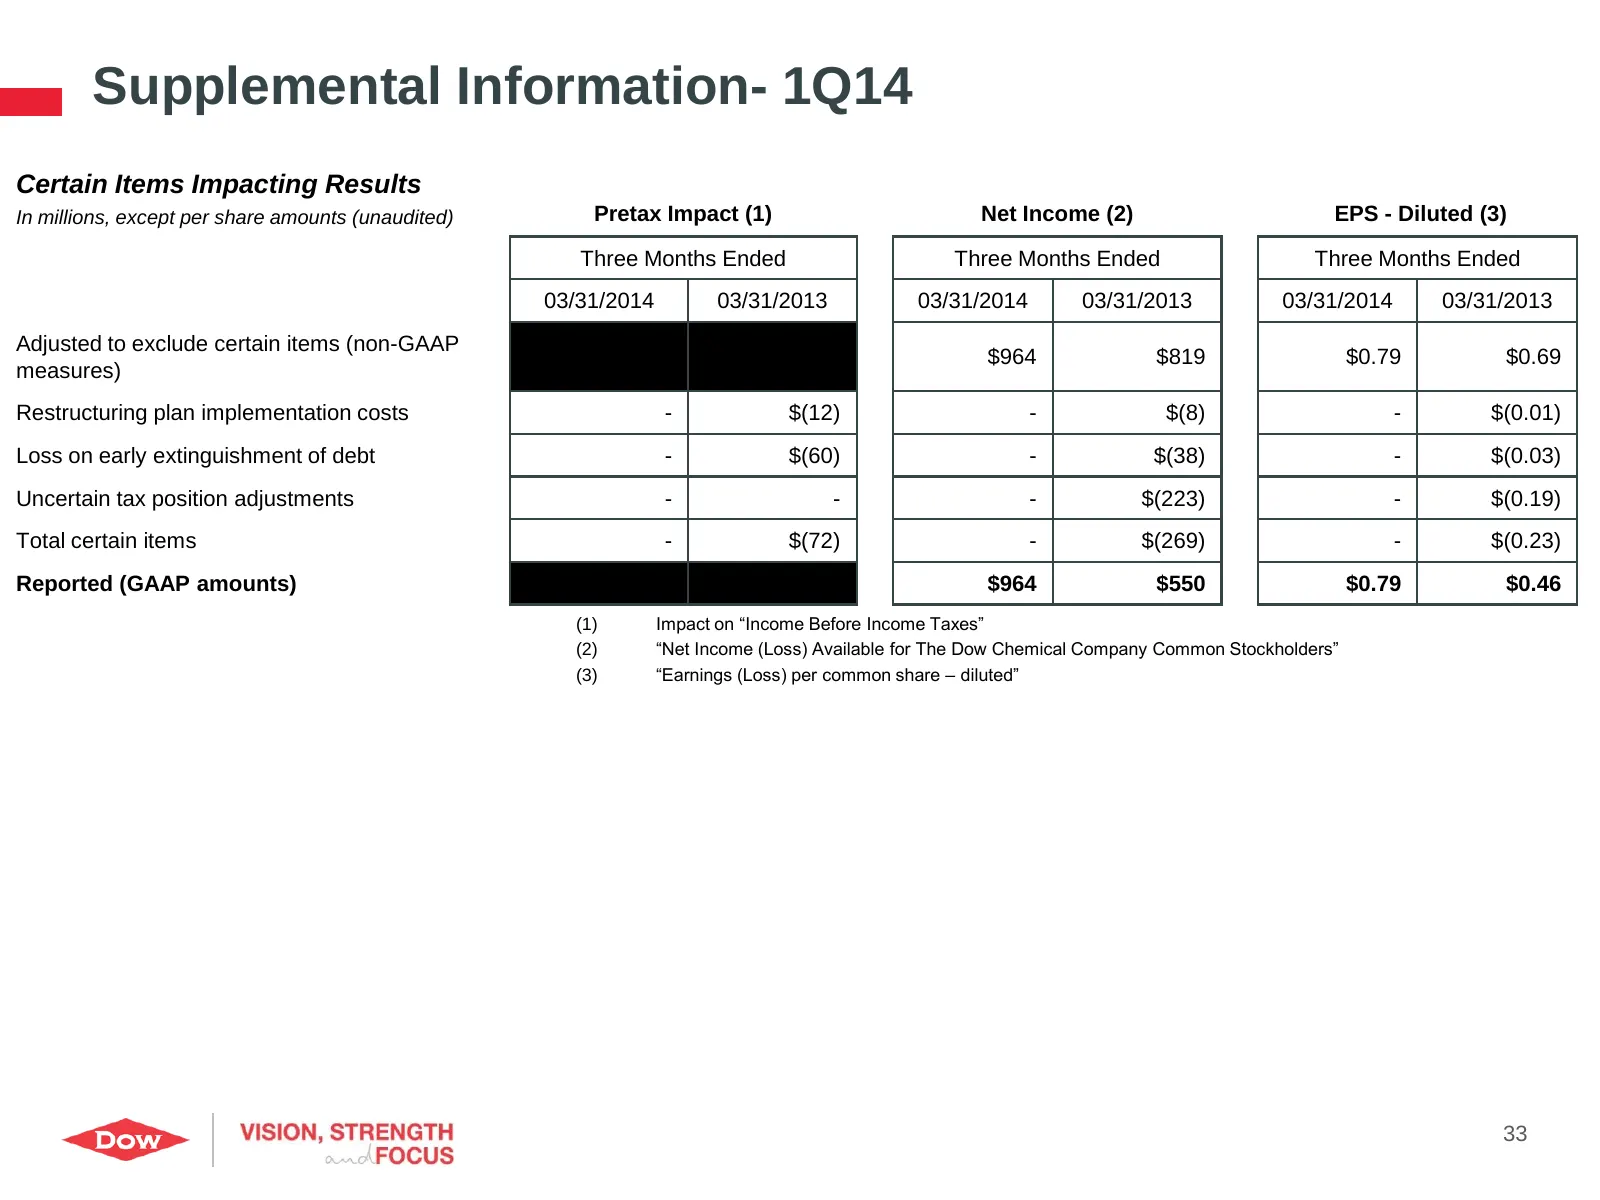
Slide 33: Supplemental Information- 1Q14
Supplemental Information- 1Q14 Certain Items Impacting Results In millions, except per share amounts (unaudited) Pretax Impact (1) Net Income (2) EPS - Diluted (3) Three Months Ended Three Months Ended Three Months Ended 03/31/2014 03/31/2013 03/31/2014 03/31/2013 03/31/2014 03/31/2013 Adjusted to e
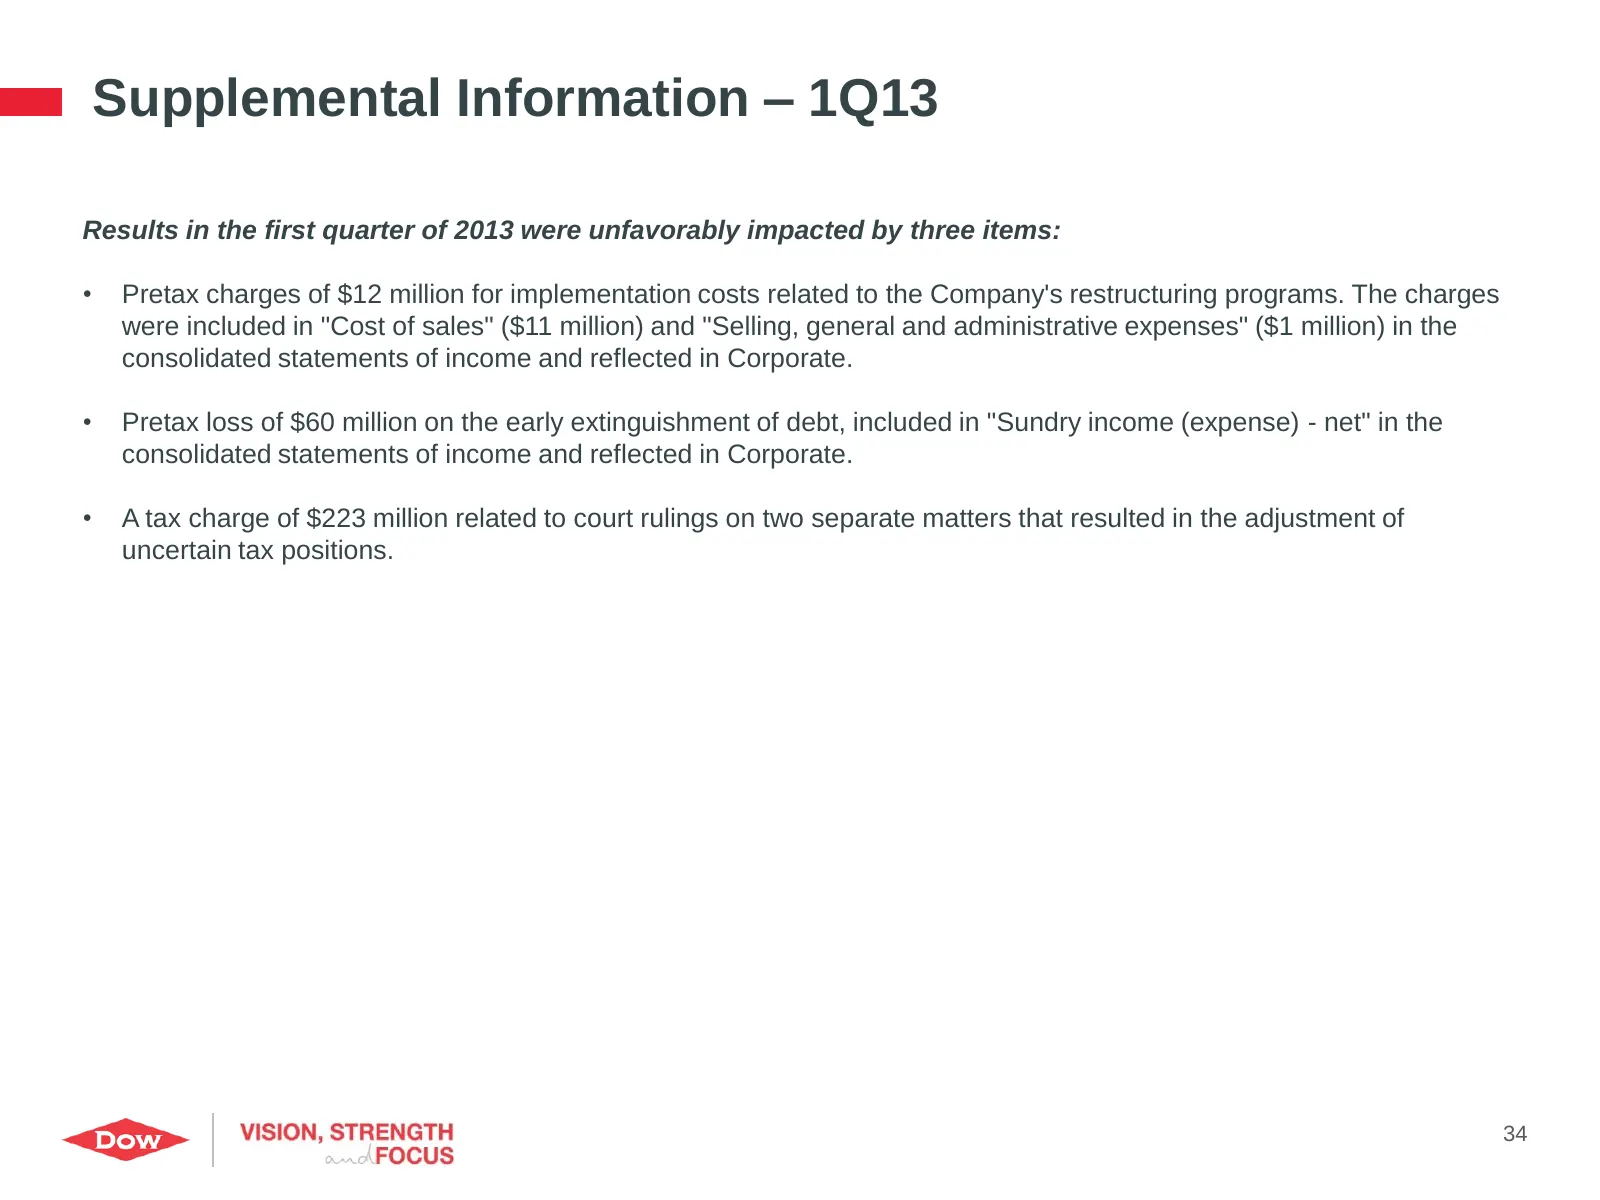
Slide 34: Supplemental Information – 1Q13
Supplemental Information – 1Q13 Results in the first quarter of 2013 were unfavorably impacted by three items: • Pretax charges of $12 million for implementation costs related to the Company's restructuring programs. The charges were included in "Cost of sales" ($11 million) and "Selling, general an
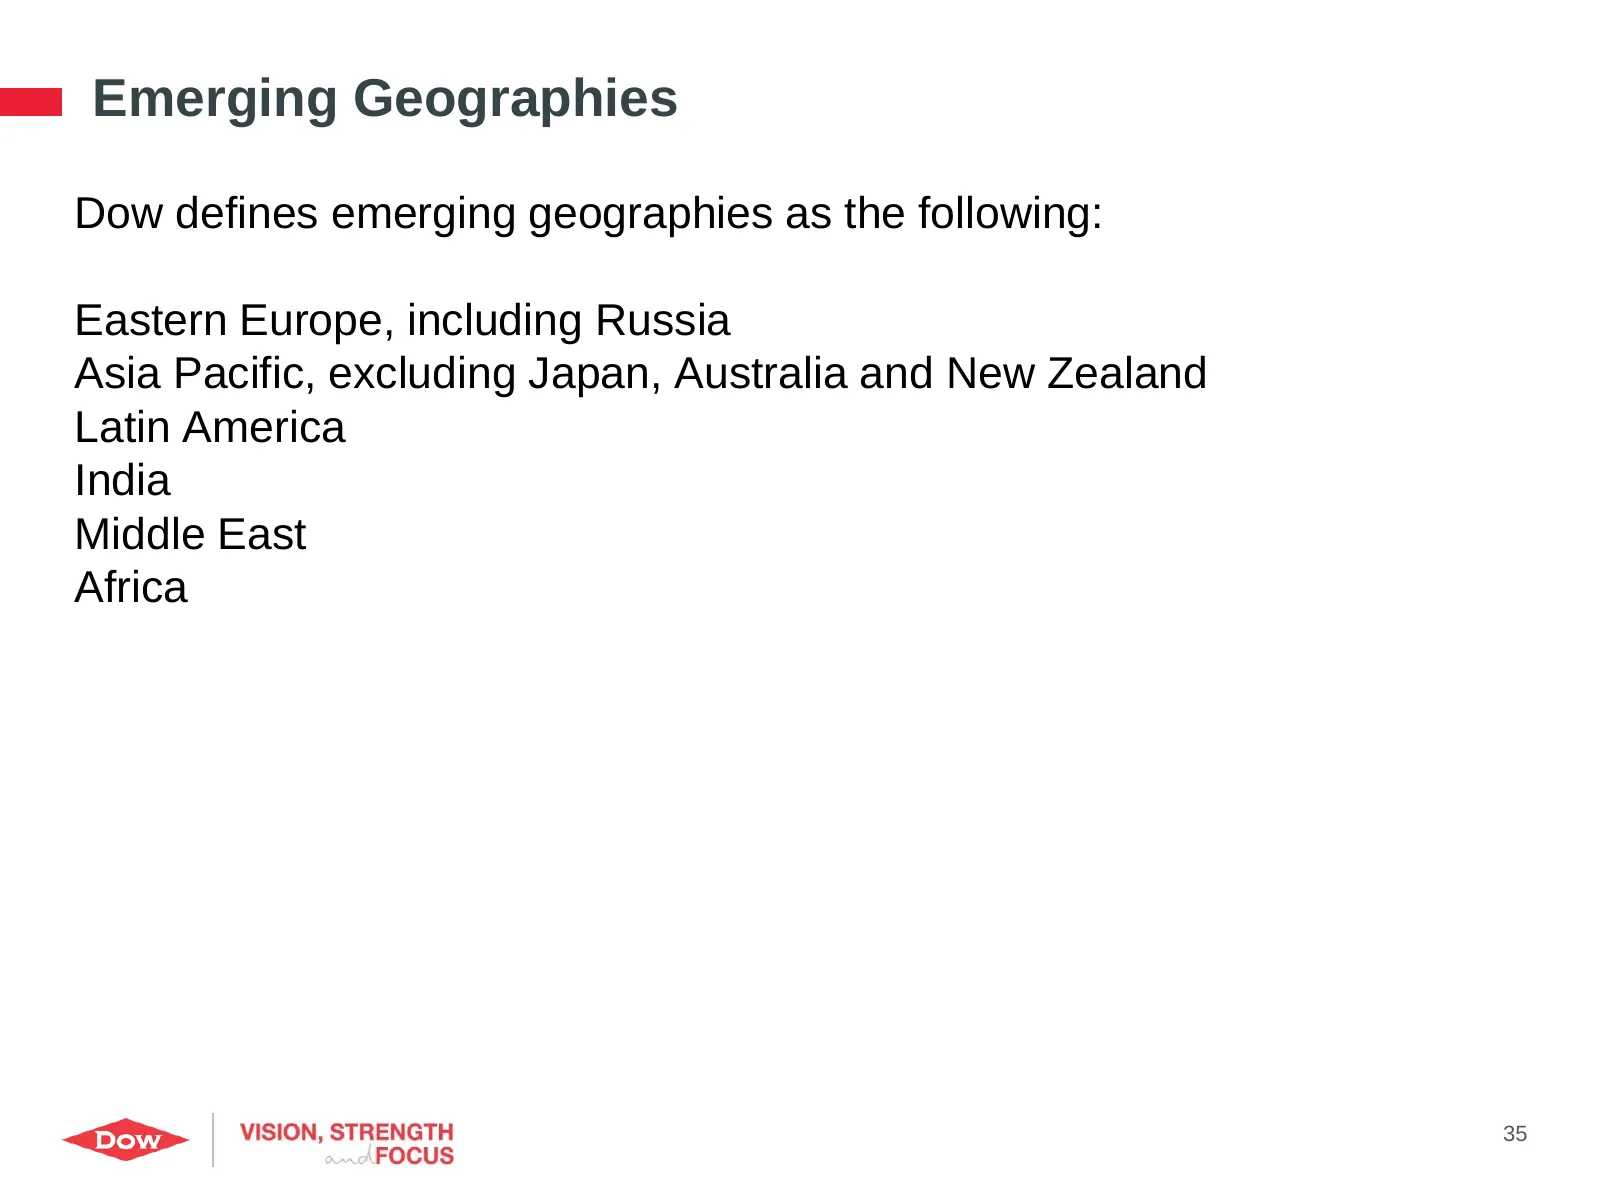
Slide 35: Emerging Geographies
Emerging Geographies Dow defines emerging geographies as the following: Eastern Europe, including Russia Asia Pacific, excluding Japan, Australia and New Zealand Latin America India Middle East Africa 35
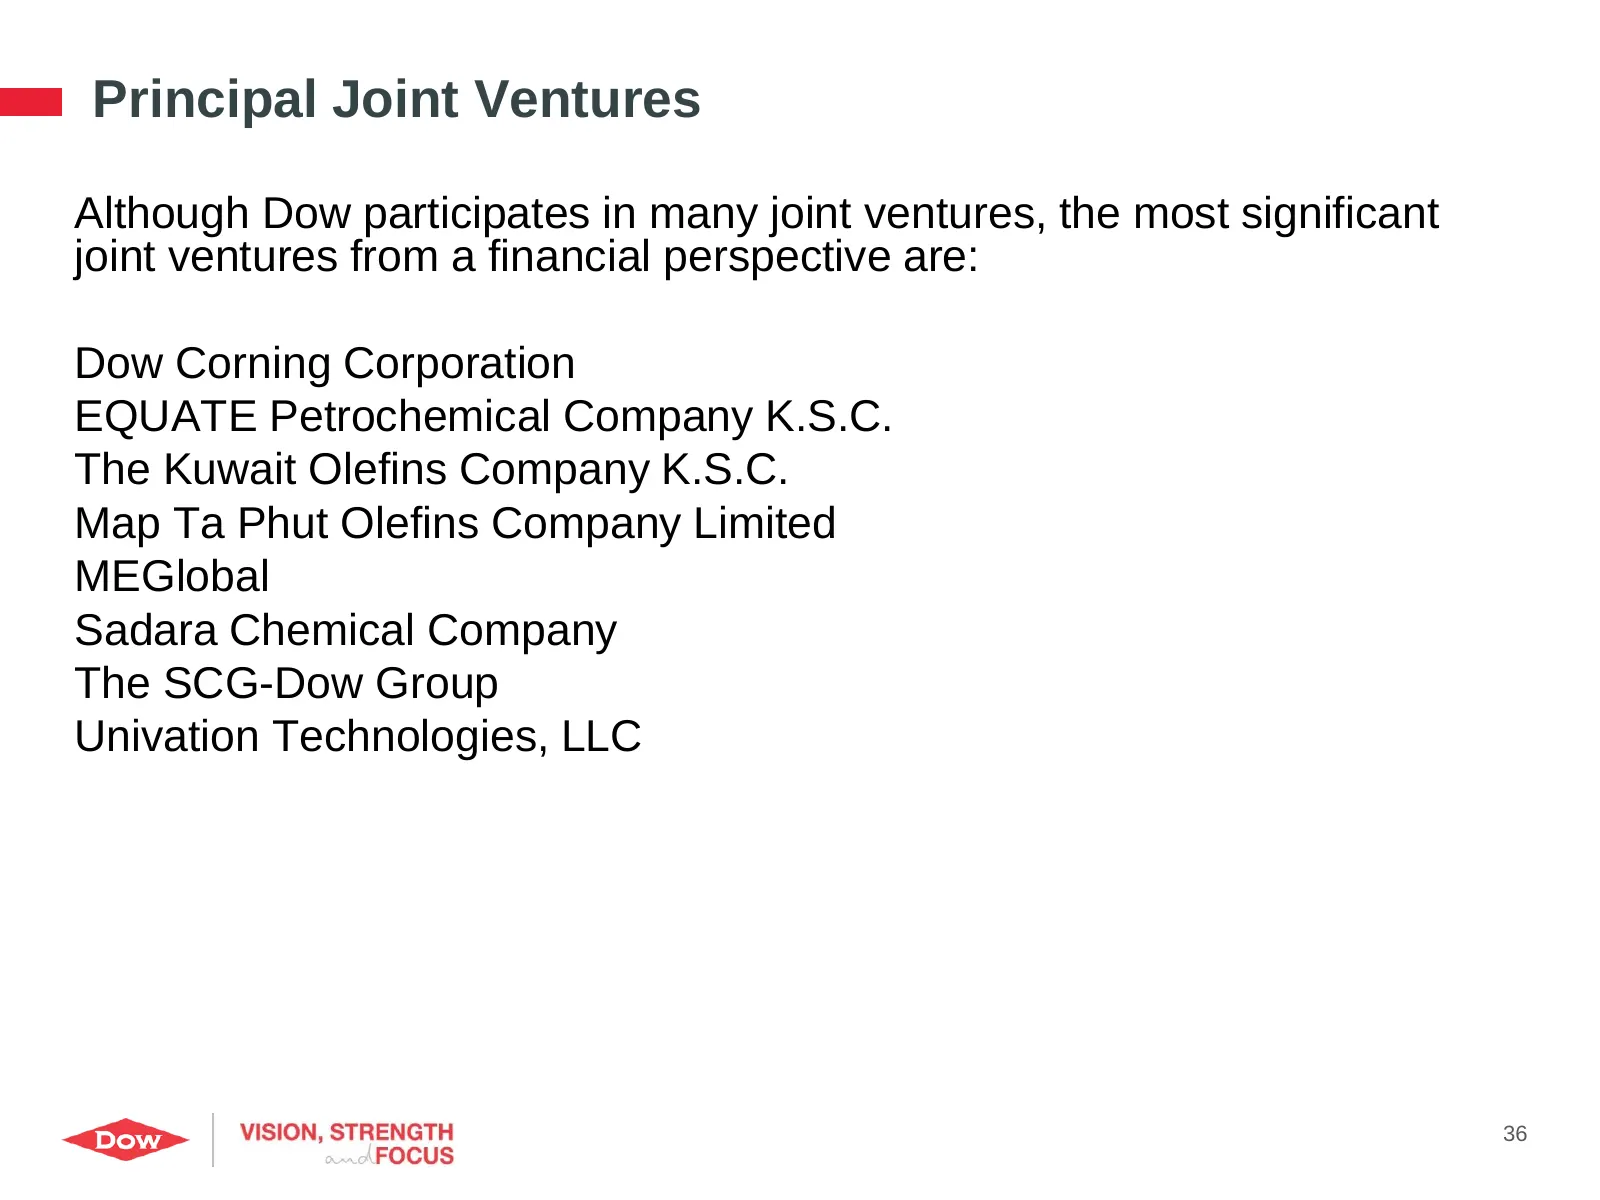
Slide 36: Principal Joint Ventures
Principal Joint Ventures Although Dow participates in many joint ventures, the most significant joint ventures from a financial perspective are: Dow Corning Corporation EQUATE Petrochemical Company K.S.C. The Kuwait Olefins Company K.S.C. Map Ta Phut Olefins Company Limited MEGlobal Sadara Chemical
Slide 37: Preliminary Results for Principal Joint Ventures
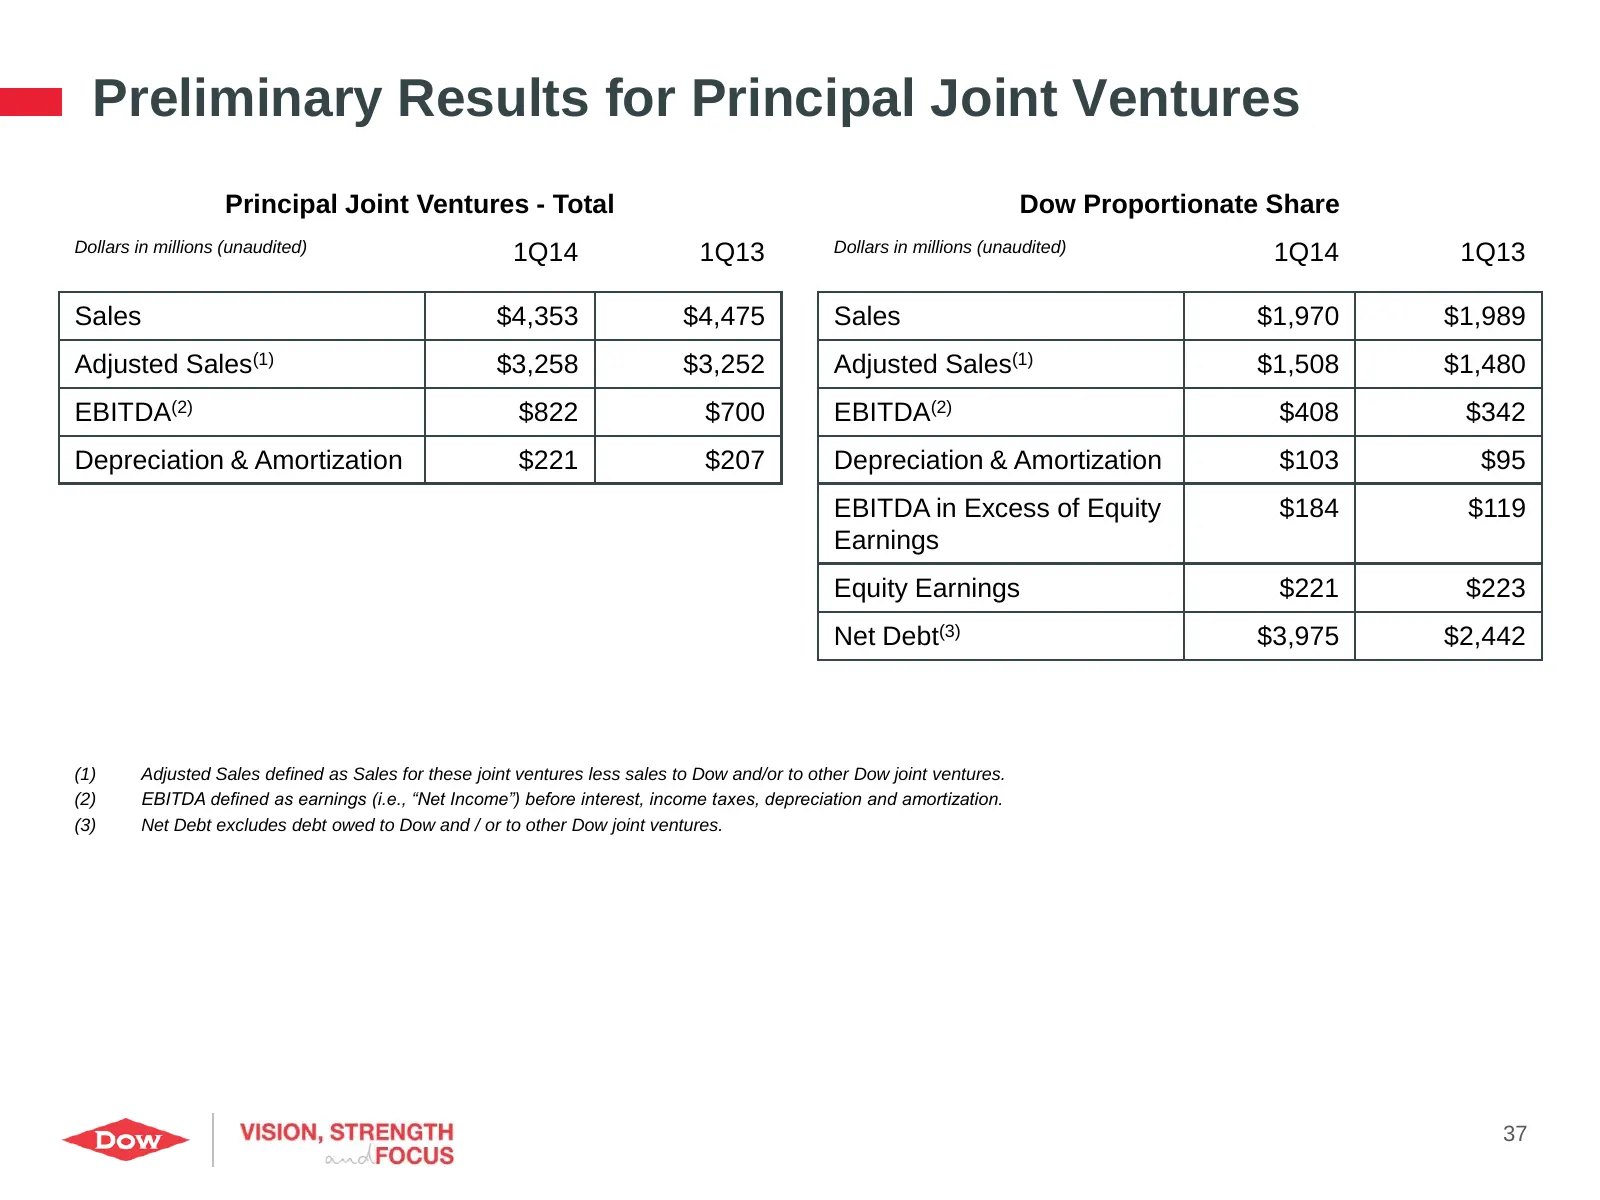
Preliminary Results for Principal Joint Ventures Principal Joint Ventures - Total Dow Proportionate Share Dollars in millions (unaudited) 1Q14 1Q13 Dollars in millions (unaudited) 1Q14 1Q13 Sales $4,353 $4,475 Sales $1,970 $1,989 Adjusted Sales(1) $3,258 $3,252 Adjusted Sales(1) $1,508 $1,480 EBITDA
Slide 38: Reconciliation of Equity Earnings
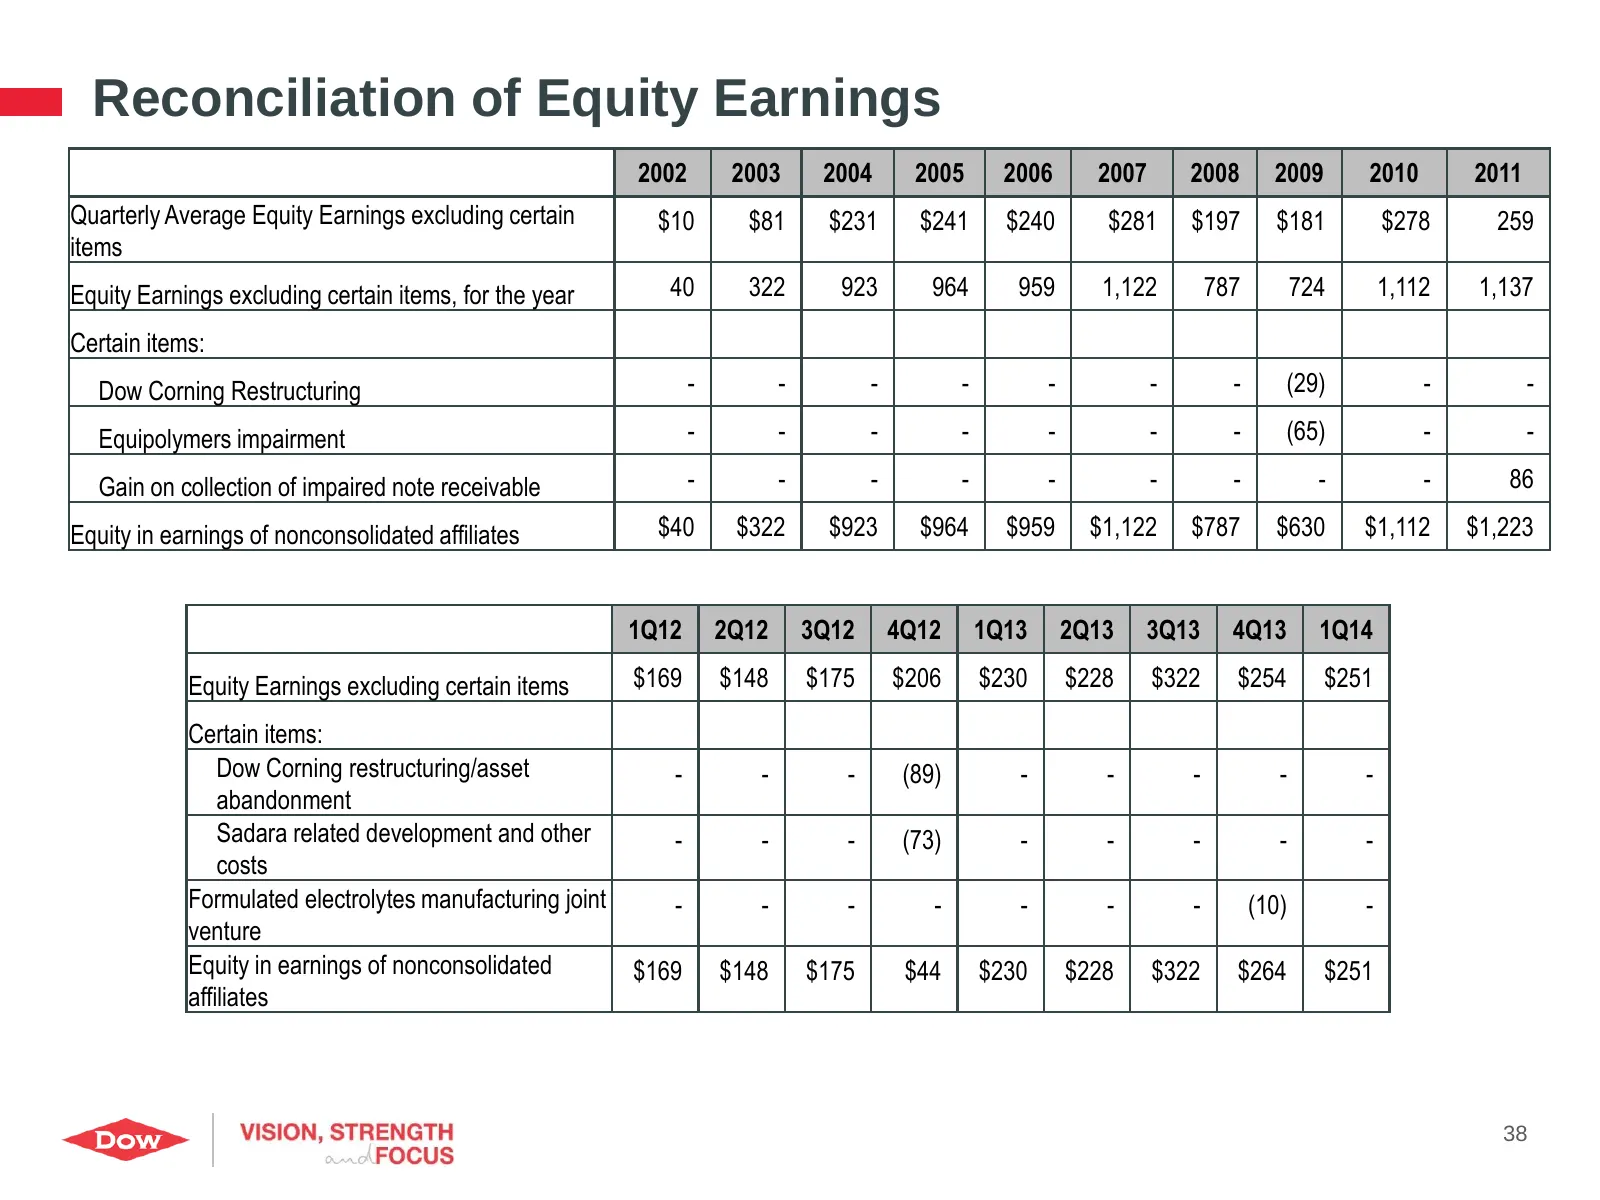
Reconciliation of Equity Earnings 2002 2003 2004 2005 2006 2007 2008 2009 2010 2011 Quarterly Average Equity Earnings excluding certain $10 $81 $231 $241 $240 $281 $197 $181 $278 259 items Equity Earnings excluding certain items, for the year 40 322 923 964 959 1,122 787 724 1,112 1,137 Certain item
Slide 39: Global Operating Rates as a Percent of Capacity
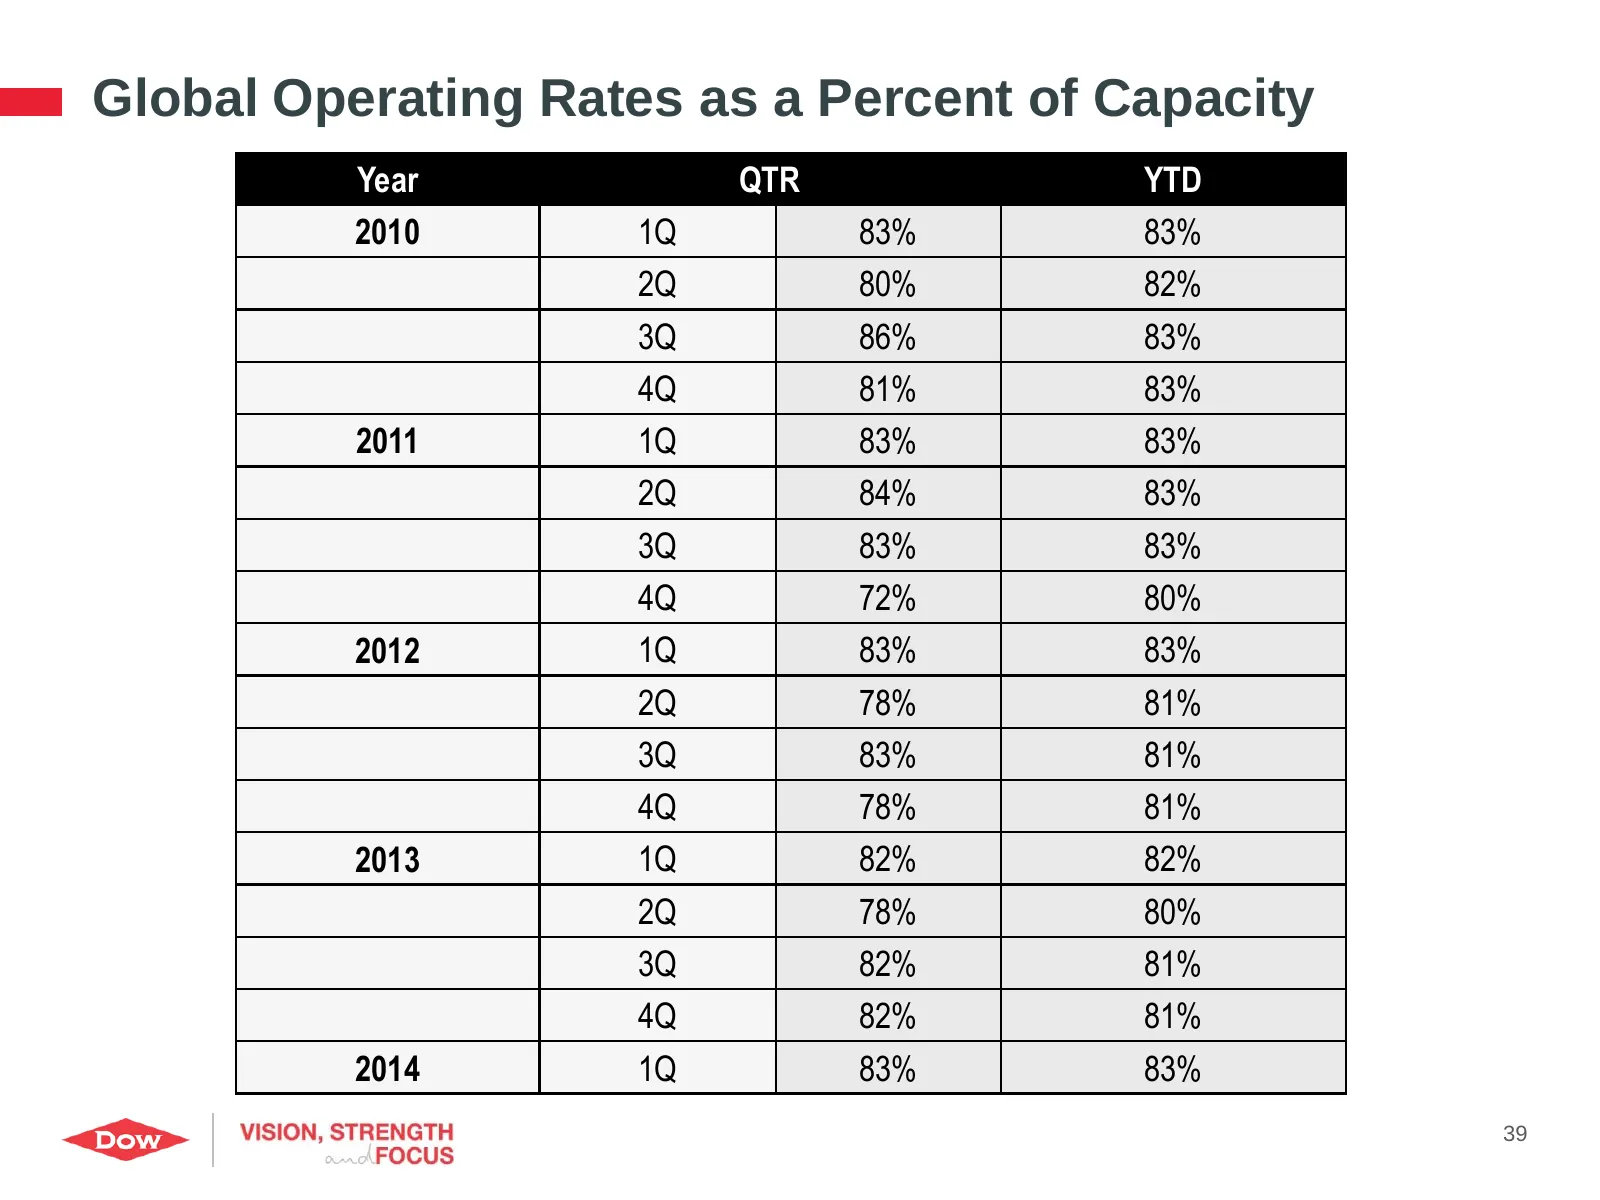
Global Operating Rates as a Percent of Capacity Year QTR YTD 2010 1Q 83% 83% 2Q 80% 82% 3Q 86% 83% 4Q 81% 83% 2011 1Q 83% 83% 2Q 84% 83% 3Q 83% 83% 4Q 72% 80% 2012 1Q 83% 83% 2Q 78% 81% 3Q 83% 81% 4Q 78% 81% 2013 1Q 82% 82% 2Q 78% 80% 3Q 82% 81% 4Q 82% 81% 2014 1Q 83% 83% 39
Slide 40
Source: Internet Archive copy of dow.com
More decks from The Dow Chemical Company
 Technical Presentation (September 2021)31 slides · September 2021
 Q2 2017 Earnings Presentation34 slides · Jul 27, 2017
 Q2 2016 Earnings Presentation30 slides · Jul 28, 2016
 Merger or Acquisition (March 2016)27 slides · Mar 2, 2016
 Merger or Acquisition (March 2016)27 slides · Mar 1, 2016
 Q4 2015 Earnings Presentation6 slides · Feb 3, 2016