Durr AG · XETR:DUE
Durr — H1 2010 Earnings Presentation
34 slides from Durr's earnings presentation, Aug 5, 2010
Slide 1: Welcome to the conference call: Results January - June 2010
Welcome to the conference call Dürr AG Results January - June 2010 Dürr Group Ralf Dieter, CEO Ralph Heuwing, CFO Bietigheim-Bissingen, August 5, 2010
Slide 2: Disclaimer
Disclaimer This presentation has been prepared independently by Dürr AG (“Dürr”). The presentation contains statements which address such key issues as Dürr´s strategy, future financial results, market positions and product development. Such statements should be carefully considered, and it should b
Slide 3: Agenda
Agenda H1 Figures China Refinancing Summary Dürr AG © CCI, Conference Call H1 2010, August 5, 2010 -3-
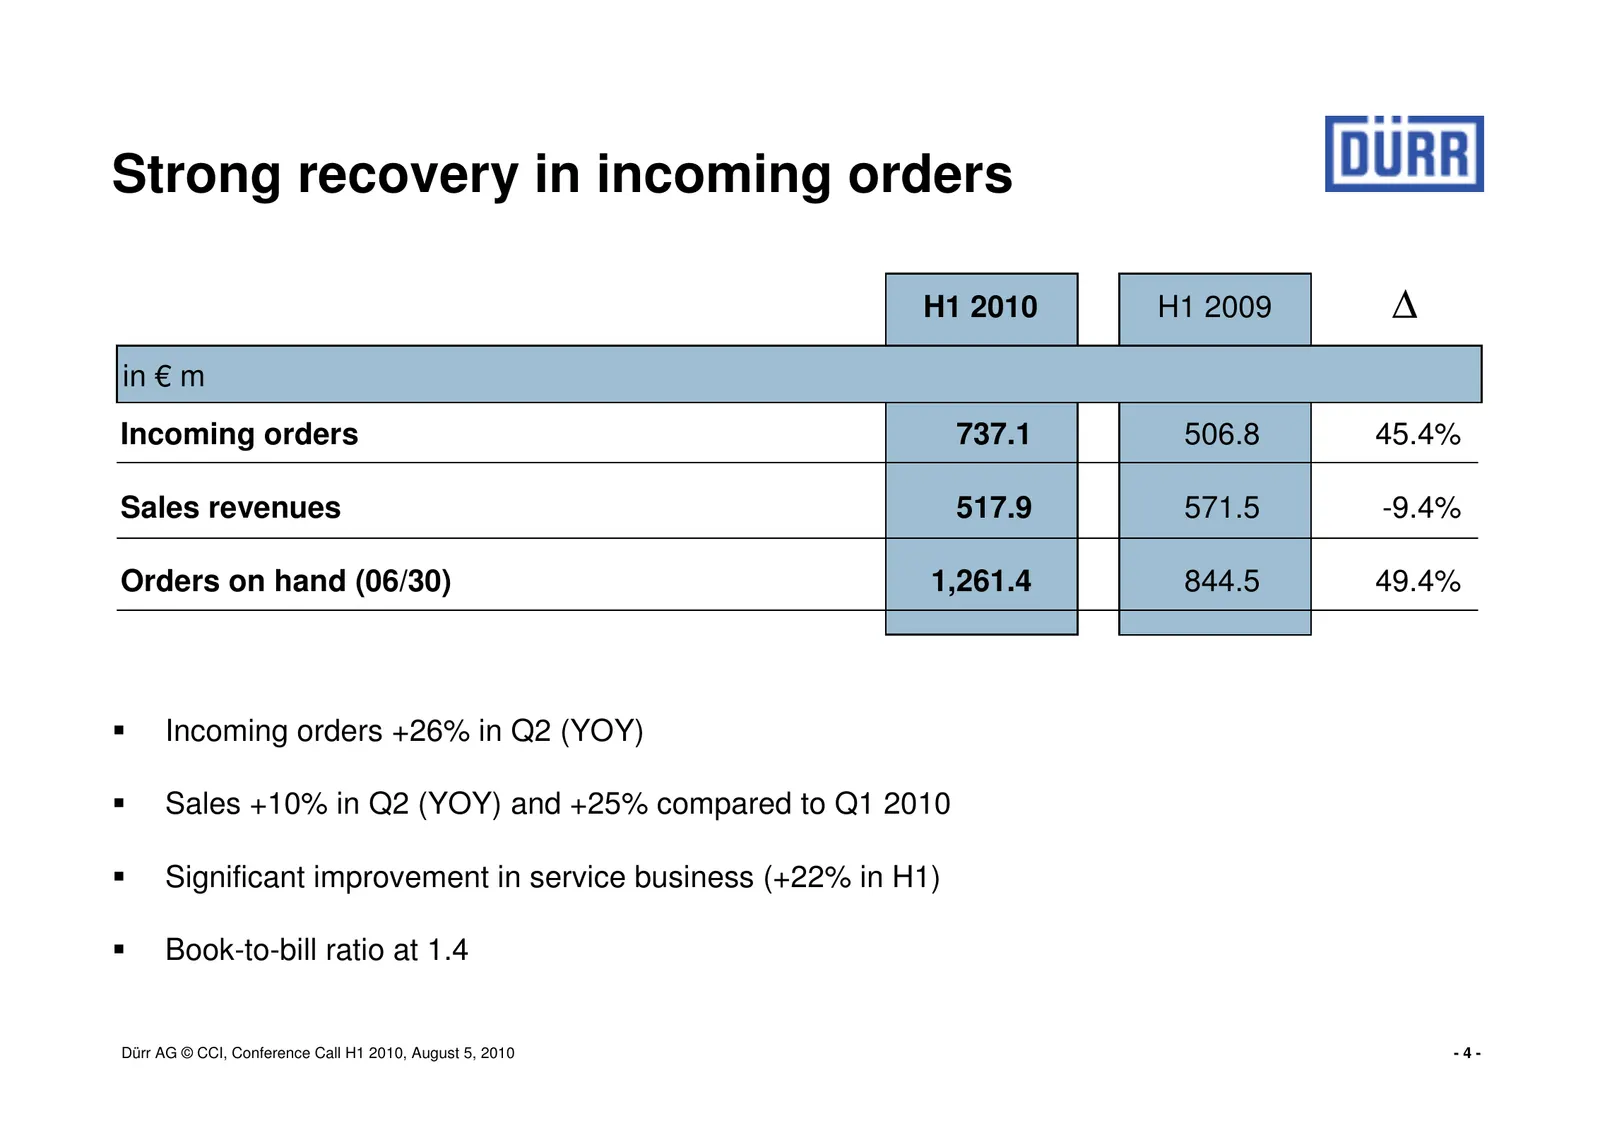
Slide 4: Strong recovery in incoming orders
Strong recovery in incoming orders H1 2010 H1 2009 ∆ in € m Incoming orders 737.1 506.8 45.4% Sales revenues 517.9 571.5 -9.4% Orders on hand (06/30) 1,261.4 844.5 49.4% Incoming orders +26% in Q2 (YOY) Sales +10% in Q2 (YOY) and +25% compared to Q1 2010 Significant improvement in service business (
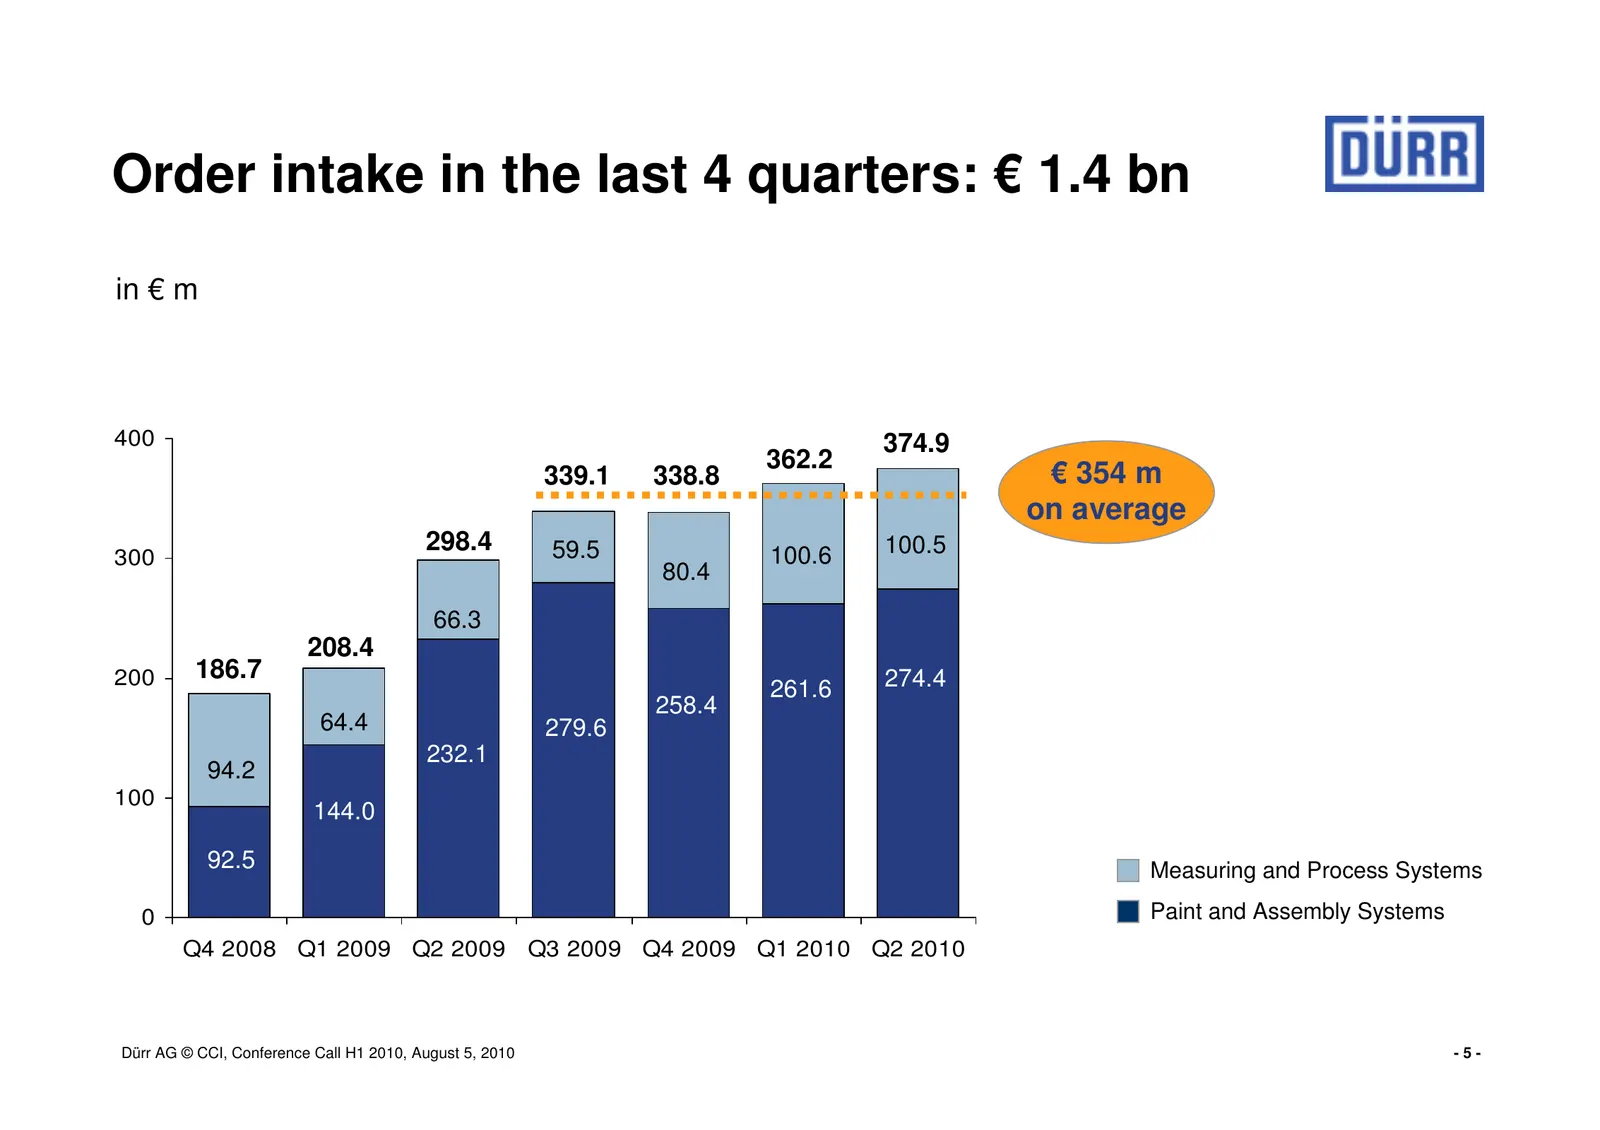
Slide 5: Order intake in the last 4 quarters: € 1.4 bn
Order intake in the last 4 quarters: € 1.4 bn in € m 400 374.9 362.2 339.1 338.8 € 354 m on average 298.4 59.5 100.6 100.5 300 80.4 66.3 208.4 200 186.7 274.4 261.6 258.4 64.4 279.6 232.1 94.2 100 144.0 92.5 Measuring and Process Systems 0 Paint and Assembly Systems Q4 2008 Q1 2009 Q2 2009 Q3 2009 Q
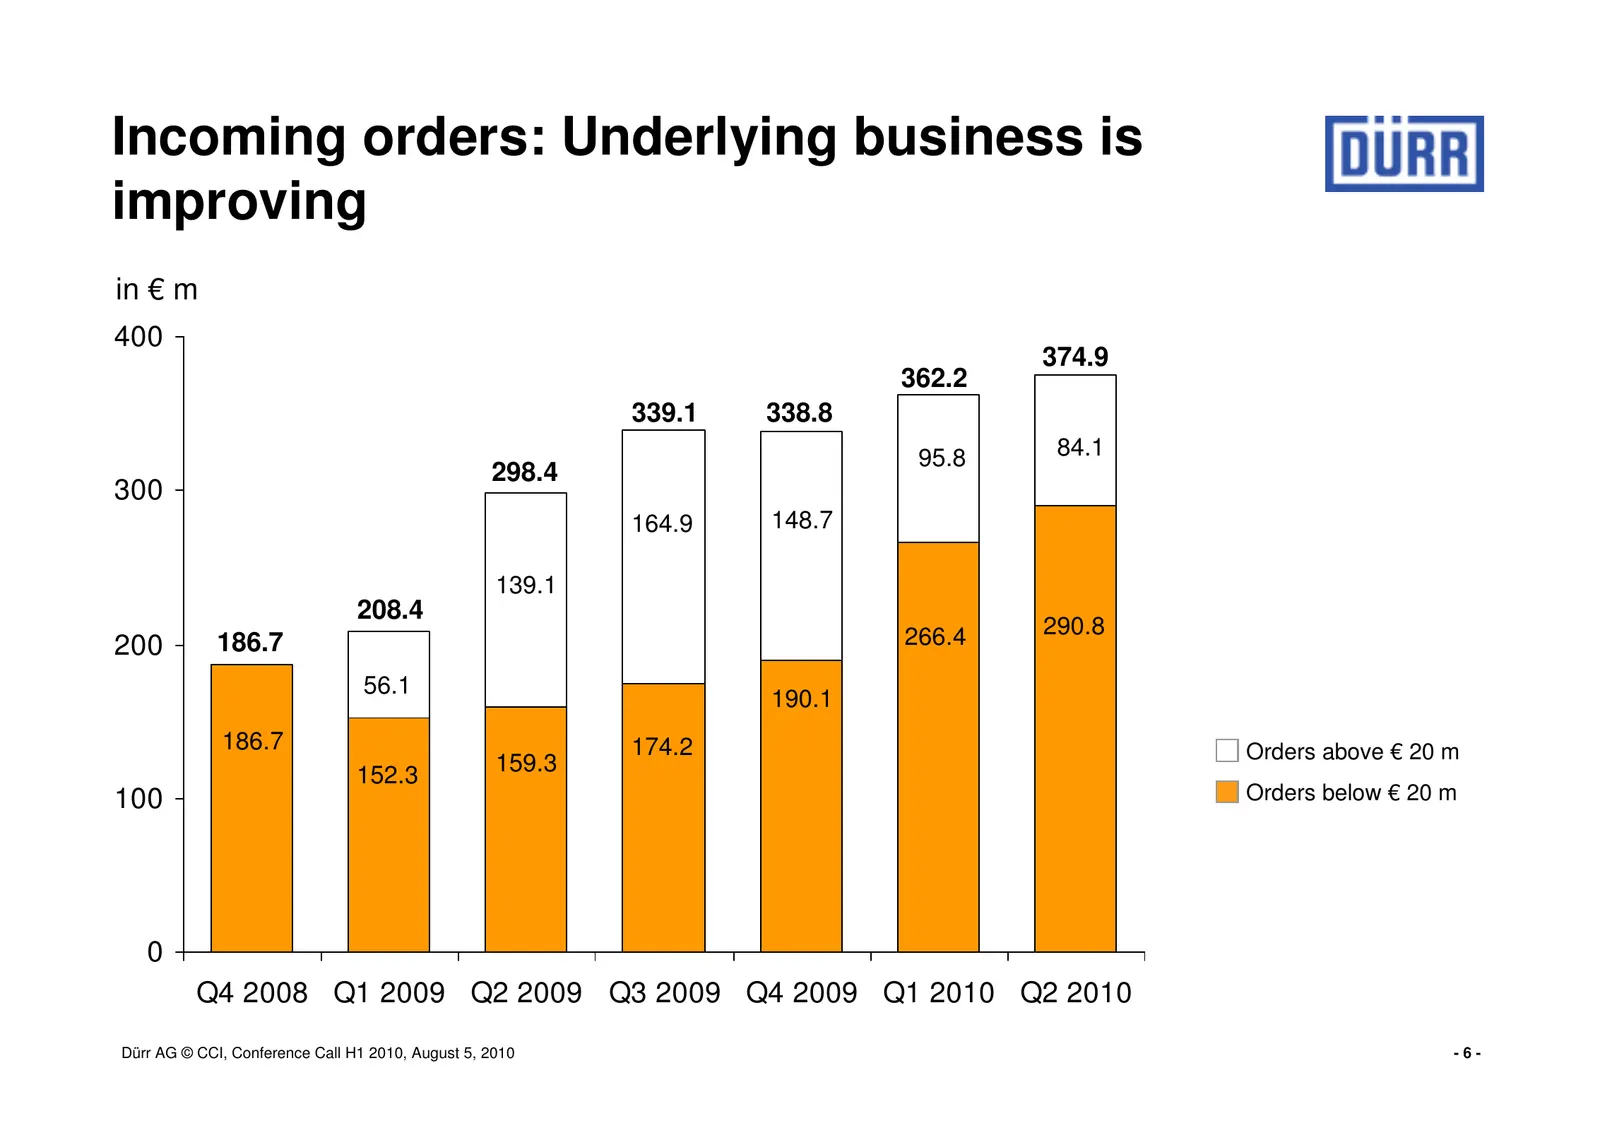
Slide 6: Incoming orders: Underlying business is improving
Incoming orders: Underlying business is improving in € m 400 374.9 362.2 339.1 338.8 95.8 84.1 298.4 300 164.9 148.7 139.1 208.4 266.4 290.8 200 186.7 56.1 190.1 186.7 174.2 Orders above € 20 m 152.3 159.3 100 Orders below € 20 m 0 Q4 2008 Q1 2009 Q2 2009 Q3 2009 Q4 2009 Q1 2010 Q2 2010 Dürr AG © CC
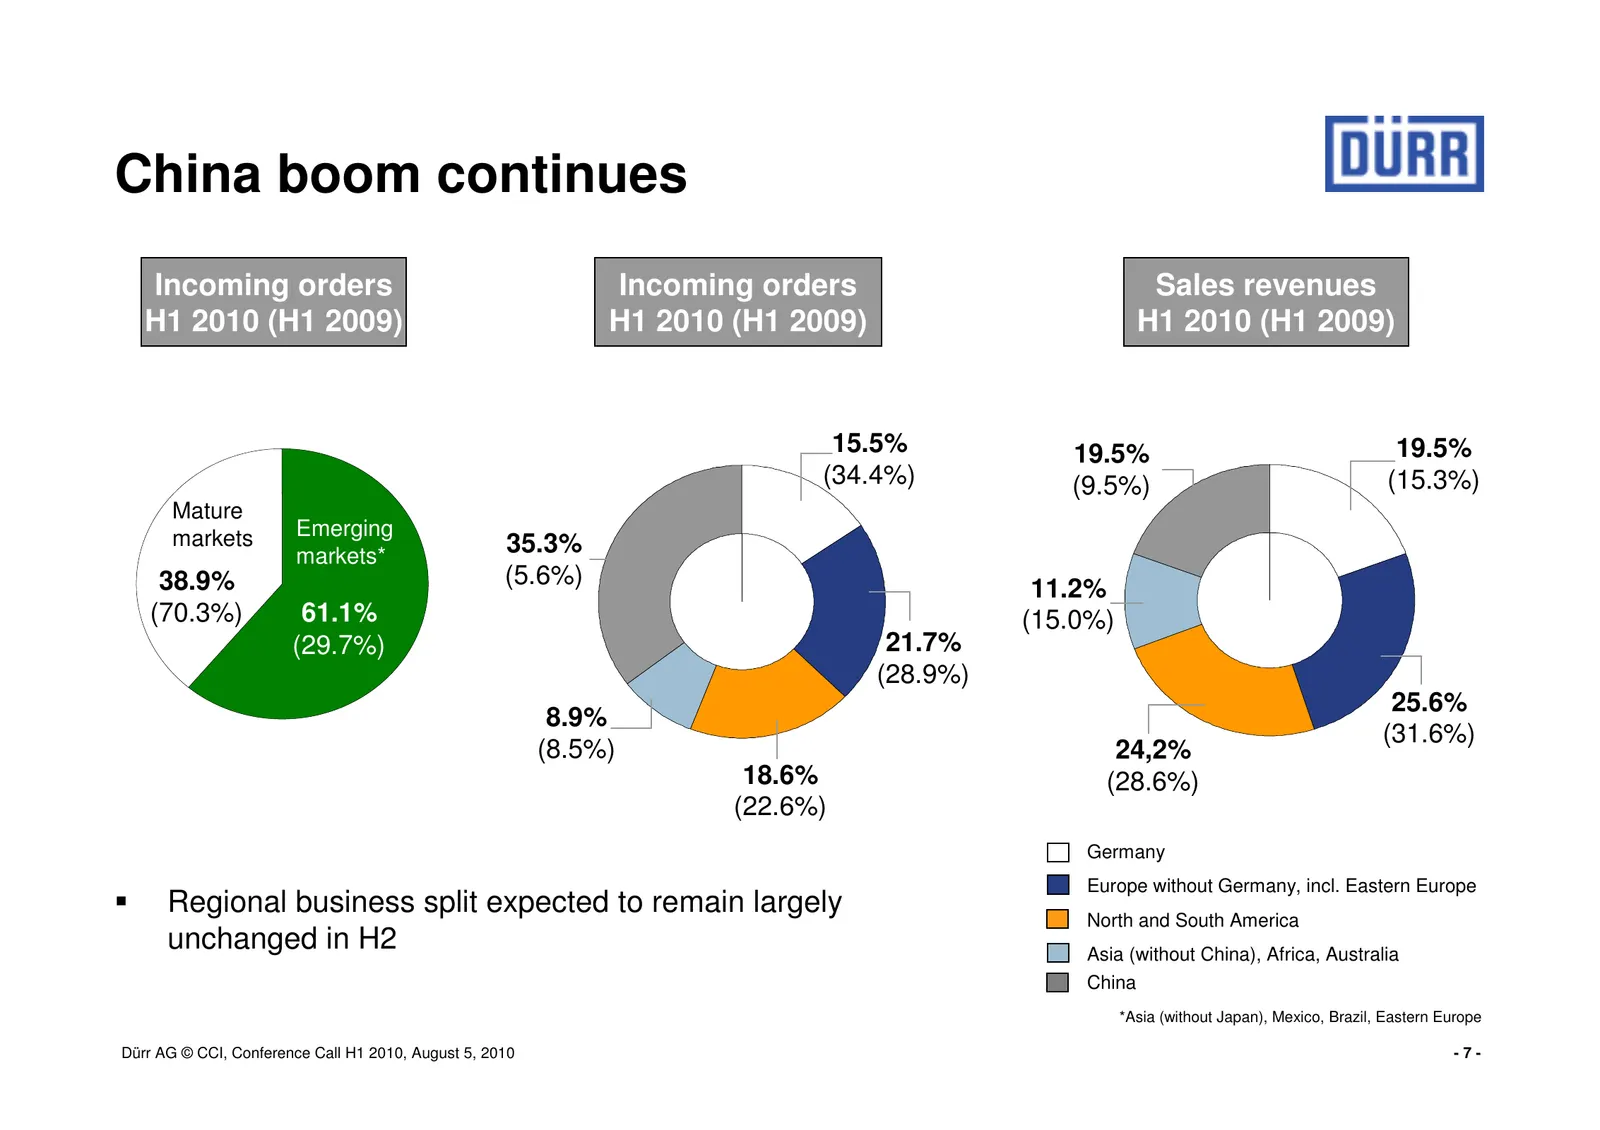
Slide 7: China boom continues
China boom continues Incoming orders Incoming orders Sales revenues H1 2010 (H1 2009) H1 2010 (H1 2009) H1 2010 (H1 2009) 15.5% 19.5% 19.5% (34.4%) (9.5%) (15.3%) Mature markets Emerging markets* 35.3% 38.9% (5.6%) 11.2% (70.3%) 61.1% (15.0%) (29.7%) 21.7% (28.9%) 25.6% 8.9% (31.6%) (8.5%) 24,2% 18.
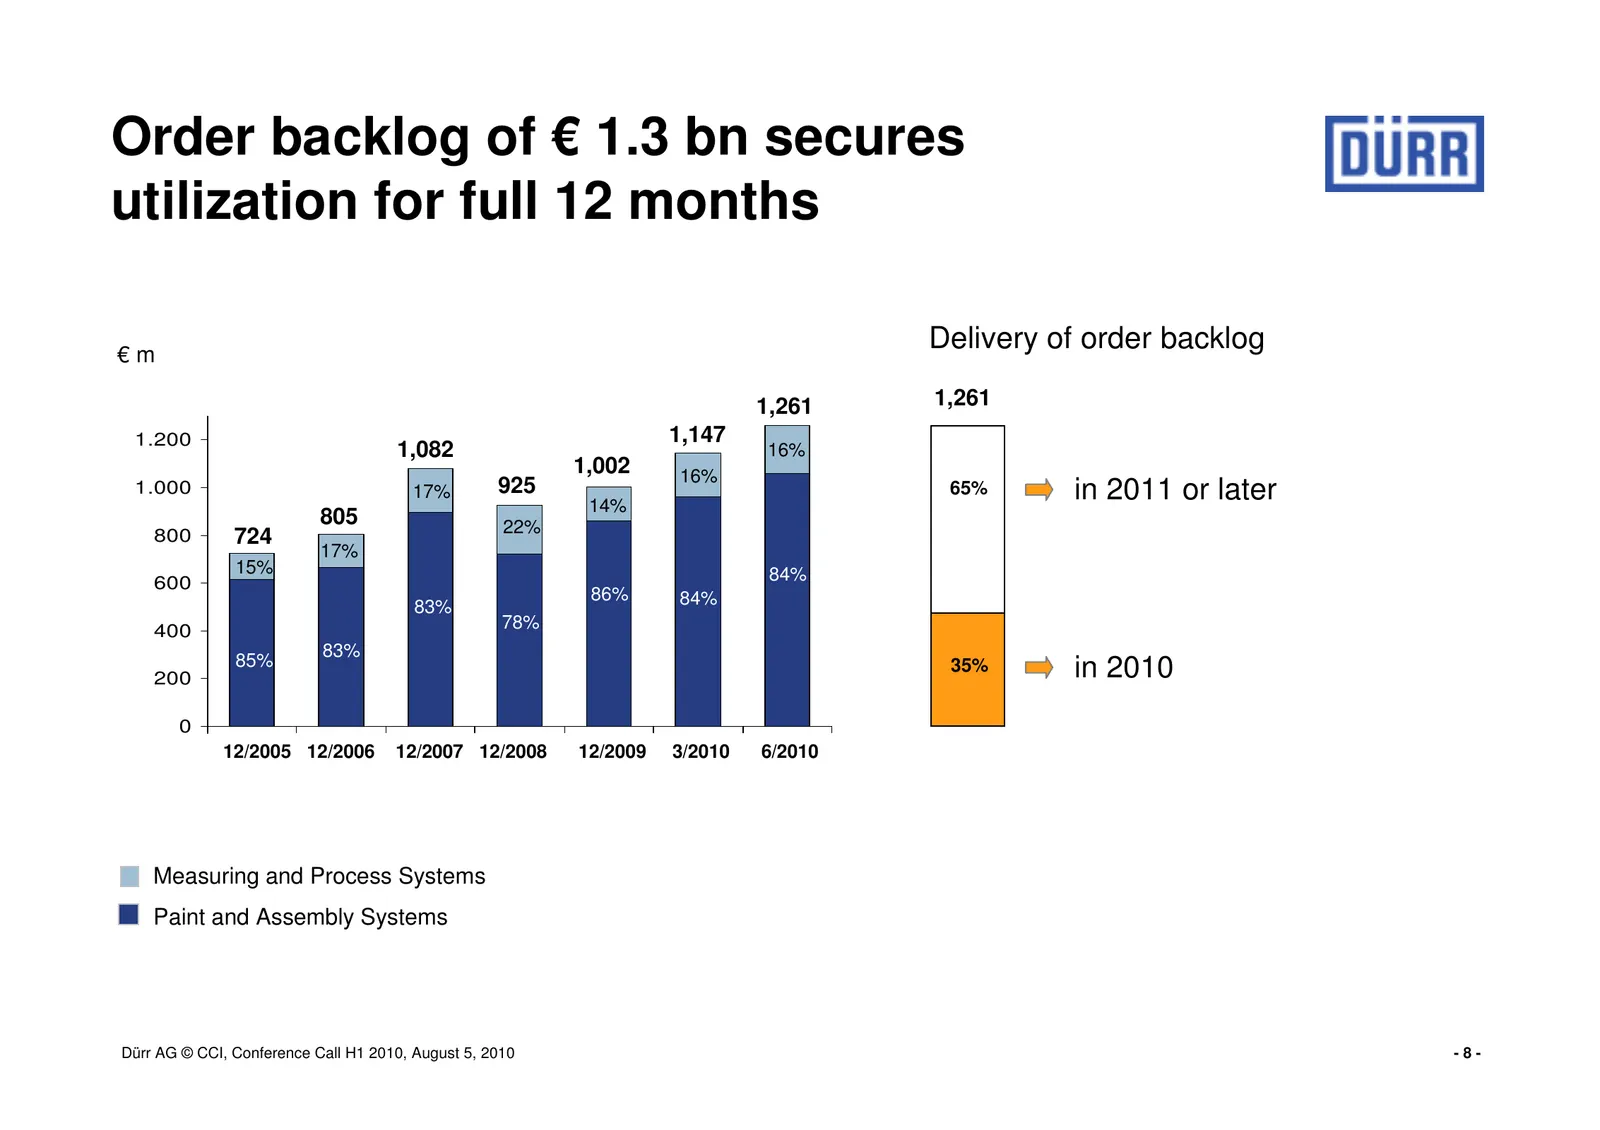
Slide 8: Order backlog of € 1.3 bn secures utilization for full 12 months
Order backlog of € 1.3 bn secures utilization for full 12 months €m Delivery of order backlog 1,261 1,261 1.200 1,147 1,082 16% 1,002 16% 1.000 17% 925 14% 65% in 2011 or later 805 22% 800 724 17% 15% 84% 600 86% 84% 83% 400 78% 85% 83% 200 35% in 2010 0 12/2005 2005 12/2006 2006 12/2007 2007 12/200
Slide 9: Strong earnings swing in Q2
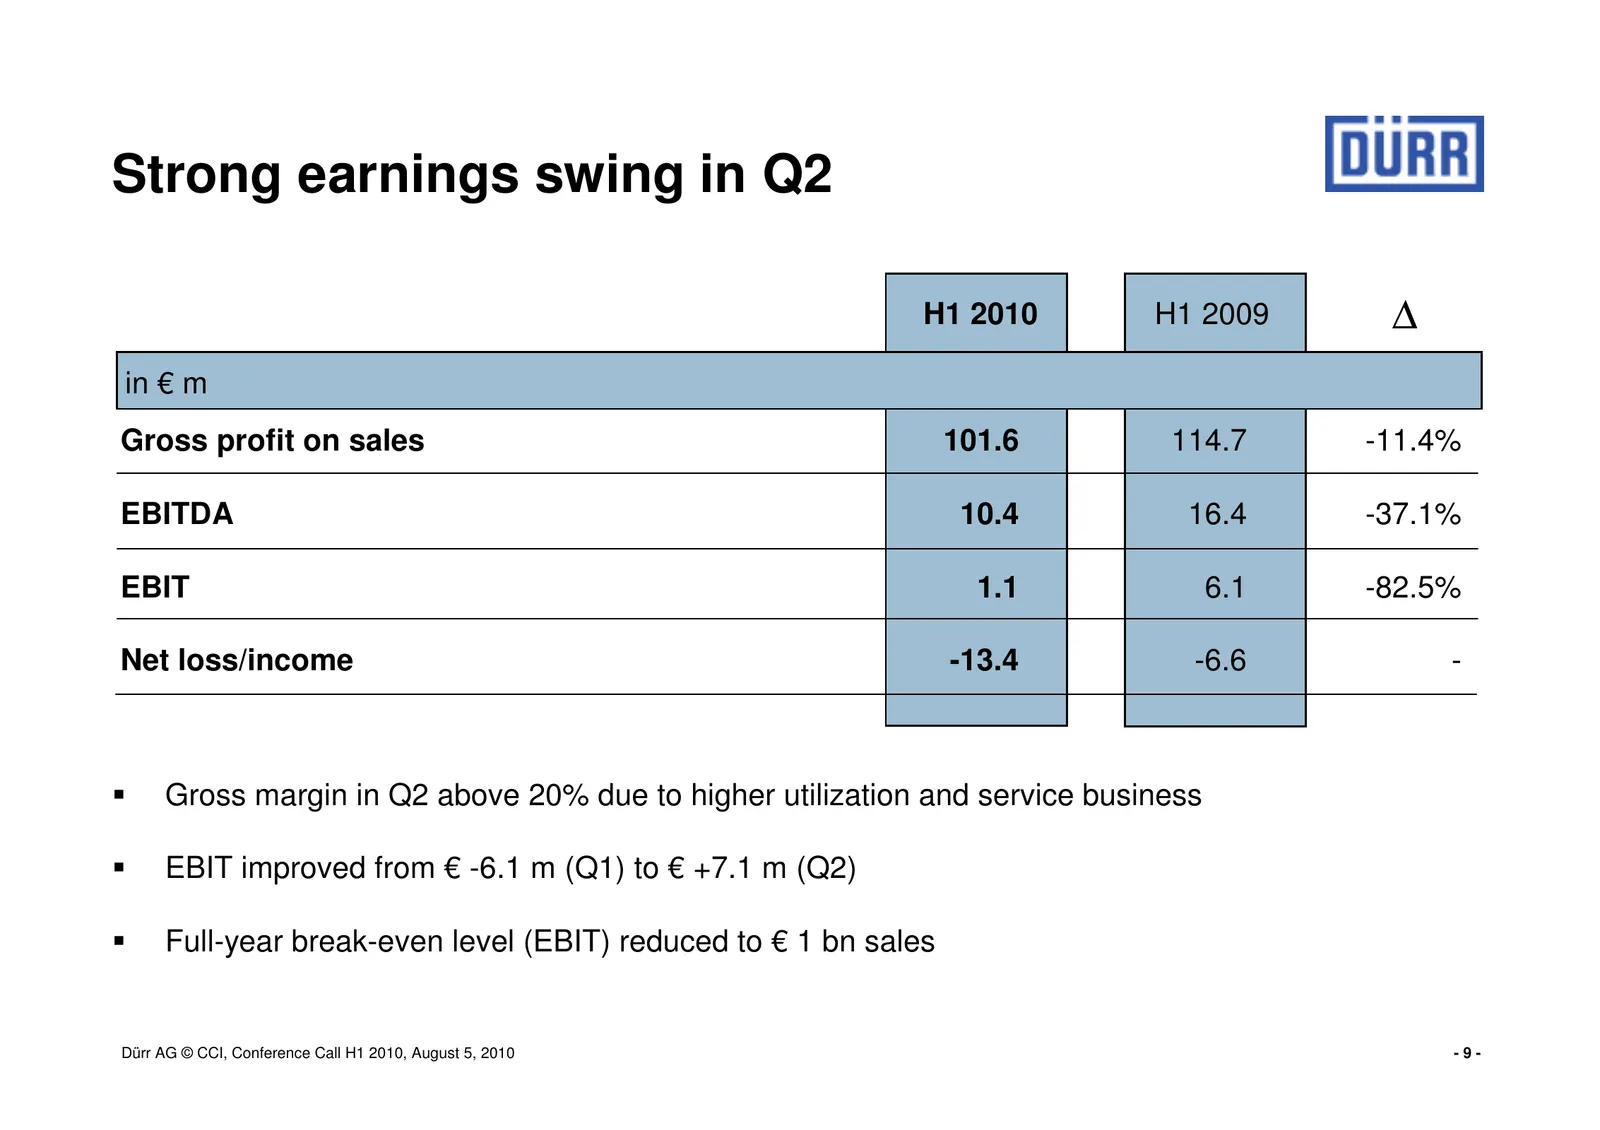
Strong earnings swing in Q2 H1 2010 H1 2009 ∆ in € m Gross profit on sales 101.6 114.7 -11.4% EBITDA 10.4 16.4 -37.1% EBIT 1.1 6.1 -82.5% Net loss/income -13.4 -6.6 - Gross margin in Q2 above 20% due to higher utilization and service business EBIT improved from € -6.1 m (Q1) to € +7.1 m (Q2) Full-ye
Slide 10: Cash flow: Moderate NWC increase in Q2 due to higher business volume
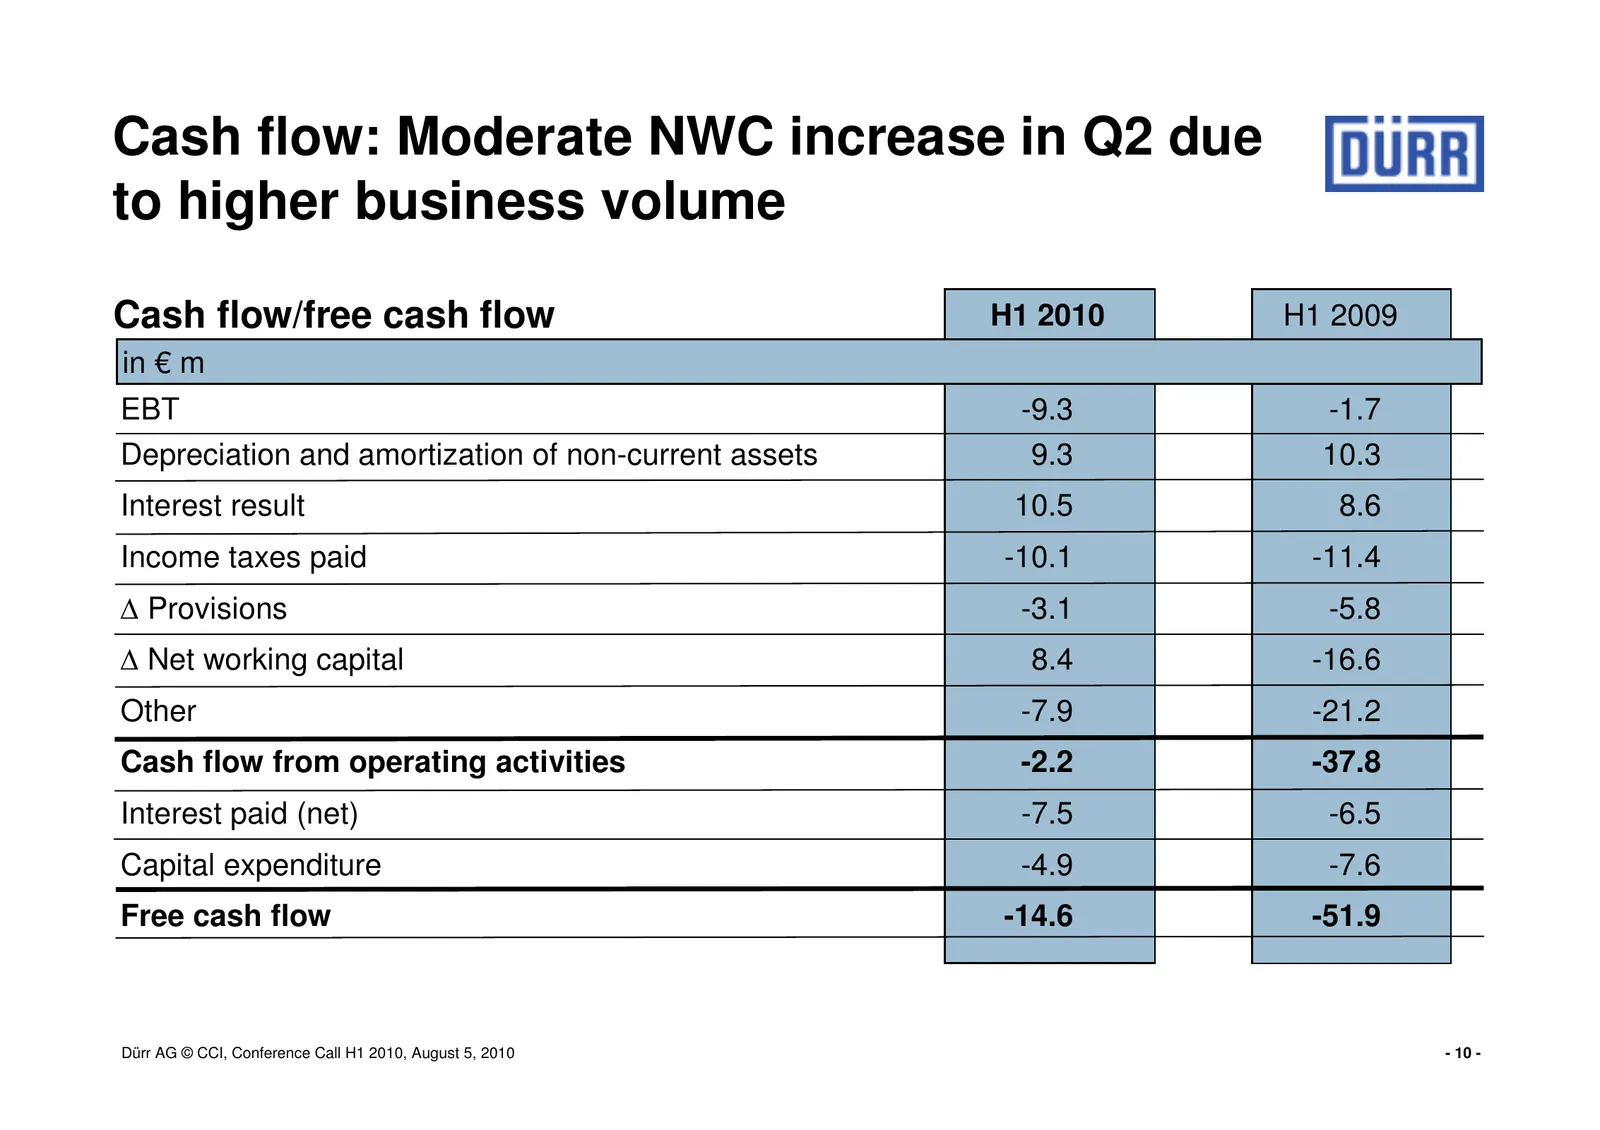
Cash flow: Moderate NWC increase in Q2 due to higher business volume Cash flow/free cash flow H1 2010 H1 2009 in € m EBT -9.3 -1.7 Depreciation and amortization of non-current assets 9.3 10.3 Interest result 10.5 8.6 Income taxes paid -10.1 -11.4 ∆ Provisions -3.1 -5.8 ∆ Net working capital 8.4 -16.
Slide 11: WIP and progress billings: More balanced
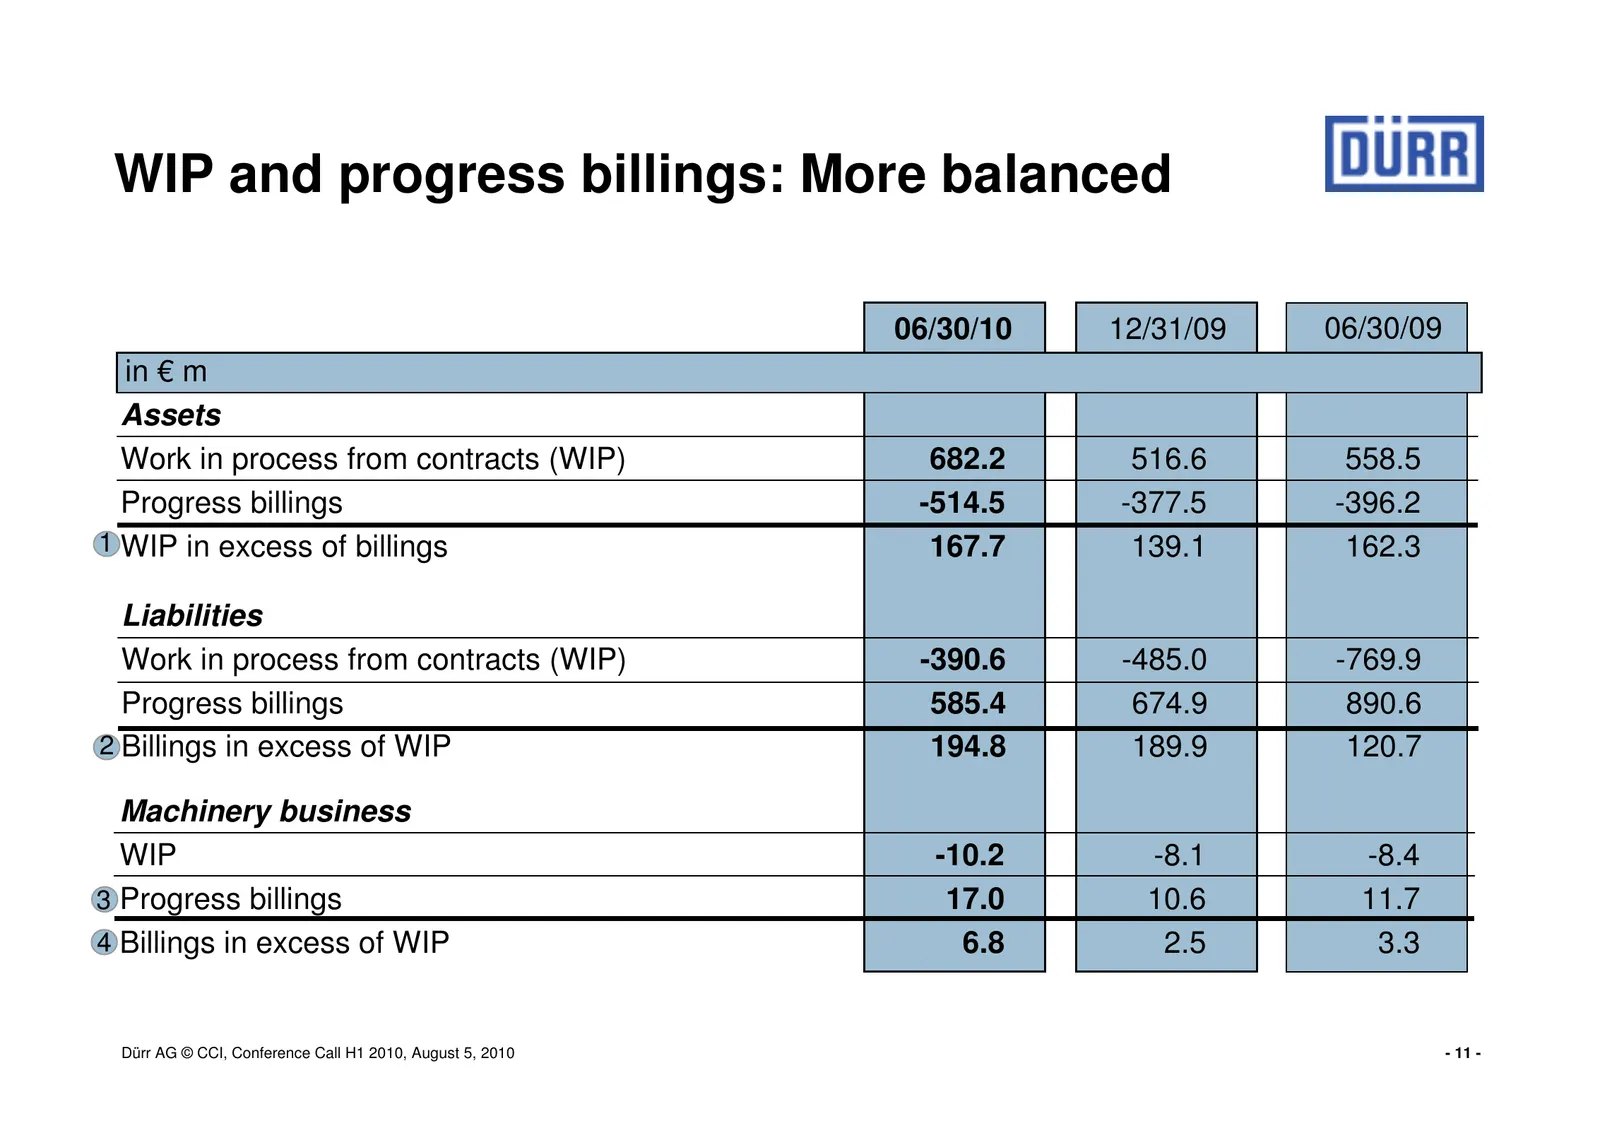
WIP and progress billings: More balanced 06/30/10 12/31/09 06/30/09 in € m Assets Work in process from contracts (WIP) 682.2 516.6 558.5 Progress billings -514.5 -377.5 -396.2 1 WIP in excess of billings 167.7 139.1 162.3 Liabilities Work in process from contracts (WIP) -390.6 -485.0 -769.9 Progress
Slide 12: WIP and progress billings: More balanced
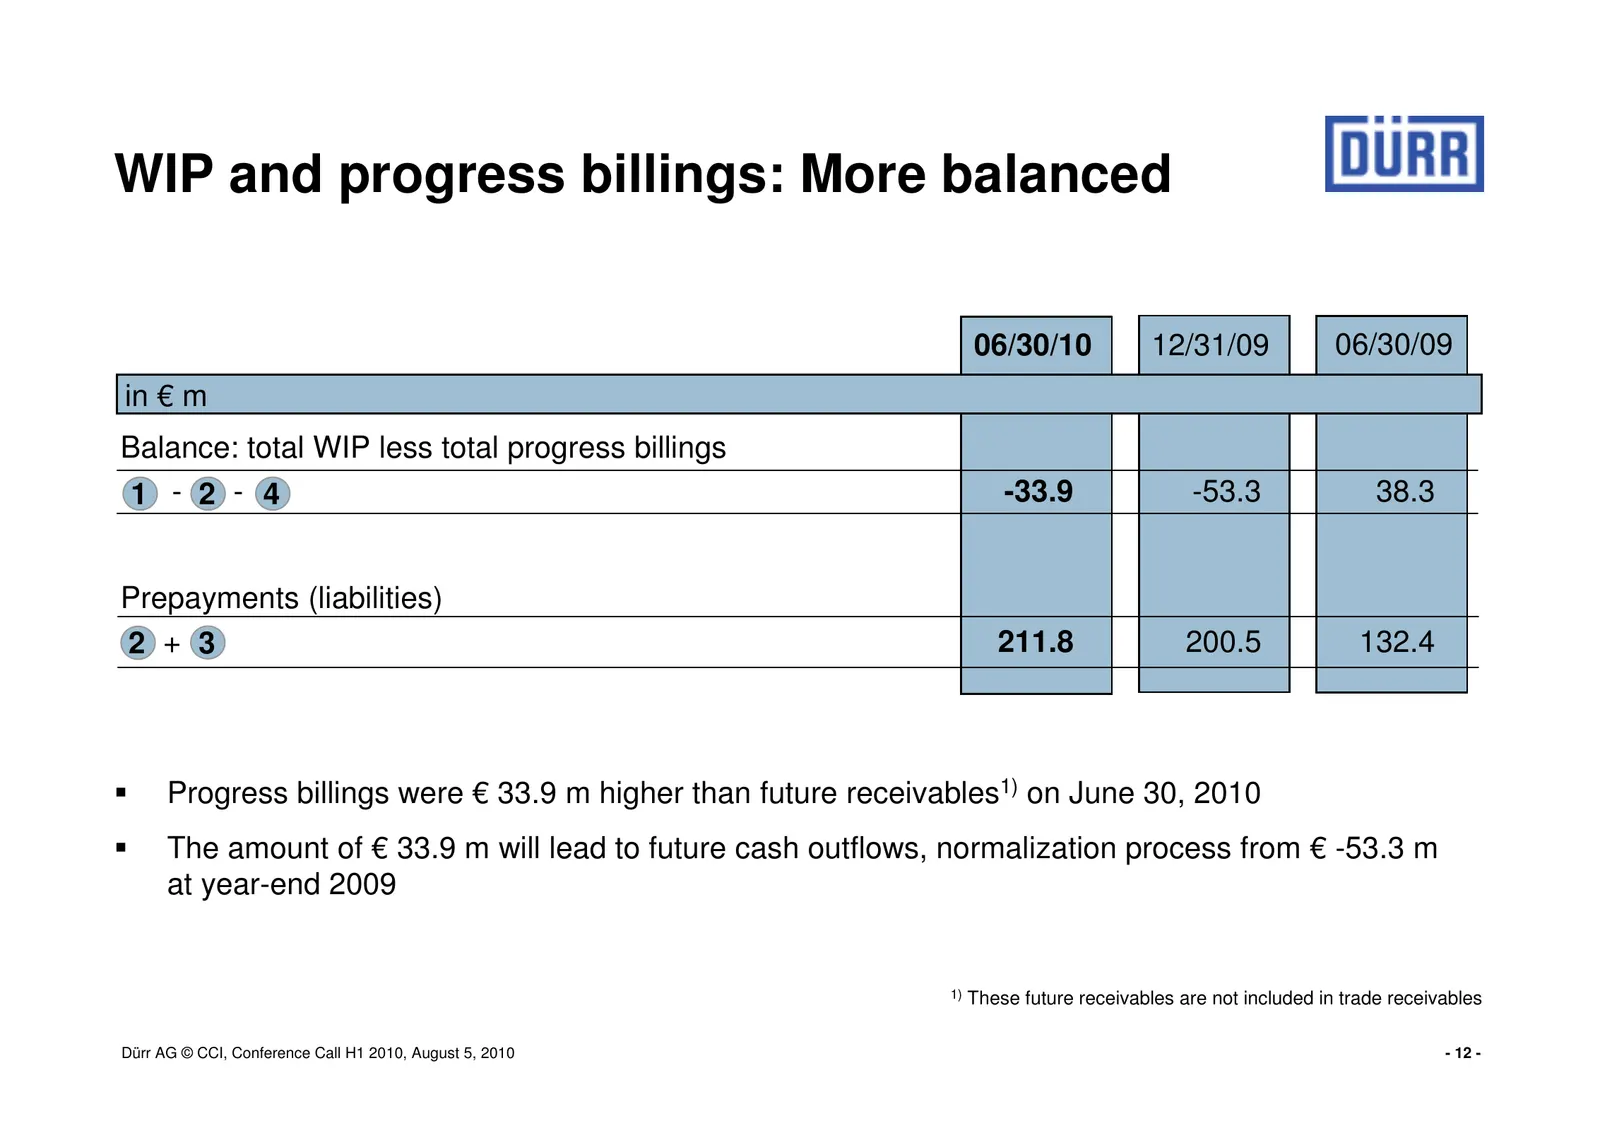
WIP and progress billings: More balanced 06/30/10 12/31/09 06/30/09 in € m Balance: total WIP less total progress billings 1 - 2 - 4 -33.9 -53.3 38.3 Prepayments (liabilities) 2 + 3 211.8 200.5 132.4 Progress billings were € 33.9 m higher than future receivables1) on June 30, 2010 The amount of € 33
Slide 13: Solid financial ratios
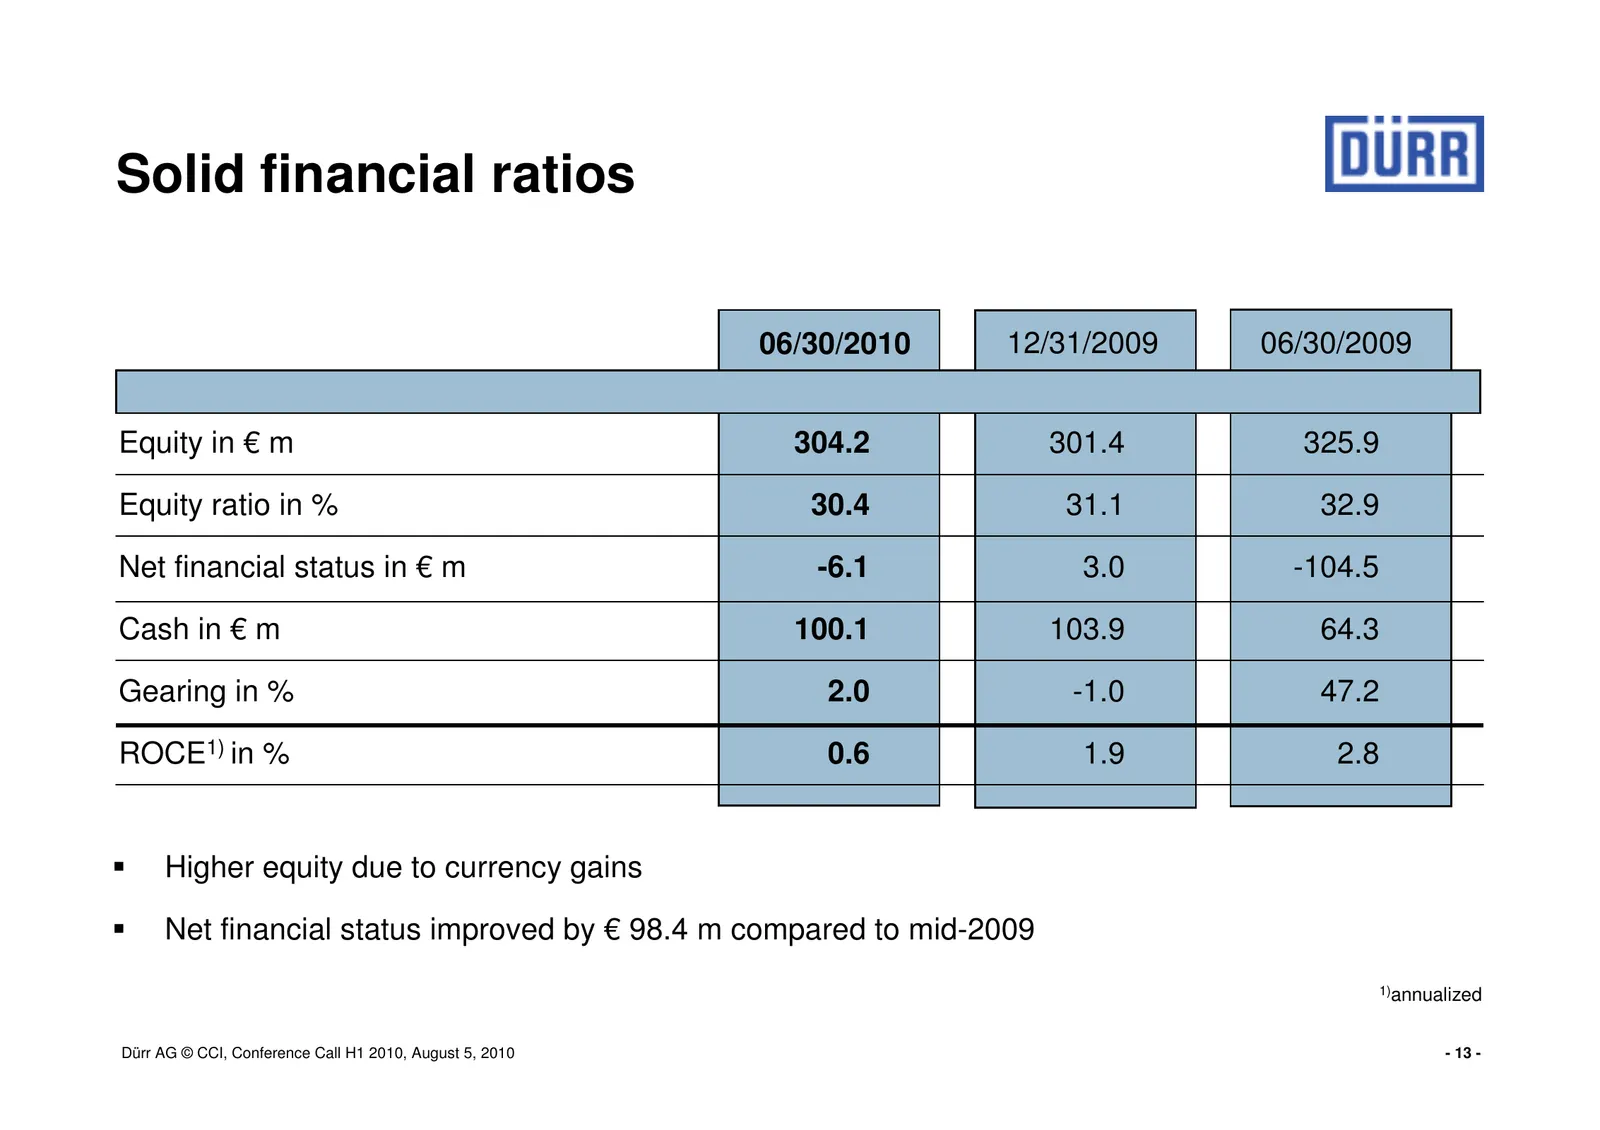
Solid financial ratios 06/30/2010 12/31/2009 06/30/2009 Equity in € m 304.2 301.4 325.9 Equity ratio in % 30.4 31.1 32.9 Net financial status in € m -6.1 3.0 -104.5 Cash in € m 100.1 103.9 64.3 Gearing in % 2.0 -1.0 47.2 ROCE1) in % 0.6 1.9 2.8 Higher equity due to currency gains Net financial statu
Slide 14: Paint and Assembly Systems: Turnaround in Q2 after loss in Q1
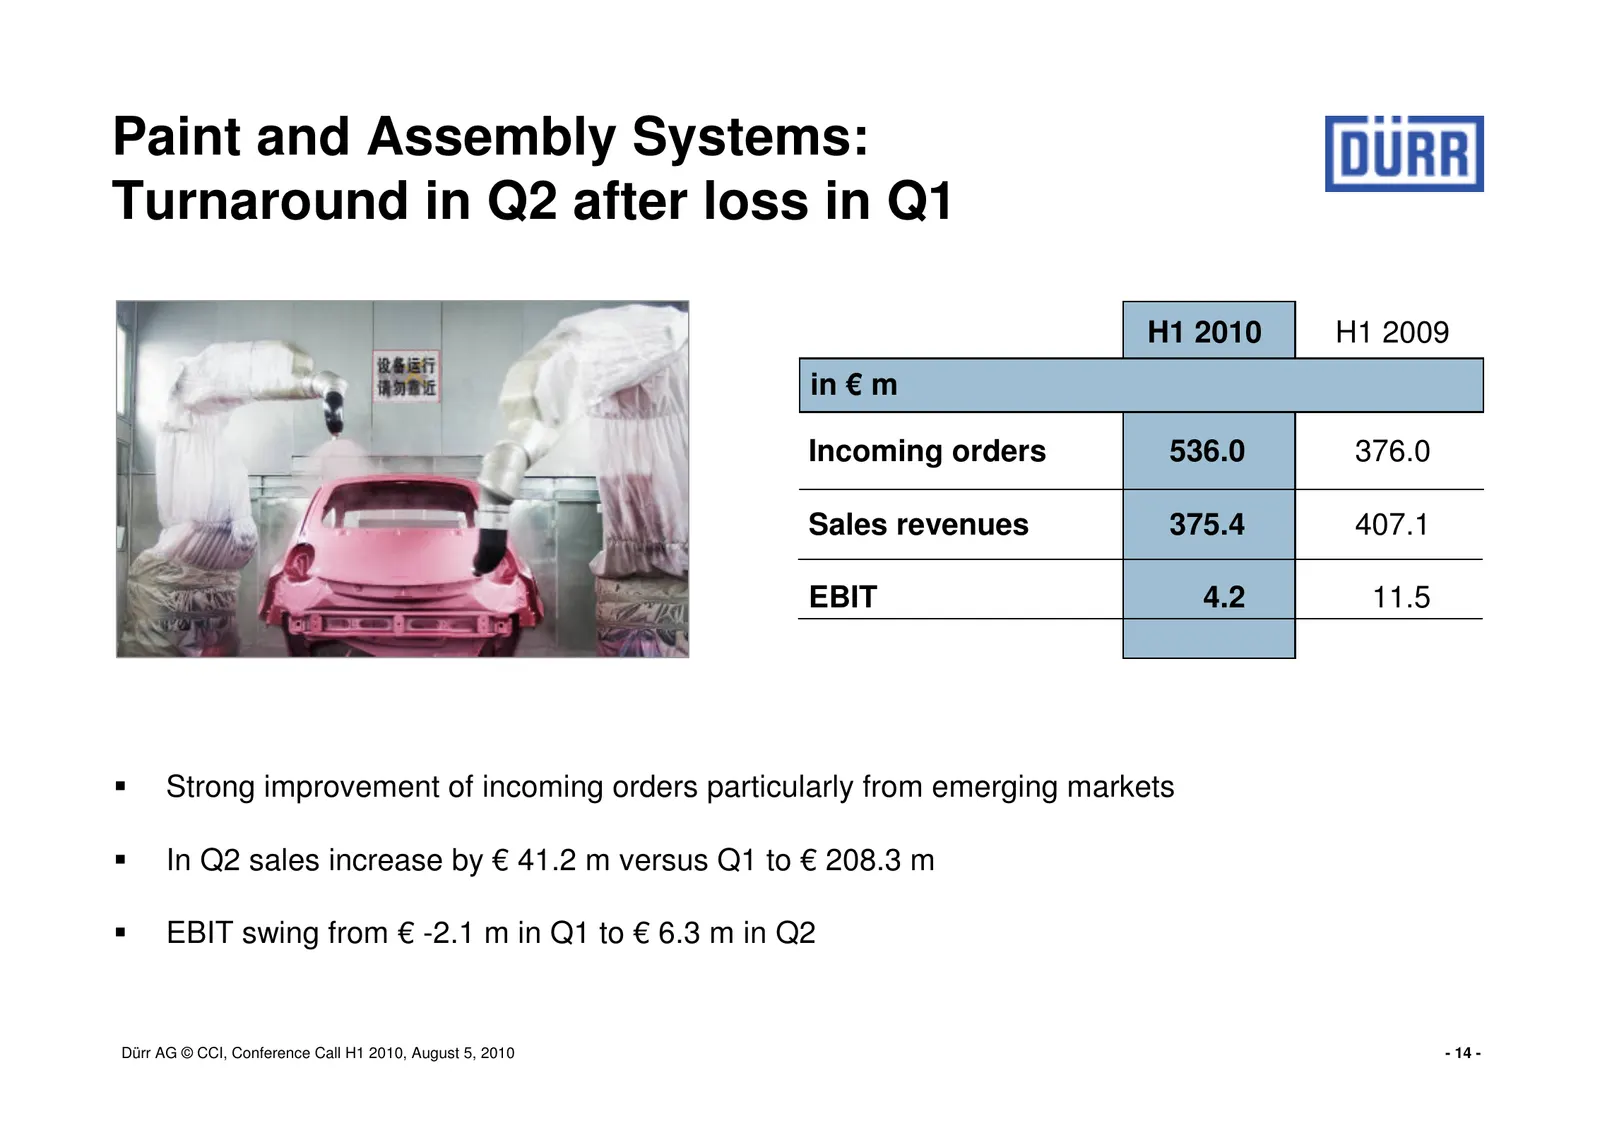
Paint and Assembly Systems: Turnaround in Q2 after loss in Q1 H1 2010 H1 2009 in € m Incoming orders 536.0 376.0 Sales revenues 375.4 407.1 EBIT 4.2 11.5 Strong improvement of incoming orders particularly from emerging markets In Q2 sales increase by € 41.2 m versus Q1 to € 208.3 m EBIT swing from €
Slide 15: Measuring and Process Systems: Strong rebound in order flow
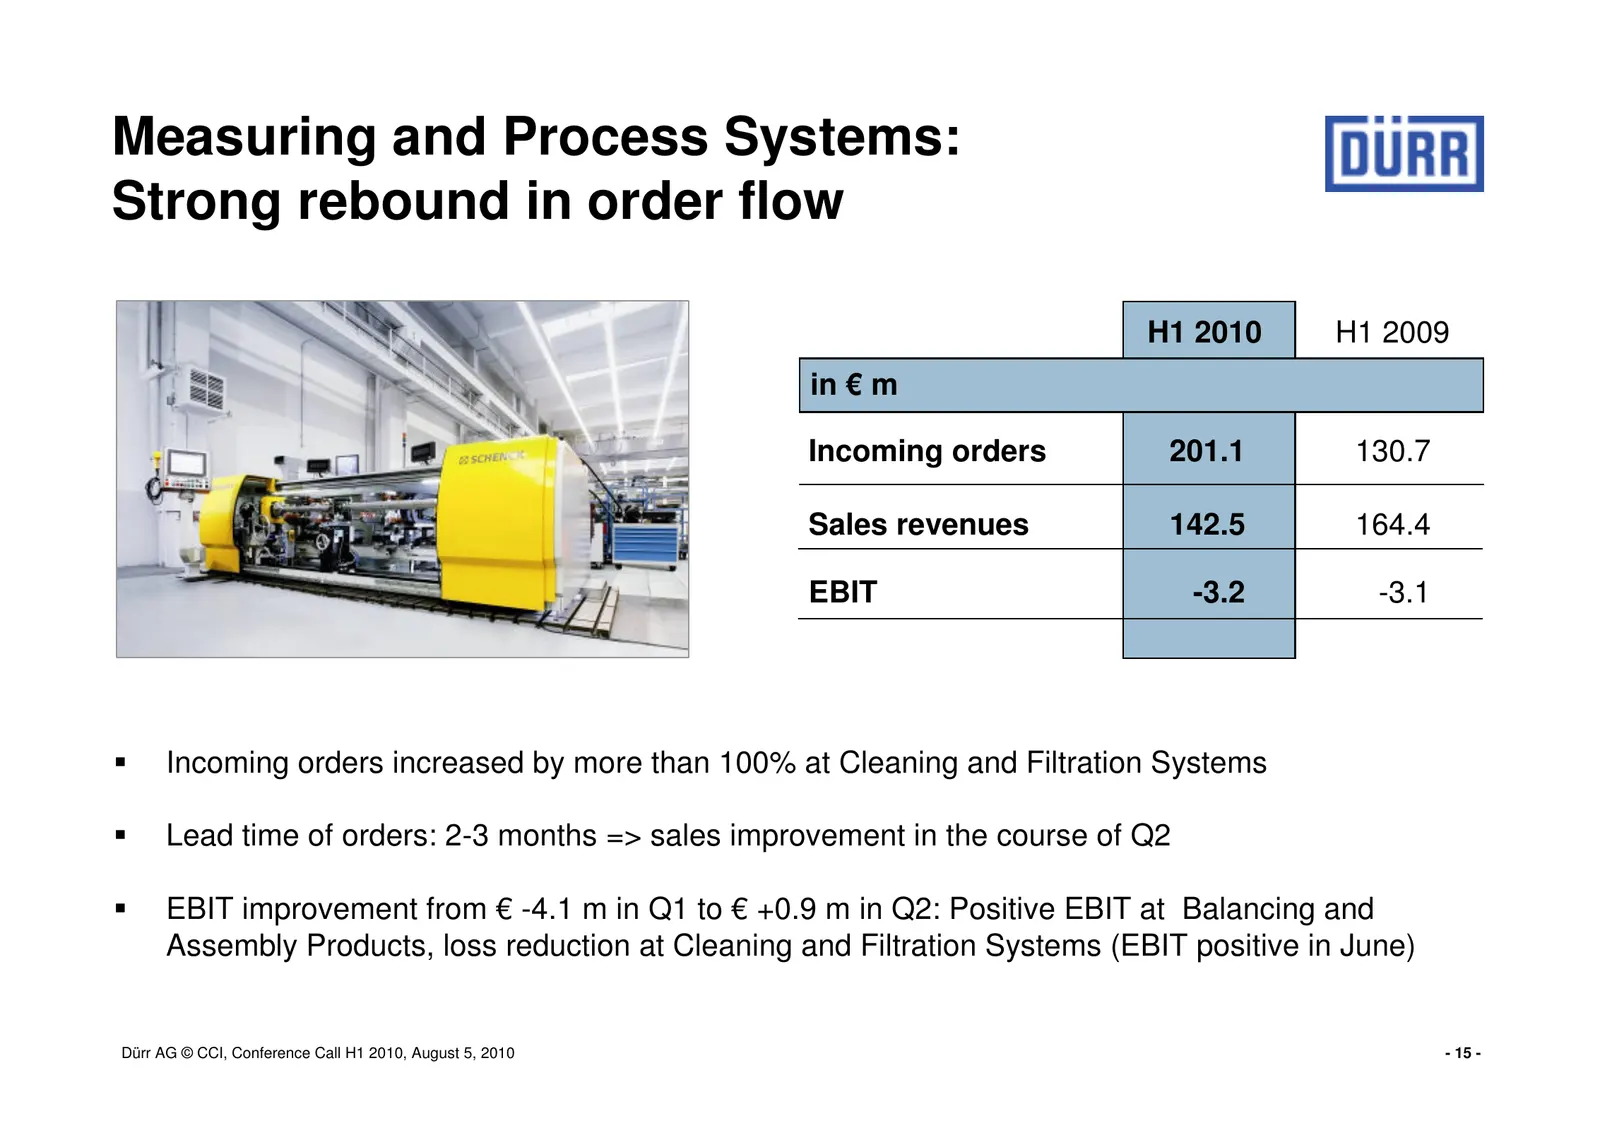
Measuring and Process Systems: Strong rebound in order flow H1 2010 H1 2009 in € m Incoming orders 201.1 130.7 Sales revenues 142.5 164.4 EBIT -3.2 -3.1 Incoming orders increased by more than 100% at Cleaning and Filtration Systems Lead time of orders: 2-3 months => sales improvement in the course o
Slide 16: Agenda
Agenda H1Figures China Refinancing Summary Dürr AG © CCI, Conference Call H1 2010, August 5, 2010 - 16 -
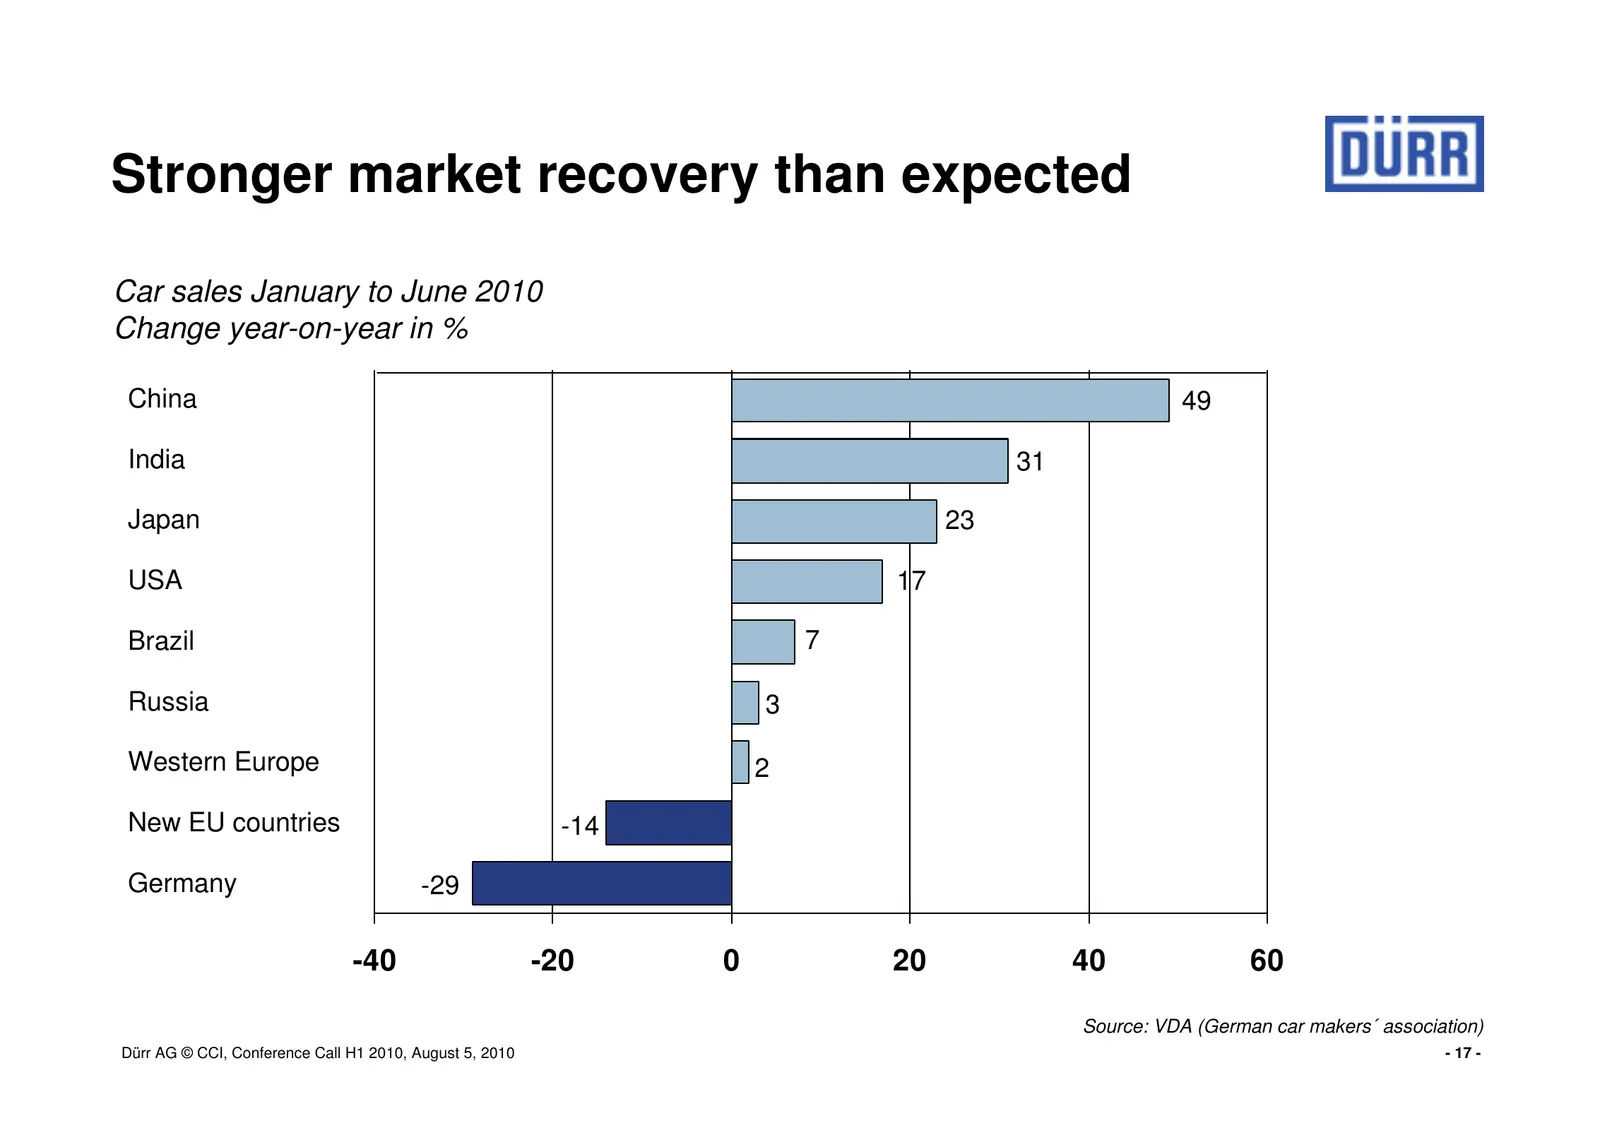
Slide 17: Stronger market recovery than expected
Stronger market recovery than expected Car sales January to June 2010 Change year-on-year in % China 49 India 31 Japan 23 USA 17 Brazil 7 Russia 3 Western Europe 2 New EU countries -14 Germany -29 -40 -20 0 20 40 60 Source: VDA (German car makers´ association) Dürr AG © CCI, Conference Call H1 2010,
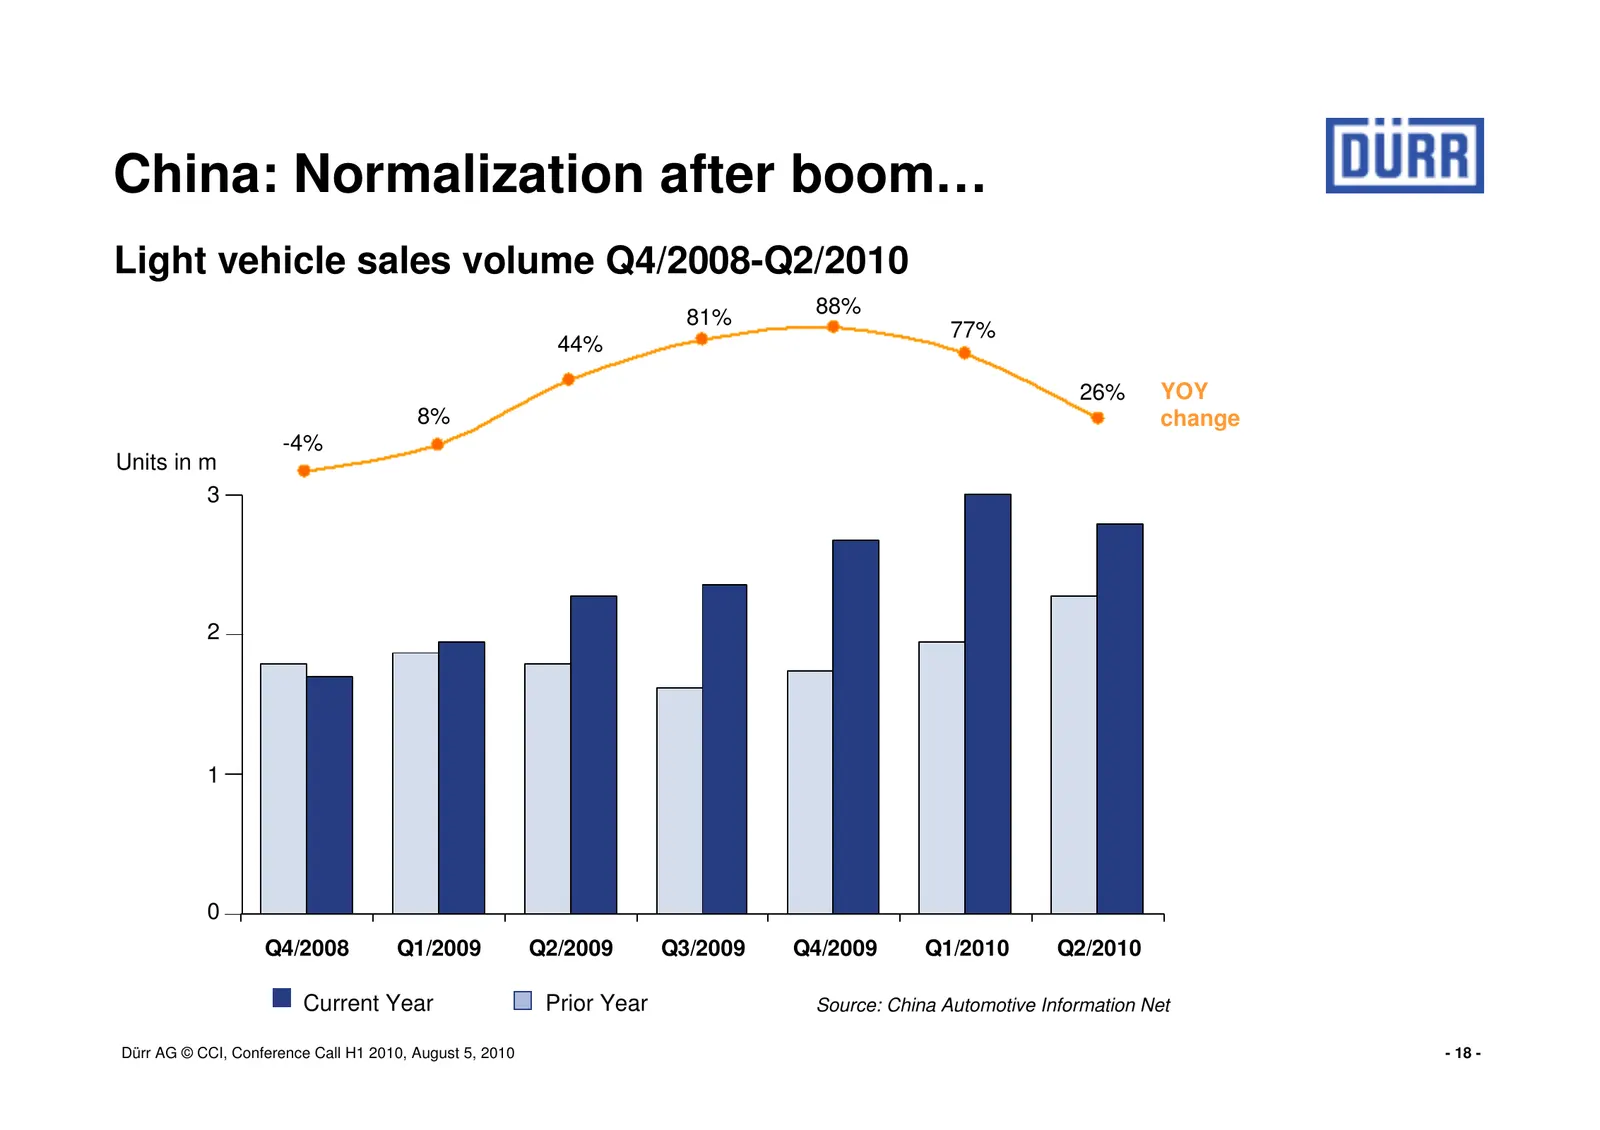
Slide 18: China: Normalization after boom…
China: Normalization after boom… Light vehicle sales volume Q4/2008-Q2/2010 81% 88% 77% 44% 26% YOY 8% change -4% Units in m 3 2 1 0 Q4/2008 Q1/2009 Q2/2009 Q3/2009 Q4/2009 Q1/2010 Q2/2010 Current Year Prior Year Source: China Automotive Information Net Dürr AG © CCI, Conference Call H1 2010, August
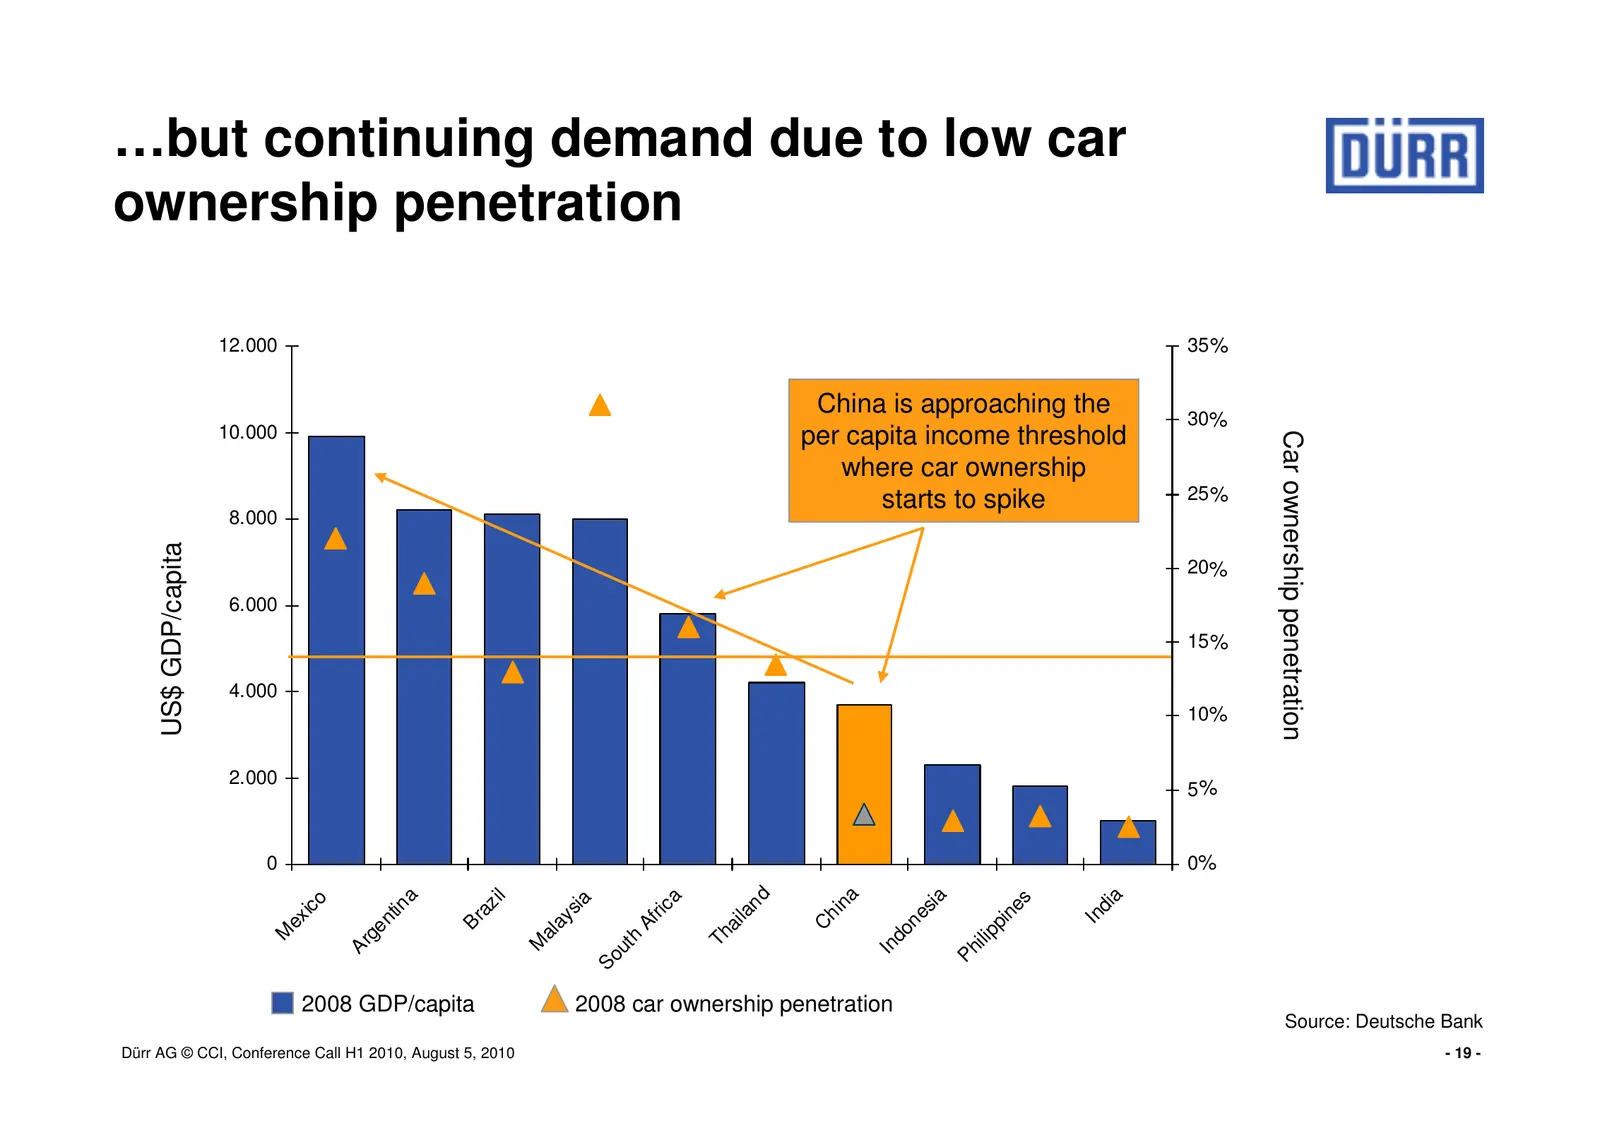
Slide 19: …but continuing demand due to low car ownership penetration
…but continuing demand due to low car ownership penetration 12.000 35 % China is approaching the 30% 10.000 per capita income threshold Car ownership penetration where car ownership starts to spike 25 % 8.000 US$ GDP/capita 20% 6.000 15 % 4.000 10% 2.000 5% 0 0% nd na a a sia ca l s o sia i di az in
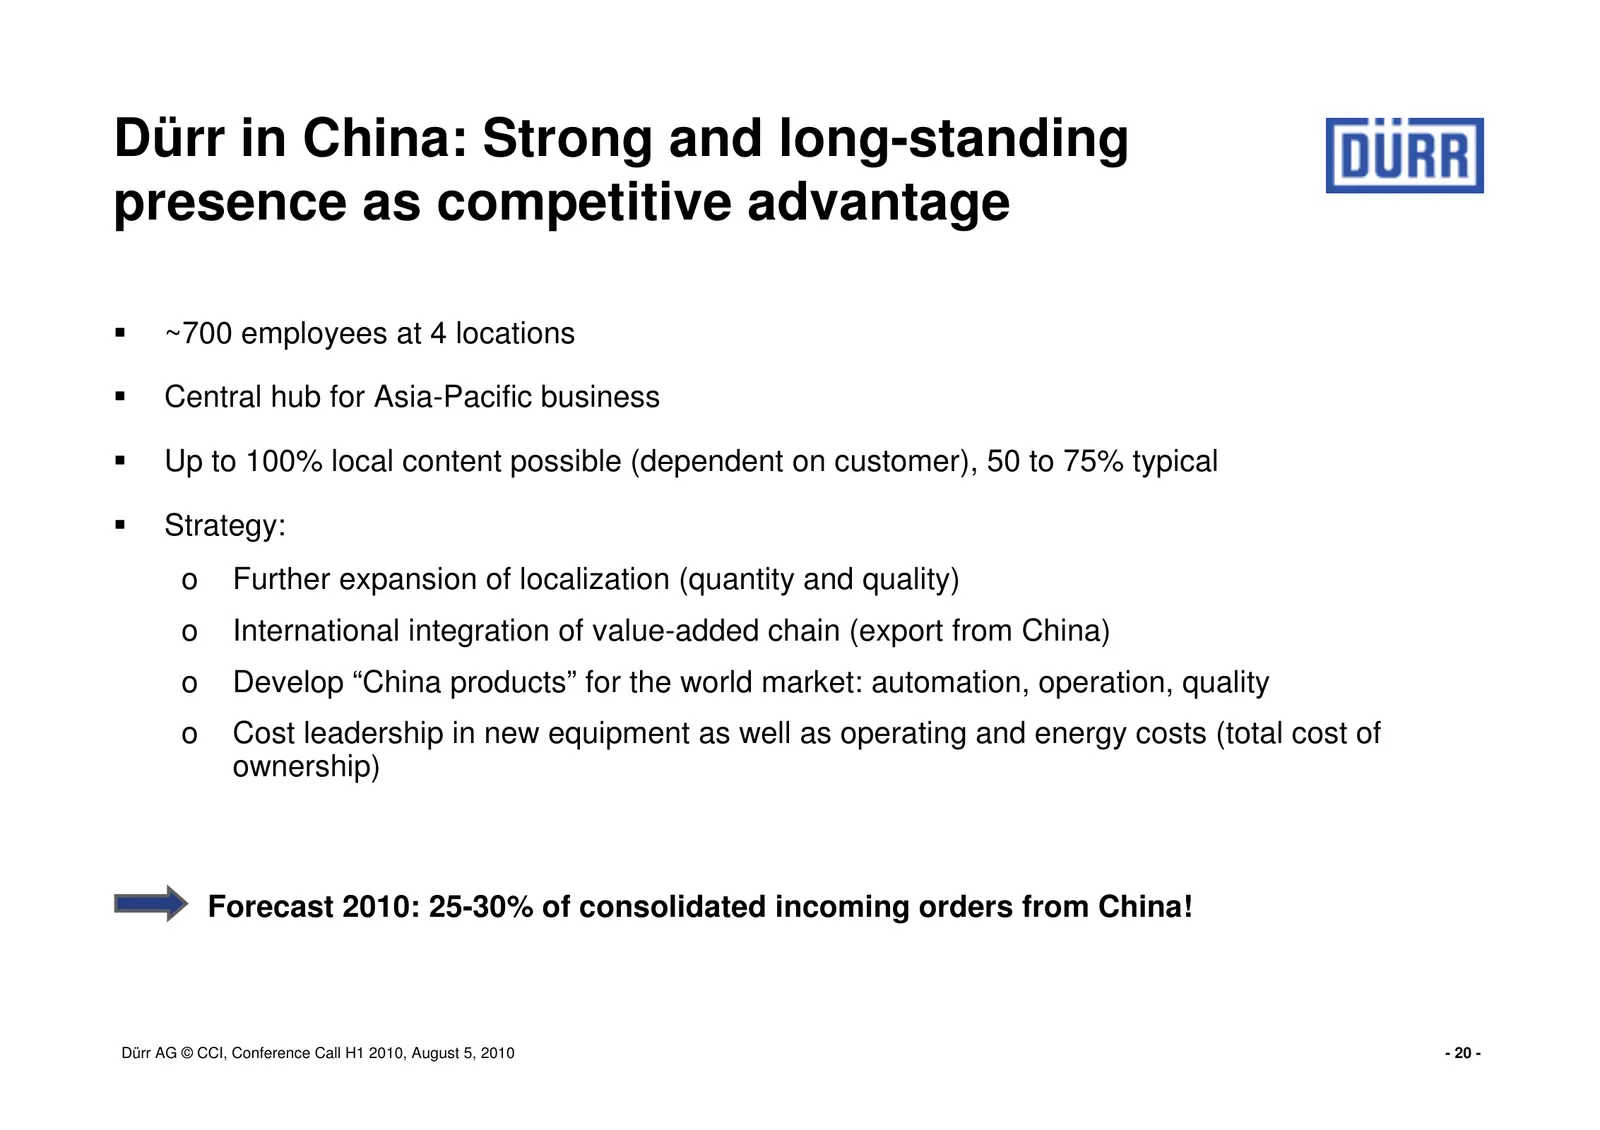
Slide 20: Dürr in China: Strong and long-standing presence as competitive advantage
Dürr in China: Strong and long-standing presence as competitive advantage ~700 employees at 4 locations Central hub for Asia-Pacific business Up to 100% local content possible (dependent on customer), 50 to 75% typical Strategy: o Further expansion of localization (quantity and quality) o Internatio
Slide 21: Dürr in China: 25 years of local presence
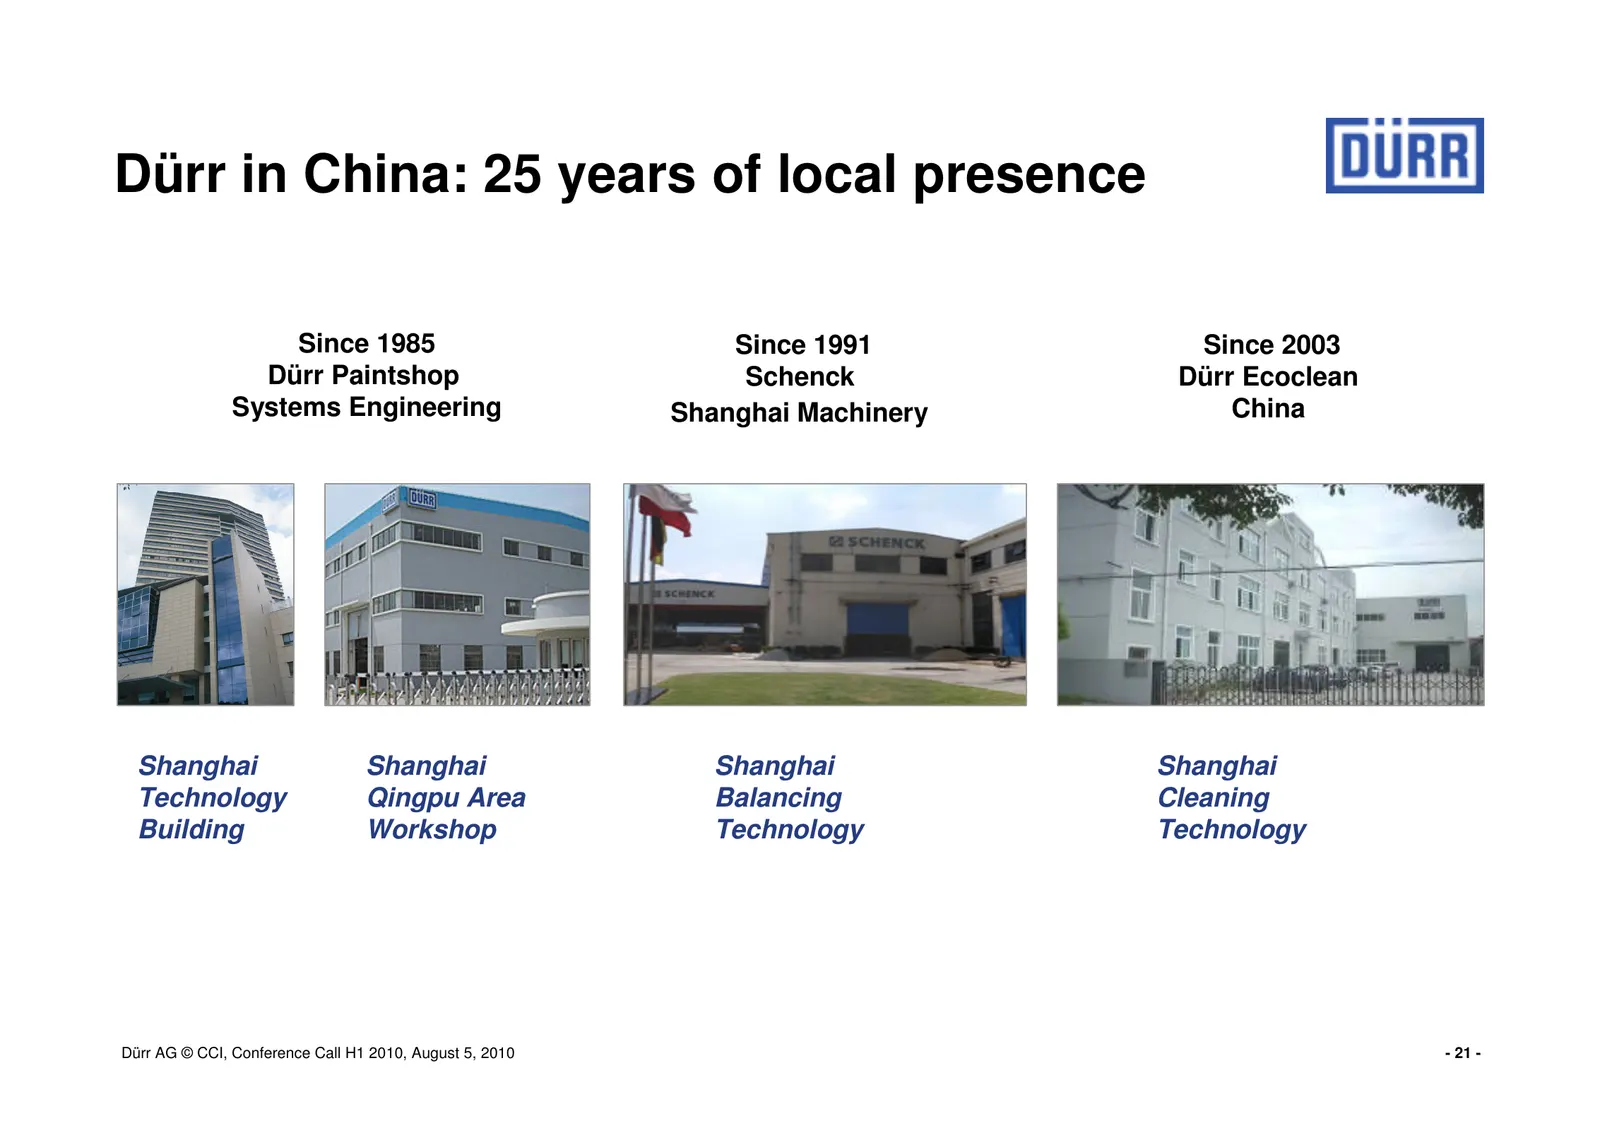
Dürr in China: 25 years of local presence Since 1985 Since 1991 Since 2003 Dürr Paintshop Schenck Dürr Ecoclean Systems Engineering Shanghai Machinery China Shanghai Shanghai Shanghai Shanghai Technology Qingpu Area Balancing Cleaning Building Workshop Technology Technology Dürr AG © CCI, Conference
Slide 22: Dürr in China: Strong ties to local and international OEMs
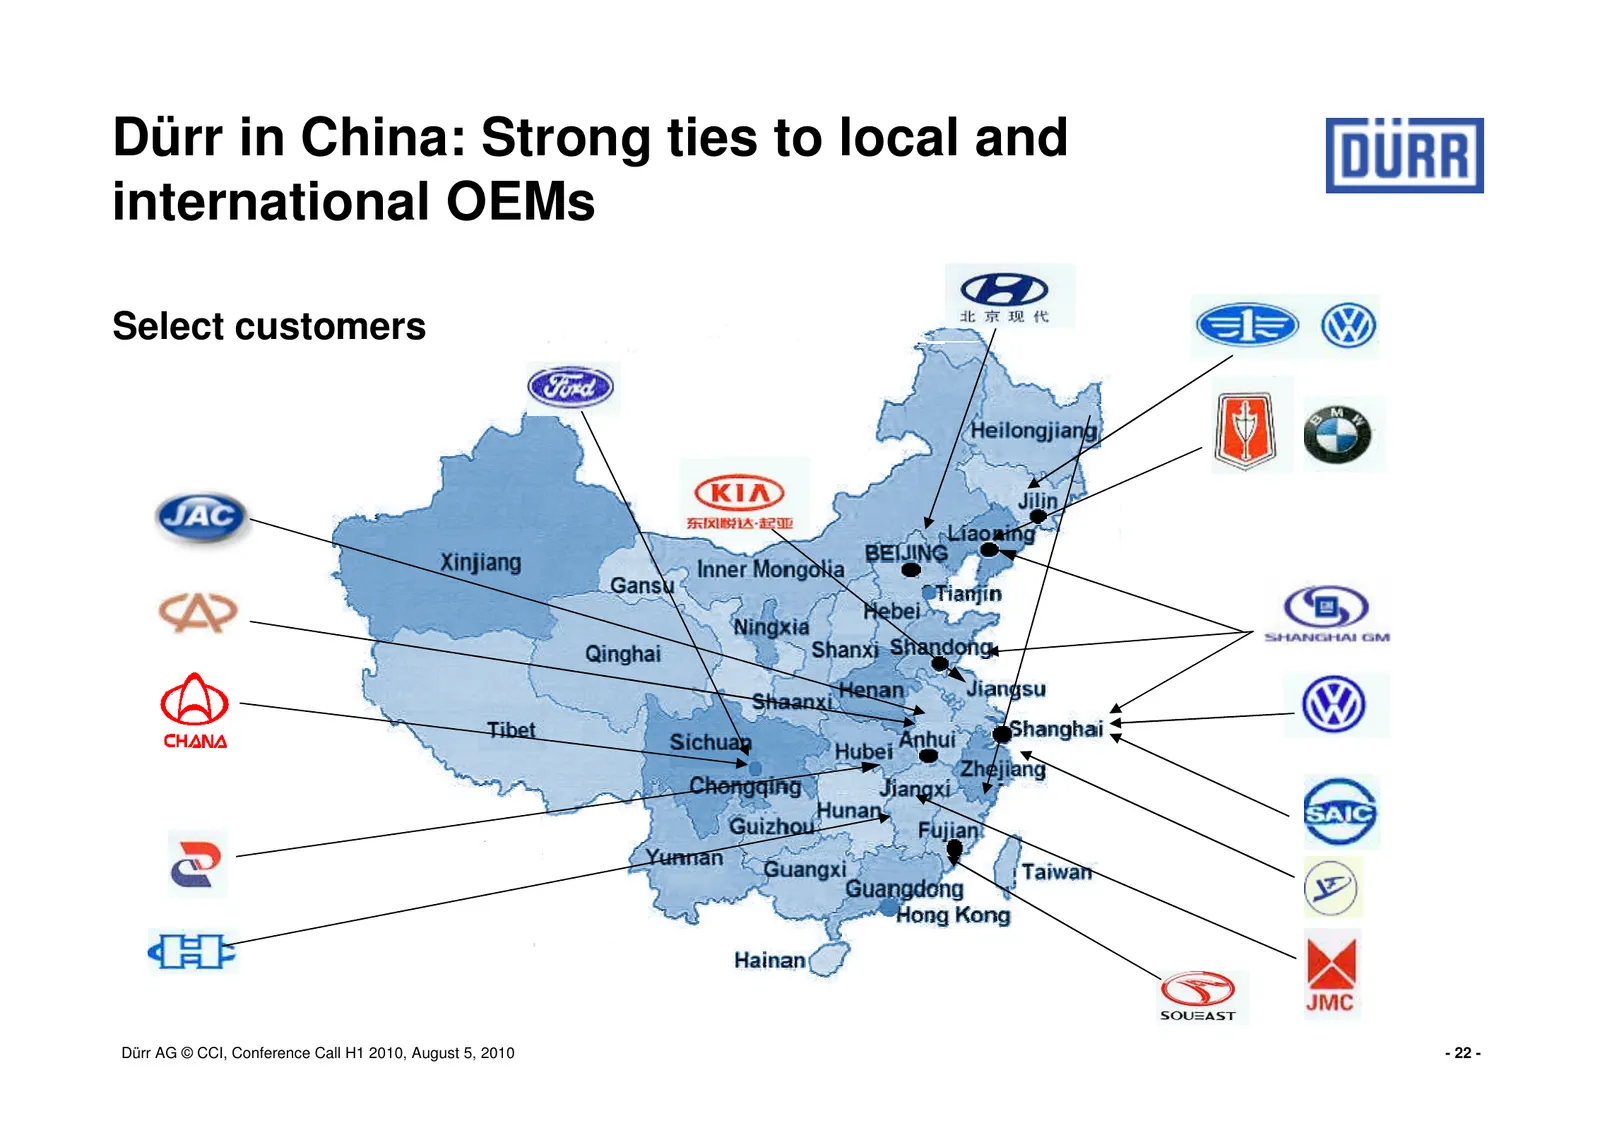
Dürr in China: Strong ties to local and international OEMs Select customers Dürr AG © CCI, Conference Call H1 2010, August 5, 2010 - 22 -
Slide 23: Localization: Benefits
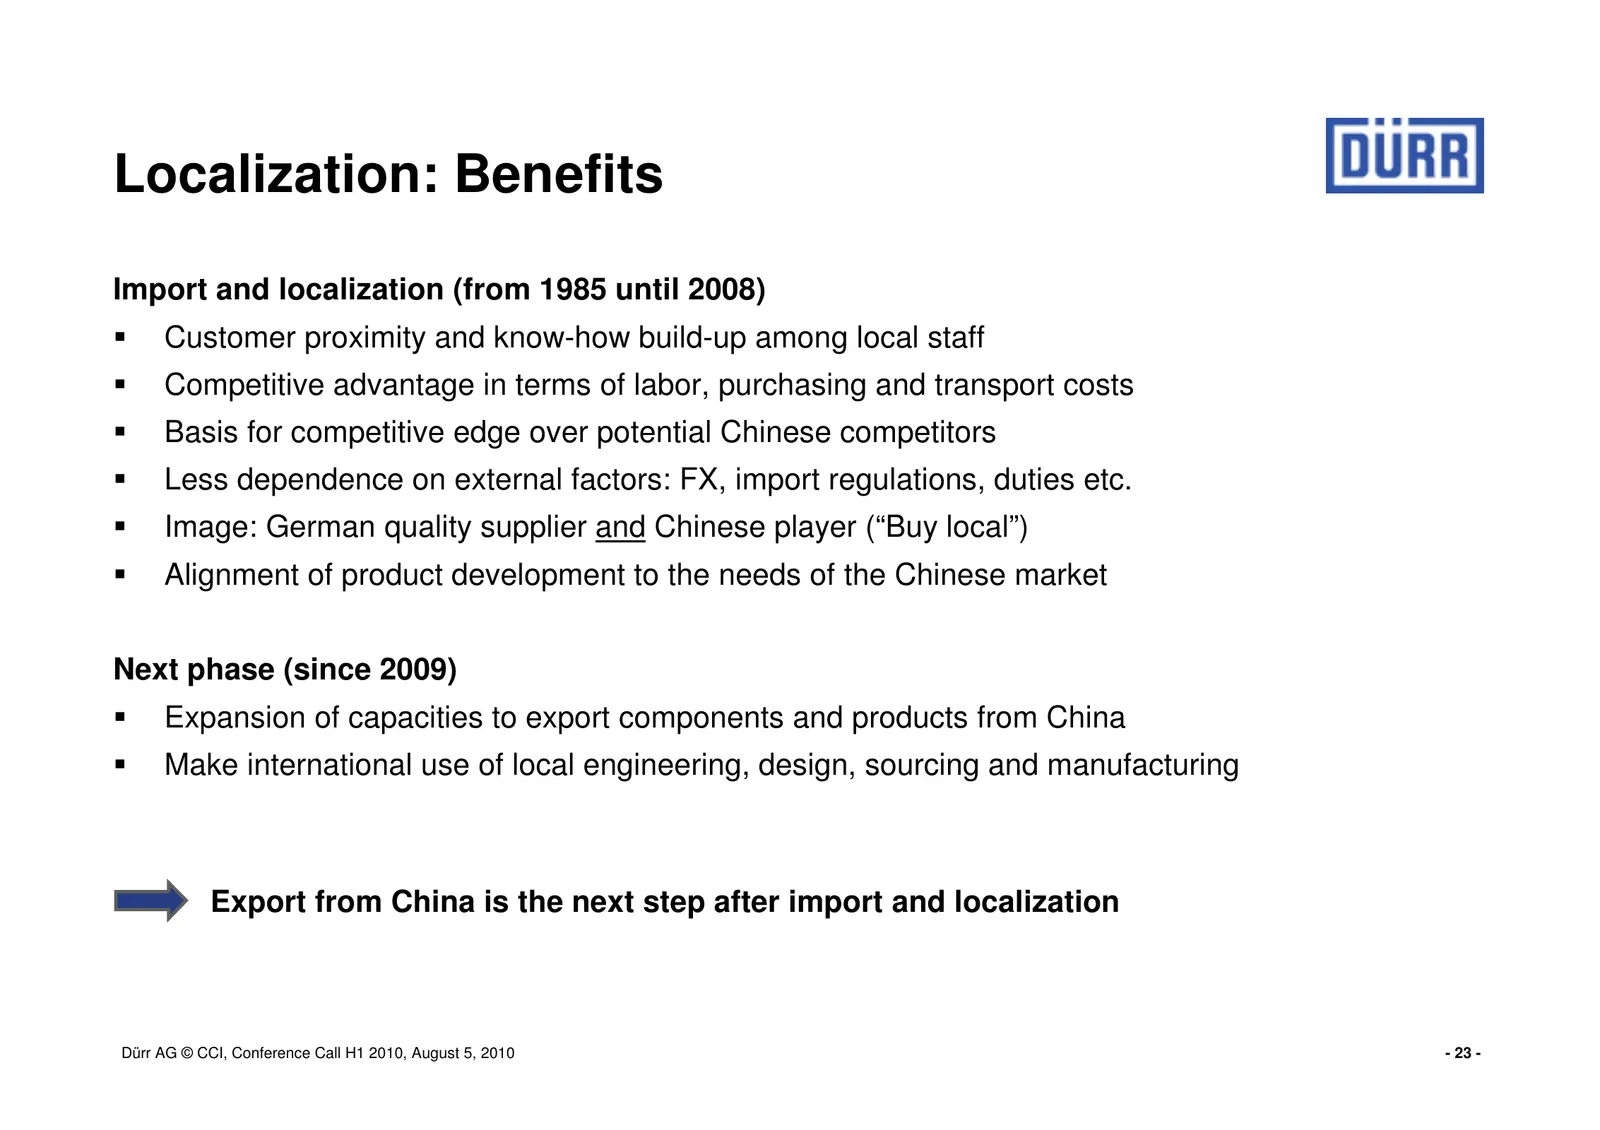
Localization: Benefits Import and localization (from 1985 until 2008) Customer proximity and know-how build-up among local staff Competitive advantage in terms of labor, purchasing and transport costs Basis for competitive edge over potential Chinese competitors Less dependence on external factors:
Slide 24: Localization: Stages of development
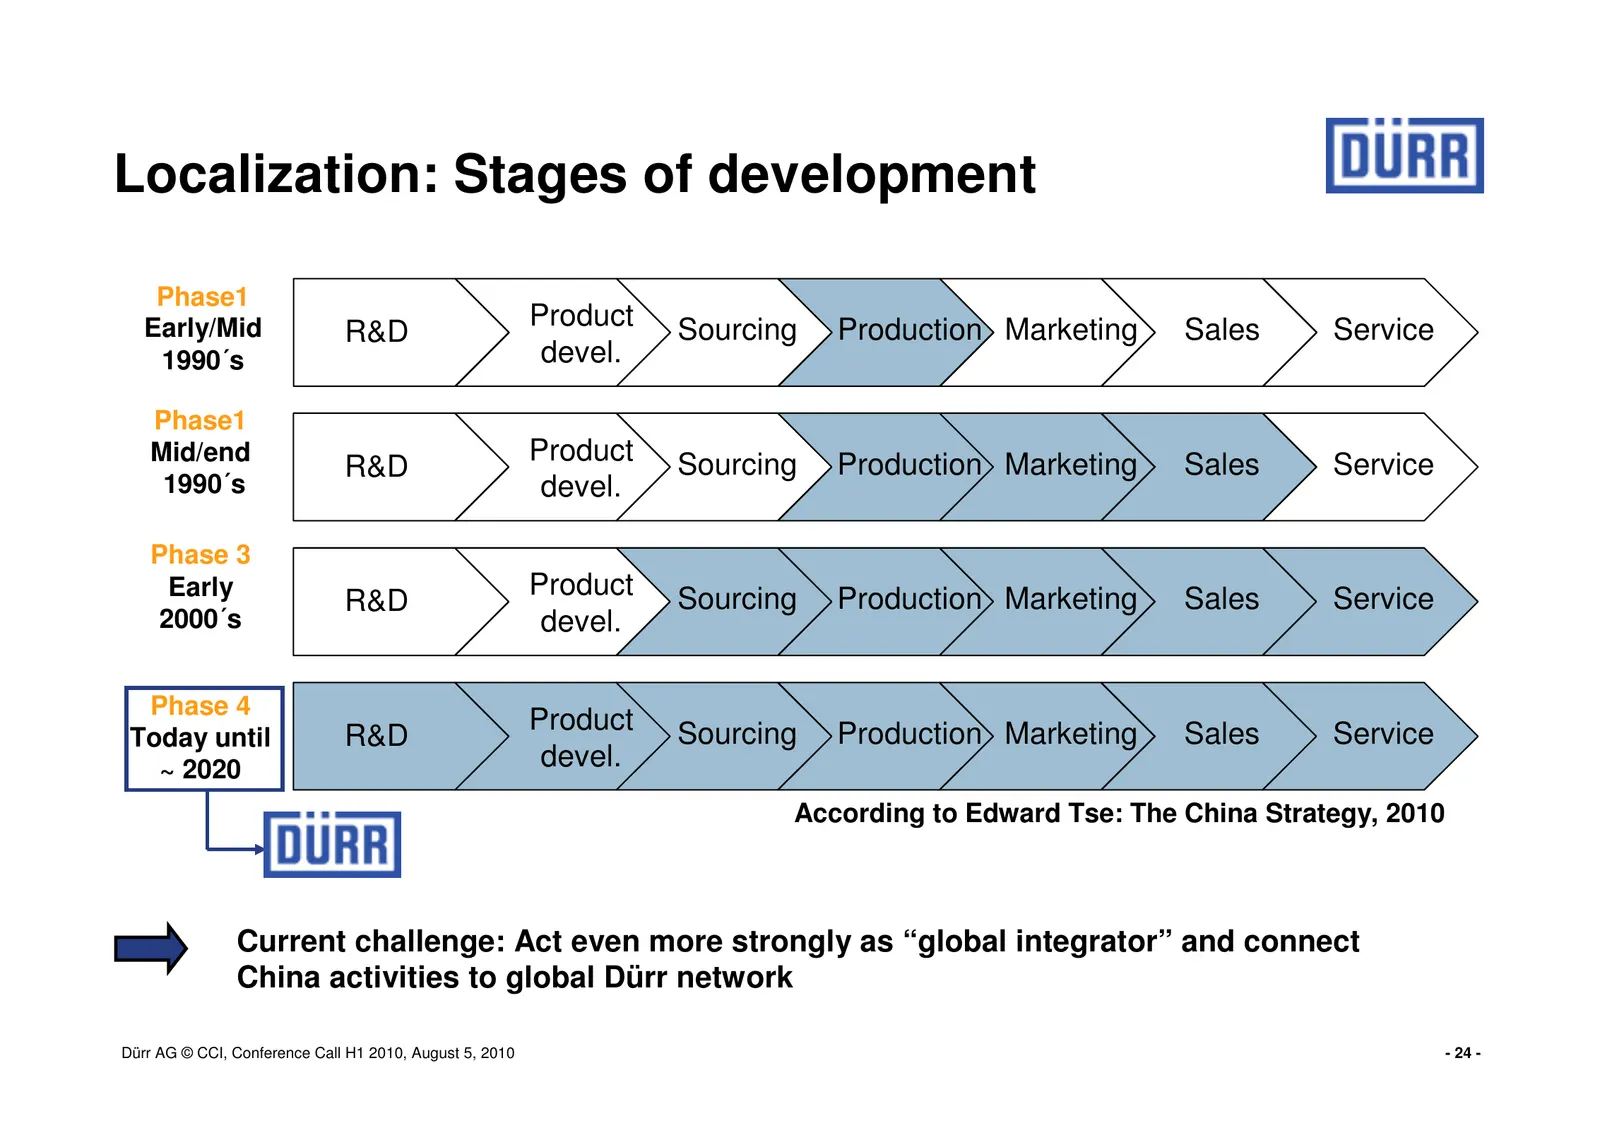
Localization: Stages of development Phase1 Early/Mid Product Sourcing Production Marketing Sales Service R&D 1990´s devel. Phase1 Mid/end Product Sourcing Production Marketing Sales Service R&D 1990´s devel. Phase 3 Early Product Sourcing Production Marketing Sales Service R&D 2000´s devel. Phase 4
Slide 25: Agenda
Agenda H1 Figures China Refinancing Summary Dürr AG © CCI, Conference Call H1 2010, August 5, 2010 - 25 -
Slide 26: Activities autumn 2010
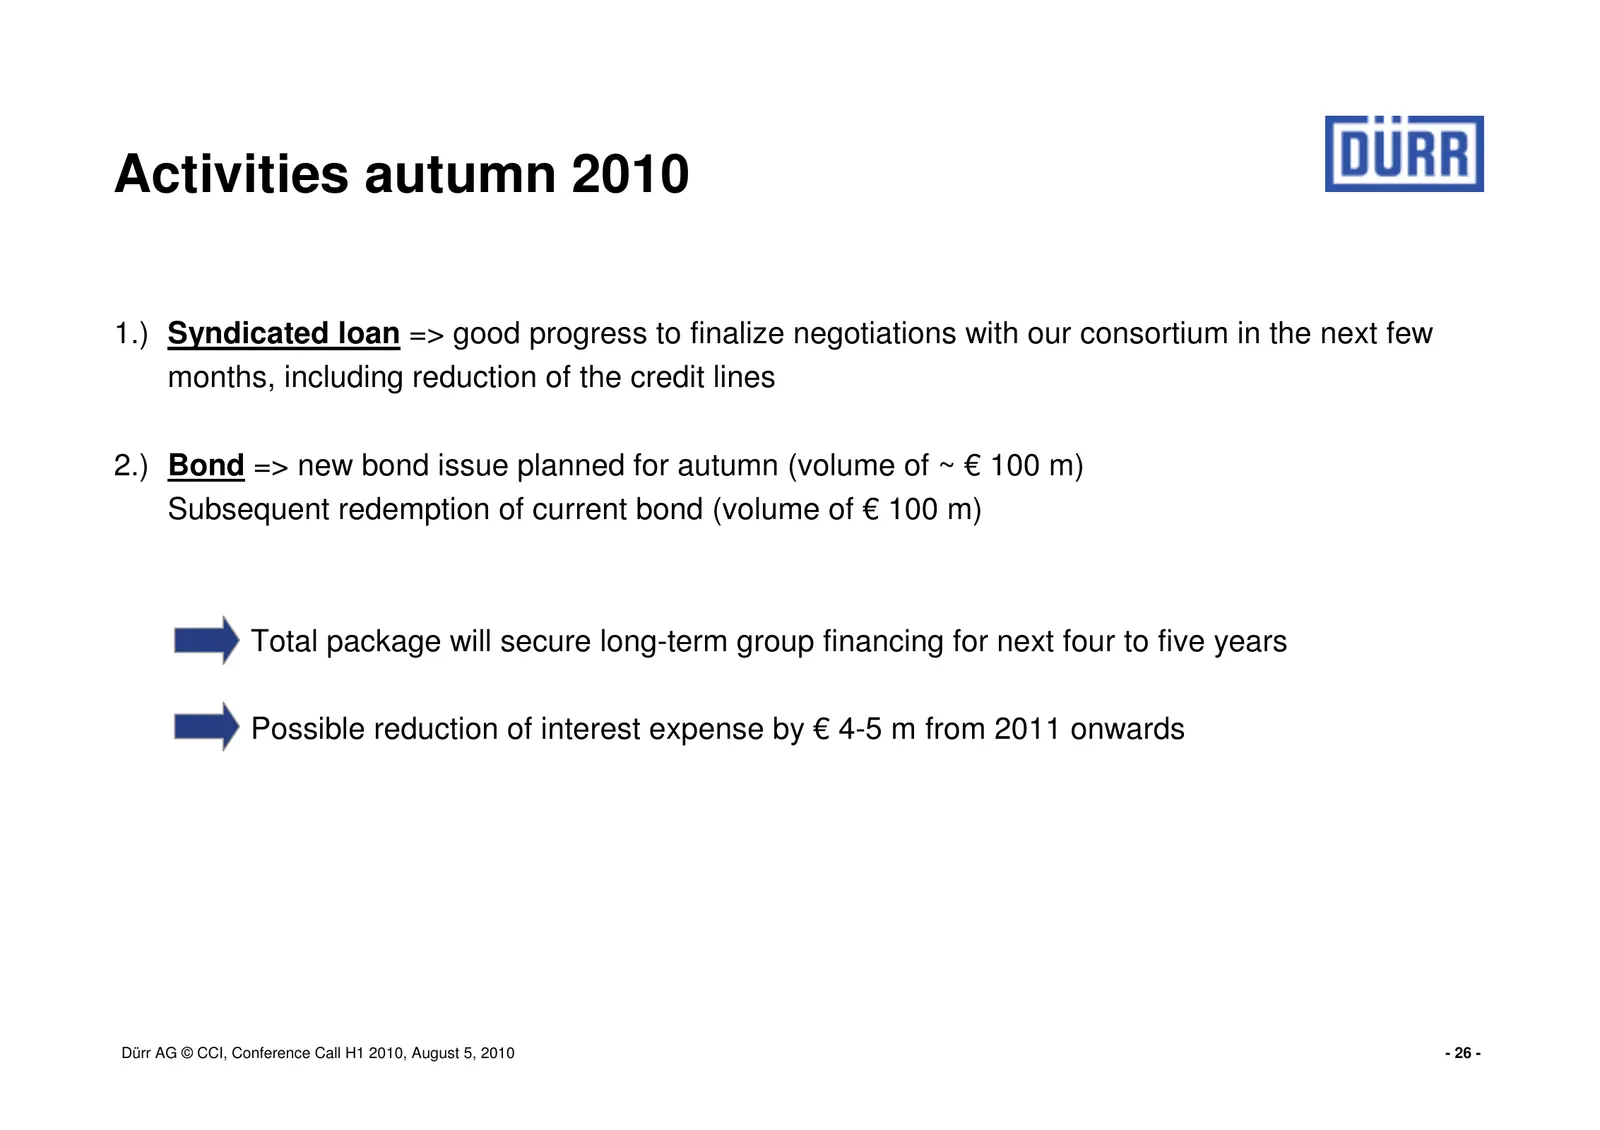
Activities autumn 2010 1.) Syndicated loan => good progress to finalize negotiations with our consortium in the next few months, including reduction of the credit lines 2.) Bond => new bond issue planned for autumn (volume of ~ € 100 m) Subsequent redemption of current bond (volume of € 100 m) Total
Slide 27: Good track record of the existing Dürr bond
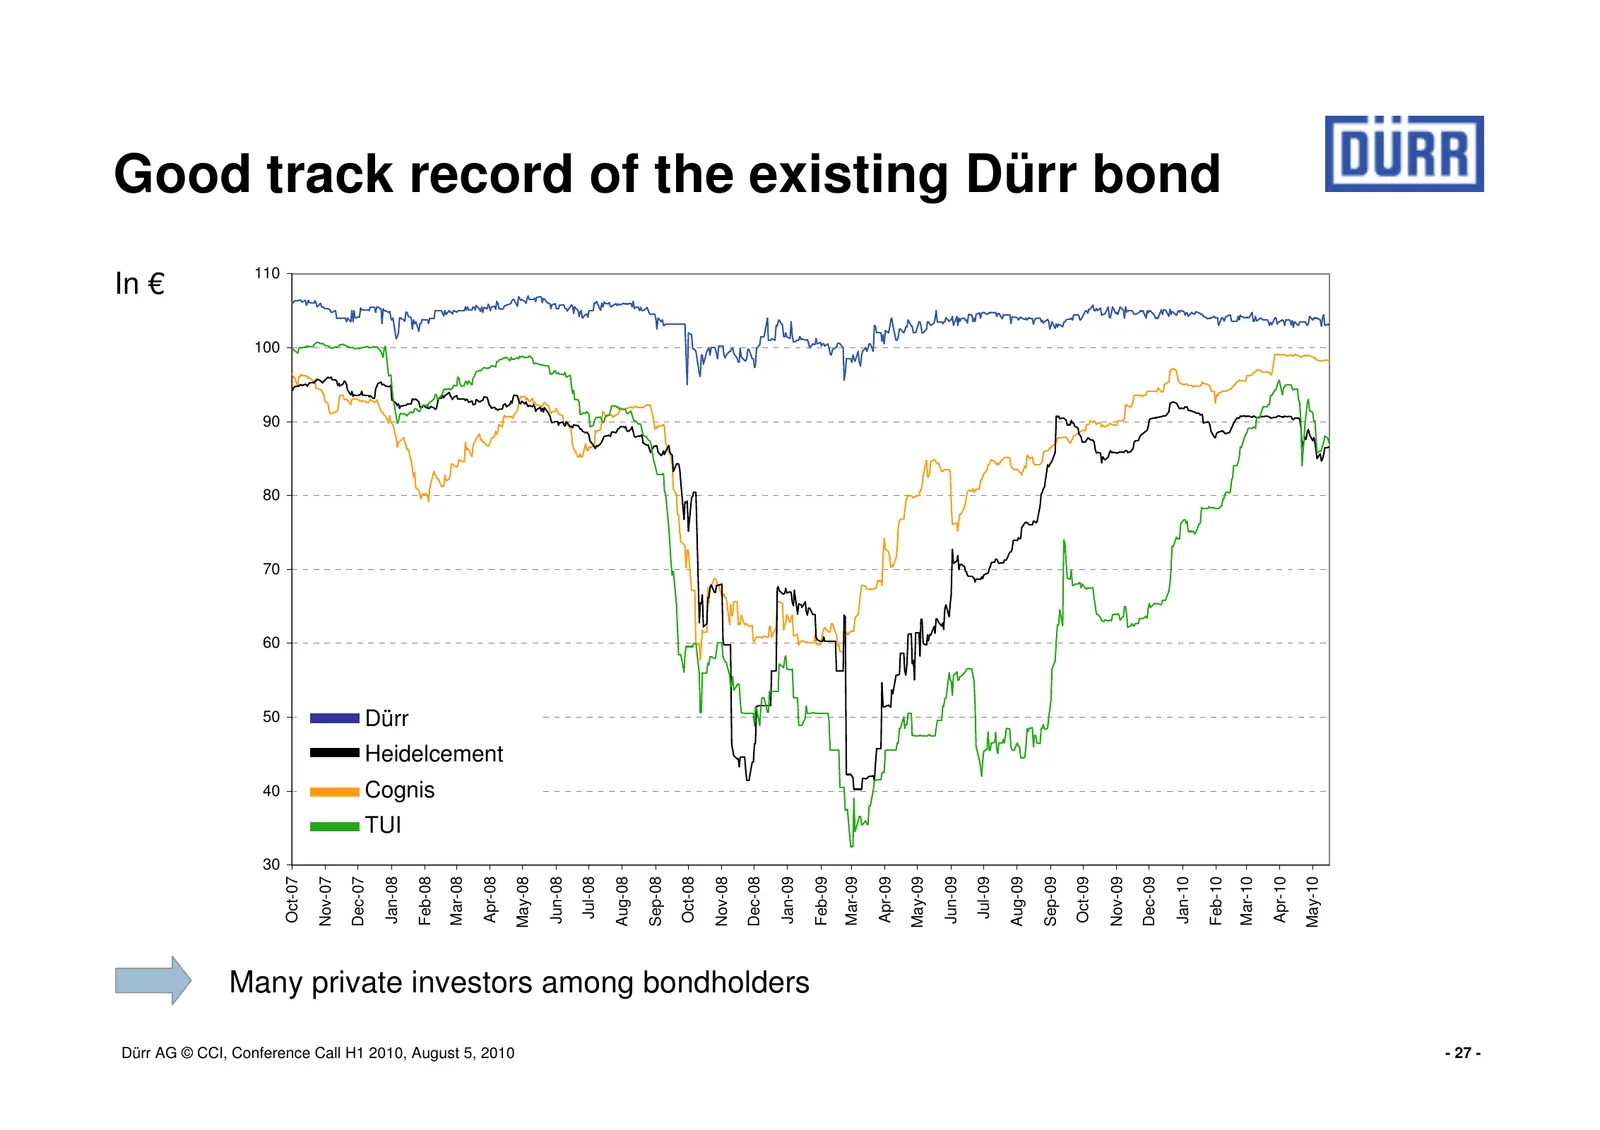
Good track record of the existing Dürr bond 110 In € 100 90 80 70 60 50 Dürr Cognis Heidelcement Heidelcement 40 Cognis TUI TUI Duerr 30 May-08 May-09 May-10 Oct-07 Nov-07 Dec-07 Jan-08 Feb-08 Mar-08 Apr-08 Jun-08 Jul-08 Aug-08 Sep-08 Oct-08 Nov-08 Dec-08 Jan-09 Feb-09 Mar-09 Apr-09 Jun-09 Jul-09 Au
Slide 28: Bond issue with an innovative concept
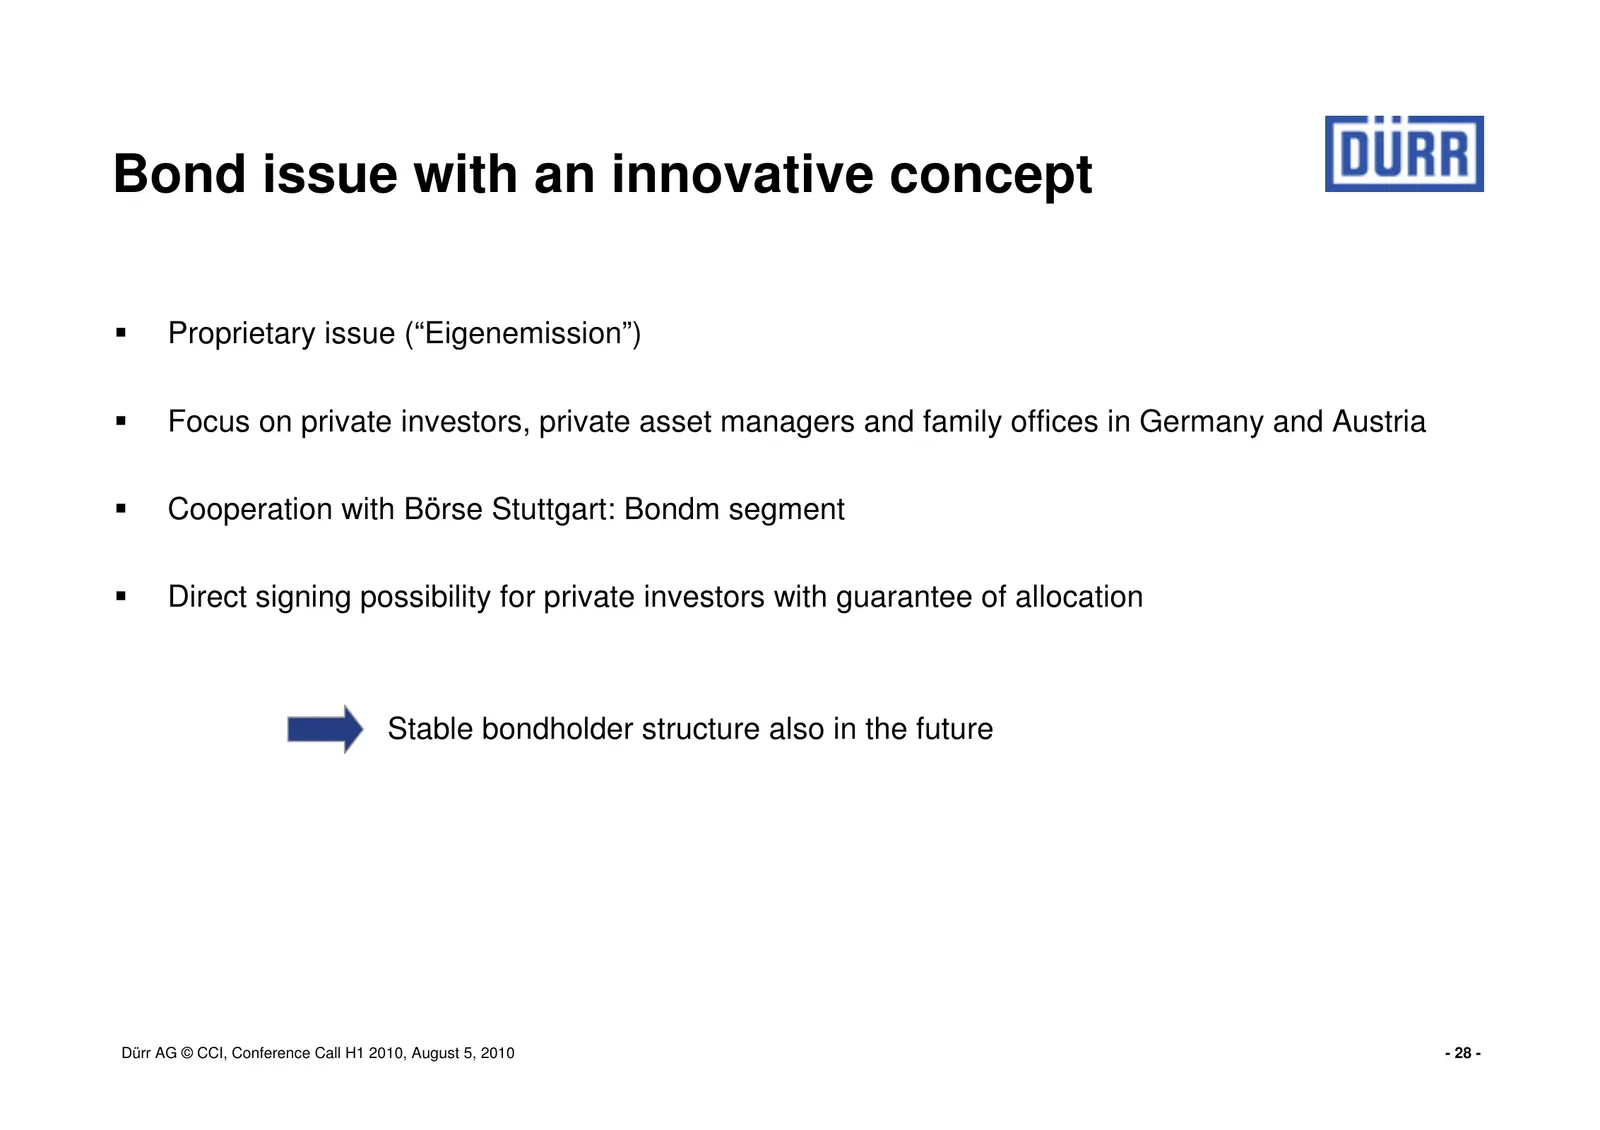
Bond issue with an innovative concept Proprietary issue (“Eigenemission”) Focus on private investors, private asset managers and family offices in Germany and Austria Cooperation with Börse Stuttgart: Bondm segment Direct signing possibility for private investors with guarantee of allocation Stable
Slide 29: Agenda
Agenda H1 Figures China Refinancing Summary Dürr AG © CCI, Conference Call H1 2010, August 5, 2010 - 29 -
Slide 30: Summary
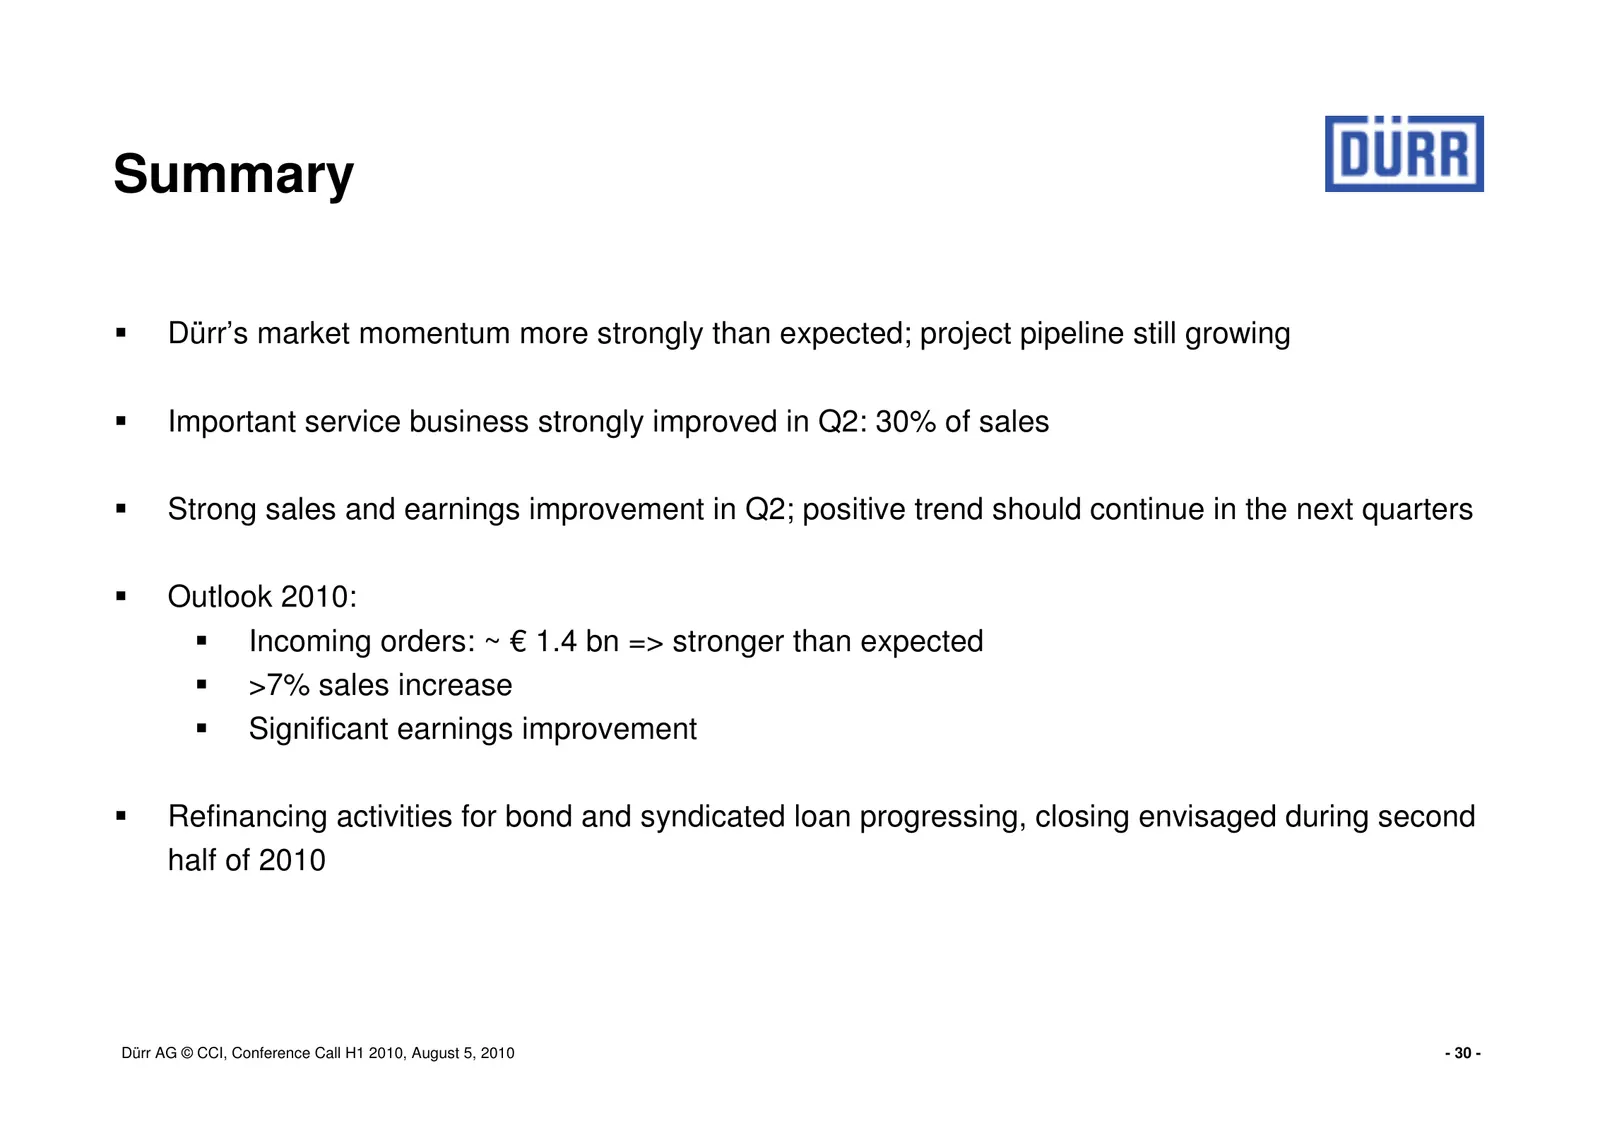
Summary Dürr’s market momentum more strongly than expected; project pipeline still growing Important service business strongly improved in Q2: 30% of sales Strong sales and earnings improvement in Q2; positive trend should continue in the next quarters Outlook 2010: Incoming orders: ~ € 1.4 bn => st
Slide 31: Financial calendar
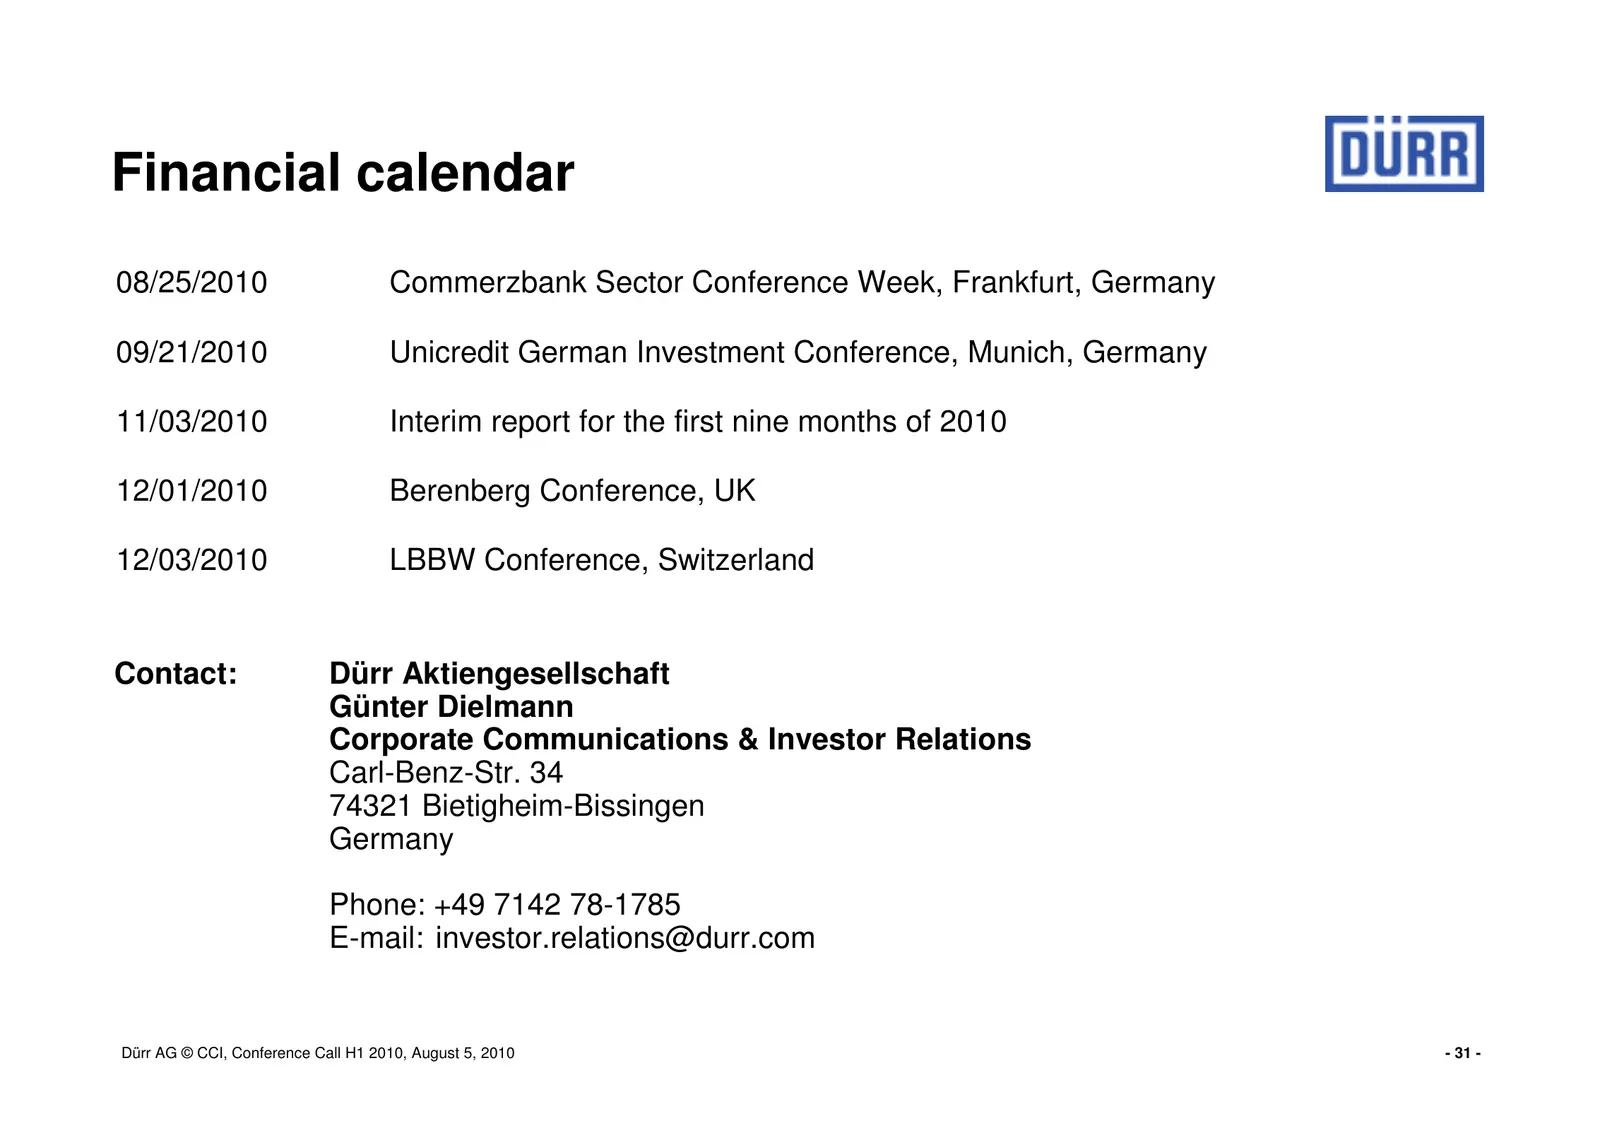
Financial calendar 08/25/2010 Commerzbank Sector Conference Week, Frankfurt, Germany 09/21/2010 Unicredit German Investment Conference, Munich, Germany 11/03/2010 Interim report for the first nine months of 2010 12/01/2010 Berenberg Conference, UK 12/03/2010 LBBW Conference, Switzerland Contact: Dür
Slide 32: Dürr AG © CCI, Conference Call H1 2010, August 5, 2010
Dürr AG © CCI, Conference Call H1 2010, August 5, 2010 - 32 -
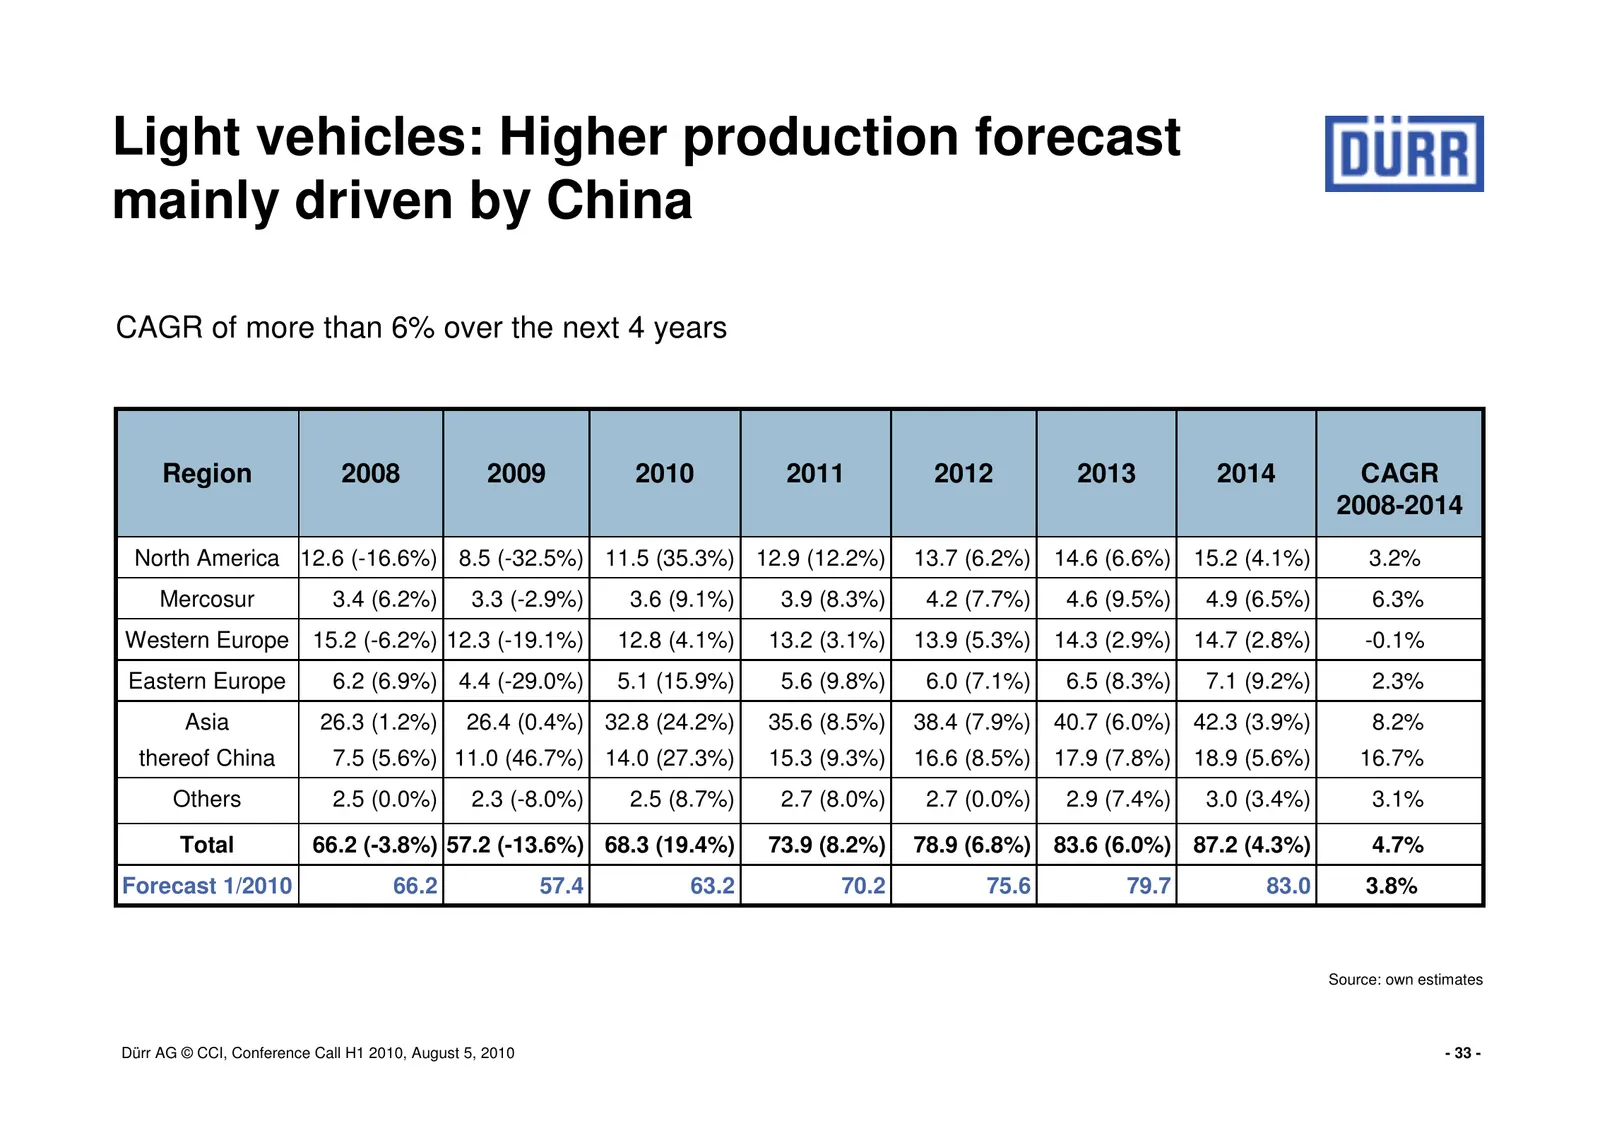
Slide 33: Light vehicles: Higher production forecast mainly driven by China
Light vehicles: Higher production forecast mainly driven by China CAGR of more than 6% over the next 4 years Region 2008 2009 2010 2011 2012 2013 2014 CAGR 2008-2014 North America 12.6 (-16.6%) 8.5 (-32.5%) 11.5 (35.3%) 12.9 (12.2%) 13.7 (6.2%) 14.6 (6.6%) 15.2 (4.1%) 3.2% Mercosur 3.4 (6.2%) 3.3 (-
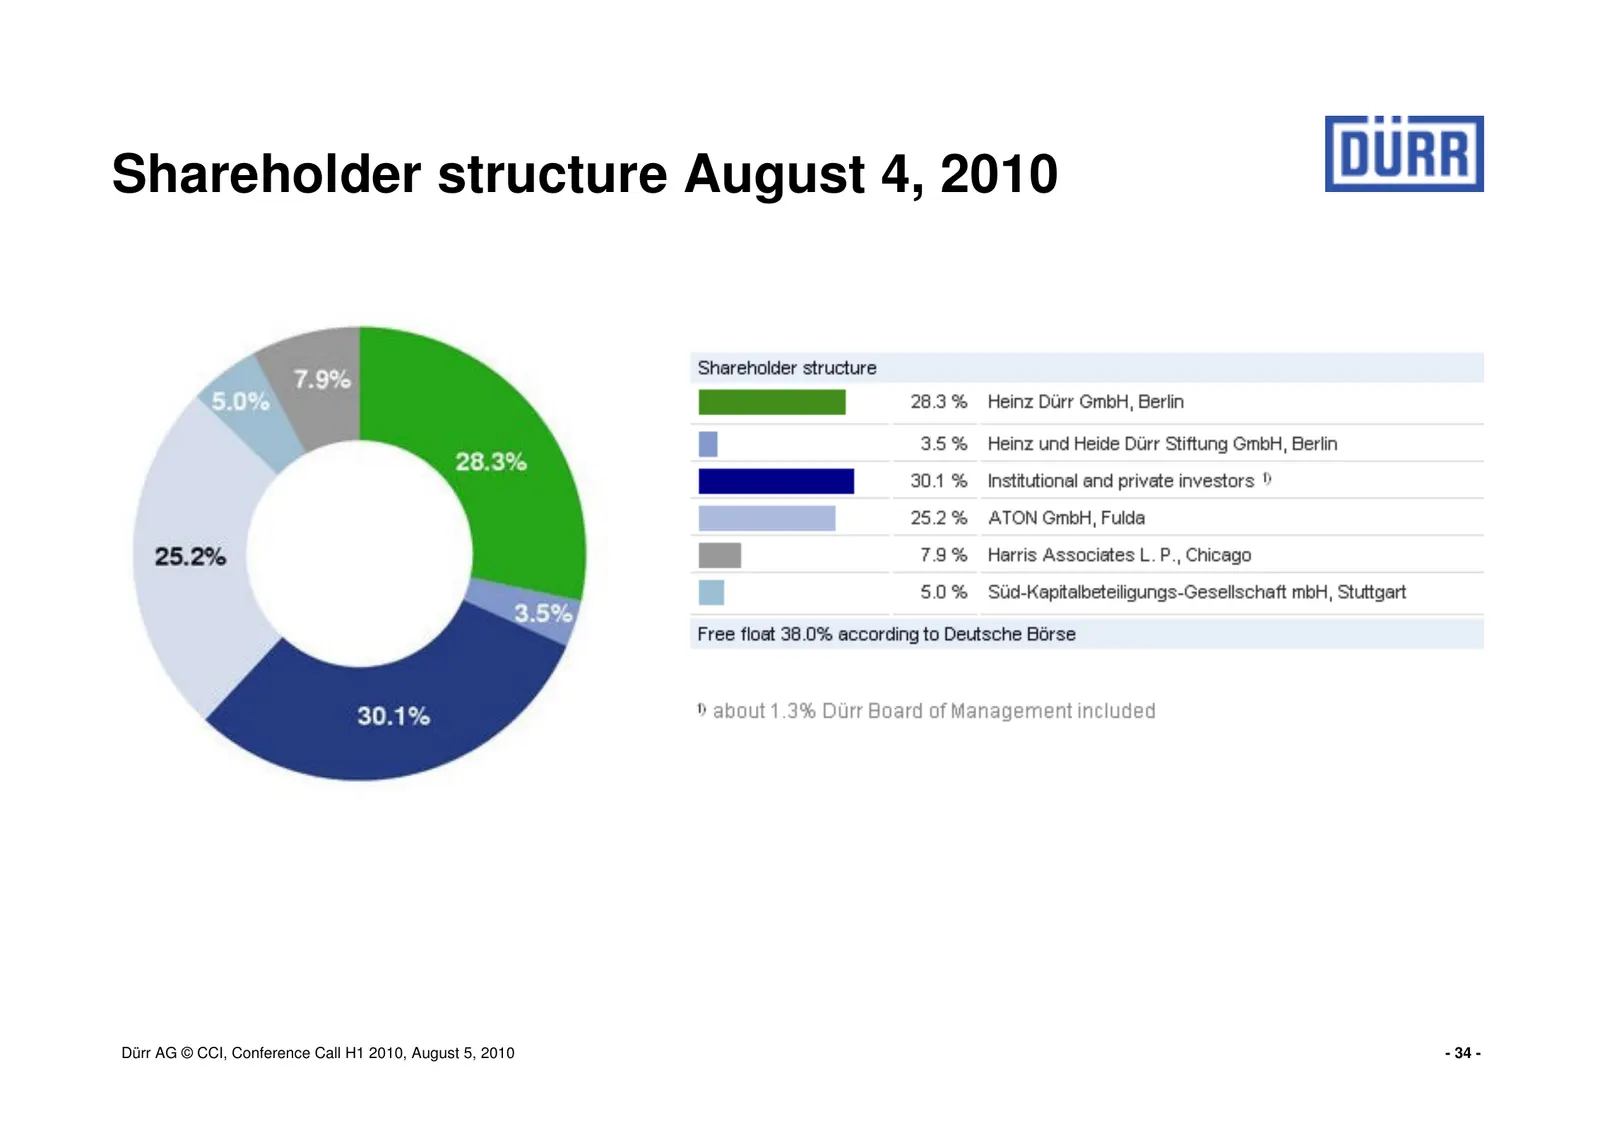
Slide 34: Shareholder structure August 4, 2010
Shareholder structure August 4, 2010 Dürr AG © CCI, Conference Call H1 2010, August 5, 2010 - 34 -
Source: Internet Archive copy of durr.com
More decks from Durr AG
 Q3 2026 Earnings Presentation33 slides · Nov 12, 2026
 Q2 2026 Earnings Presentation39 slides · Aug 6, 2026
 Q1 2026 Earnings Presentation35 slides · May 12, 2026
 Fact Sheet (2025)2 slides · Dec 2, 2025
 Q3 2025 Earnings Presentation46 slides · Nov 13, 2025
 Q2 2025 Earnings Presentation31 slides · Jul 24, 2025