Inovalon — Q3 2019 Earnings Presentation
31 slides from Inovalon's earnings presentation, Oct 30, 2019
Slide 1: Q3 2019 Earnings Supplement
Q3 2019 Earnings Supplement October 30, 2019
Slide 2: Cautionary Note Regarding Forward-Looking Statements
Cautionary Note Regarding Forward-Looking Statement Certain statements contained in this presentation constitute forward-looking statements within the meaning of, and are intended to be covered by the safe harbor provisions of, Section 27A of the Securities Act of 1933, as amended, and Section 21E o
Slide 3: Contents
Contents 1 Overview 2 2019 Q3 and TTM Financial Results This presentation serves as a supplement to the Inovalon announcement on October 30, 2019 pertaining to third quarter (Q3) of 2019 3 2019 Financial Guidance results and guidance. 4 2020 Financial Guidance 5 Appendix 1: Reconciliations INOV Q3 2
Slide 4: The Inovalon ONE Platform
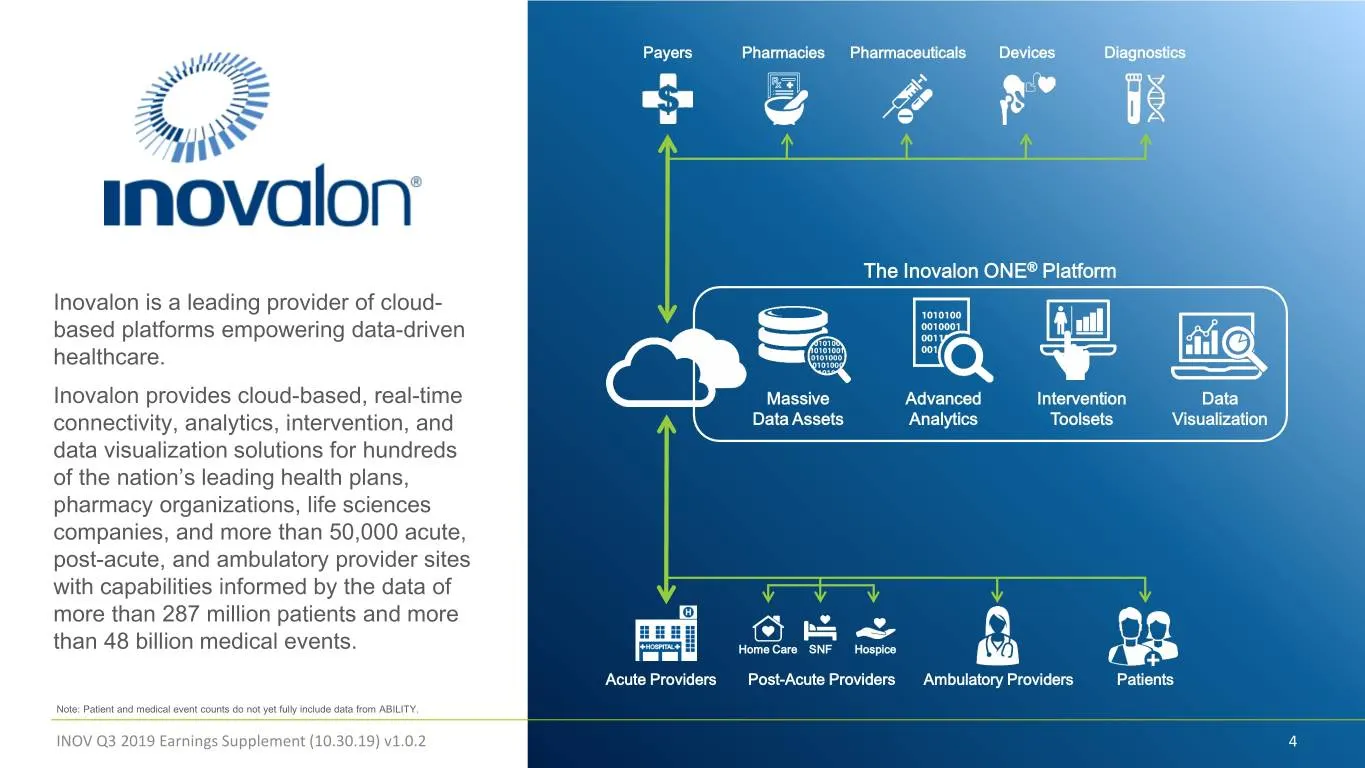
Payers Pharmacies Pharmaceuticals Devices Diagnostics The Inovalon ONE® Platform Inovalon is a leading provider of cloud- based platforms empowering data-driven healthcare. Inovalon provides cloud-based, real-time Massive Advanced Intervention Data connectivity, analytics, intervention, and Data Ass
Slide 5: Empowering Data-Driven Healthcare In Scale
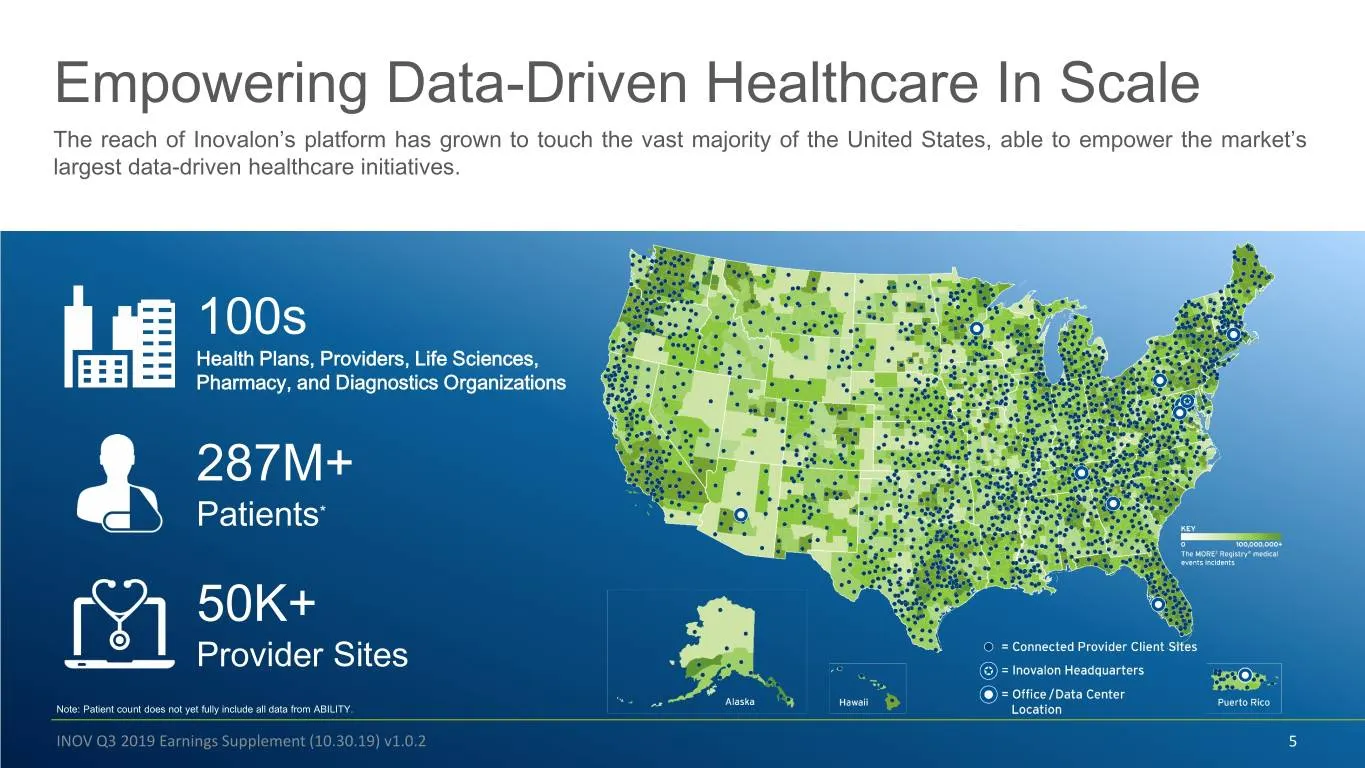
Empowering Data-Driven Healthcare In Scale The reach of Inovalon’s platform has grown to touch the vast majority of the United States, able to empower the market’s largest data-driven healthcare initiatives. 100s Health Plans, Providers, Life Sciences, Pharmacy, and Diagnostics Organizations 287M+ P
Slide 6: MORE2 Registry Dataset Growth
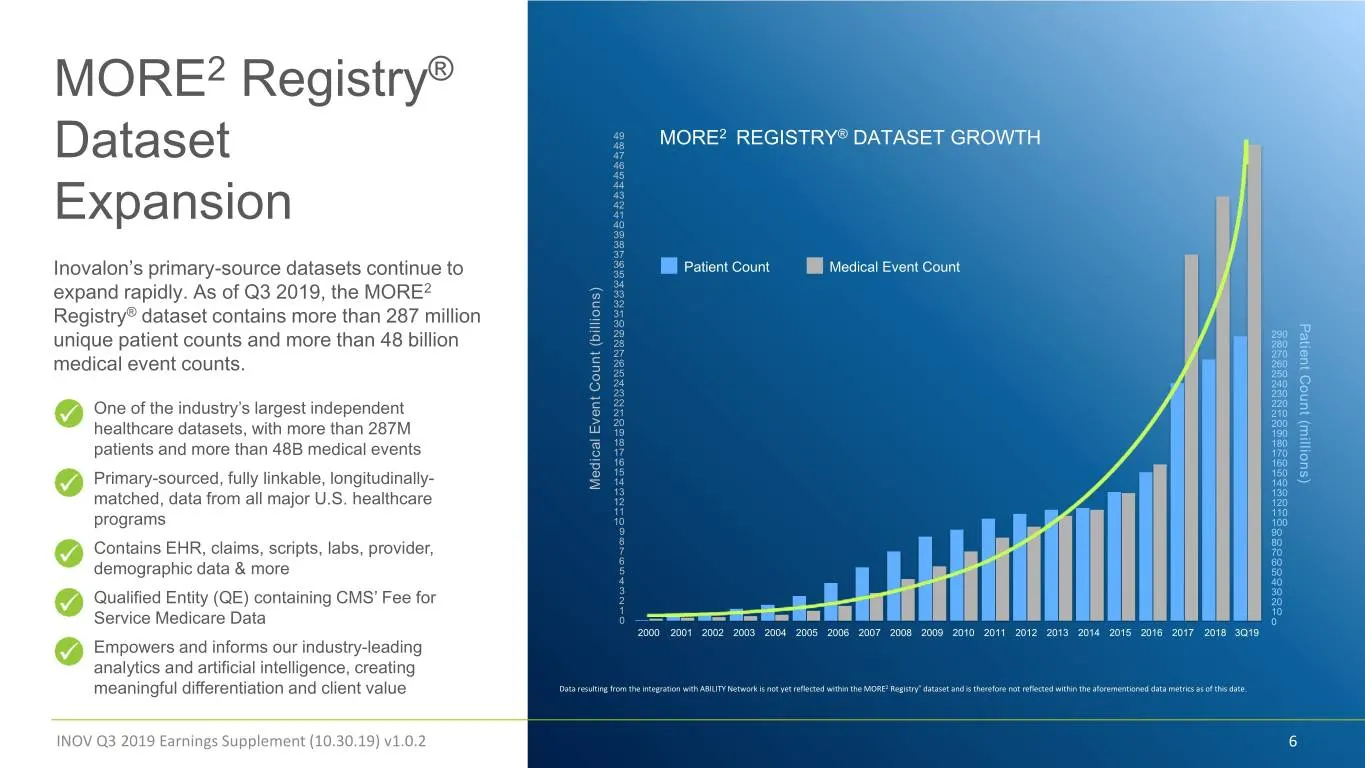
MORE2 Registry® 49 2 ® 48 MORE REGISTRY DATASET GROWTH 47 Dataset 46 45 44 43 42 41 Expansion 40 39 38 37 36 Patient Count Medical Event Count Inovalon’s primary-source datasets continue to 35 2 34 expand rapidly. As of Q3 2019, the MORE 33 32 ® 31 Registry dataset contains more than 287 million 30
Slide 7: Contents
Contents 1 Overview 2 2019 Q3 and TTM Financial Results This presentation serves as a supplement to the Inovalon announcement on October 30, 2019 pertaining to third quarter (Q3) of 2019 3 2019 Financial Guidance results and guidance. 4 2020 Financial Guidance 5 Appendix 1: Reconciliations INOV Q3 2
Slide 8: Q3 2019 Financial Highlights
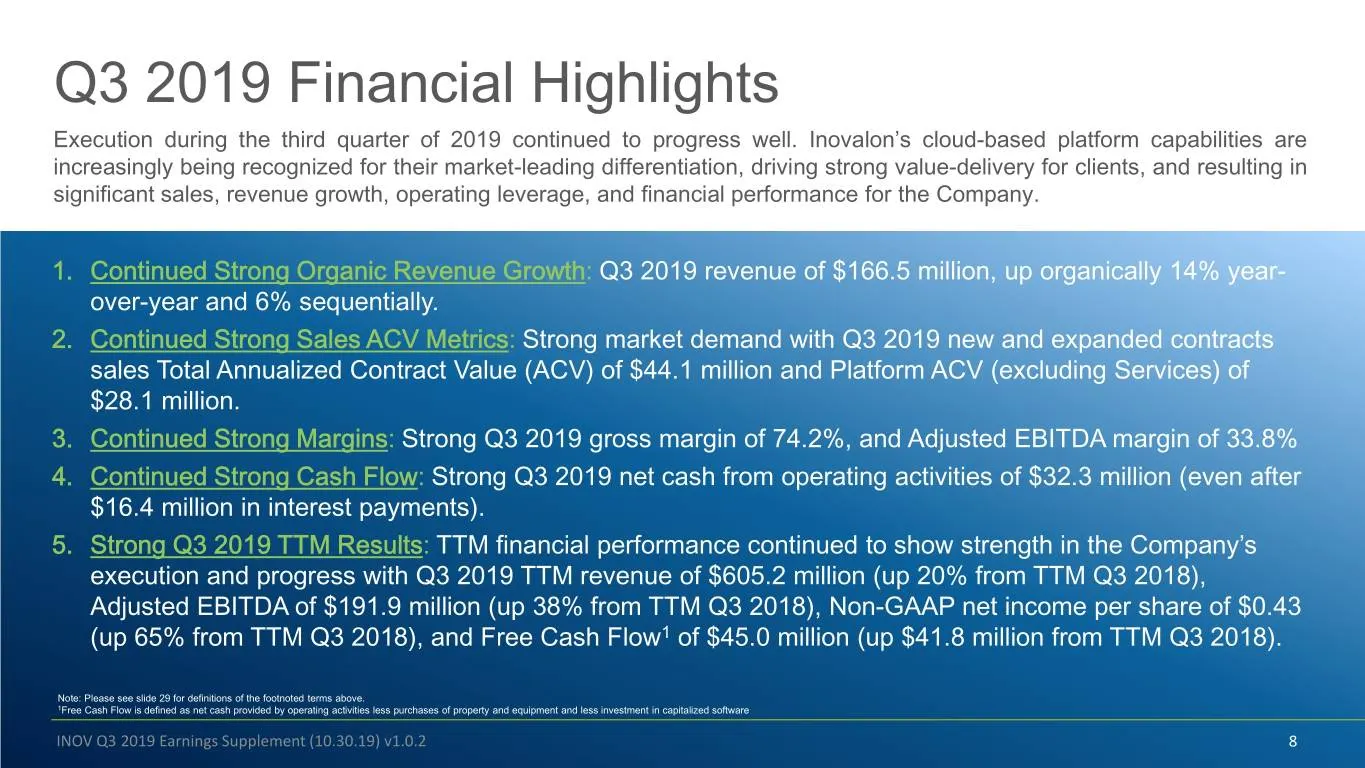
Q3 2019 Financial Highlights Execution during the third quarter of 2019 continued to progress well. Inovalon’s cloud-based platform capabilities are increasingly being recognized for their market-leading differentiation, driving strong value-delivery for clients, and resulting in significant sales,
Slide 9: Continued Strong Sales Performance
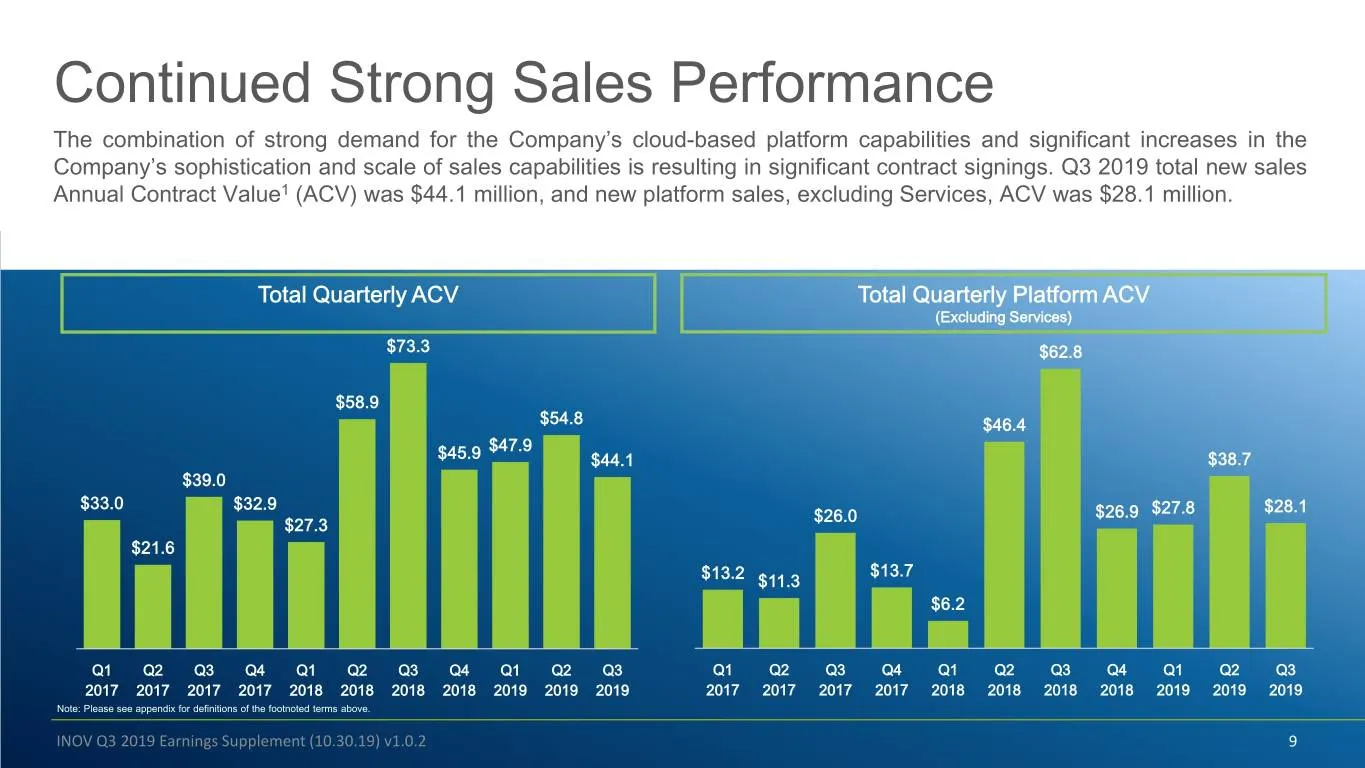
Continued Strong Sales Performance The combination of strong demand for the Company’s cloud-based platform capabilities and significant increases in the Company’s sophistication and scale of sales capabilities is resulting in significant contract signings. Q3 2019 total new sales Annual Contract Val
Slide 10: Continued Strong Growth Inflection
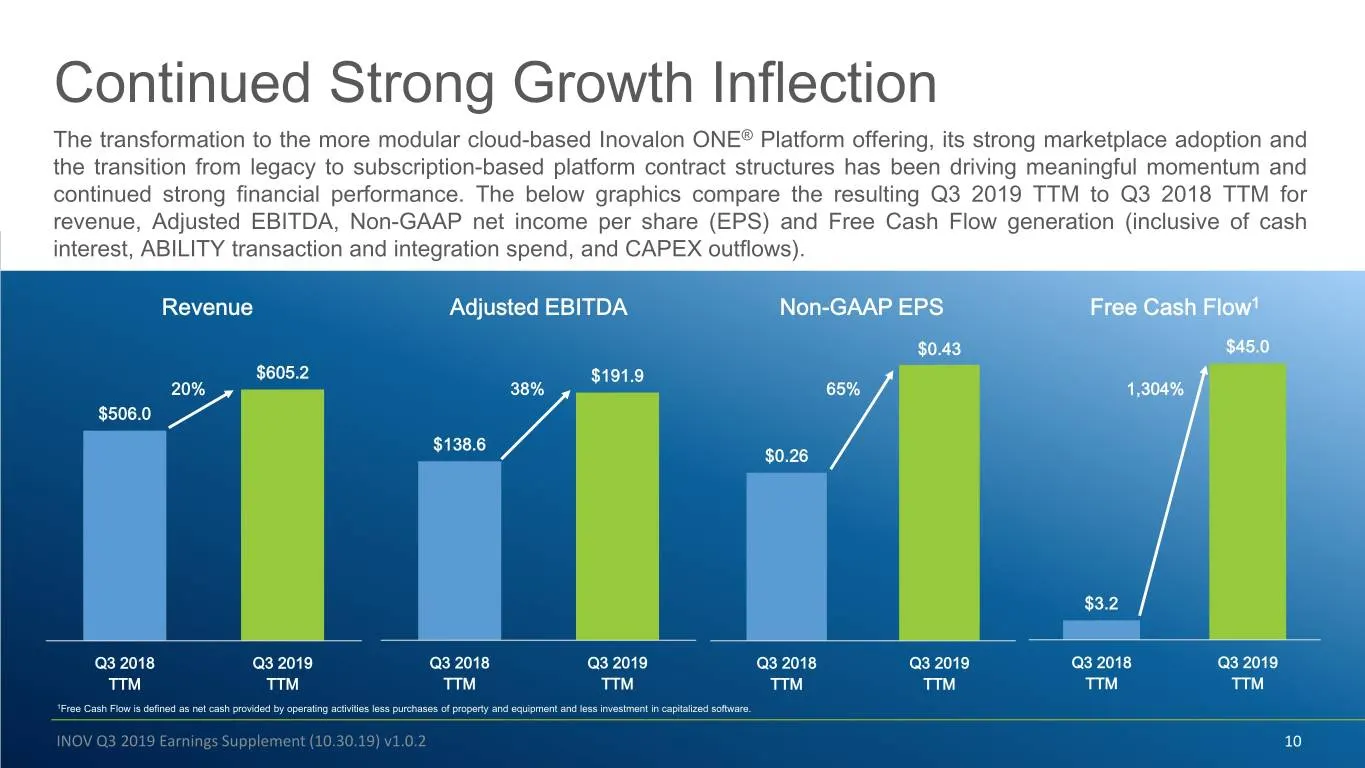
Continued Strong Growth Inflection The transformation to the more modular cloud-based Inovalon ONE® Platform offering, its strong marketplace adoption and the transition from legacy to subscription-based platform contract structures has been driving meaningful momentum and continued strong financial
Slide 11: Continued Salesforce Expansion
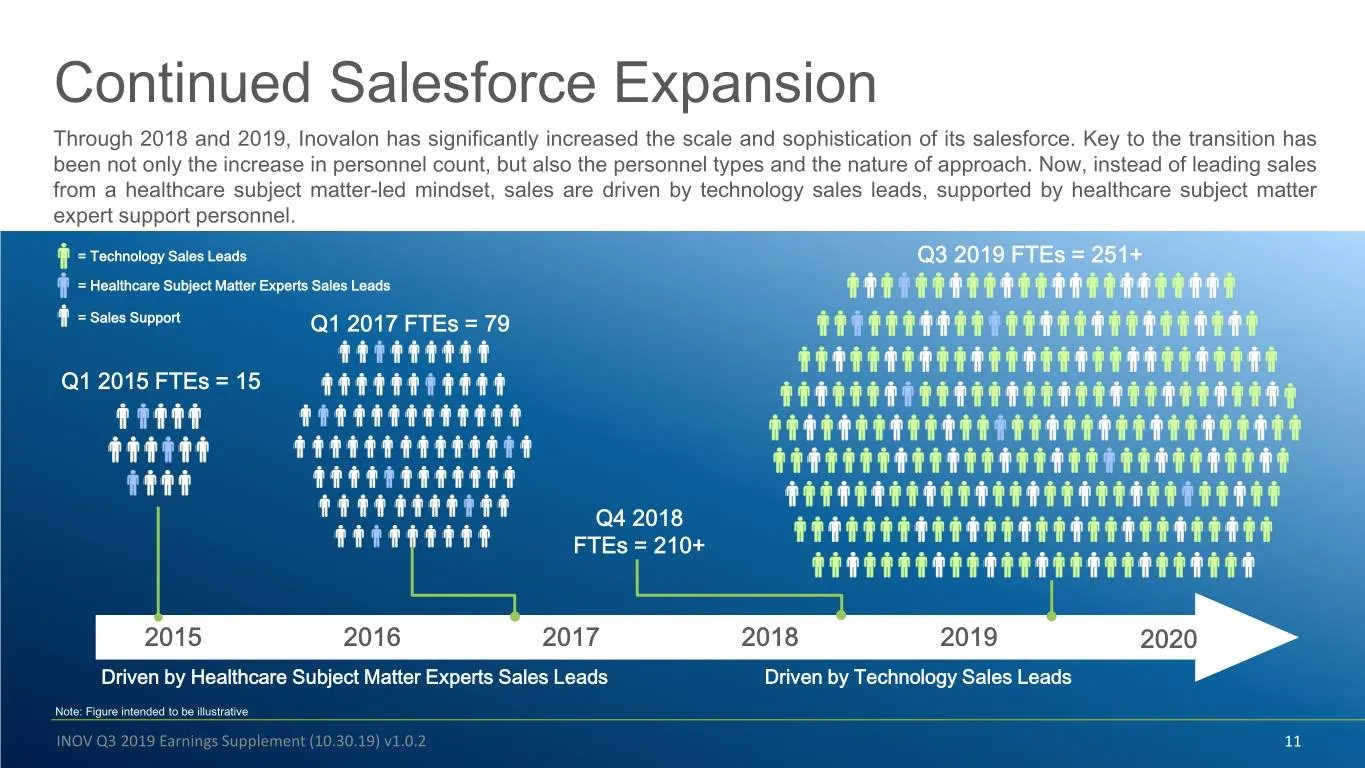
Continued Salesforce Expansion Through 2018 and 2019, Inovalon has significantly increased the scale and sophistication of its salesforce. Key to the transition has been not only the increase in personnel count, but also the personnel types and the nature of approach. Now, instead of leading sales f
Slide 12: Increasing Headcount Efficiency
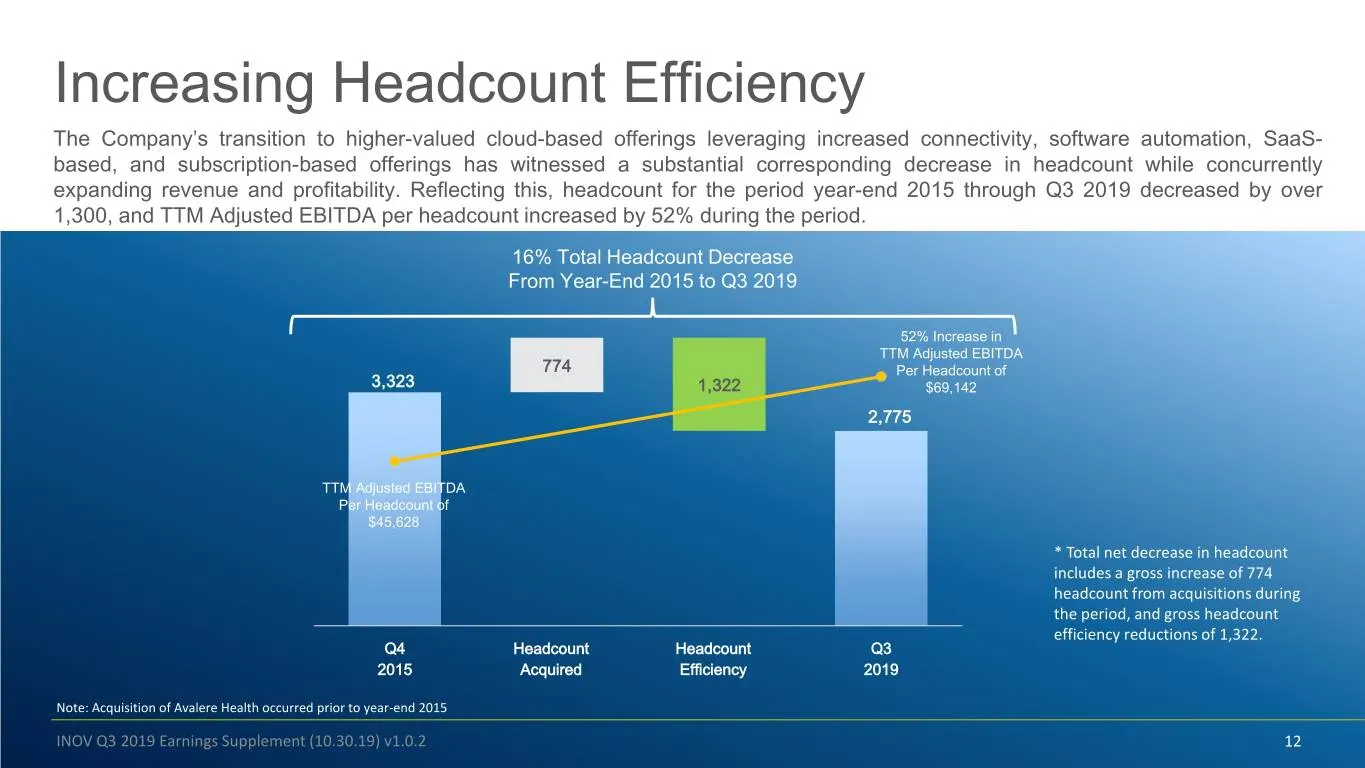
Increasing Headcount Efficiency The Company’s transition to higher-valued cloud-based offerings leveraging increased connectivity, software automation, SaaS- based, and subscription-based offerings has witnessed a substantial corresponding decrease in headcount while concurrently expanding revenue a
Slide 13: Contents
Contents 1 Overview 2 2019 Q3 and TTM Financial Results This presentation serves as a supplement to the Inovalon announcement on October 30, 2019 pertaining to third quarter (Q3) of 2019 3 2019 Financial Guidance results and guidance. 4 2020 Financial Guidance 5 Appendix 1: Reconciliations INOV Q3 2
Slide 14: 2019 Revenue Guidance Bridge
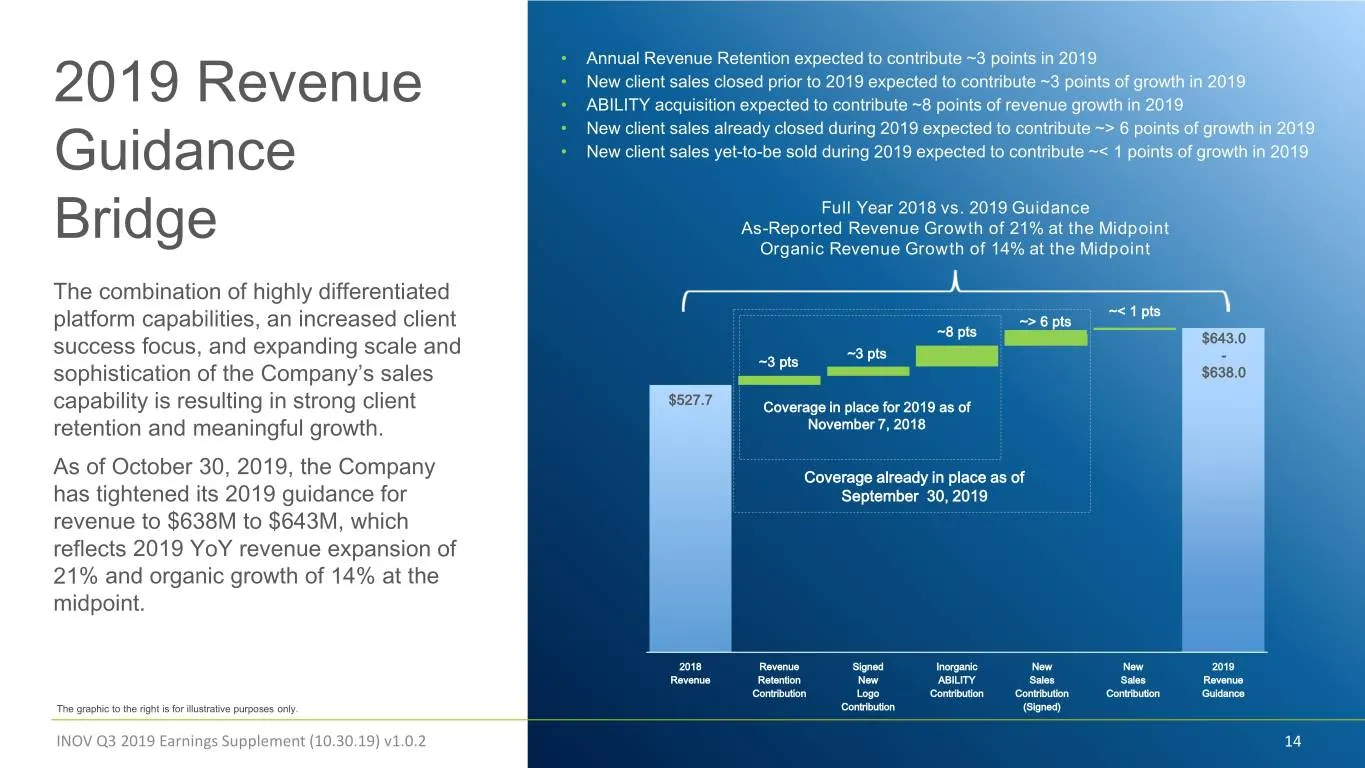
• Annual Revenue Retention expected to contribute ~3 points in 2019 • New client sales closed prior to 2019 expected to contribute ~3 points of growth in 2019 2019 Revenue • ABILITY acquisition expected to contribute ~8 points of revenue growth in 2019 • New client sales already closed during 2019 e
Slide 15: 2019 Adjusted EBITDA Margin Bridge
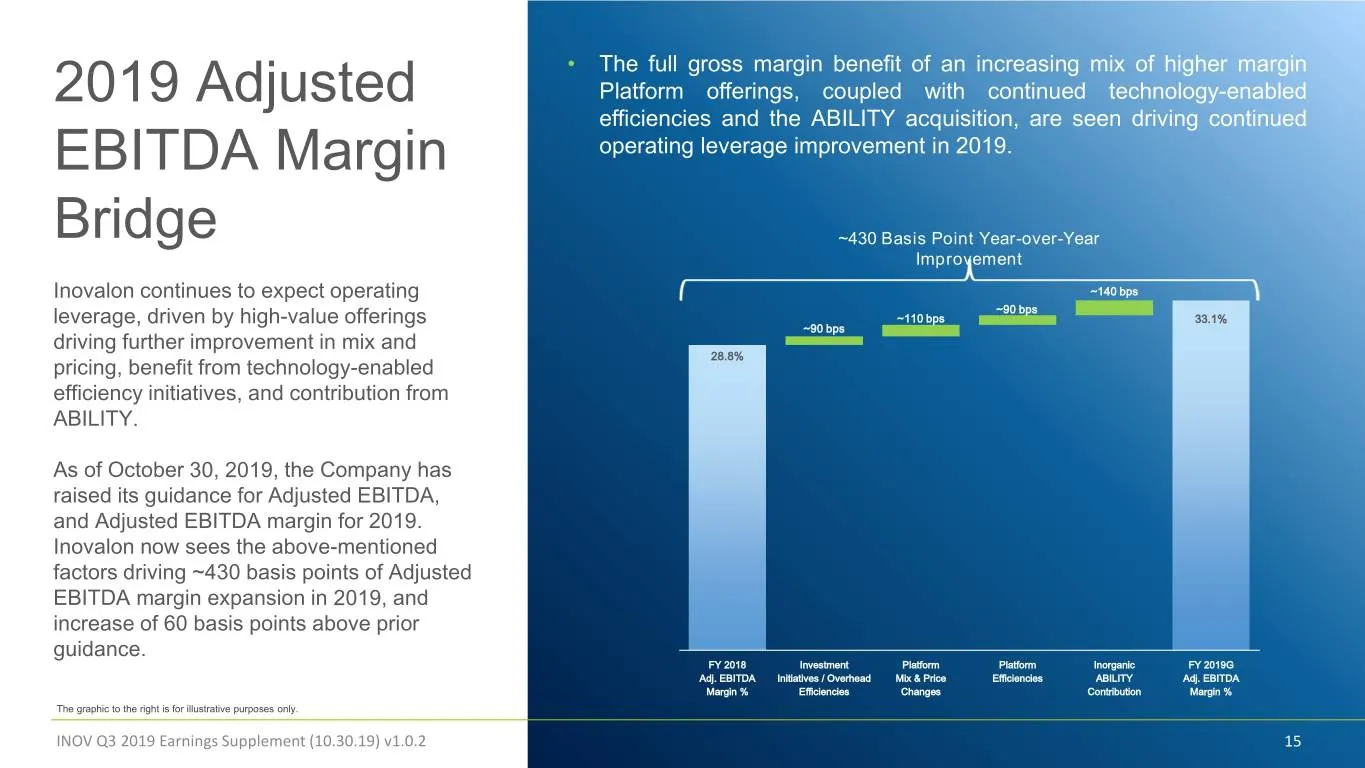
• The full gross margin benefit of an increasing mix of higher margin 2019 Adjusted Platform offerings, coupled with continued technology-enabled efficiencies and the ABILITY acquisition, are seen driving continued EBITDA Margin operating leverage improvement in 2019. Bridge ~430 Basis Point Year-ov
Slide 16: Full Year 2019 Financial Guidance
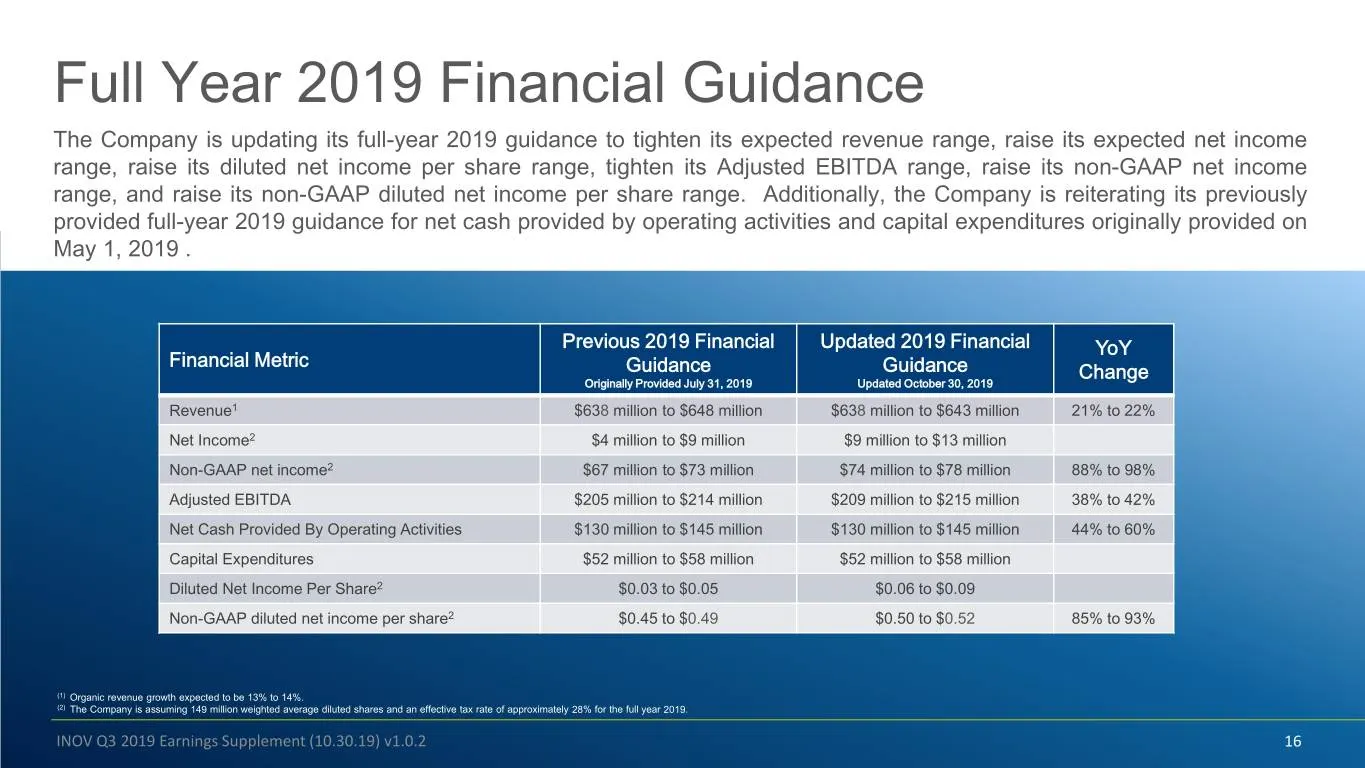
Full Year 2019 Financial Guidance The Company is updating its full-year 2019 guidance to tighten its expected revenue range, raise its expected net income range, raise its diluted net income per share range, tighten its Adjusted EBITDA range, raise its non-GAAP net income range, and raise its non-GA
Slide 17: Q4 2019 Financial Guidance
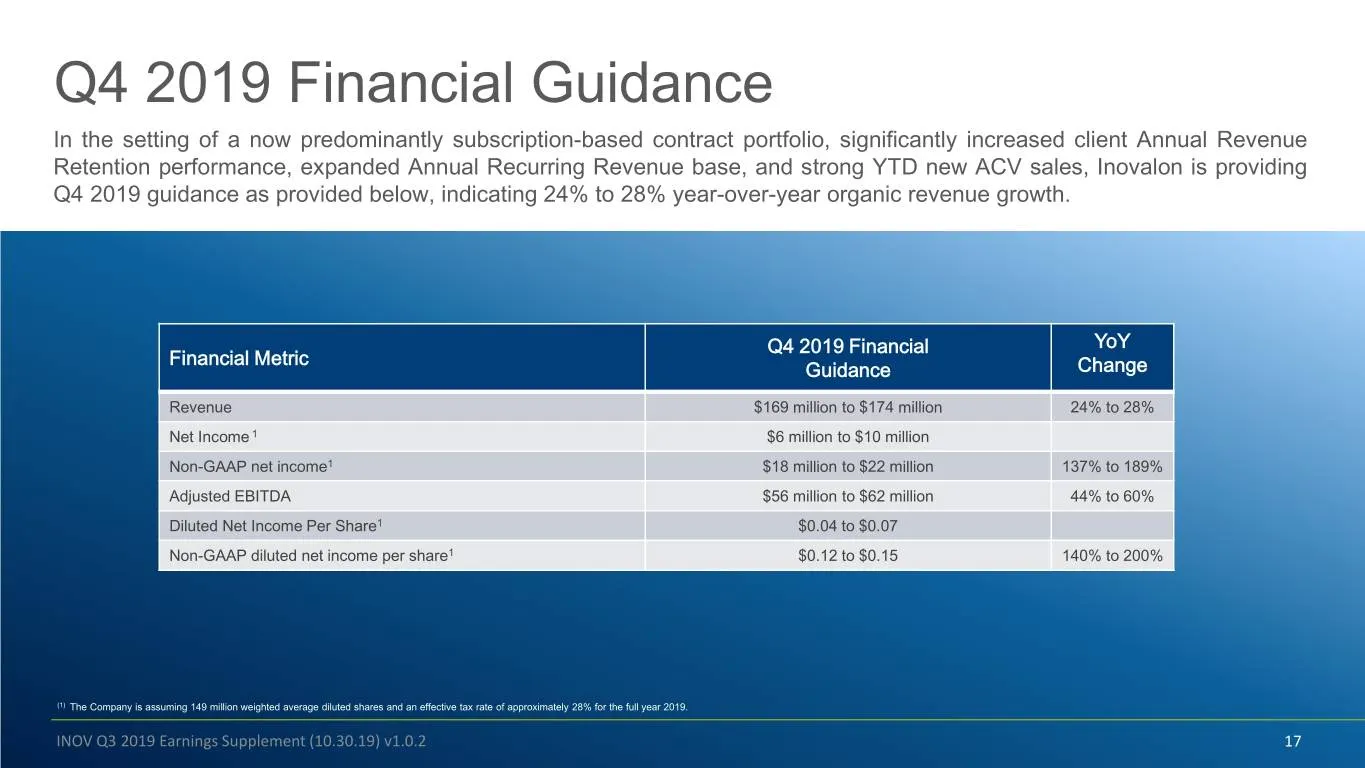
Q4 2019 Financial Guidance In the setting of a now predominantly subscription-based contract portfolio, significantly increased client Annual Revenue Retention performance, expanded Annual Recurring Revenue base, and strong YTD new ACV sales, Inovalon is providing Q4 2019 guidance as provided below,
Slide 18: Contents
Contents 1 Overview 2 2019 Q3 and TTM Financial Results This presentation serves as a supplement to the Inovalon announcement on October 30, 2019 pertaining to third quarter (Q3) of 2019 3 2019 Financial Guidance results and guidance. 4 2020 Financial Guidance 5 Appendix 1: Reconciliations INOV Q3 2
Slide 19: Strong Subscription-Based Platform Adoption
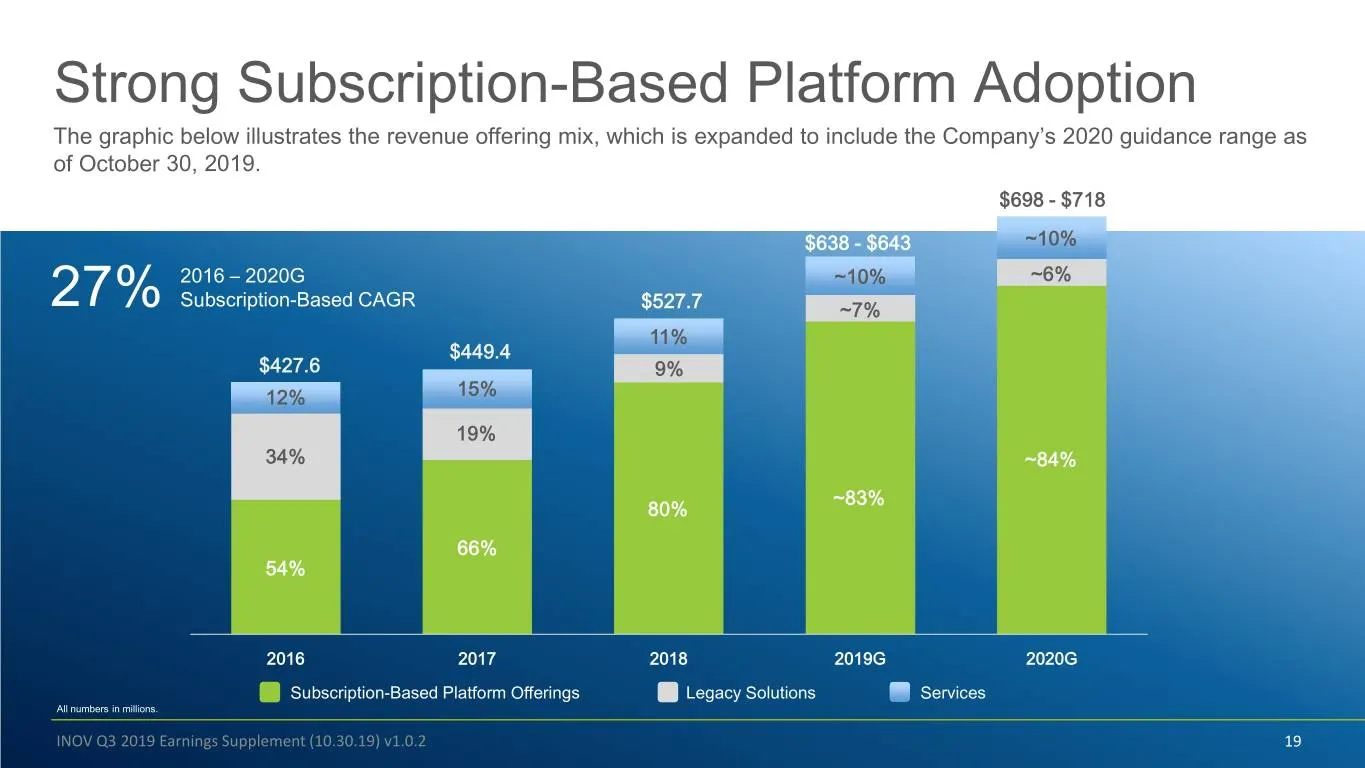
Strong Subscription-Based Platform Adoption The graphic below illustrates the revenue offering mix, which is expanded to include the Company’s 2020 guidance range as of October 30, 2019. $698 - $718 $638 - $643 ~10% 2016 – 2020G ~10% ~6% Subscription-Based CAGR 27% $527.7 ~7% 11% $449.4 $427.6 9% 12
Slide 20: Revenue
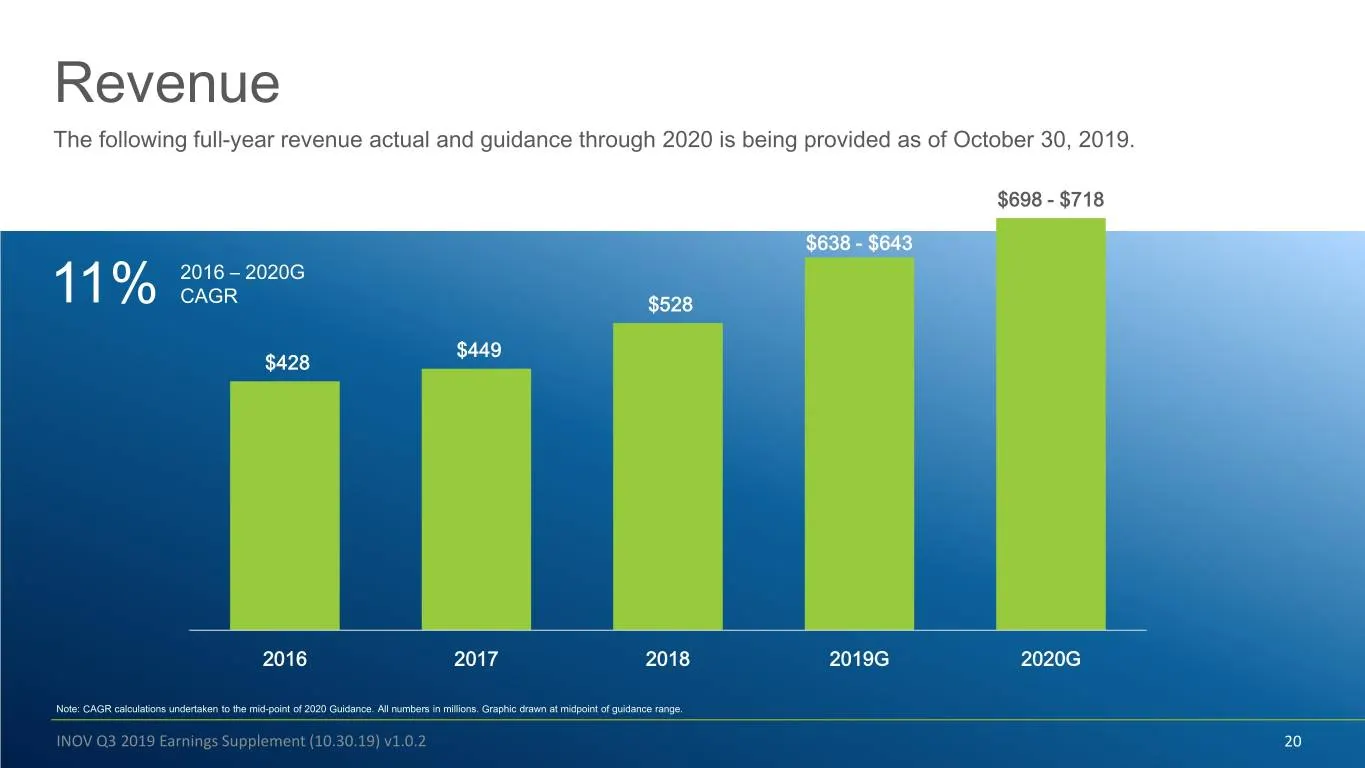
Revenue The following full-year revenue actual and guidance through 2020 is being provided as of October 30, 2019. $698 - $718 $638 - $643 2016 – 2020G 11% CAGR $528 $449 $428 2016 2017 2018 2019G 2020G Note: CAGR calculations undertaken to the mid-point of 2020 Guidance. All numbers in millions. Gr
Slide 21: Expected Quarterly Revenue Cadence
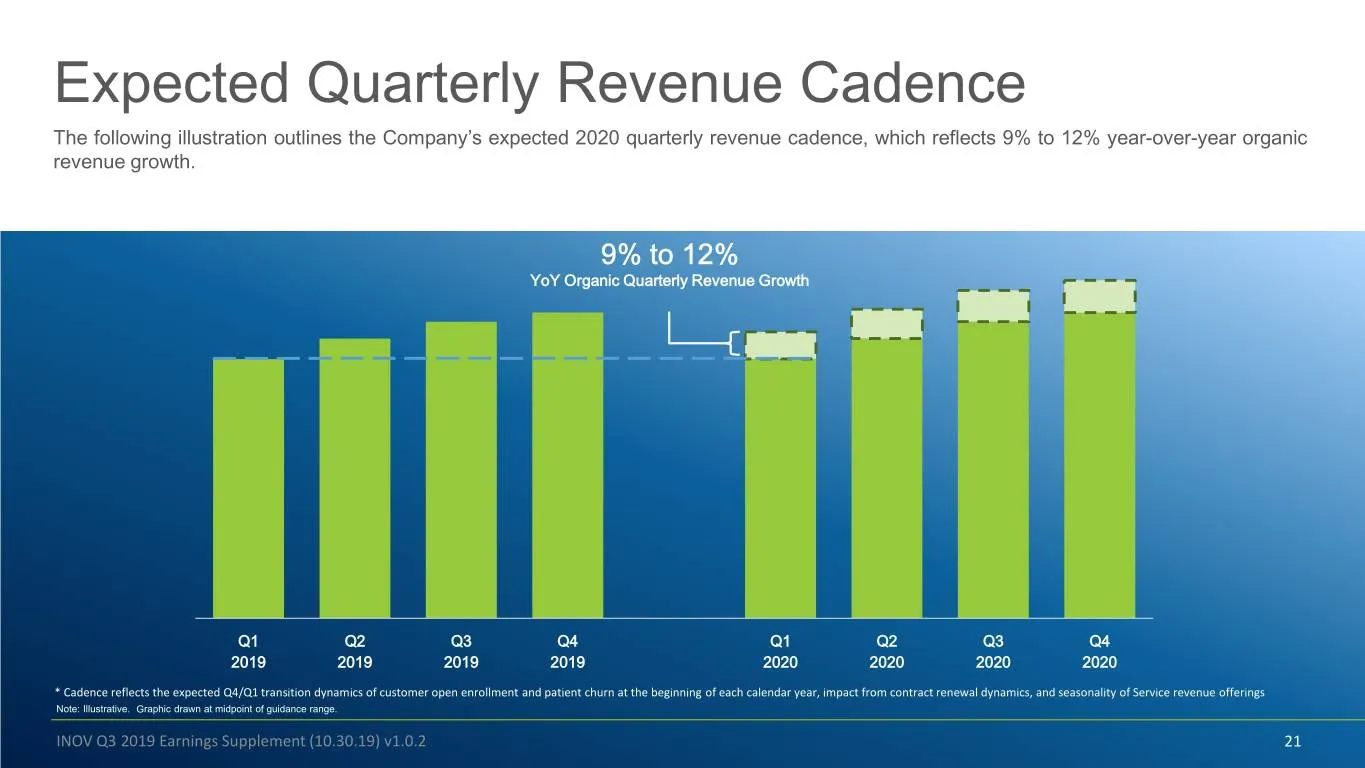
Expected Quarterly Revenue Cadence The following illustration outlines the Company’s expected 2020 quarterly revenue cadence, which reflects 9% to 12% year-over-year organic revenue growth. 9% to 12% YoY Organic Quarterly Revenue Growth Q1 Q2 Q3 Q4 Q1 Q2 Q3 Q4 2019 2019 2019 2019 2020 2020 2020 2020
Slide 22: Adjusted EBITDA
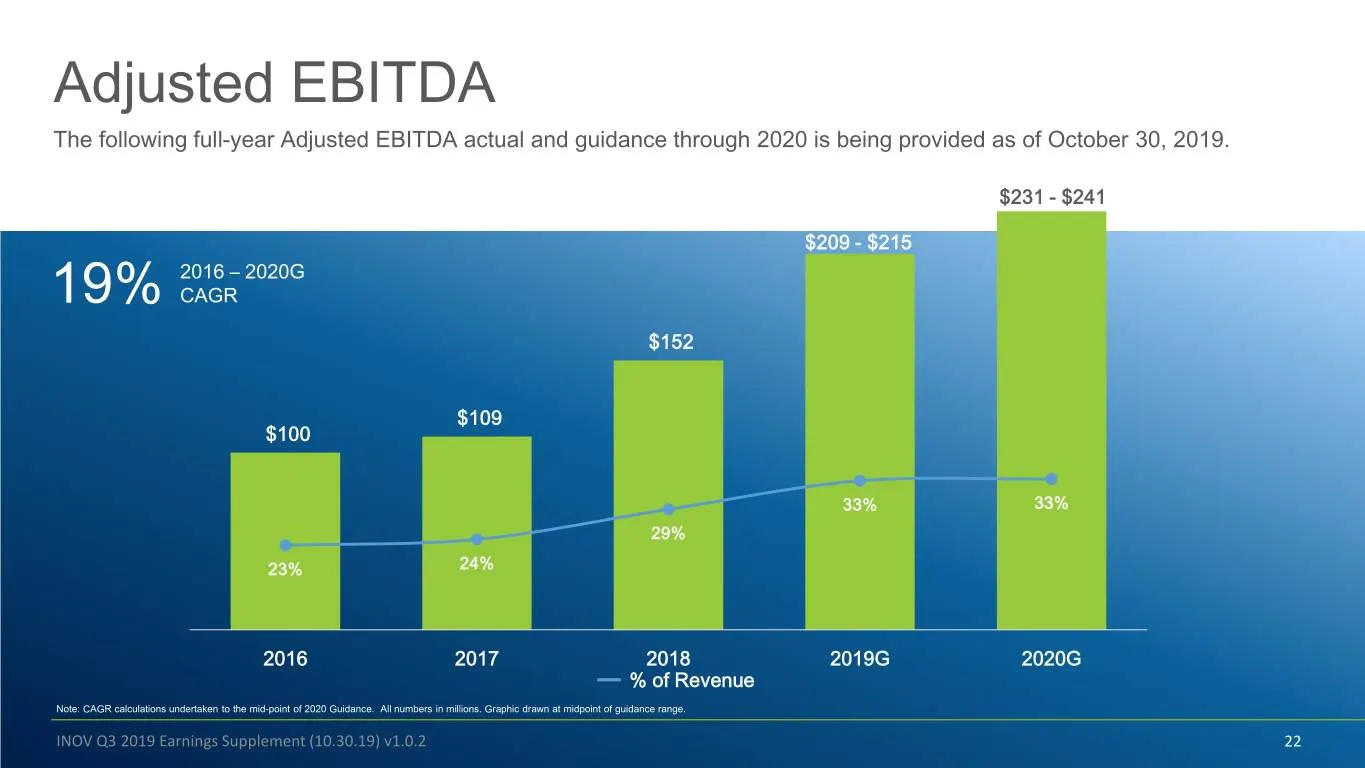
Adjusted EBITDA The following full-year Adjusted EBITDA actual and guidance through 2020 is being provided as of October 30, 2019. $231 - $241 $209 - $215 2016 – 2020G 19% CAGR $152 $109 $100 33% 33% 29% 23% 24% 2016 2017 2018 2019G 2020G % of Revenue Note: CAGR calculations undertaken to the mid-po
Slide 23: Cash Flow From Operations
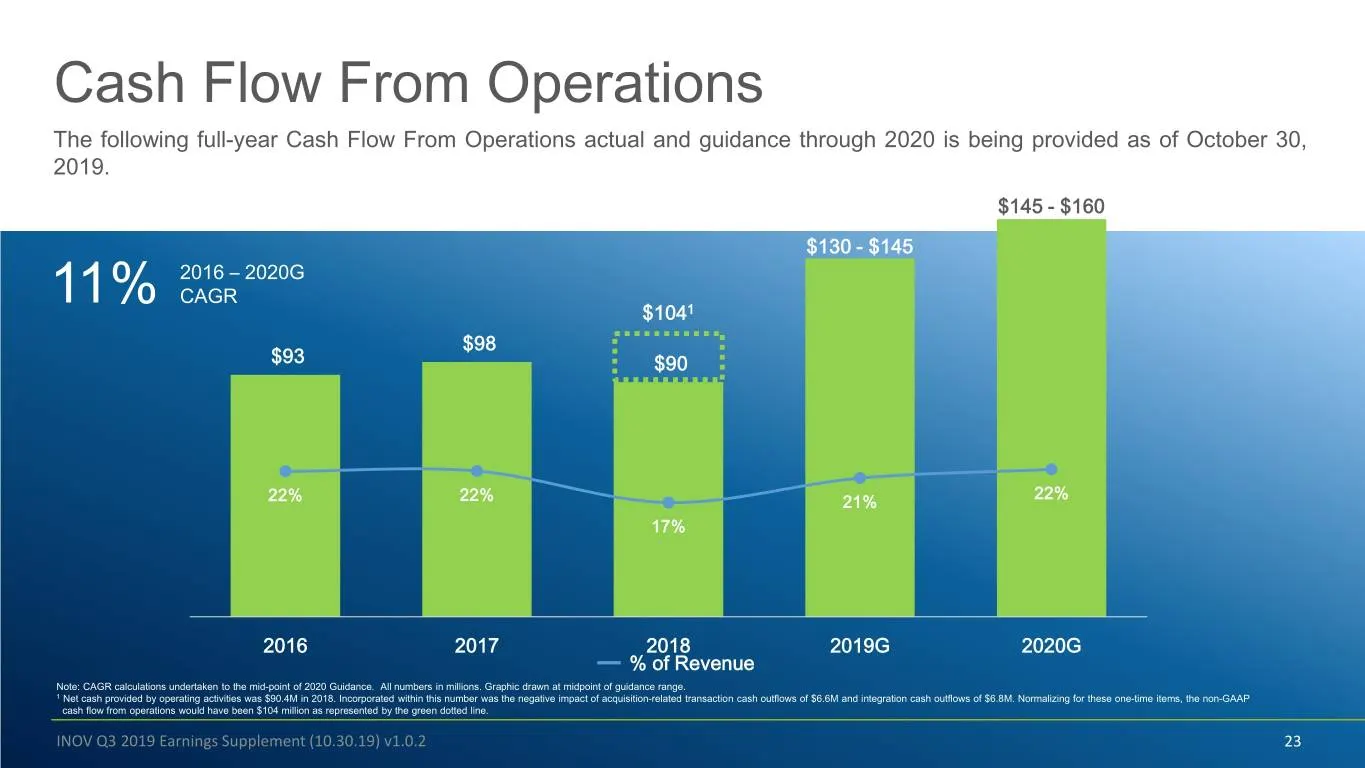
Cash Flow From Operations The following full-year Cash Flow From Operations actual and guidance through 2020 is being provided as of October 30, 2019. $145 - $160 $130 - $145 2016 – 2020G CAGR 11% $1041 $98 $93 $90 22% 22% 22% 21% 17% 2016 2017 2018 2019G 2020G % of Revenue Note: CAGR calculations u
Slide 24: CAPEX Returning Towards Historical Levels
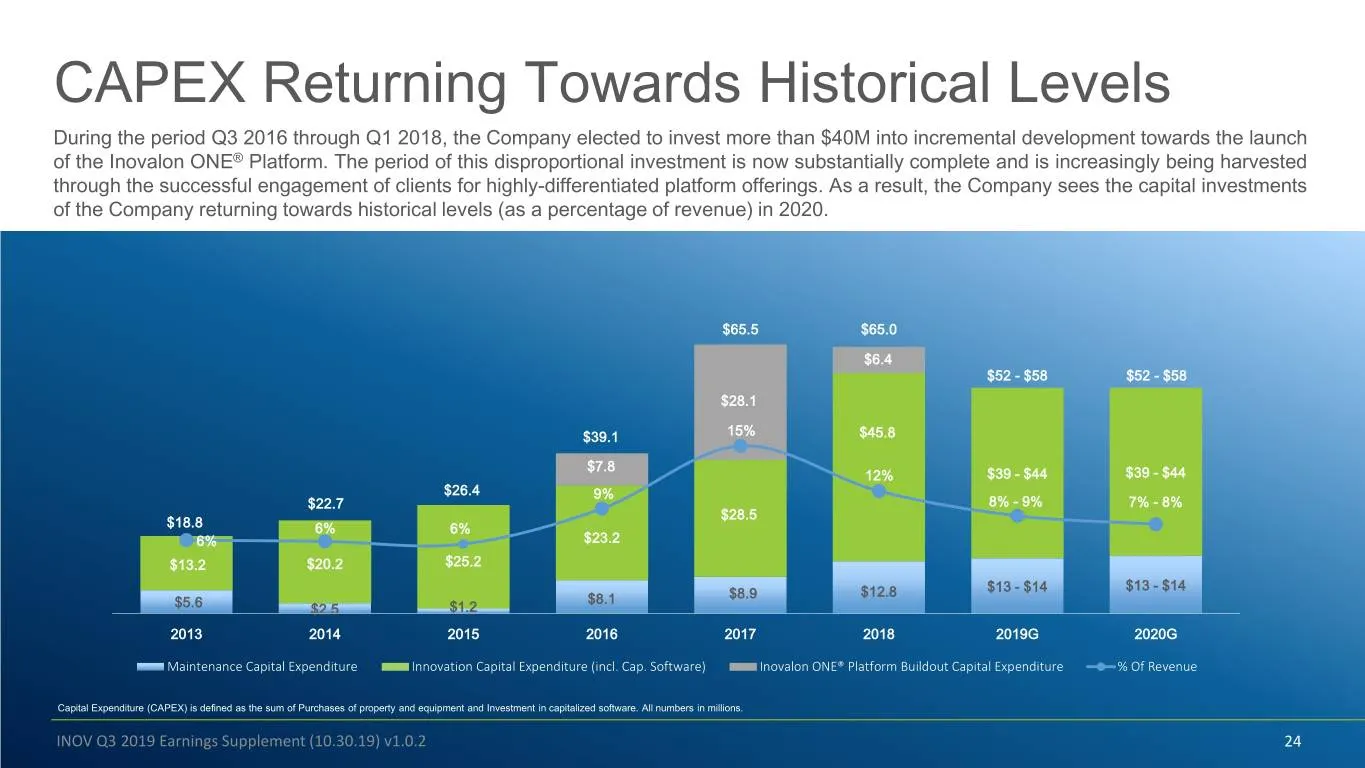
CAPEX Returning Towards Historical Levels During the period Q3 2016 through Q1 2018, the Company elected to invest more than $40M into incremental development towards the launch of the Inovalon ONE® Platform. The period of this disproportional investment is now substantially complete and is increasi
Slide 25: Full Year 2020 Financial Guidance
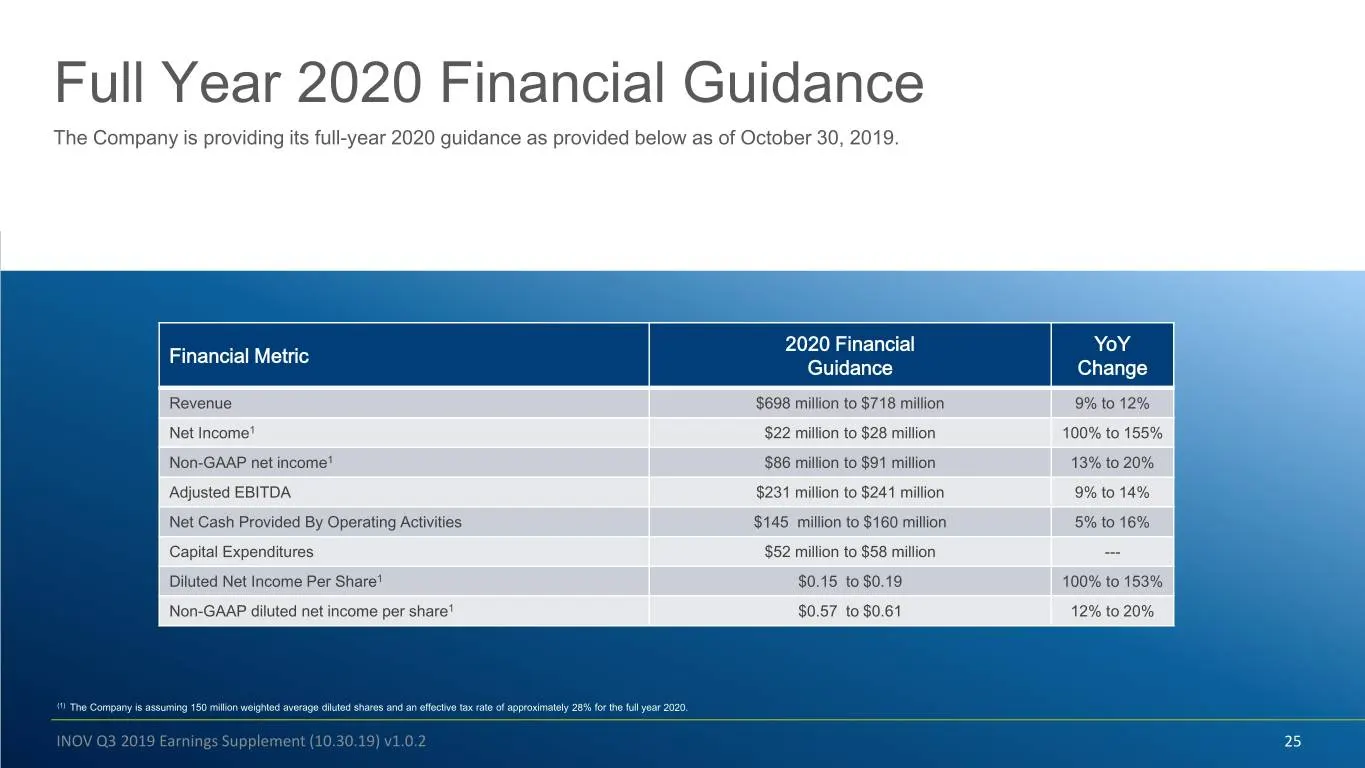
Full Year 2020 Financial Guidance The Company is providing its full-year 2020 guidance as provided below as of October 30, 2019. 2020 Financial YoY Financial Metric Guidance Change Revenue $698 million to $718 million 9% to 12% Net Income1 $22 million to $28 million 100% to 155% Non-GAAP net income1
Slide 26: Contents
Contents 1 Overview 2 2019 Q3 and TTM Financial Results This presentation serves as a supplement to the Inovalon announcement on October 30, 2019 pertaining to third quarter (Q3) of 2019 3 2019 Financial Guidance results and guidance. 4 2020 Financial Guidance 5 Appendix 1: Reconciliations INOV Q3 2
Slide 27: Reconciliation of Forward-Looking Guidance Adjusted EBITDA
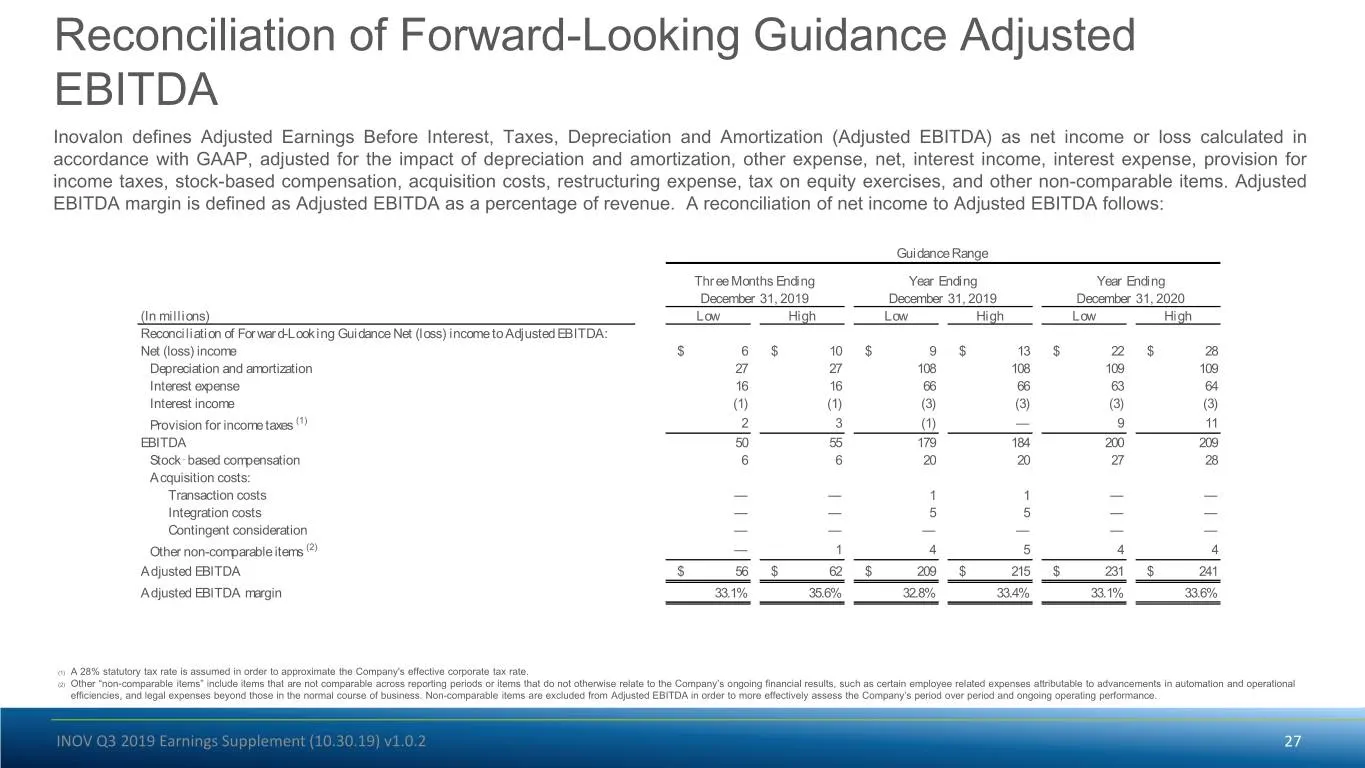
Reconciliation of Forward-Looking Guidance Adjusted EBITDA Inovalon defines Adjusted Earnings Before Interest, Taxes, Depreciation and Amortization (Adjusted EBITDA) as net income or loss calculated in accordance with GAAP, adjusted for the impact of depreciation and amortization, other expense, net
Slide 28: Reconciliation of Forward-Looking Guidance Non-GAAP Net Income
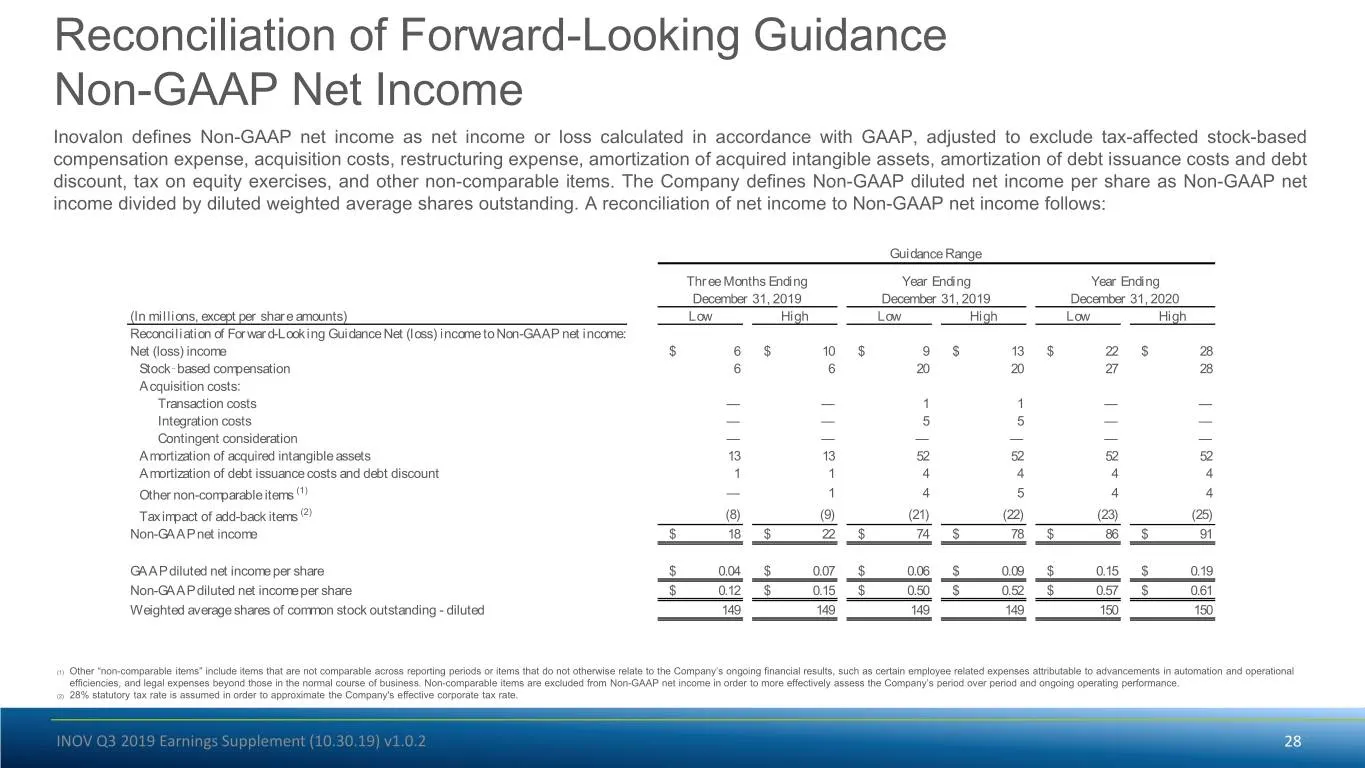
Reconciliation of Forward-Looking Guidance Non-GAAP Net Income Inovalon defines Non-GAAP net income as net income or loss calculated in accordance with GAAP, adjusted to exclude tax-affected stock-based compensation expense, acquisition costs, restructuring expense, amortization of acquired intangib
Slide 29: Definitions
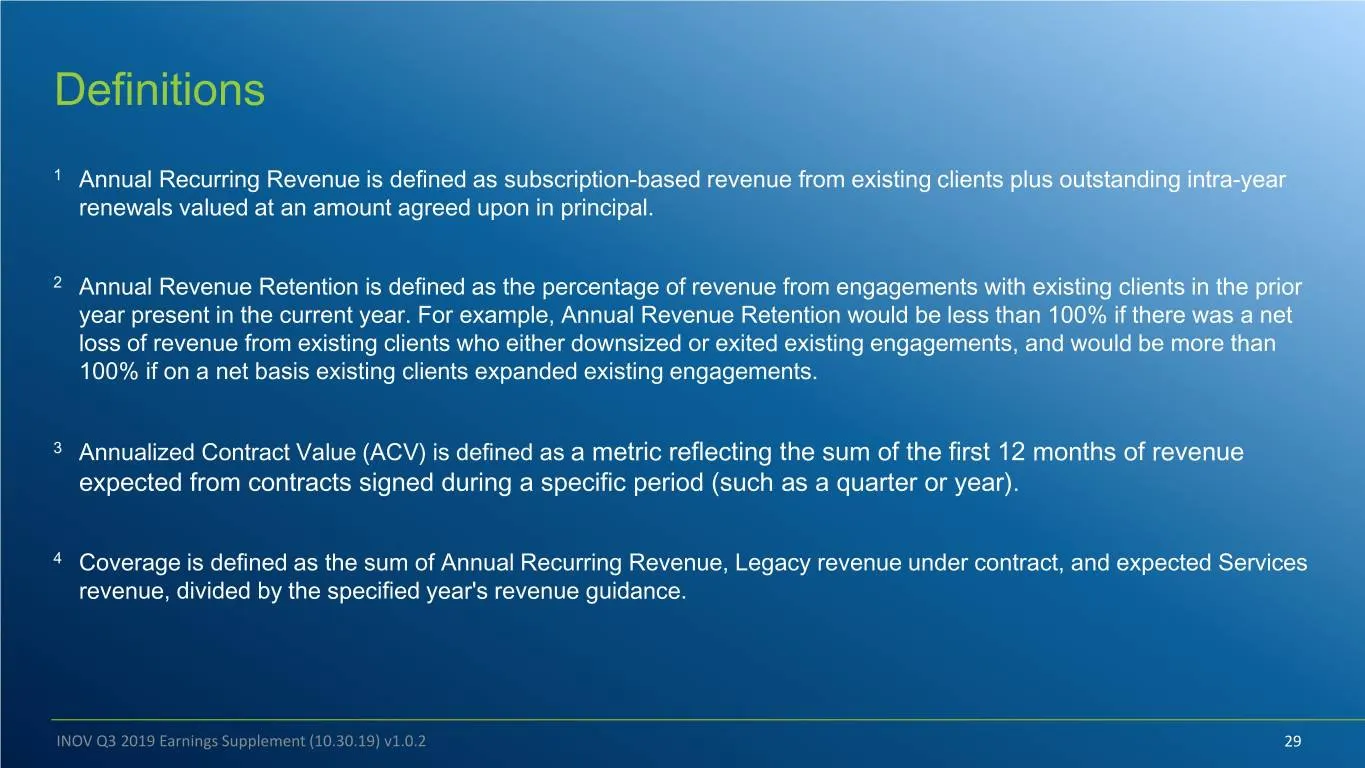
Definitions 1 Annual Recurring Revenue is defined as subscription-based revenue from existing clients plus outstanding intra-year renewals valued at an amount agreed upon in principal. 2 Annual Revenue Retention is defined as the percentage of revenue from engagements with existing clients in the pr
Slide 30: ACV, TCV and Bookings
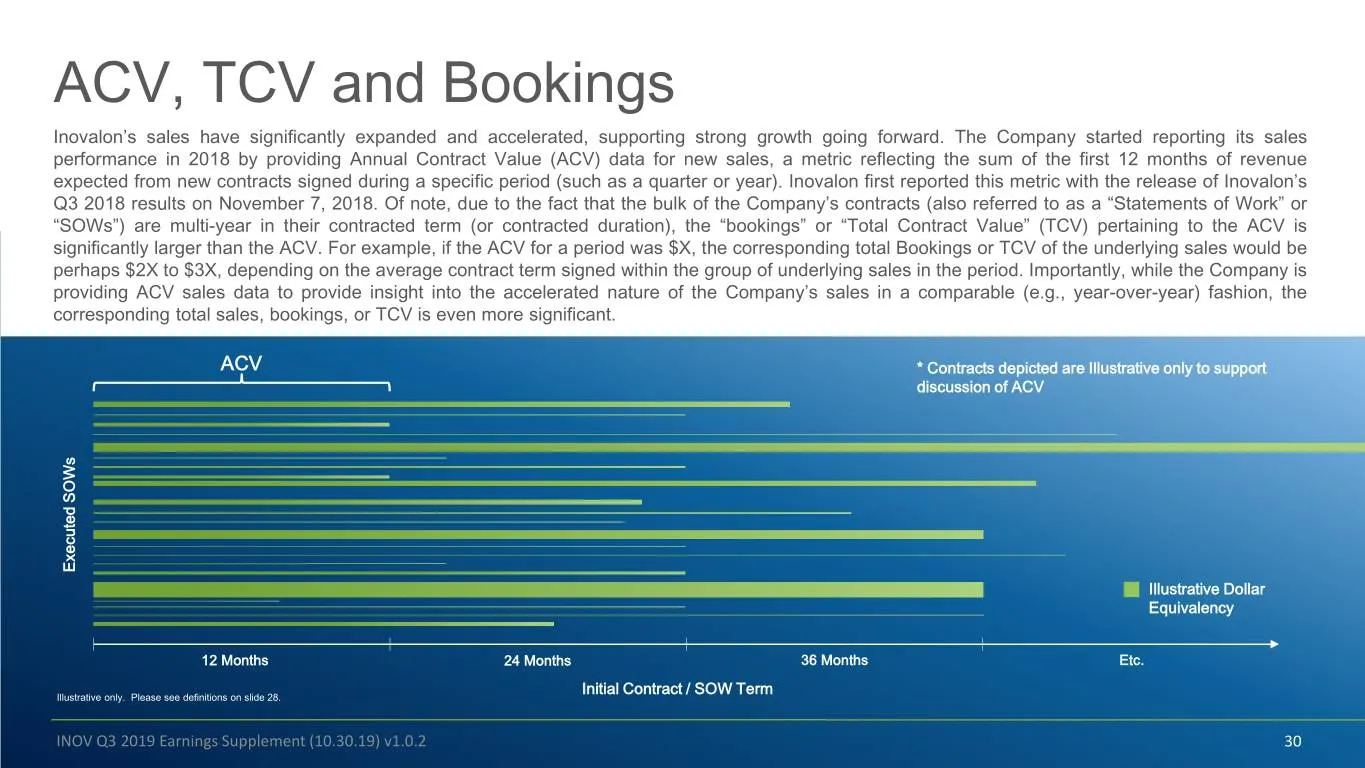
ACV, TCV and Bookings Inovalon’s sales have significantly expanded and accelerated, supporting strong growth going forward. The Company started reporting its sales performance in 2018 by providing Annual Contract Value (ACV) data for new sales, a metric reflecting the sum of the first 12 months of r
Slide 31: Healthcare Empowered
Healthcare Empowered® © 2019 by Inovalon. All rights reserved.
Source: SEC EDGAR · 8-K filed Oct 30, 2019
More decks from Inovalon Holdings Inc
 Q2 2021 Earnings Presentation28 slides · Jul 28, 2021
 Q1 2021 Earnings Presentation28 slides · Apr 28, 2021
 Q4 2020 Earnings Presentation28 slides · Feb 3, 2021
 Q3 2020 Earnings Presentation33 slides · Oct 28, 2020
 Q2 2020 Earnings Presentation33 slides · Jul 29, 2020
 Q1 2020 Earnings Presentation34 slides · Apr 29, 2020