South Financial — Investor Presentation (February 2009)
34 slides from South Financial's investor presentation, Feb 23, 2009
Slide 1: Investor Presentation First Quarter 2009
Investor Presentation First Quarter 2009
Slide 2: Forward-Looking Statements and Non-GAAP Financial Information
Forward-Looking Statements and Non-GAAP Financial Information The forward-looking statements, as defined in the applicable federal securities laws, being made today are subject to risks and uncertainties. TSFG’s actual results may differ materially from those set forth in such forward-looking statem
Slide 3: Company Overview: TSFG at a Glance
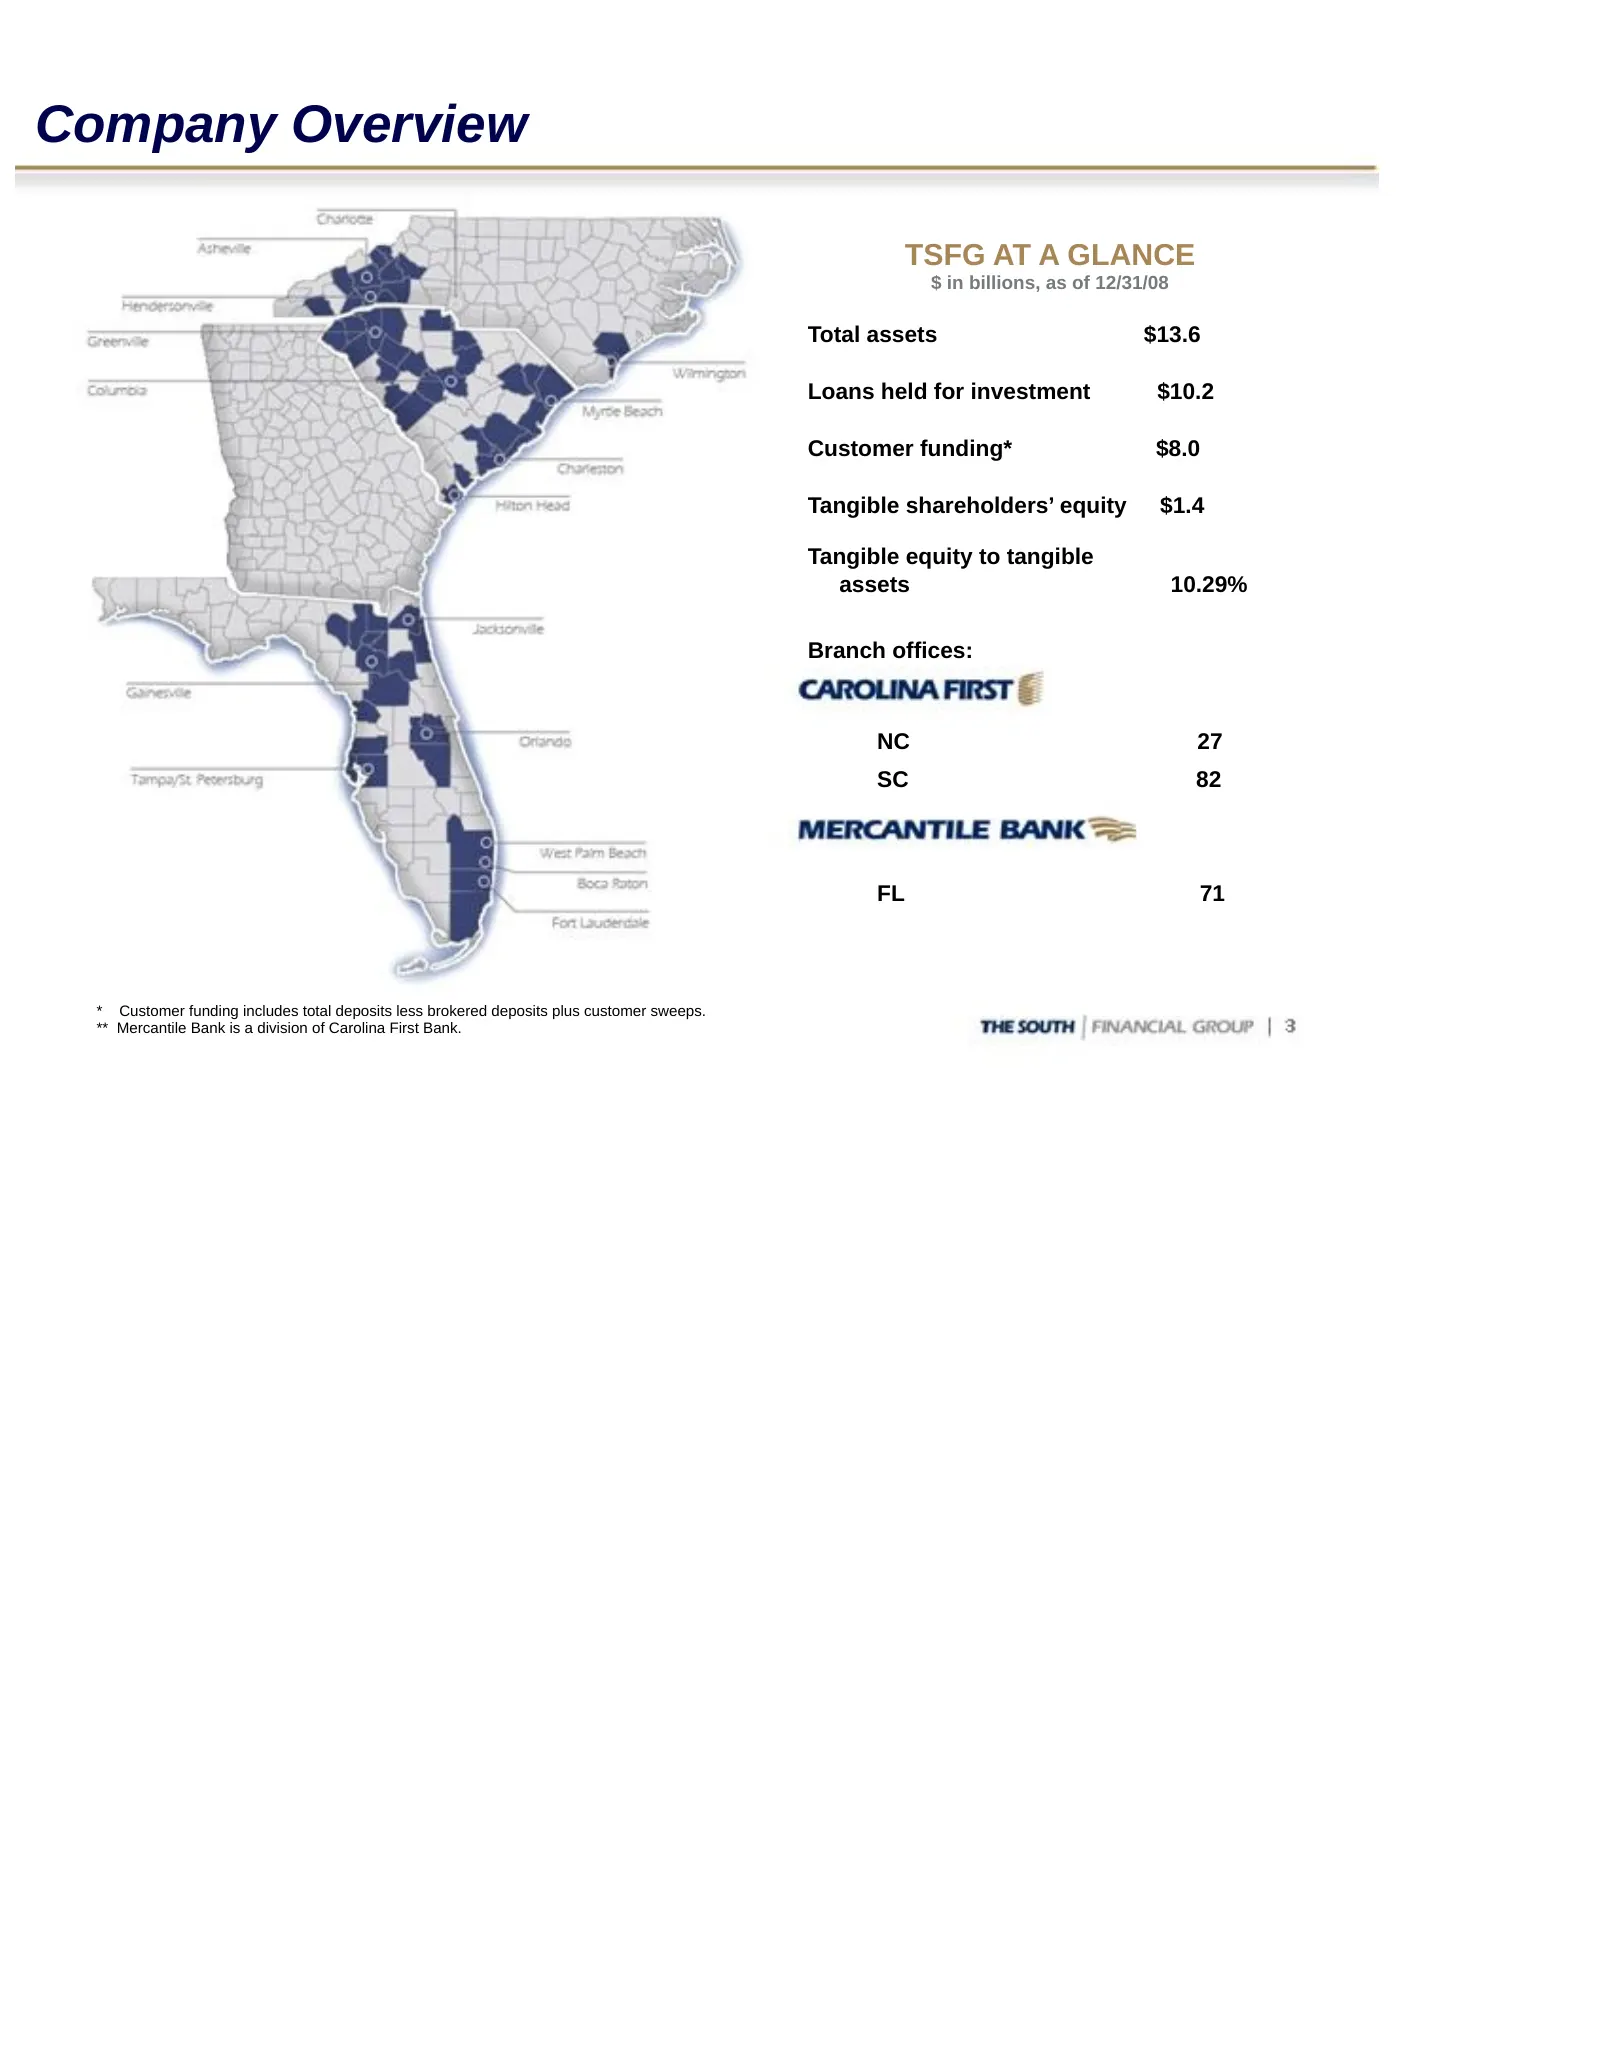
Company Overview TSFG AT A GLANCE $ in billions, as of 12/31/08 Total assets $13.6 Loans held for investment $10.2 Customer funding* $8.0 Tangible shareholders’ equity $1.4 Tangible equity to tangible assets 10.29% Branch offices: NC 27 SC 82 FL 71 * Customer funding includes total deposits less bro
Slide 4: Goal: Relationship Bank of Choice
Goal: Relationship Bank of Choice Building core banking relationships Focused on customer relationships with local decision-making Accessible and responsive Involved in our communities Target small businesses, middle market, and retail customers Built through multi-product relationships Located in a
Slide 5: Footprint: Long-term Growth Potential
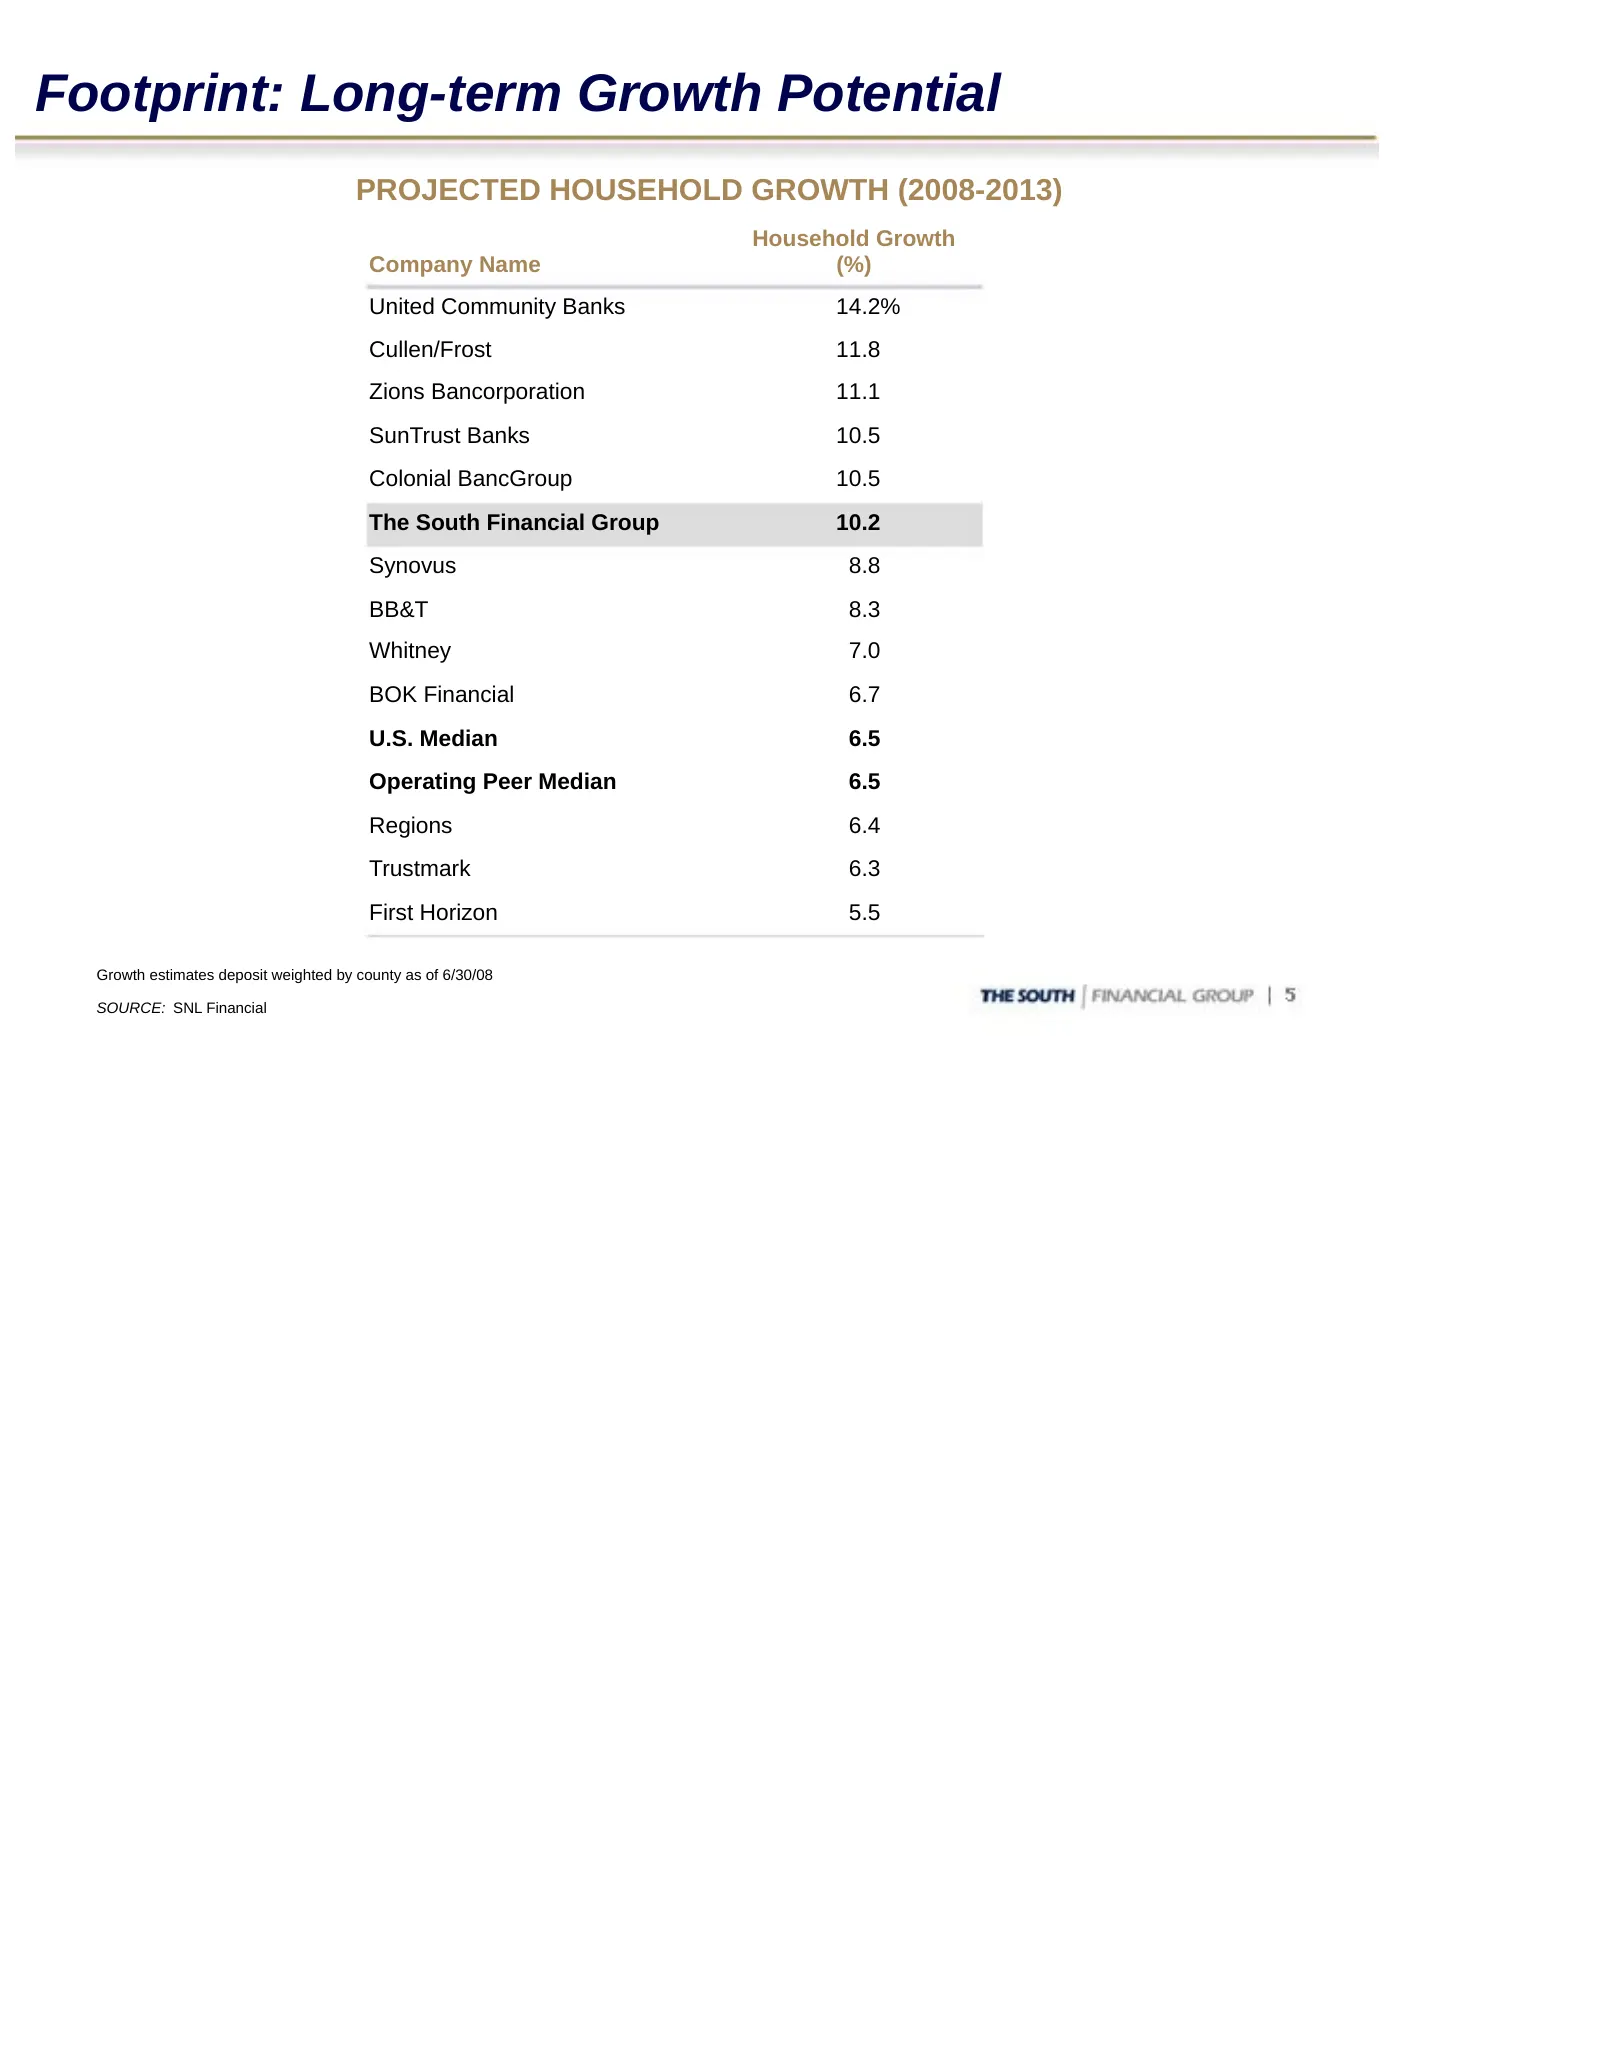
Footprint: Long-term Growth Potential PROJECTED HOUSEHOLD GROWTH (2008-2013) Household Growth Company Name (%) United Community Banks 14.2% Cullen/Frost 11.8 Zions Bancorporation 11.1 SunTrust Banks 10.5 Colonial BancGroup 10.5 The South Financial Group 10.2 Synovus 8.8 BB&T 8.3 Whitney 7.0 BOK Fina
Slide 6: Footprint: Geographic Diversification
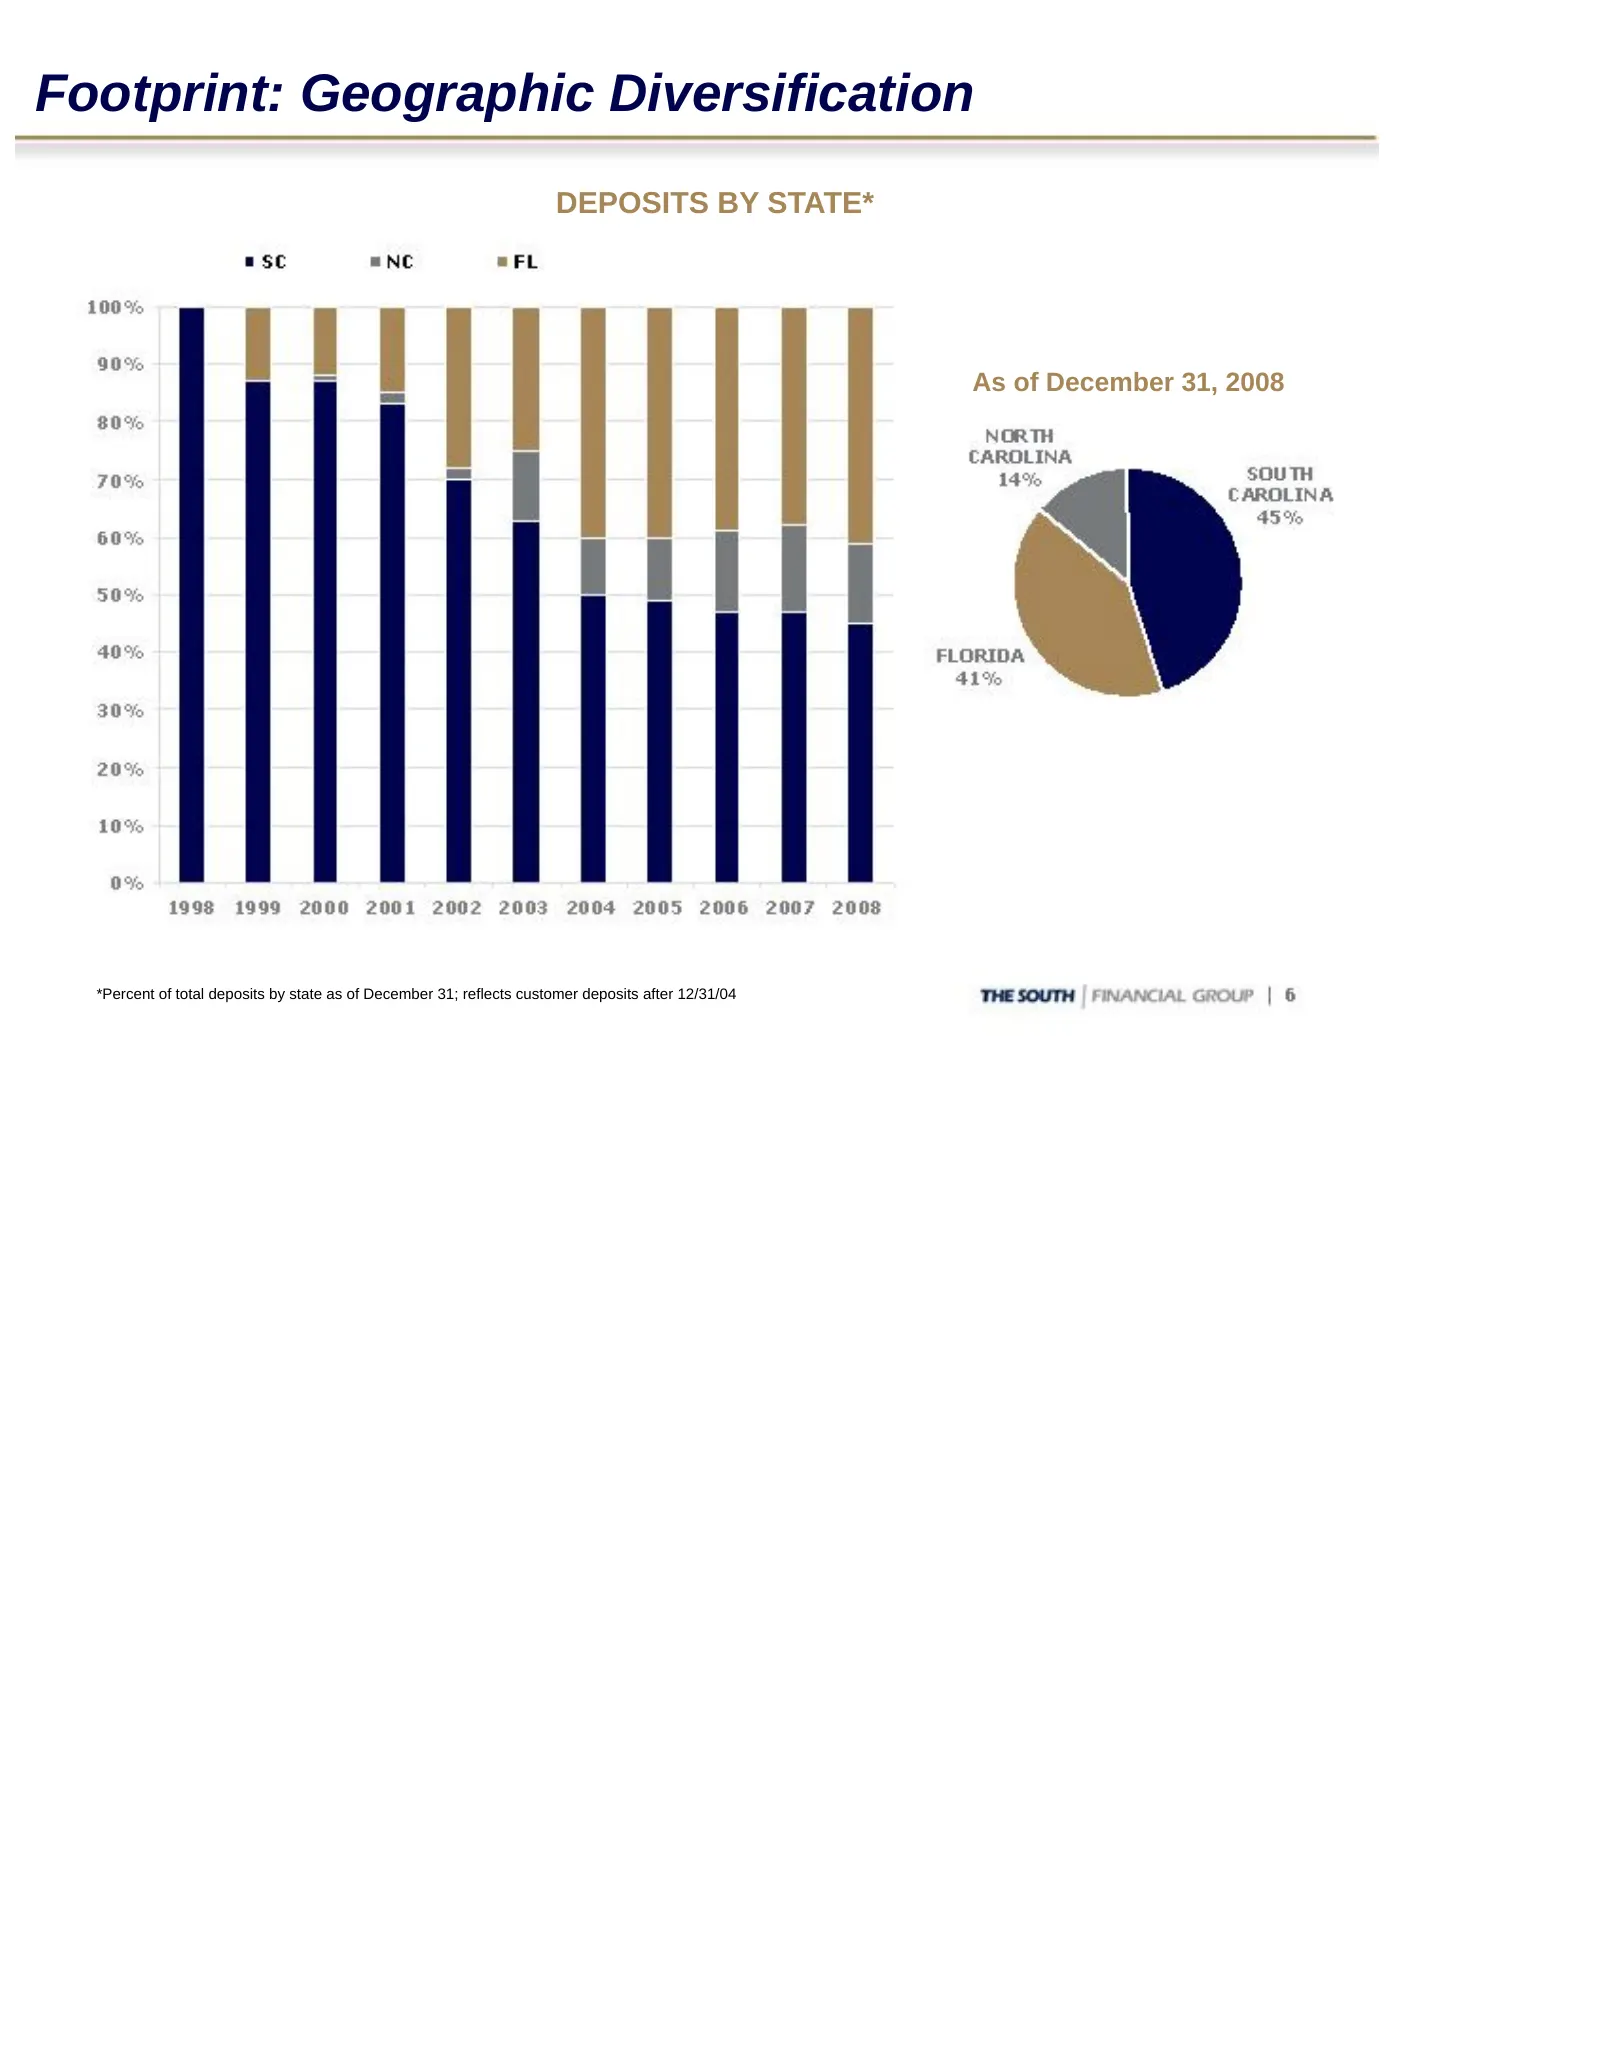
Footprint: Geographic Diversification DEPOSITS BY STATE* As of December 31, 2008 *Percent of total deposits by state as of December 31; reflects customer deposits after 12/31/04
Slide 7: Proactive and Realistic Approach to Cycle
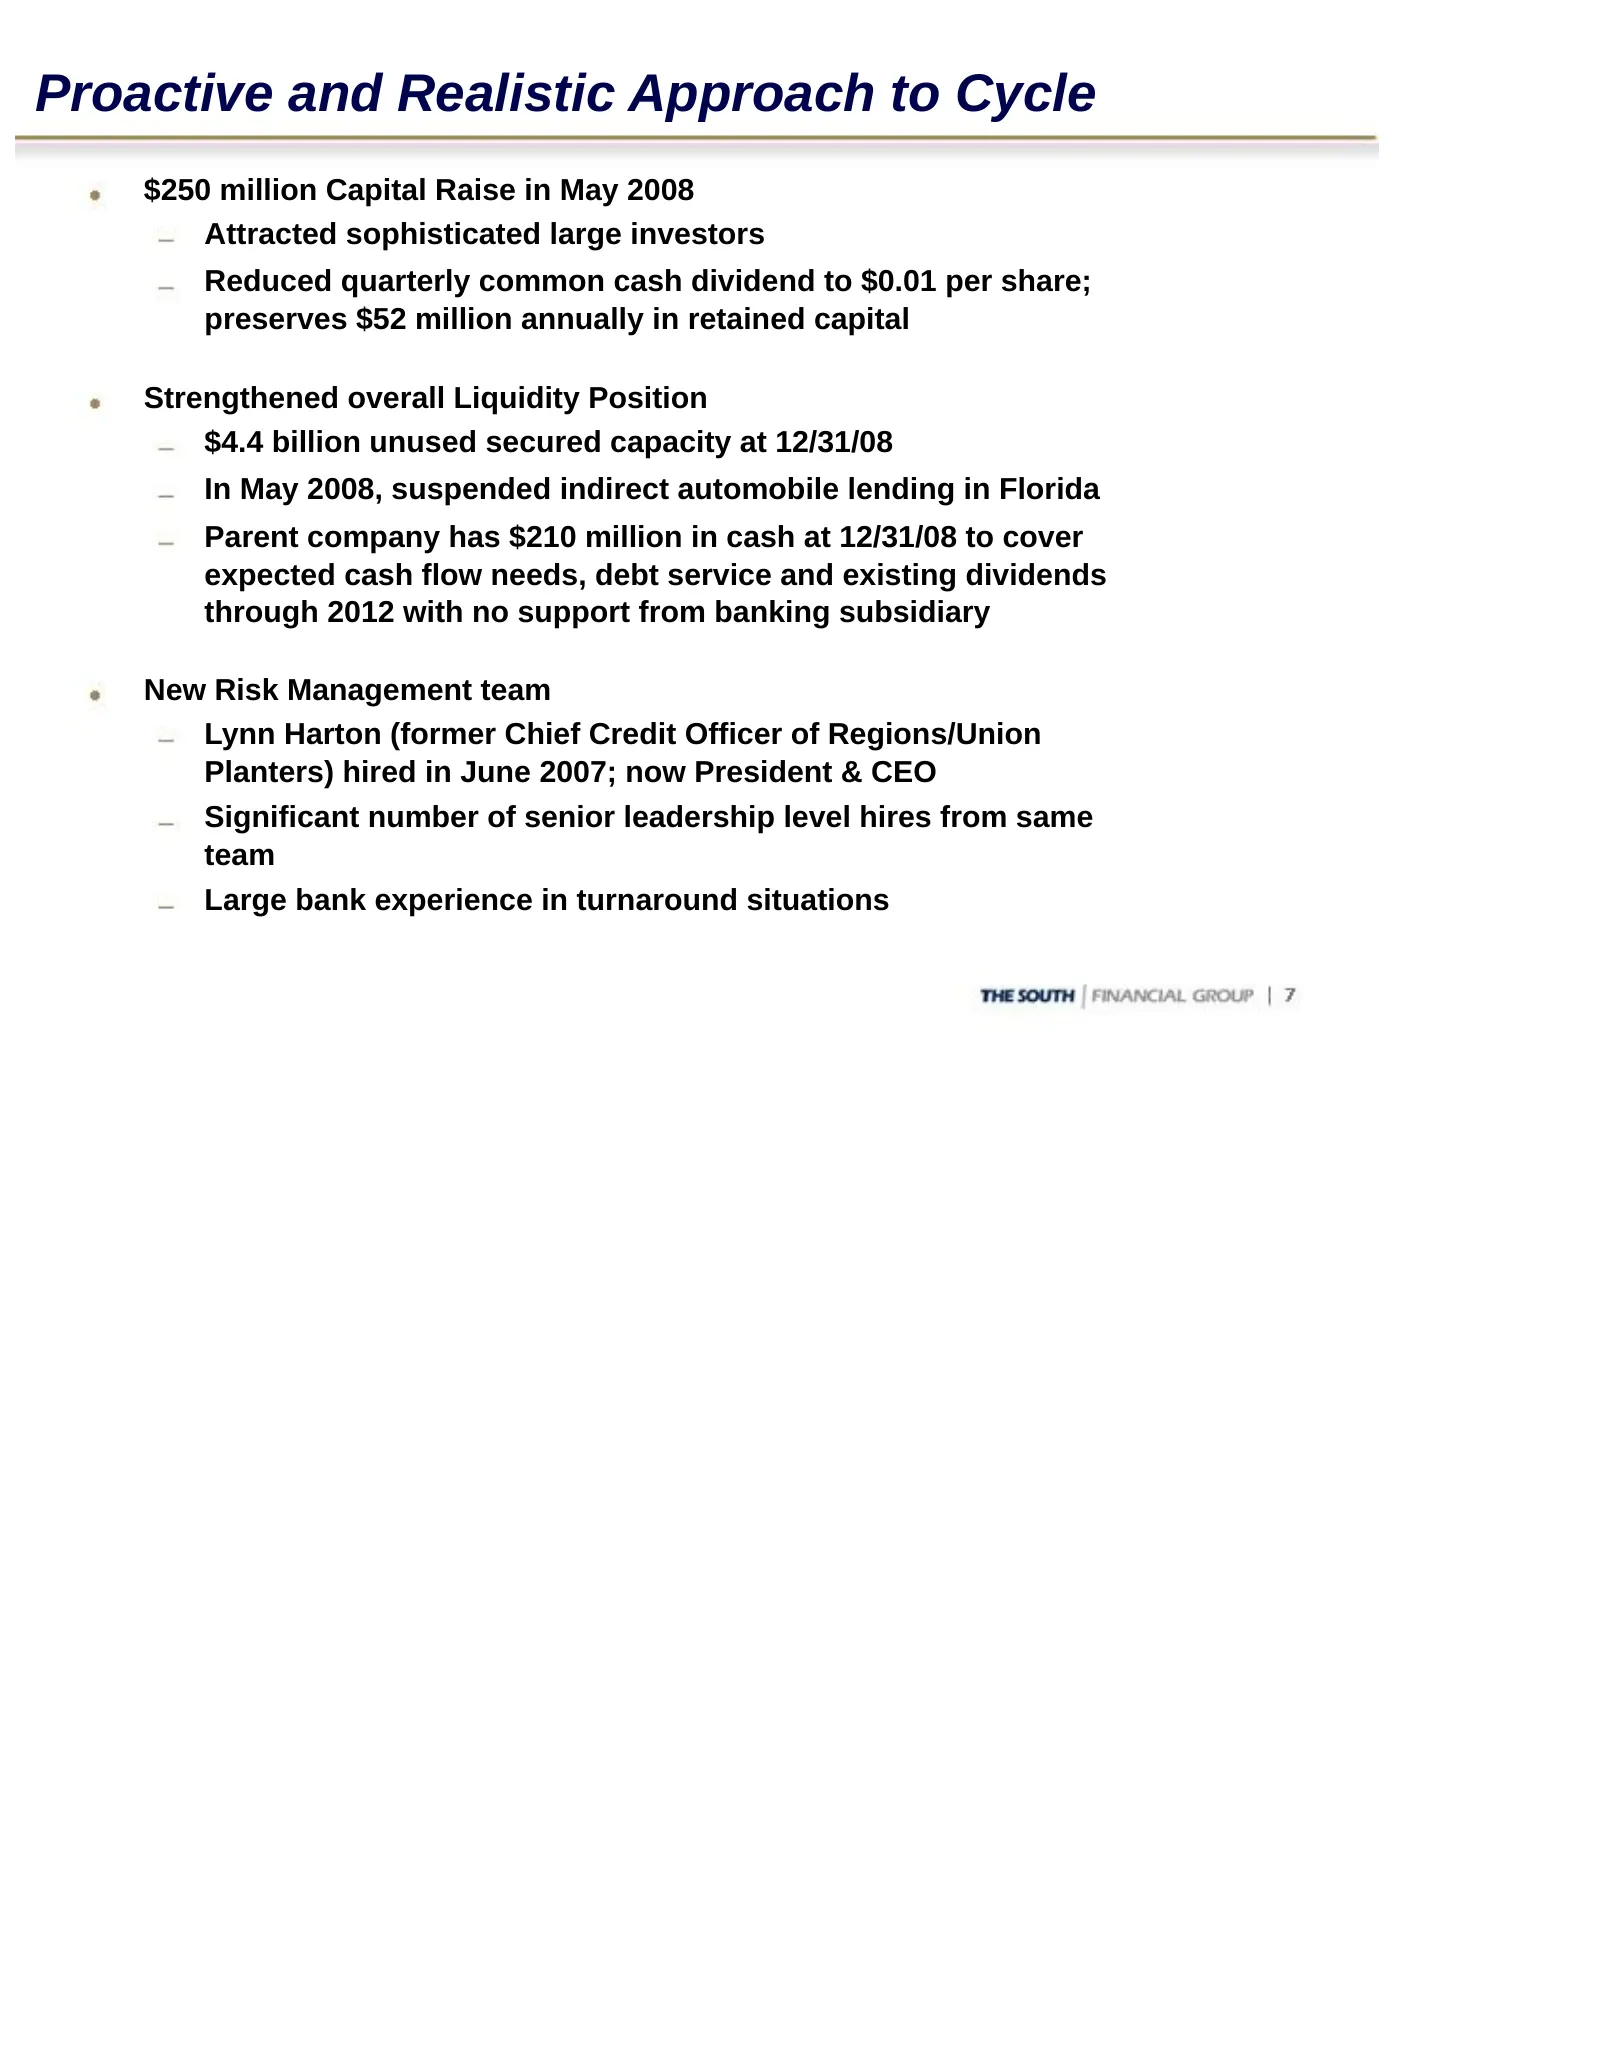
Proactive and Realistic Approach to Cycle $250 million Capital Raise in May 2008 Attracted sophisticated large investors Reduced quarterly common cash dividend to $0.01 per share; preserves $52 million annually in retained capital Strengthened overall Liquidity Position $4.4 billion unused secured c
Slide 8: Proactive and Realistic Approach (continued)
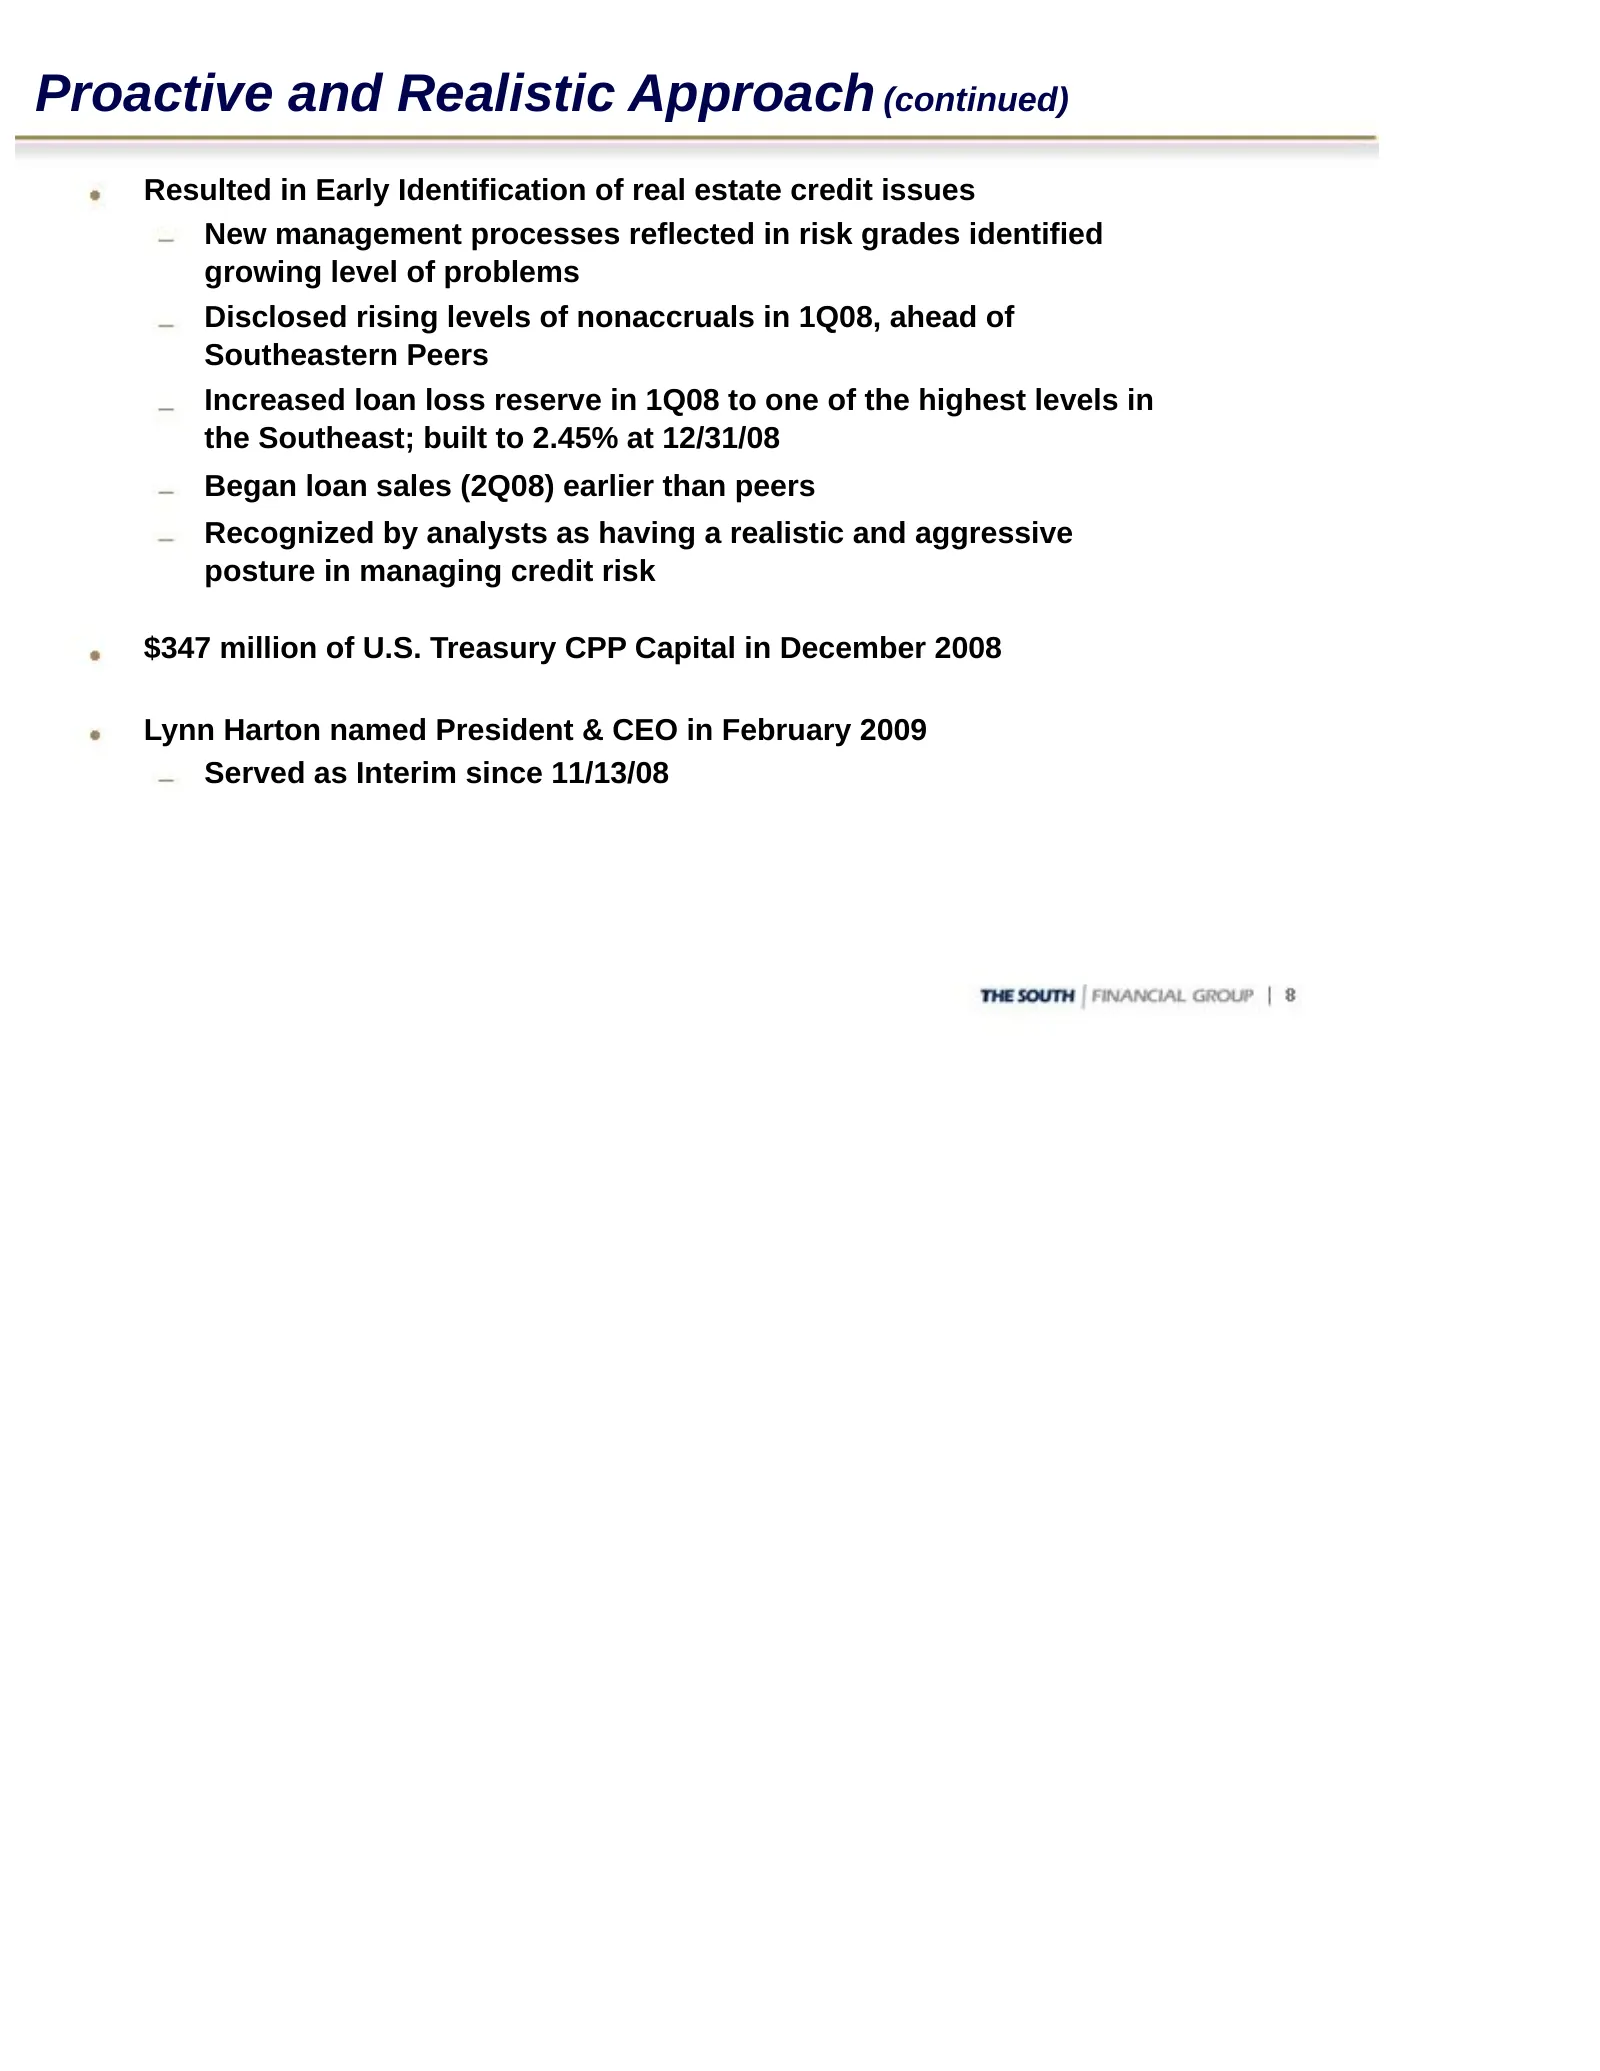
Proactive and Realistic Approach (continued) Resulted in Early Identification of real estate credit issues New management processes reflected in risk grades identified growing level of problems Disclosed rising levels of nonaccruals in 1Q08, ahead of Southeastern Peers Increased loan loss reserve in
Slide 9: New Leadership - Initial Actions
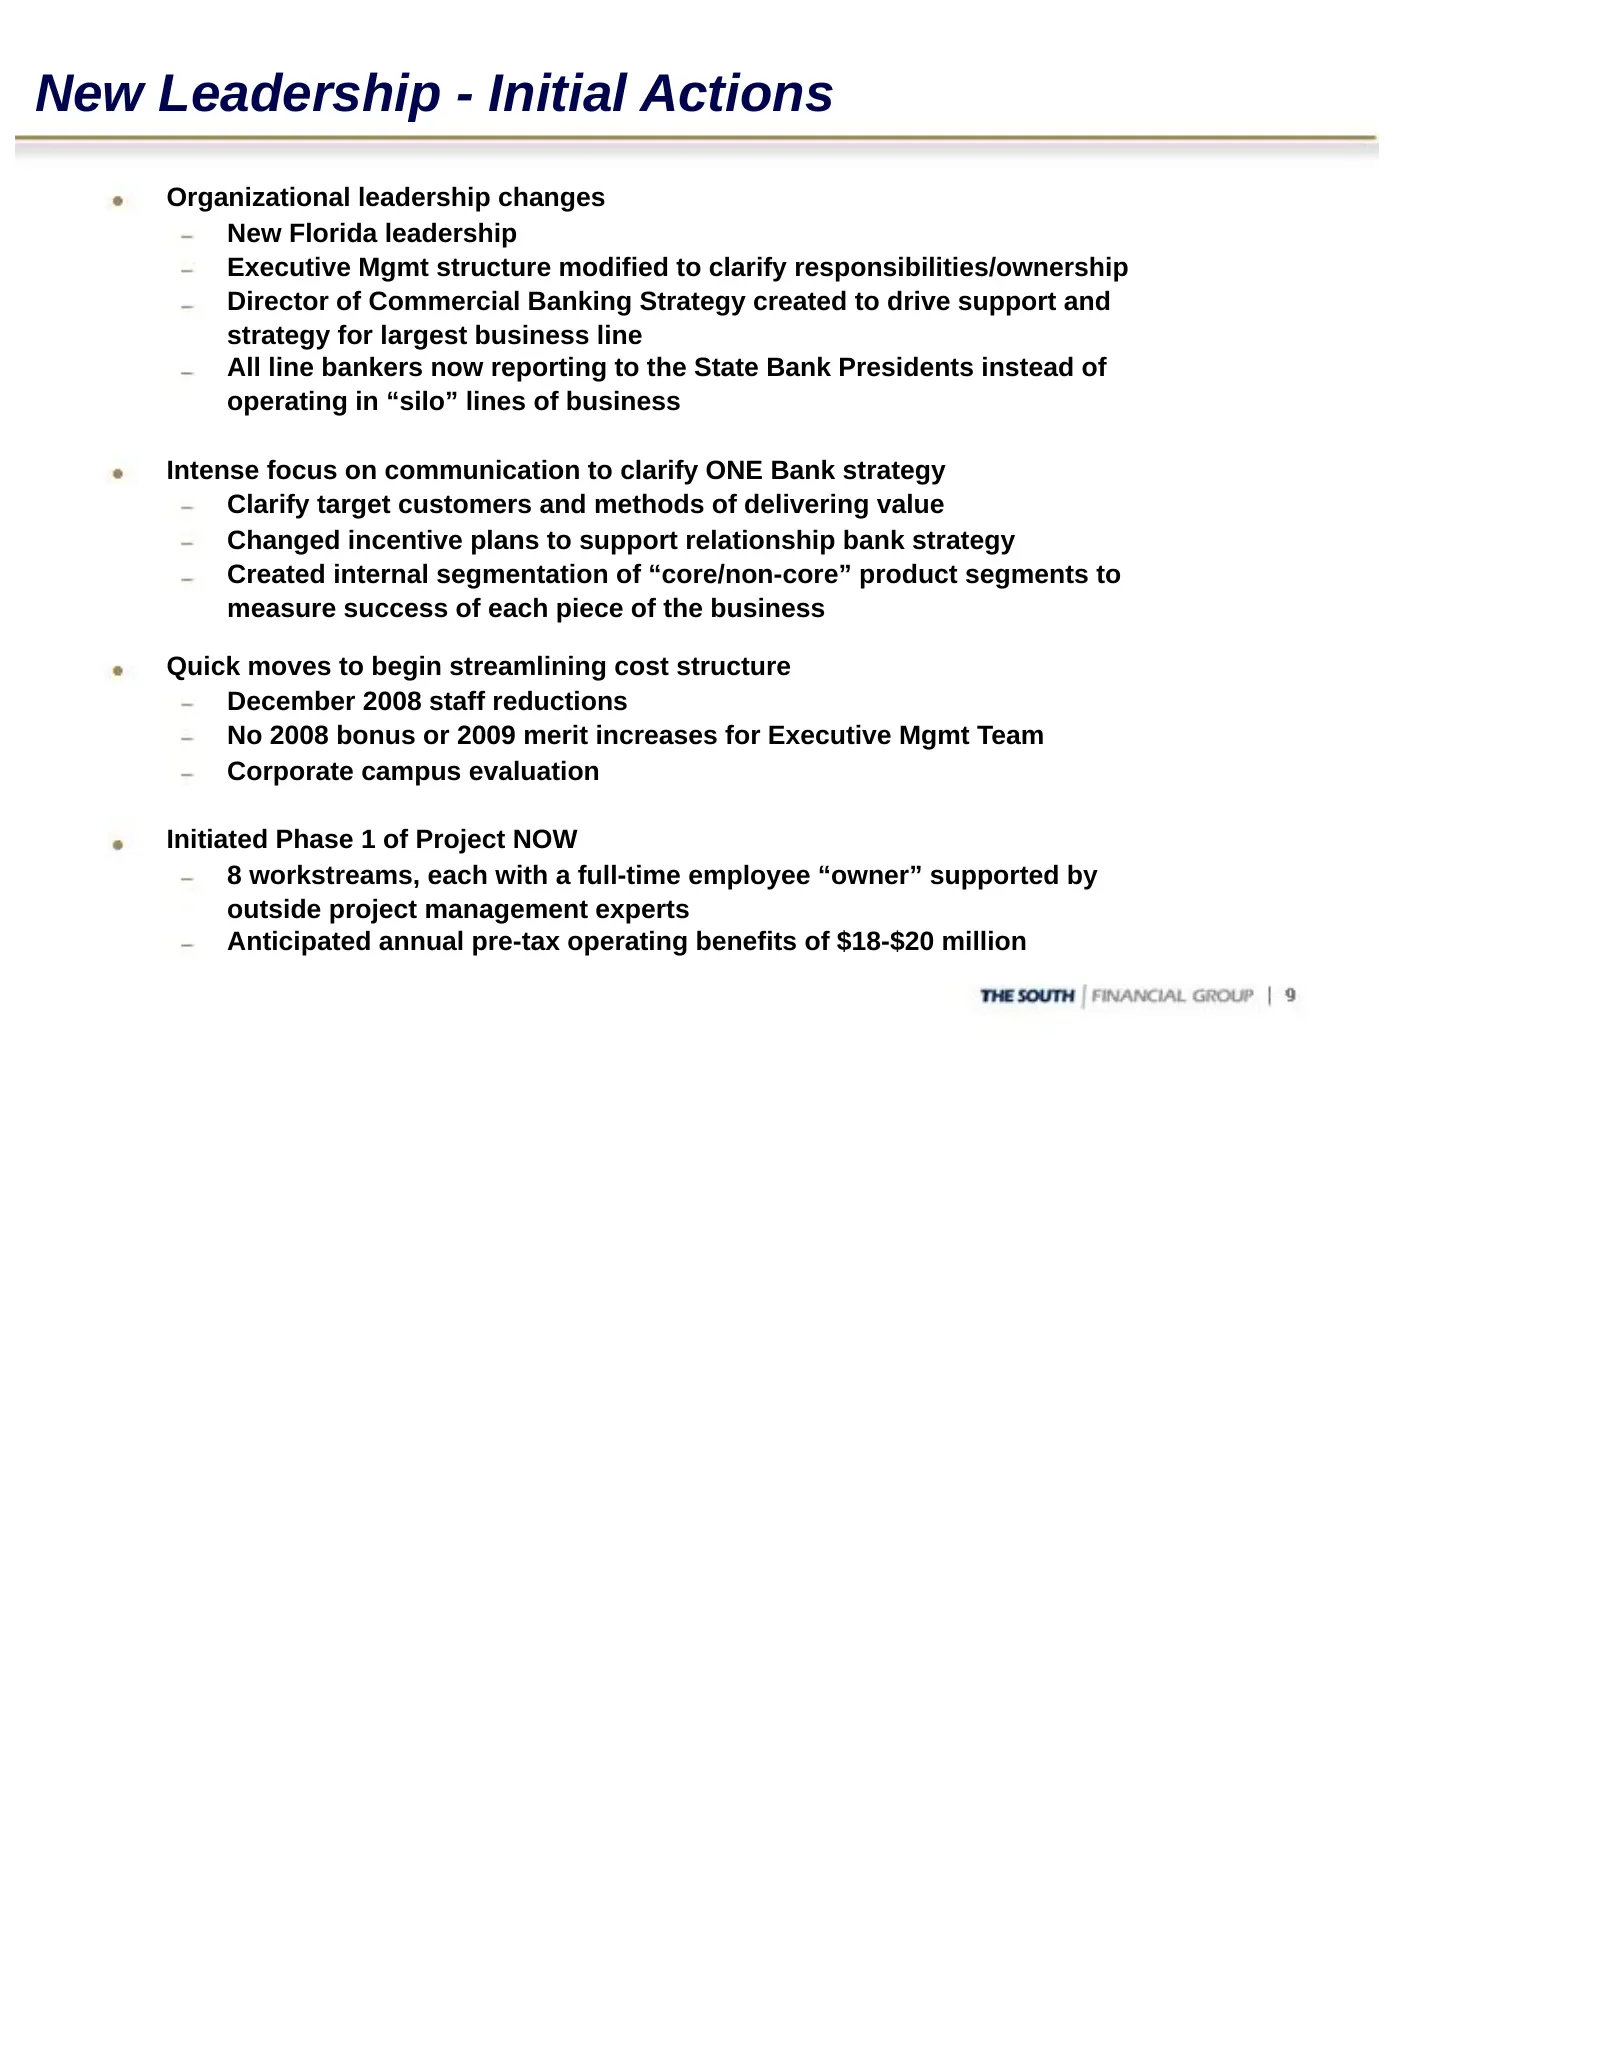
New Leadership - Initial Actions Organizational leadership changes New Florida leadership Executive Mgmt structure modified to clarify responsibilities/ownership Director of Commercial Banking Strategy created to drive support and strategy for largest business line All line bankers now reporting to
Slide 10: Executive Management Team
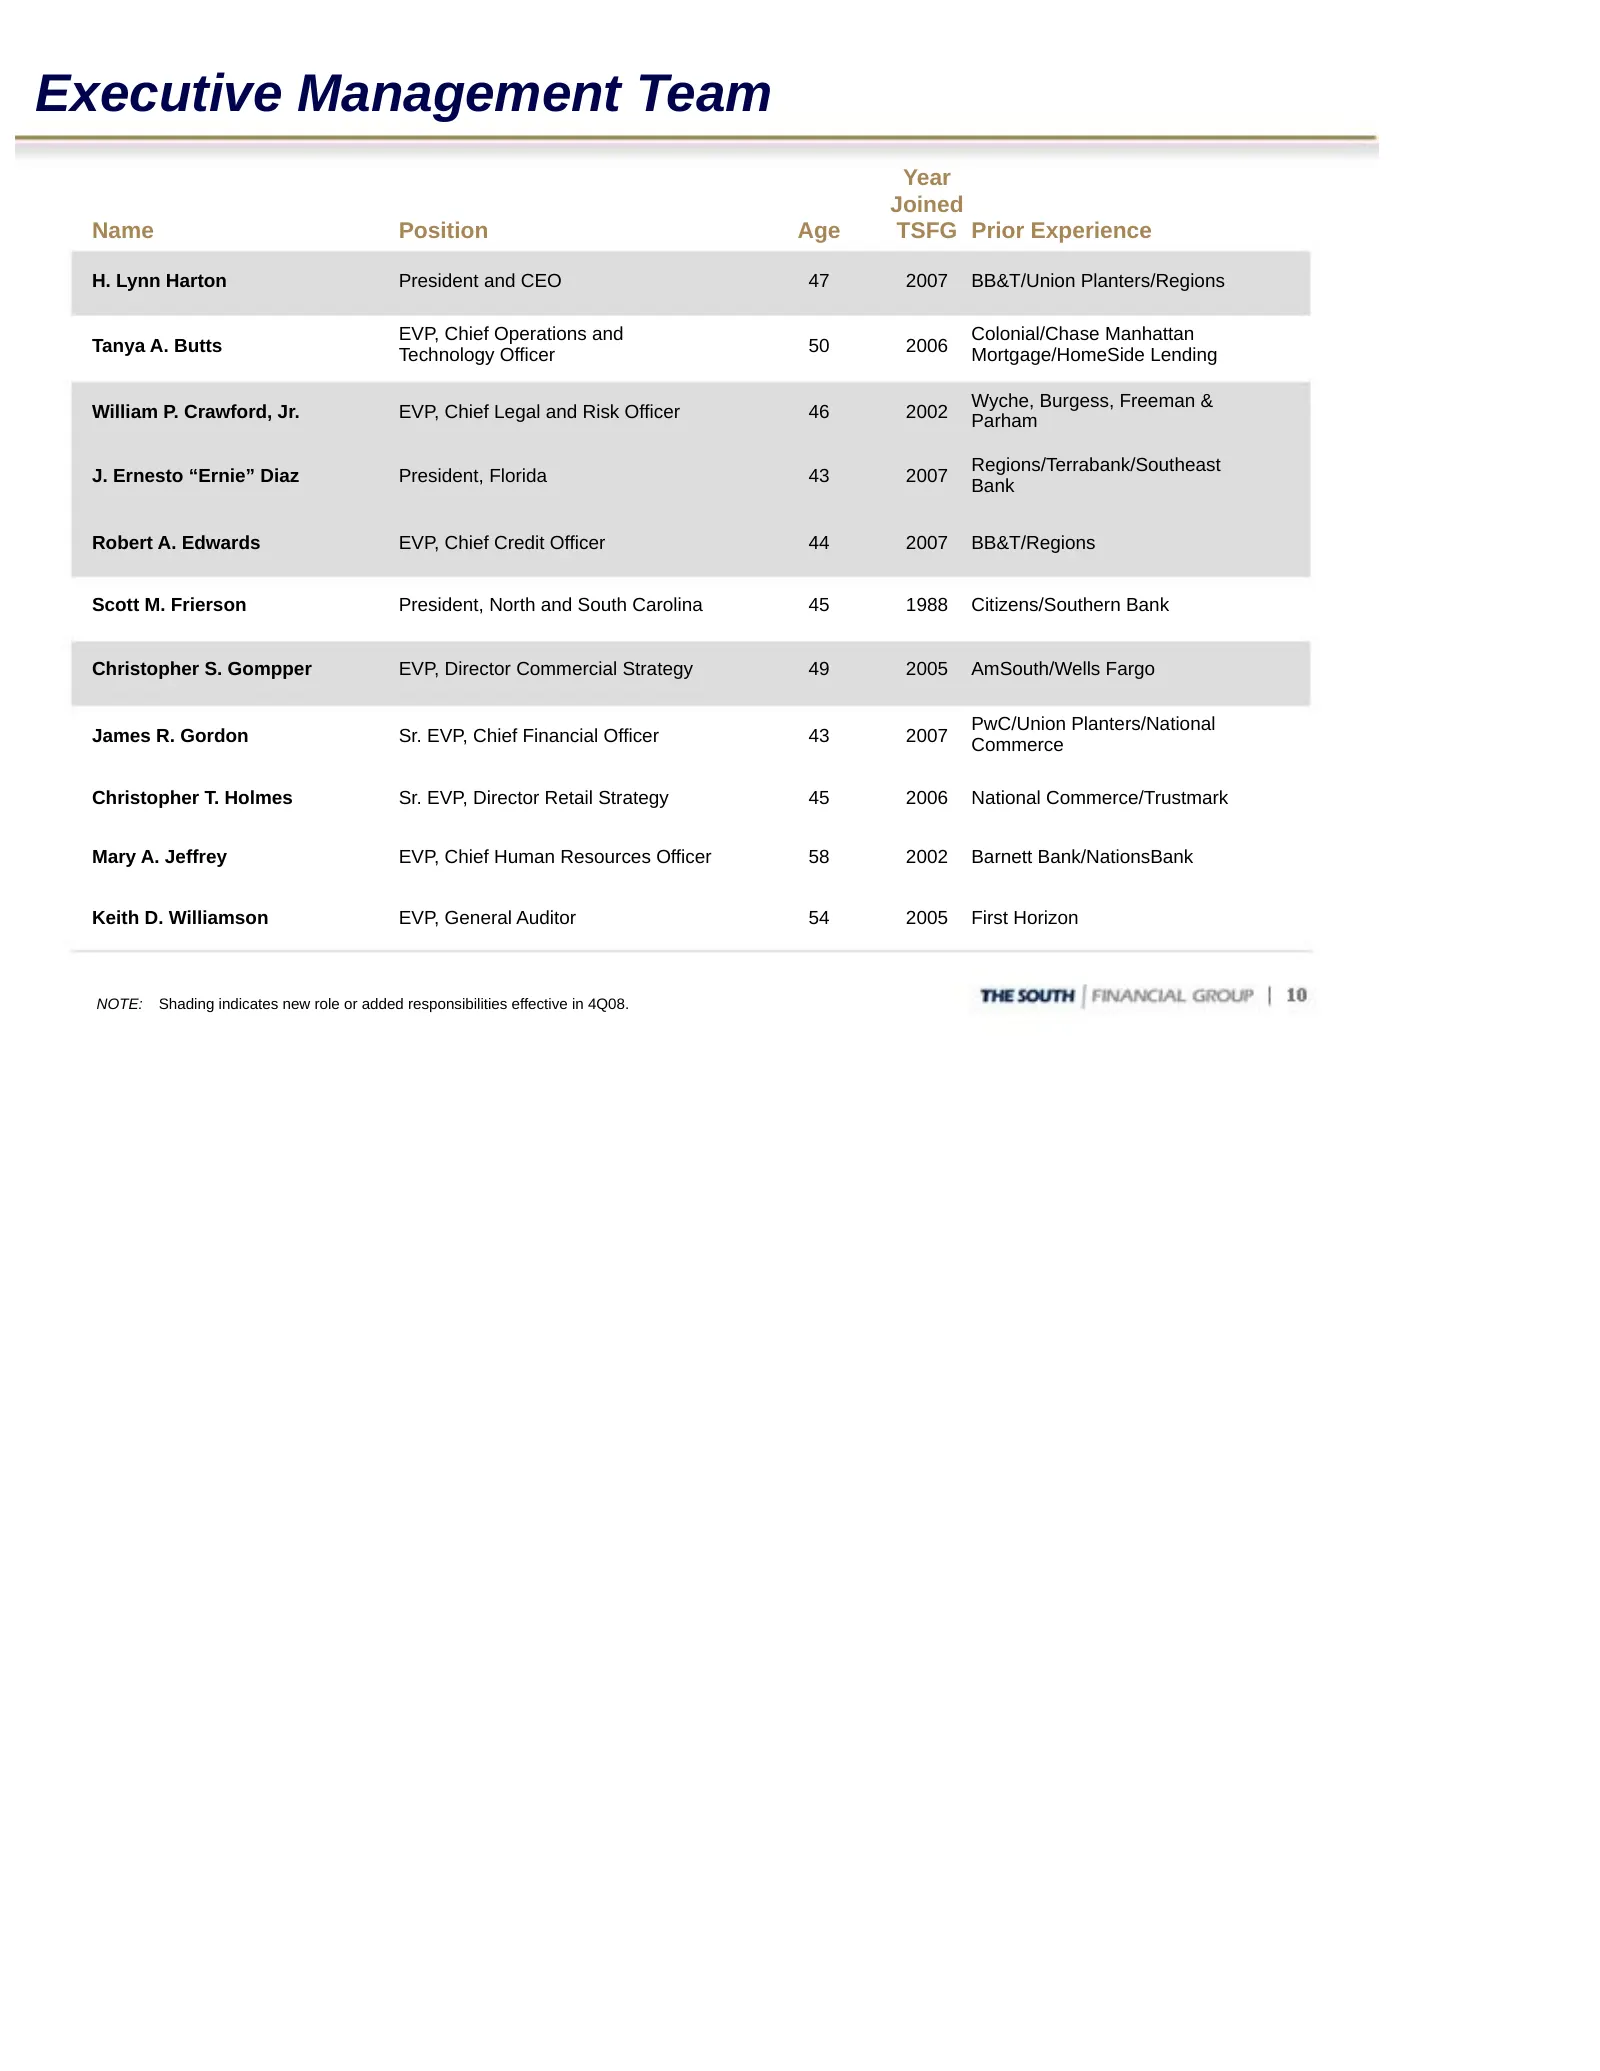
Executive Management Team Year Joined Name Position Age TSFG Prior Experience H. Lynn Harton President and CEO 47 2007 BB&T/Union Planters/Regions EVP, Chief Operations and Colonial/Chase Manhattan Tanya A. Butts Technology Officer 50 2006 Mortgage/HomeSide Lending Wyche, Burgess, Freeman & William
Slide 11: Strategic Objectives
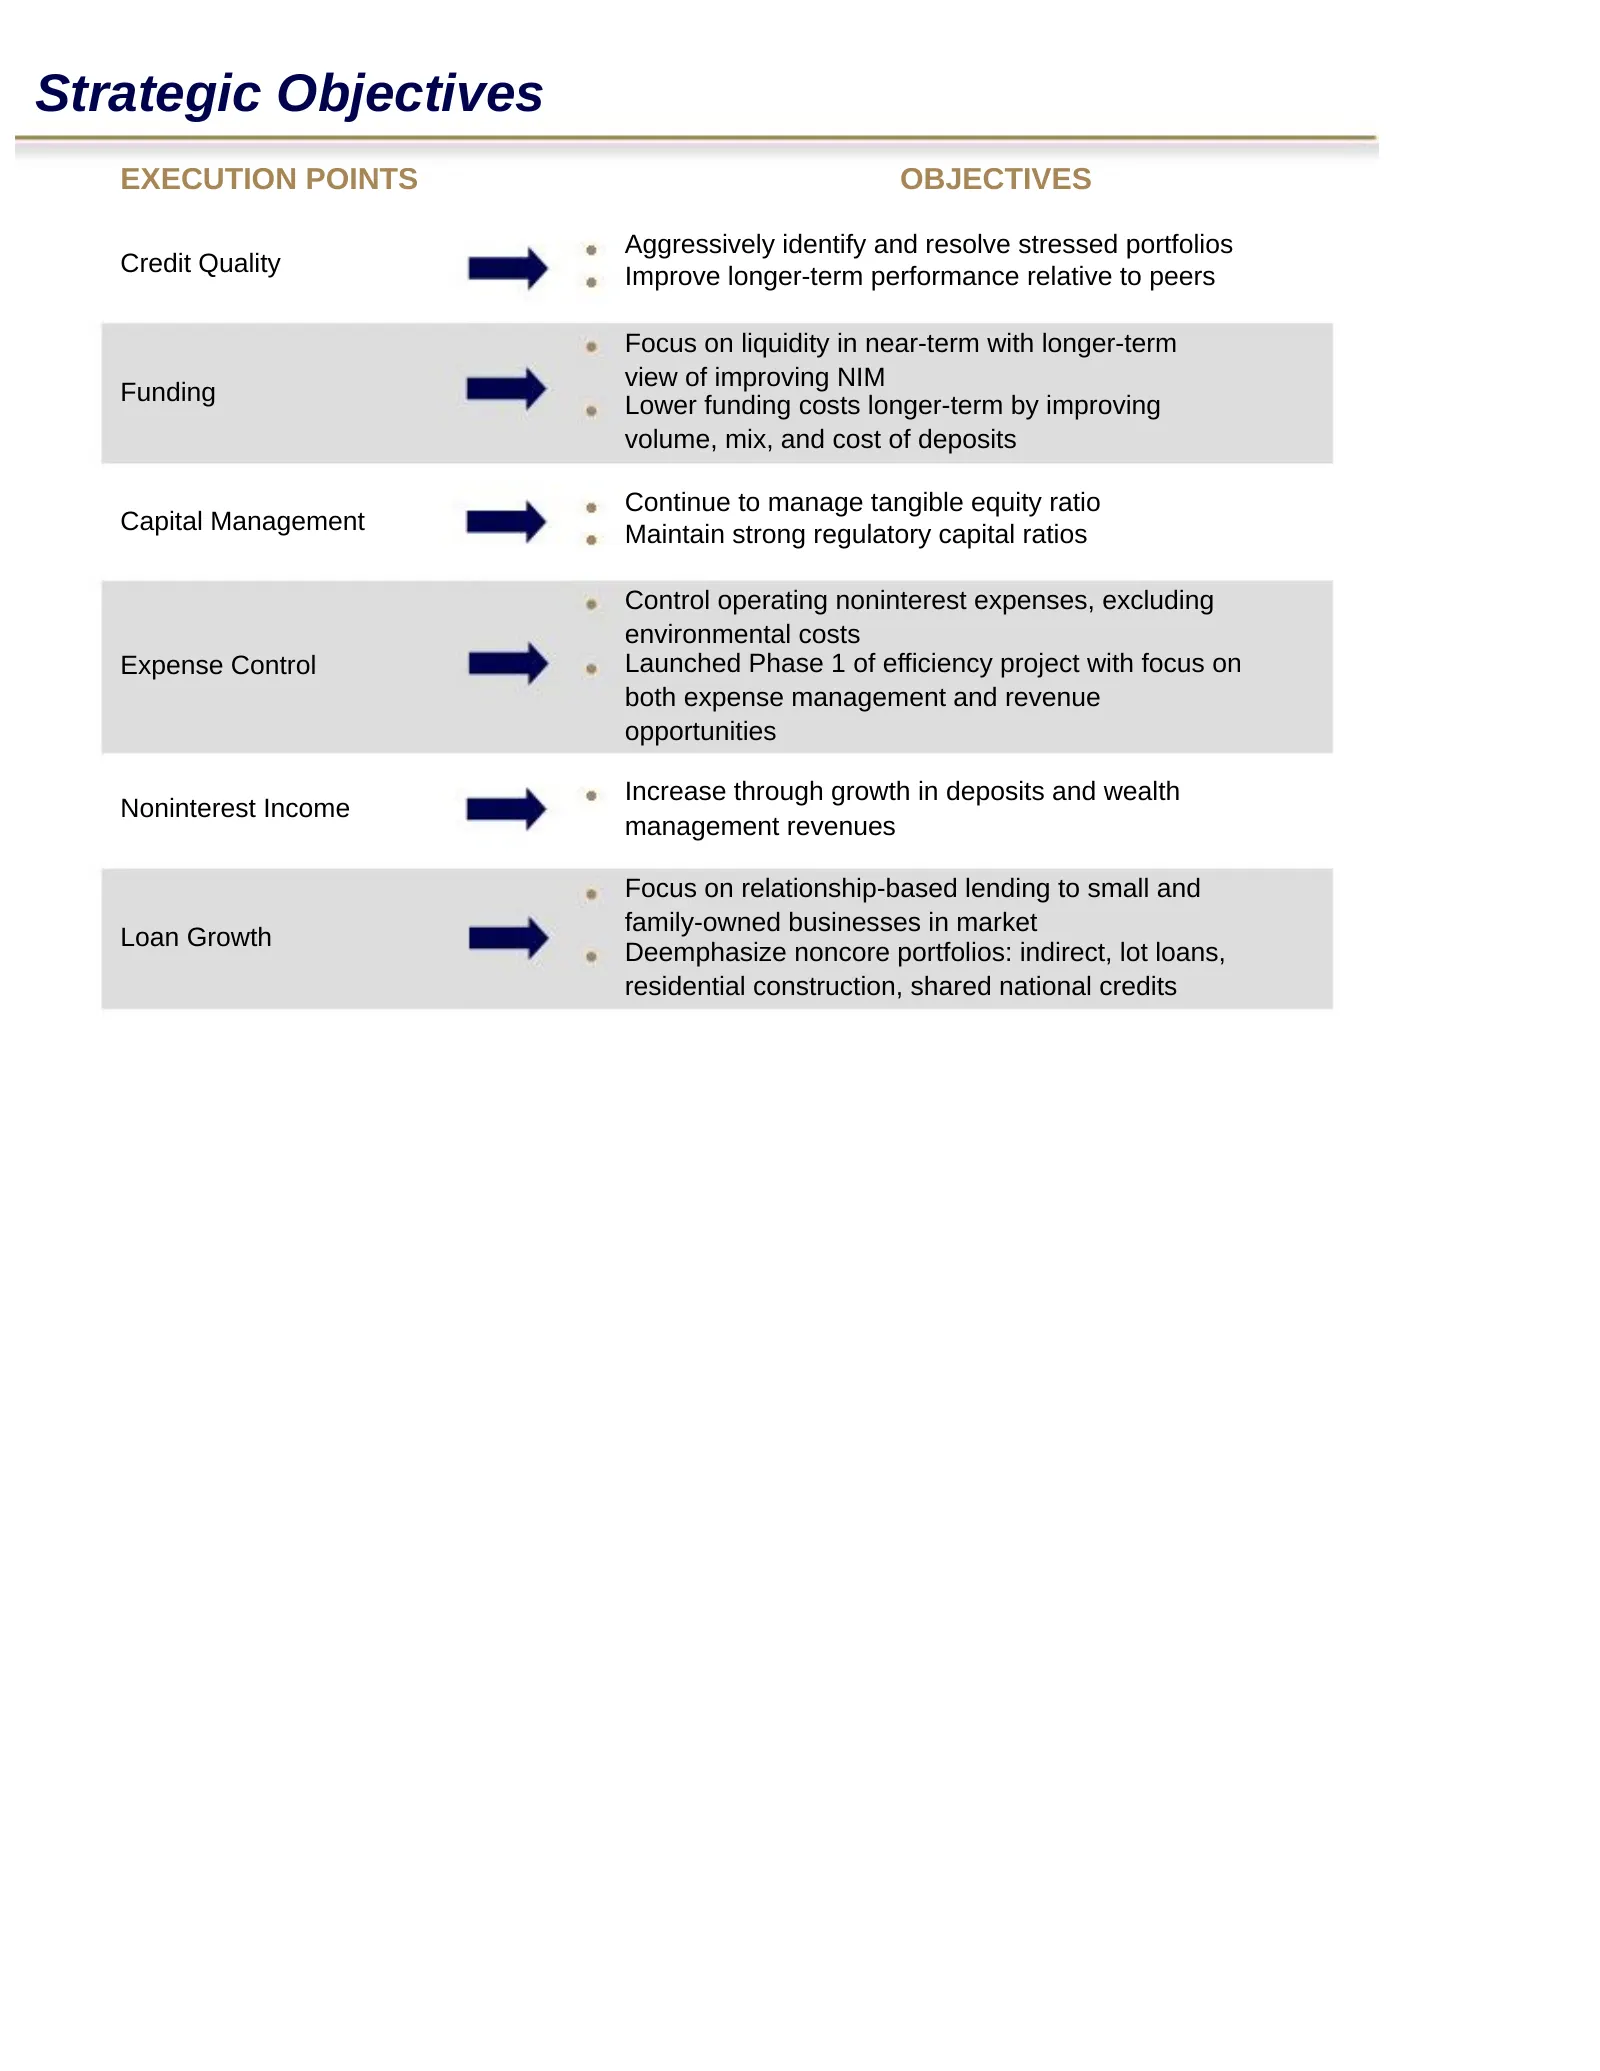
Strategic Objectives EXECUTION POINTS OBJECTIVES Aggressively identify and resolve stressed portfolios Credit Quality Improve longer-term performance relative to peers Focus on liquidity in near-term with longer-term view of improving NIM Funding Lower funding costs longer-term by improving volume,
Slide 12: Diversified Loan Portfolio
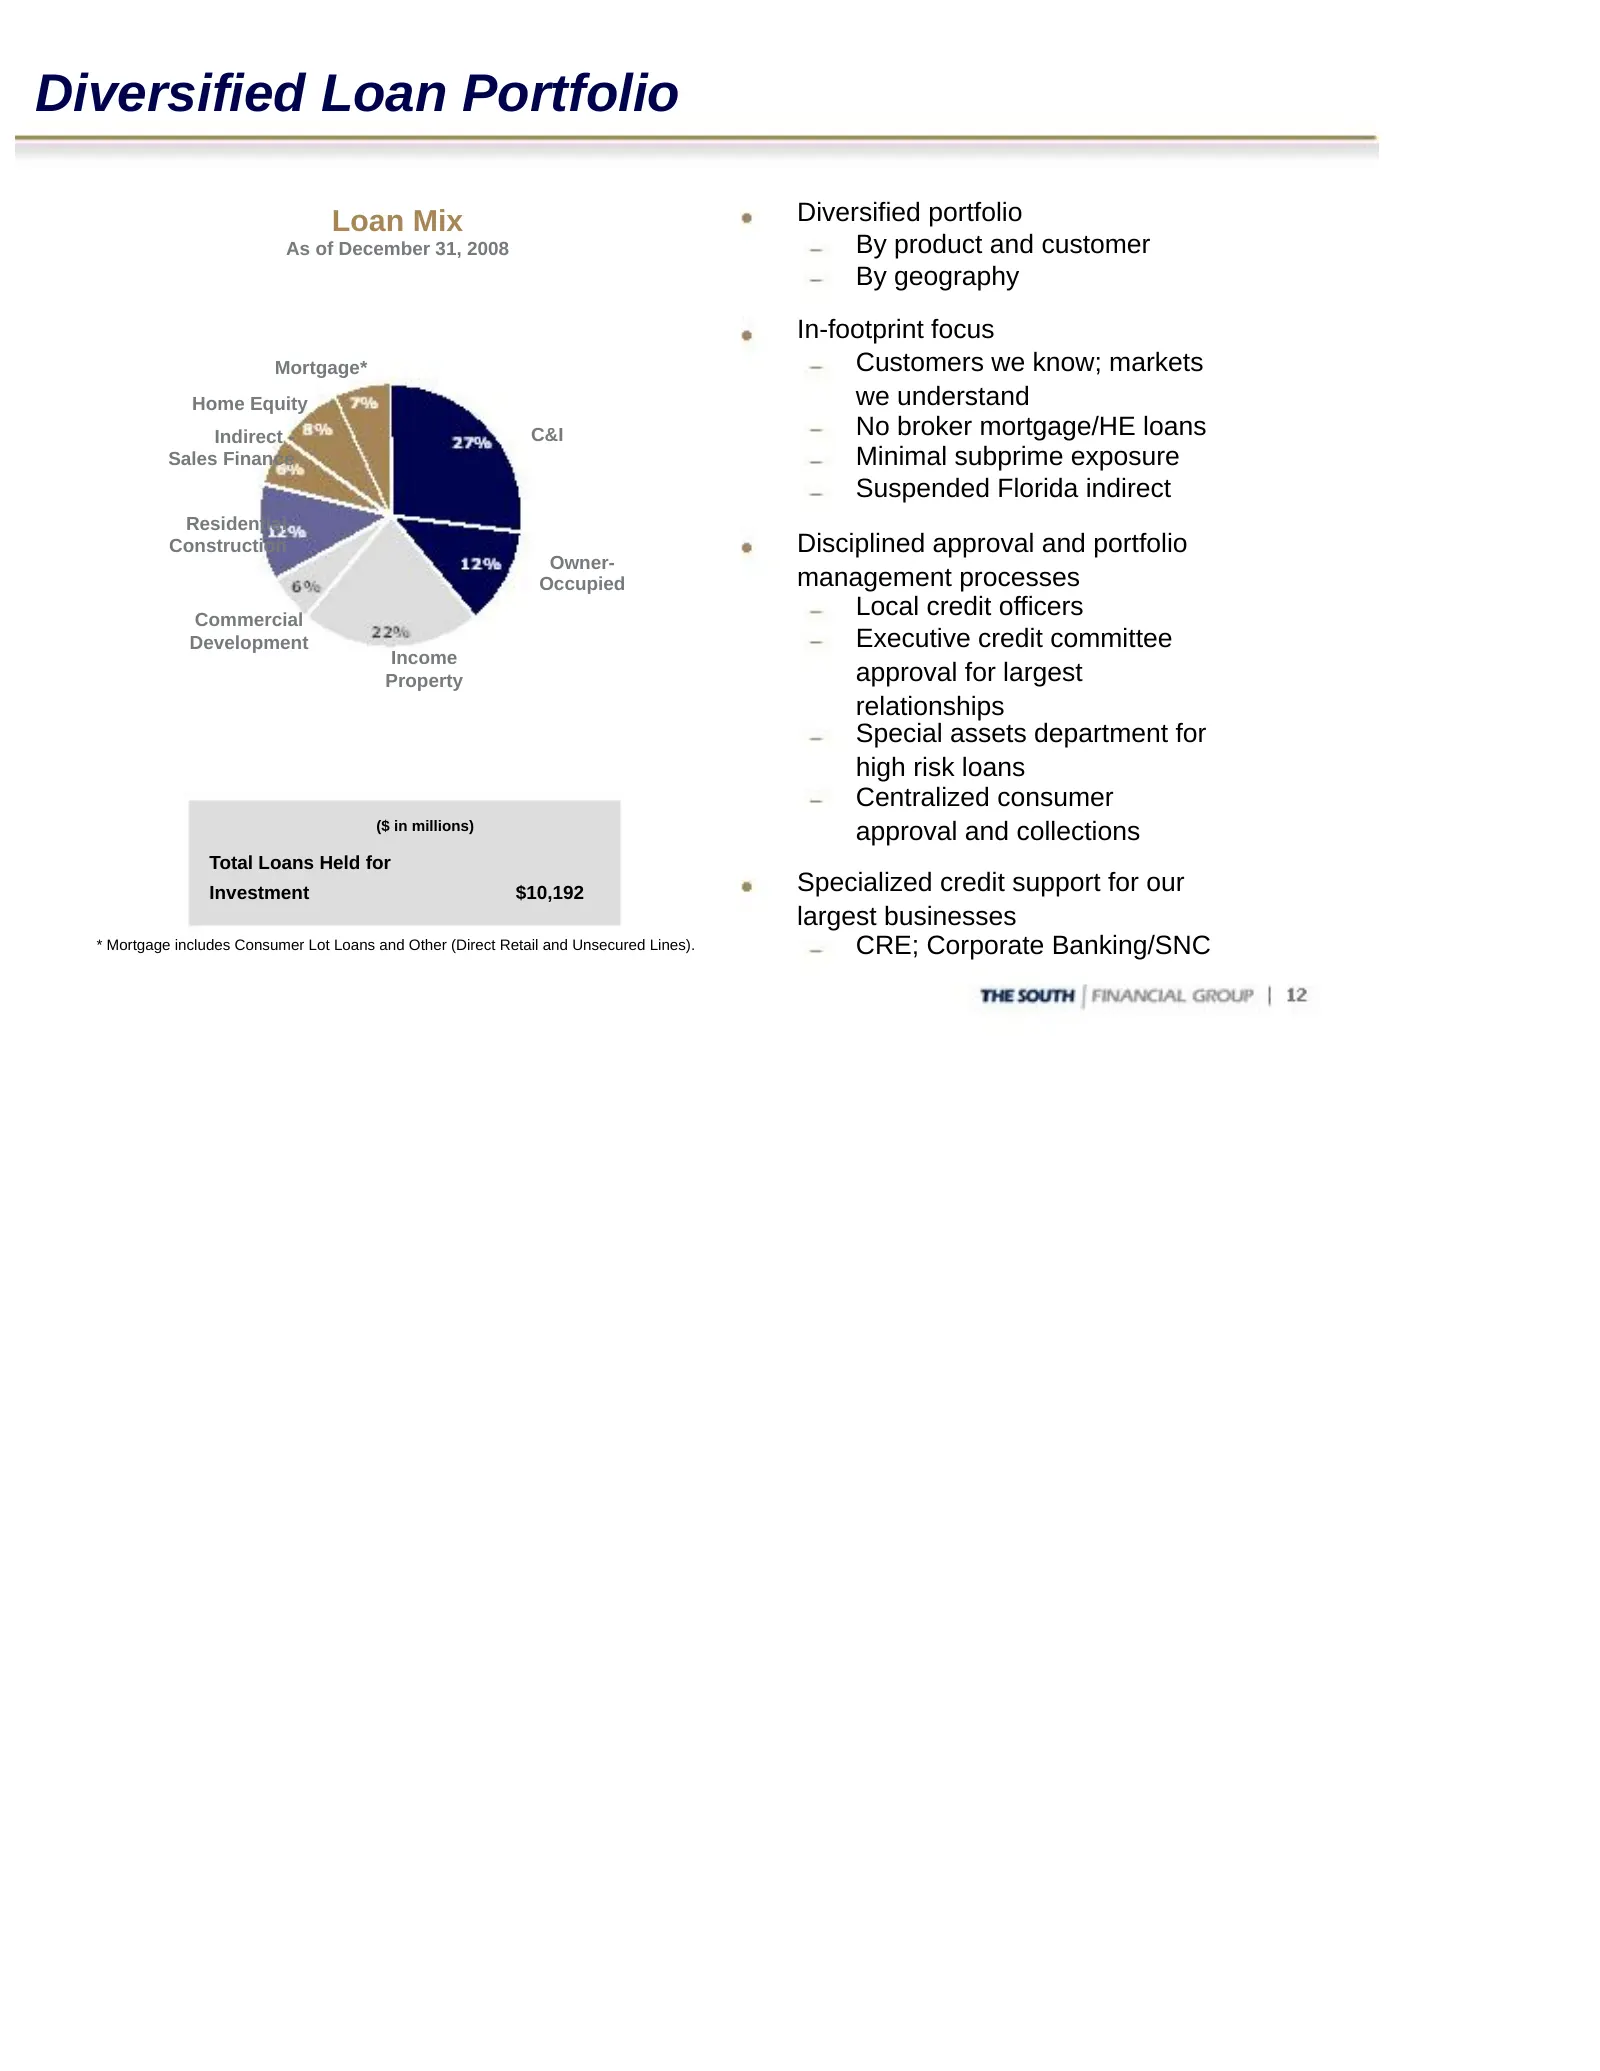
Diversified Loan Portfolio Loan Mix Diversified portfolio As of December 31, 2008 By product and customer By geography In-footprint focus Mortgage* Customers we know; markets Home Equity we understand Indirect - C&I No broker mortgage/HE loans Sales Finance Minimal subprime exposure Suspended Florid
Slide 13: Credit Quality Results
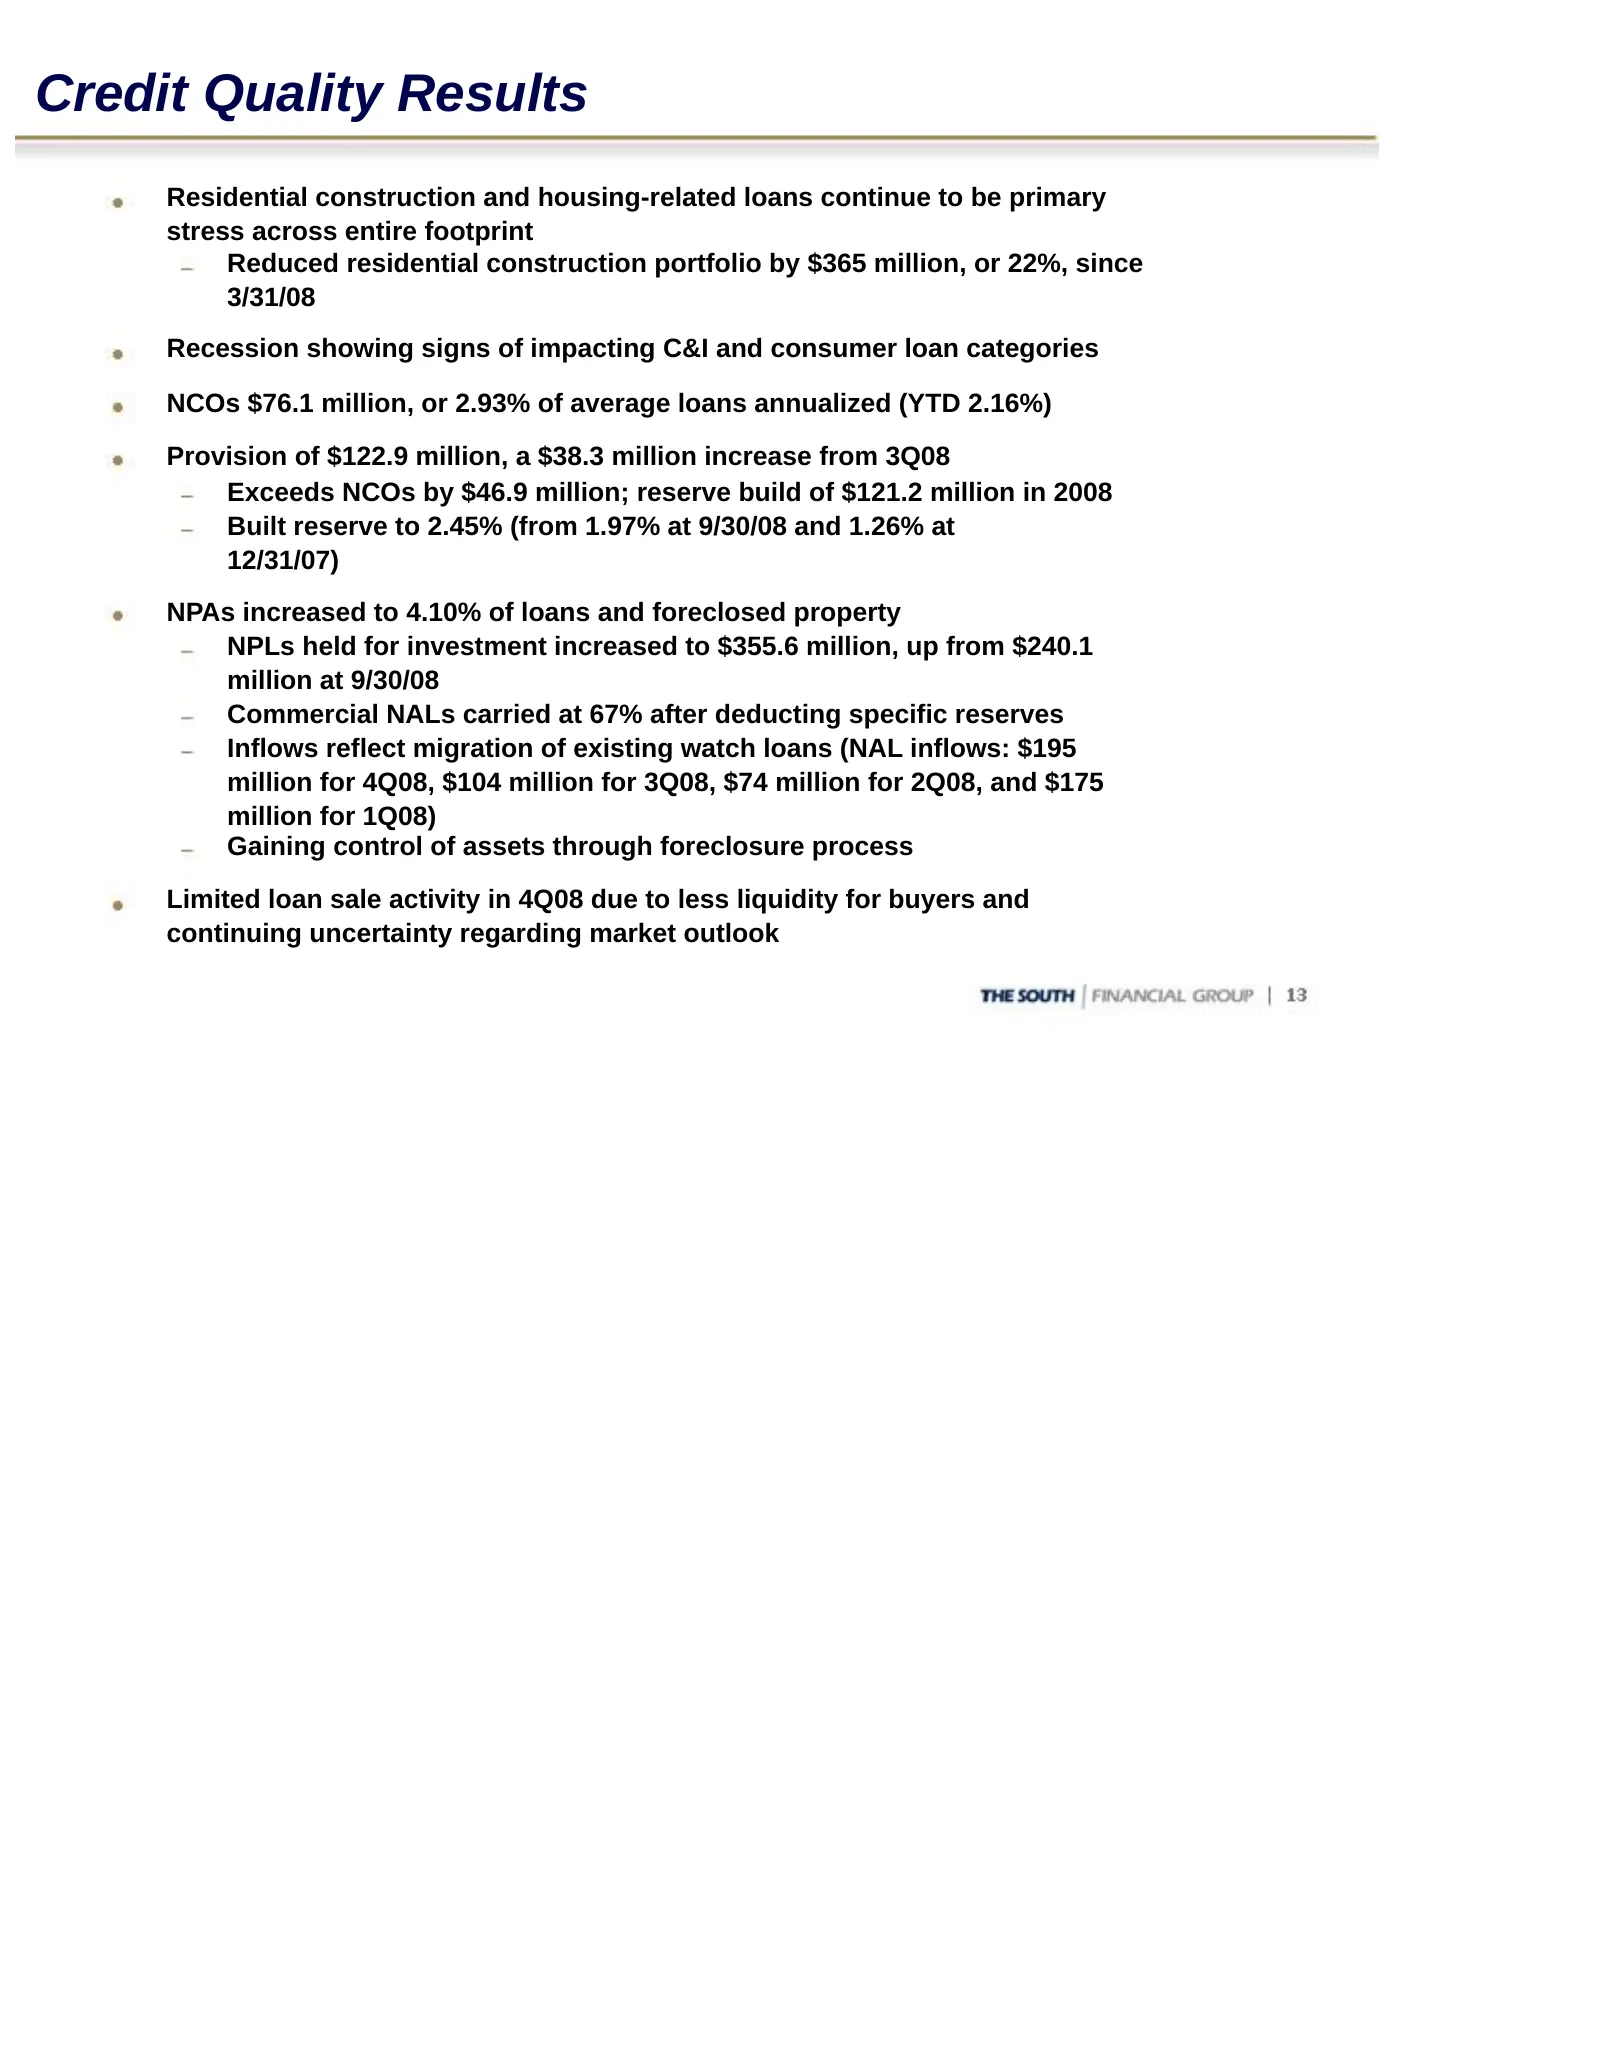
Credit Quality Results Residential construction and housing-related loans continue to be primary stress across entire footprint Reduced residential construction portfolio by $365 million, or 22%, since 3/31/08 Recession showing signs of impacting C&I and consumer loan categories NCOs $76.1 million,
Slide 14: Loan and Credit Quality Composition
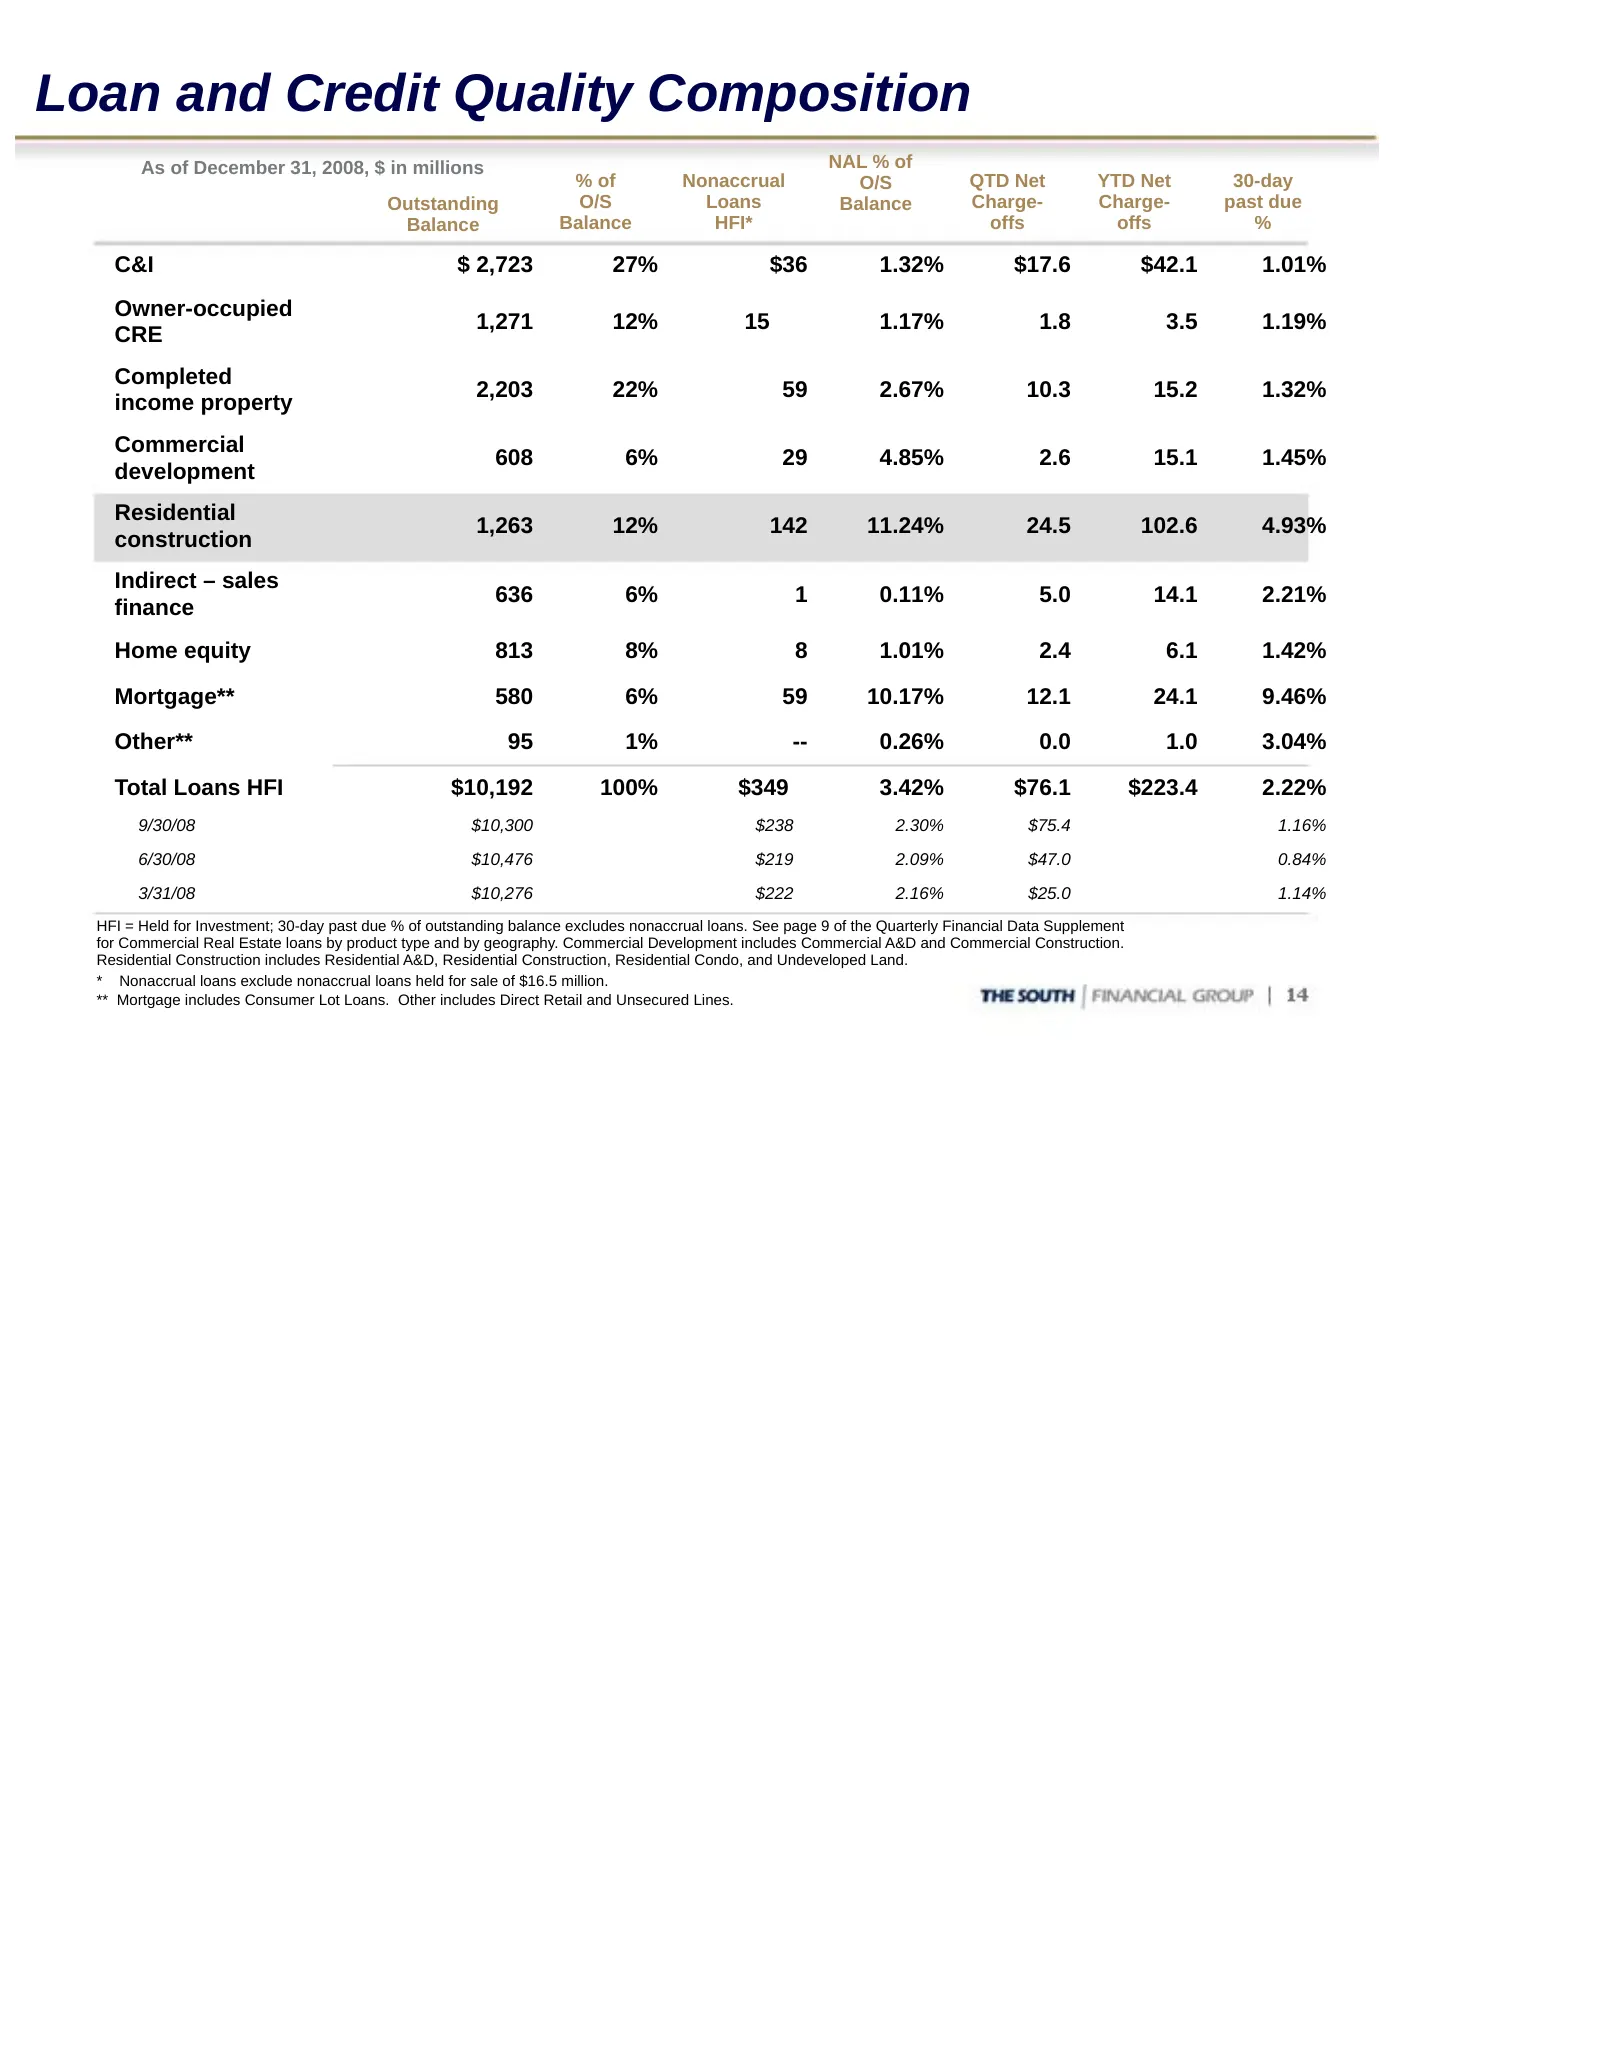
Loan and Credit Quality Composition As of December 31, 2008, $ in millions NAL % of % of Nonaccrual O/S QTD Net YTD Net 30-day Outstanding O/S Loans Balance Charge- Charge- past due Balance Balance HFI* offs offs % C&I $ 2,723 27% $36 1.32% $17.6 $42.1 1.01% Owner-occupied 1,271 12% 15 1.17% 1.8 3.5
Slide 15: Credit Quality Trends - Commercial
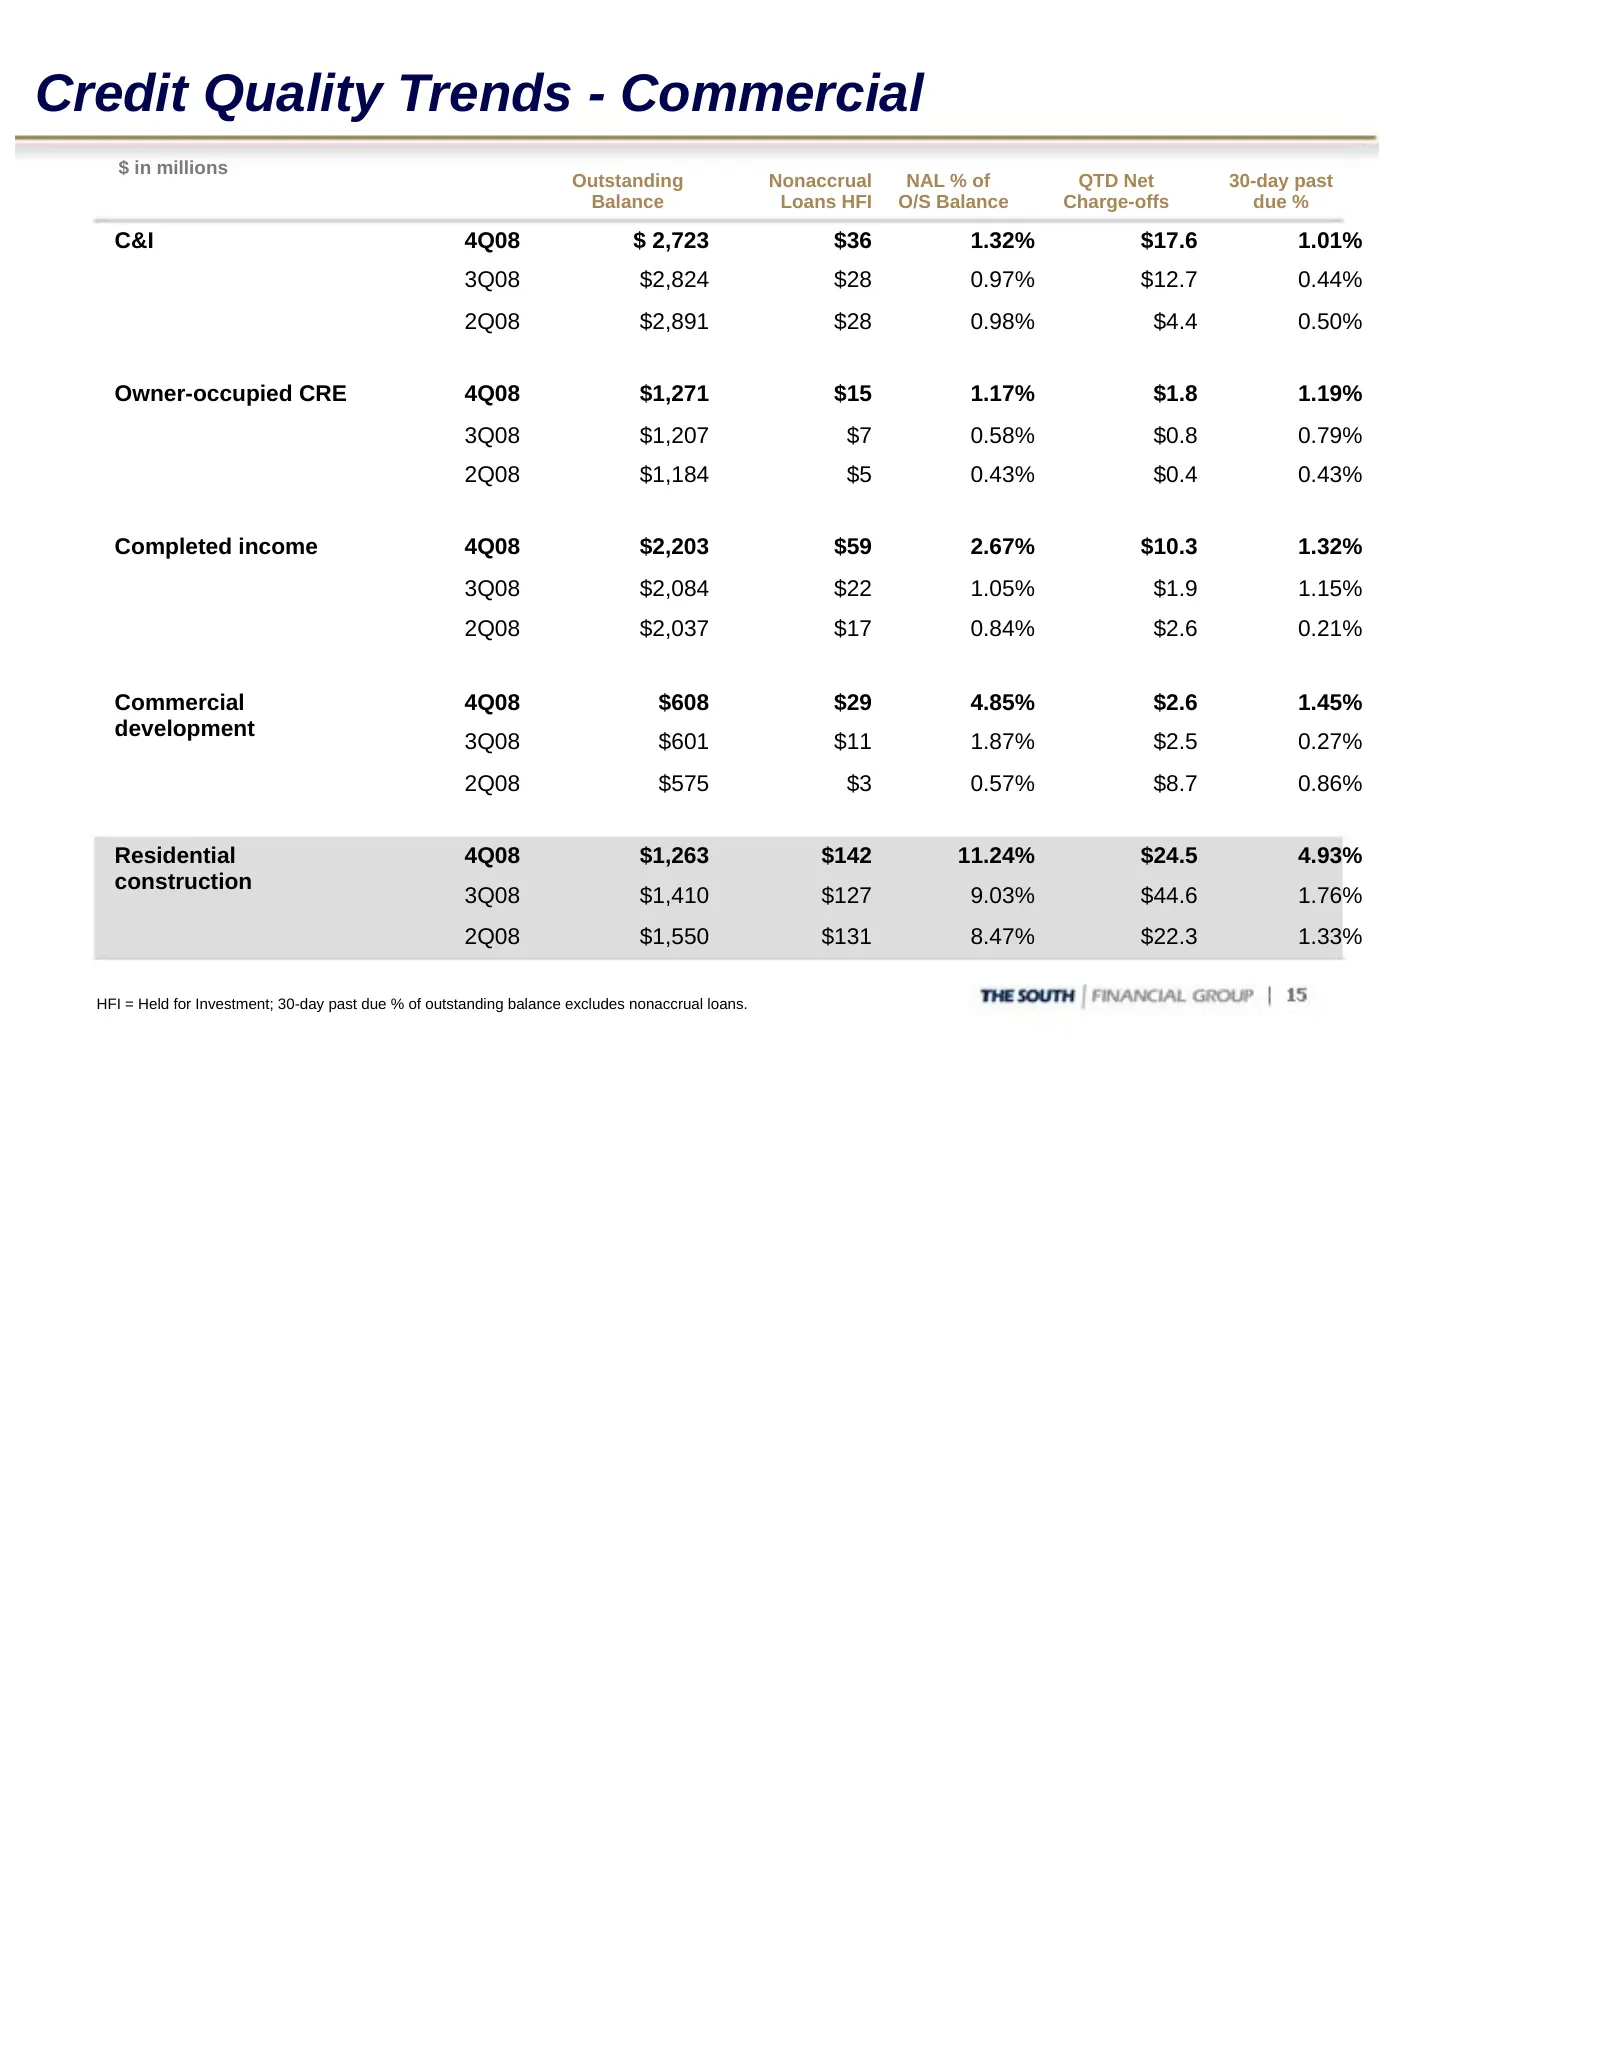
Credit Quality Trends - Commercial $ in millions Outstanding Nonaccrual NAL % of QTD Net 30-day past Balance Loans HFI O/S Balance Charge-offs due % C&I 4Q08 $ 2,723 $36 1.32% $17.6 1.01% 3Q08 $2,824 $28 0.97% $12.7 0.44% 2Q08 $2,891 $28 0.98% $4.4 0.50% Owner-occupied CRE 4Q08 $1,271 $15 1.17% $1.8
Slide 16: Credit Quality Trends - Consumer
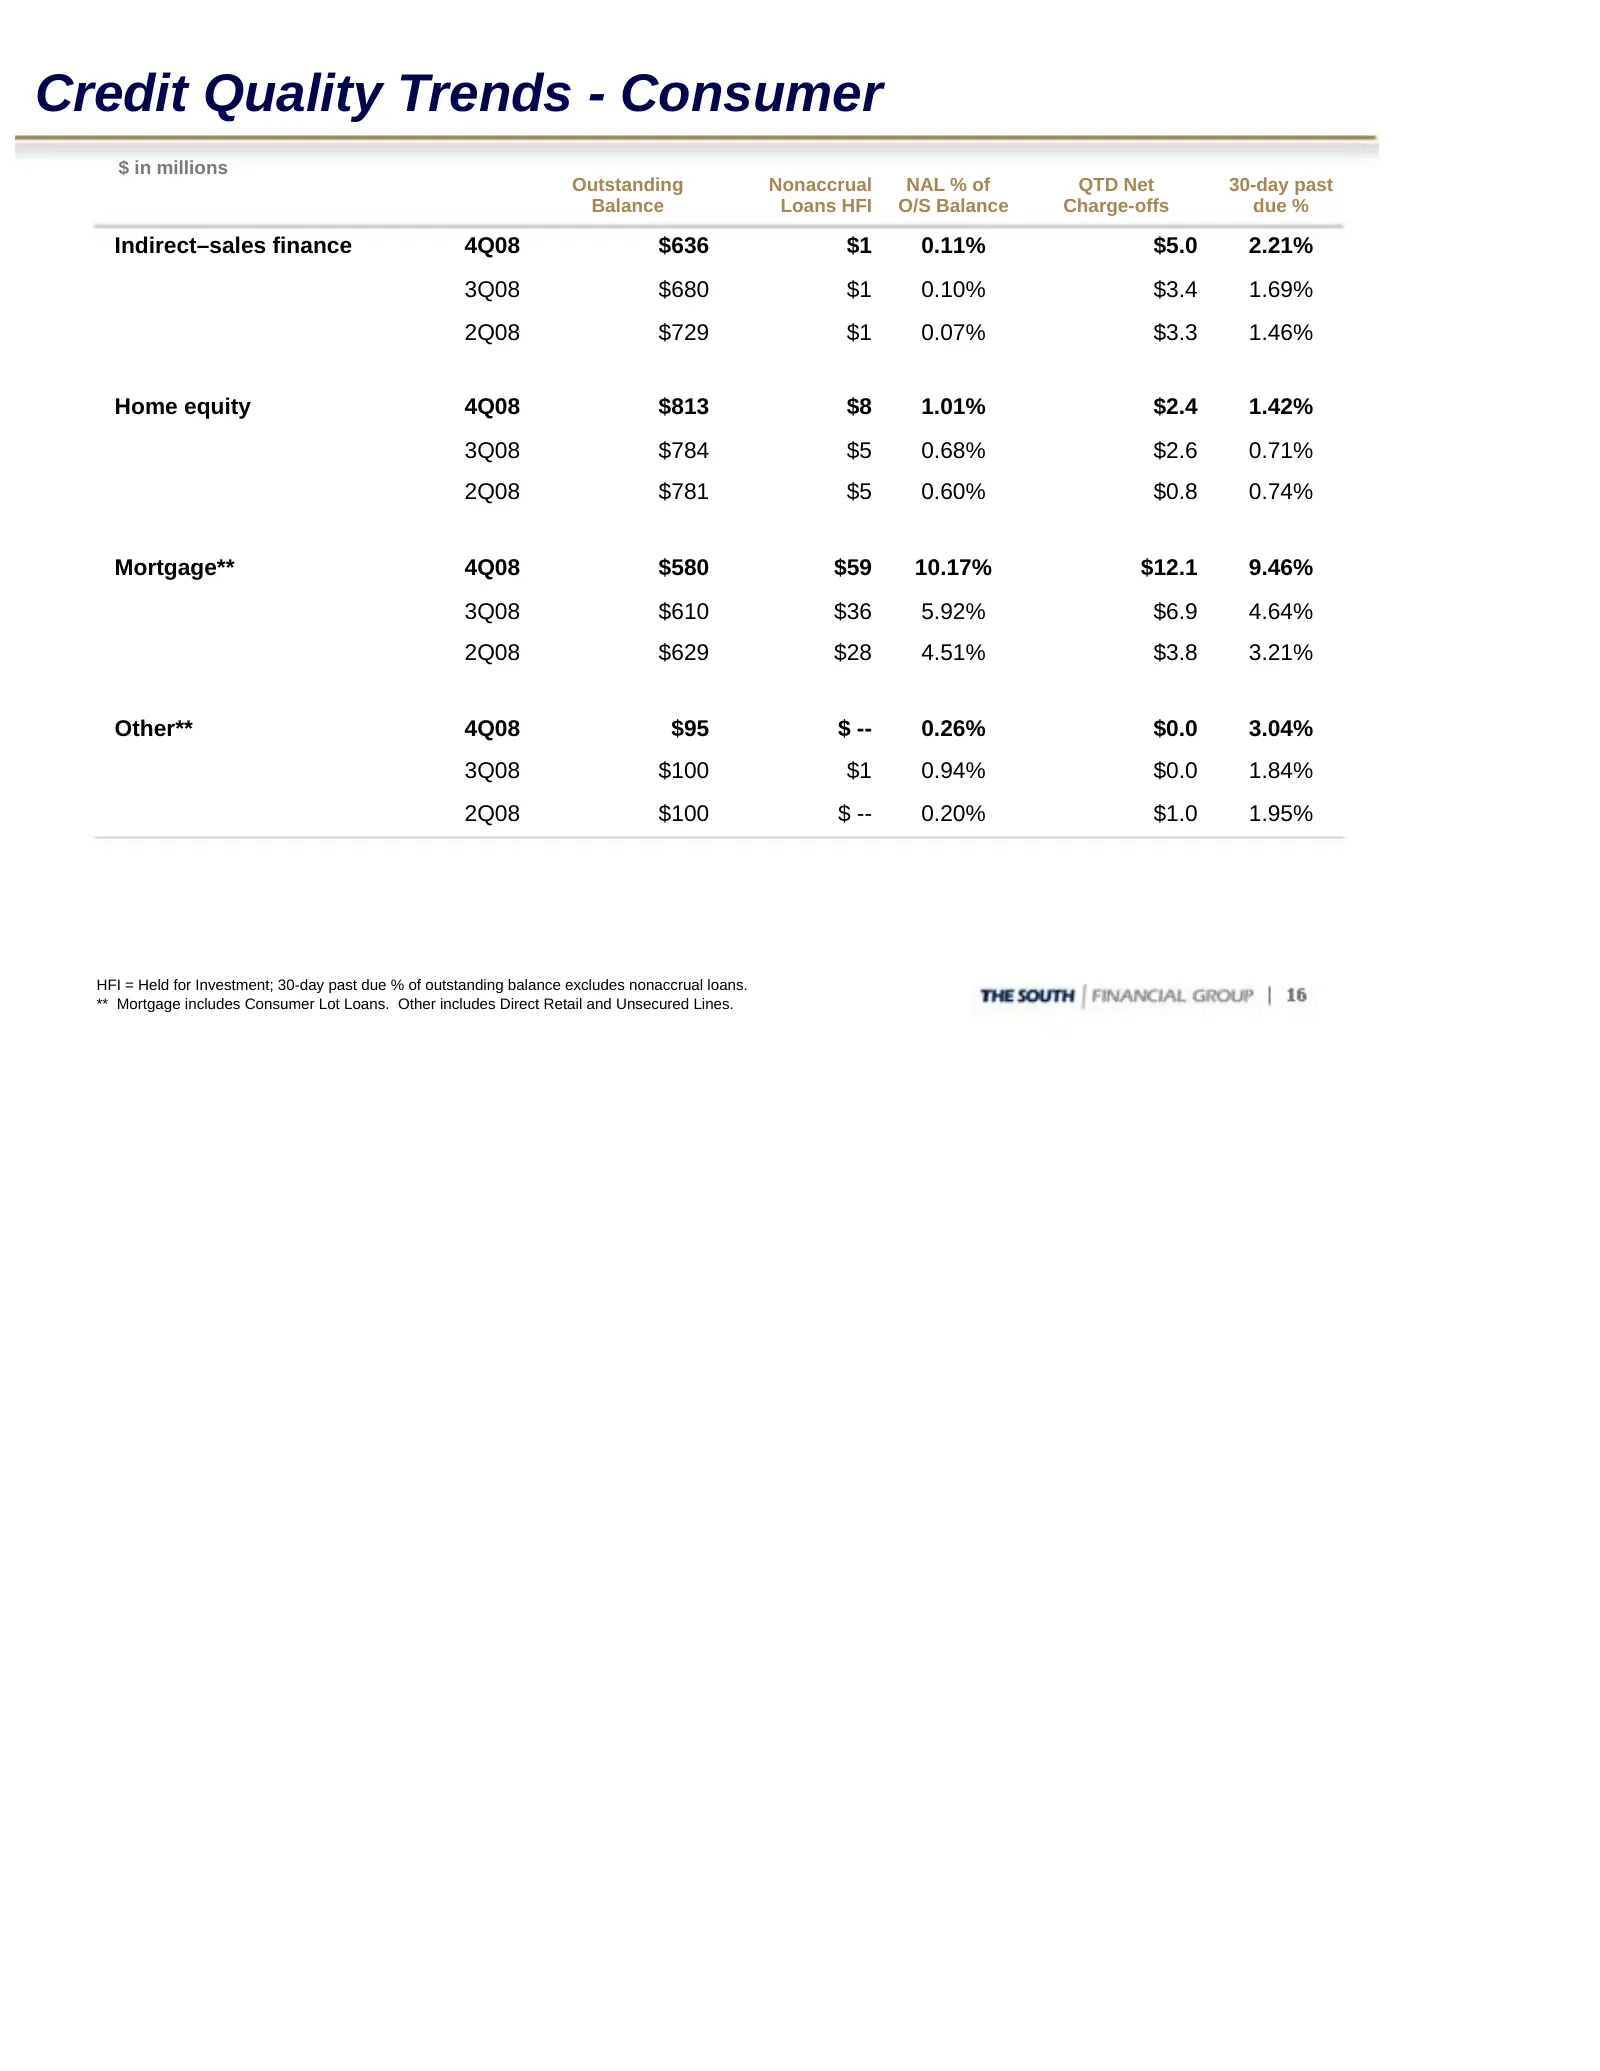
Credit Quality Trends - Consumer $ in millions Outstanding Nonaccrual NAL % of QTD Net 30-day past Balance Loans HFI O/S Balance Charge-offs due % Indirect–sales finance 4Q08 $636 $1 0.11% $5.0 2.21% 3Q08 $680 $1 0.10% $3.4 1.69% 2Q08 $729 $1 0.07% $3.3 1.46% Home equity 4Q08 $813 $8 1.01% $2.4 1.42
Slide 17: Residential Construction by Geography
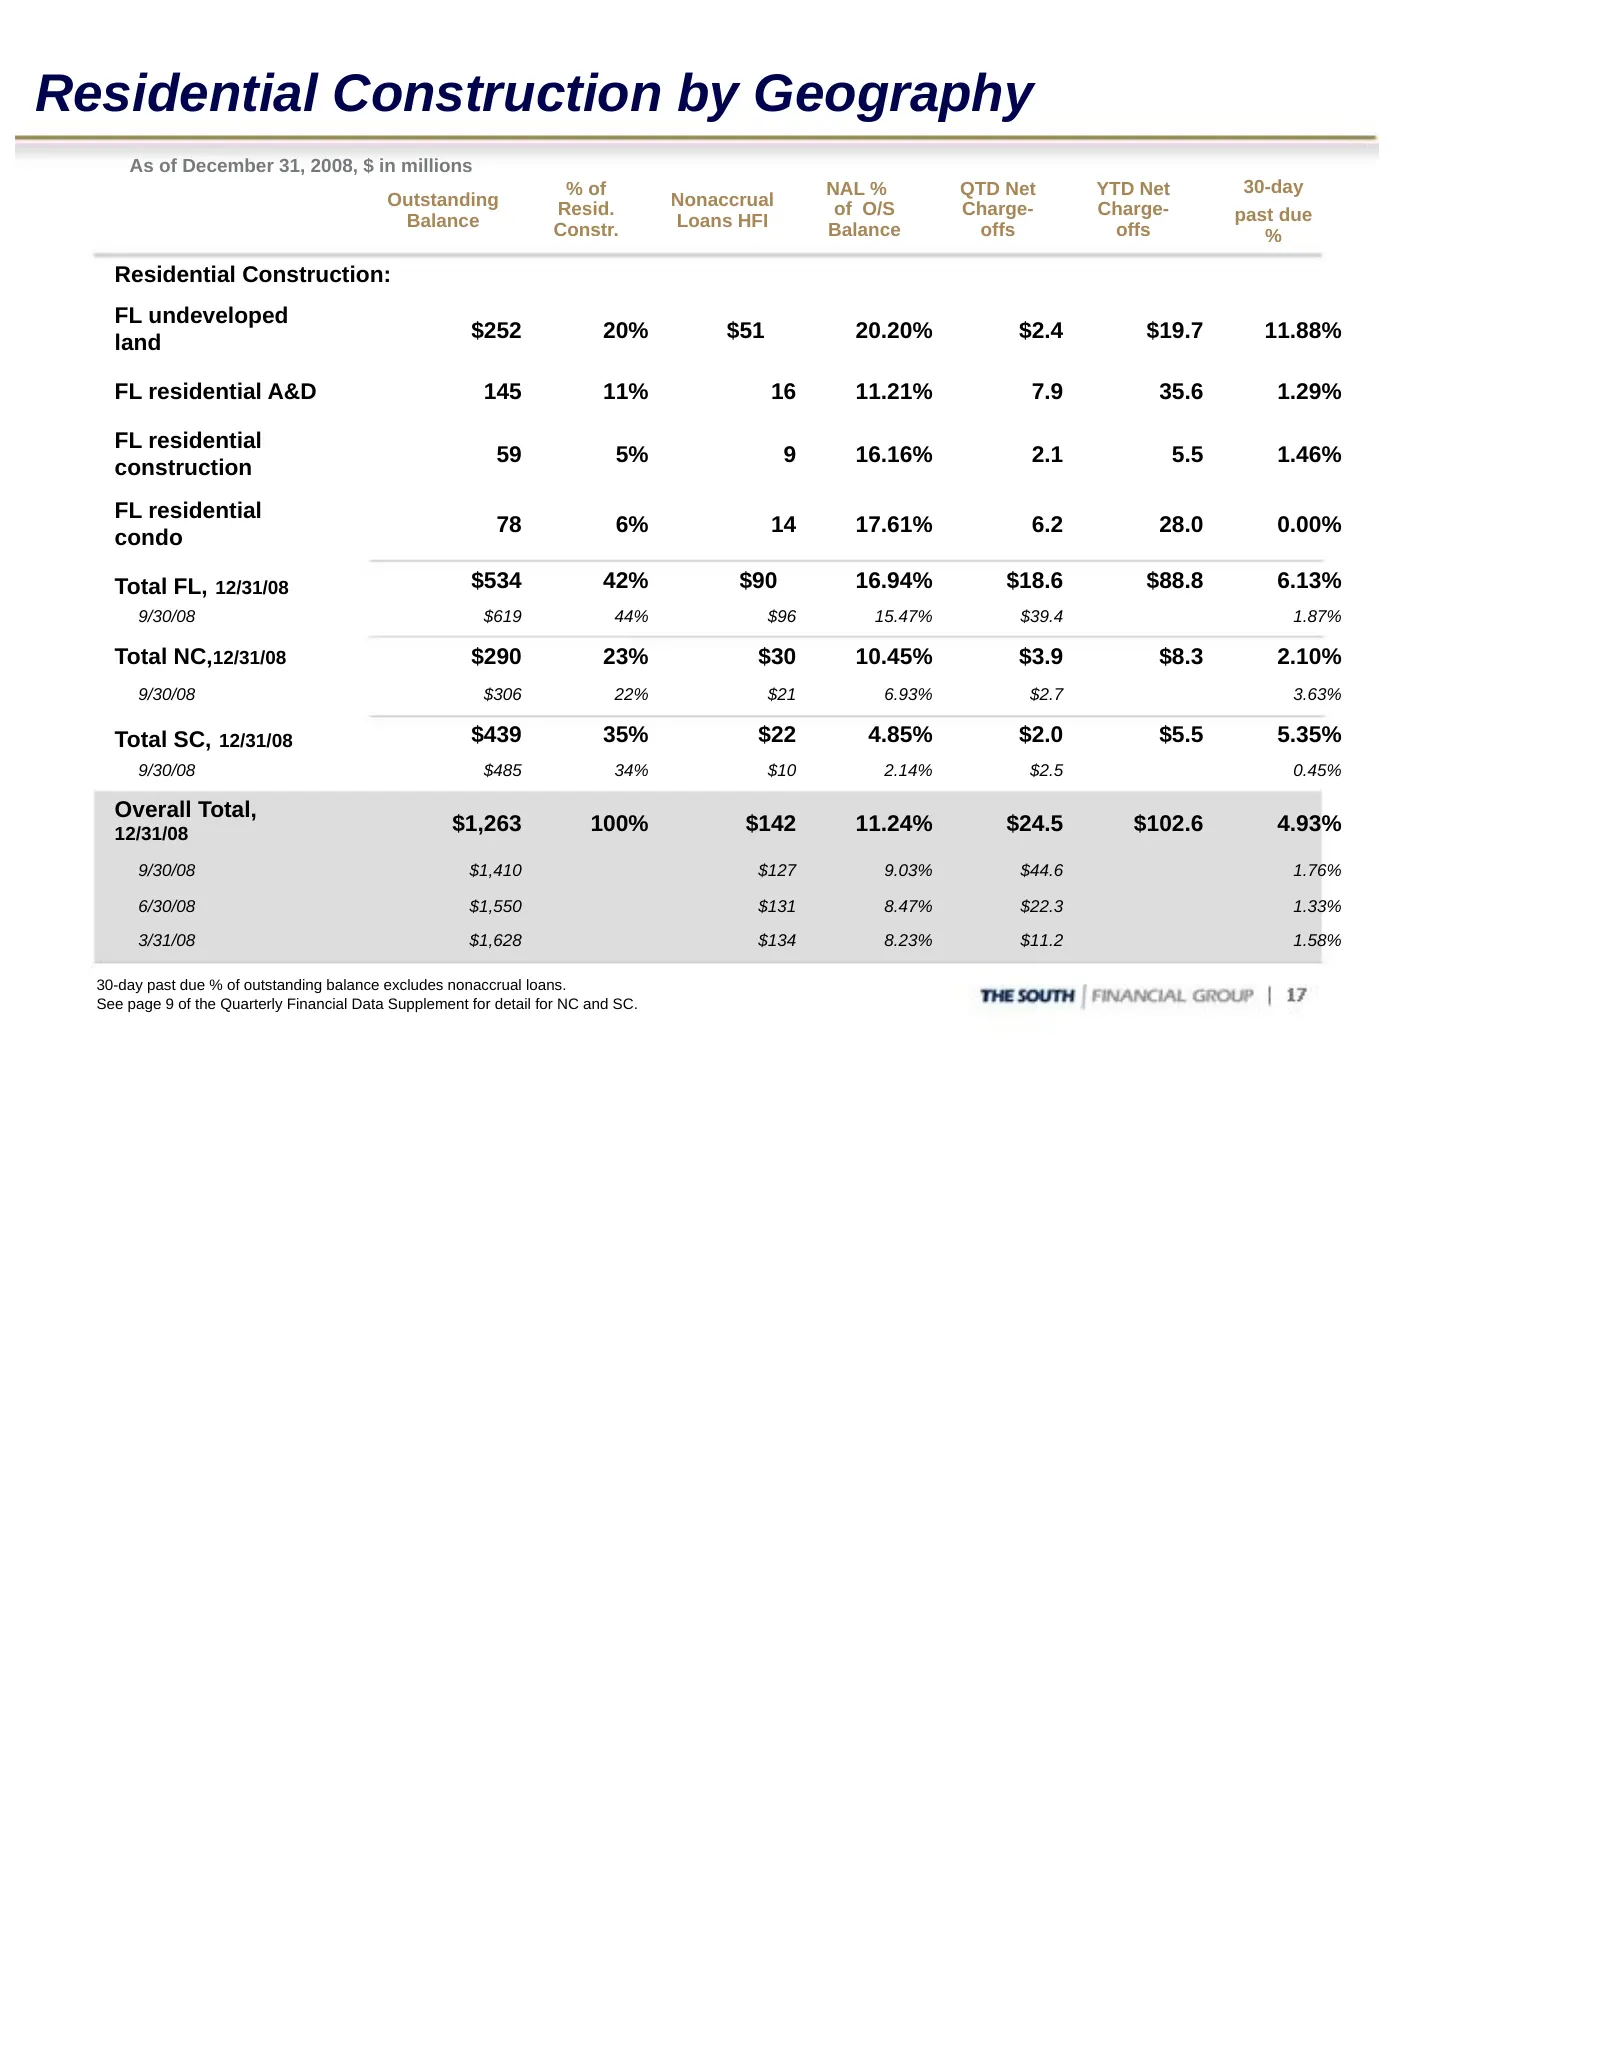
Residential Construction by Geography As of December 31, 2008, $ in millions % of NAL % QTD Net YTD Net 30-day Outstanding Resid. Nonaccrual of O/S Charge- Charge- Balance Loans HFI past due Constr. Balance offs offs % Residential Construction: FL undeveloped $252 20% $51 20.20% $2.4 $19.7 11.88% la
Slide 18: Commercial Nonaccruals – Net Balance
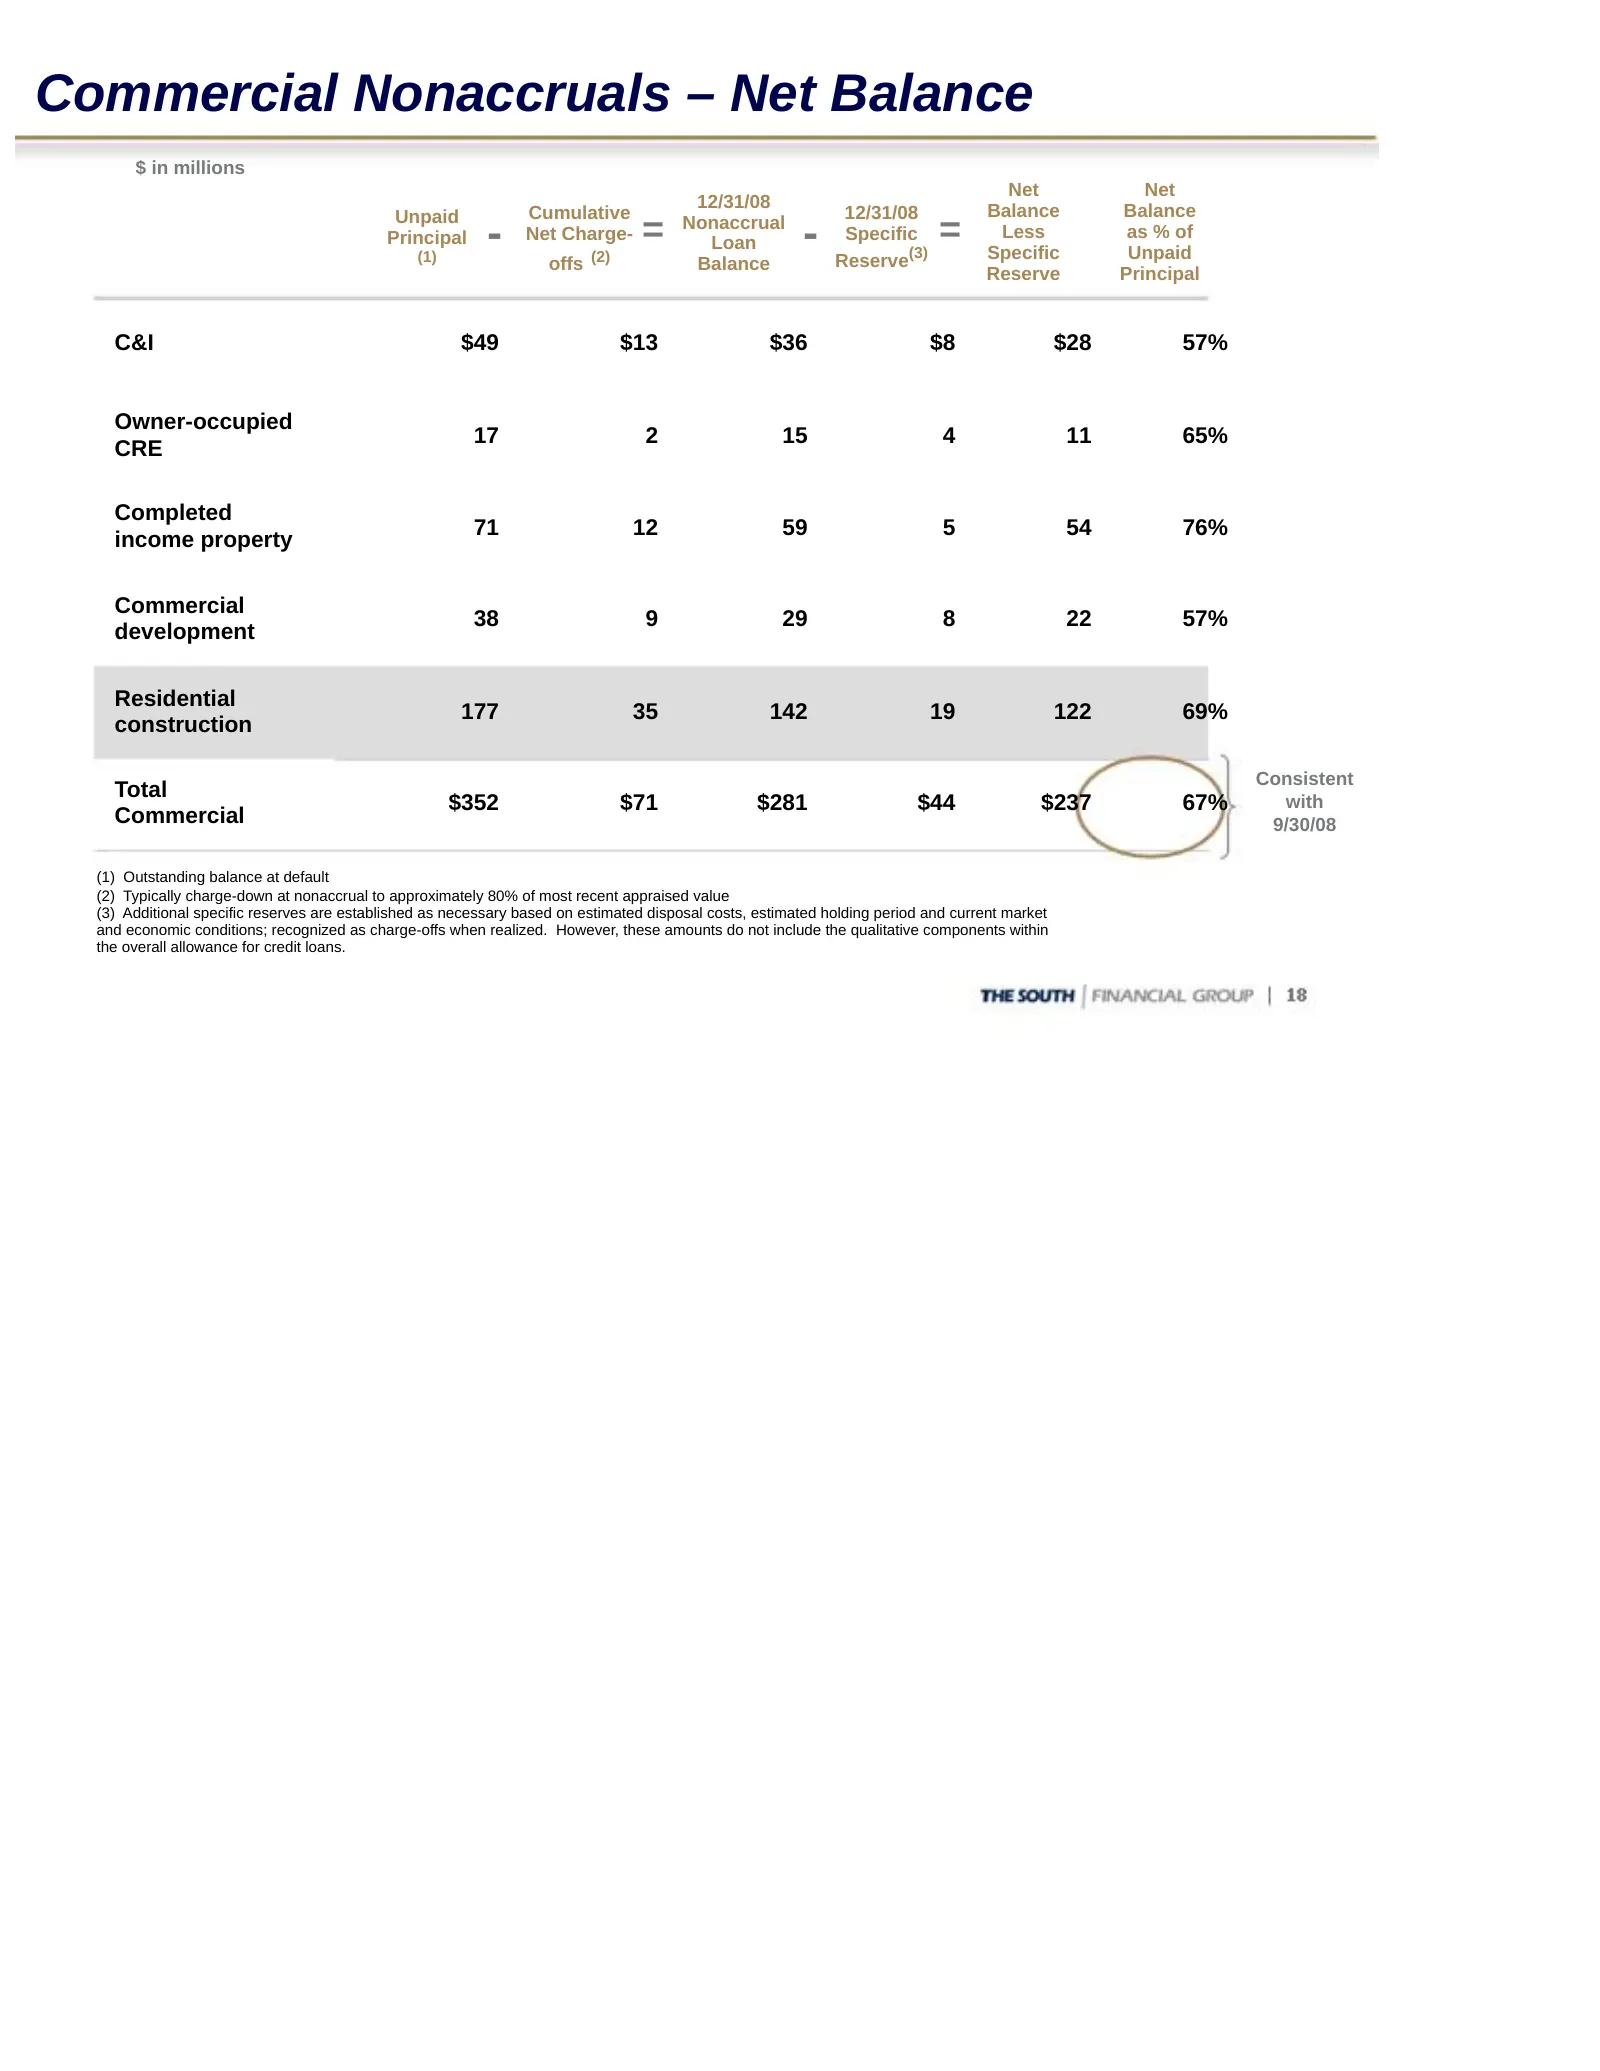
Commercial Nonaccruals – Net Balance $ in millions Net Net 12/31/08 Unpaid Cumulative 12/31/08 Balance Balance Principal (1) - Net Charge- offs (2) = Nonaccrual Loan Balance - Specific Reserve(3) = Less Specific as % of Unpaid Reserve Principal C&I $49 $13 $36 $8 $28 57% Owner-occupied 17 2 15 4 11
Slide 19: Indirect – Sales Finance
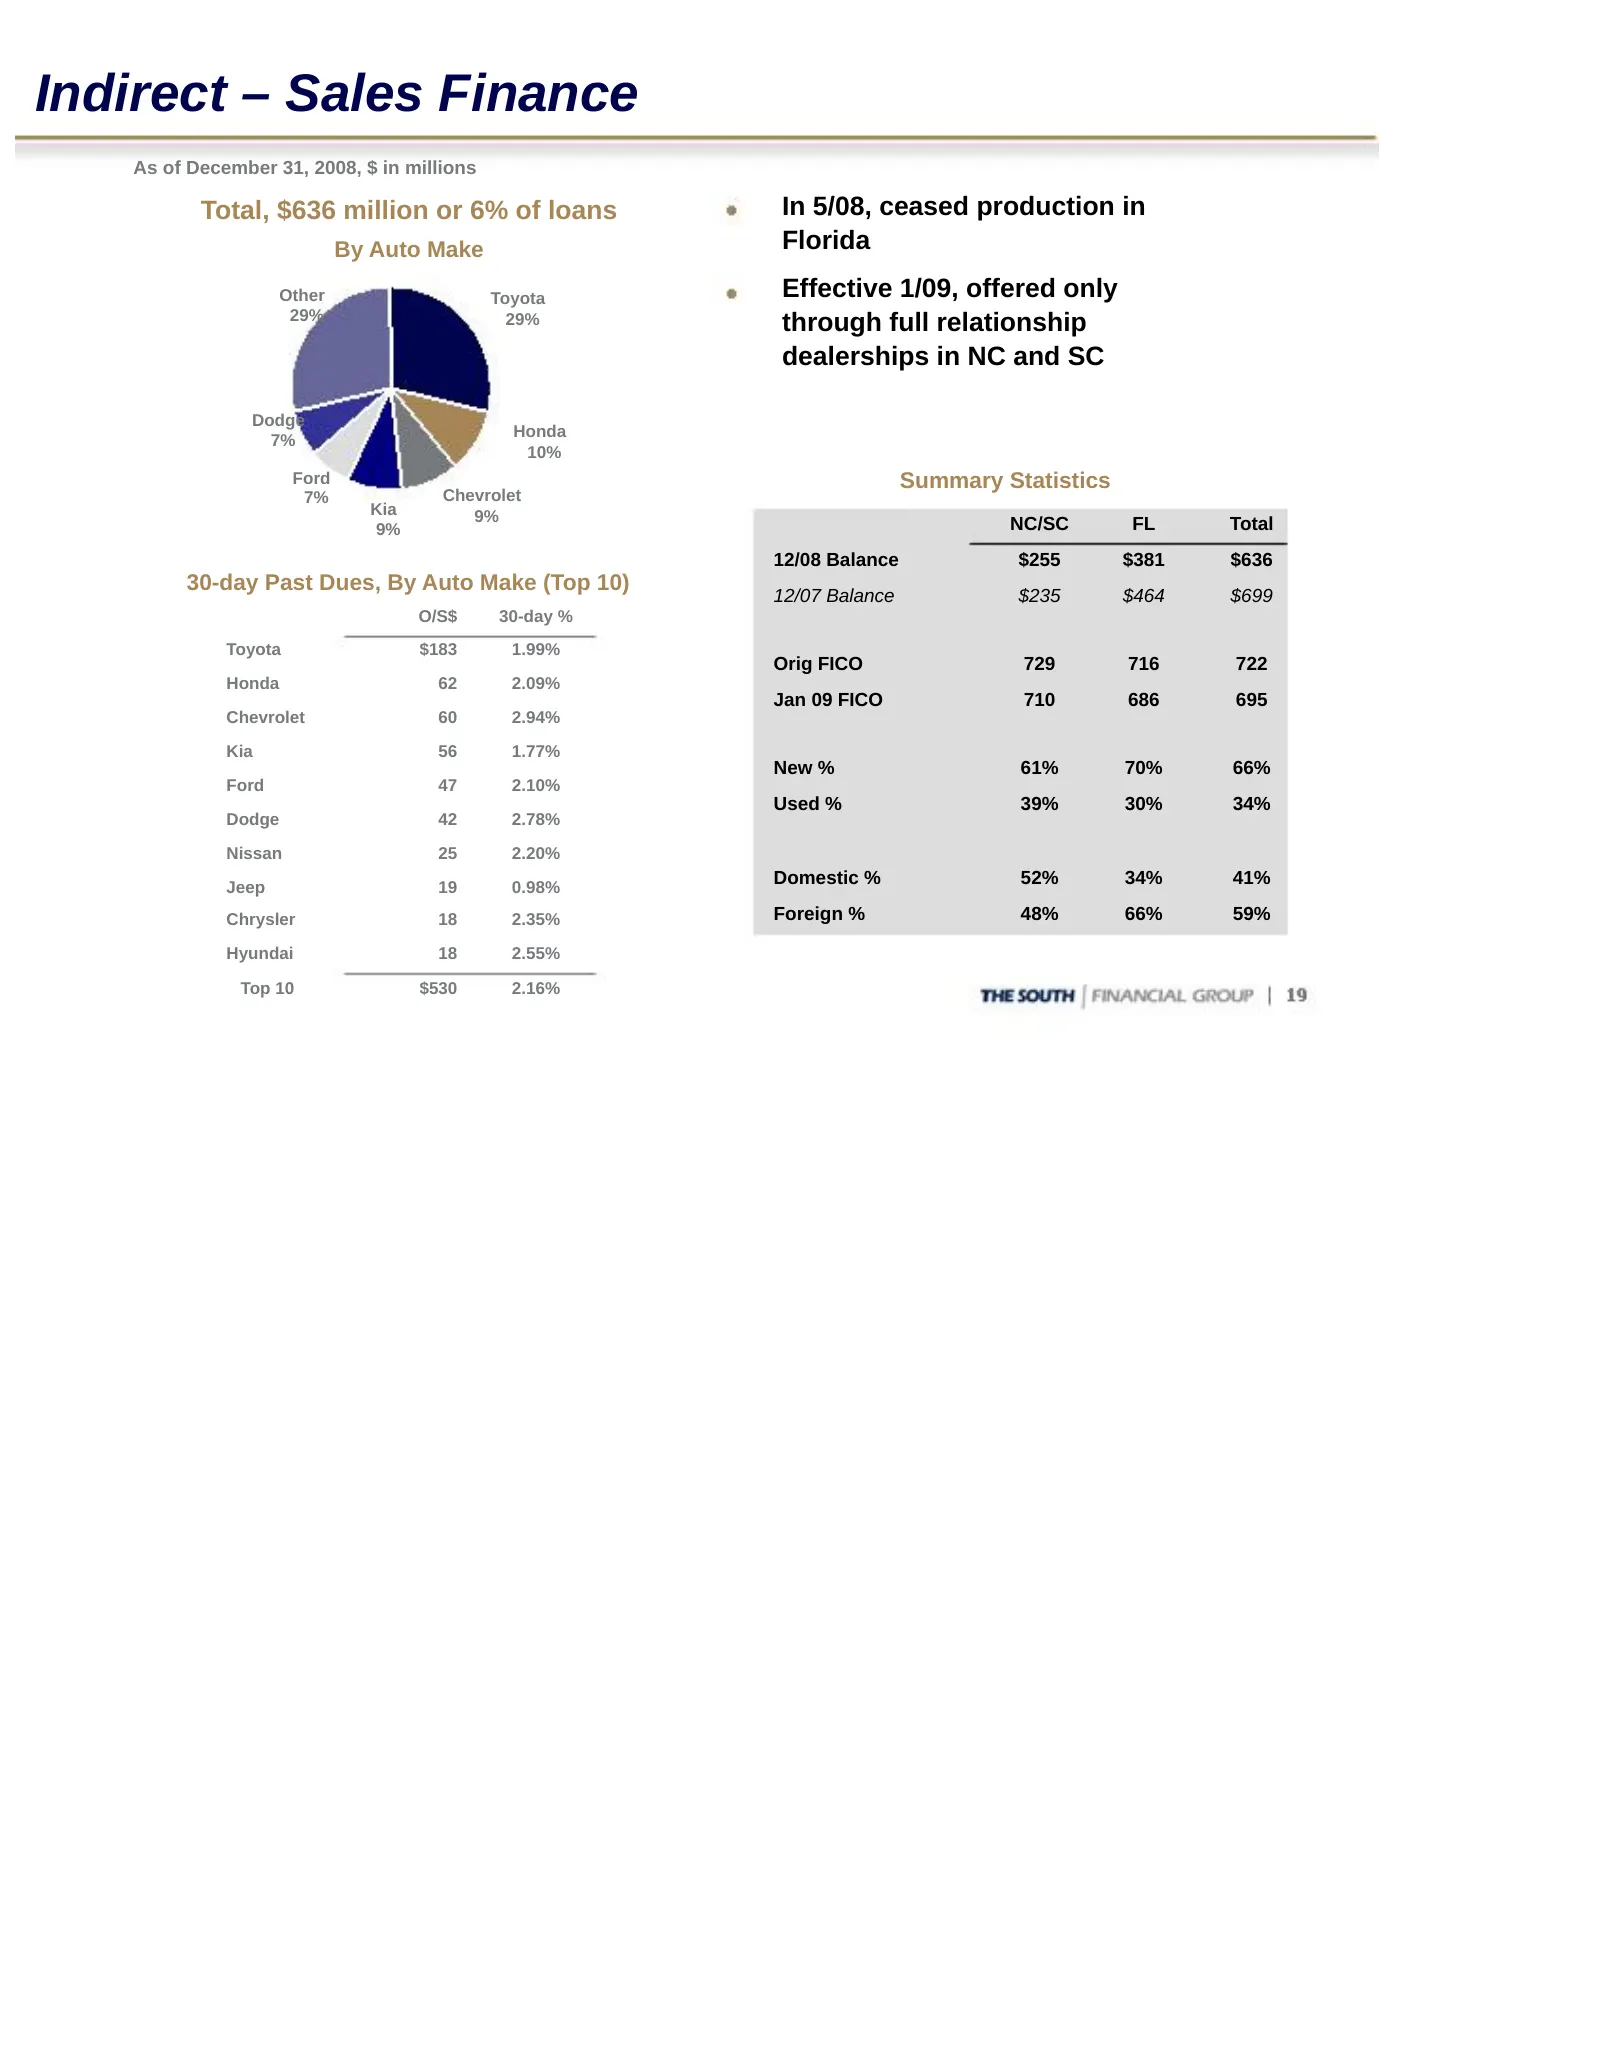
Indirect – Sales Finance As of December 31, 2008, $ in millions Total, $636 million or 6% of loans In 5/08, ceased production in By Auto Make Florida Other Toyota Effective 1/09, offered only 29% 29% through full relationship dealerships in NC and SC Dodge Honda 7% 10% Ford Summary Statistics 7% Che
Slide 20: Home Equity Lines/Loans
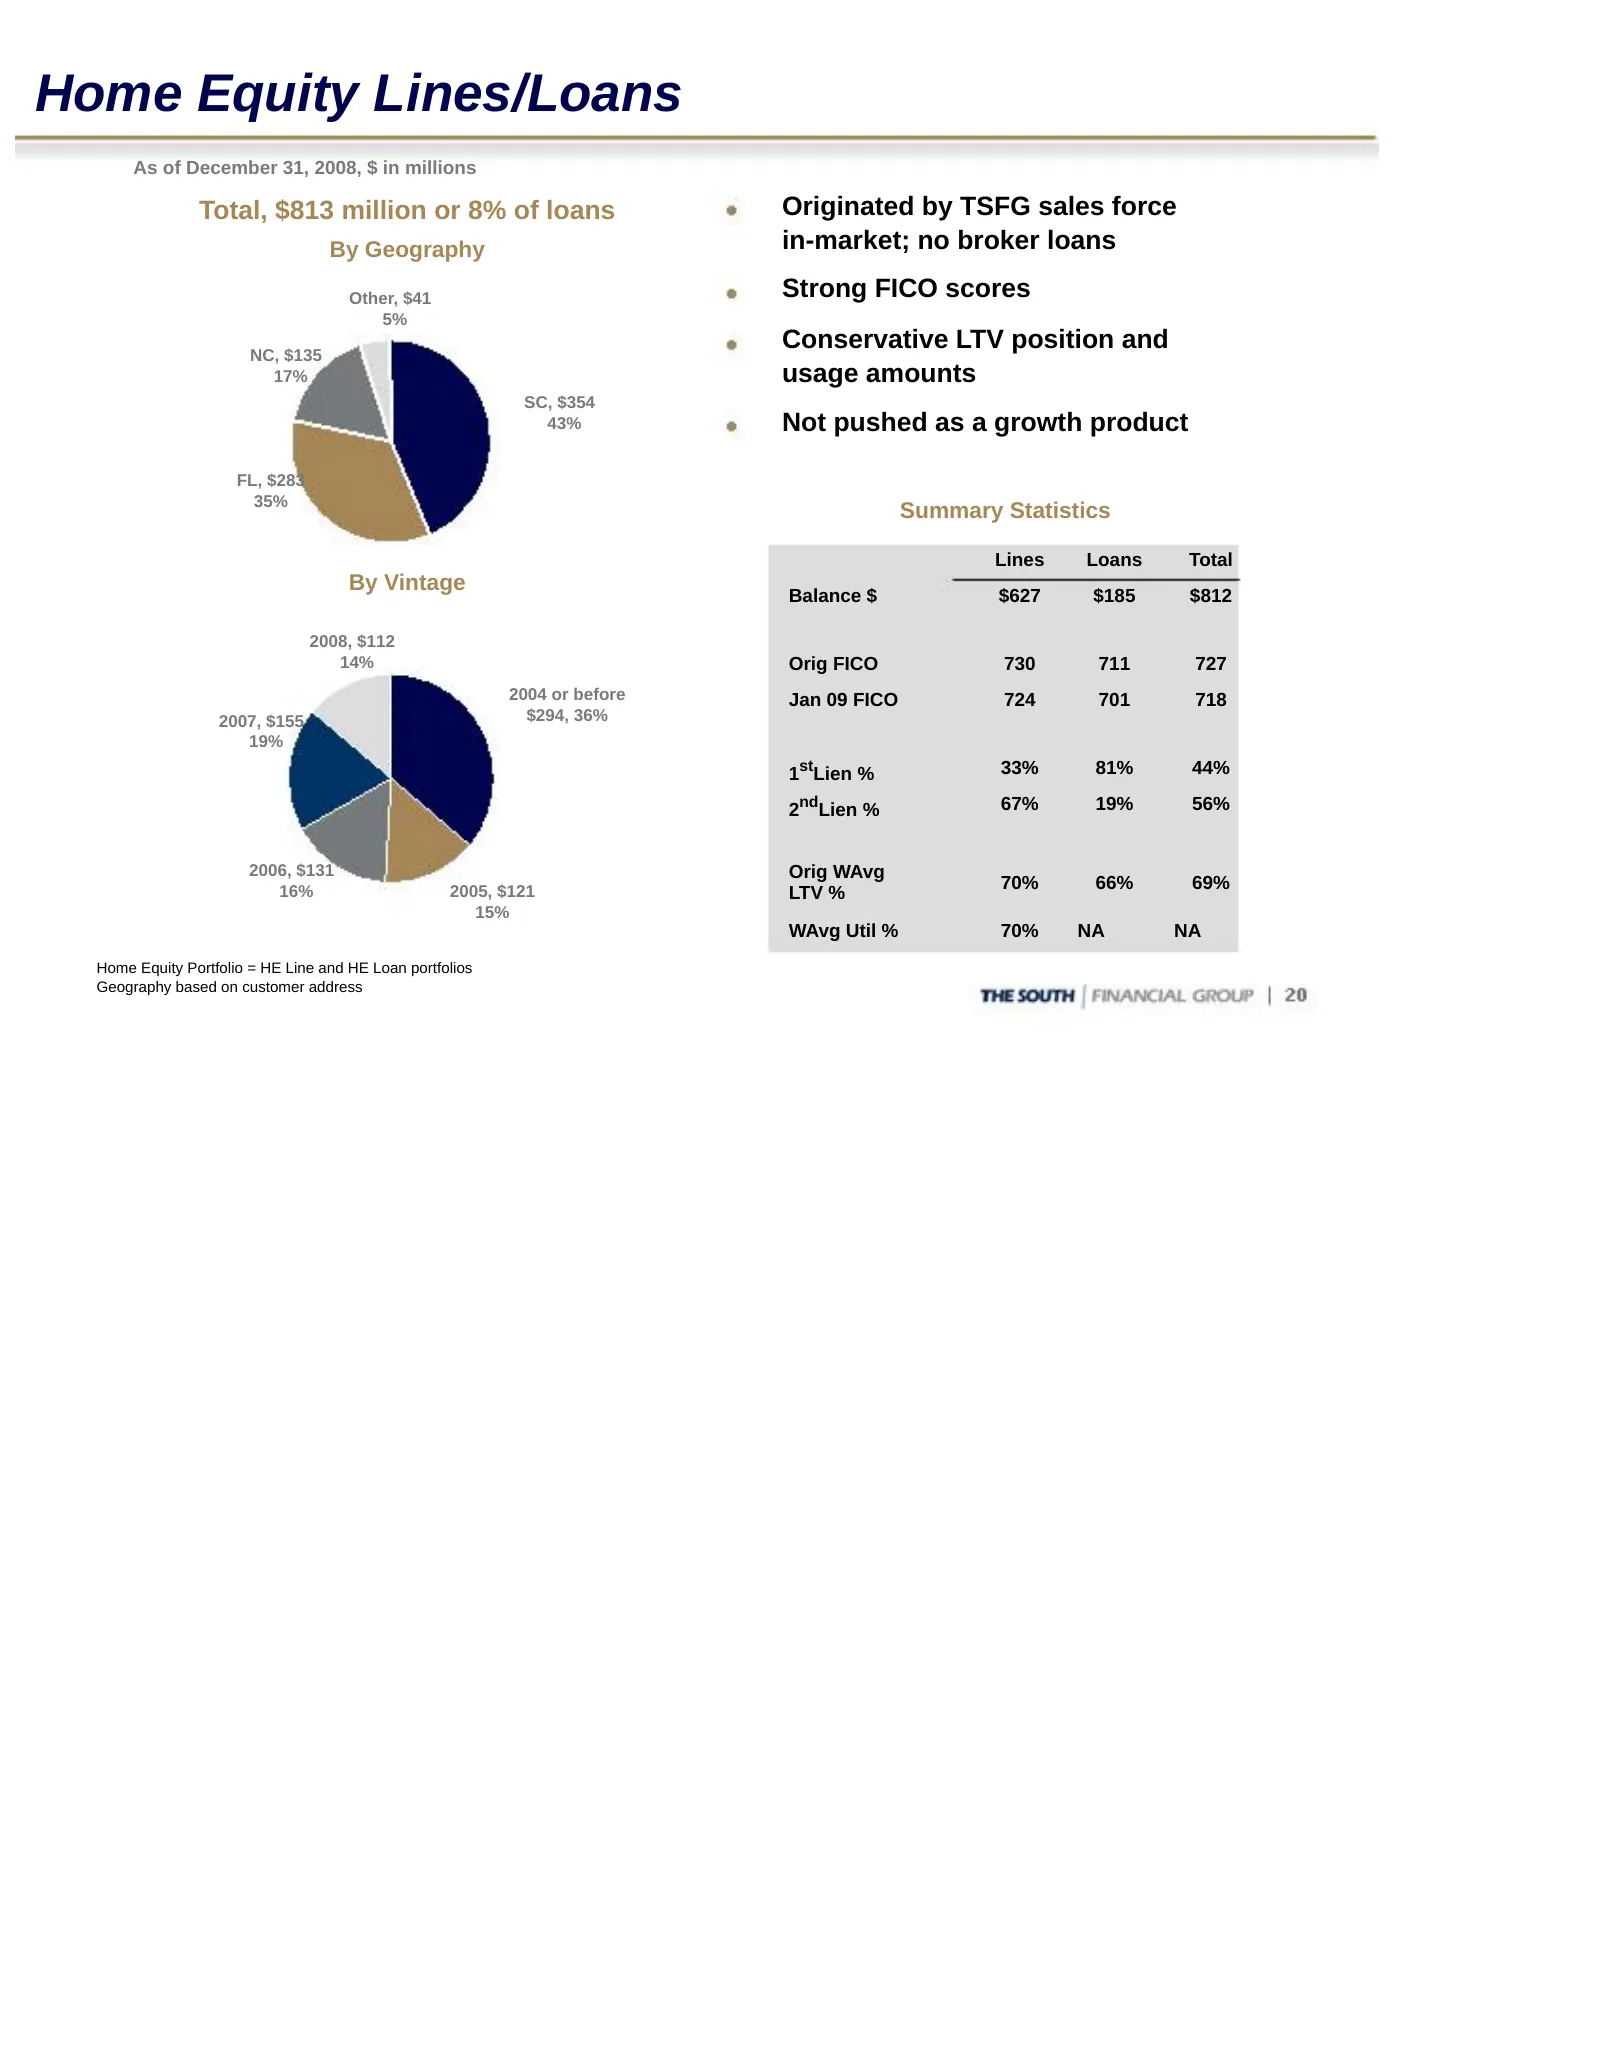
Home Equity Lines/Loans As of December 31, 2008, $ in millions Total, $813 million or 8% of loans Originated by TSFG sales force By Geography in-market; no broker loans Other, $41 Strong FICO scores 5% Conservative LTV position and NC, $135 17% usage amounts SC, $354 43% Not pushed as a growth produ
Slide 21: Mortgage Banking Portfolio
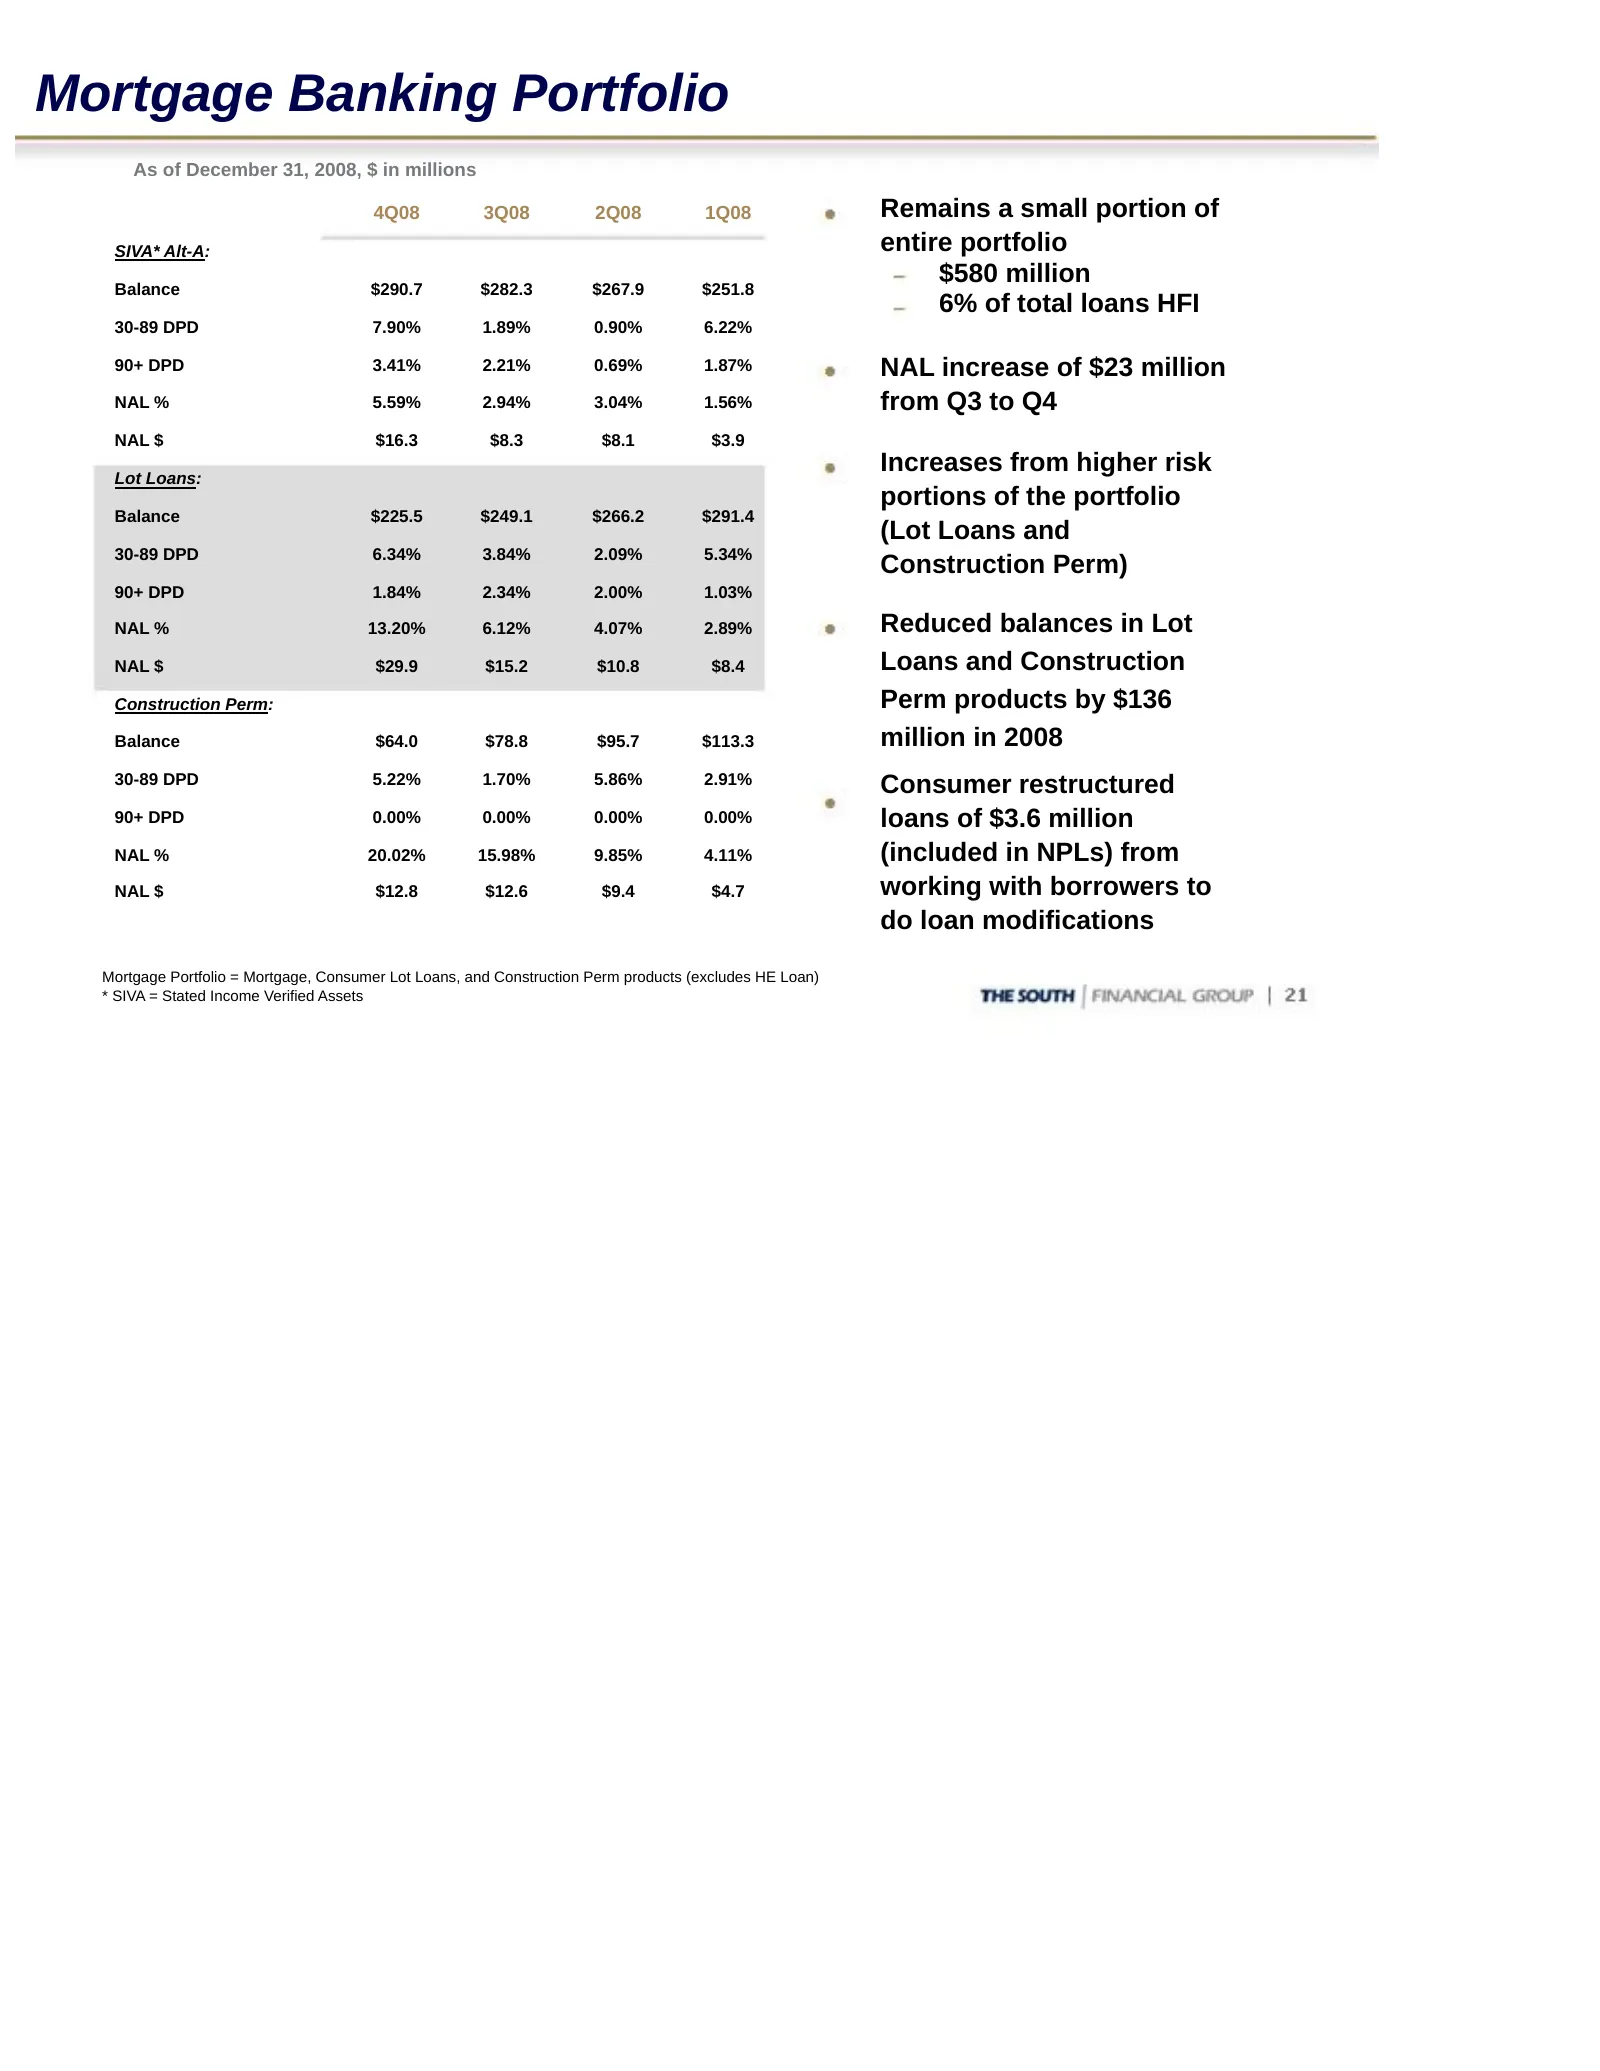
Mortgage Banking Portfolio As of December 31, 2008, $ in millions 4Q08 3Q08 2Q08 1Q08 Remains a small portion of SIVA* Alt-A: entire portfolio $580 million Balance $290.7 $282.3 $267.9 $251.8 6% of total loans HFI 30-89 DPD 7.90% 1.89% 0.90% 6.22% 90+ DPD 3.41% 2.21% 0.69% 1.87% NAL increase of $23
Slide 22: Net Interest Margin
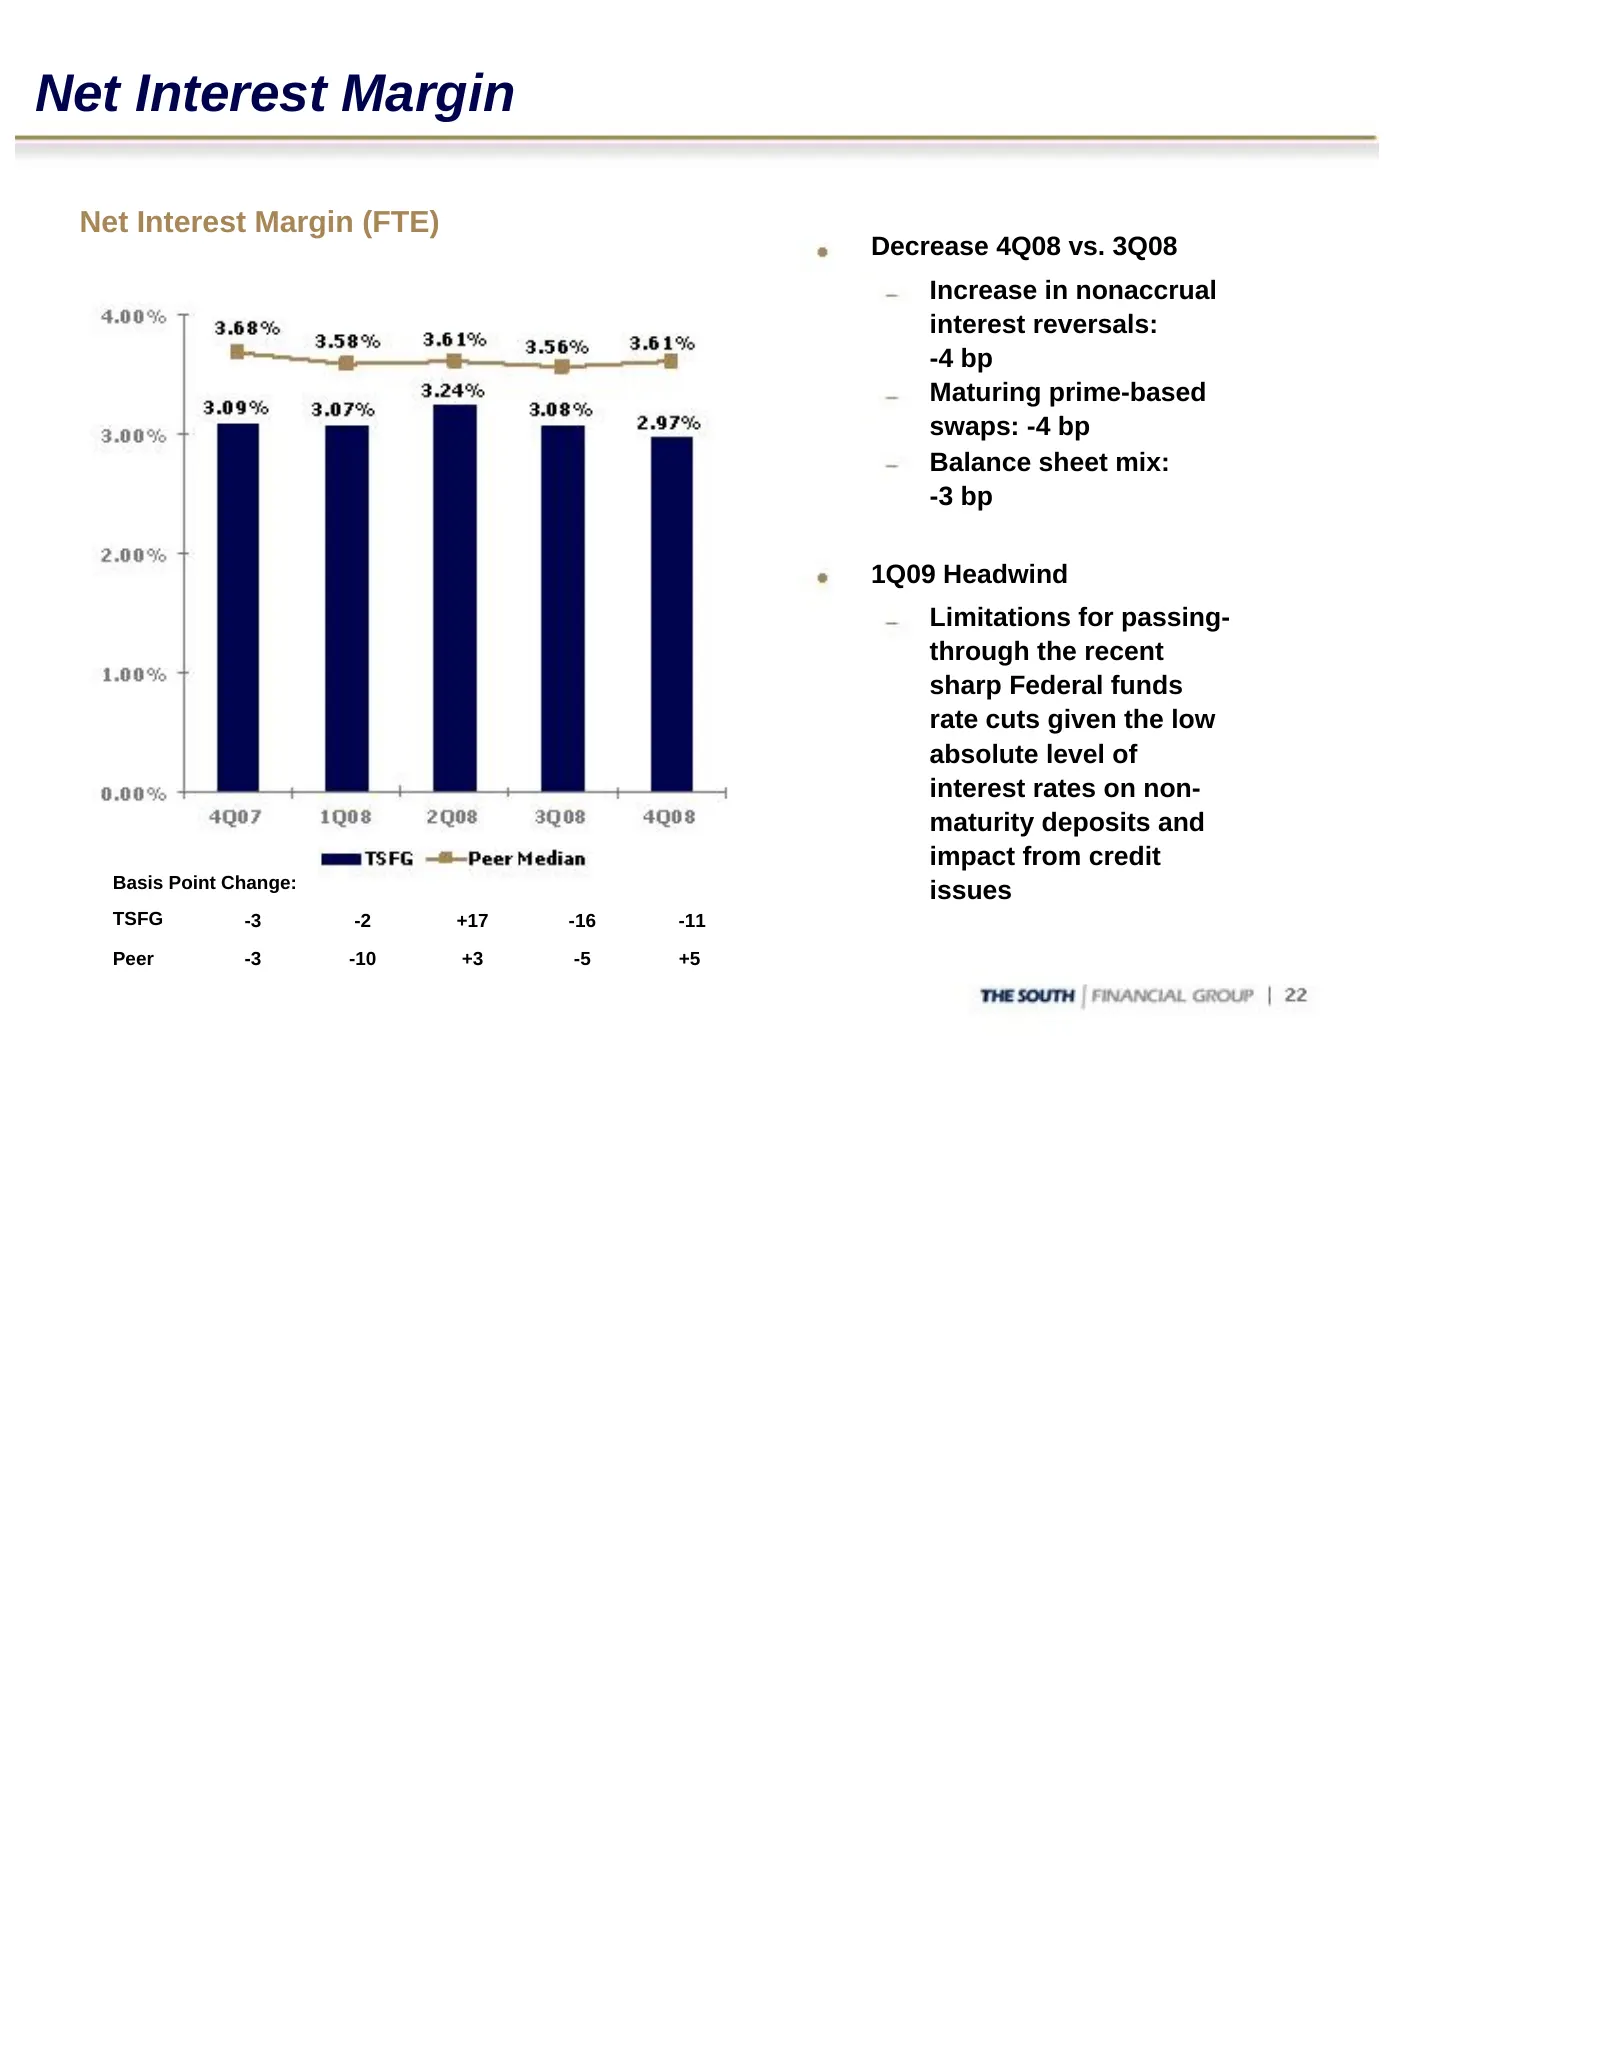
Net Interest Margin Net Interest Margin (FTE) Decrease 4Q08 vs. 3Q08 Increase in nonaccrual interest reversals: -4 bp Maturing prime-based swaps: -4 bp Balance sheet mix: -3 bp 1Q09 Headwind Limitations for passing- through the recent sharp Federal funds rate cuts given the low absolute level of int
Slide 23: Customer Funding
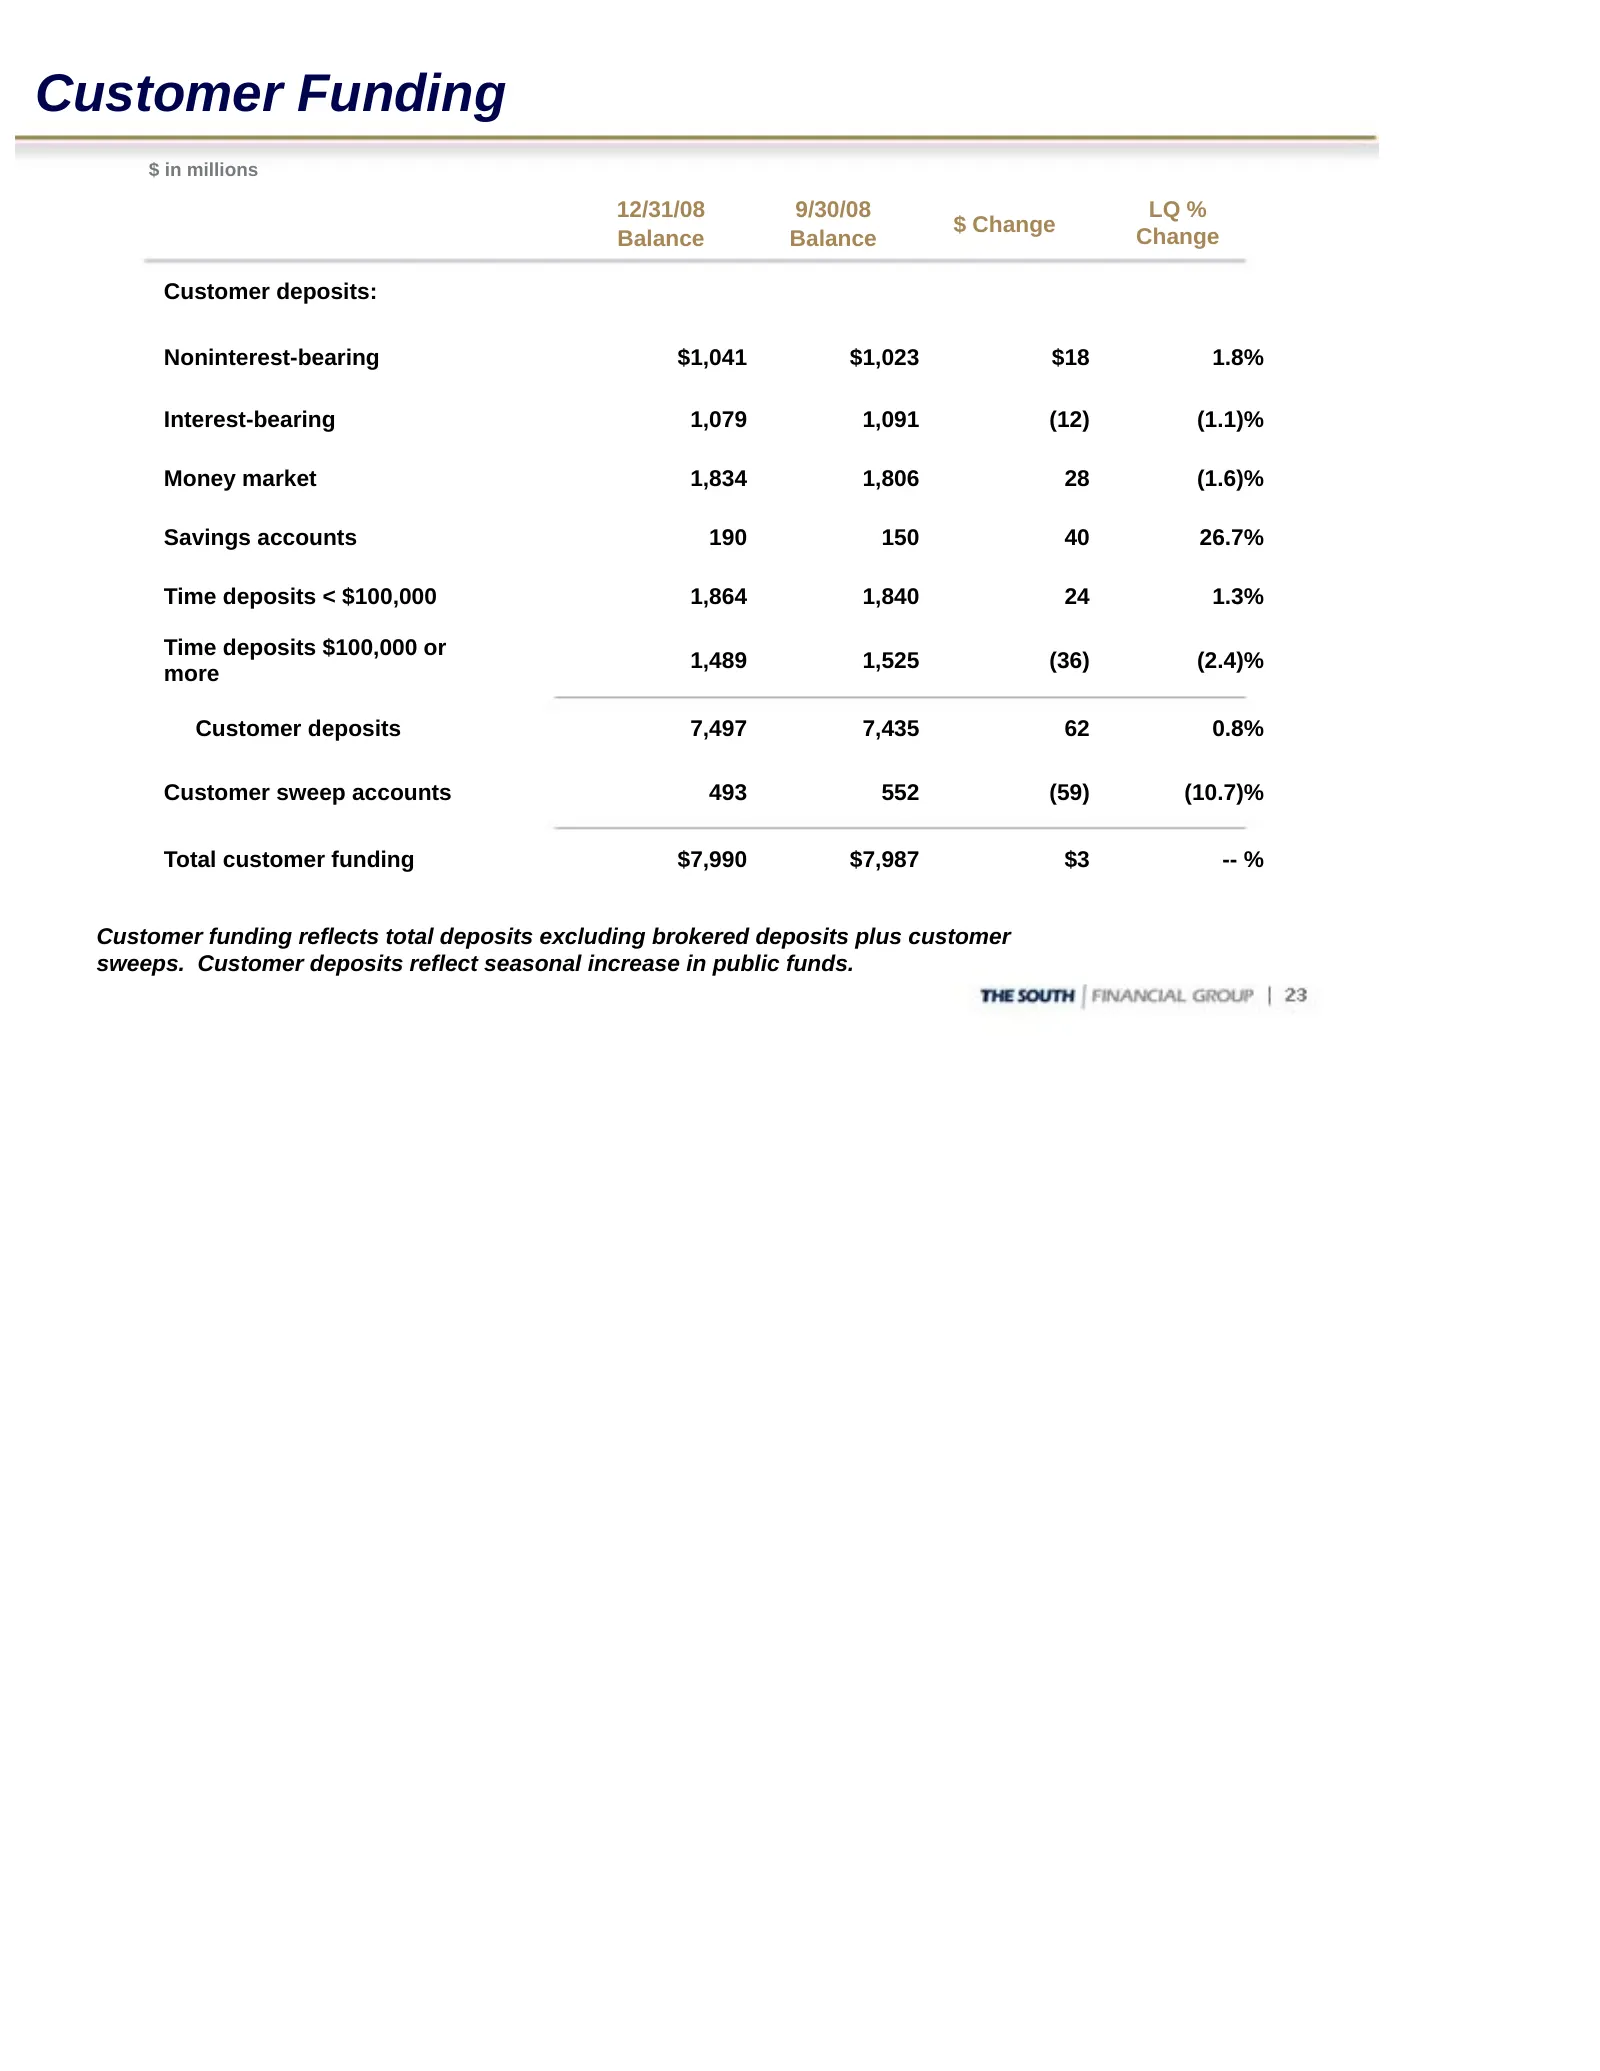
Customer Funding $ in millions 12/31/08 9/30/08 LQ % $ Change Balance Balance Change Customer deposits: Noninterest-bearing $1,041 $1,023 $18 1.8% Interest-bearing 1,079 1,091 (12) (1.1)% Money market 1,834 1,806 28 (1.6)% Savings accounts 190 150 40 26.7% Time deposits < $100,000 1,864 1,840 24 1.3
Slide 24: Wholesale Borrowings
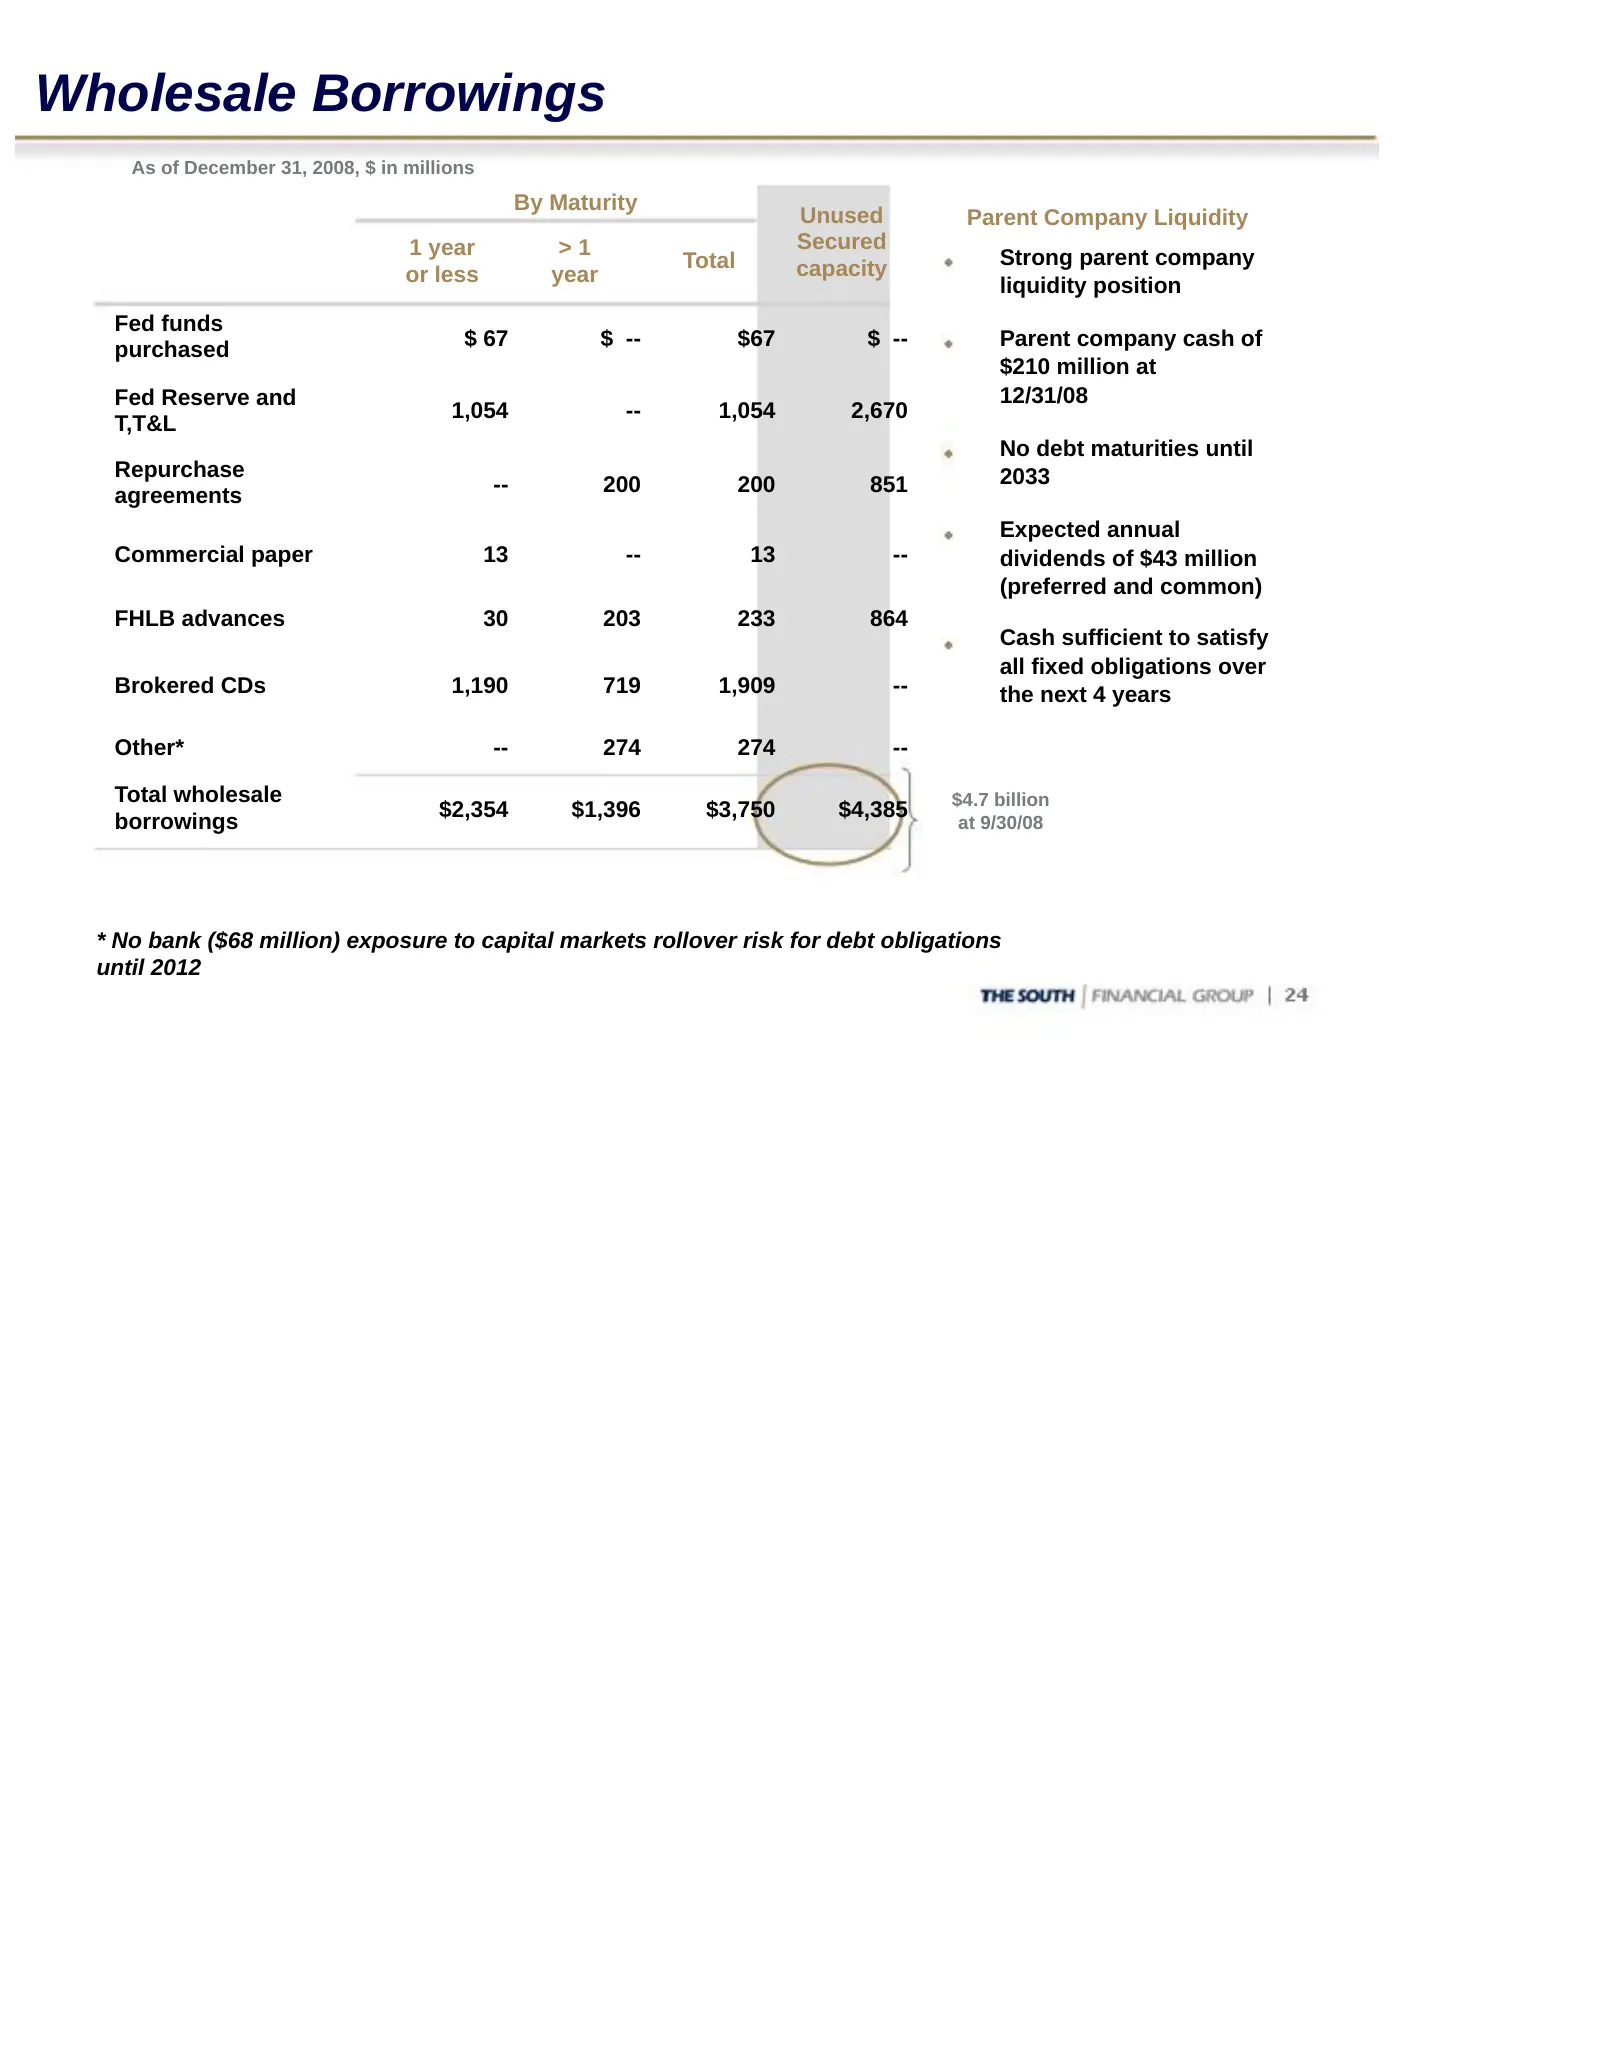
Wholesale Borrowings As of December 31, 2008, $ in millions By Maturity Unused Parent Company Liquidity 1 year >1 Secured Total Strong parent company or less year capacity liquidity position Fed funds $ 67 $ -- $67 $ -- Parent company cash of purchased $210 million at Fed Reserve and 12/31/08 1,054
Slide 25: Capital Position
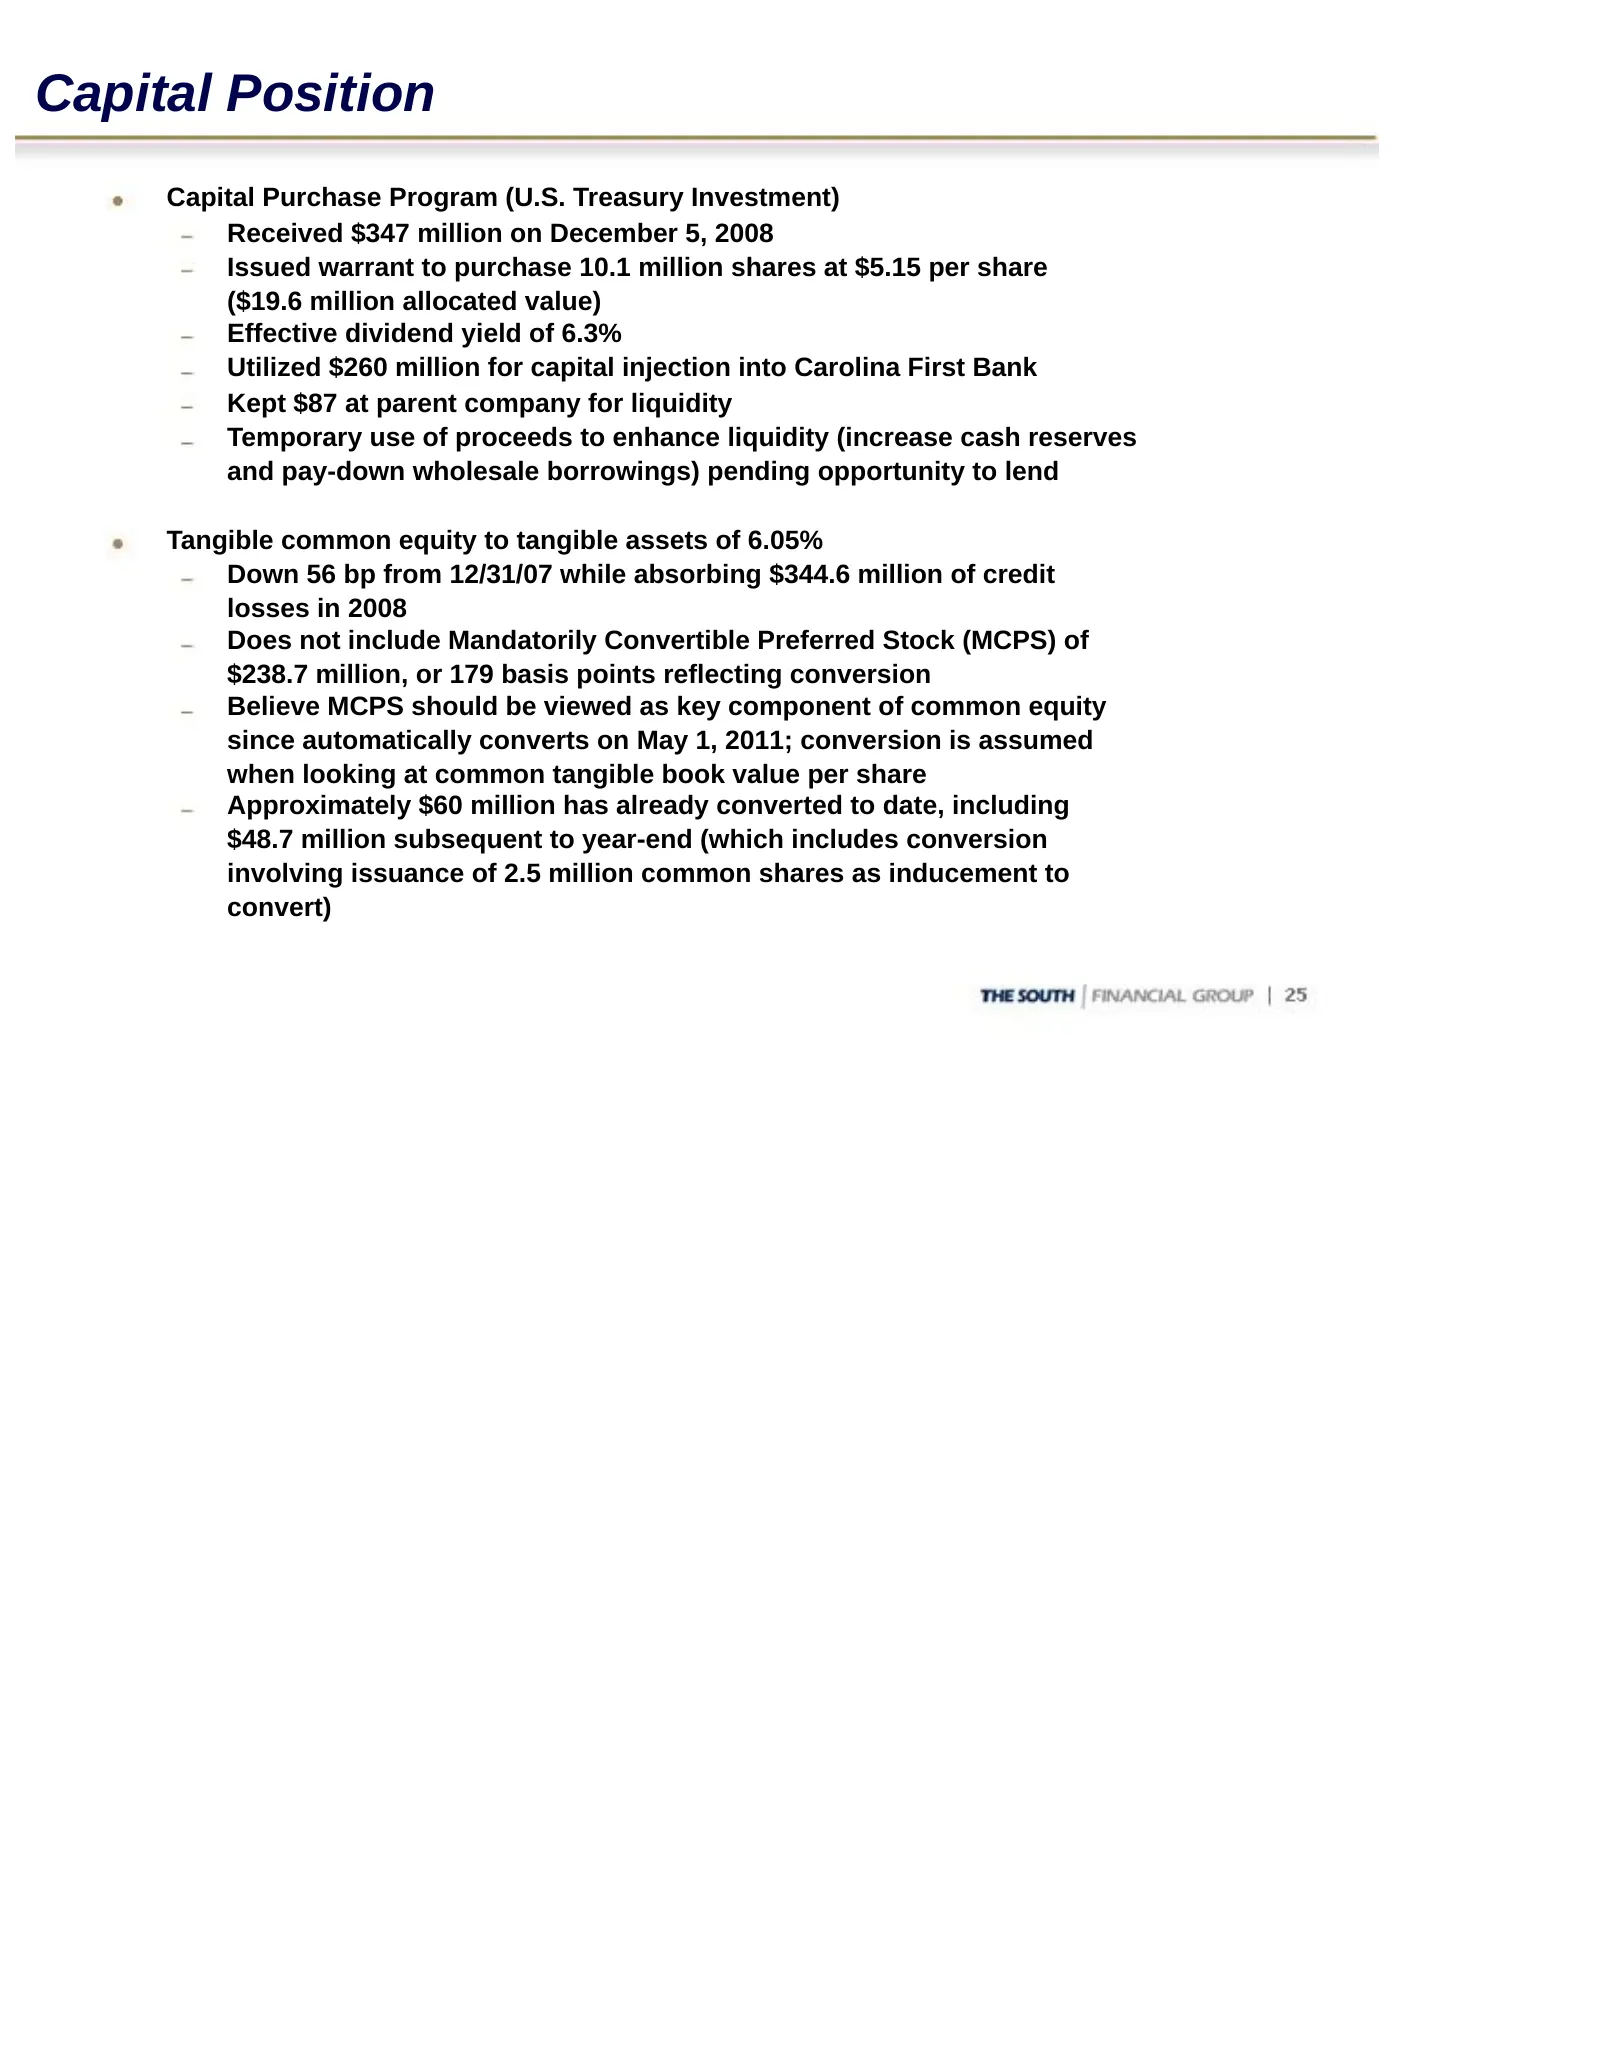
Capital Position Capital Purchase Program (U.S. Treasury Investment) Received $347 million on December 5, 2008 Issued warrant to purchase 10.1 million shares at $5.15 per share ($19.6 million allocated value) Effective dividend yield of 6.3% Utilized $260 million for capital injection into Carolina
Slide 26: Capital Position
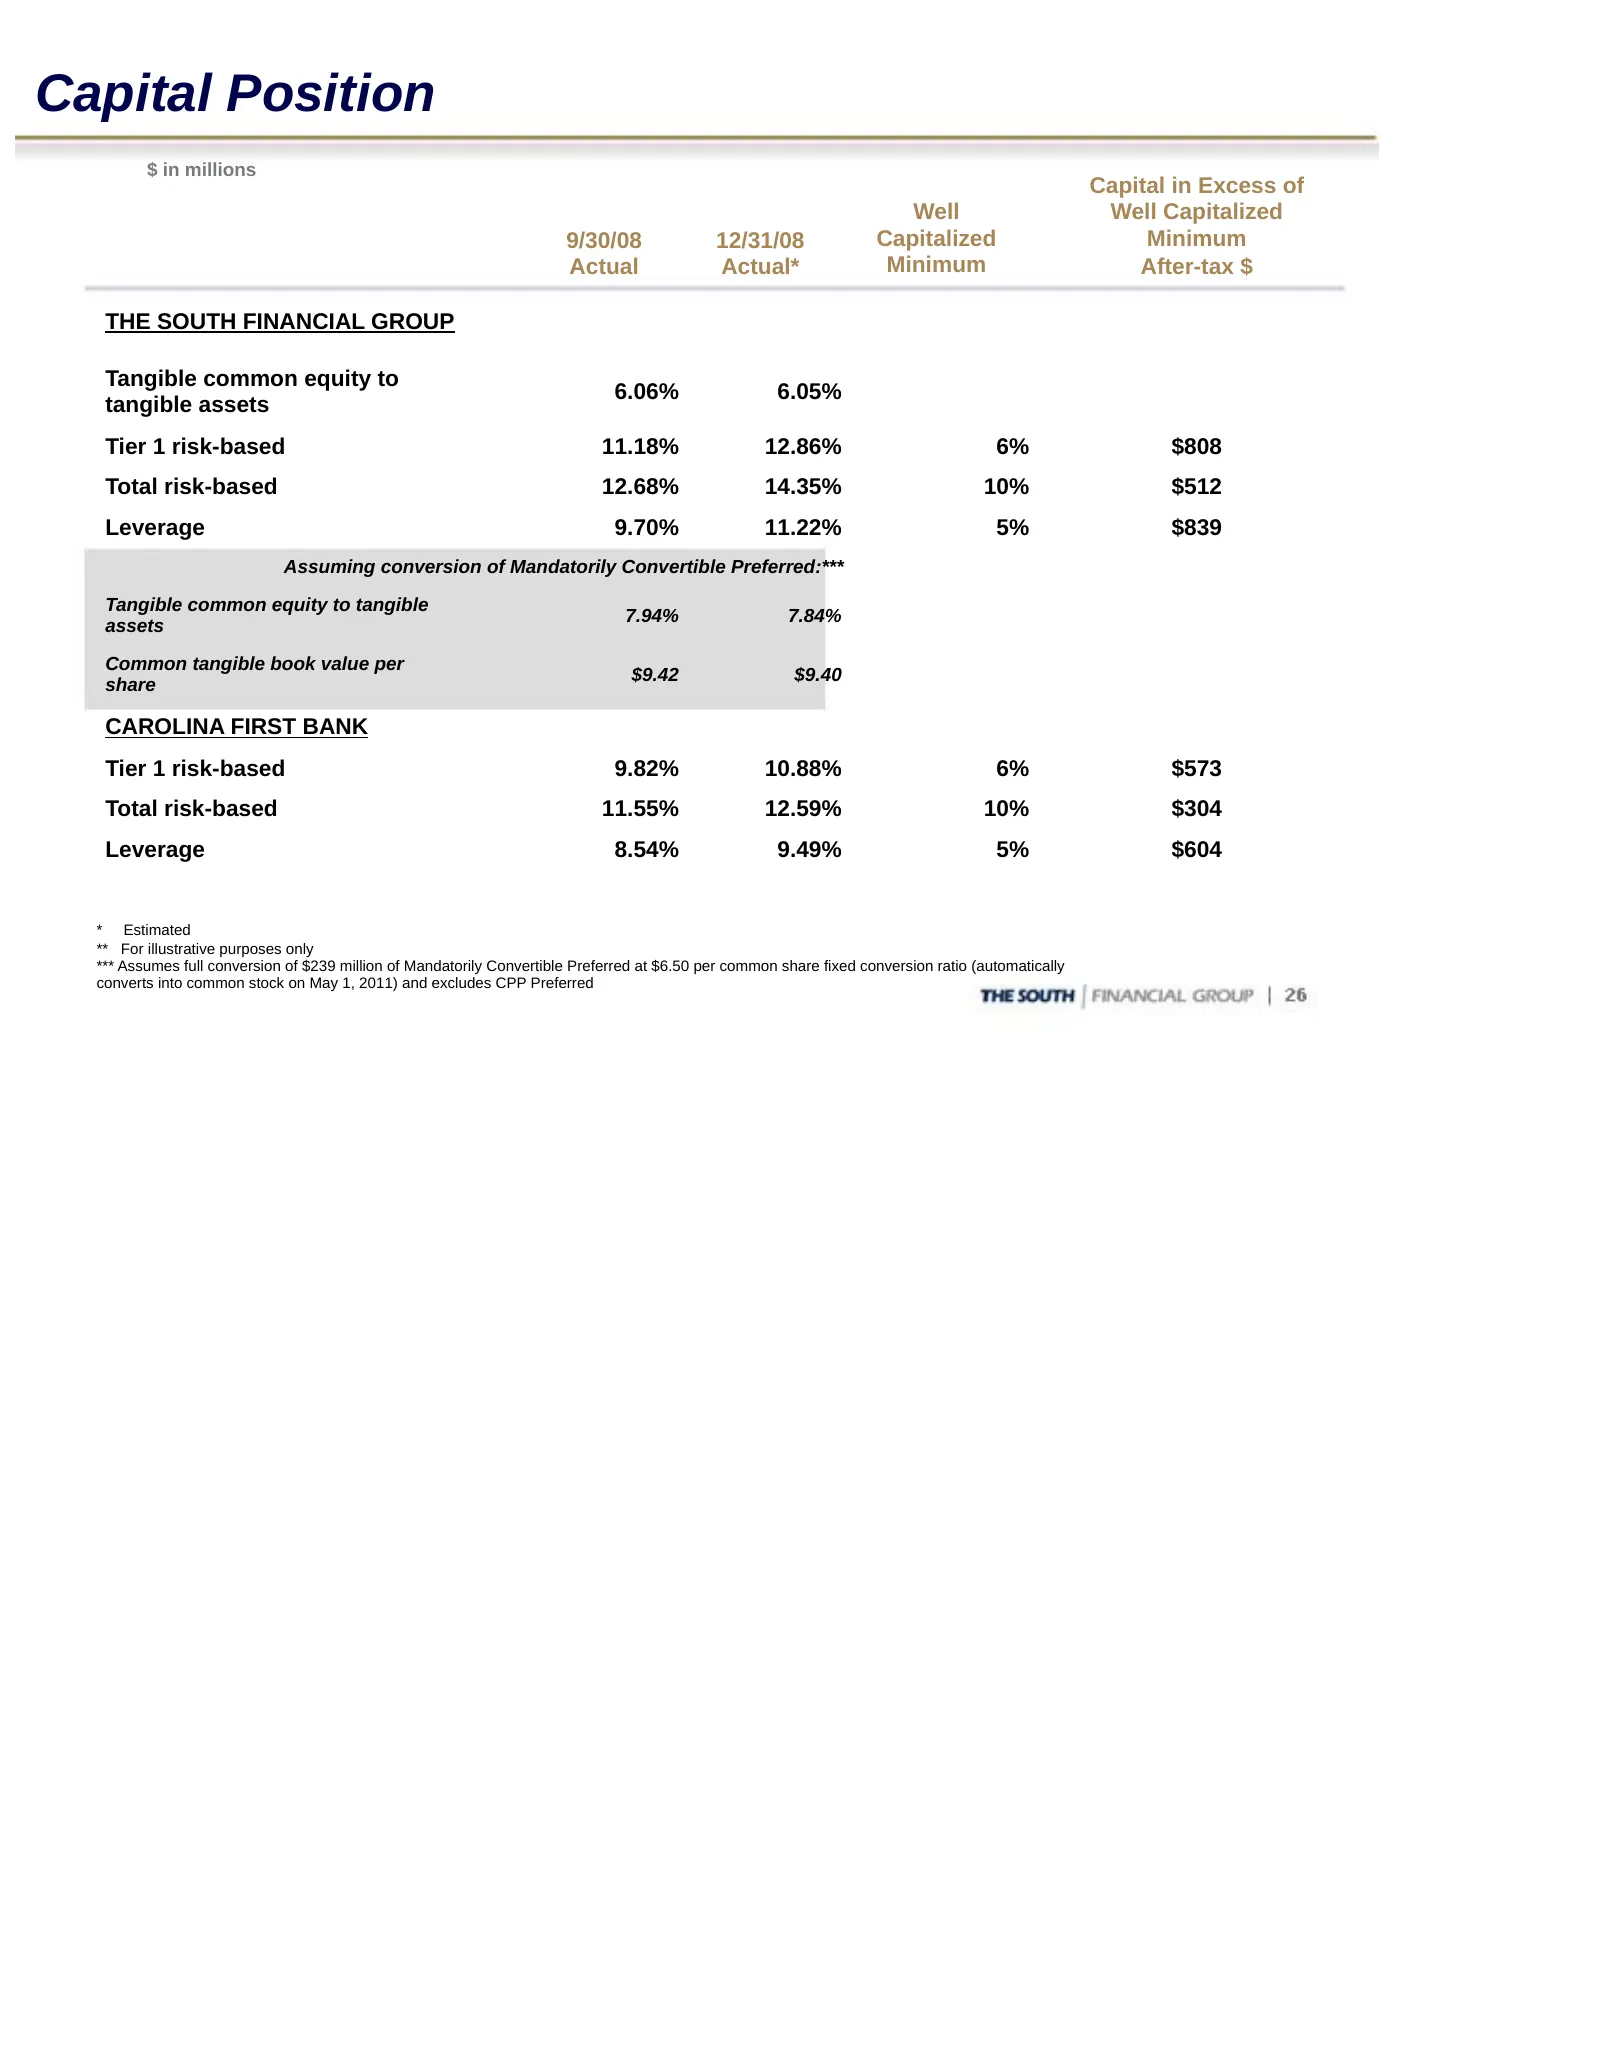
Capital Position $ in millions Capital in Excess of Well Well Capitalized 9/30/08 12/31/08 Capitalized Minimum Actual Actual* Minimum After-tax $ THE SOUTH FINANCIAL GROUP Tangible common equity to 6.06% 6.05% tangible assets Tier 1 risk-based 11.18% 12.86% 6% $808 Total risk-based 12.68% 14.35% 10%
Slide 27: Noninterest Expenses
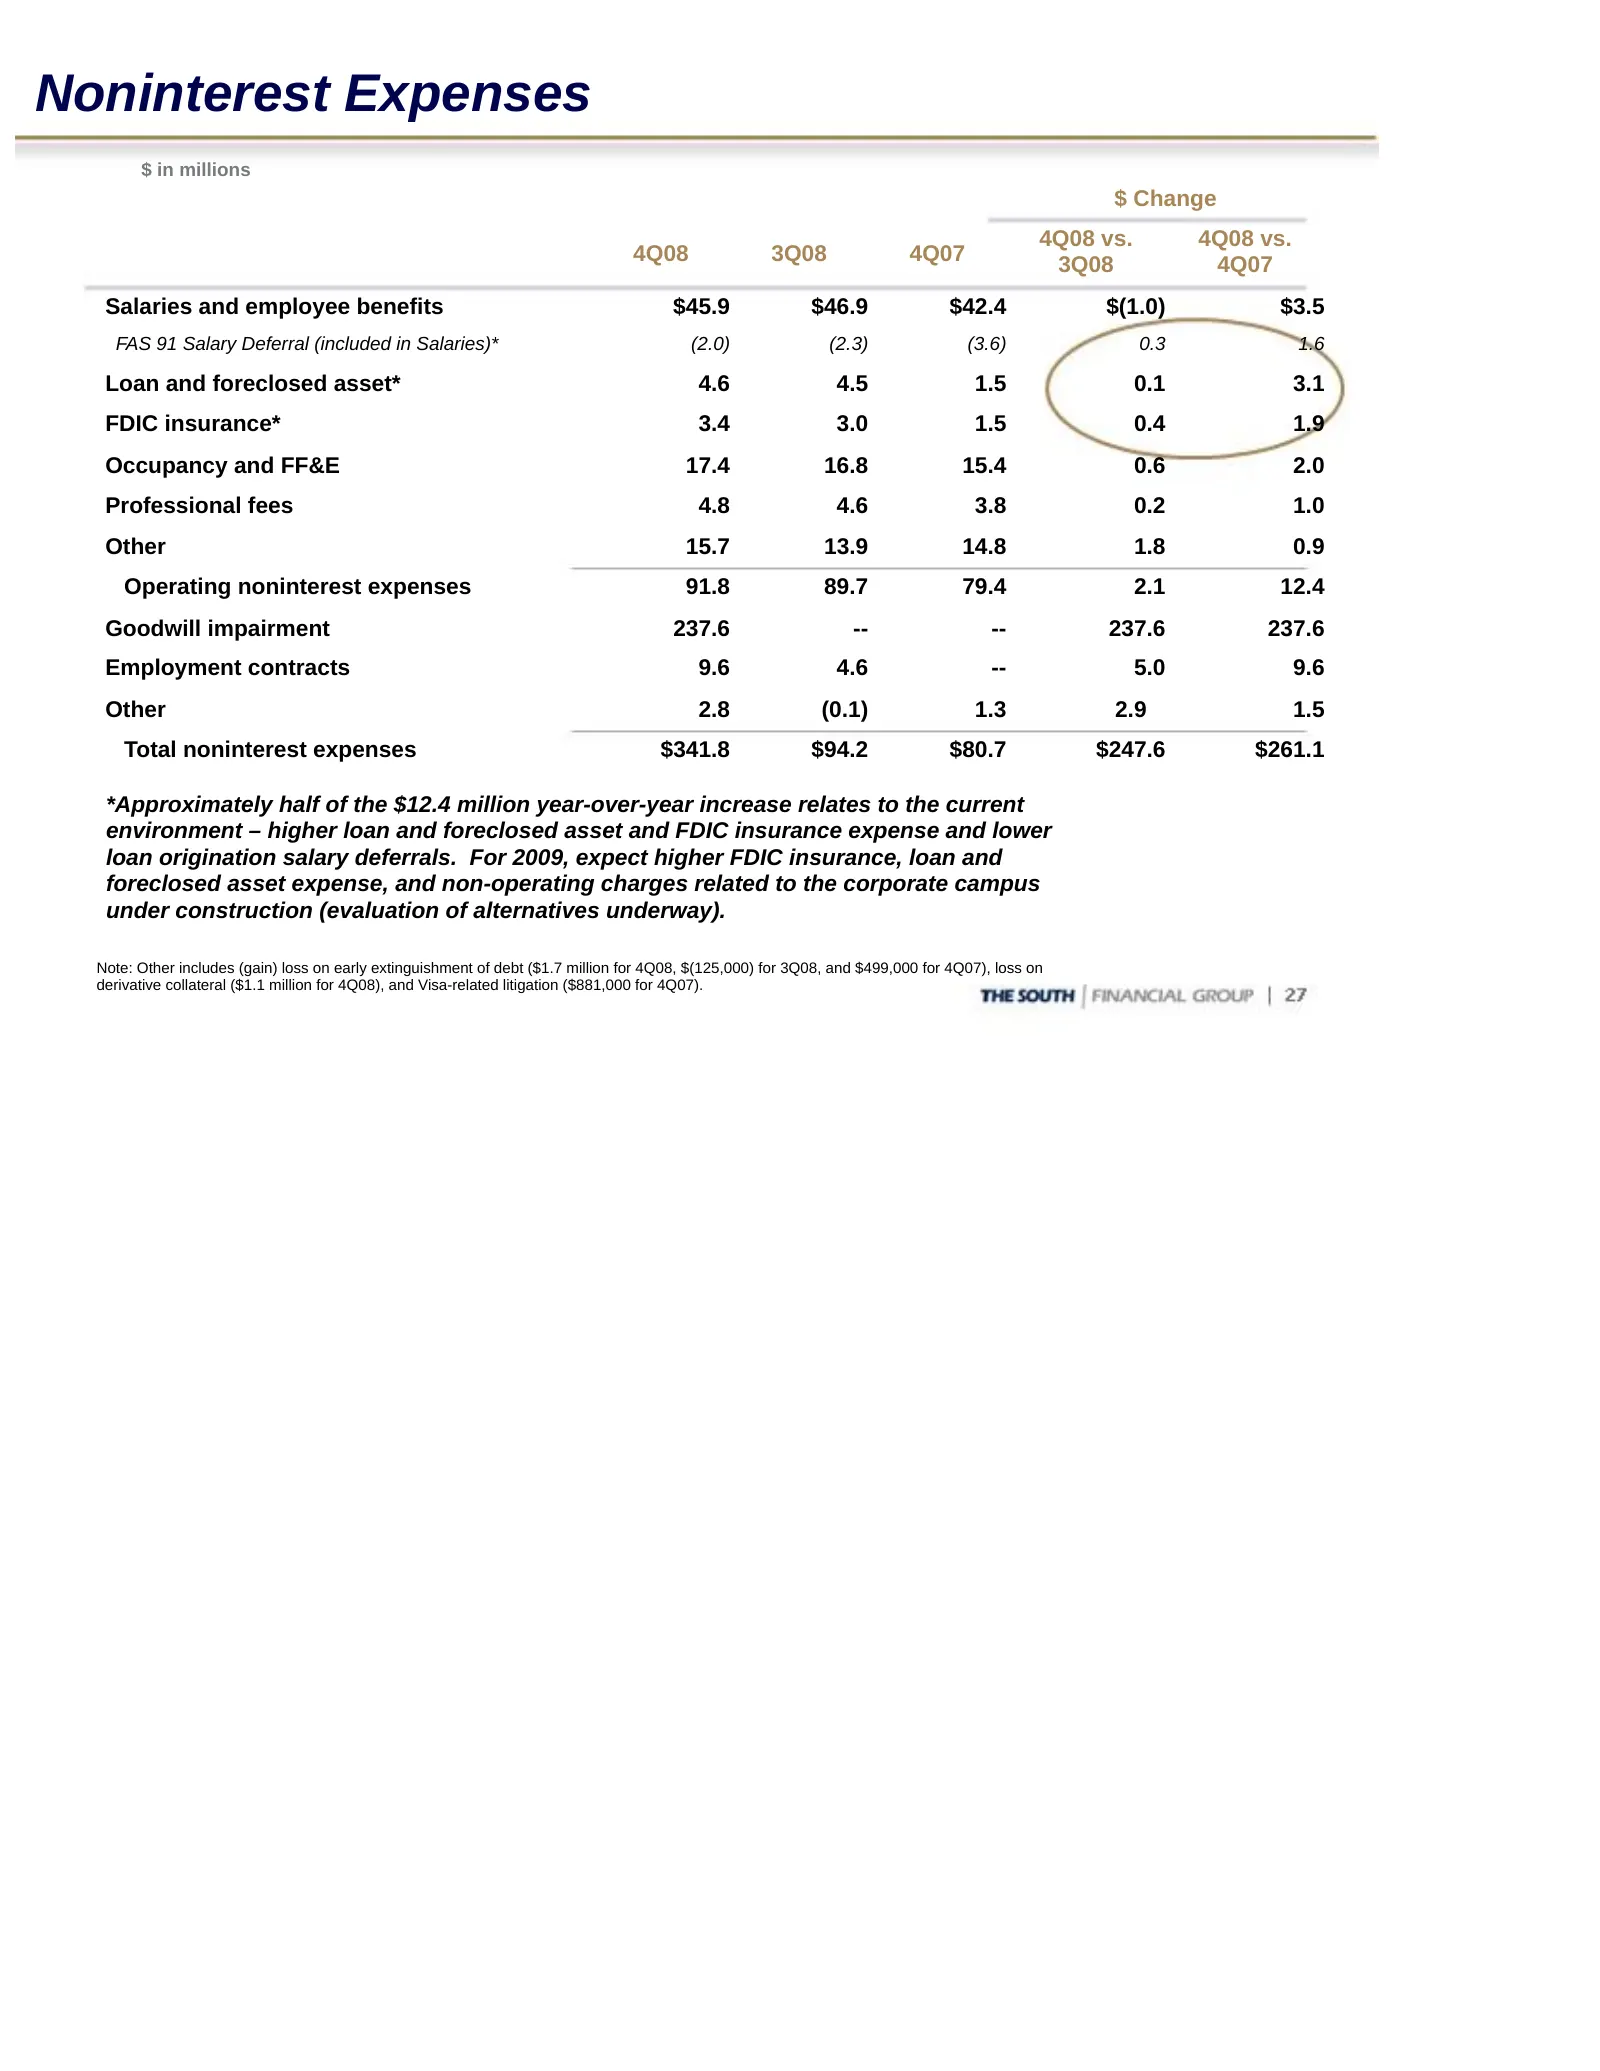
Noninterest Expenses $ in millions $ Change 4Q08 vs. 4Q08 vs. 4Q08 3Q08 4Q07 3Q08 4Q07 Salaries and employee benefits $45.9 $46.9 $42.4 $(1.0) $3.5 FAS 91 Salary Deferral (included in Salaries)* (2.0) (2.3) (3.6) 0.3 1.6 Loan and foreclosed asset* 4.6 4.5 1.5 0.1 3.1 FDIC insurance* 3.4 3.0 1.5 0.4
Slide 28: Noninterest Income
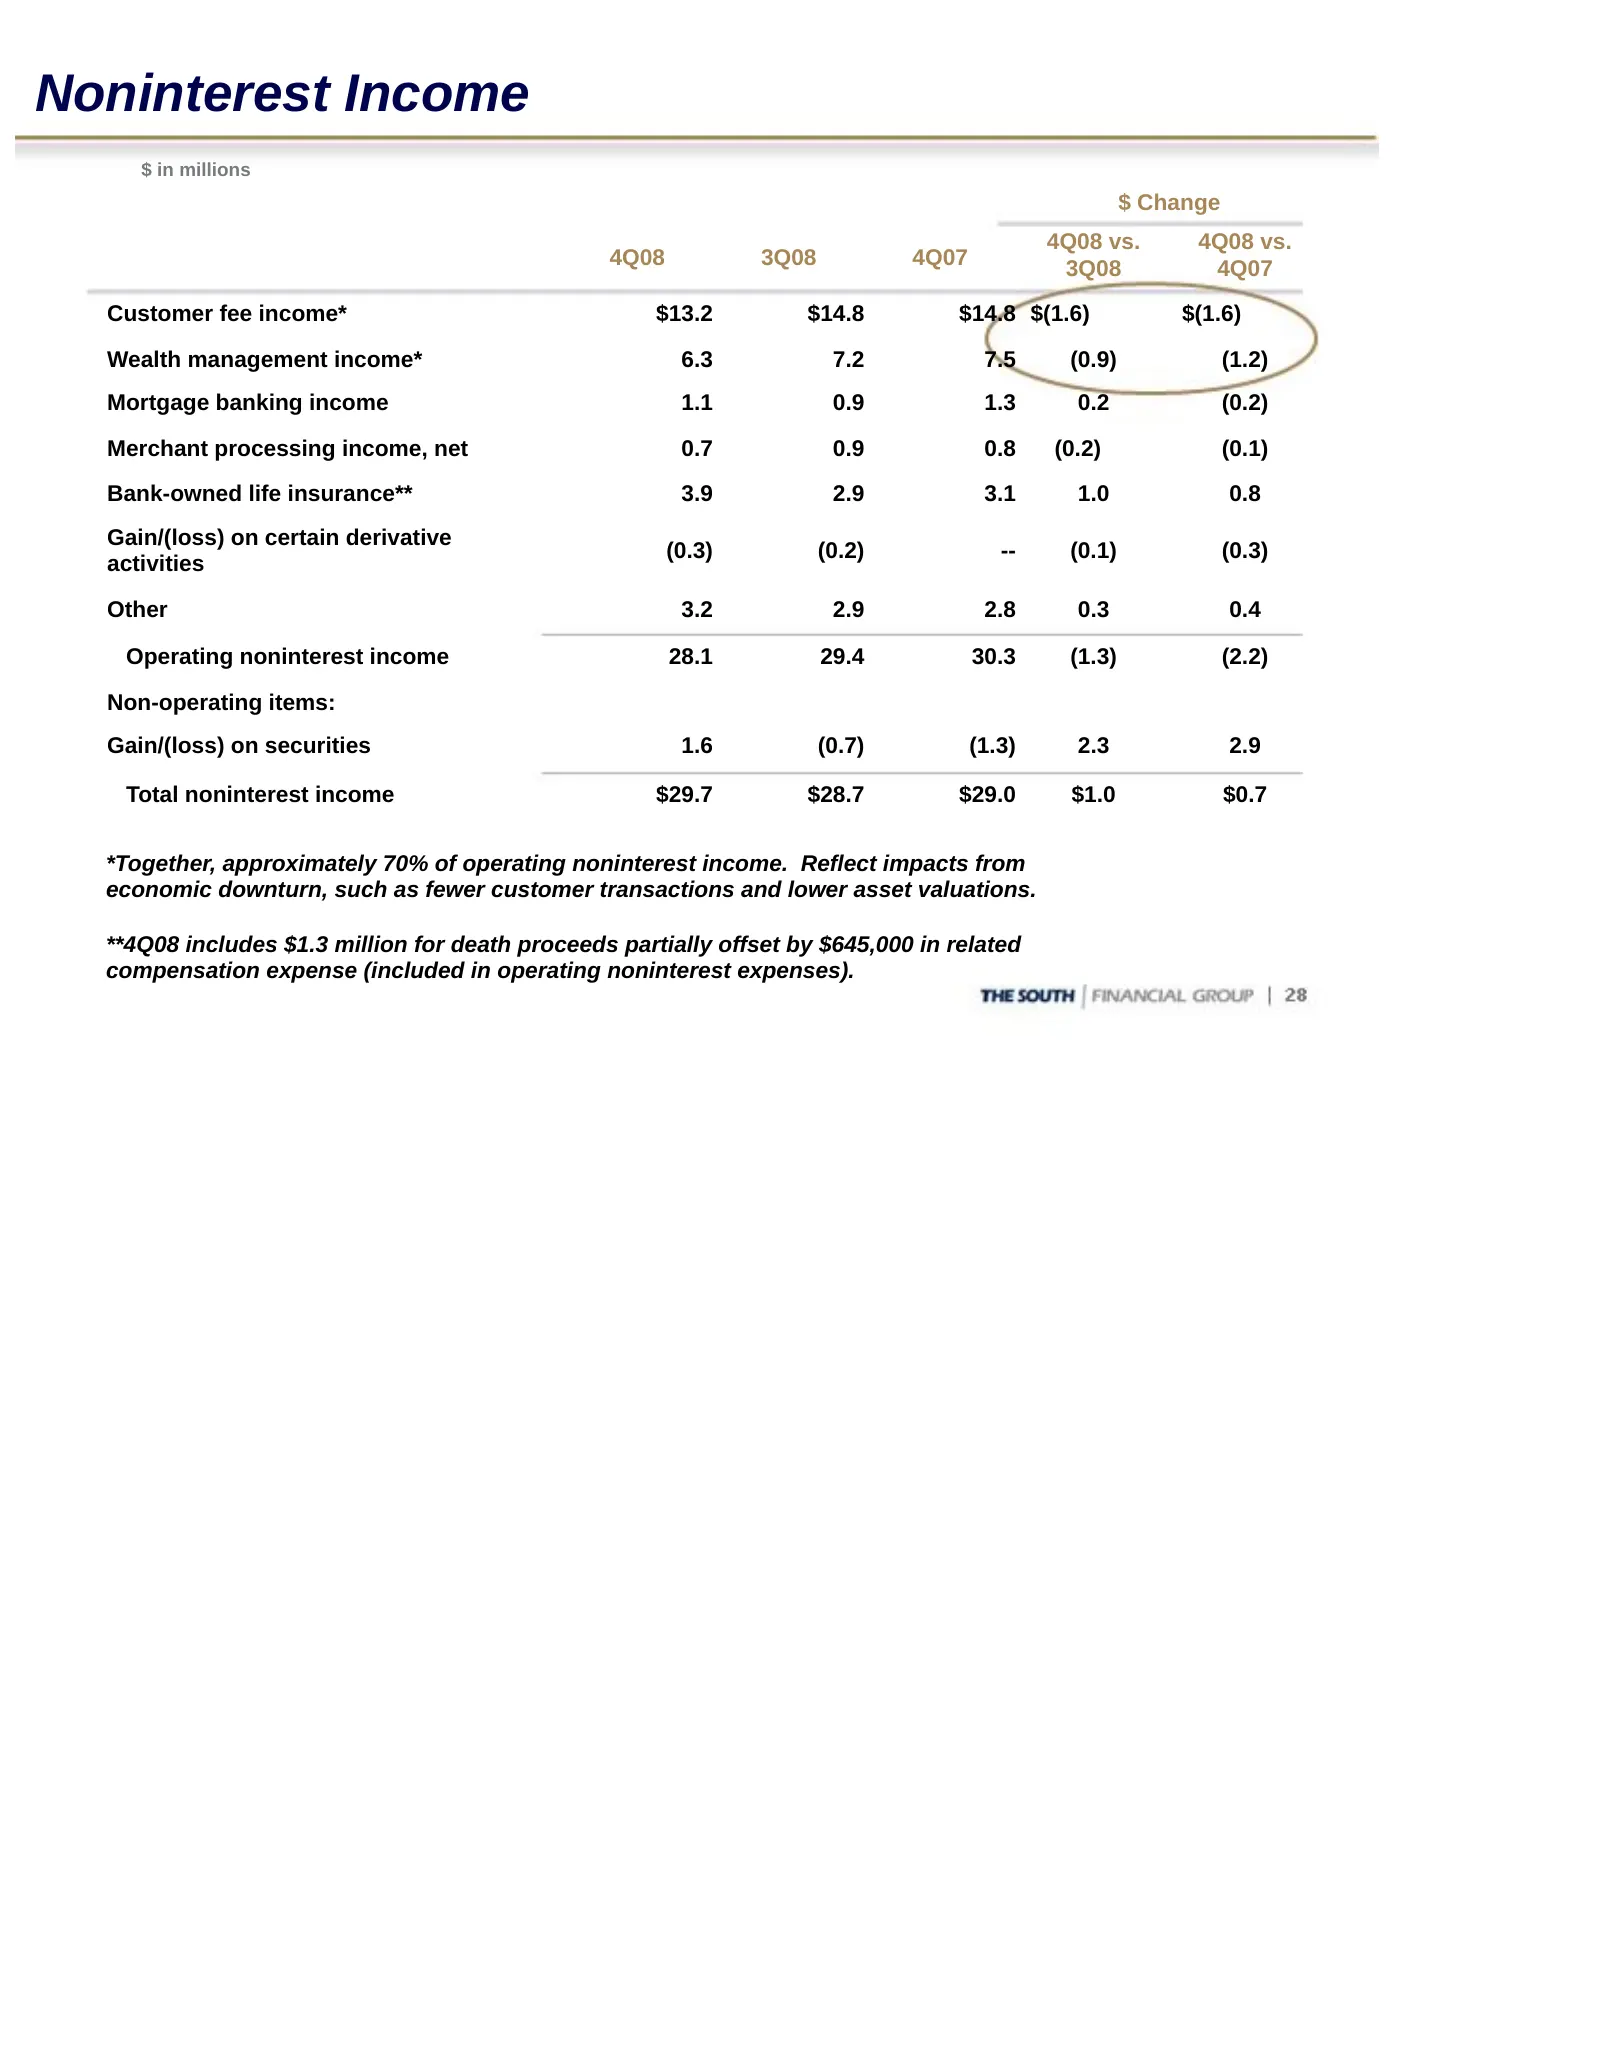
Noninterest Income $ in millions $ Change 4Q08 vs. 4Q08 vs. 4Q08 3Q08 4Q07 3Q08 4Q07 Customer fee income* $13.2 $14.8 $14.8 $(1.6) $(1.6) Wealth management income* 6.3 7.2 7.5 (0.9) (1.2) Mortgage banking income 1.1 0.9 1.3 0.2 (0.2) Merchant processing income, net 0.7 0.9 0.8 (0.2) (0.1) Bank-owned
Slide 29: Expectations for 2009
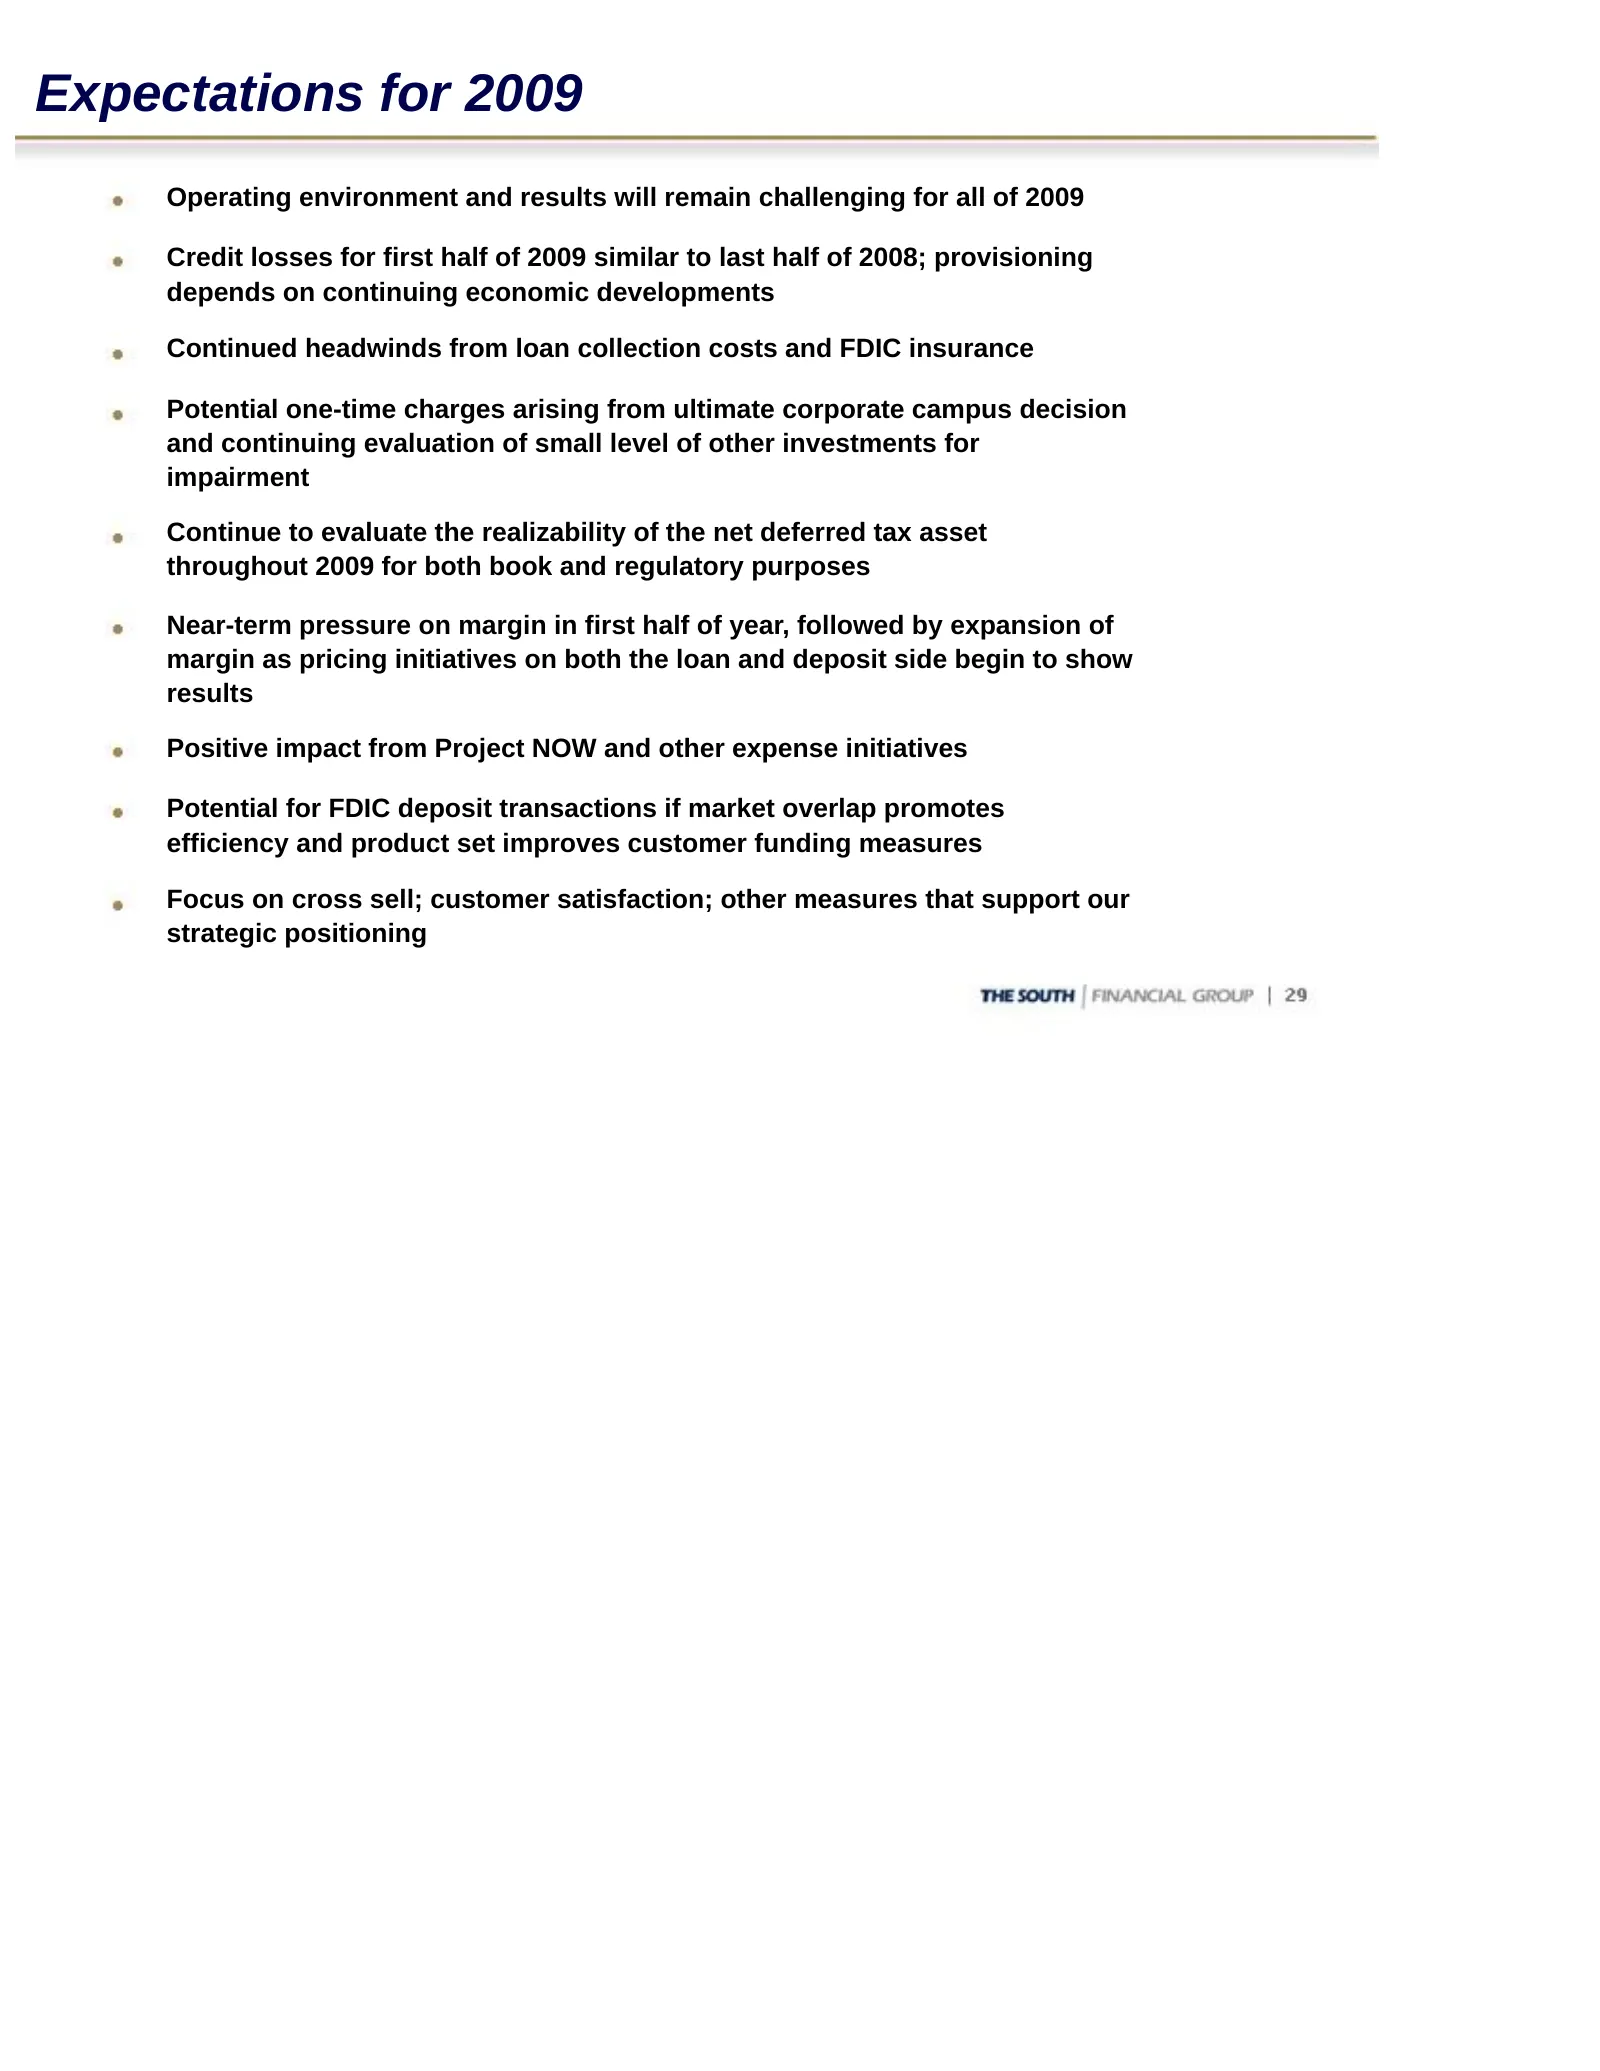
Expectations for 2009 Operating environment and results will remain challenging for all of 2009 Credit losses for first half of 2009 similar to last half of 2008; provisioning depends on continuing economic developments Continued headwinds from loan collection costs and FDIC insurance Potential one-
Slide 30: Positioned to Emerge Stronger
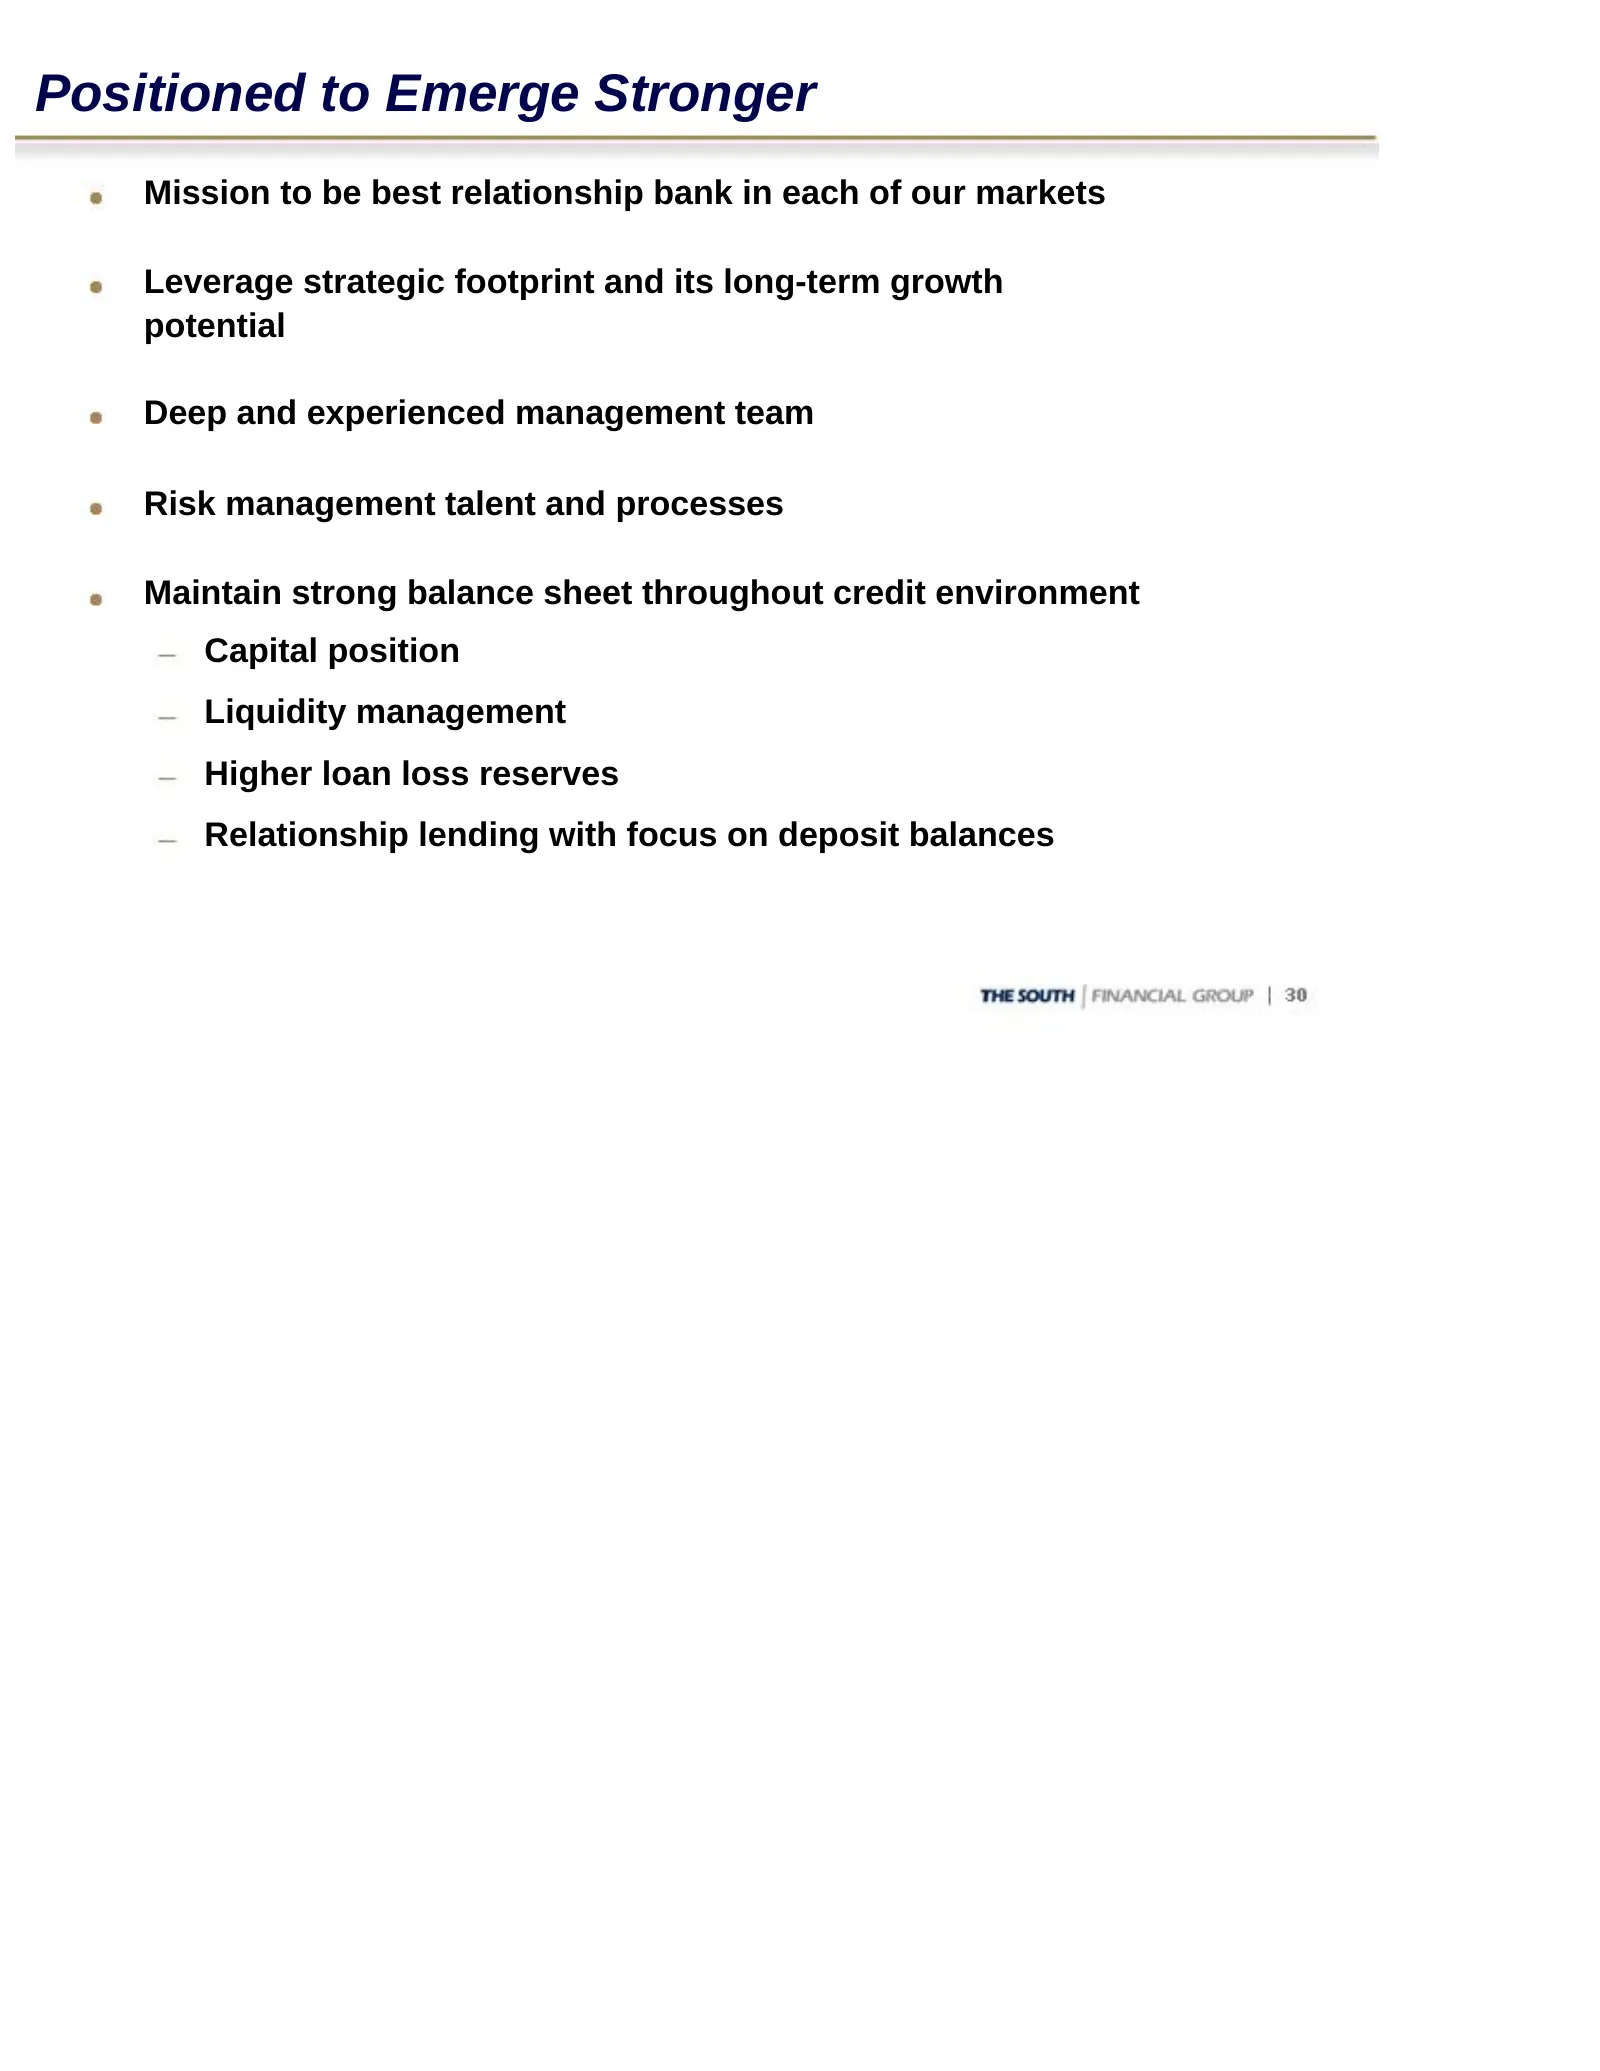
Positioned to Emerge Stronger Mission to be best relationship bank in each of our markets Leverage strategic footprint and its long-term growth potential Deep and experienced management team Risk management talent and processes Maintain strong balance sheet throughout credit environment Capital posi
Slide 31: Appendix
va “is ans, eT ee MS. rq —\ \Y "i —_— 4 5 . To | THE SOUTH mi FINANCIAL |GROUP APPENDIX
Slide 32: Appendix – List of Operating Peers
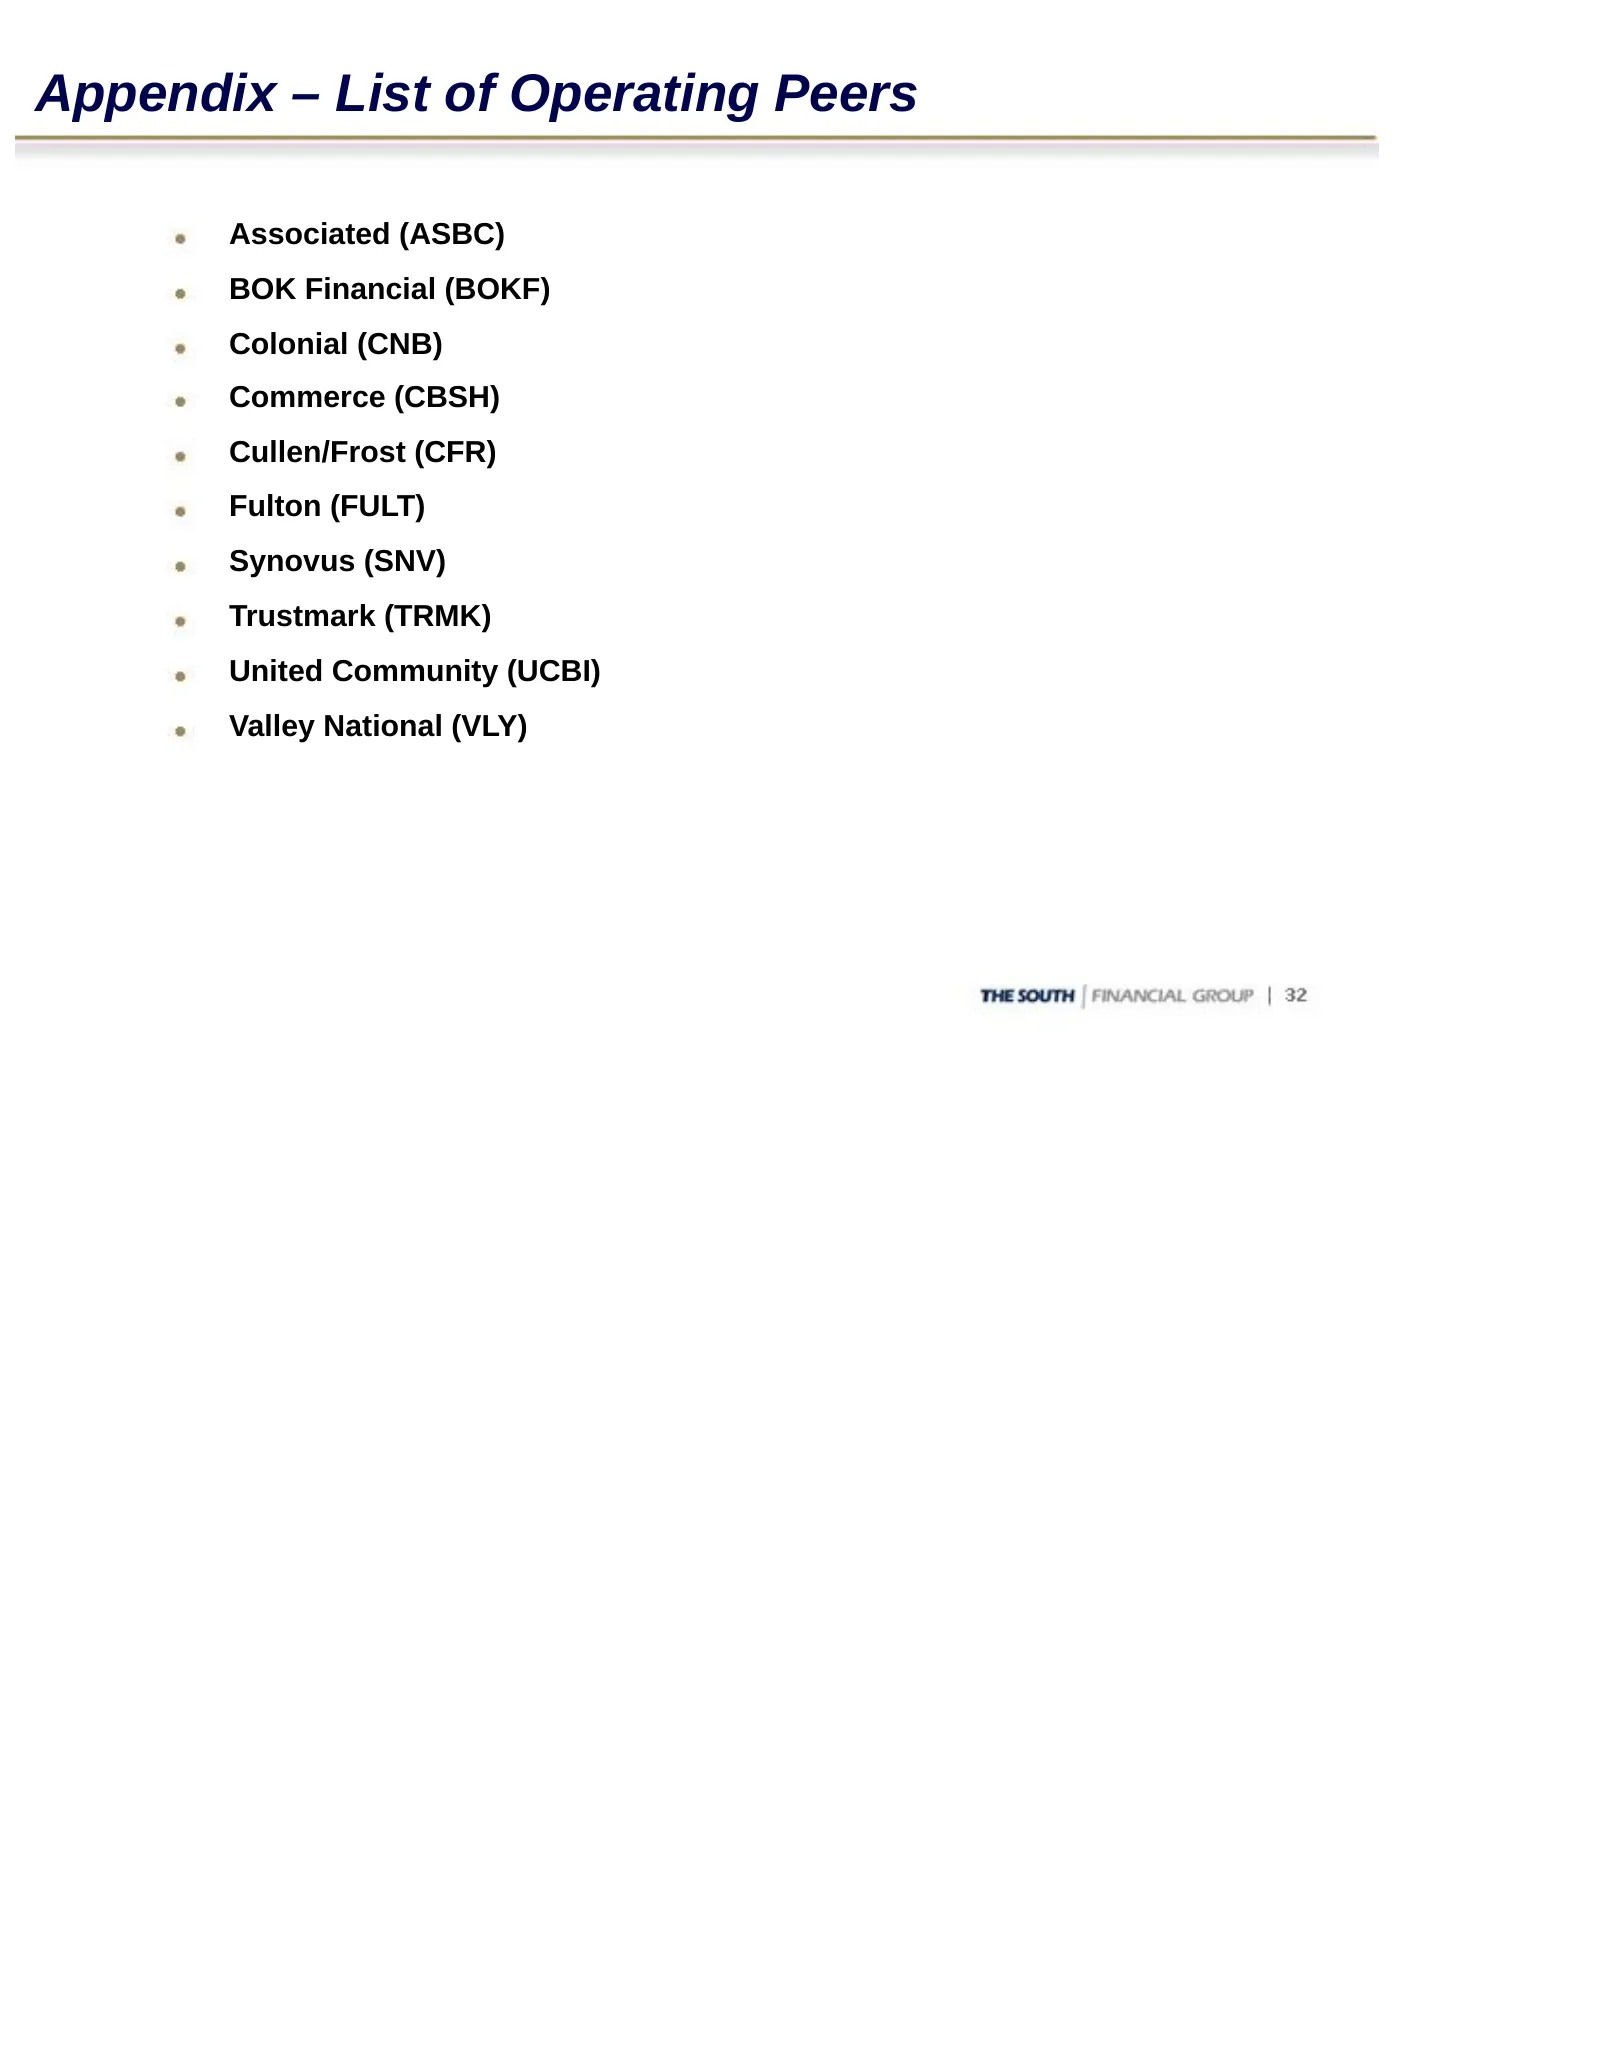
Appendix – List of Operating Peers Associated (ASBC) BOK Financial (BOKF) Colonial (CNB) Commerce (CBSH) Cullen/Frost (CFR) Fulton (FULT) Synovus (SNV) Trustmark (TRMK) United Community (UCBI) Valley National (VLY)
Slide 33: TSFG’s Footprint: Household Growth
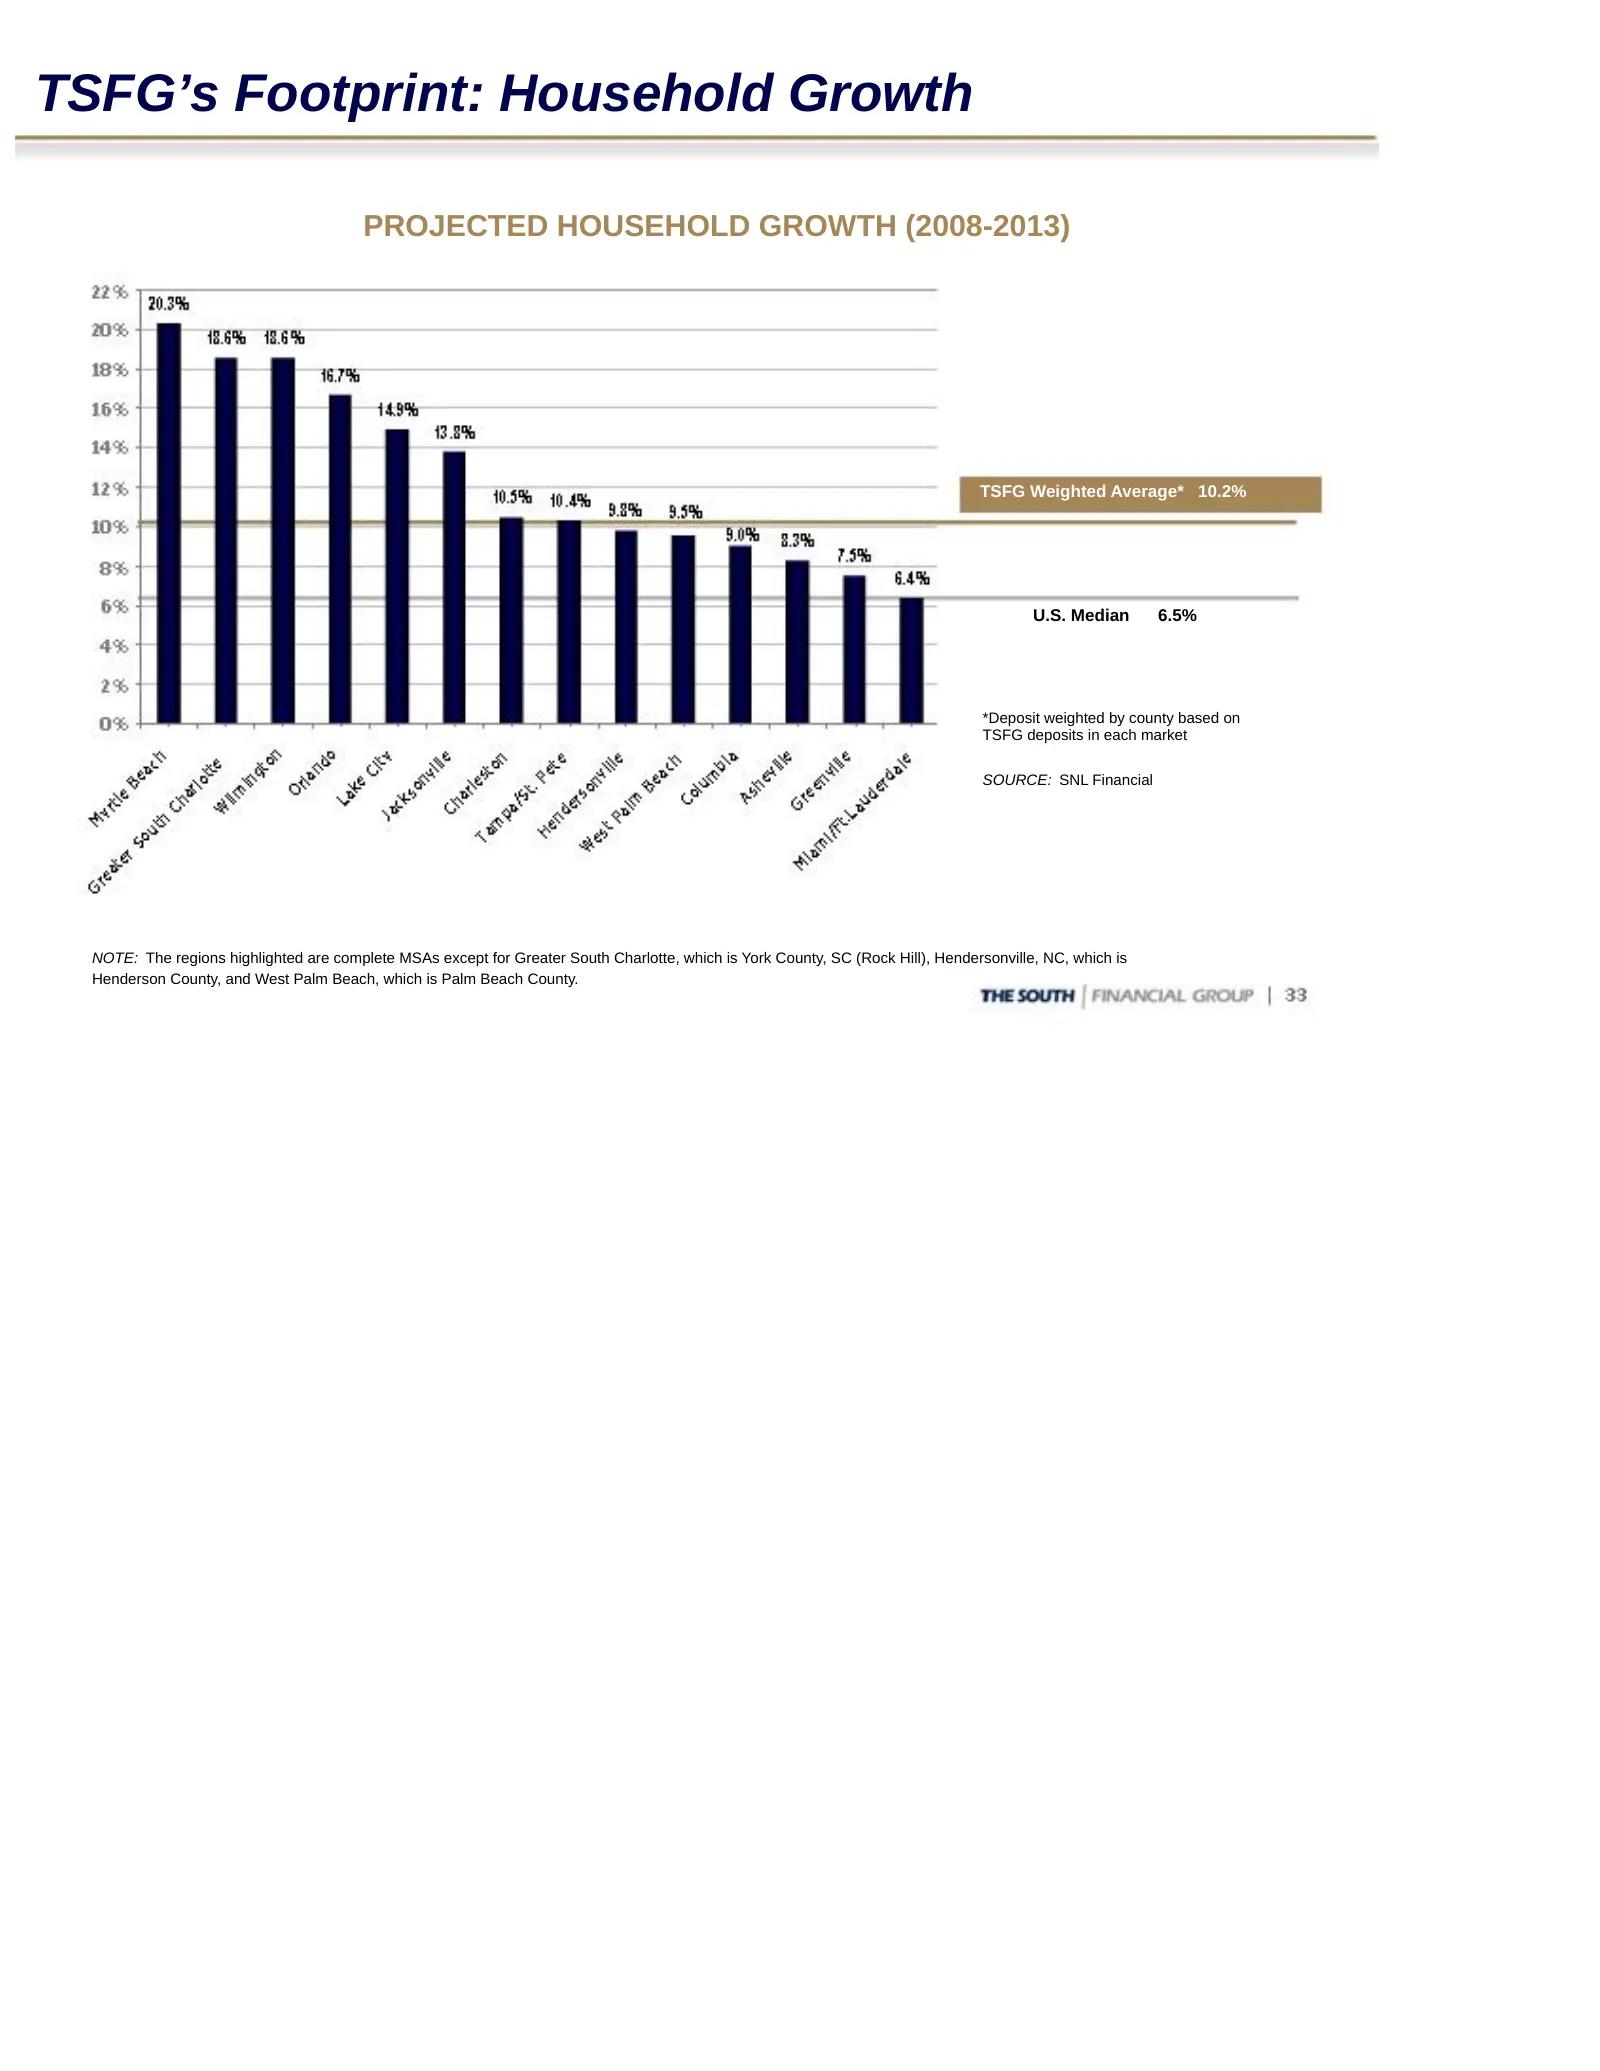
TSFG’s Footprint: Household Growth PROJECTED HOUSEHOLD GROWTH (2008-2013) TSFG Weighted Average* 10.2% U.S. Median 6.5% *Deposit weighted by county based on TSFG deposits in each market SOURCE: SNL Financial NOTE: The regions highlighted are complete MSAs except for Greater South Charlotte, which is
Slide 34: Current as of 2/19/09
THE:SOUTH — oi FINANCIAL | GROUP Si, “an | ~ a, \ > For more information: > 7 INVESTOR RELATIONS ~ investor@thesouthgroup.com > www.thesouthgroup.com ~ Current as of 2/19/09
Source: SEC EDGAR · 8-K filed Feb 23, 2009
More decks from South Financial Group Inc
 Merger or Acquisition (June 2010)15 slides · Jun 29, 2010
 Debt Investor Presentation (June 2010)84 slides · Jun 18, 2010
 Merger or Acquisition (June 2010)43 slides · Jun 4, 2010
 Merger or Acquisition (May 2010)15 slides · May 17, 2010
 Q1 2010 Earnings Presentation30 slides · Apr 20, 2010
 Q4 2009 Earnings Presentation30 slides · Jan 26, 2010