Chaparral Energy — Wells Fargo Conference 2012
45 slides from Chaparral Energy's conference presentation, Dec 5, 2012
Slide 1: Chaparral Energy – Wells Fargo Conference
Chaparral Energy Wells Fargo Conference December, 2012 Exhibit 99.1
Slide 2: Forward-Looking Statements
2 This presentation contains "forward-looking statements" within the meaning of Section 27A of the Securities Act of 1933, as amended, and Section 21E of the Securities Exchange Act of 1934, as amended. These forward-looking statements are subject to certain risks, trends and uncertainties that coul
Slide 3: Company Representatives
3 Company Representative Company Representative Joe Evans Chief Financial Officer & Executive Vice President Mark Fischer Chief Executive Officer & President John Zimmerman Director of Corporate Finance & Investor Relations
Slide 4: Chaparral Overview and Company Statistics
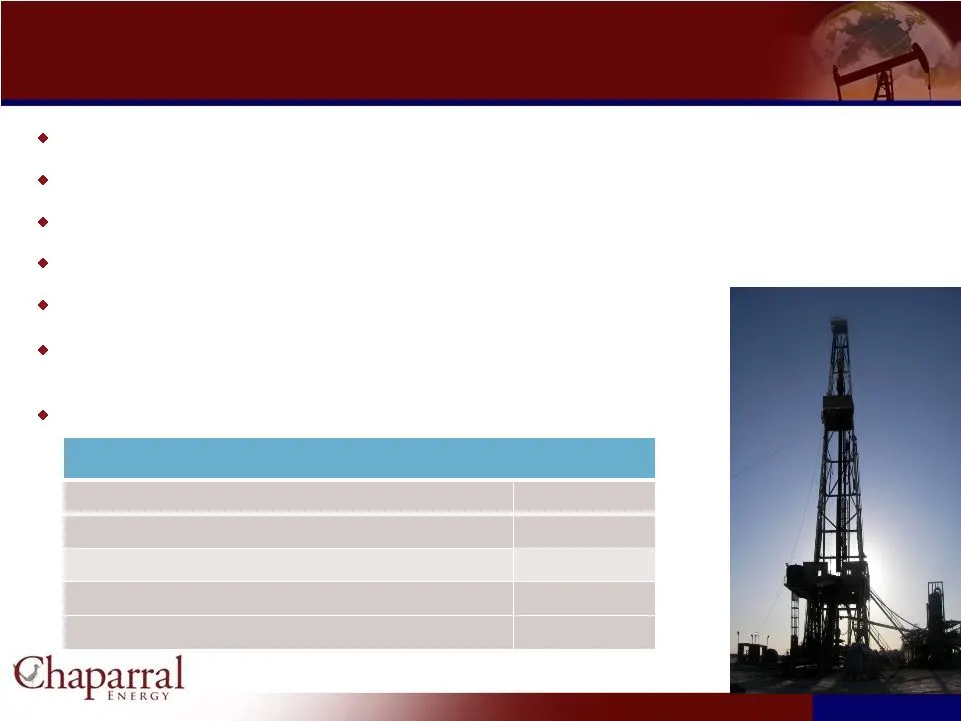
Chaparral Overview Company Statistics 4 Chaparral Overview Founded in 1988, Based in Oklahoma City Core areas — Mid-Continent (Oklahoma) and Permian Basin (W. Texas) Oil-weighted producer (64% oil; 36% gas); R/P ratio 18 years Second largest oil producer in Oklahoma Stable 1P base with large potenti
Slide 5: Operating Areas
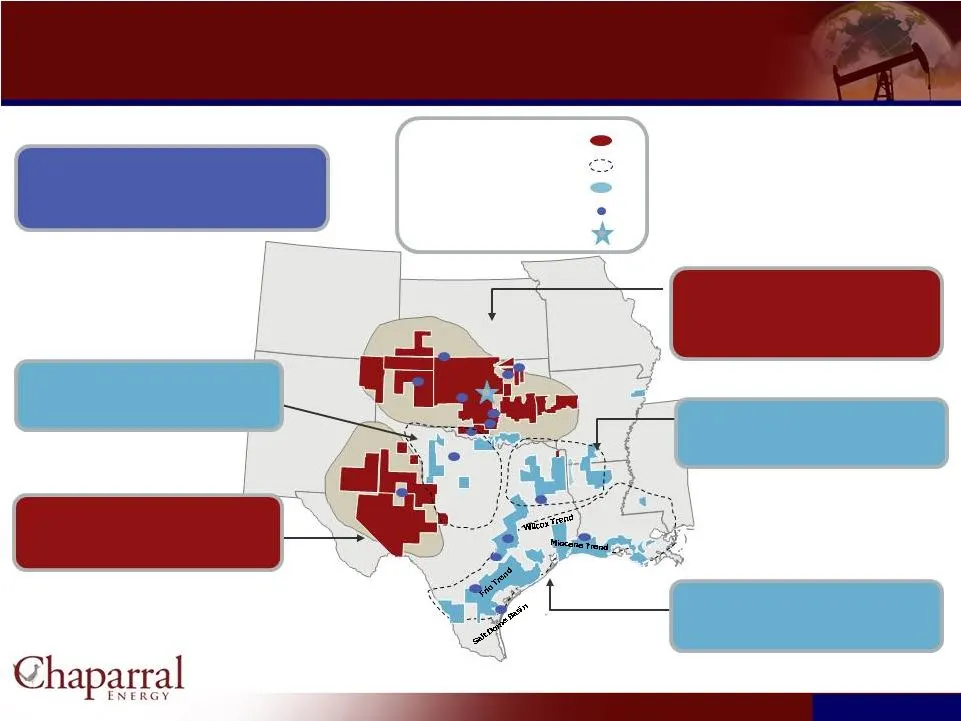
Operating Areas North Texas Reserves: 3.9 MMBoe, 3% of total Production: 0.5 Mboe/d, 2% of total Permian Basin Reserves: 19.3 MMBoe, 12% of total Production: 3.6 MBoe/d, 15% of total Company Total December 2011 proved reserves – 156.3 MMBoe 2011 average daily production – 23.7 MBoe/d Acreage (gross
Slide 6: Strong Record of Reserve and Production Growth
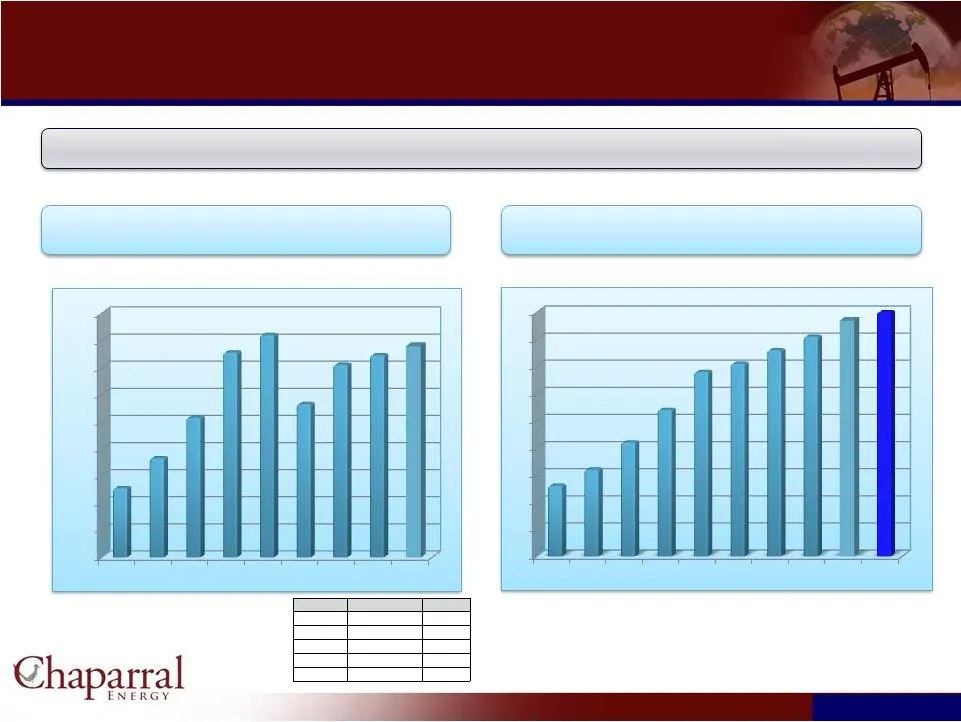
Strong Record of Reserve and Production Growth 6 6 Strong Record of Reserve and Production Growth Year-End SEC Reserves (MMBoe) (1) 2003 – 2011 CAGR = 15% Annual Production (MMBoe) 2003 – 2011 CAGR = 16% Chaparral’s reserve replacement ratio averaged 422% per year since 2003 Year Oil Gas $96.01 $6.8
Slide 7: Current Production - 2012
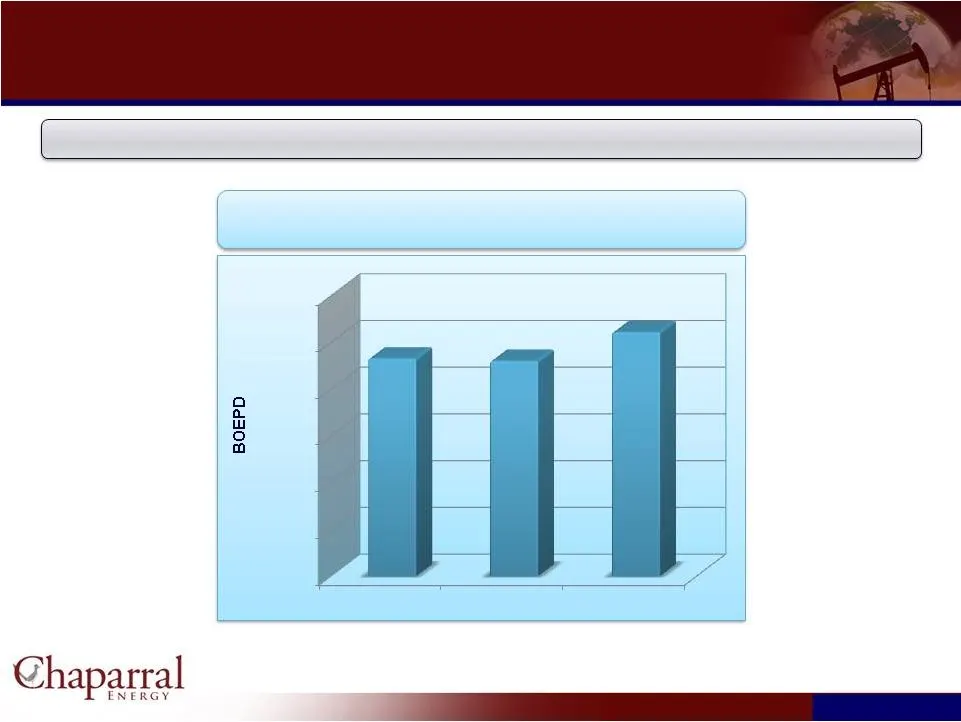
Current Production - 2012 7 7 Current Production - 2012 Production by Quarter In the 3 Quarter Chaparral increased production by 13.4% over the previous quarter rd - 5,000 10,000 15,000 20,000 25,000 30,000 Q1 Q2 Q3 23,278 23,018 26,098
Slide 8: Financial Position to Execute Strategy
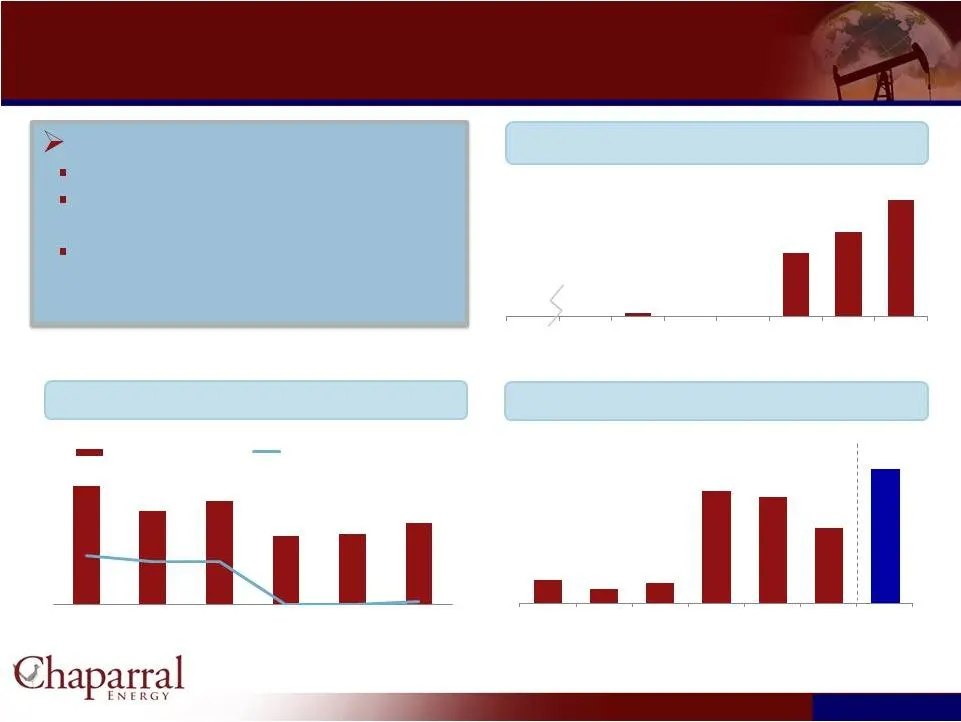
Financial Position to Execute Strategy $325 $300 $400 8 Net Debt / EBITDA Liquidity ($mm) Strong Financial Position No senior note maturities before 2020 Hedge positions in place to secure cash flow in near term Budget CAPEX within free cash flow (including divestiture proceeds) * * Pro-Forma for $1
Slide 9: Capital Budget
Capital Budget ($mm) Component 2008 2009 2010 2011 2012 Budget 2012 Expanded Budget 2012 % Total $339 $154 $344 $336 $330 $460 100% Key Drilling Areas Total $201 9 EOR Field Total $168 Capital Budget ($mm) Drilling $168 $76 $196 $172 $131 $201 44% EOR 37% Enhancements 3% Acquisitions 9% Other (P&E,
Slide 10: Drilling Resource Potential
10 Drilling Resource Potential Drilling Resource Potential
Slide 11: Substantial Resource Potential for Near-Term Growth
Substantial Resource Potential for Near-Term Growth 11 11 Substantial Resource Potential for Near-Term Growth Near-Term 2,522 Unrisked (1,184 Risked) Net Undrilled Wells 156 MMBoe Proved Reserves Plus 583 MMBoe Unproved Resource Potential Conventional Drilling (ROR 50% - 75%) Anadarko Granite Wash A
Slide 12: Northern Oklahoma Mississippi Play
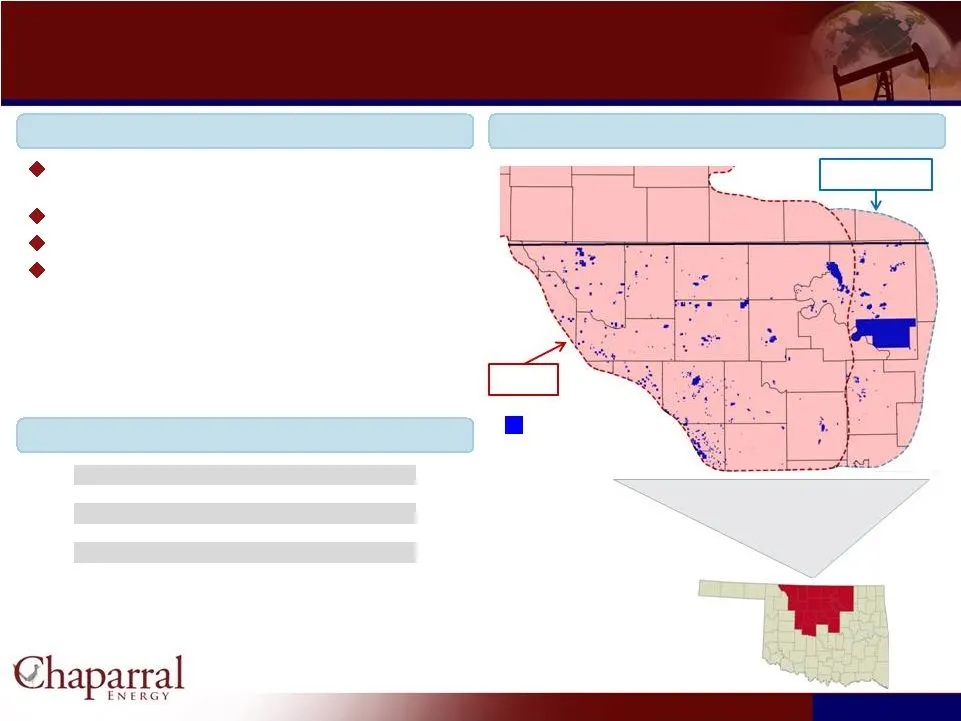
Northern Oklahoma Mississippi Play 12 The Northern Oklahoma Mississippi Play (“NOMP”) is a key near–term focus area for Chaparral Chaparral acreage over 260,000 net acres in the NOMP Over 132 MMBoe of potential 1,600 unrisked drilling well inventory Chaparral Acreage Overview NOMP Asset Map NOMP Wel

Slide 13: NOMP: Recent Results
13 NOMP: Recent Results NOMP: Recent Results Current Net Production – 3,200 Boepd (65% Oil) 2012 Capital - $73 mm NOMP Core (93,000 Net Acres) Significant industry activity in the play Drilled or participated in 37 wells to date (18 operated); 2 WOCU 1-3 additional wells in 2012 Average IP ~600 Boep
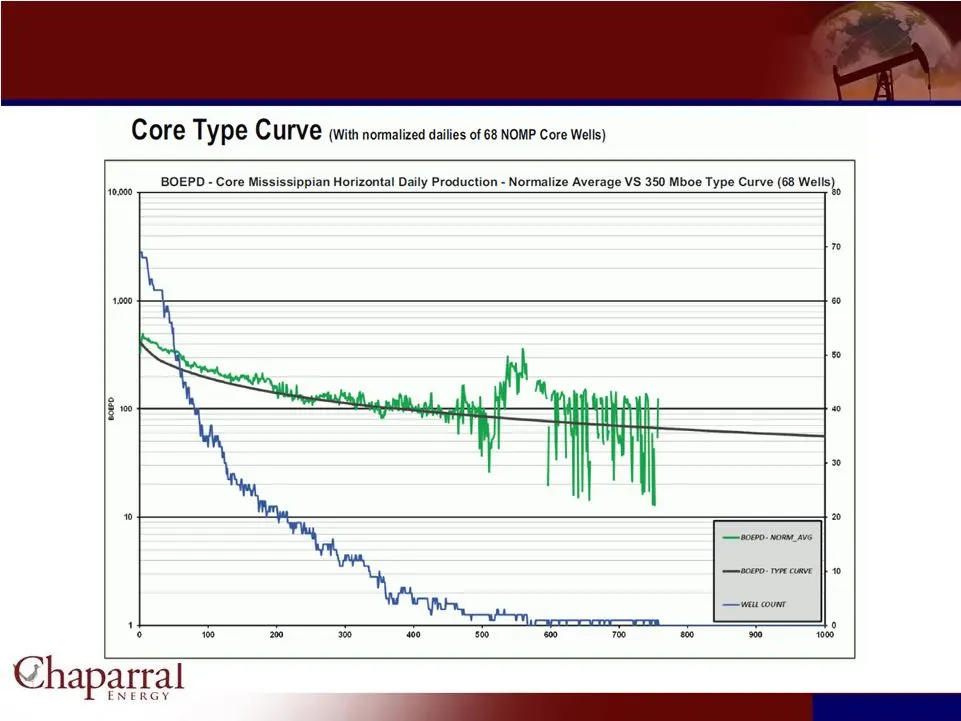
Slide 14: NOMP Core Type Curve
14 NOMP Core Type Curve NOMP Core Type Curve
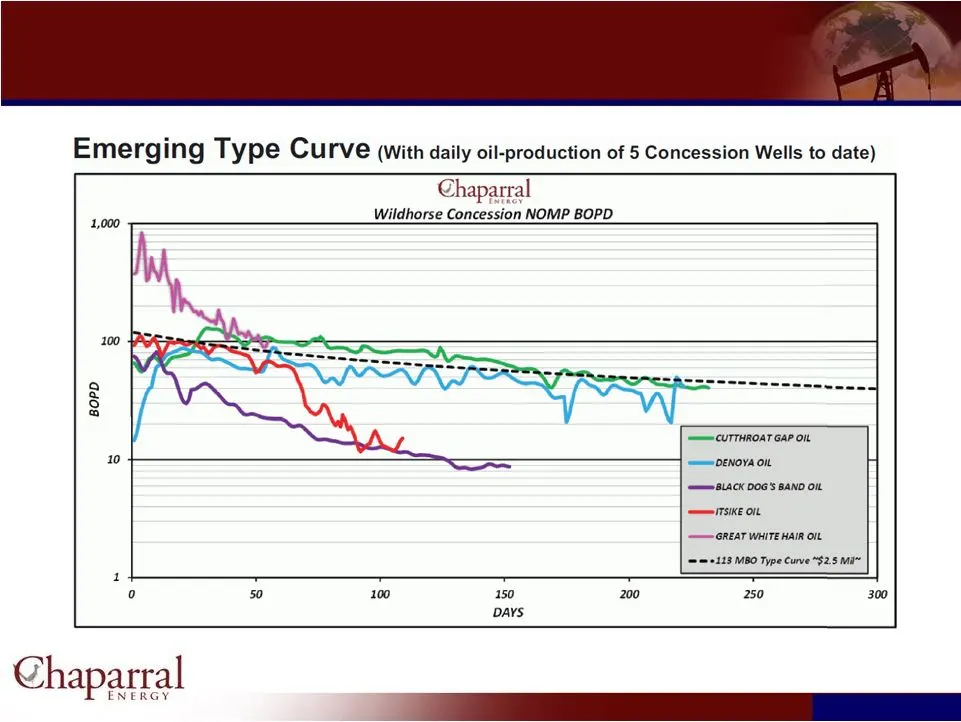
Slide 15: NOMP Emerging Type Curve
15 NOMP Emerging Type Curve NOMP Emerging Type Curve
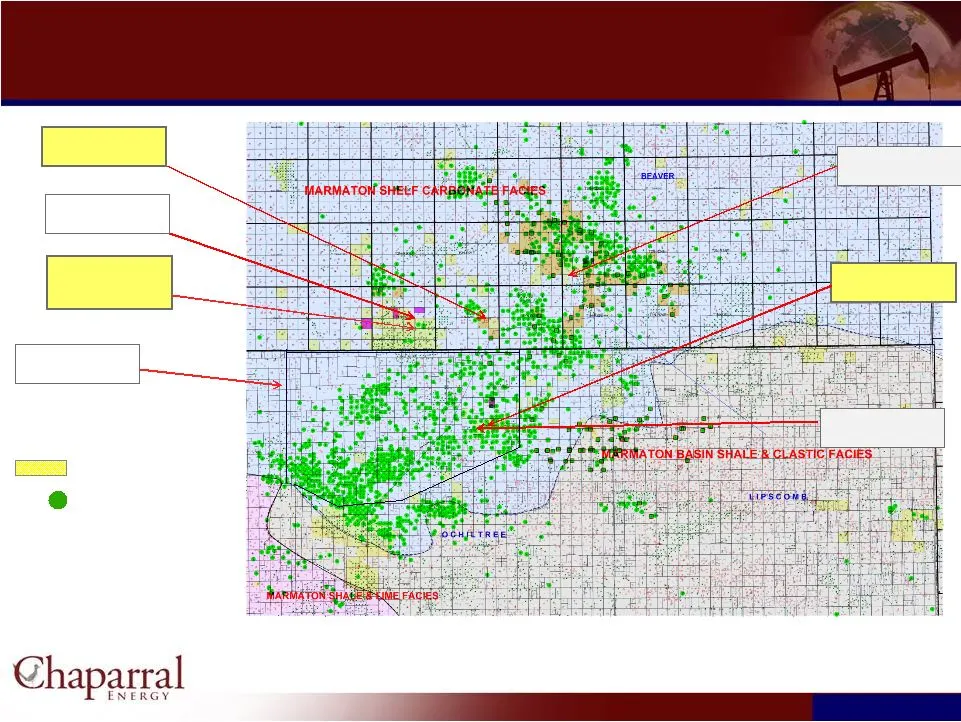
Slide 16: Marmaton Shelf Play
Marmaton Shelf Play 16 Marmaton Shelf Play Johnston 1H-24 IP +300 Boepd Leatherman 1H-14 2012 Location Lamaster 1H-23 IP +500 Boepd (90% Oil) Jay 1H-1098 IP +140 Boepd Wright 1H-1099 2012 Location Marmaton Production Chaparral Acreage Net Acreage 48,000 EUR/well (MBoe) Cost per Well (MM$) $3.6 Corne
Slide 17: Chaparral: A Growing Mid-Continent CO2 EOR Company
17 Chaparral: A Growing Mid-Continent CO 2 EOR Company Chaparral: A Growing Mid-Continent CO EOR Company
Slide 18: Chaparral is a Leader in the CO2-EOR Industry
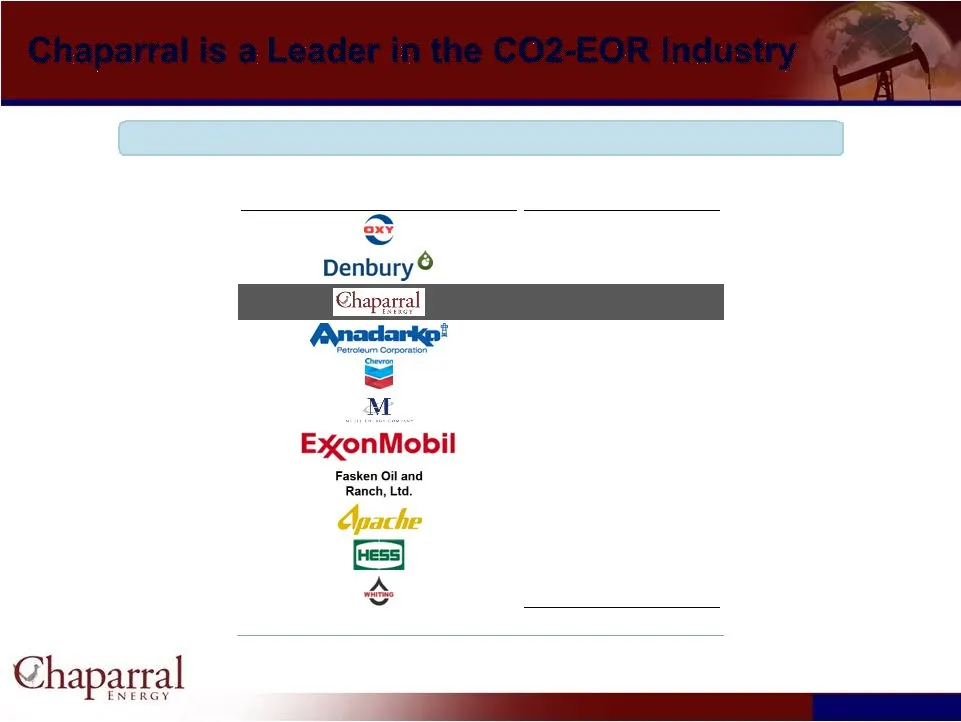
8 18 Chaparral is a Leader in the CO2-EOR Industry # of Active Producer CO 2 -EOR Projects Total Source: April 2012 Oil & Gas Journal Note: Chaparral projects include the North Burbank Unit Chaparral is a Leader in the CO2-EOR Industry Chaparral is the third most active CO2-EOR producer in the U.S.
Slide 19: CO2 EOR Focused Areas
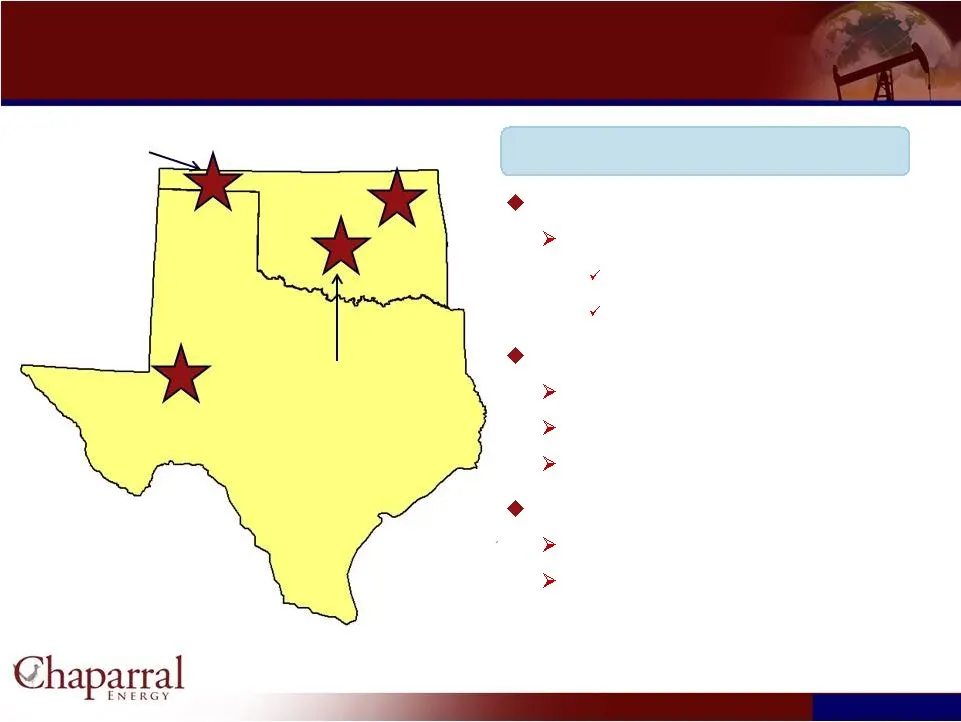
CO 2 EOR Focused Areas 19 CO EOR Focused Areas CO Project Inventory 74 units with 1P, 2P & 3P EOR reserve 8 units with proved reserves 8 units with CO injection CO Infrastructure – 473 Miles 318 miles of active line 68 miles under construction 87 miles of inactive line CO Supply 47 MMscf/D of existi
Slide 20: Currently Owned CO2 Development Potential and Infrastructure
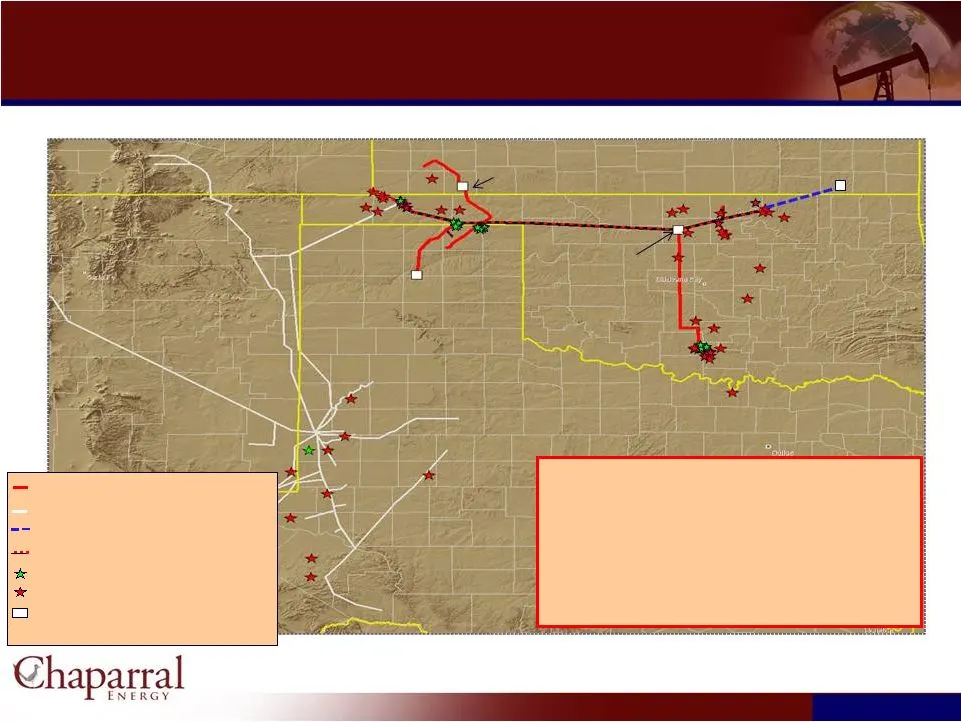
20 Currently Owned CO 2 Development Potential and Infrastructure Currently Owned CO Development Potential and Infrastructure Total OOIP 3,735 MMBo Primary Production 628 MMBo Secondary Recovery 597 MMBo Tertiary Potential 410 MMBo Net Tertiary Potential 197 MMBo Existing CELLC CO Pipelines Existing
Slide 21: EOR 2012 Capital Budget
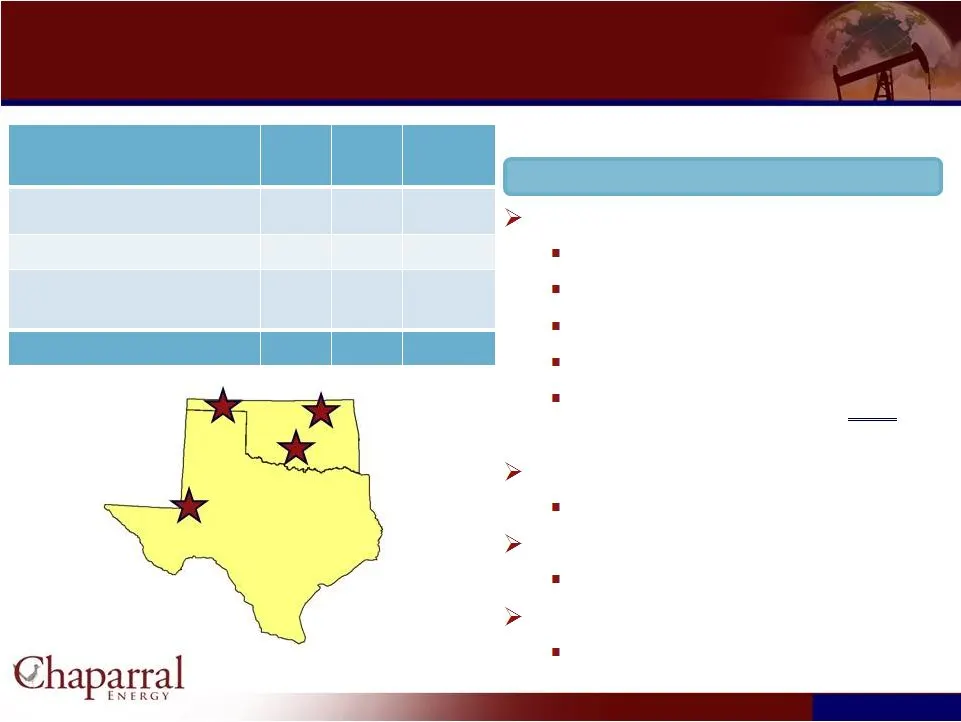
EOR 2012 Capital Budget (1) 21 EOR 2012 Capital Budget (1) Budget by Category ($mm) Actual Budget Expanded Budget Infrastructure / Pipelines Drilling Enhancements / CO Purchases Total $86 $127 $168 2012 Field Projects ($mm) Panhandle Area Permian Basin Central Oklahoma Area Burbank Area (1) Does not
Slide 22: Processing Rate: The Key to Improved Rate of Return
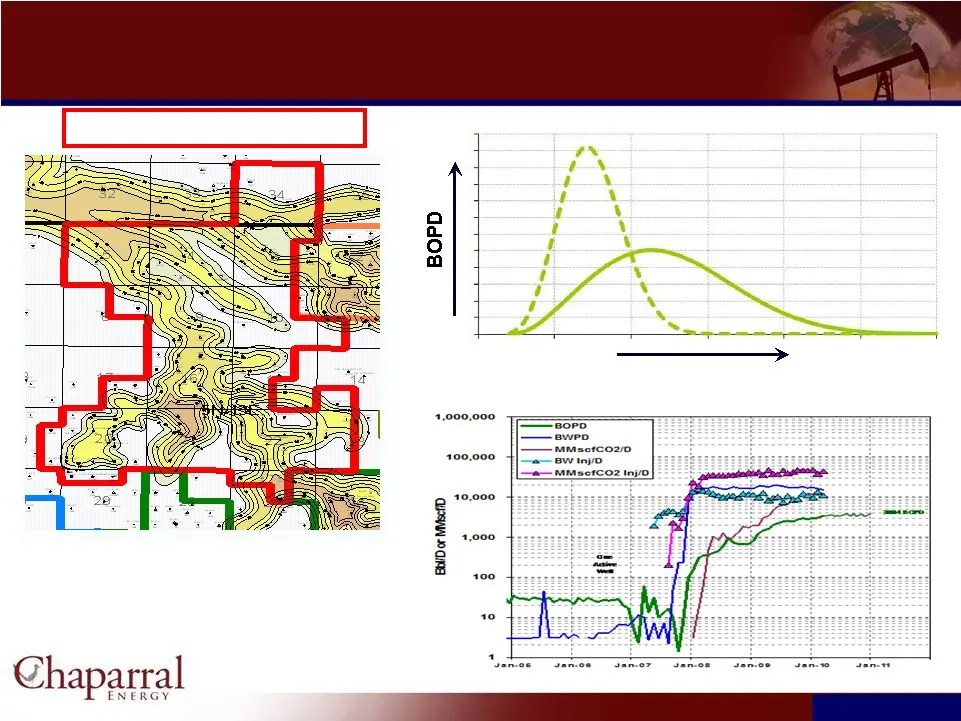
Processing Rate: The Key to Improved Rate of Return 22 Processing Rate: The Key to Improved Rate of Return Time 25% hcpv Inj./Yr 10% hcpv Inj./Yr HMU Model: Processing Rate v. Reserve Recovery • CO Injection initiated Sep’07 • Processing Rates Average 25% hcpv Inj./Yr Hovey Morrow Unit (HMU)
Slide 23: Monthly Incremental EOR from Active CO2 Projects
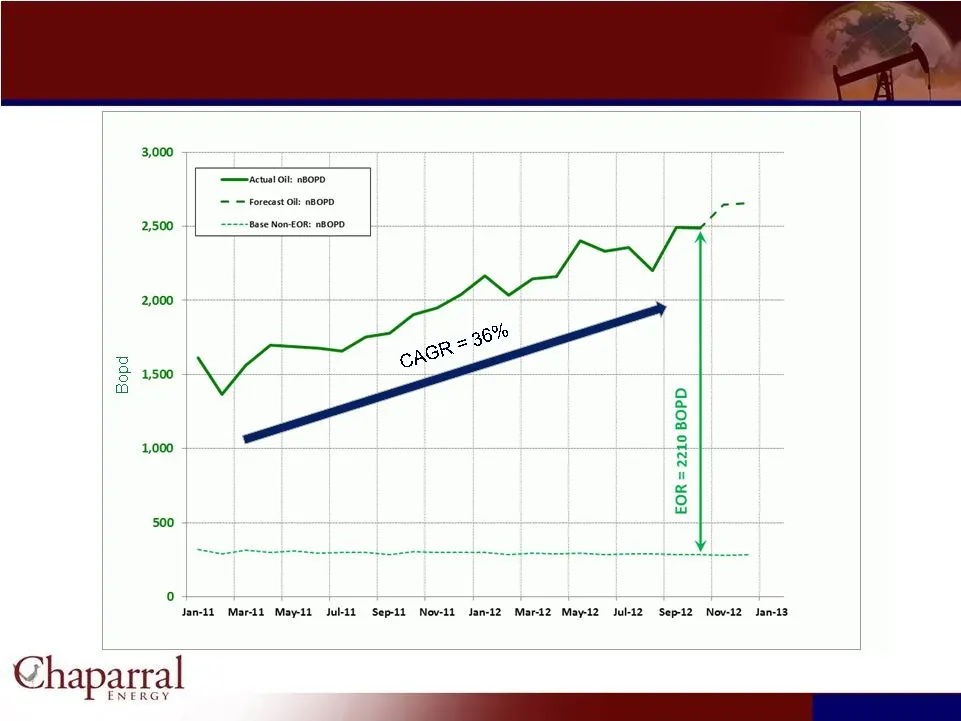
Monthly Incremental EOR from Active CO 2 Projects 23
Slide 24: Potential EOR Production Growth
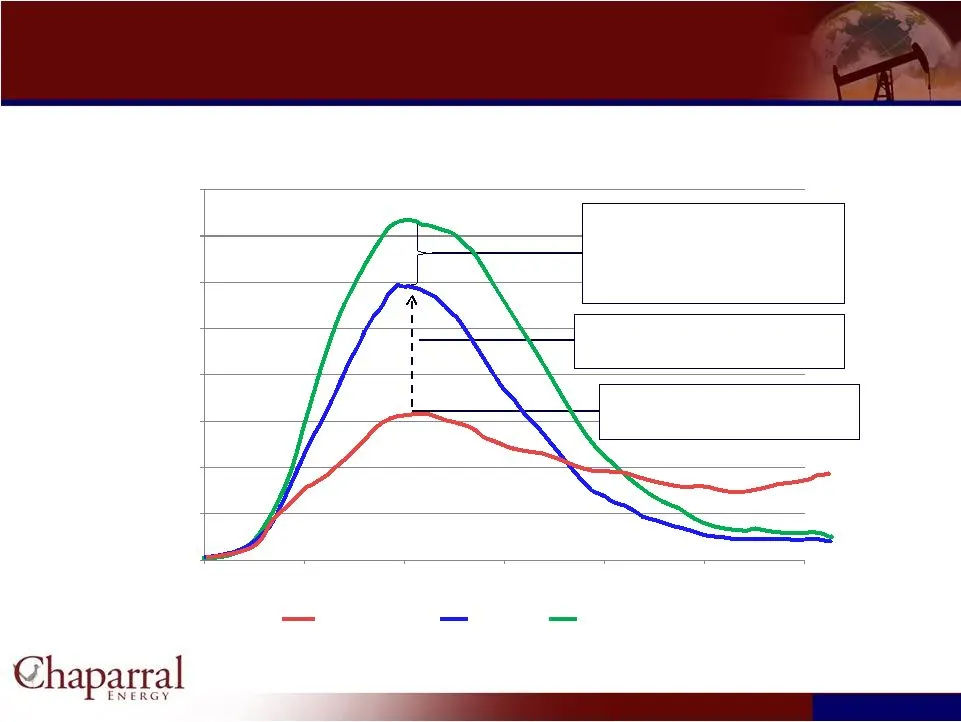
Chaparral – Potential EOR Production Growth 24 Chaparral – Potential EOR Production Growth 5,000 10,000 15,000 20,000 25,000 30,000 35,000 40,000 Net Oil Production Additional production from non Business Plan projects meeting corporate economic hurdles Additional CO2 Plan w/ +100 mmcfpd in 2015 at
Slide 25: North Burbank CO2 Development
25 North Burbank CO 2 Development North Burbank CO Development
Slide 26: North Burbank Unit – Overview
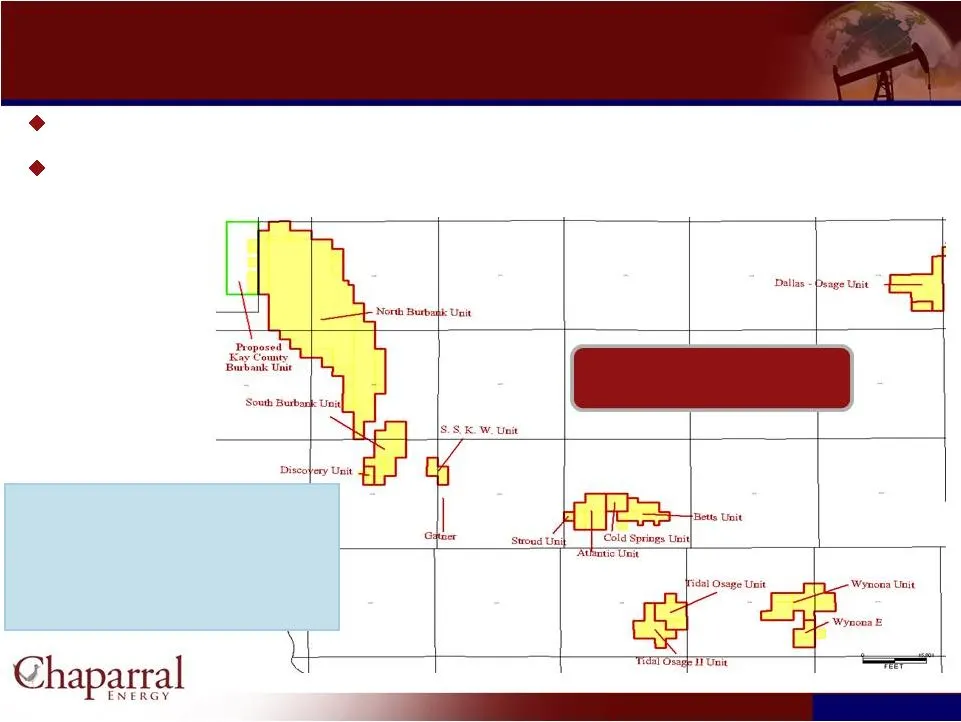
North Burbank Unit – Overview 26 Burbank Area: Net Potential: 100 MMBoe, 51% of total North Burbank Unit – Overview Chaparral’s North Burbank Unit is its largest EOR field and plans to introduce CO injection into the North Burbank Unit in 1Q 2013 Chaparral anticipates that it will spend $800 million
Slide 27: Burbank in Perspective
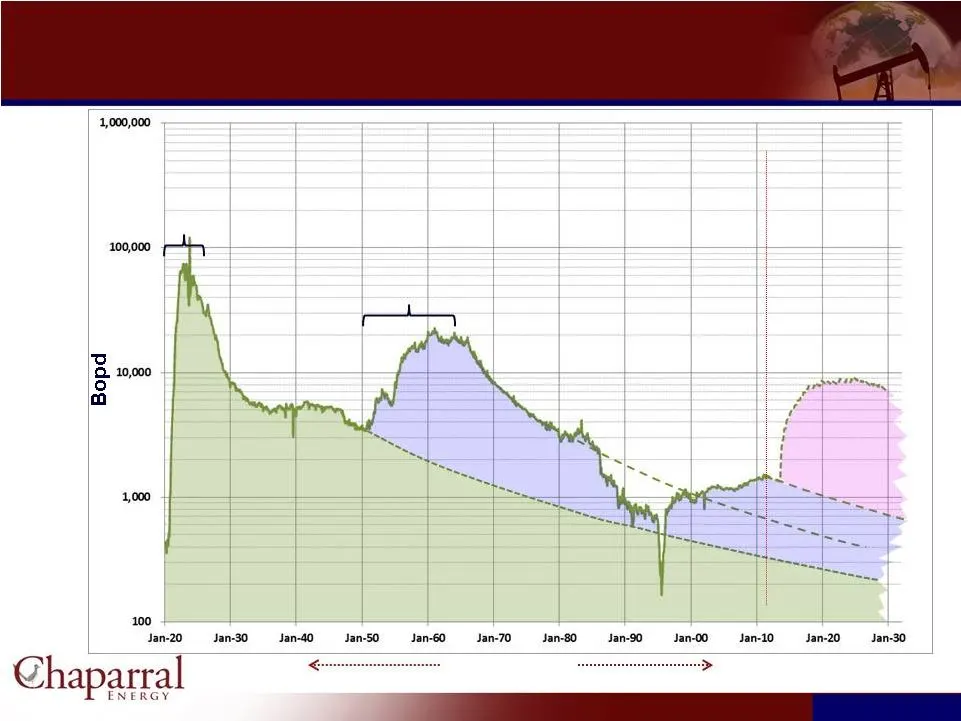
Burbank in Perspective 27 Burbank in Perspective Secondary Development Primary Development Tertiary Development 110 Years “CO 2 EOR” “Waterflood” +8,000 BOPD
Slide 28: North Burbank Unit – Miscibility Pressure Build
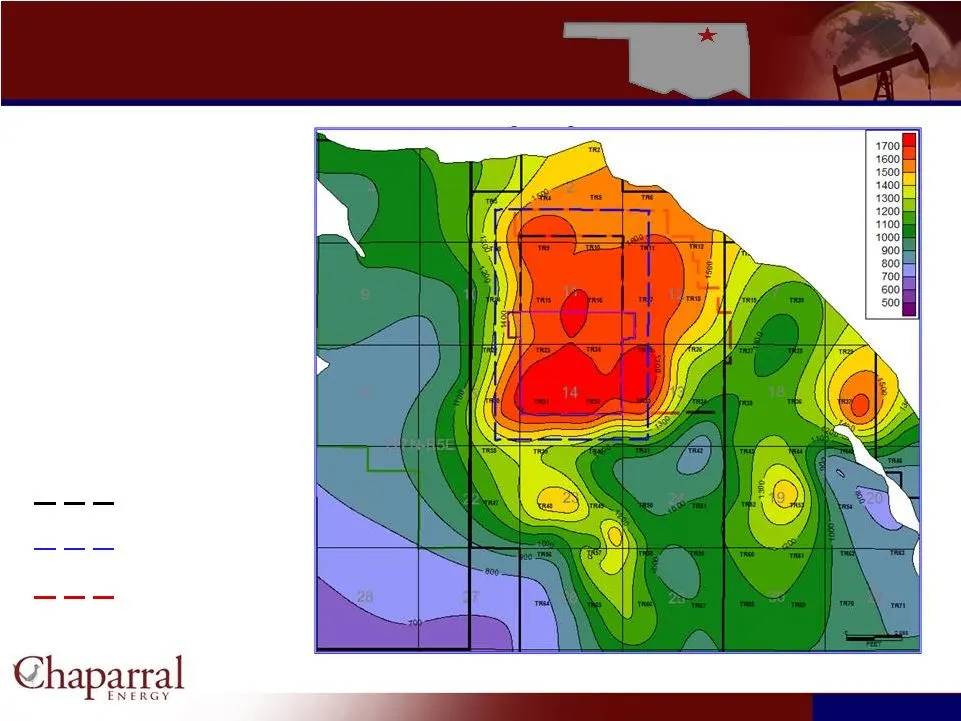
28 North Burbank Unit – Miscibility Pressure Build November 2012 Average pressure 1622 psia Ph-I Vicinity Phase I Halo Area Phase II
Slide 29: Coffeyville CO2 System
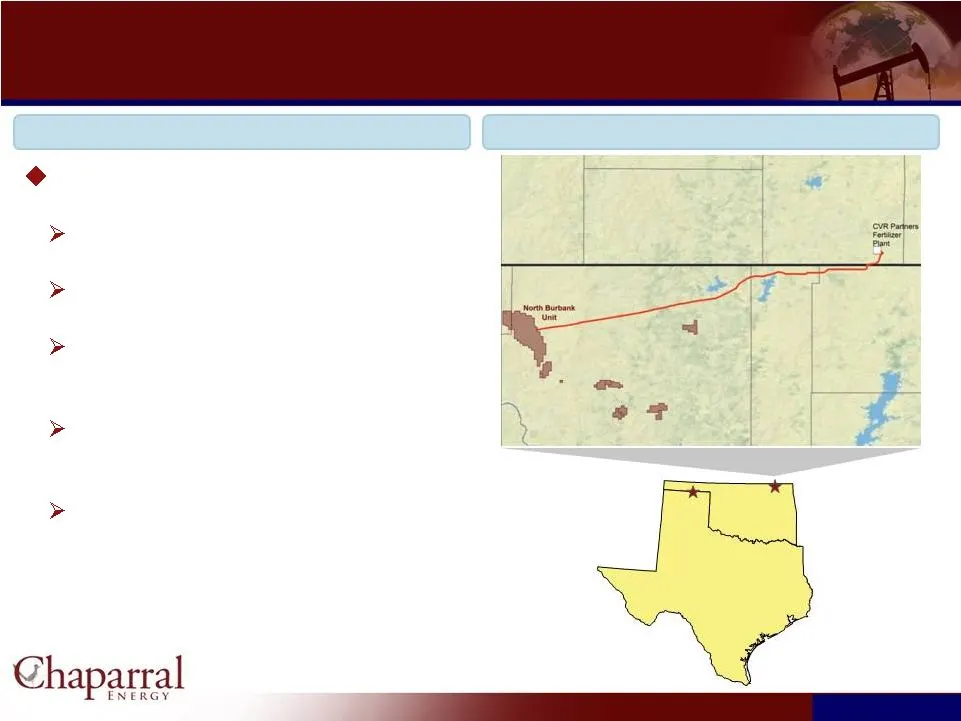
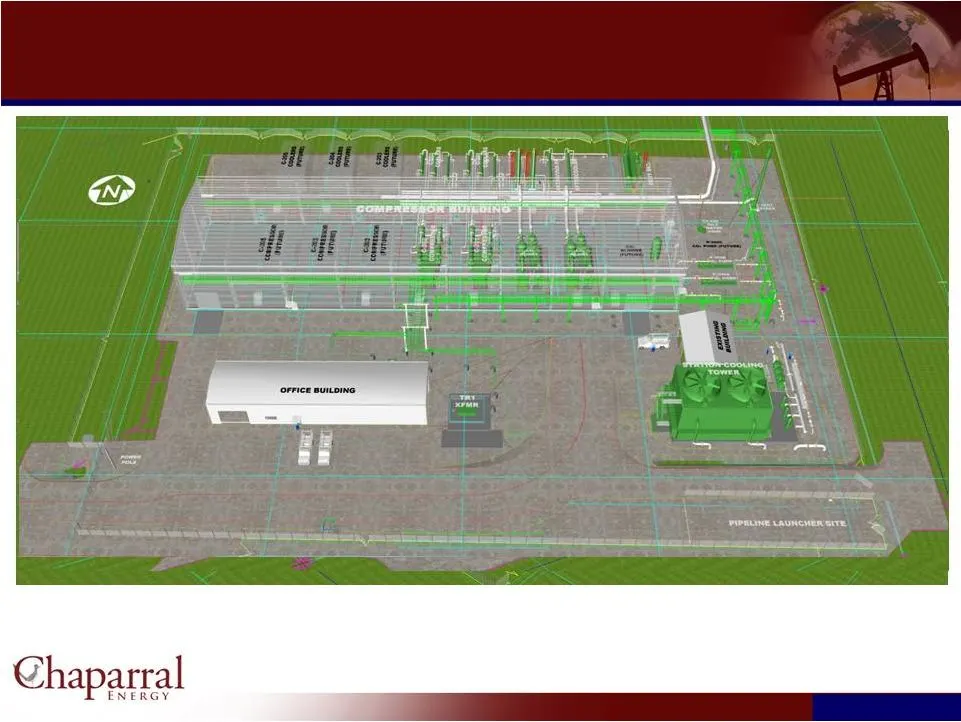
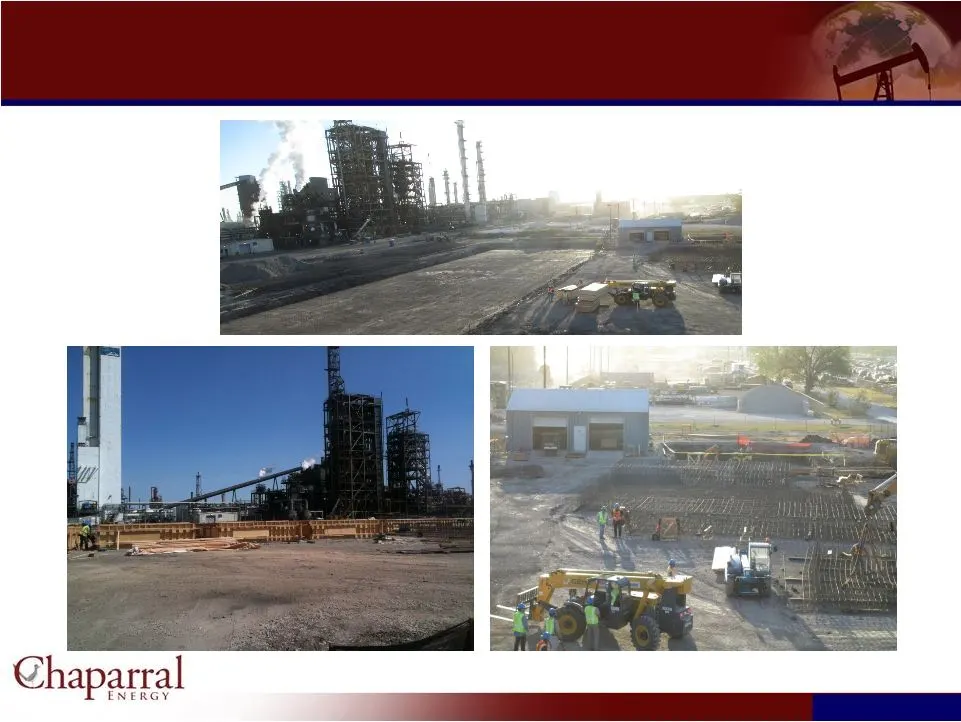
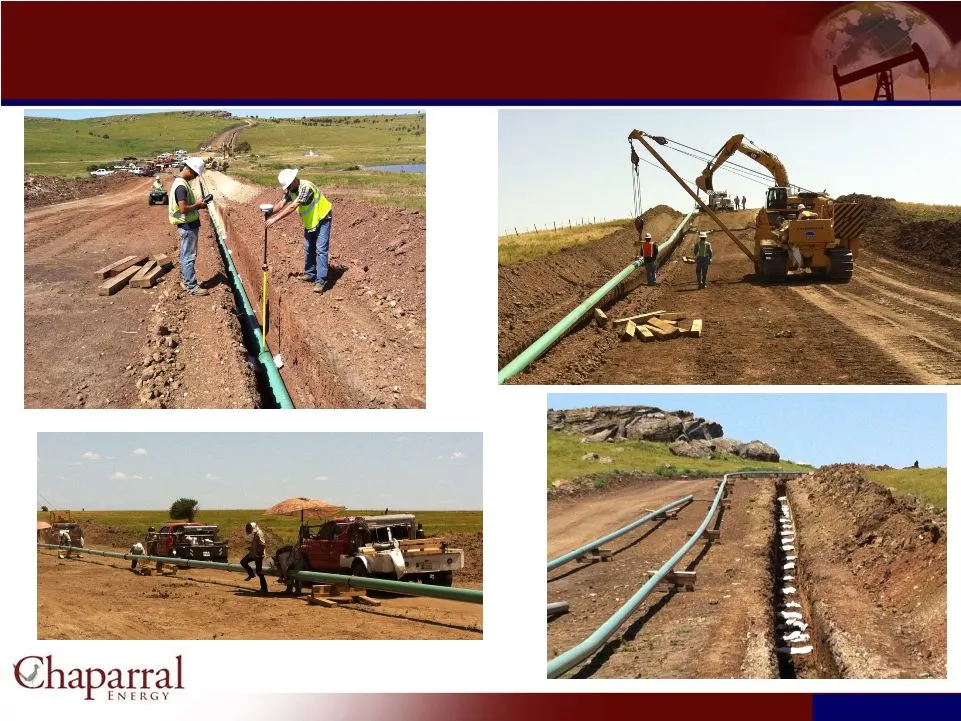
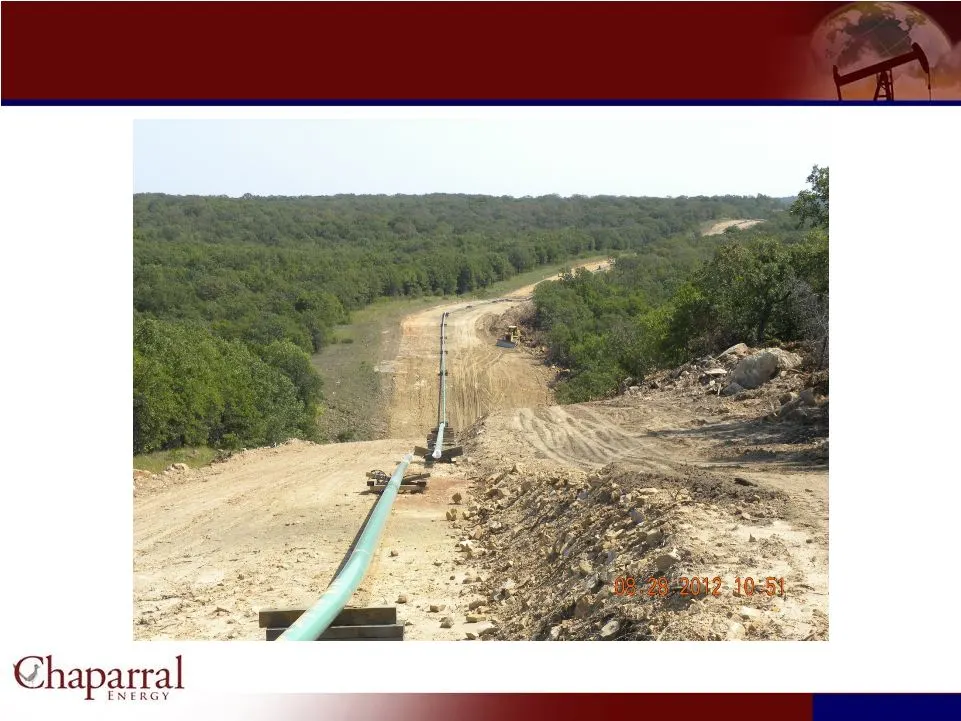
Coffeyville CO 2 System 29 Coffeyville CO System The Coffeyville CO System $84 million of total capital expenditures 23,500 HP compression facility 68.3-mile 8-inch pipeline with potential capacity of approximately 60 MMcf/d. CO is sourced from the CVR Partners fertilizer plant in Coffeyville, KS. O
Slide 30: Coffeyville CO2 Compression Facility
Coffeyville CO 2 Compression Facility 30 Coffeyville CO Compression Facility
Slide 31: Coffeyville CO2 Facility: Foundation Construction
Coffeyville CO 2 Facility: Foundation Construction 31 Coffeyville CO Facility: Foundation Construction
Slide 32: Coffeyville CO2 Pipeline: Construction
Coffeyville CO 2 Pipeline: Construction 32 Coffeyville CO Pipeline: Construction
Slide 33: Coffeyville CO2 Pipeline: Construction
33 Coffeyville CO 2 Pipeline: Construction Coffeyville CO Pipeline: Construction
Slide 34: Other CO2 Injection Projects
34 Other CO 2 Injection Projects Other CO Injection Projects
Slide 35: Camrick CO2-EOR Flood
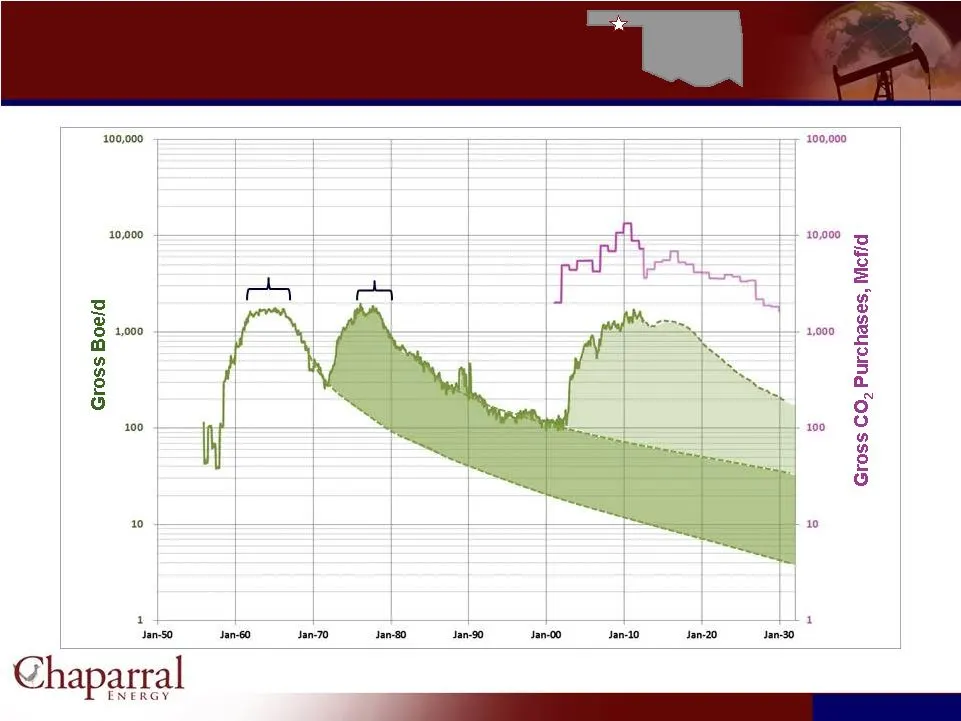
Camrick CO 2 –EOR Flood 35 Secondary Development Primary Development Tertiary Development Camrick CO –EOR Flood +1,500 BOPD
Slide 36: North Perryton CO2-EOR Flood
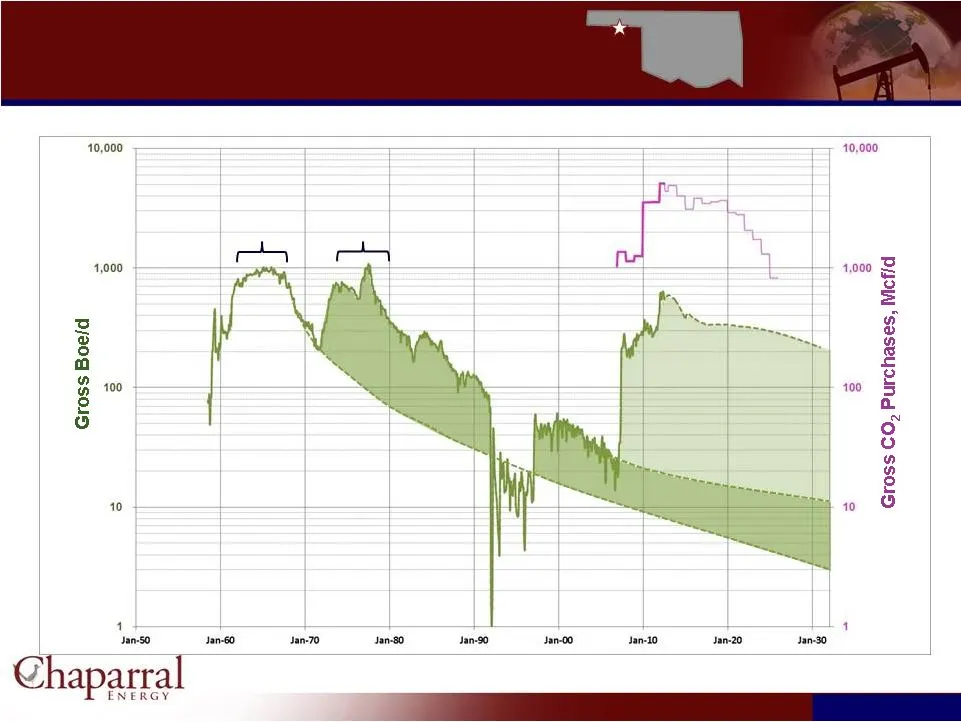
36 North Perryton CO 2 –EOR Flood North Perryton CO –EOR Flood Secondary Development Primary Development Tertiary Development +600 BOPD
Slide 37: Booker Area CO2-EOR Flood
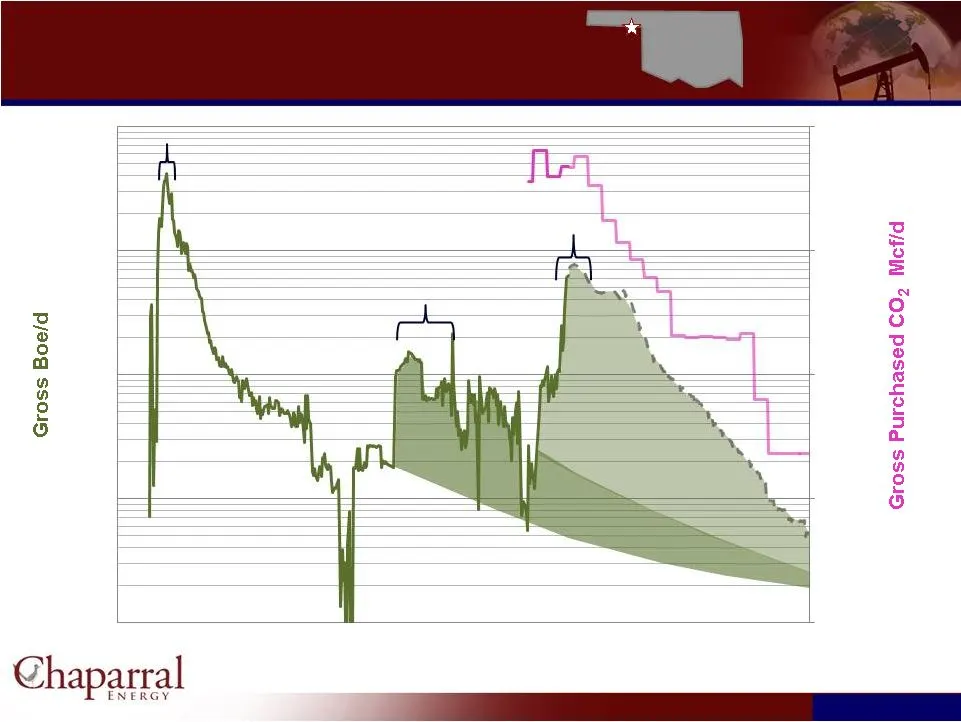
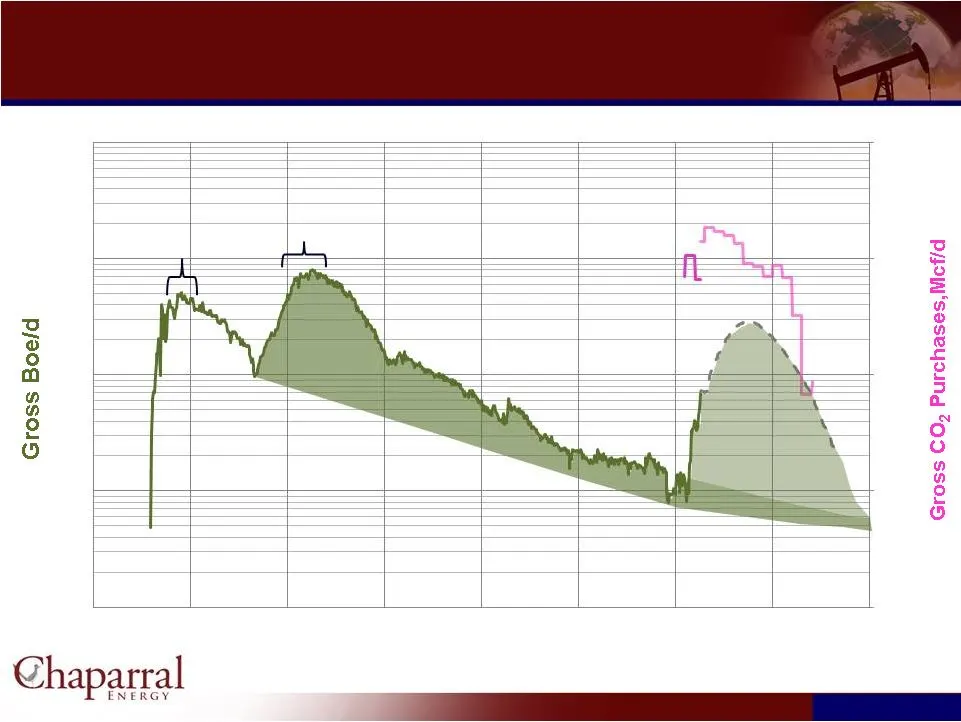
37 Booker Area CO 2 –EOR Flood Primary Development Secondary Development Tertiary Development Booker Area CO –EOR Flood +700 BOPD 1,000 10,000 1,000 10,000 Jan-80 Jan-90 Jan-00 Jan-10 Jan-20
Slide 38: Farnsworth Area CO2-EOR Flood (West Side Only)
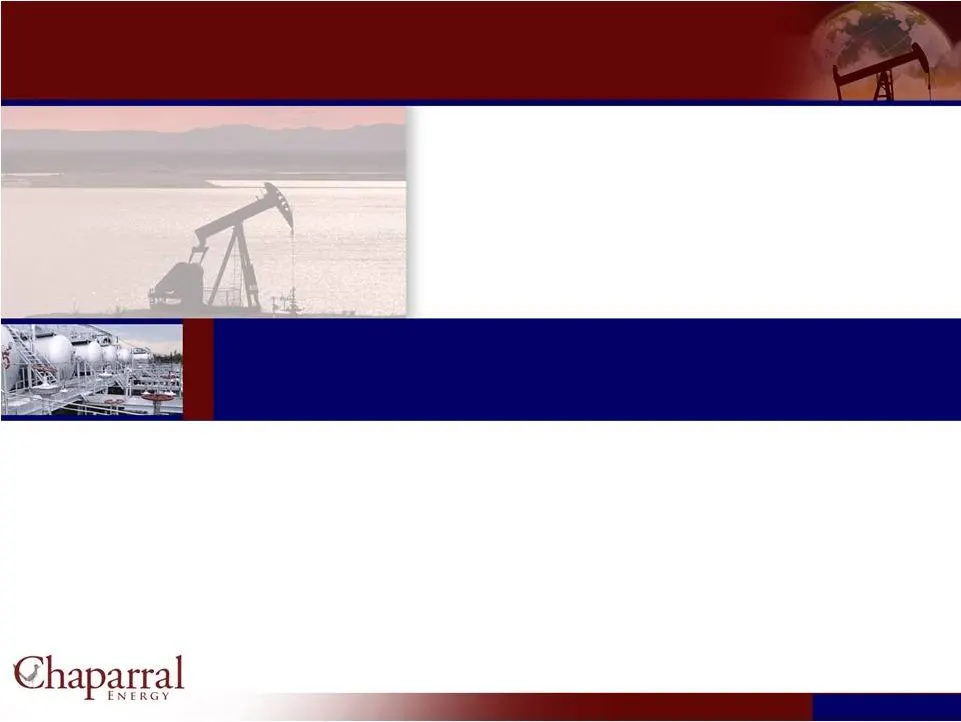
38 Farnsworth Area CO 2 –EOR Flood (West Side Only) Primary Development Tertiary Development Secondary Development Farnsworth Area CO –EOR Flood (West Side Only) +2,900 BOPD 1,000 10,000 100,000 1,000 10,000 100,000 Jan-50 Jan-60 Jan-70 Jan-80 Jan-90 Jan-00 Jan-10 Jan-20
Slide 39: Potential of 740 MMBoe
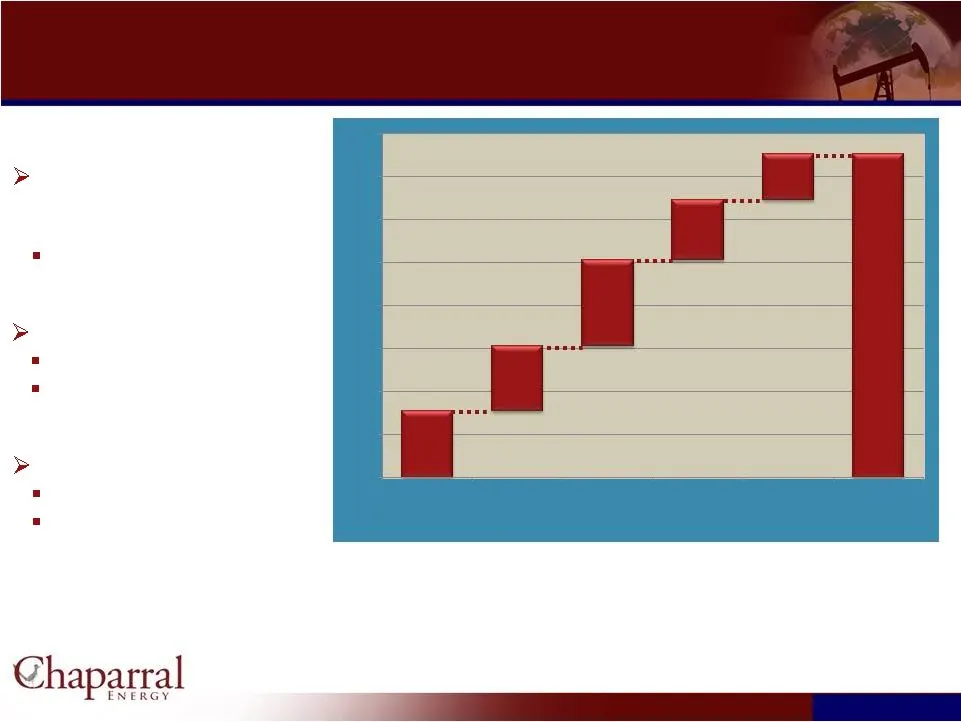
39 Potential of 740 MMBoe 0 100 200 300 400 500 600 700 800 2011 Proved Reserves +NOMP Drilling Potential +EOR Potential + Developing Emerging Plays* +Other Drilling =Total Potential Potential of 740 MMBoe Near-term + Long-term strategy yields significant value increase ~ 70% Oil * Woodford, Bone Sp
Slide 40: Financial Overview
Financial Overview 40 Financial Overview
Slide 41: Financial Summary
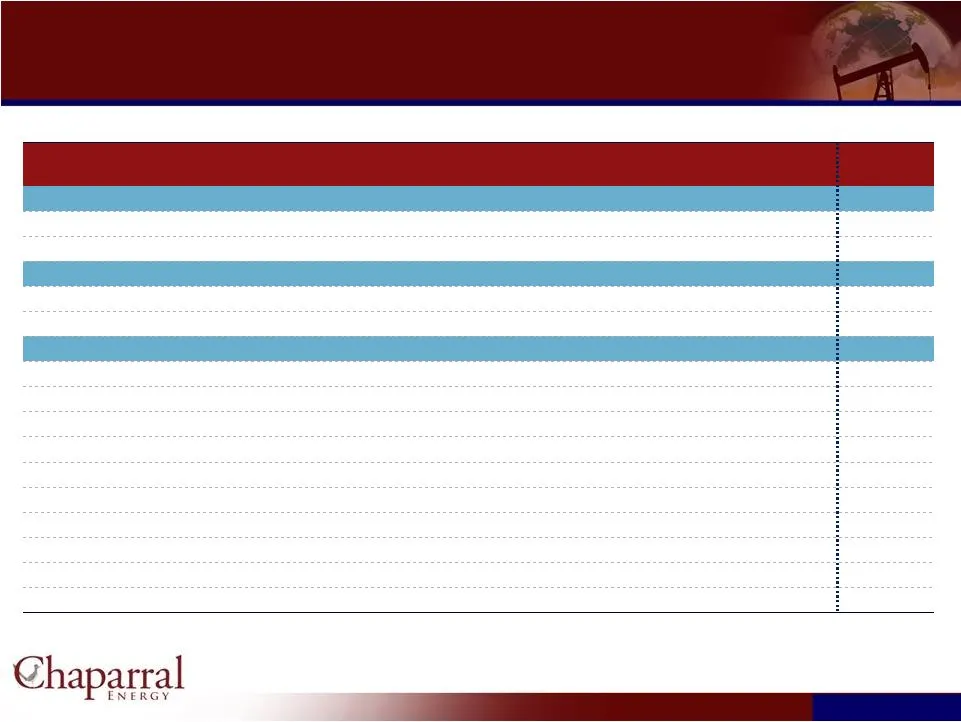
41 Financial Summary 2009 2010 2011 3Q 2012 Price Production (MMBoe) 7.6 8.1 8.7 2.4 Financial Data ($mm) Financial Summary Oil & NGL – Wellhead ($/Bbl) $55.04 $74.53 $87.52 $76.13 Gas – Wellhead ($/Mcf) $3.51 $4.36 $4.08 $2.82 Oil & NGL (MMBbls) 3.9 4.0 5.0 1.5 Gas (Bcf) 22.6 23.7 21.6 5.2 Operatin
Slide 42: Financial Metrics per Boe
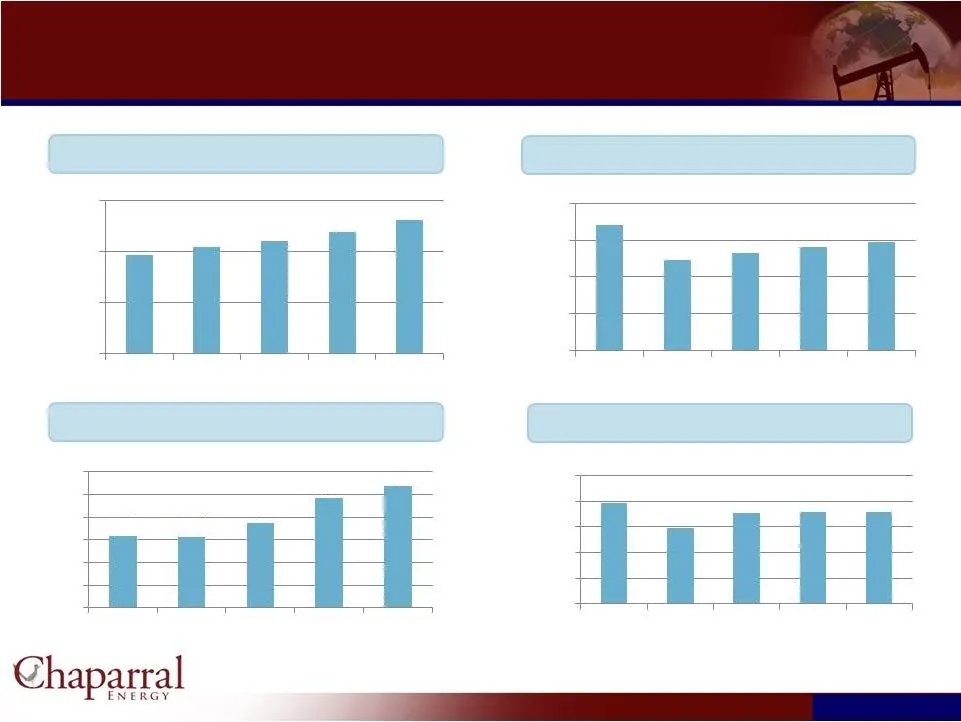
Financial Metrics per Boe 42 Financial Metrics per Boe Production (Boe) / Day LOE / Boe EBITDA / Boe G&A / Boe 19,323 20,926 22,055 23,713 26,098 10,000 20,000 30,000 3Q, 2012 $17.04 $12.32 $13.18 $14.03 $14.69 $0 $5 $10 $15 $20 3Q, 2012 $3.16 $3.11 $3.72 $4.86 $5.36 3Q, 2012 $39.43 $29.47 $35.56 $3
Slide 43: Operating Statistics: 2011 Results and 2012 Guidance
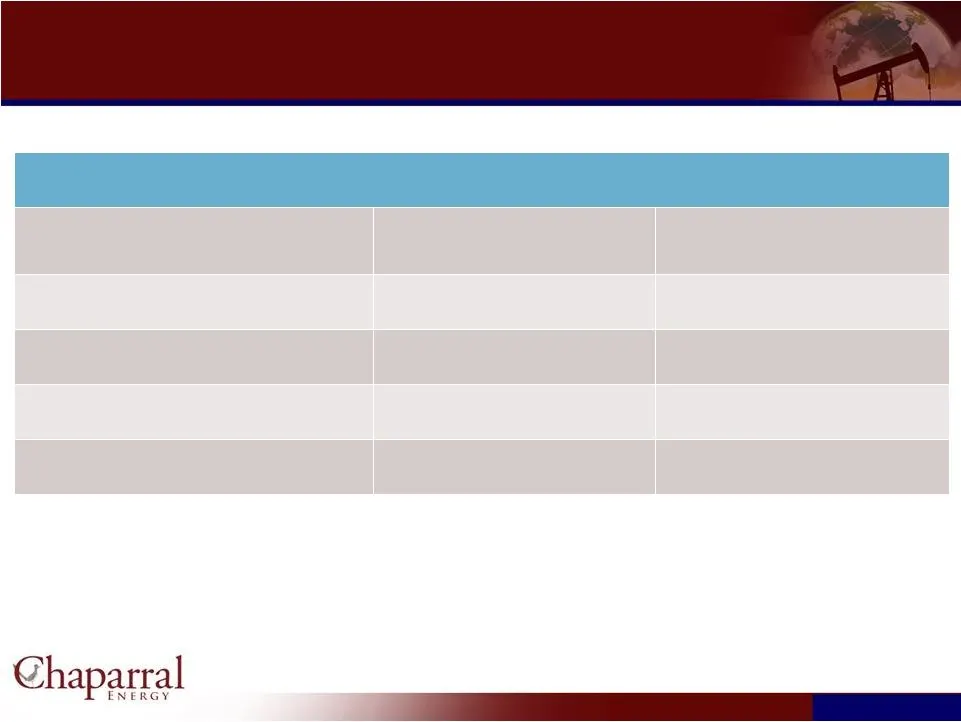
Operating Statistics 2011 Results and 2012 Guidance 43 2011 Results Guidance Capital Expenditures $336 million $460 million Production 8.7 MMBoe 8.8 - 9.0 MMBoe General and Administrative $4.86/Boe $5.75 - $6.25/Boe Lease Operating Expense $14.03/Boe $14.25 - $14.75/Boe 2011 Results and 2012 Guidanc
Slide 44: Hedge Portfolio
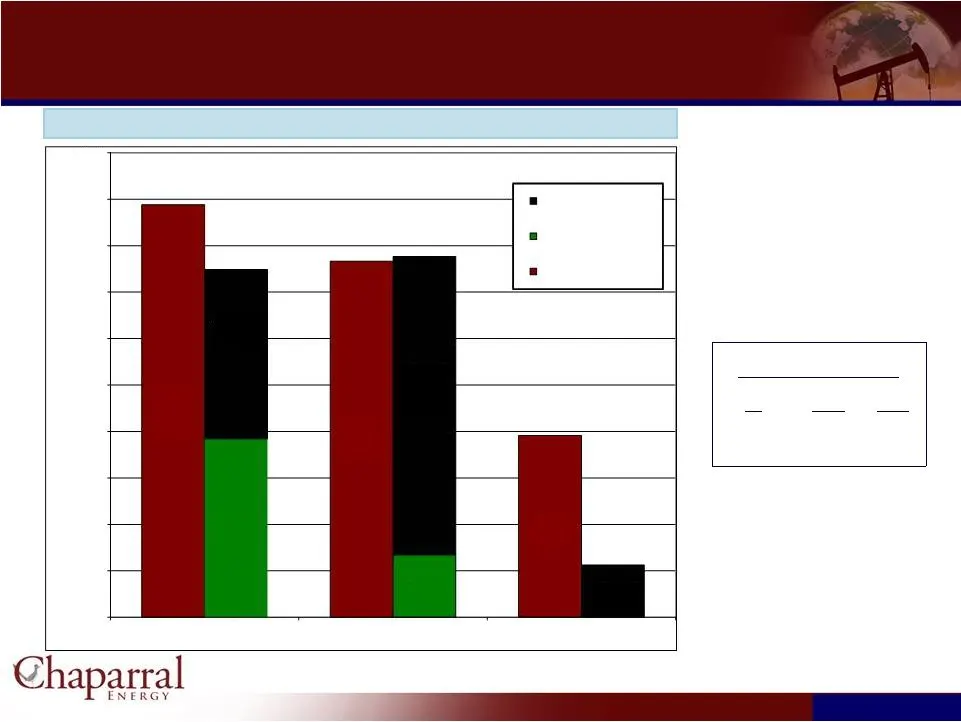
44 Hedge Portfolio $4.44 $4.31 $3.95 $94.45 $98.48 $ 108.79 $96.28 $73.85 $ 114.26 $99.94 $77.88 $ 105.43 $93.49 $76.67 % of Total Proved Reserves Hedged (as of November 23, 2012) Note: Dollars represent average strike price of hedges (includes all derivative instruments) Gas Basis Hedges YR Price %
Slide 45: Question & Answer
Question & Answer 45 Question & Answer
Source: SEC EDGAR · 8-K filed Dec 5, 2012
More decks from Chaparral Energy Inc
 Debt Investor Presentation (August 2020)10 slides · Aug 17, 2020
 Q1 2020 Earnings Presentation26 slides · May 12, 2020
 Investor Presentation (March 2020)30 slides · Mar 12, 2020
 Q3 2019 Earnings Presentation31 slides · Nov 12, 2019
 Q2 2019 Earnings Presentation33 slides · Aug 8, 2019
 Investor Presentation (May 2019)41 slides · May 28, 2019