Farmers National Banc Corp. · NASDAQ:FMNB
Farmers National Banc — Q4 2023 Earnings Presentation
21 slides from Farmers National Banc's earnings presentation, January 2024
Slide 1: Q4 2023 Investor Presentation
Q4 2023 Investor Presentation NASDAQ: FMNB
Slide 2: Disclosure Statement
Disclosure Statement Forward-Looking Statements This presentation contains forward-looking statements within the meaning of the Private Securities Litigation Reform Act of 1995, including statements about the financial condition, results of operations, asset quality trends and profitability of Farm
Slide 3: About Farmers National Banc Corp.
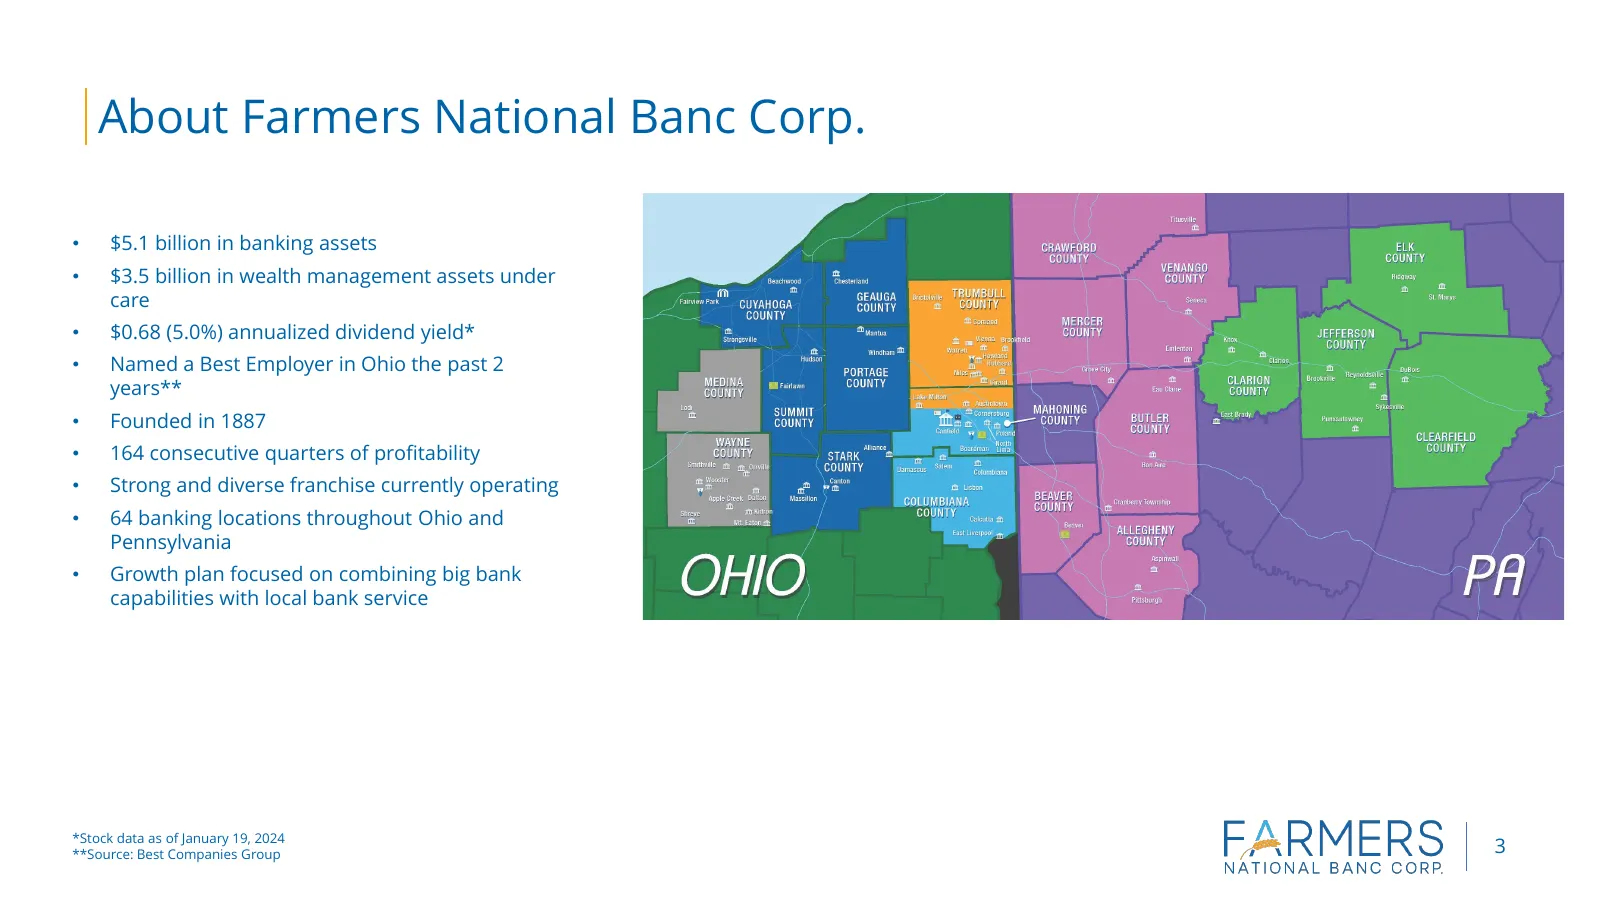
About Farmers National Banc Corp. • $5.1 billion in banking assets • $3.5 billion in wealth management assets under care • $0.68 (5.0%) annualized dividend yield* • Named a Best Employer in Ohio the past 2 years** • Founded in 1887 • 164 consecutive quarters of profitability • Strong and diverse fra
Slide 4: Local, Established & Experienced Leadership Team
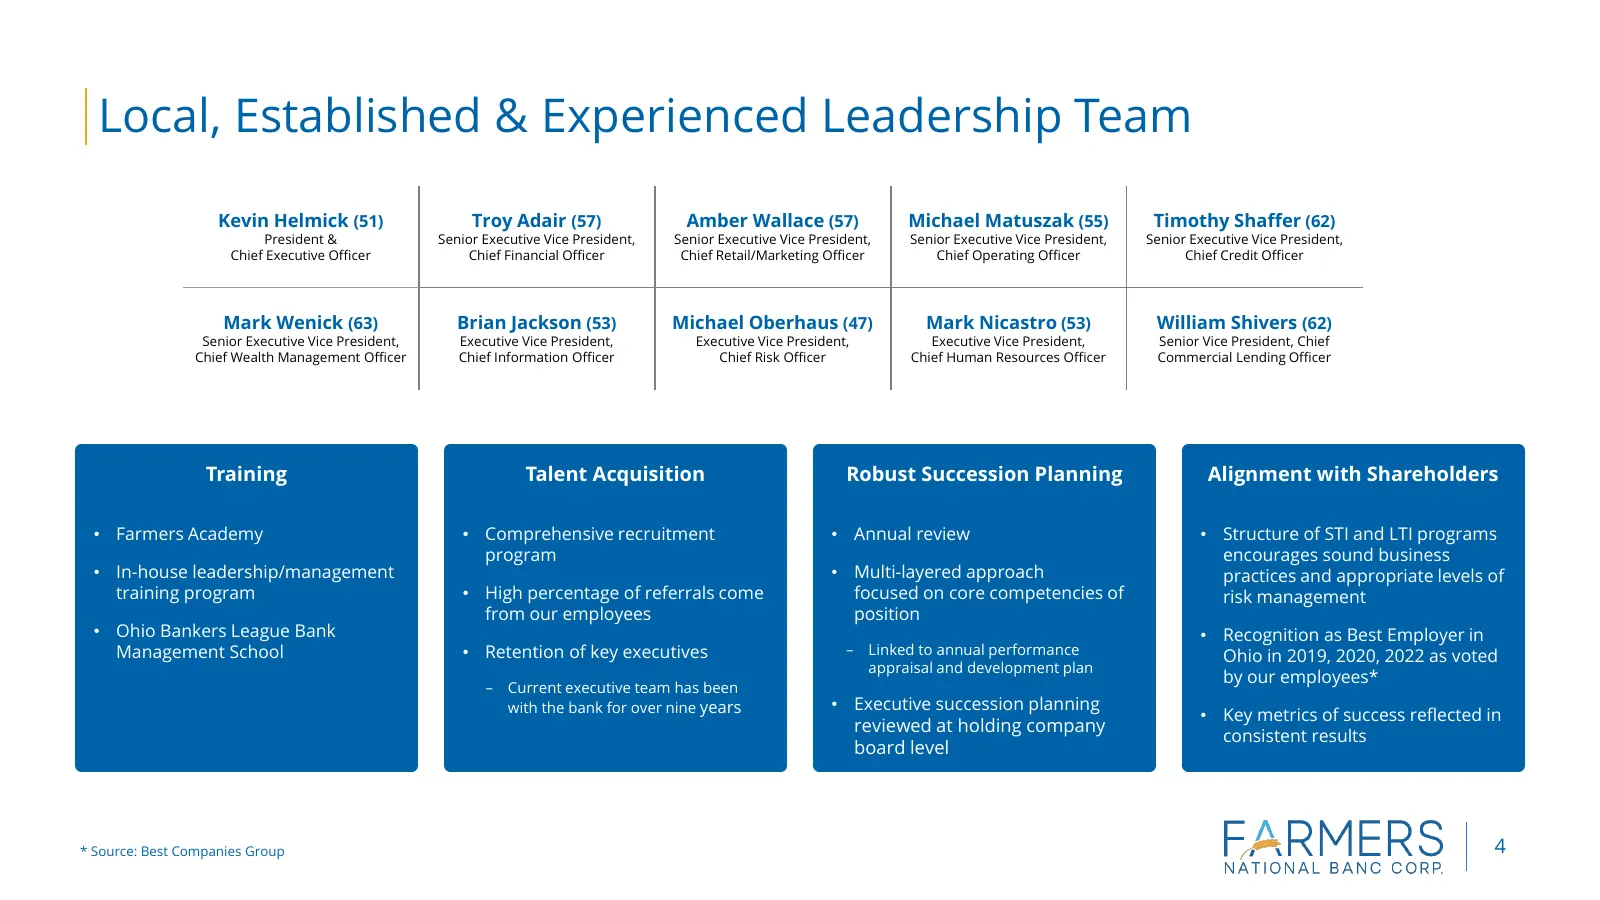
Local, Established & Experienced Leadership Team Kevin Helmick (51) Troy Adair (57) Amber Wallace (57) Michael Matuszak (55) Timothy Shaffer (62) President & Senior Executive Vice President, Senior Executive Vice President, Senior Executive Vice President, Senior Executive Vice President, Chief Exec
Slide 5: Farmers Strategic Vision
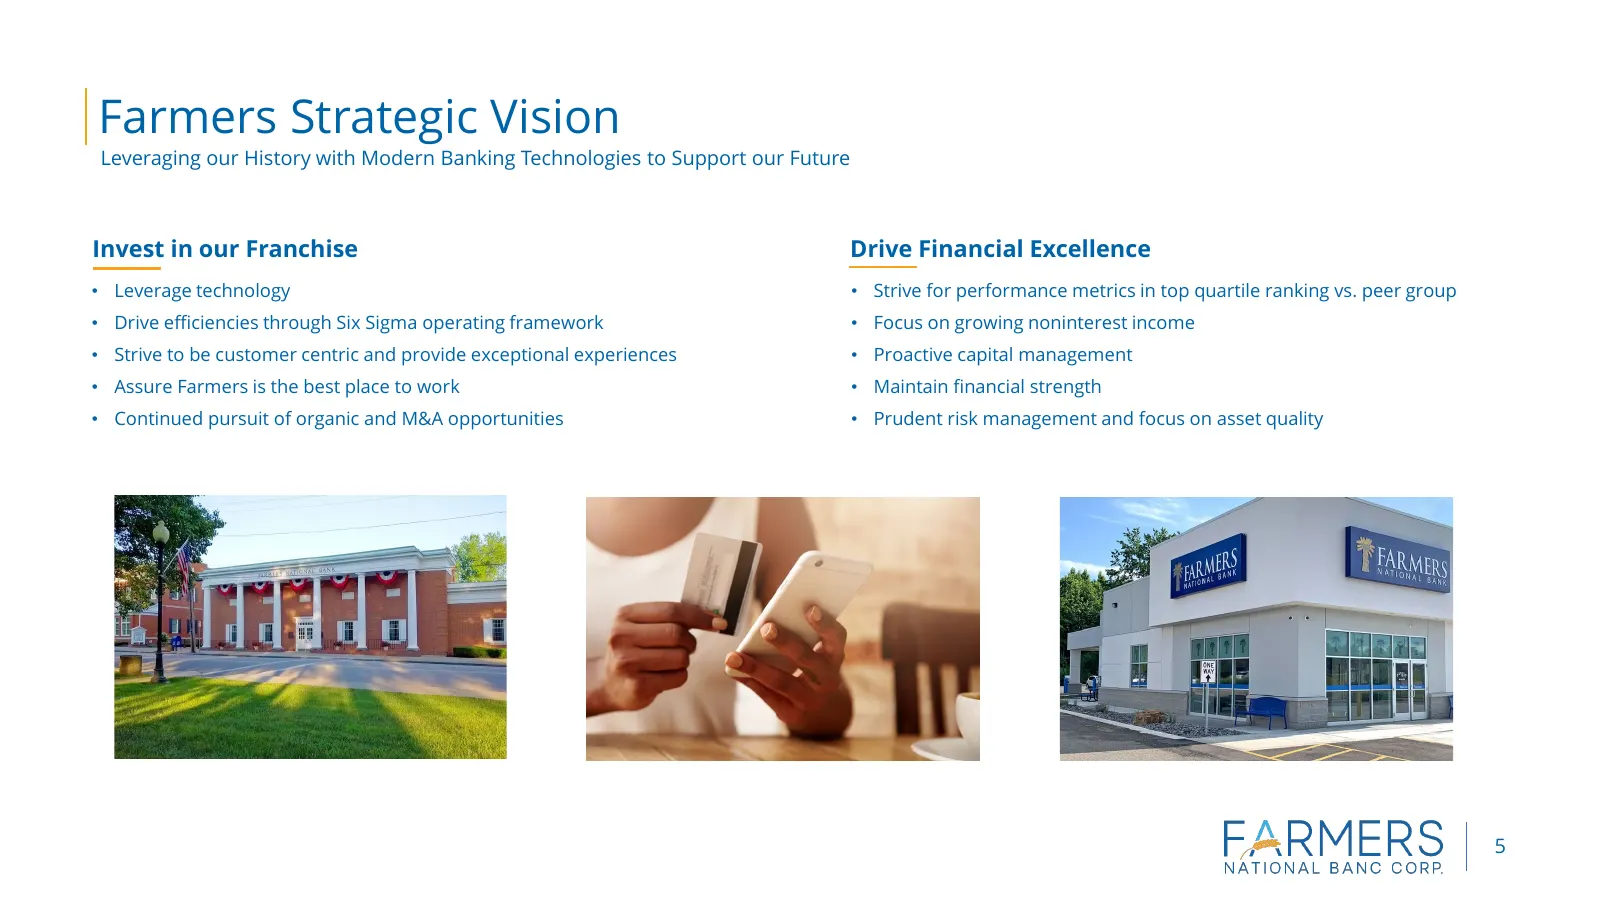
Farmers Strategic Vision Leveraging our History with Modern Banking Technologies to Support our Future Invest in our Franchise Drive Financial Excellence • Leverage technology • Strive for performance metrics in top quartile ranking vs. peer group • Drive efficiencies through Six Sigma operating fra
Slide 6: Proven Acquisition History and Strategy
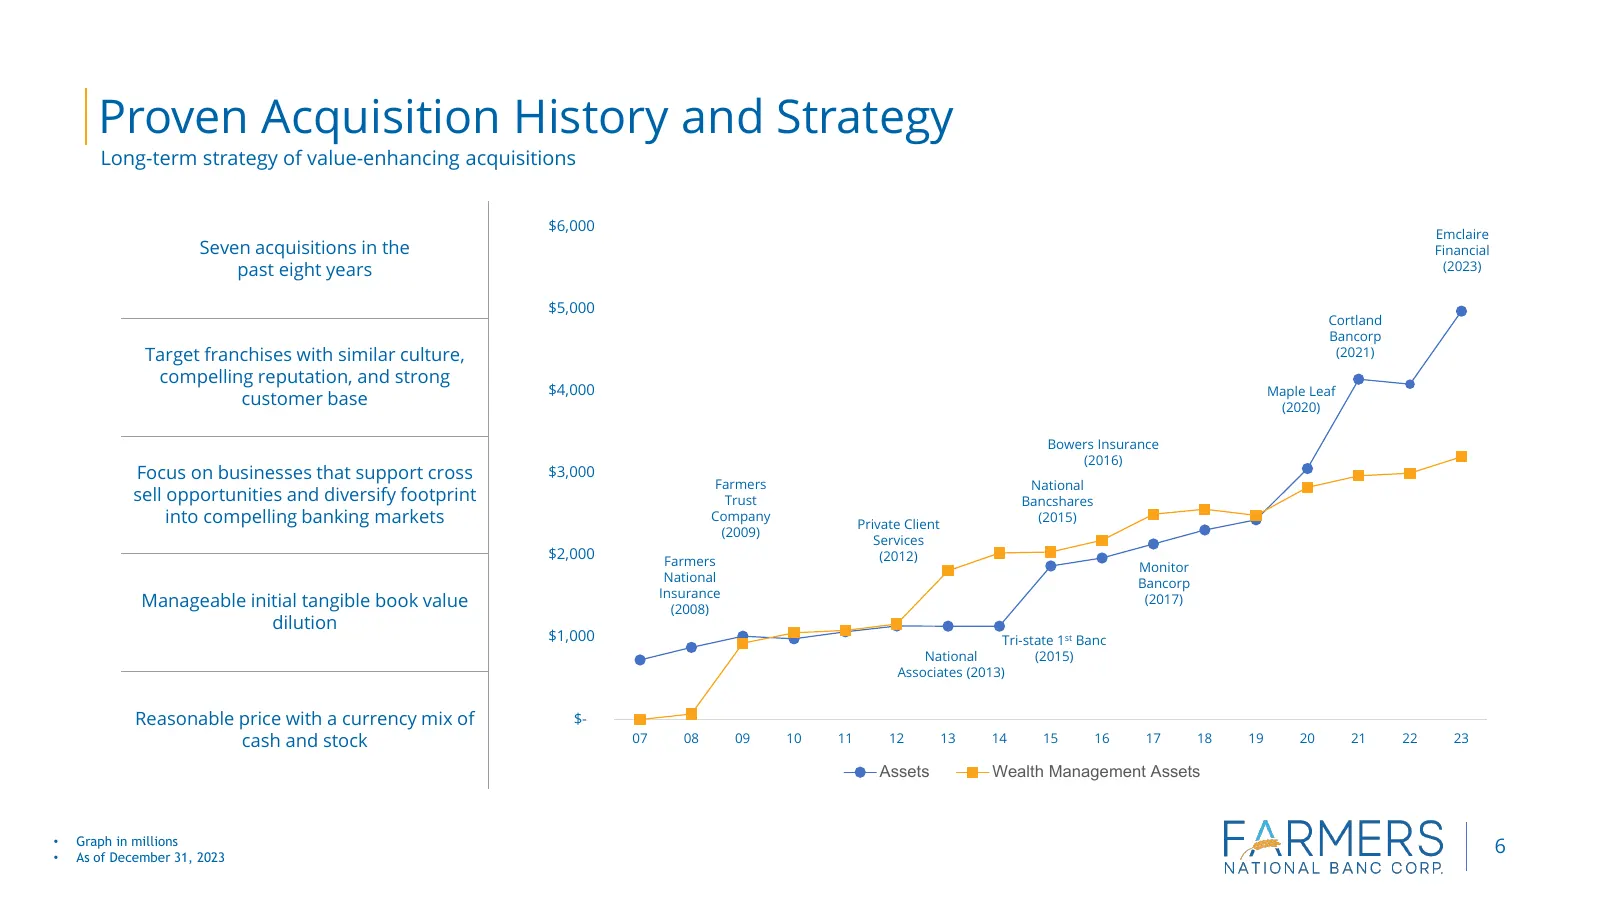
Proven Acquisition History and Strategy Long-term strategy of value-enhancing acquisitions $6,000 Emclaire Seven acquisitions in the Financial past eight years (2023) $5,000 Cortland Bancorp Target franchises with similar culture, (2021) compelling reputation, and strong $4,000 Maple Leaf customer b

Slide 7: Financial Performance
Financial Performance NASDAQ: FMNB
Slide 8: Balance Sheet Strengths
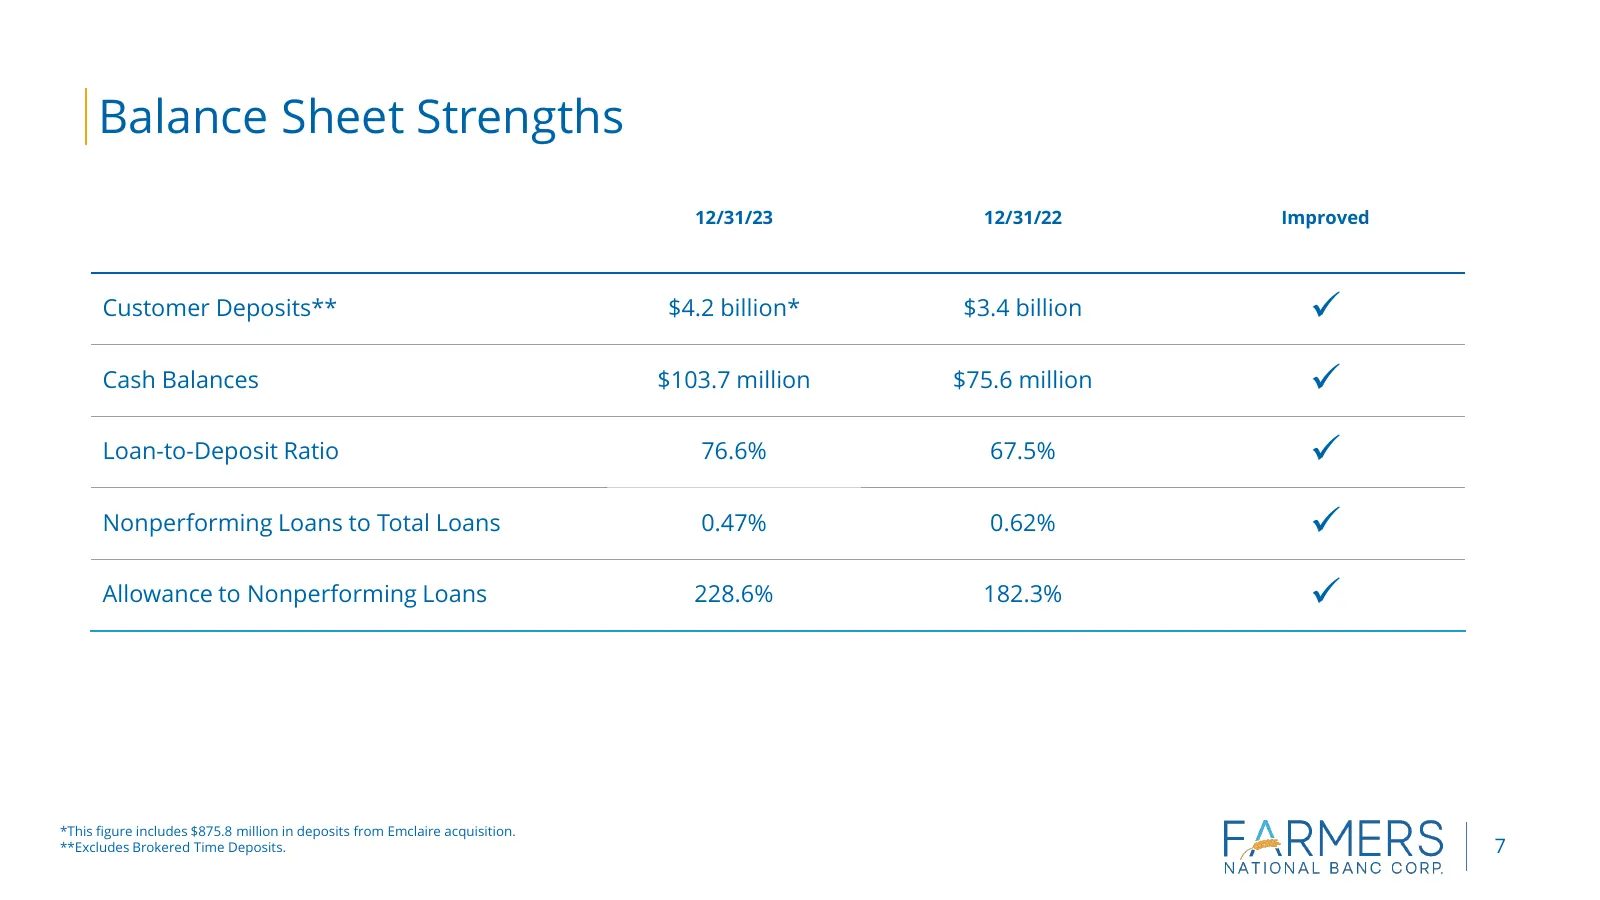
Balance Sheet Strengths (1) 12/31/23 12/31/22 Improved Customer Deposits** $4.2 billion* $3.4 billion Cash Balances $103.7 million $75.6 million (1) Loan-to-Deposit Ratio 76.6% 67.5% Nonperforming Loans to Total Loans 0.47% 0.62% Allowance to Nonperforming Loans 228.6% 182.3% *This figure
Slide 9: Core Results
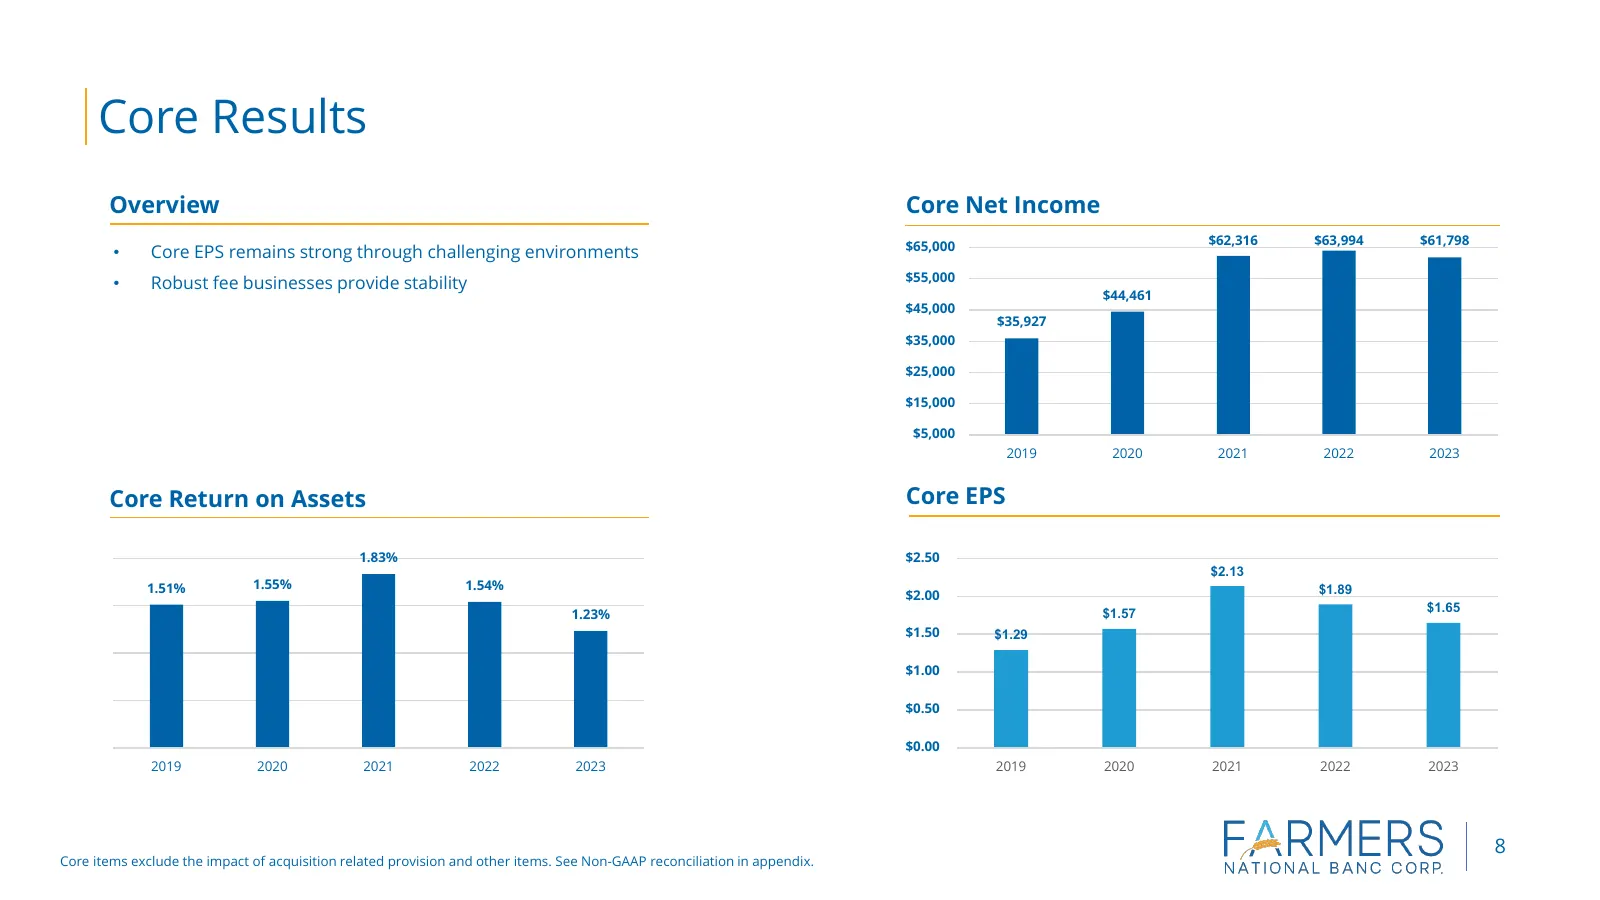
Core Results Overview Core Net Income $65,000 $62,316 $63,994 $61,798 • Core EPS remains strong through challenging environments $55,000 • Robust fee businesses provide stability $44,461 $45,000 $35,927 $35,000 $25,000 $15,000 $5,000 2019 2020 2021 2022 2023 Core Return on Assets Core EPS 1.83% $2.5
Slide 10: Loan Portfolio Overview
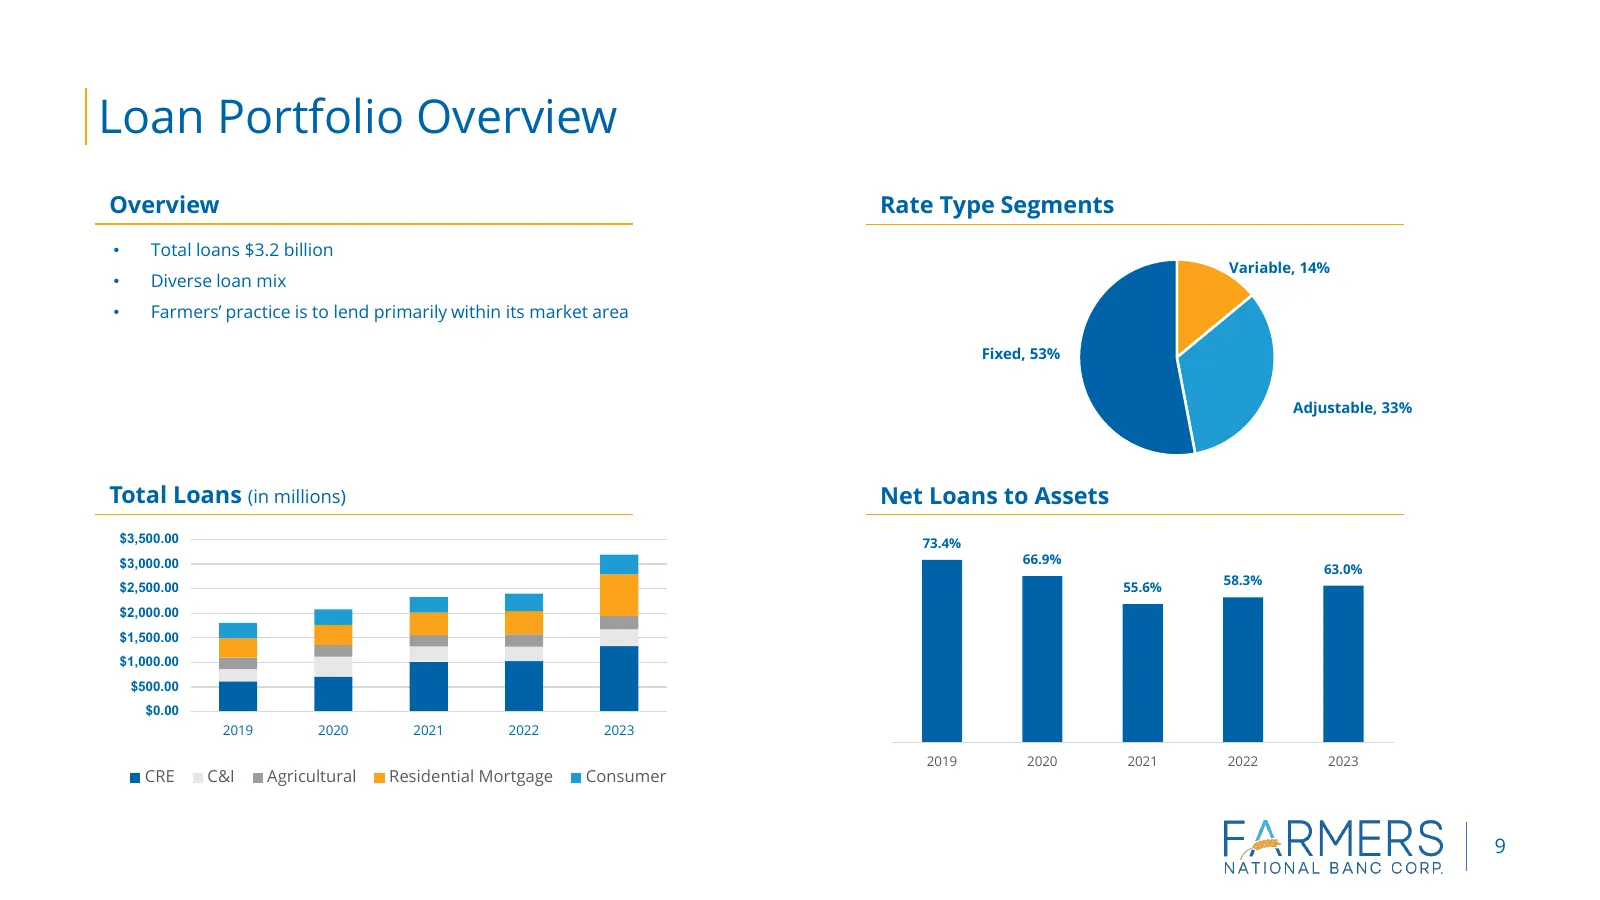
Loan Portfolio Overview Overview Rate Type Segments • Total loans $3.2 billion Variable, 14% • Diverse loan mix • Farmers’ practice is to lend primarily within its market area Fixed, 53% Adjustable, 33% Total Loans (in millions) Net Loans to Assets $3,500.00 73.4% $3,000.00 66.9% 63.0% 58.3% $2,500.
Slide 11: CRE
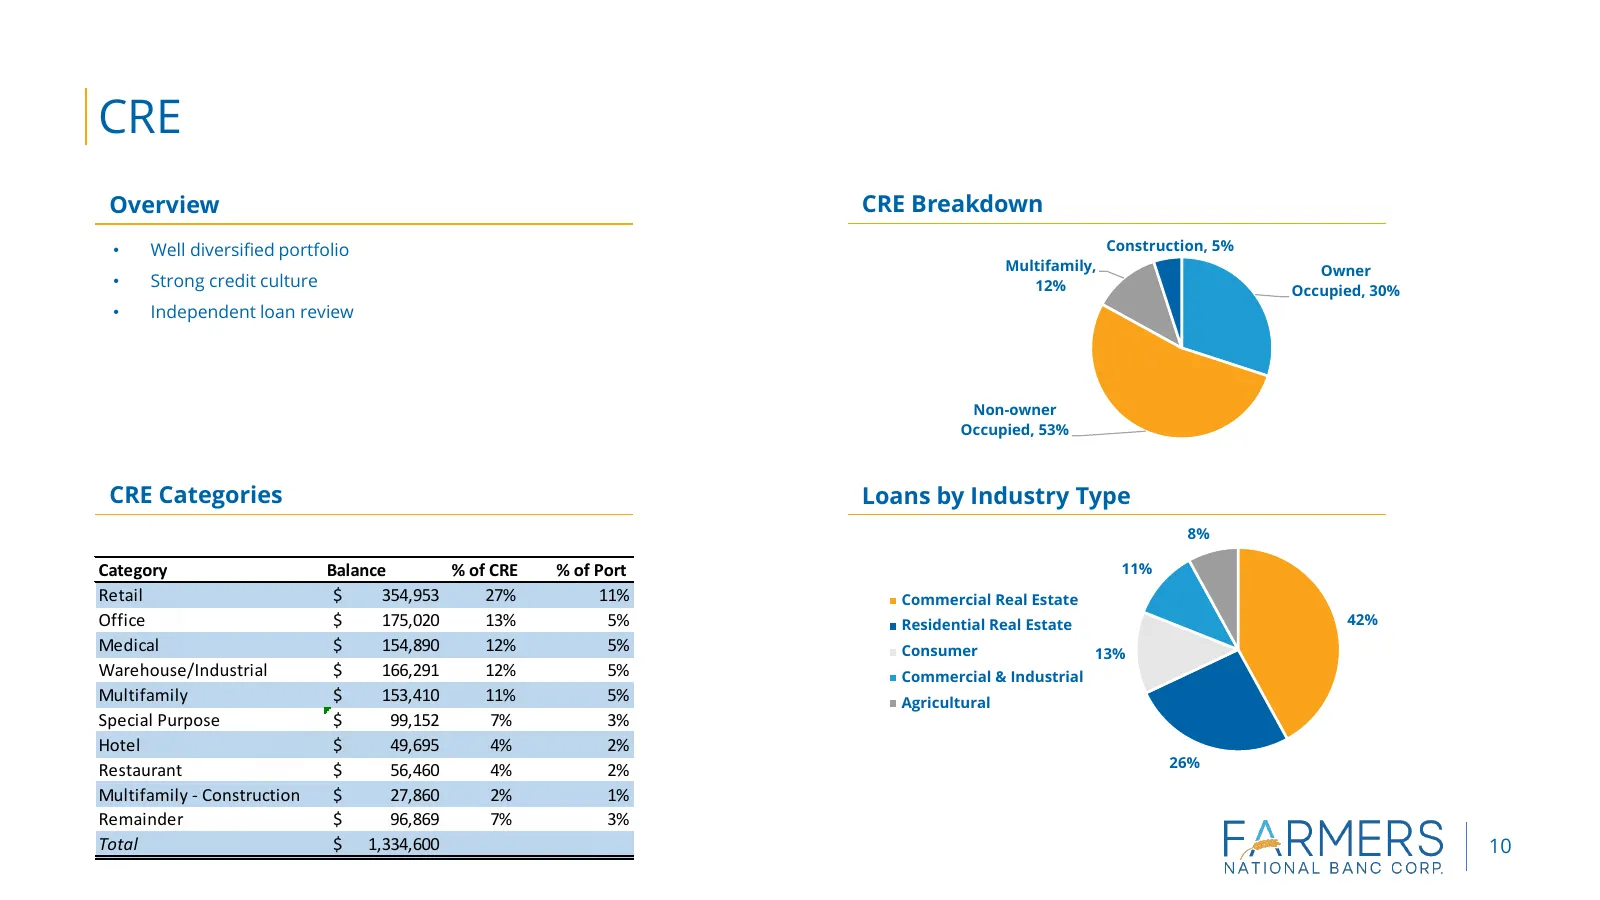
CRE Overview CRE Breakdown • Well diversified portfolio Construction, 5% Multifamily, Owner • Strong credit culture 12% Occupied, 30% • Independent loan review Non-owner Occupied, 53% CRE Categories Loans by Industry Type 8% Category Balance % of CRE % of Port 11% Retail $ 354,953 27% 11% Commercial
Slide 12: Asset Quality Trends
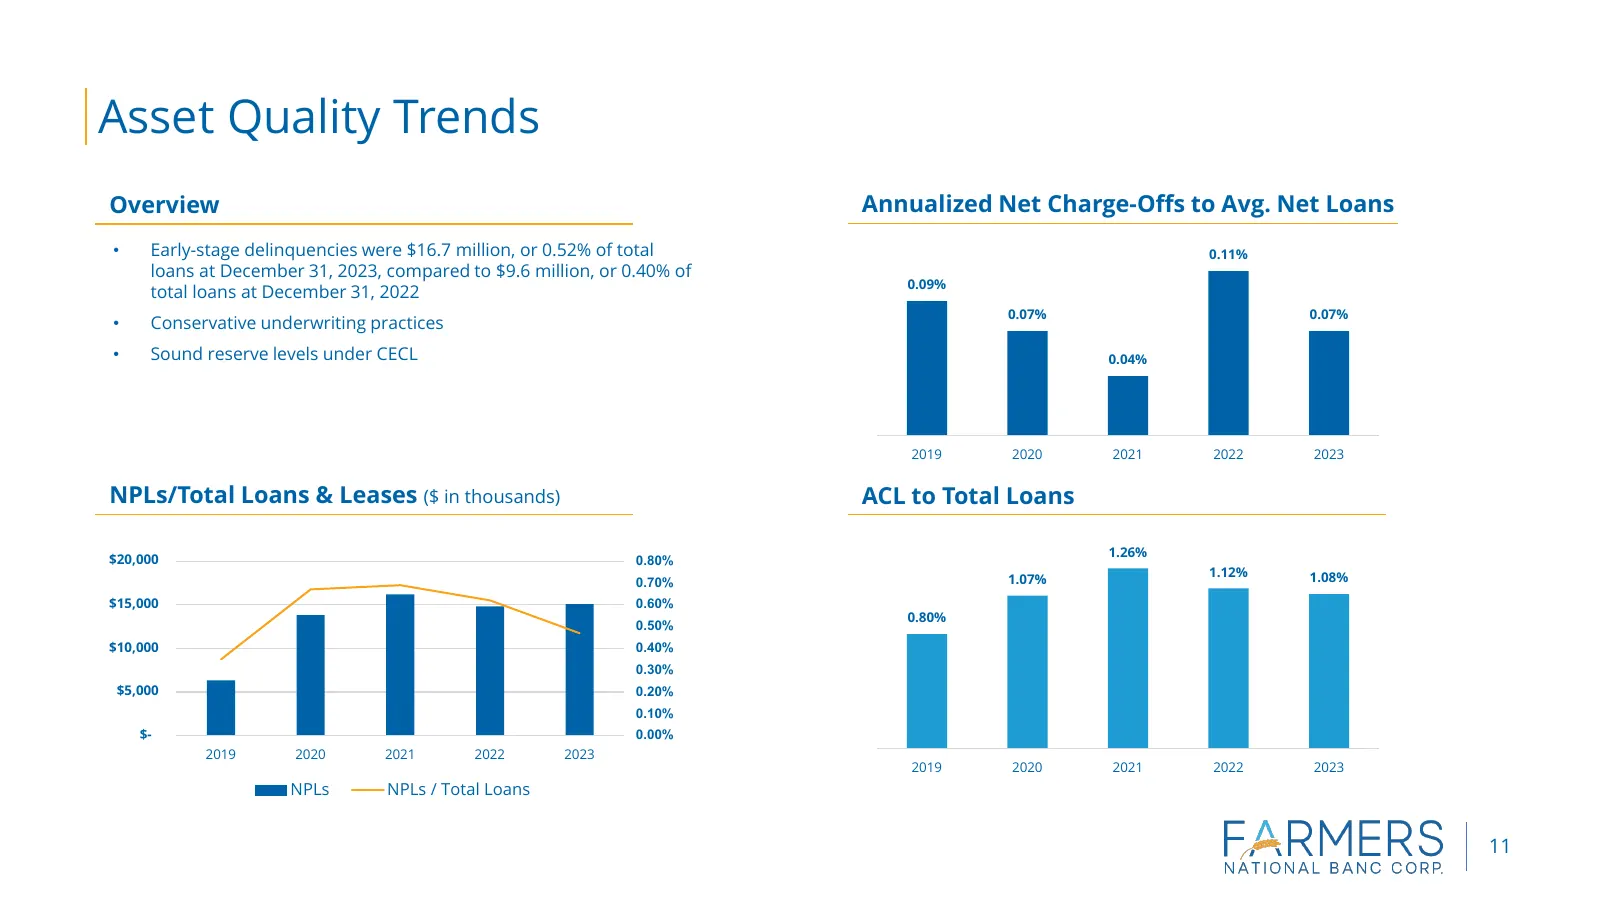
Asset Quality Trends Overview Annualized Net Charge-Offs to Avg. Net Loans • Early-stage delinquencies were $16.7 million, or 0.52% of total 0.11% loans at December 31, 2023, compared to $9.6 million, or 0.40% of 0.09% total loans at December 31, 2022 0.07% 0.07% • Conservative underwriting practice
Slide 13: Securities Portfolio
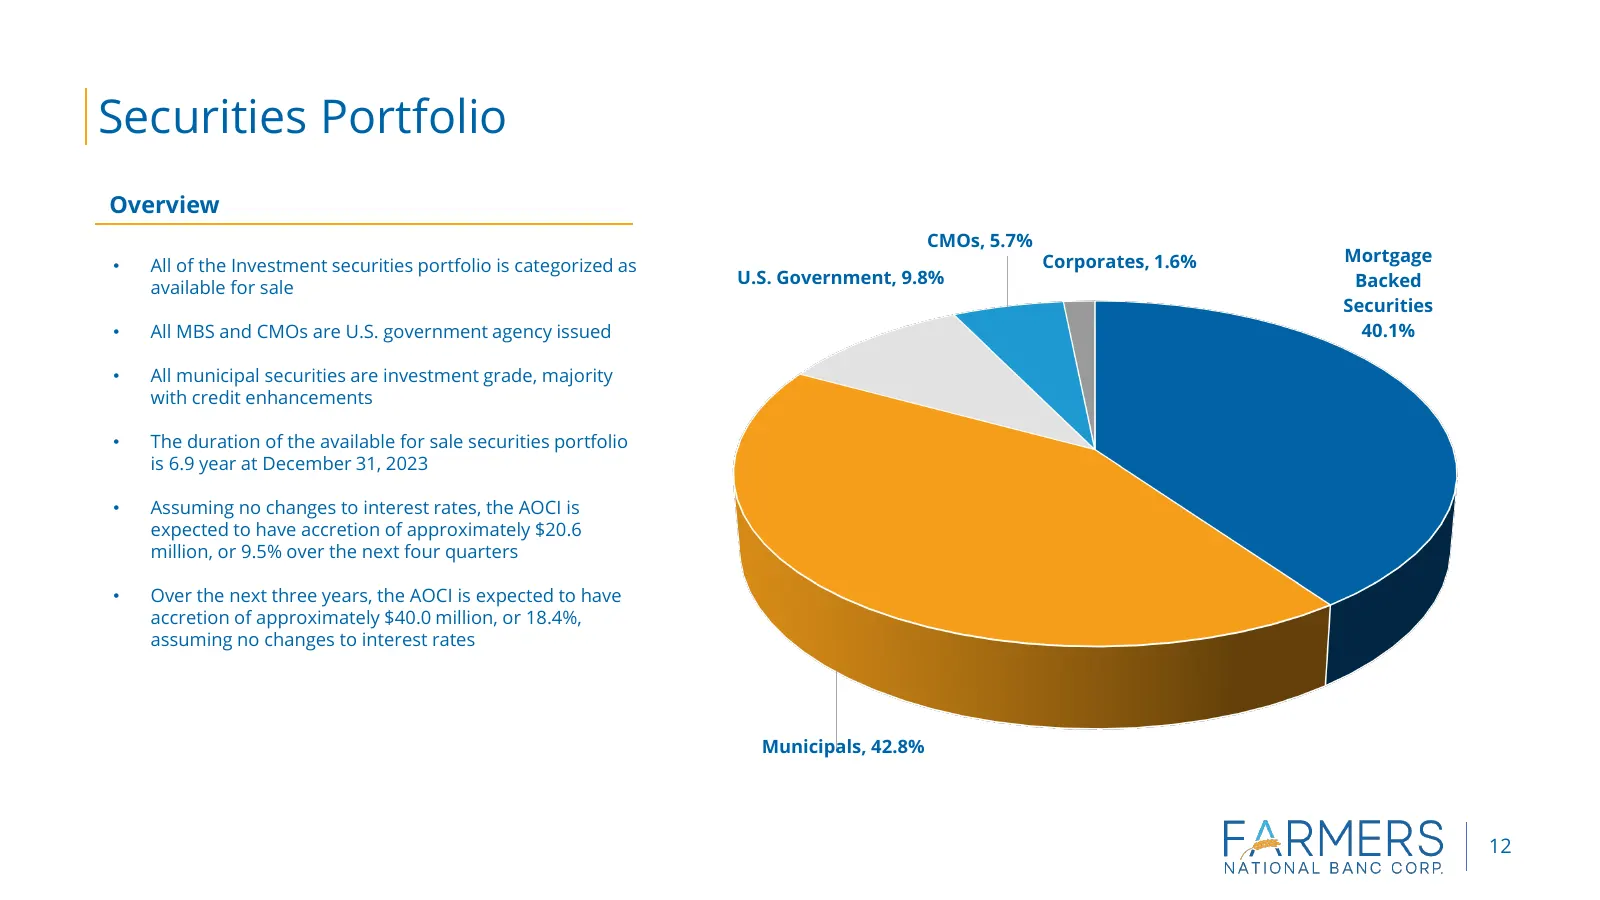
Securities Portfolio Overview CMOs, 5.7% Corporates, 1.6% Mortgage • All of the Investment securities portfolio is categorized as U.S. Government, 9.8% Backed available for sale Securities • All MBS and CMOs are U.S. government agency issued 40.1% • All municipal securities are investment grade, maj
Slide 14: Deposit Trends
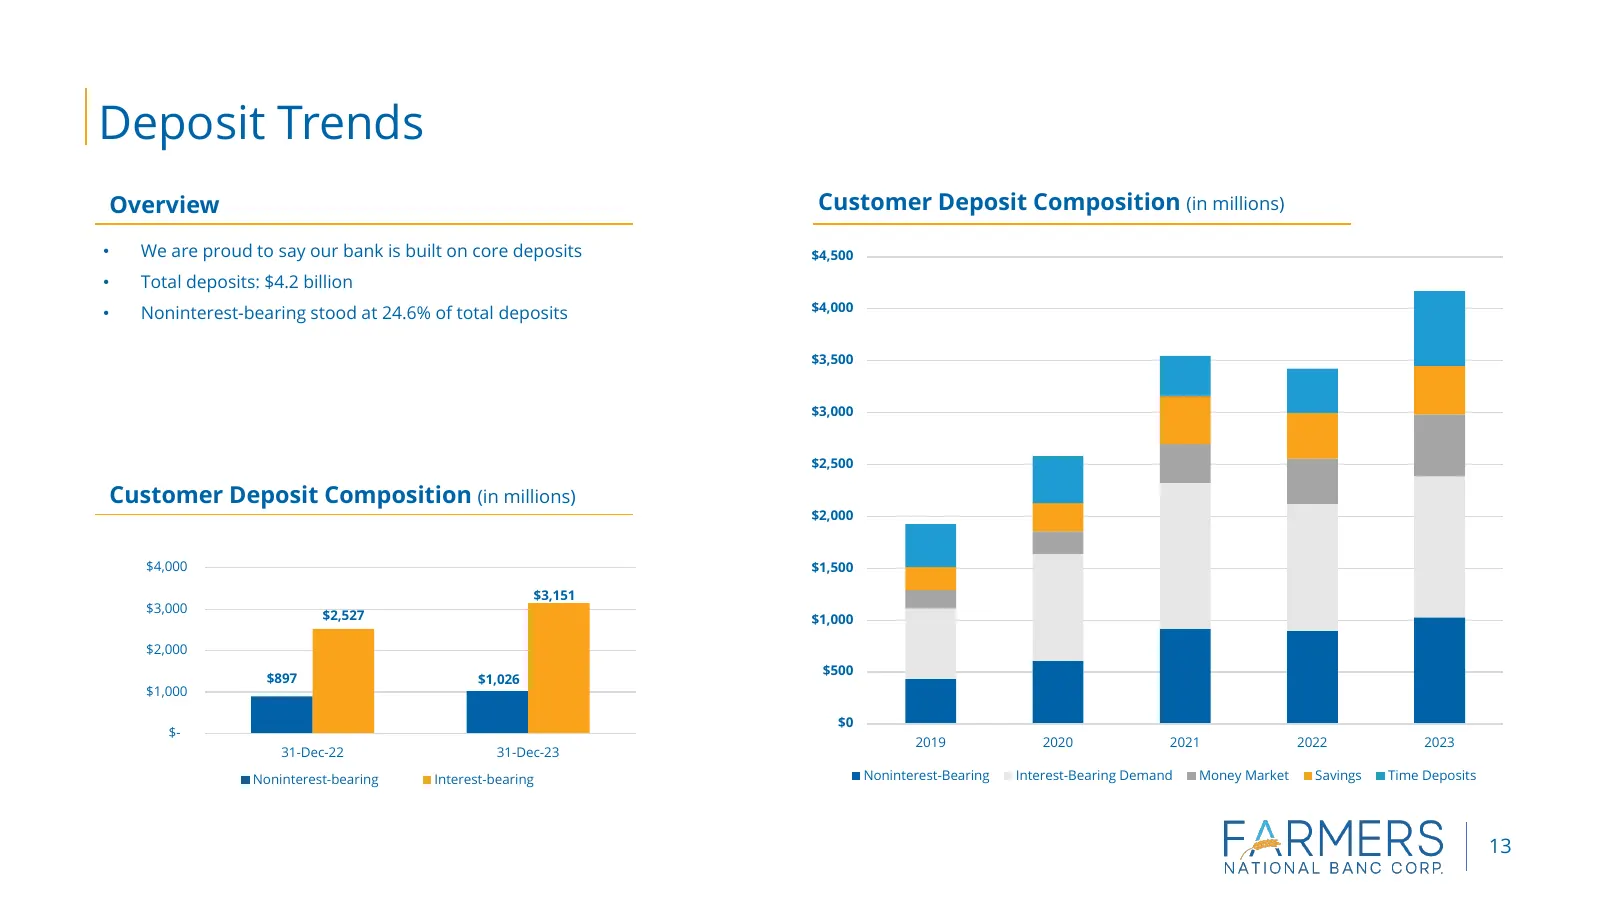
Deposit Trends Overview Customer Deposit Composition (in millions) • We are proud to say our bank is built on core deposits $4,500 • Total deposits: $4.2 billion $4,000 • Noninterest-bearing stood at 24.6% of total deposits $3,500 $3,000 $2,500 Customer Deposit Composition (in millions) $2,000 $4,00
Slide 15: Liquidity
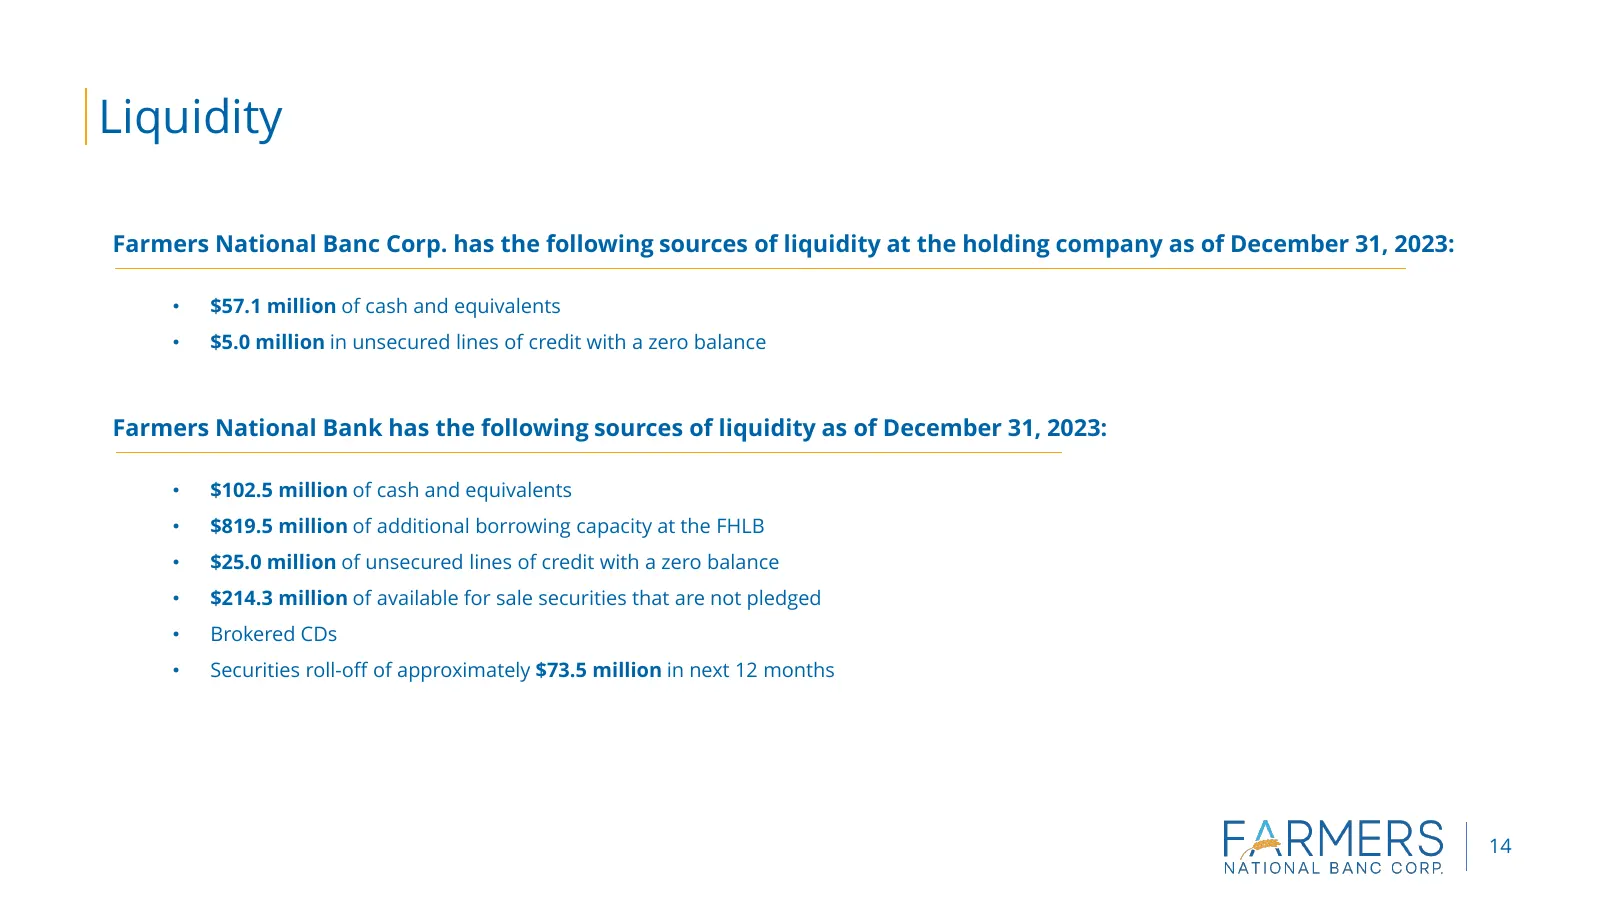
Liquidity Farmers National Banc Corp. has the following sources of liquidity at the holding company as of December 31, 2023: • $57.1 million of cash and equivalents • $5.0 million in unsecured lines of credit with a zero balance Farmers National Bank has the following sources of liquidity as of Dece
Slide 16: Net Interest Income and NIM Trends
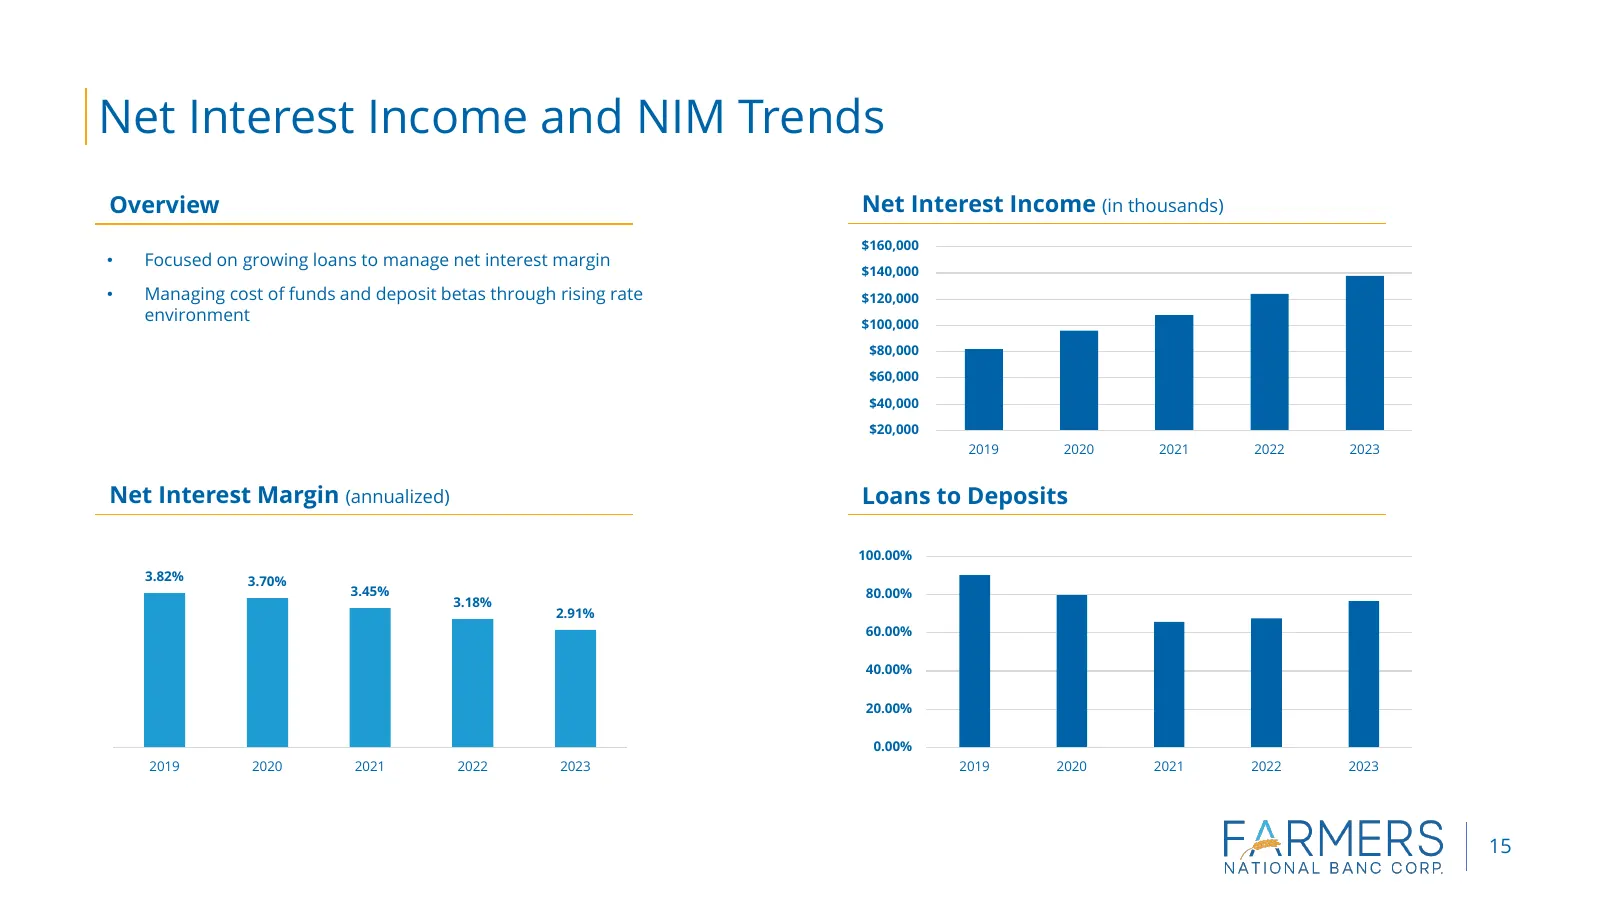
Net Interest Income and NIM Trends Overview Net Interest Income (in thousands) $160,000 • Focused on growing loans to manage net interest margin $140,000 • Managing cost of funds and deposit betas through rising rate $120,000 environment $100,000 $80,000 $60,000 $40,000 $20,000 2019 2020 2021 2022 2
Slide 17: Noninterest Income Trends
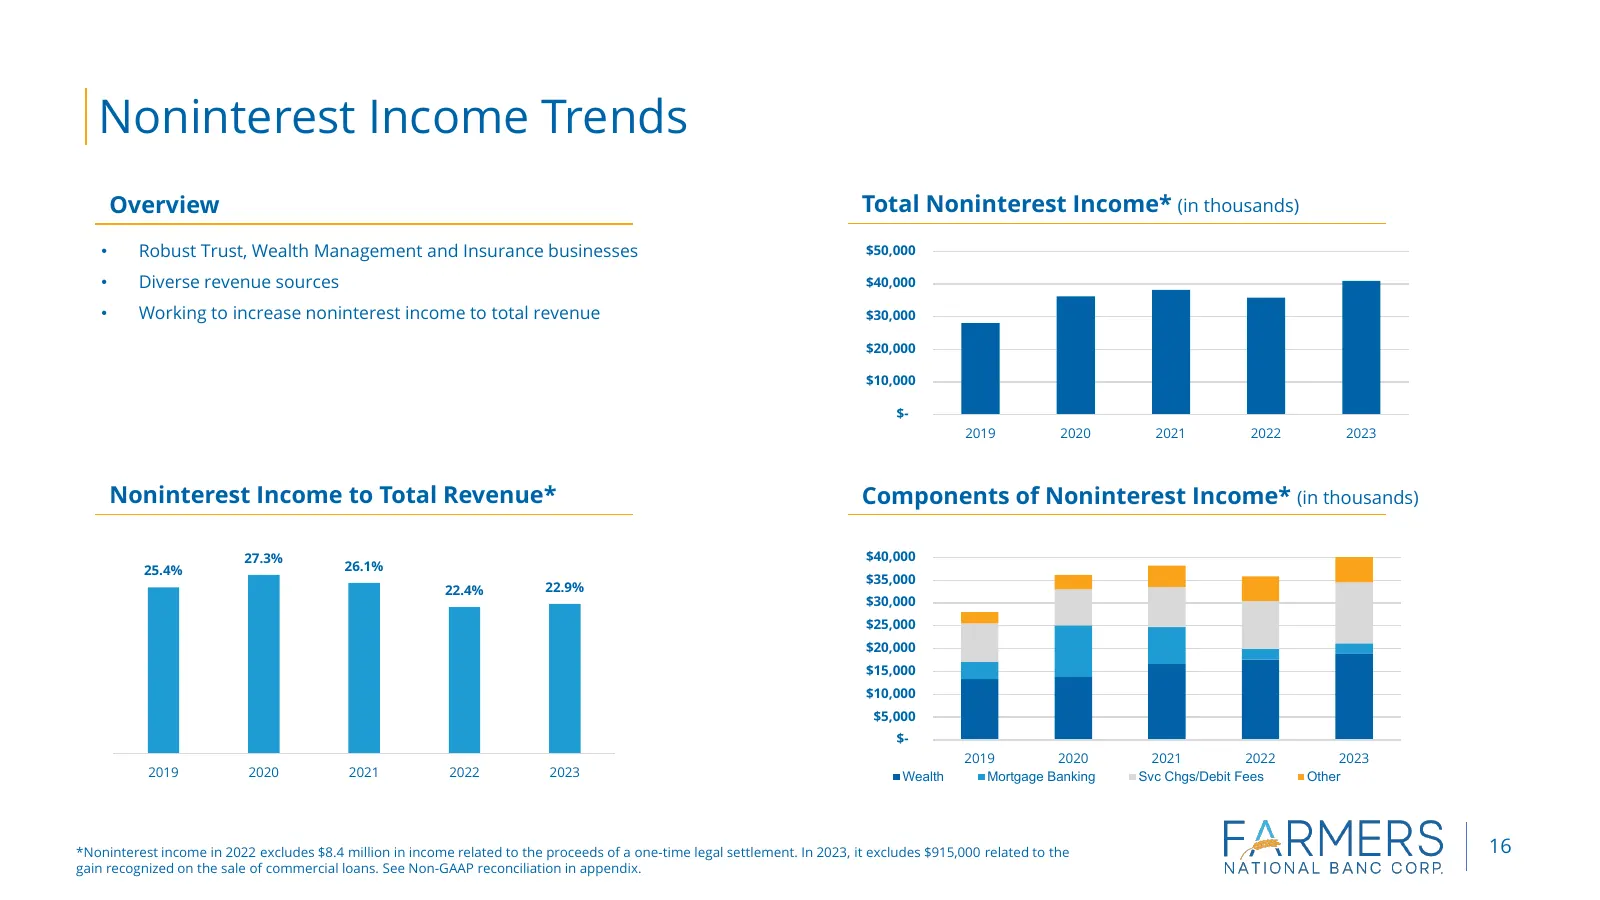
Noninterest Income Trends Overview Total Noninterest Income* (in thousands) • Robust Trust, Wealth Management and Insurance businesses $50,000 • Diverse revenue sources $40,000 • Working to increase noninterest income to total revenue $30,000 $20,000 $10,000 $- 2019 2020 2021 2022 2023 Noninterest I
Slide 18: Noninterest Expense Trends
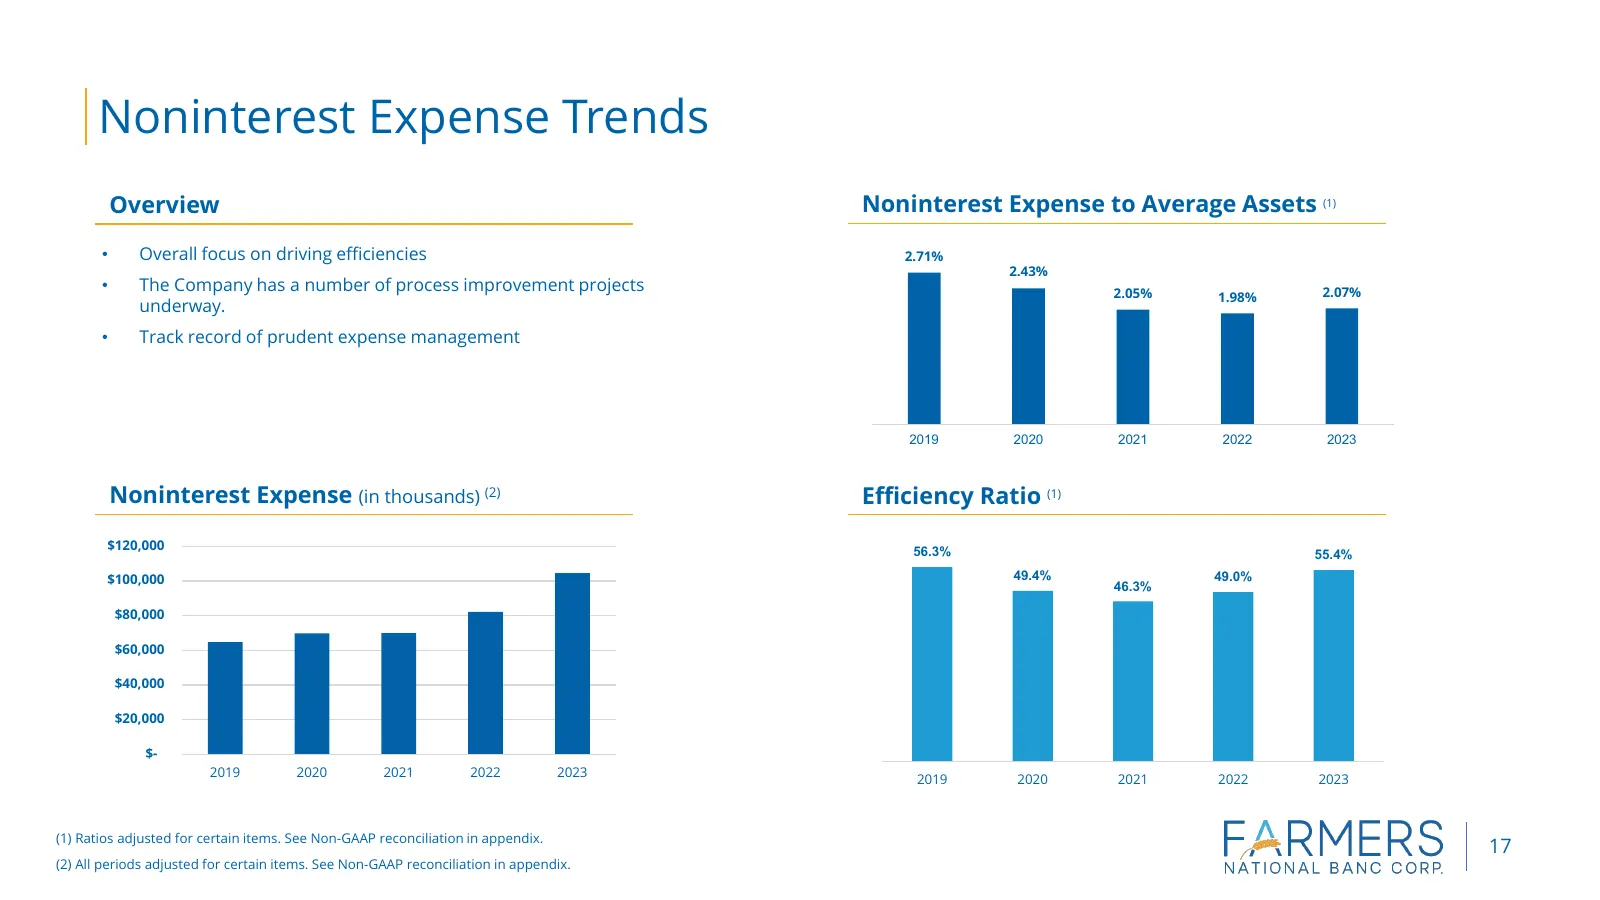
Noninterest Expense Trends 1) Overview Noninterest Expense to Average Assets (1) • Overall focus on driving efficiencies 2.71% 2.43% • The Company has a number of process improvement projects 2.05% 2.07% 1.98% underway. • Track record of prudent expense management 2019 2020 2021 2022 2023 Noninteres
Slide 19: Capital
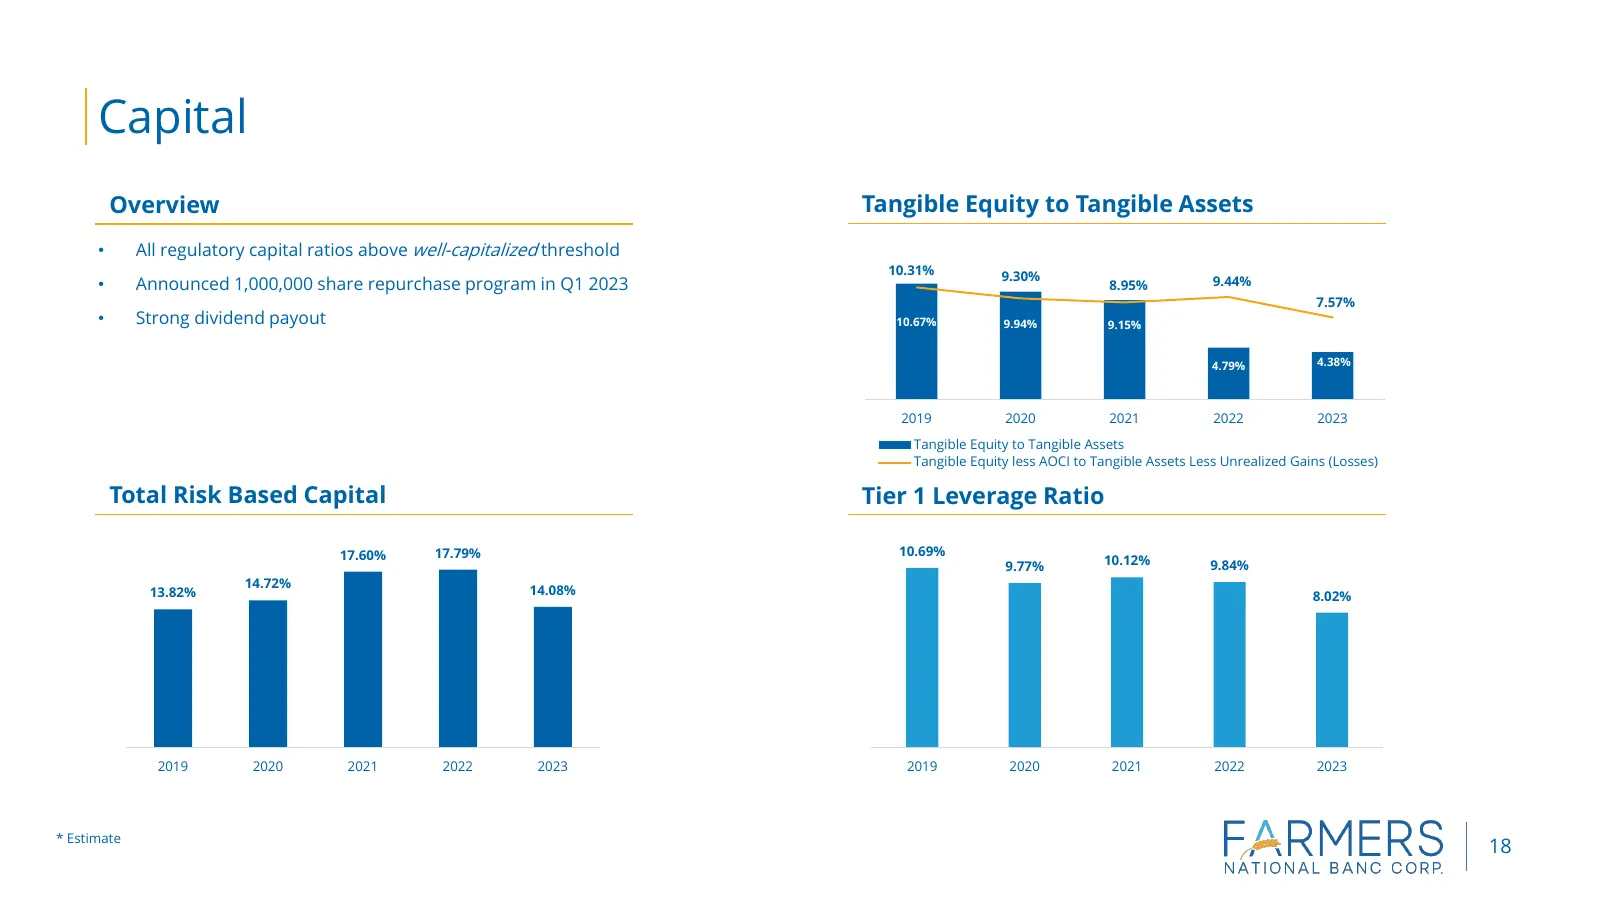
Capital Overview Tangible Equity to Tangible Assets • All regulatory capital ratios above well-capitalized threshold 10.31% 9.30% • Announced 1,000,000 share repurchase program in Q1 2023 8.95% 9.44% 7.57% • Strong dividend payout 10.67% 9.94% 9.15% 4.79% 4.38% 2019 2020 2021 2022 2023 Tangible Equi
Slide 20: Appendix – Non GAAP Reconciliations
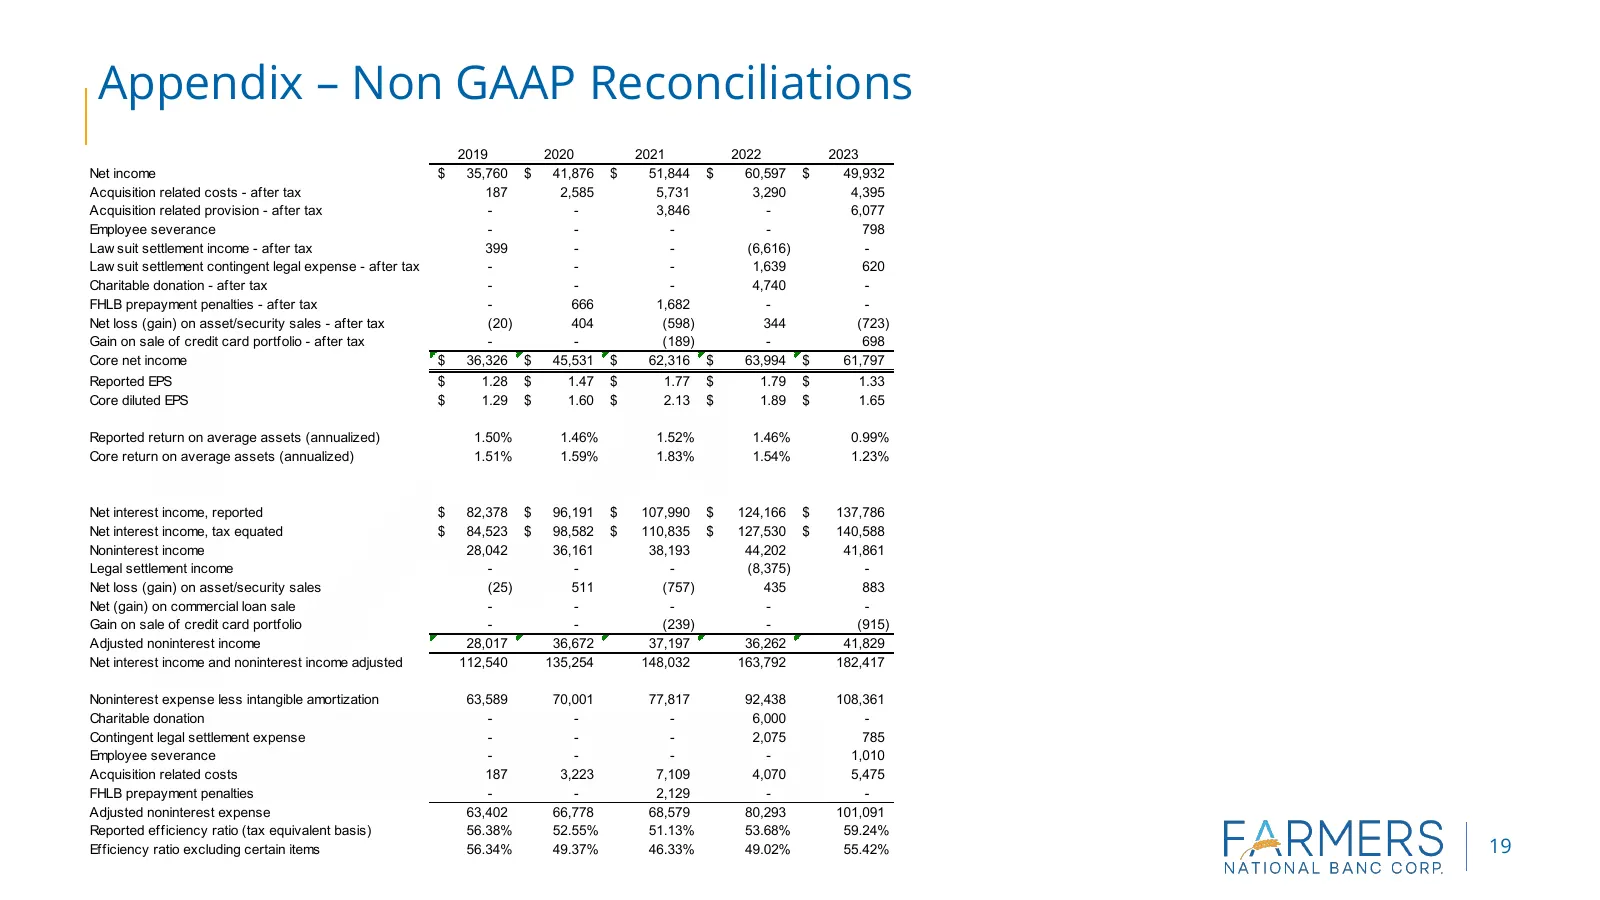
Appendix – Non GAAP Reconciliations 2019 2020 2021 2022 2023 Net income $ 35,760 $ 41,876 $ 51,844 $ 60,597 $ 49,932 Acquisition related costs - after tax 187 2,585 5,731 3,290 4,395 Acquisition related provision - after tax - - 3,846 - 6,077 Employee severance - - - - 798 Law suit settlement income
Slide 21: Appendix – Non GAAP Reconciliations
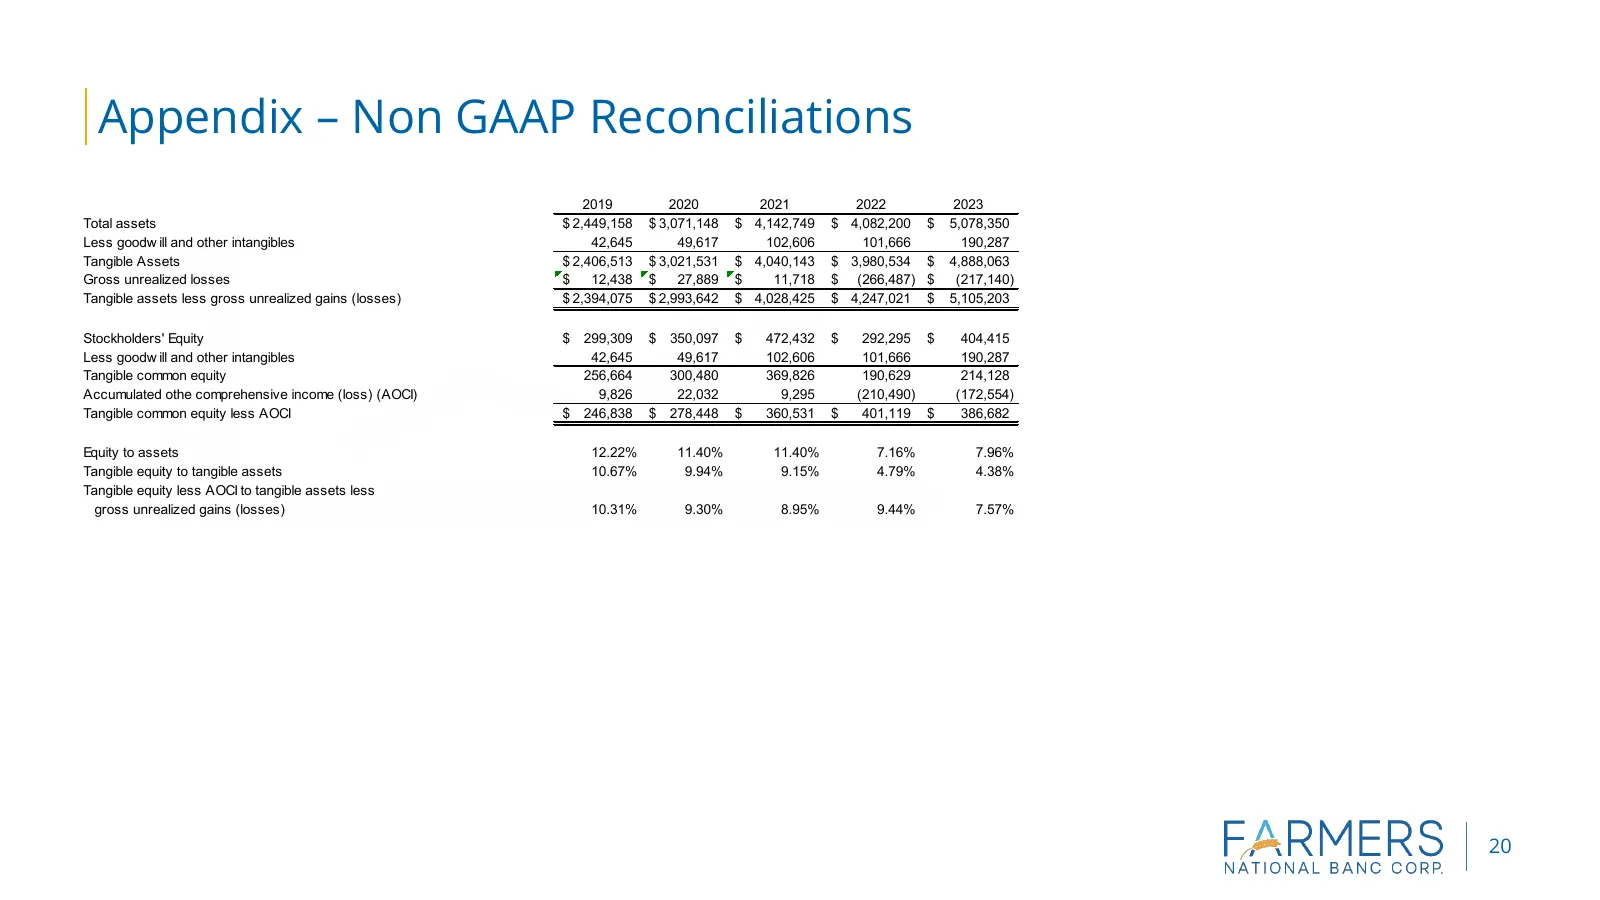
Appendix – Non GAAP Reconciliations 2019 2020 2021 2022 2023 Total assets $ 2,449,158 $ 3,071,148 $ 4,142,749 $ 4,082,200 $ 5,078,350 Less goodw ill and other intangibles 42,645 49,617 102,606 101,666 190,287 Tangible Assets $ 2,406,513 $ 3,021,531 $ 4,040,143 $ 3,980,534 $ 4,888,063 Gross unrealize
Source: company website
More decks from Farmers National Banc Corp.
 Q3 2026 Earnings Presentation20 slides · Oct 28, 2026
 Q2 2026 Earnings Presentation20 slides · Jul 22, 2026
 Q1 2026 Earnings Presentation20 slides · Apr 22, 2026
 Q4 2025 Earnings Presentation20 slides · Jan 28, 2026
 Merger or Acquisition (October 2025)27 slides · Oct 22, 2025
 Q3 2025 Earnings Presentation21 slides · Oct 22, 2025