Tabcorp Holdings Limited · ASX:TAH
Tabcorp — 1H22 Earnings Presentation
36 slides from Tabcorp's earnings presentation, Feb 17, 2022

Slide 1: Half Year Results Presentation for the Six Months Ended 31 December 2021
2021-22 HALF YEAR RESULTS PRESENTATION FOR THE SIX MONTHS ENDED 31 DECEMBER 2021 17 FEBRUARY 2022 ABN 66 063 780 709
Slide 2: Table of Contents
TA B L E O F CONTENTS 03 - 08 Group Overview 10 - 19 Business Results 21 - 22 Capital 24 - 25 Conclusion 27 - 34 Appendices
Slide 3: Executive Summary
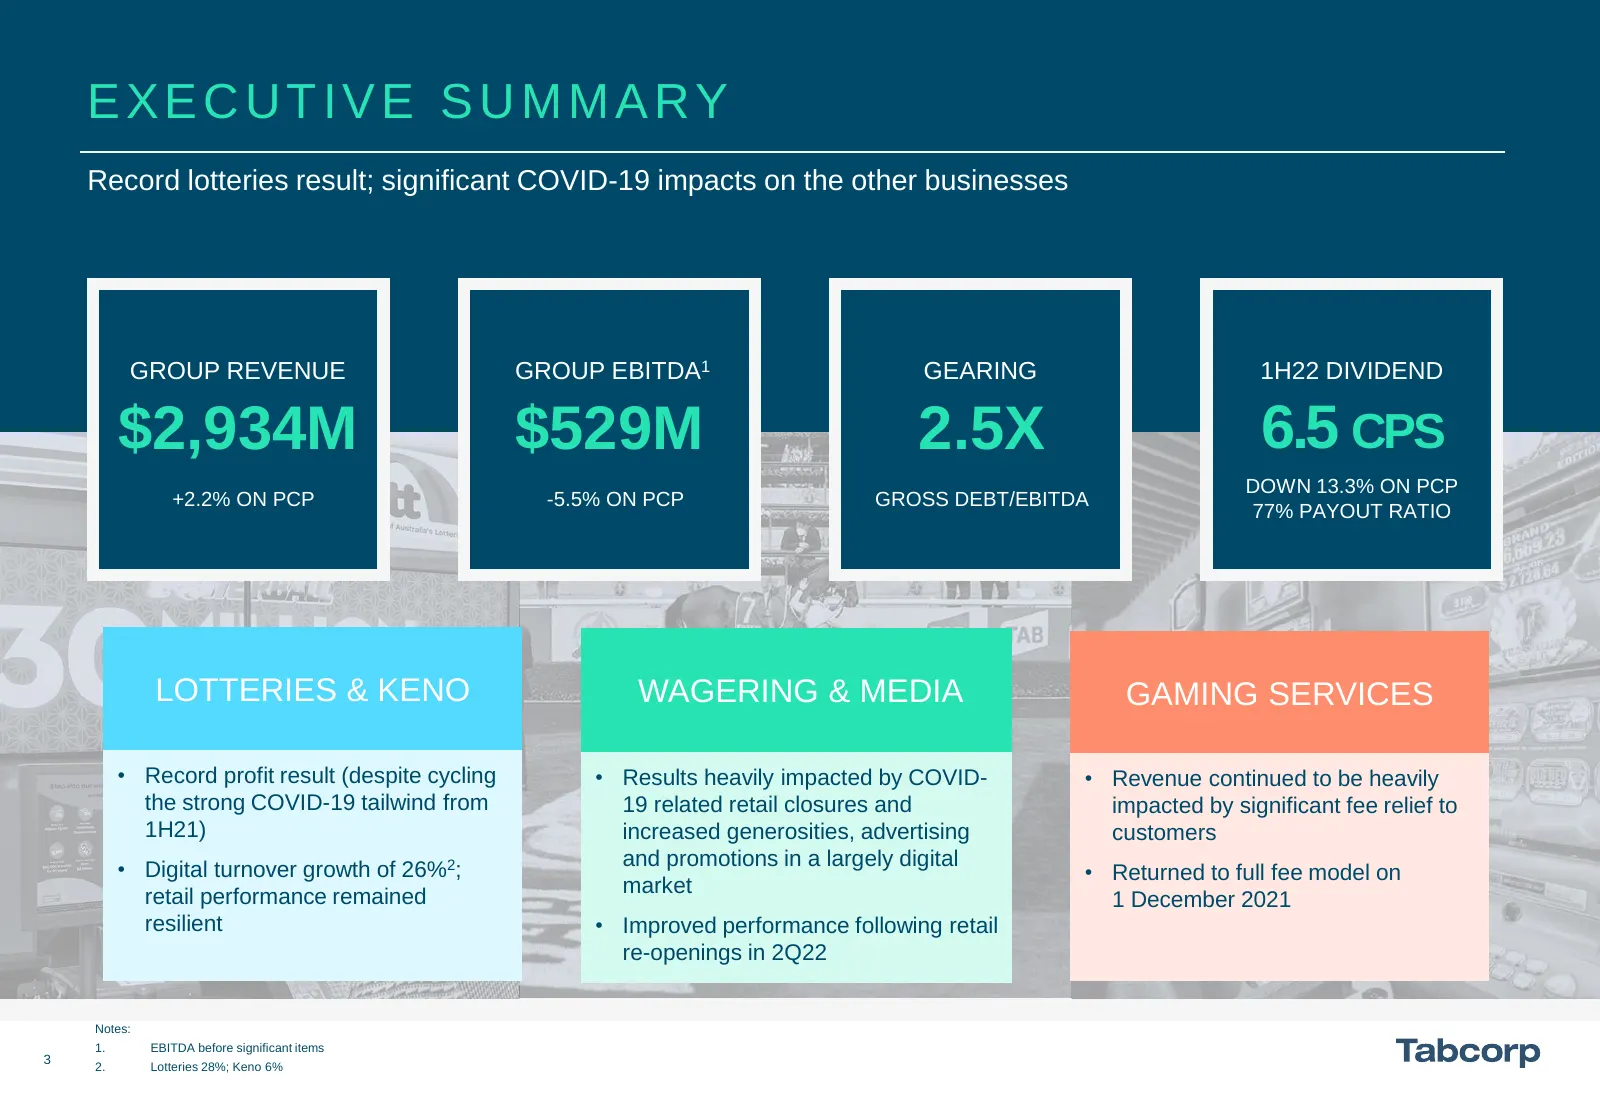
EXECUTIVE SUMMARY Record lotteries result; significant COVID-19 impacts on the other businesses GROUP REVENUE GROUP EBITDA1 GEARING 1H22 DIVIDEND $2,934M $529M 2.5X 6.5 CPS DOWN 13.3% ON PCP +2.2% ON PCP -5.5% ON PCP GROSS DEBT/EBITDA 77% PAYOUT RATIO LOTTERIES & KENO WAGERING & MEDIA GAMING SERVICE
Slide 4: 1H22 Group Results
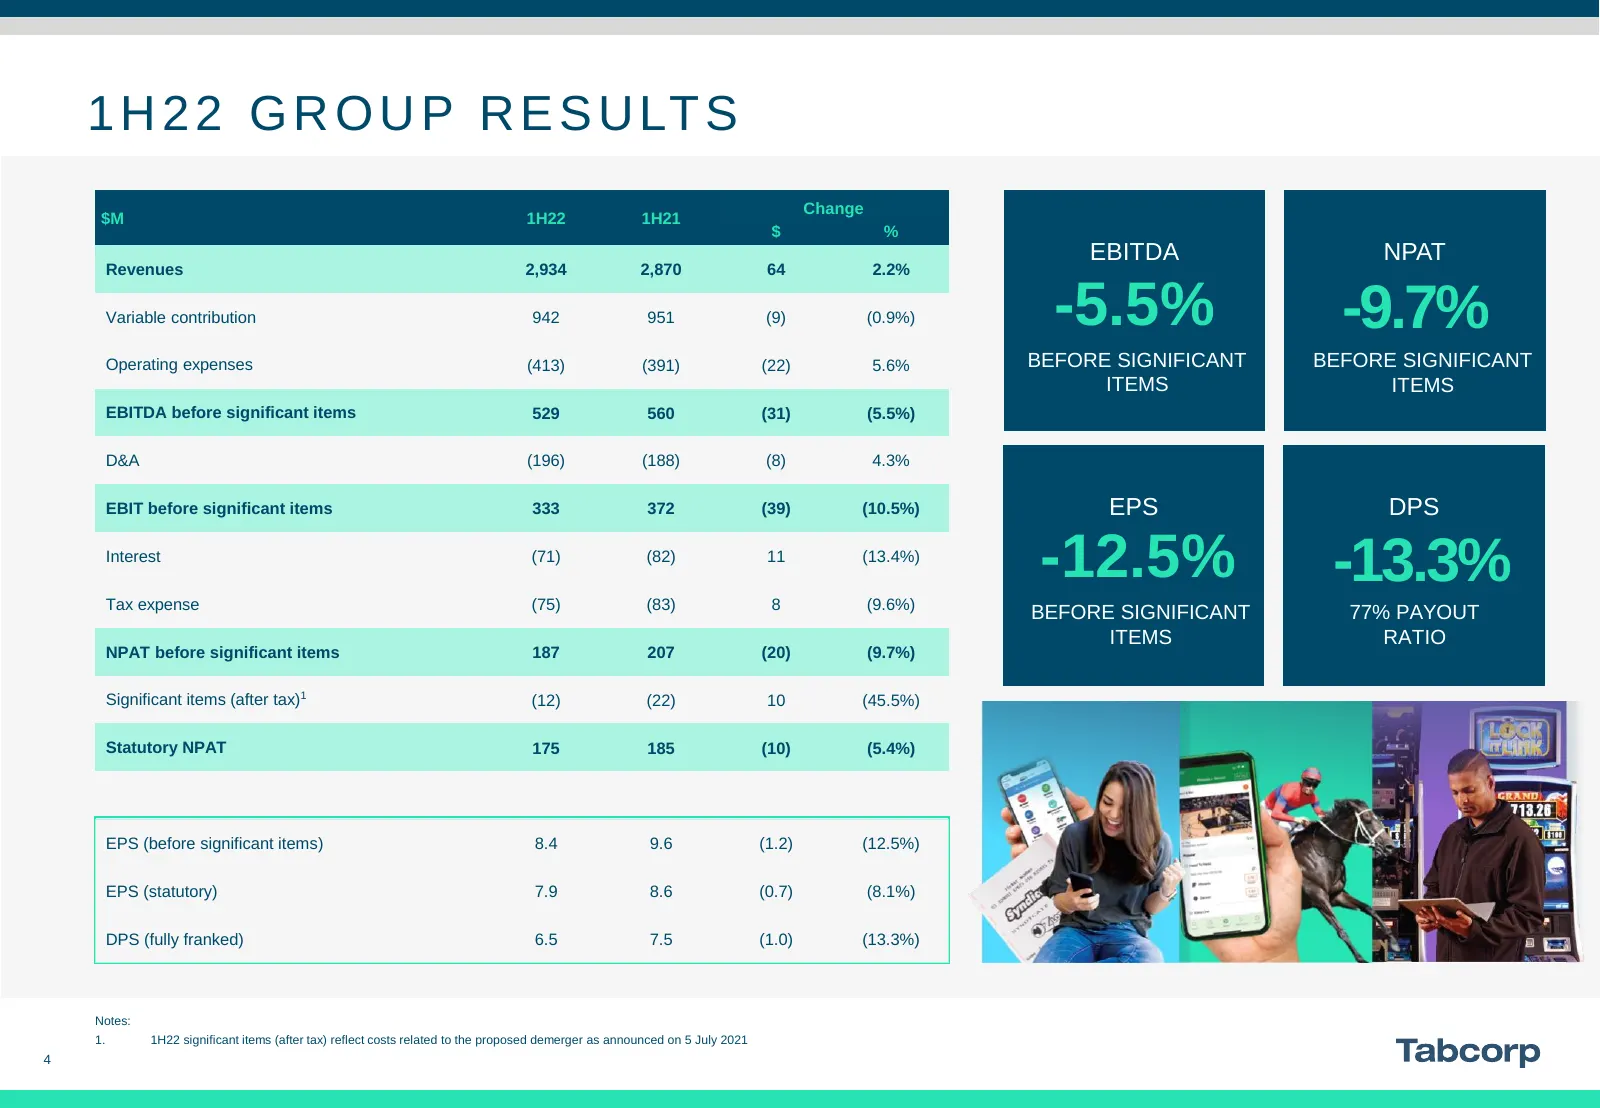
1 H 2 2 G R O U P R E S U LT S Change $M 1H22 1H21 $ % EBITDA NPAT Revenues 2,934 2,870 64 2.2% Variable contribution 942 951 (9) (0.9%) -5.5% -9.7% Operating expenses (413) (391) (22) 5.6% BEFORE SIGNIFICANT BEFORE SIGNIFICANT ITEMS items) (before significant ITEMS EBITDA before significant items 5
Slide 5: Group EBITDA Down 5.5%
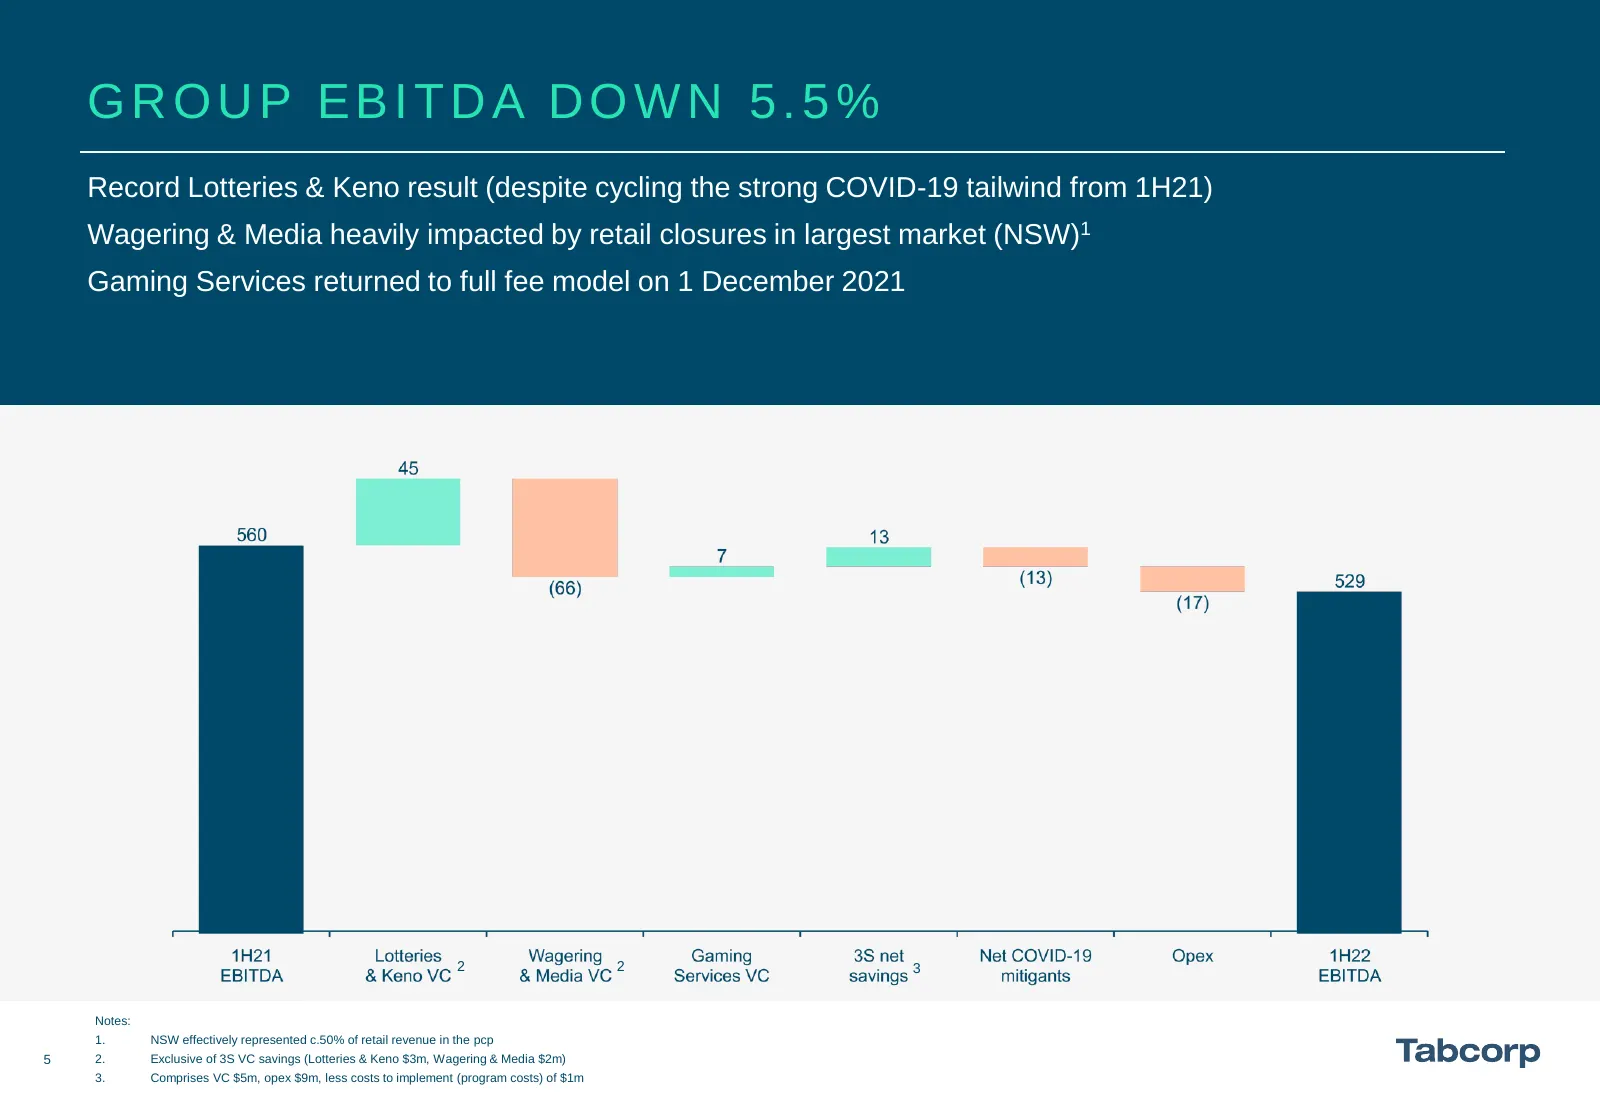
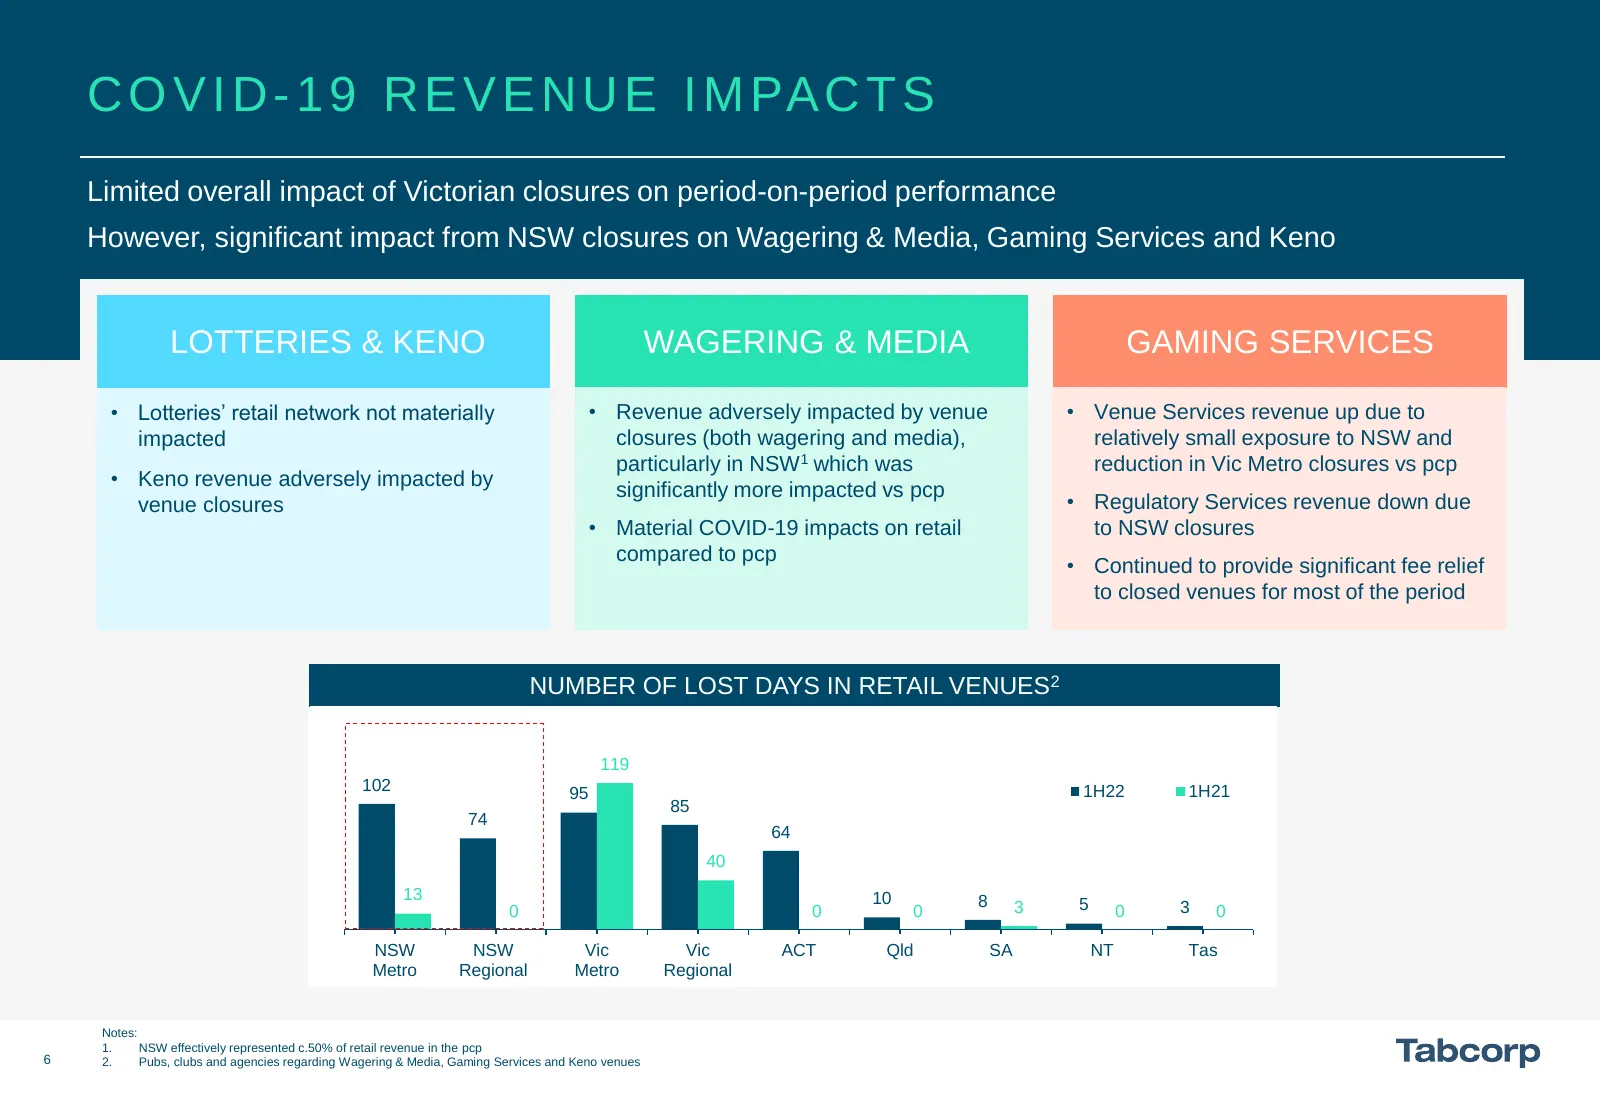
GROUP EBITDA DOWN 5.5% Record Lotteries & Keno result (despite cycling the strong COVID-19 tailwind from 1H21) Wagering & Media heavily impacted by retail closures in largest market (NSW)1 Gaming Services returned to full fee model on 1 December 2021 2 2 3 Notes: 1. NSW effectively represented c.50%
Slide 6: COVID-19 Revenue Impacts
C O V I D - 1 9 R E V E N U E I M PA C T S Limited overall impact of Victorian closures on period-on-period performance However, significant impact from NSW closures on Wagering & Media, Gaming Services and Keno LOTTERIES & KENO WAGERING & MEDIA GAMING SERVICES • Lotteries’ retail network not materi
Slide 7: Capital Metrics
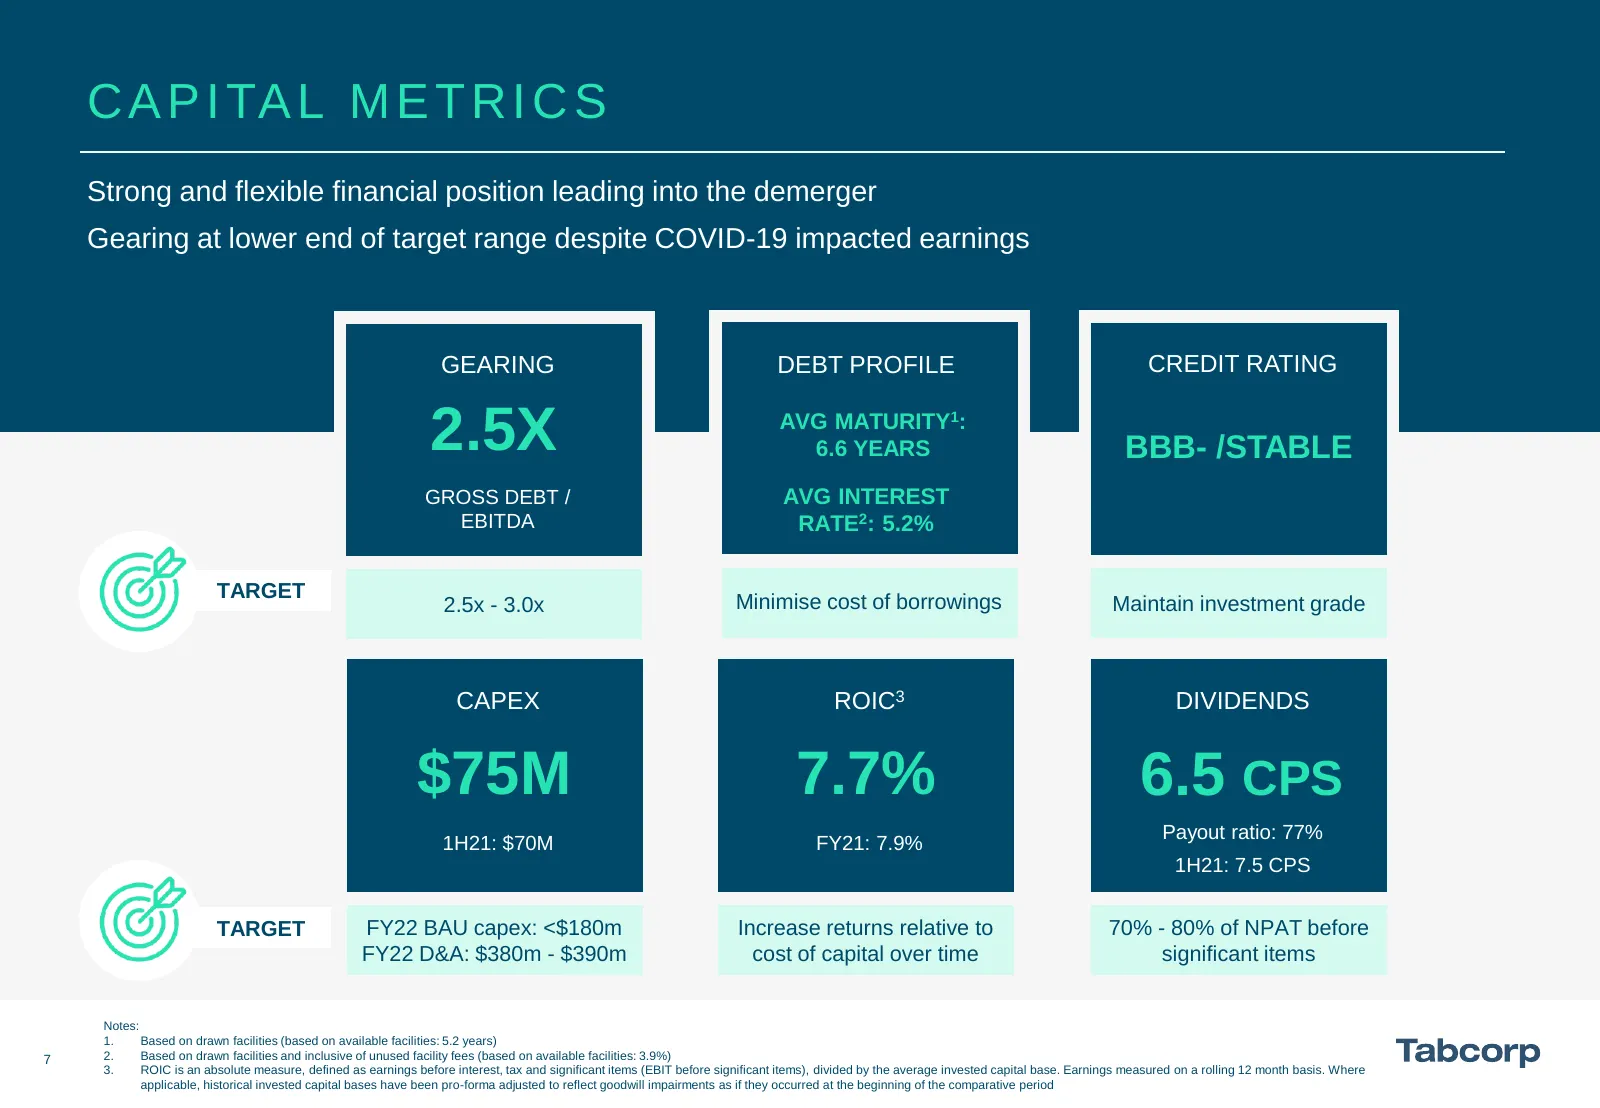
C A P I TA L M E T R I C S Strong and flexible financial position leading into the demerger Gearing at lower end of target range despite COVID-19 impacted earnings GEARING DEBT PROFILE CREDIT RATING 2.5X AVG MATURITY1: 6.6 YEARS BBB- /STABLE GROSS DEBT / AVG INTEREST EBITDA RATE2: 5.2% TARGET 2.5x -
Slide 8: Optimisation Program 3S
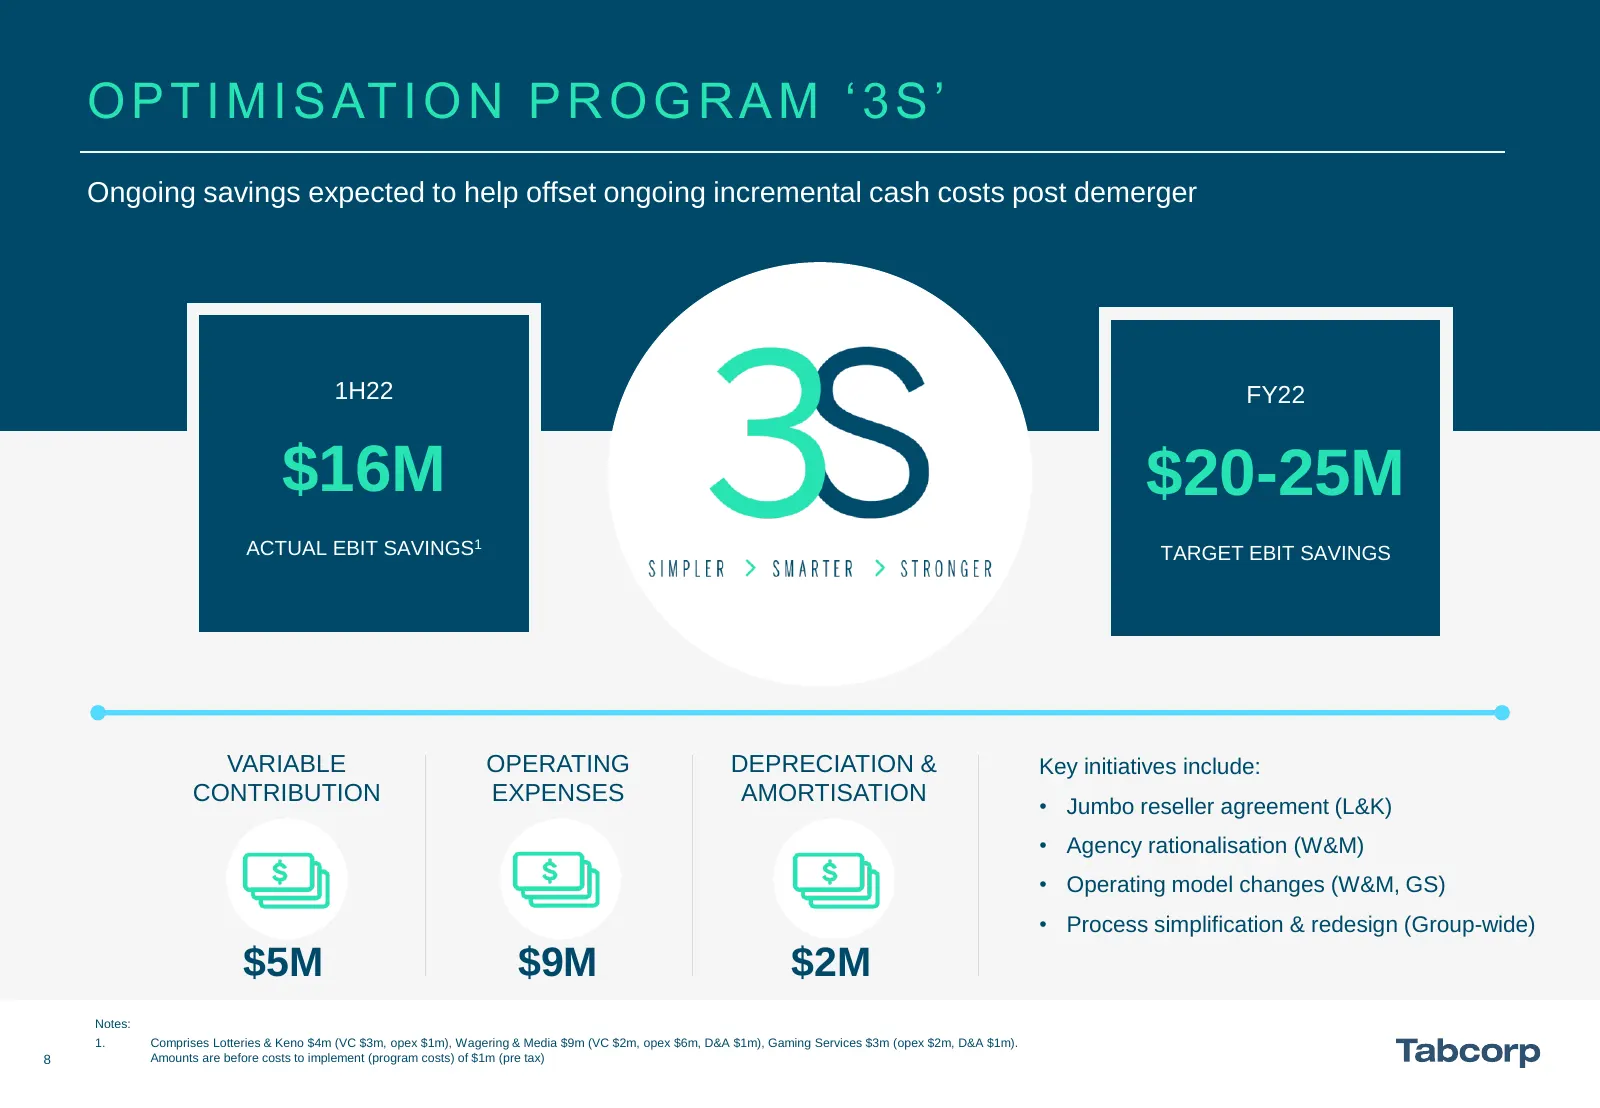
O P T I M I S AT I O N P R O G R A M ‘ 3 S ’ Ongoing savings expected to help offset ongoing incremental cash costs post demerger 1H22 FY22 $16M $20-25M ACTUAL EBIT SAVINGS1 TARGET EBIT SAVINGS VARIABLE OPERATING DEPRECIATION & Key initiatives include: CONTRIBUTION EXPENSES AMORTISATION • Jumbo rese
Slide 9: Table of Contents
TA B L E O F CONTENTS 03 - 08 Group Overview 10 - 19 Business Results 21 - 22 Capital 24 - 25 Conclusion 27 - 34 Appendices
Slide 10: Group & Business Results
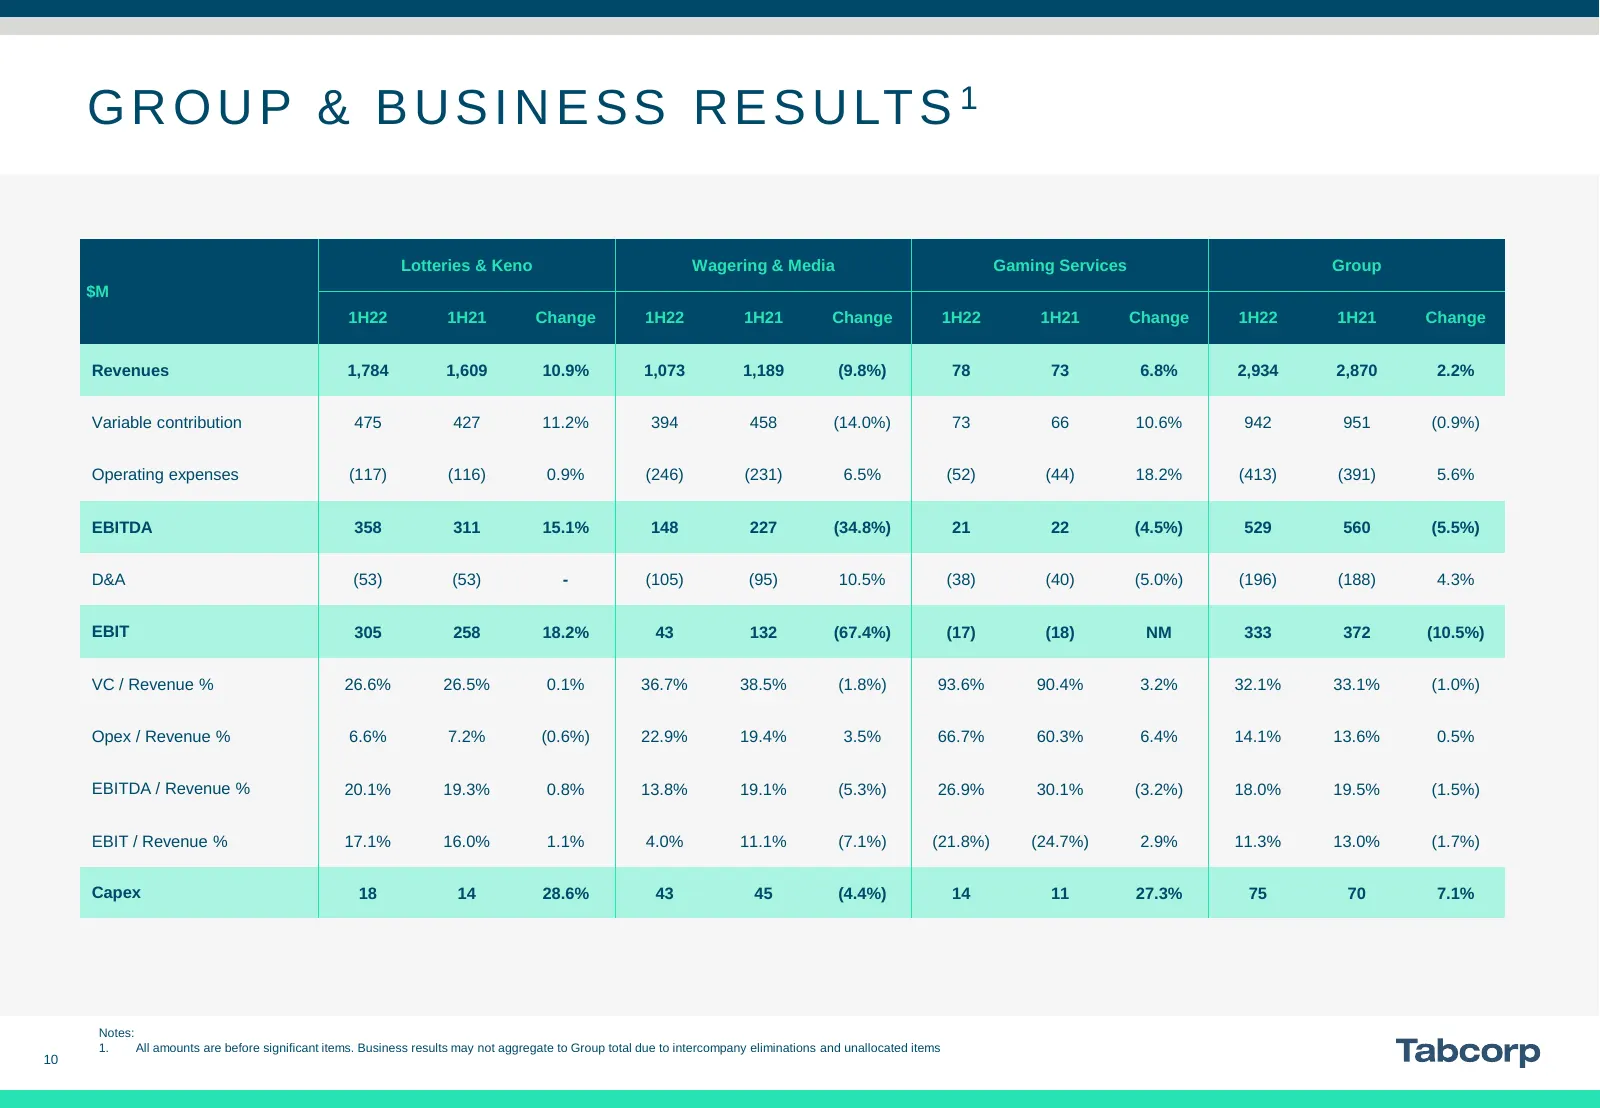
G R O U P & B U S I N E S S R E S U LT S 1 Lotteries & Keno Wagering & Media Gaming Services Group $M 1H22 1H21 Change 1H22 1H21 Change 1H22 1H21 Change 1H22 1H21 Change Revenues 1,784 1,609 10.9% 1,073 1,189 (9.8%) 78 73 6.8% 2,934 2,870 2.2% Variable contribution 475 427 11.2% 394 458 (14.0%) 73 6
Slide 11: Lotteries & Keno Result Highlights
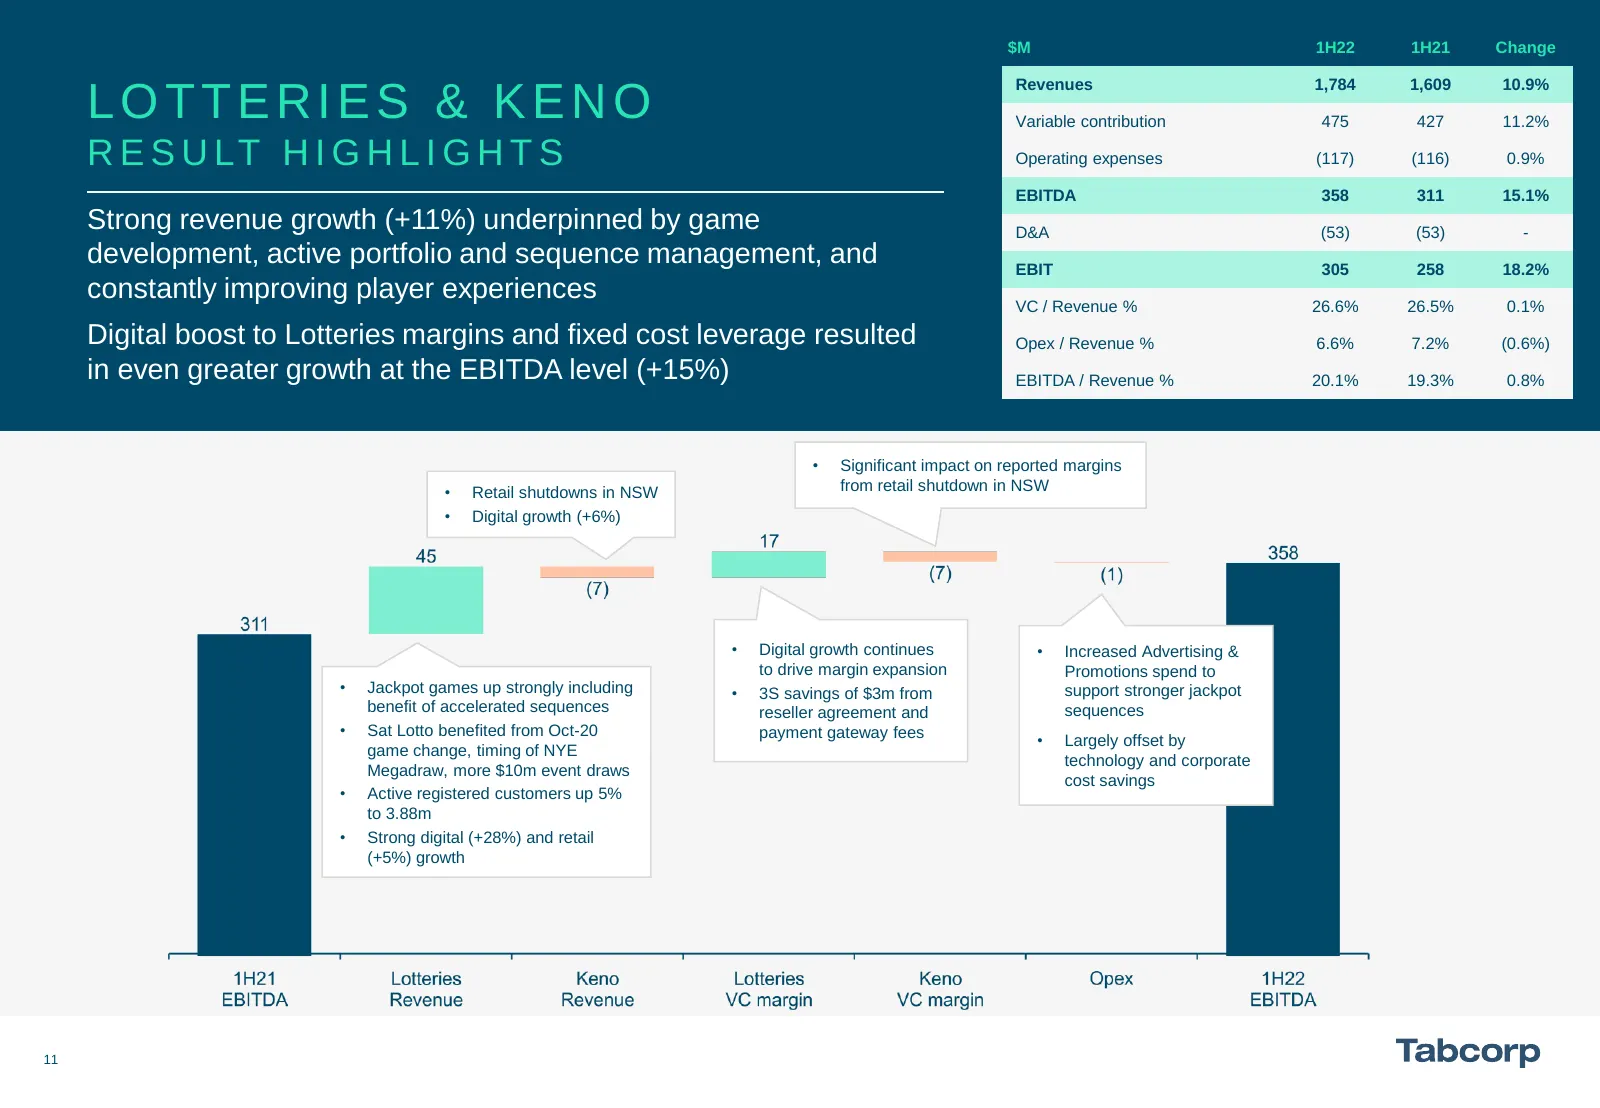
$M 1H22 1H21 Change Revenues 1,784 1,609 10.9% LOTTERIES & KENO Variable contribution 475 427 11.2% R E S U LT H I G H L I G H T S Operating expenses (117) (116) 0.9% EBITDA 358 311 15.1% Strong revenue growth (+11%) underpinned by game D&A (53) (53) - development, active portfolio and sequence mana
Slide 12: Lotteries & Keno Key Performance Indicators
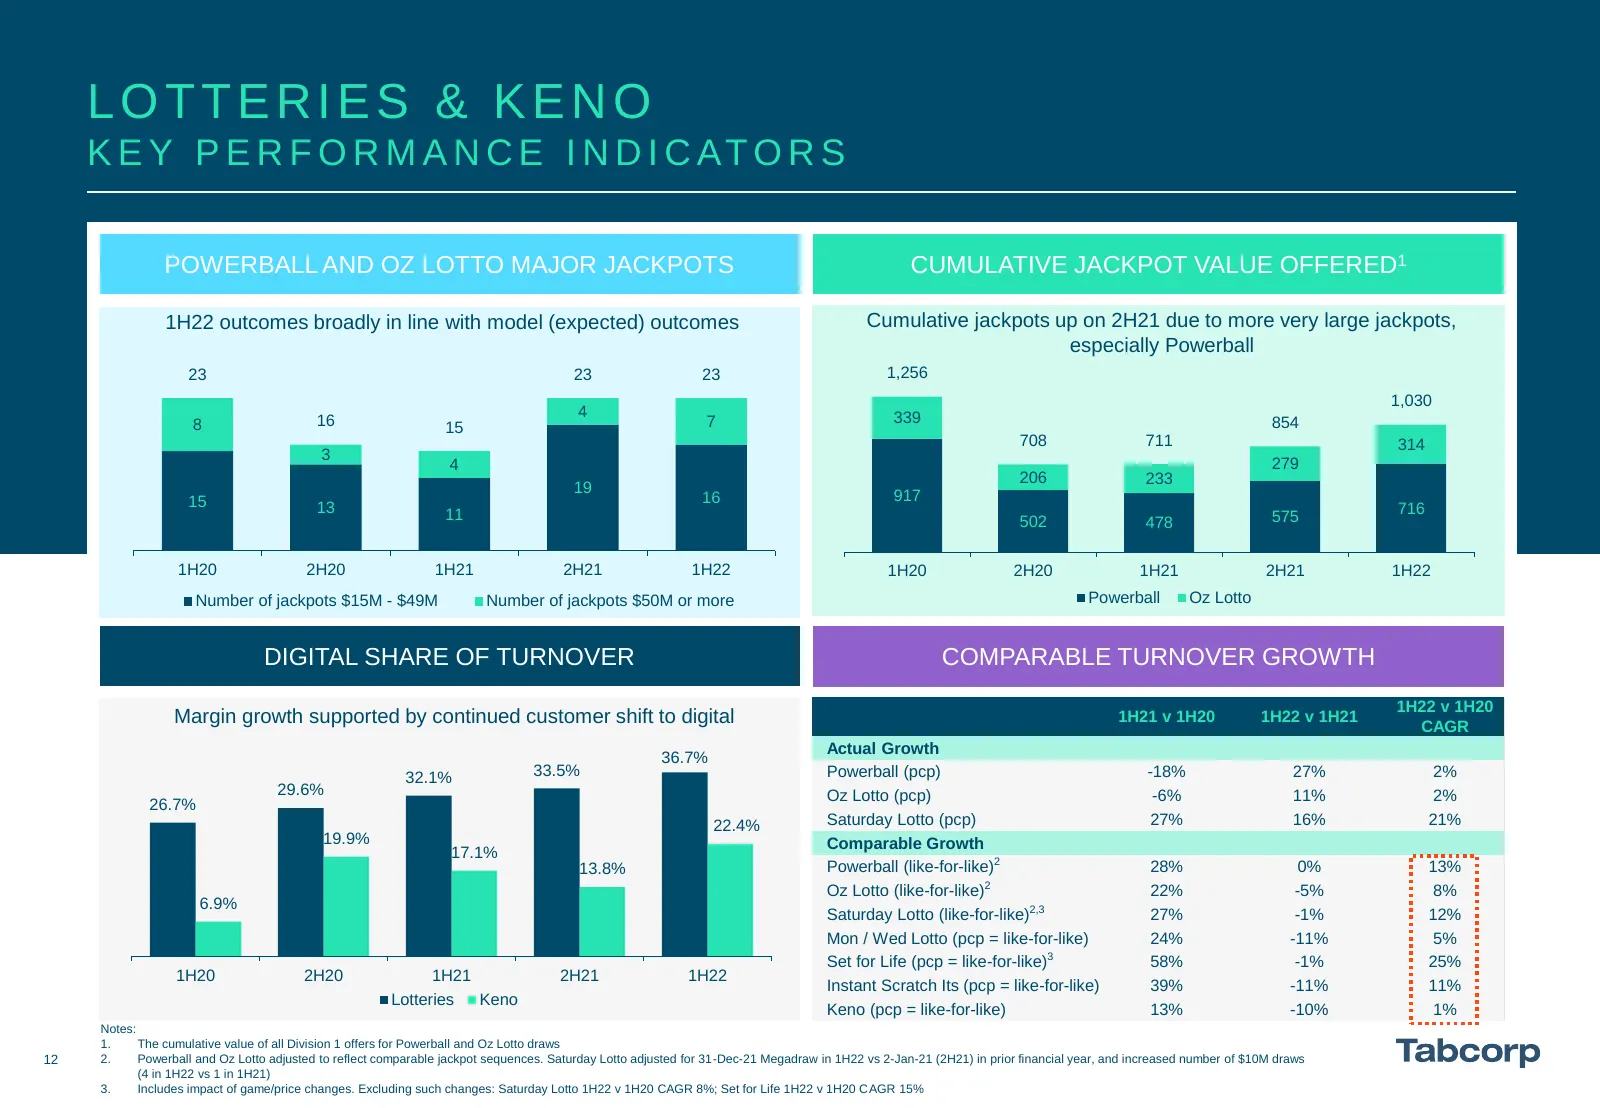
LOTTERIES & KENO K E Y P E R F O R M A N C E I N D I C AT O R S POWERBALL AND OZ LOTTO MAJOR JACKPOTS CUMULATIVE JACKPOT VALUE OFFERED1 1H22 outcomes broadly in line with model (expected) 634 outcomes Cumulative jackpots up on 2H21 due to more very large jackpots, especially Powerball 23 547 23 23 1
Slide 13: Oz Lotto Game Change
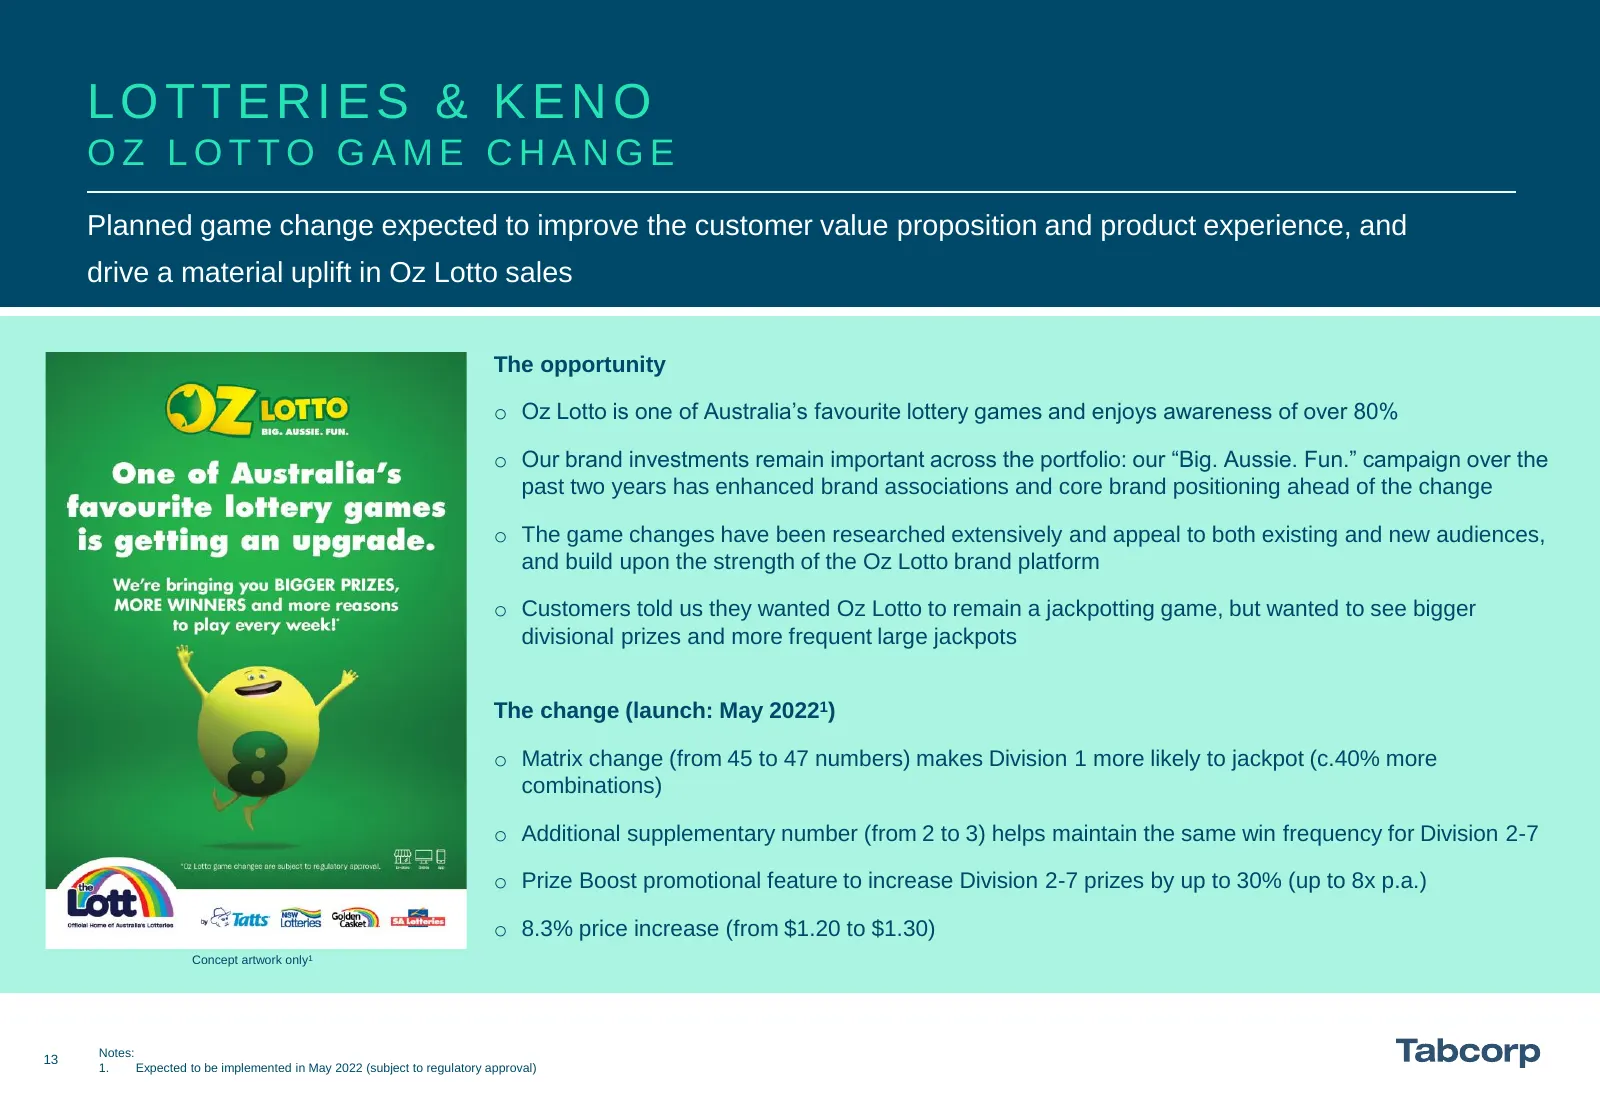
LOTTERIES & KENO OZ LOTTO GAME CHANGE Planned game change expected to improve the customer value proposition and product experience, and drive a material uplift in Oz Lotto sales The opportunity o Oz Lotto is one of Australia’s favourite lottery games and enjoys awareness of over 80% o Our brand inv
Slide 14: Lotteries & Keno Key Growth Strategies
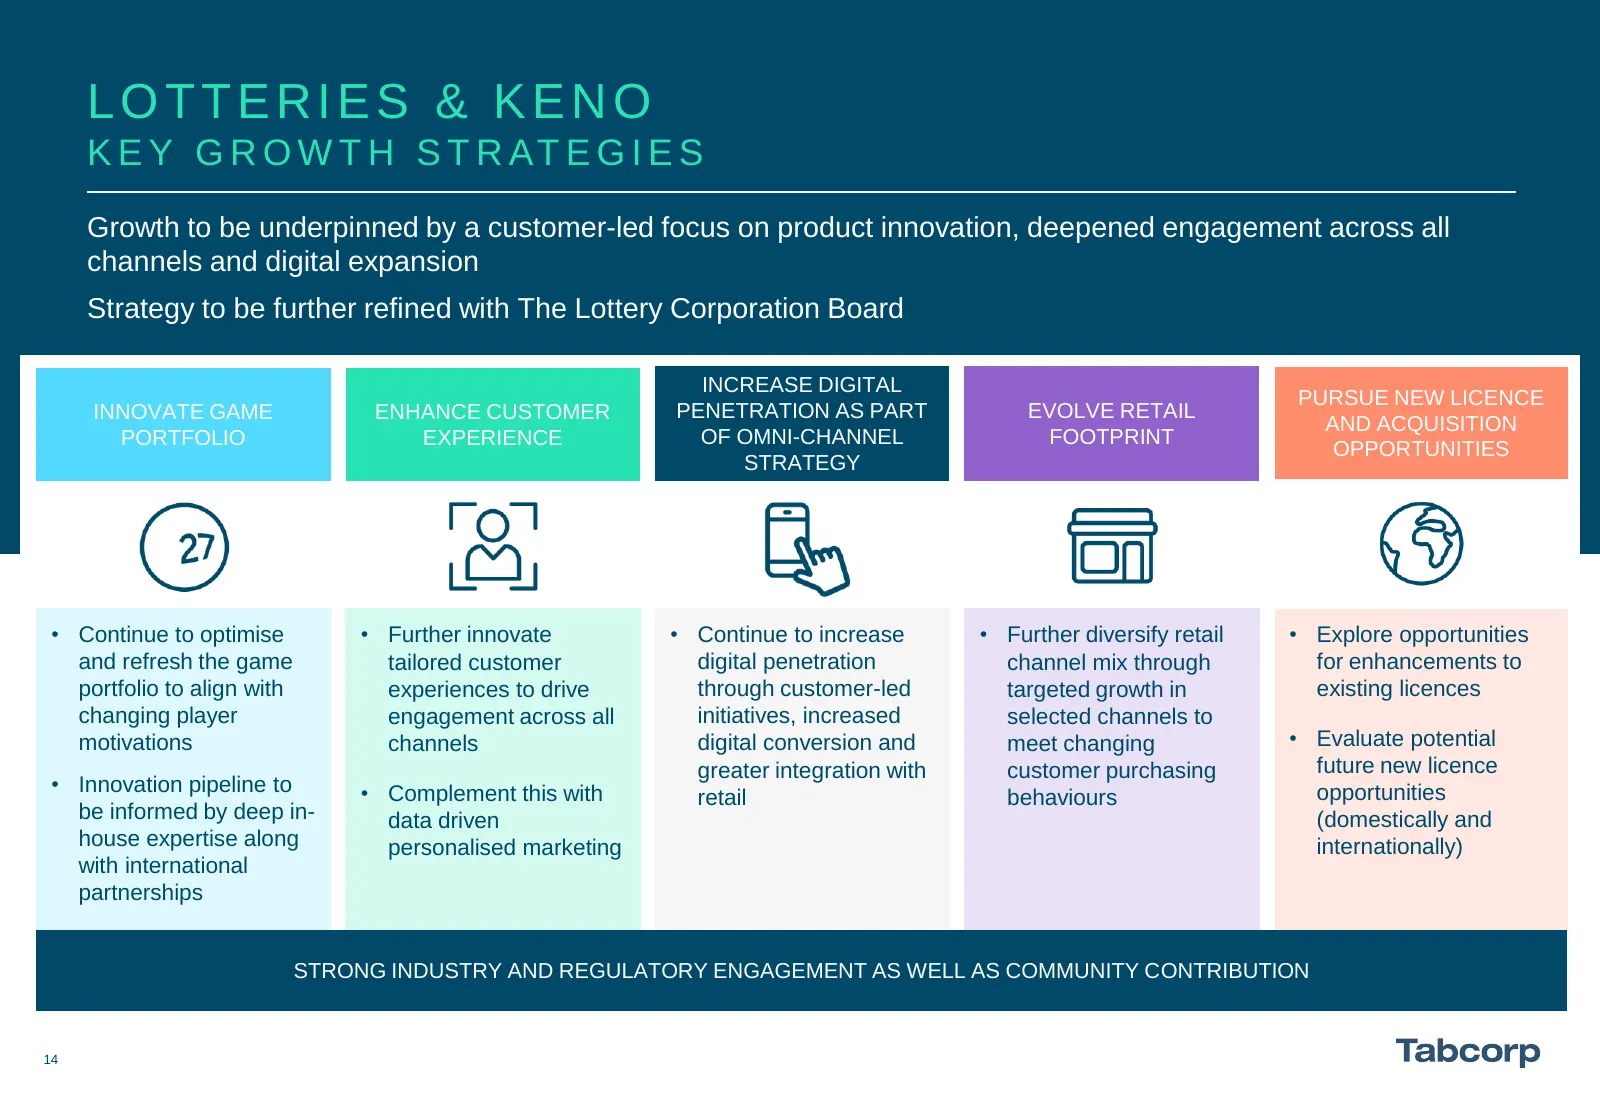
LOTTERIES & KENO K E Y G R O W T H S T R AT E G I E S Growth to be underpinned by a customer-led focus on product innovation, deepened engagement across all channels and digital expansion Strategy to be further refined with The Lottery Corporation Board INCREASE DIGITAL PURSUE NEW LICENCE INNOVATE G
Slide 15: Wagering & Media Result Highlights
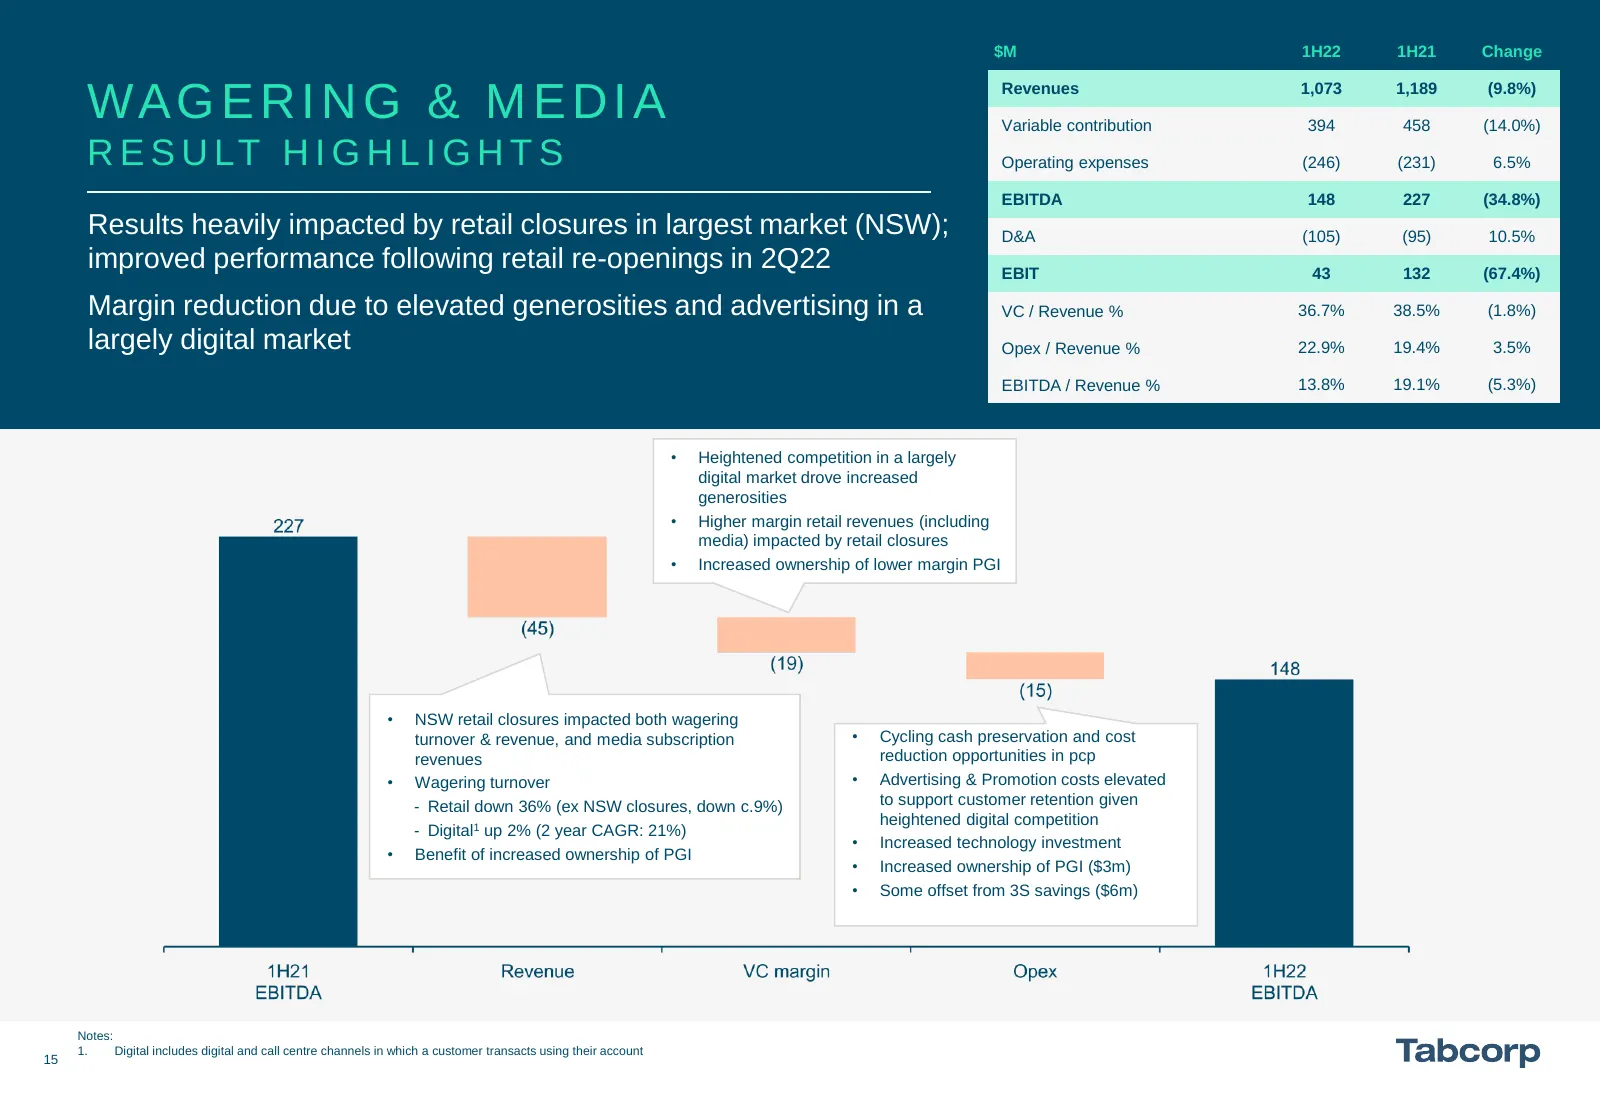
$M 1H22 1H21 Change Revenues 1,073 1,189 (9.8%) WA G E R I N G & M E D I A Variable contribution 394 458 (14.0%) R E S U LT H I G H L I G H T S Operating expenses (246) (231) 6.5% EBITDA 148 227 (34.8%) Results heavily impacted by retail closures in largest market (NSW); D&A (105) (95) 10.5% improve
Slide 16: Wagering & Media Key Performance Indicators
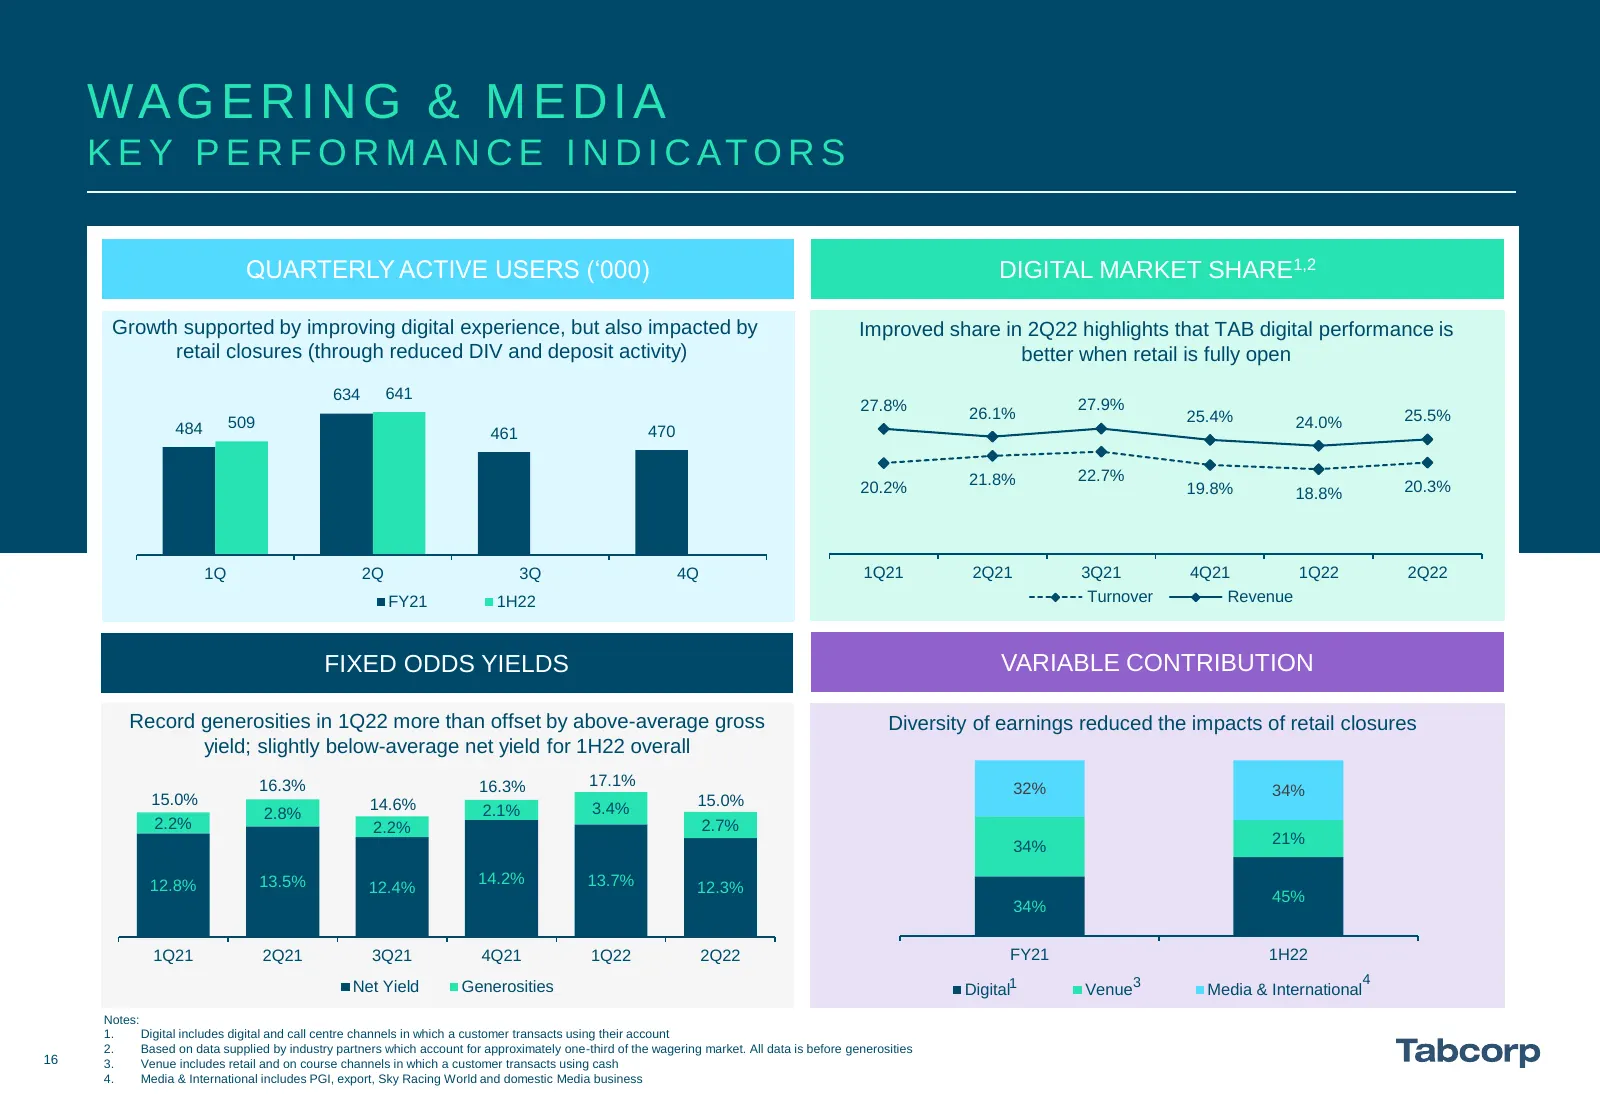
WA G E R I N G & M E D I A K E Y P E R F O R M A N C E I N D I C AT O R S QUARTERLY ACTIVE USERS (‘000) DIGITAL MARKET SHARE1,2 Growth supported by improving digital experience, 634 but also impacted by Improved share in 2Q22 highlights that TAB digital performance is retail closures (through reduce
Slide 17: Wagering & Media Strategy Framework
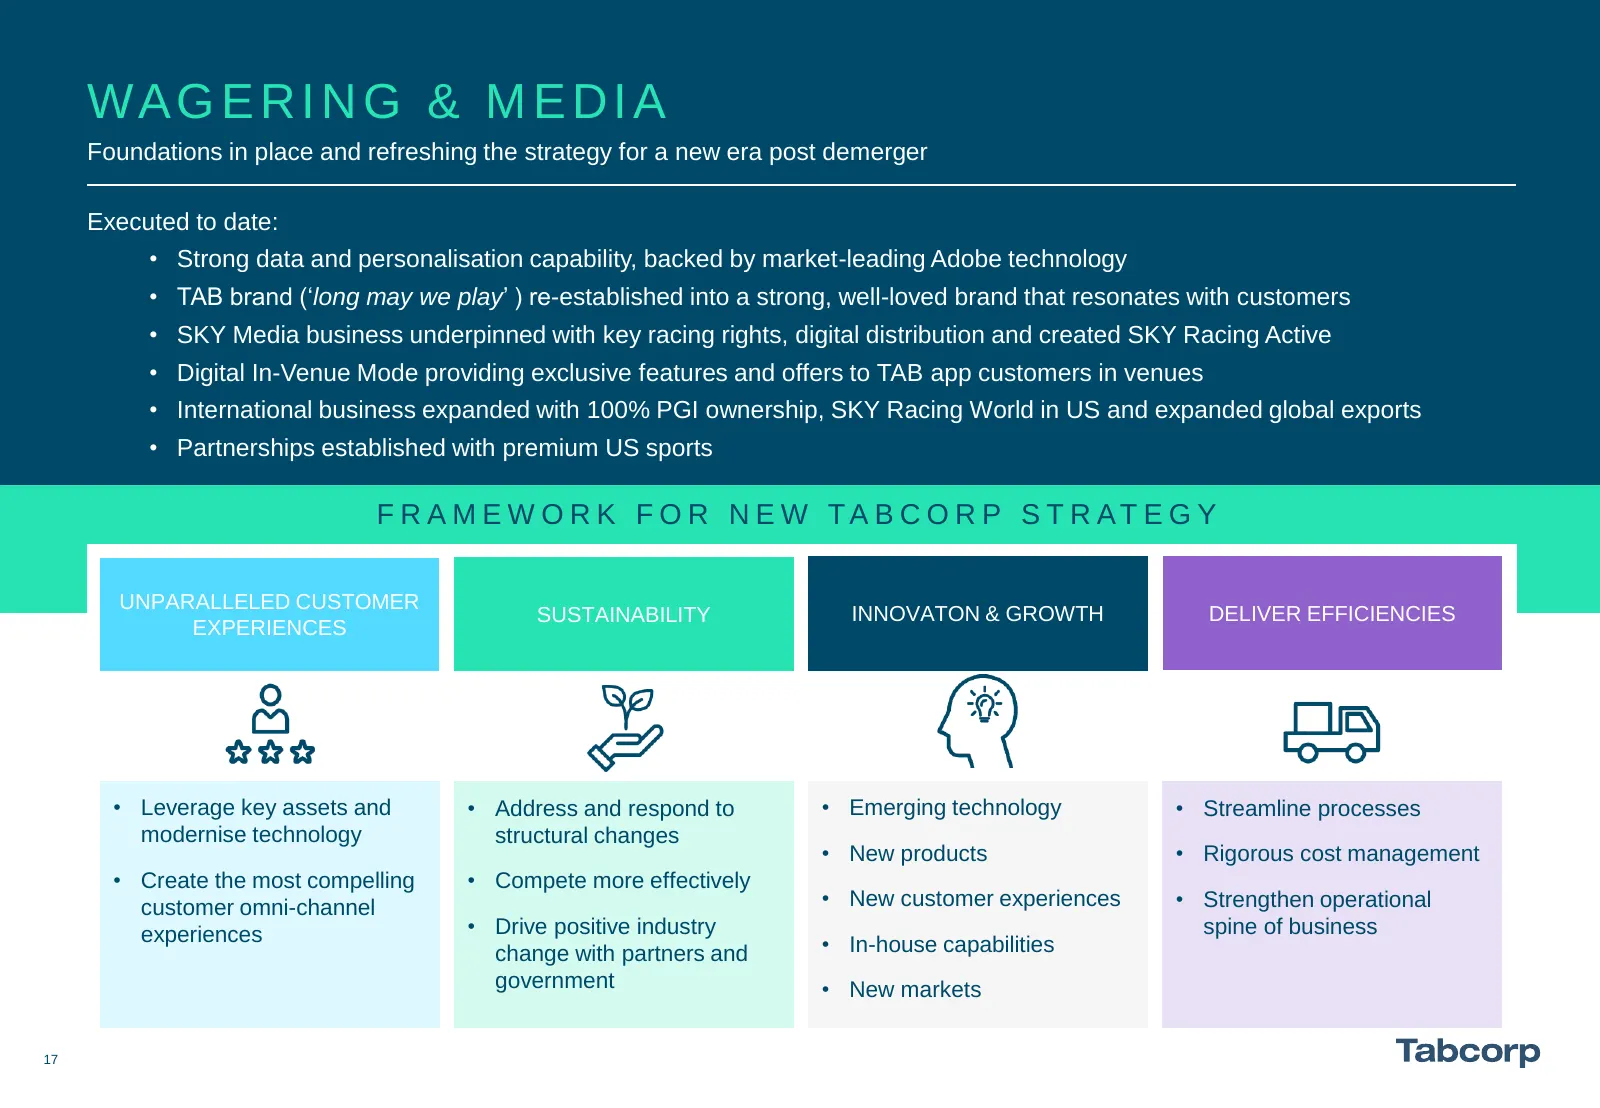
WA G E R I N G & M E D I A Foundations in place and refreshing the strategy for a new era post demerger Executed to date: • Strong data and personalisation capability, backed by market-leading Adobe technology • TAB brand (‘long may we play’ ) re-established into a strong, well-loved brand that reso
Slide 18: Gaming Services Result Highlights
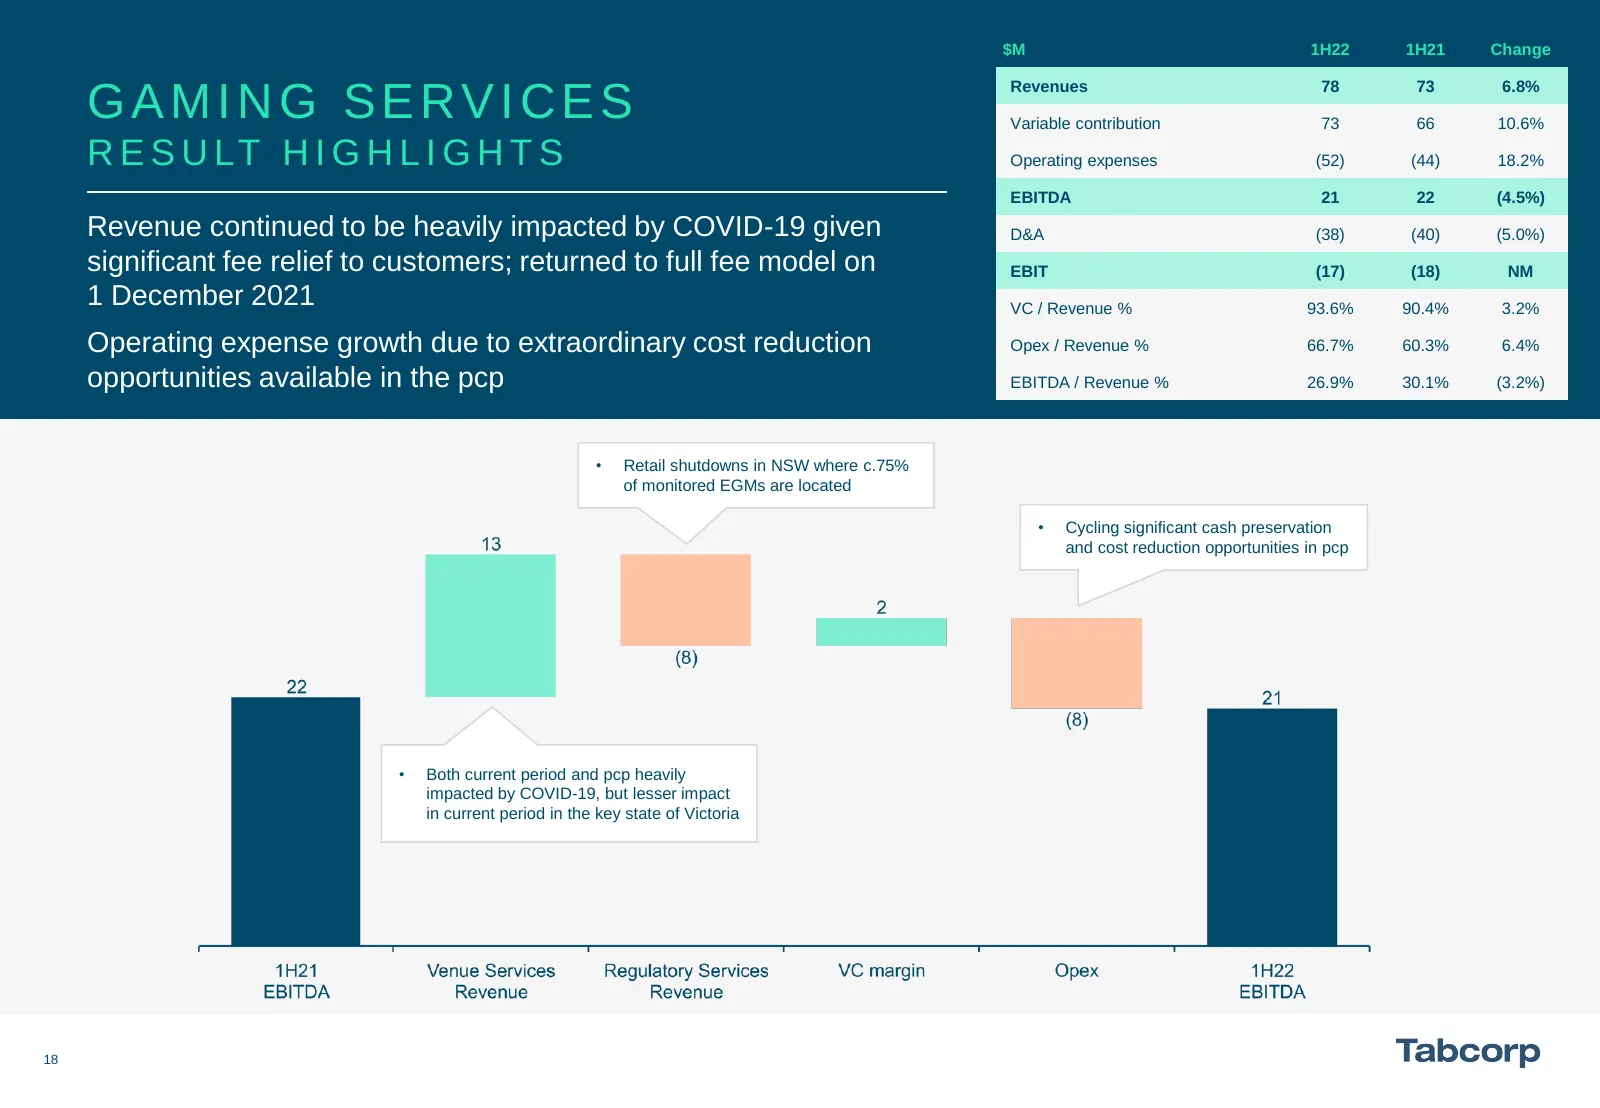
$M 1H22 1H21 Change Revenues 78 73 6.8% GAMING SERVICES Variable contribution 73 66 10.6% R E S U LT H I G H L I G H T S Operating expenses (52) (44) 18.2% EBITDA 21 22 (4.5%) Revenue continued to be heavily impacted by COVID-19 given D&A (38) (40) (5.0%) significant fee relief to customers; returne
Slide 19: Gaming Services Key Strategies
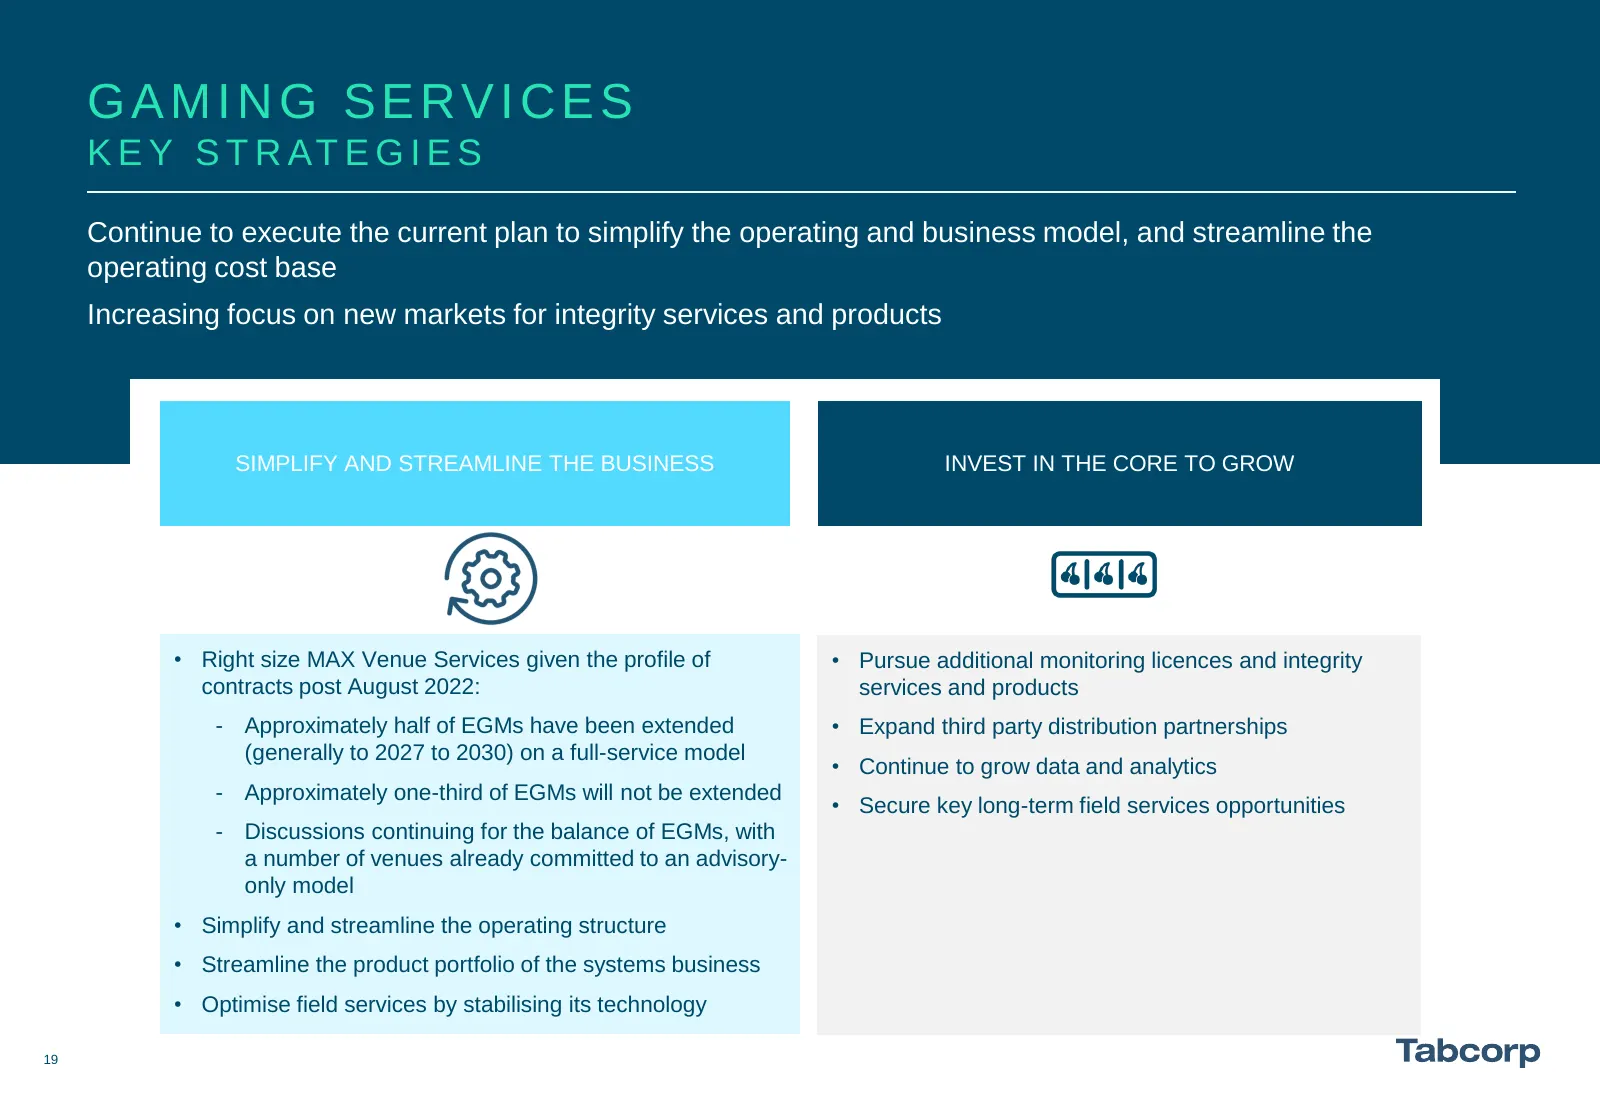
GAMING SERVICES K E Y S T R AT E G I E S Continue to execute the current plan to simplify the operating and business model, and streamline the operating cost base Increasing focus on new markets for integrity services and products SIMPLIFY AND STREAMLINE THE BUSINESS INVEST IN THE CORE TO GROW • Rig
Slide 20: Table of Contents
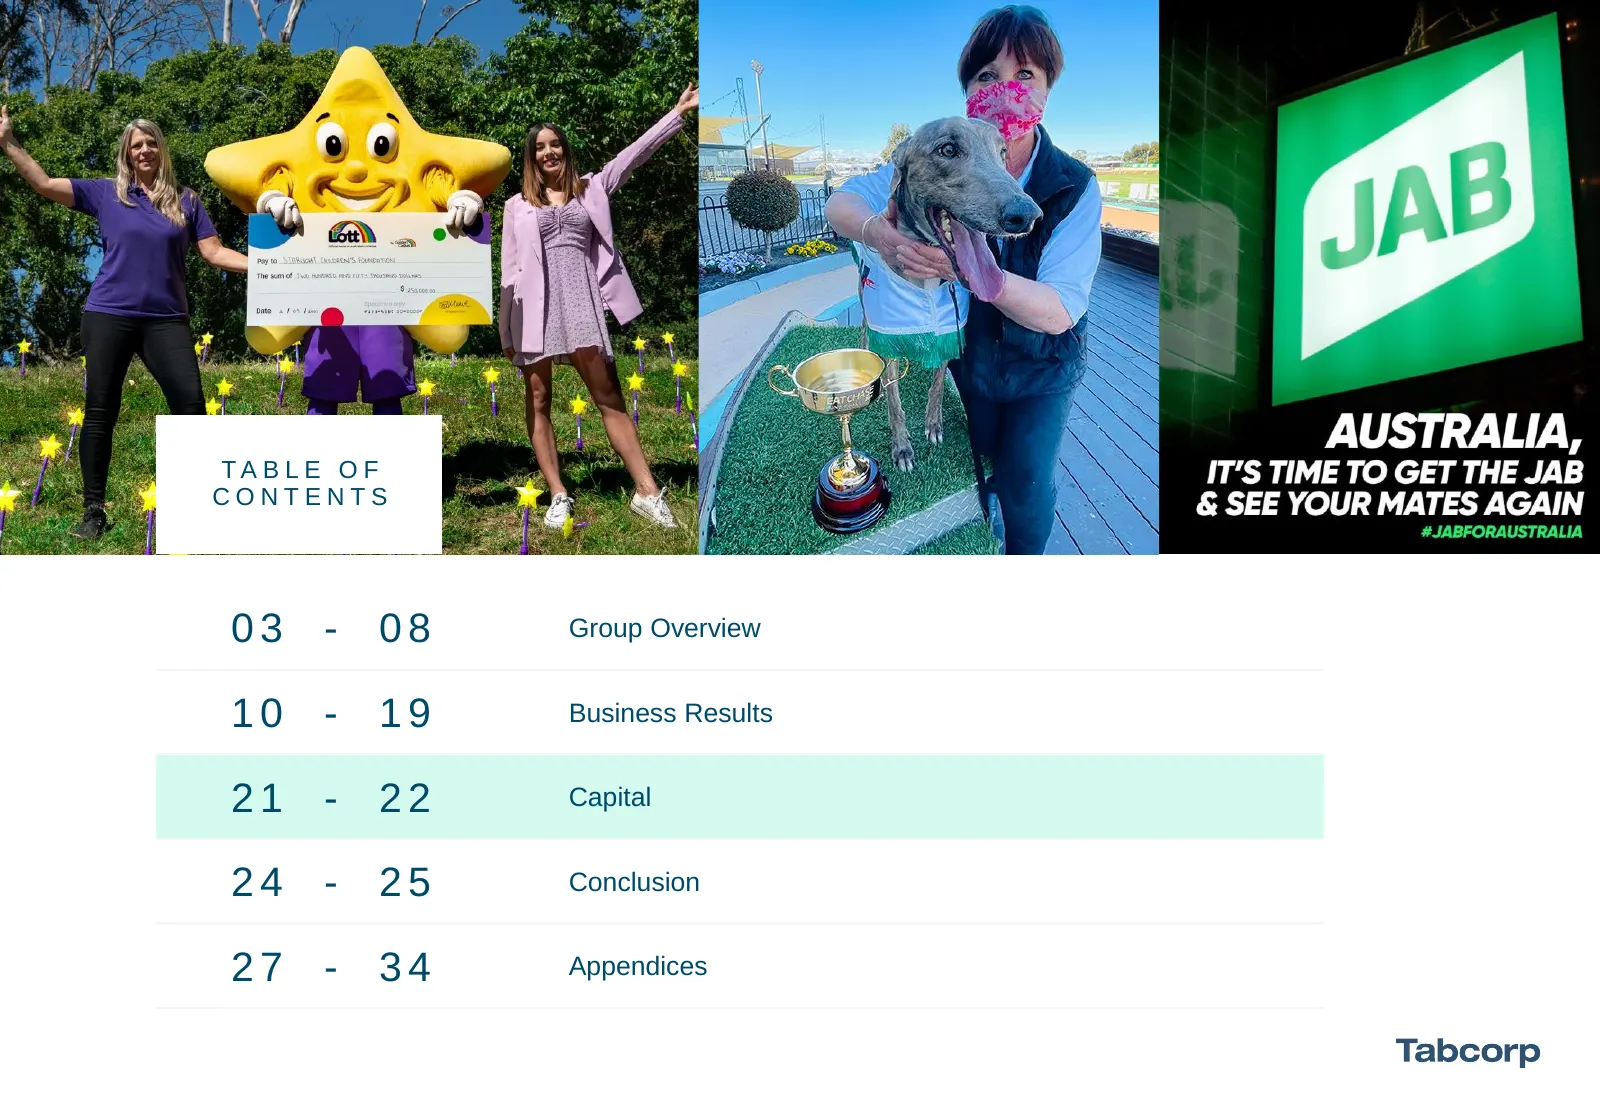
TA B L E O F CONTENTS 03 - 08 Group Overview 10 - 19 Business Results 21 - 22 Capital 24 - 25 Conclusion 27 - 34 Appendices
Slide 21: Cash Flow and Debt
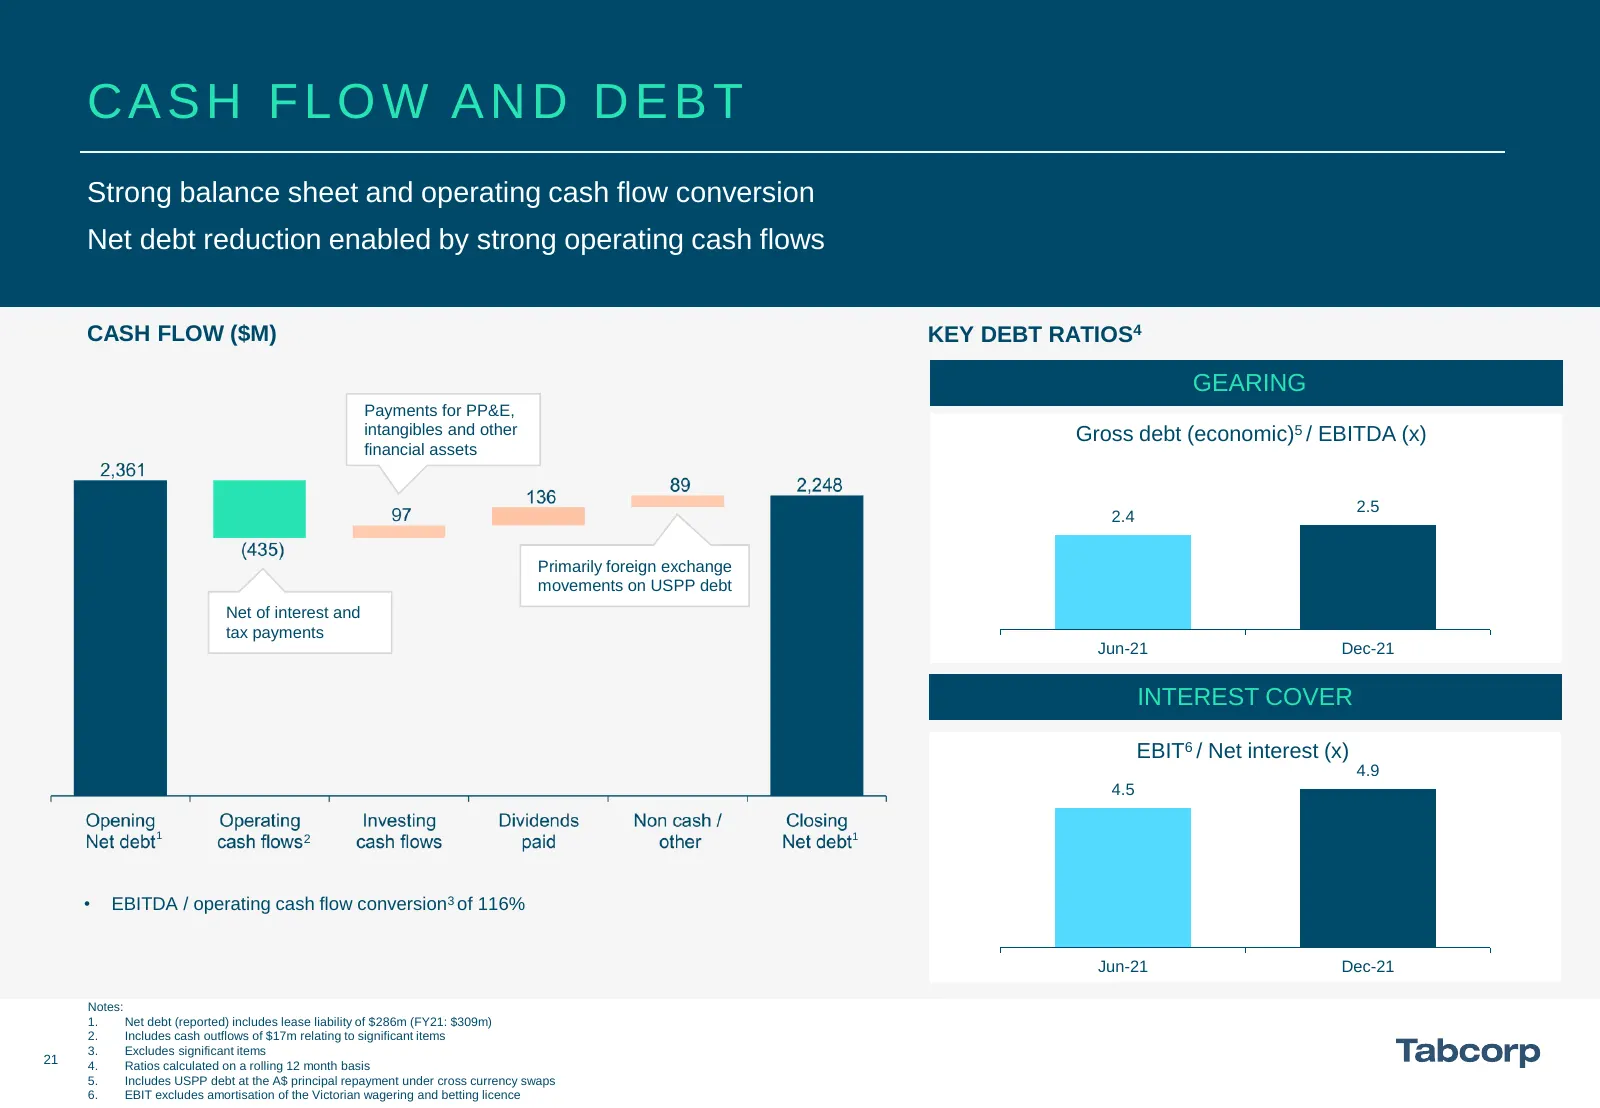
CASH FLOW AND DEBT Strong balance sheet and operating cash flow conversion Net debt reduction enabled by strong operating cash flows CASH FLOW ($M) KEY DEBT RATIOS4 GEARING Payments for PP&E, intangibles and other Gross debt (economic)5 / EBITDA (x) financial assets 2.5 2.4 Primarily foreign exchang
Slide 22: Debt Structure and Capital Expenditure
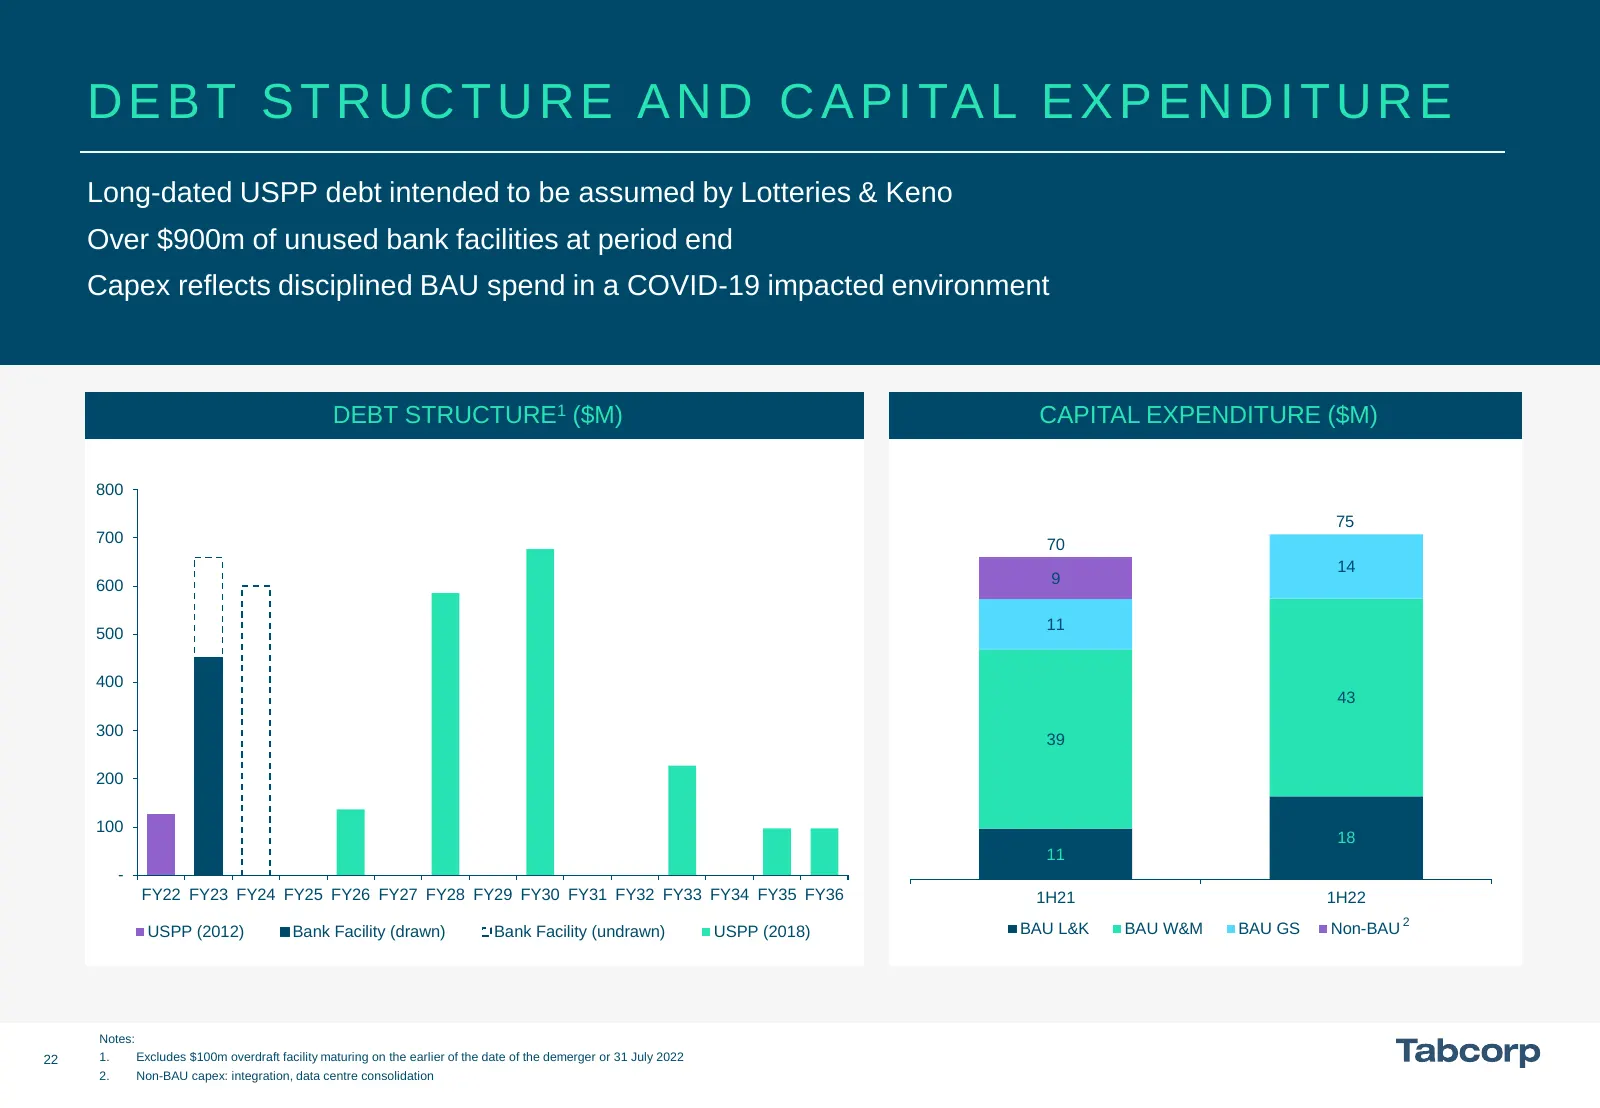
D E B T S T R U C T U R E A N D C A P I TA L E X P E N D I T U R E Long-dated USPP debt intended to be assumed by Lotteries & Keno Over $900m of unused bank facilities at period end Capex reflects disciplined BAU spend in a COVID-19 impacted environment DEBT STRUCTURE1 ($M) CAPITAL EXPENDITURE ($M)
Slide 23: Table of Contents
TA B L E O F CONTENTS 03 - 08 Group Overview 10 - 19 Business Results 21 - 22 Capital 24 - 25 Conclusion 27 - 34 Appendices
Slide 24: Demerger Update
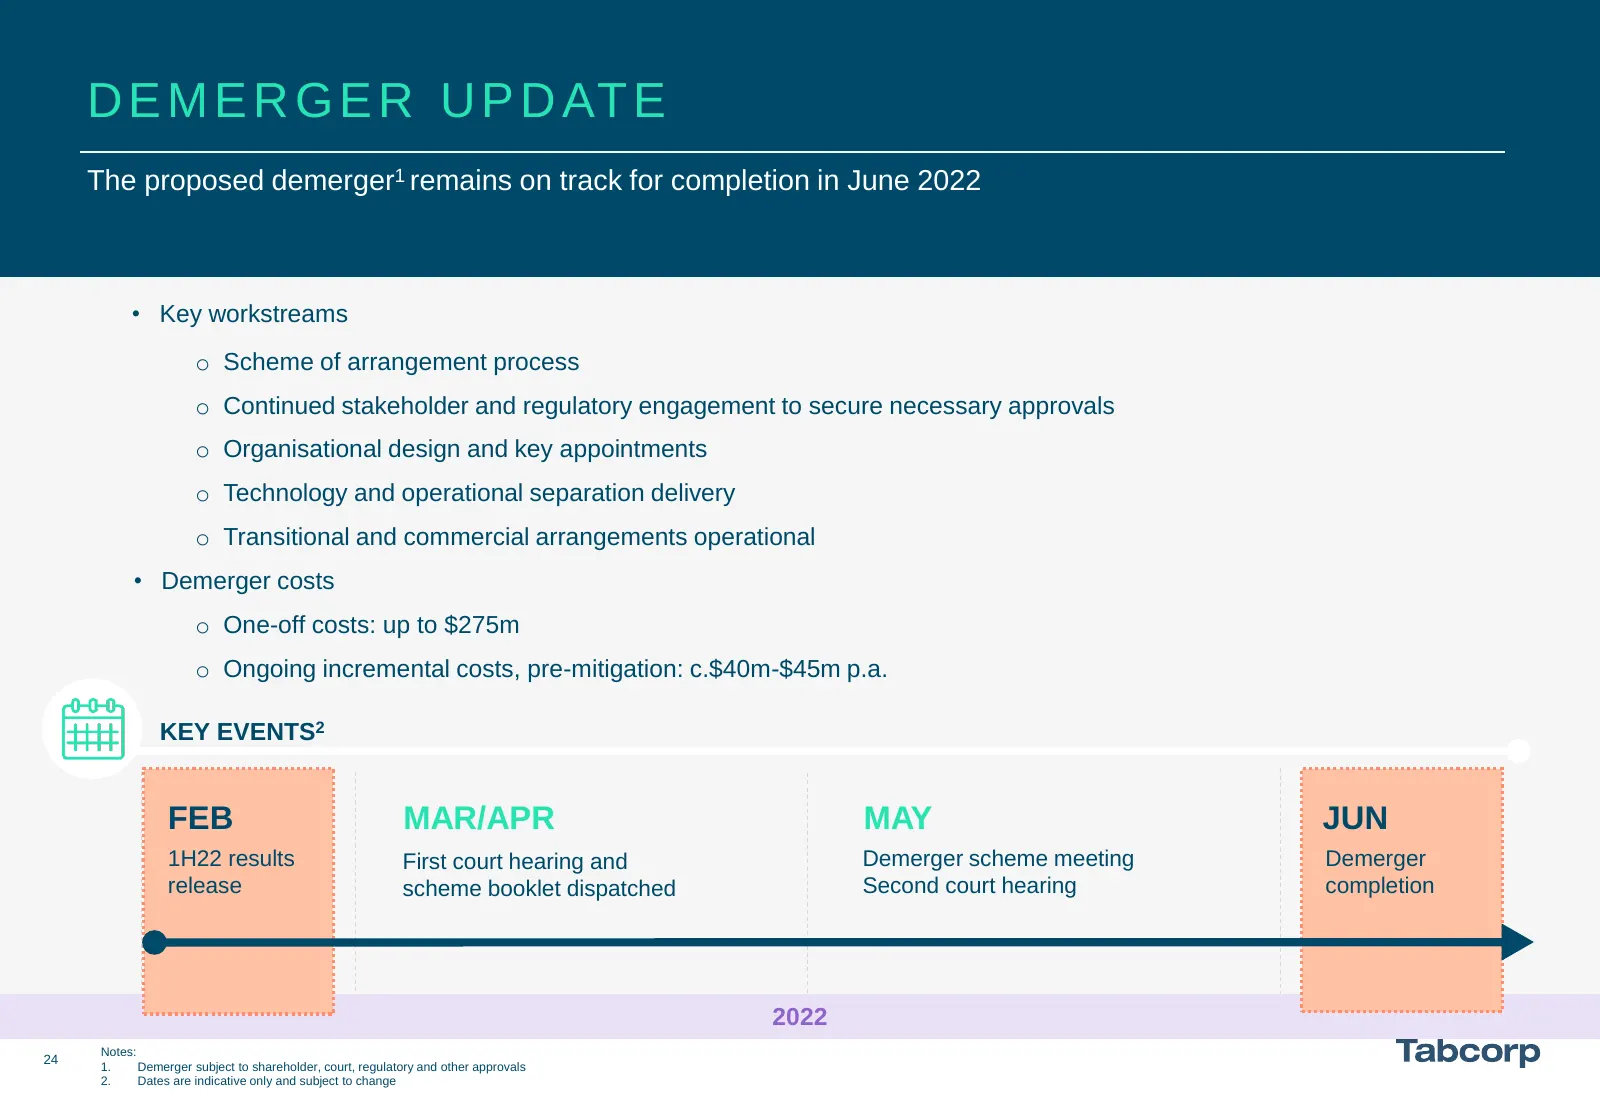
D E M E R G E R U P D AT E The proposed demerger1 remains on track for completion in June 2022 • Key workstreams o Scheme of arrangement process o Continued stakeholder and regulatory engagement to secure necessary approvals o Organisational design and key appointments o Technology and operational s
Slide 25: Conclusion
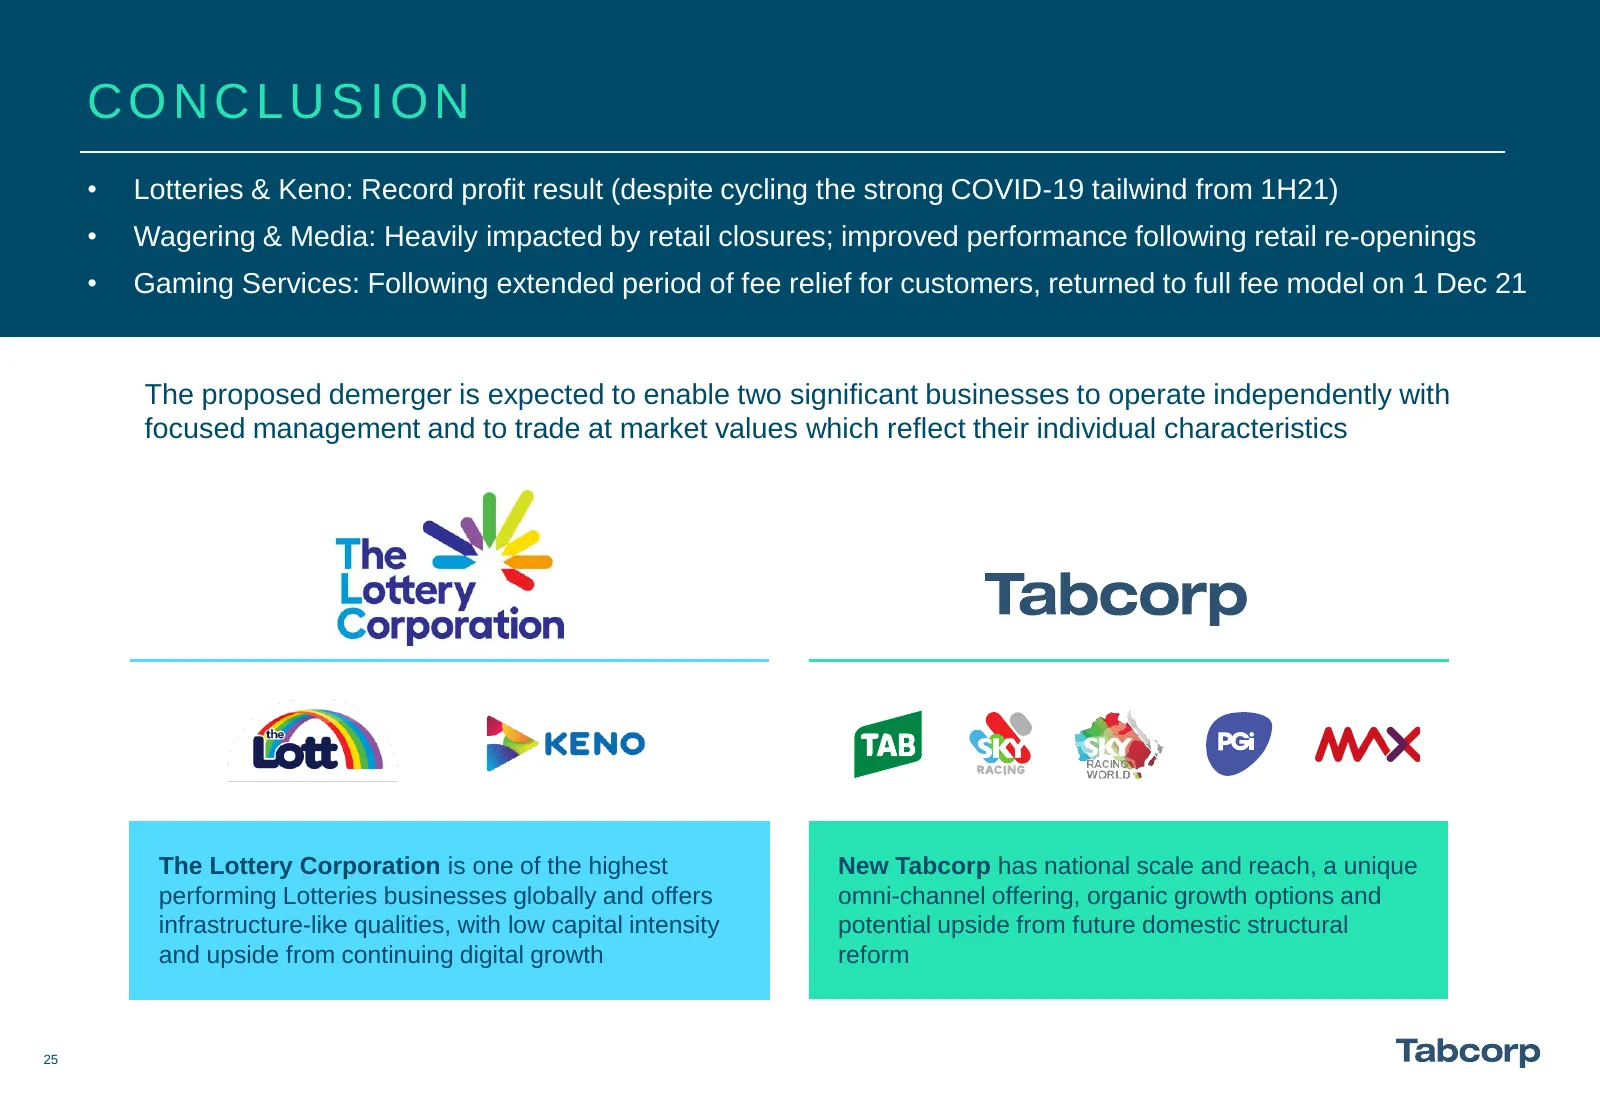
CONCLUSION • Lotteries & Keno: Record profit result (despite cycling the strong COVID-19 tailwind from 1H21) • Wagering & Media: Heavily impacted by retail closures; improved performance following retail re-openings • Gaming Services: Following extended period of fee relief for customers, returned t
Slide 26: Table of Contents
TA B L E O F CONTENTS 03 - 08 Group Overview 10 - 19 Business Results 21 - 22 Capital 24 - 25 Conclusion 27 - 34 Appendices
Slide 27: Group Operating Expenses
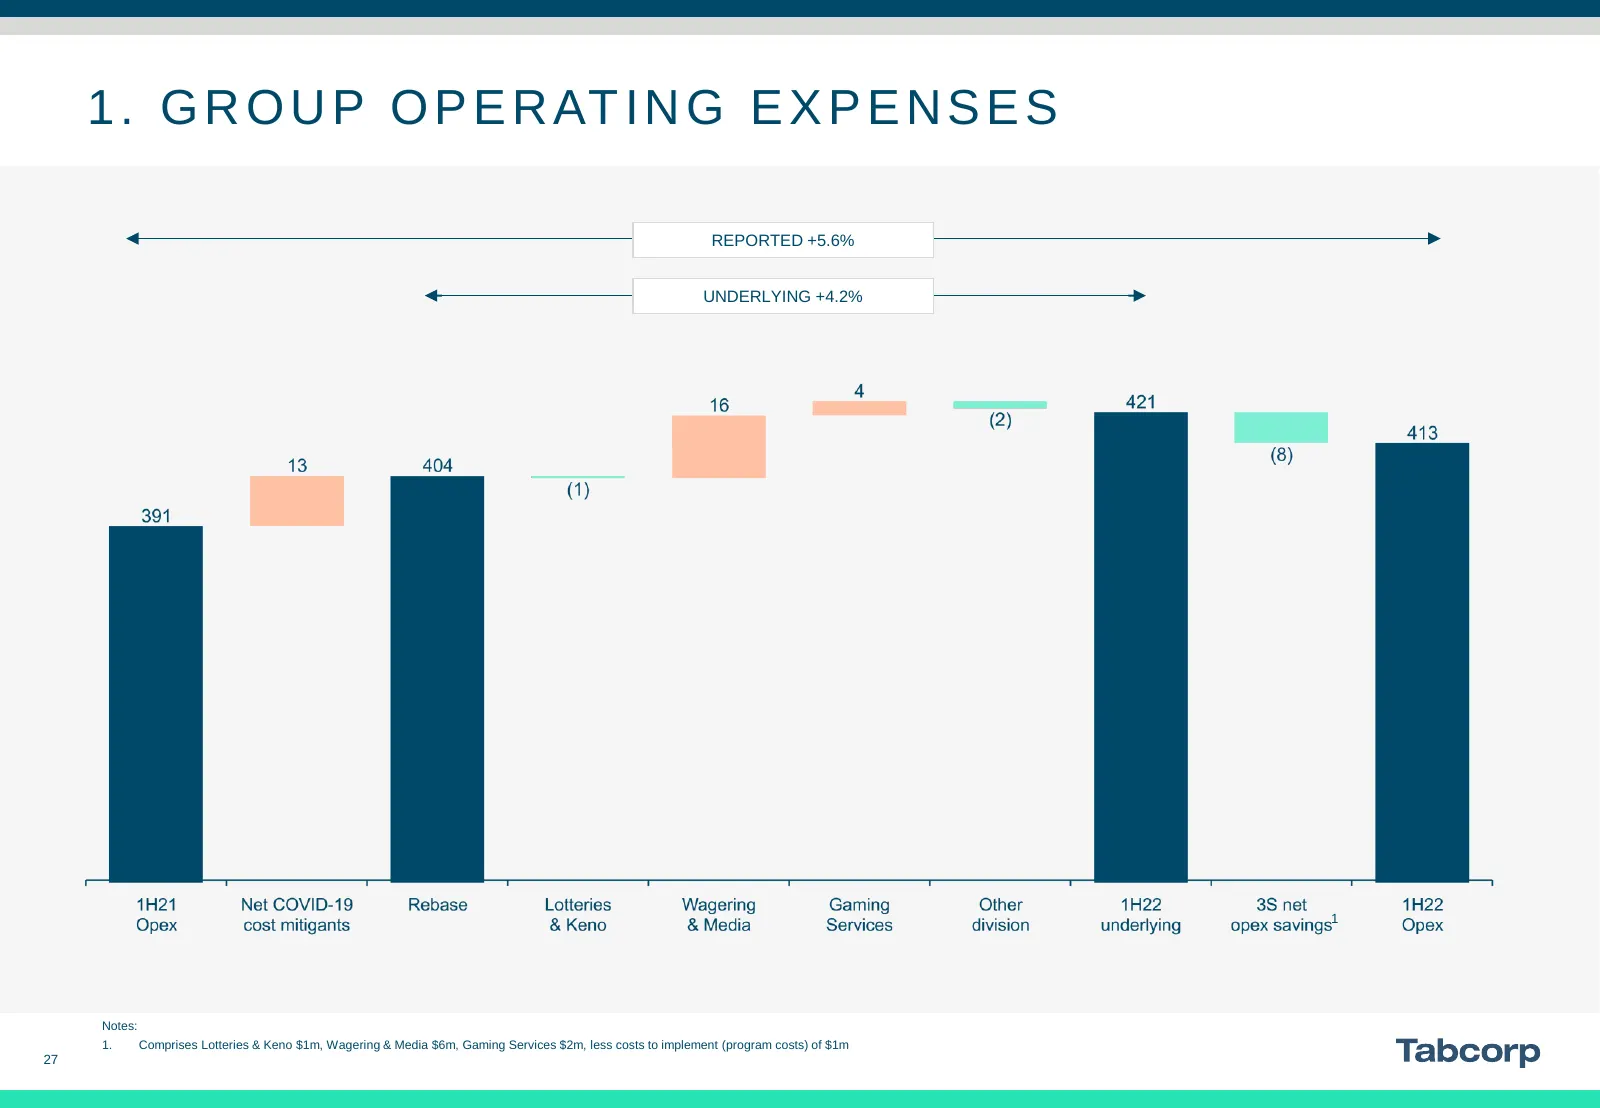
1 . G R O U P O P E R AT I N G E X P E N S E S REPORTED +5.6% UNDERLYING +4.2% 1 Notes: 1. Comprises Lotteries & Keno $1m, Wagering & Media $6m, Gaming Services $2m, less costs to implement (program costs) of $1m 27
Slide 28: Group Results
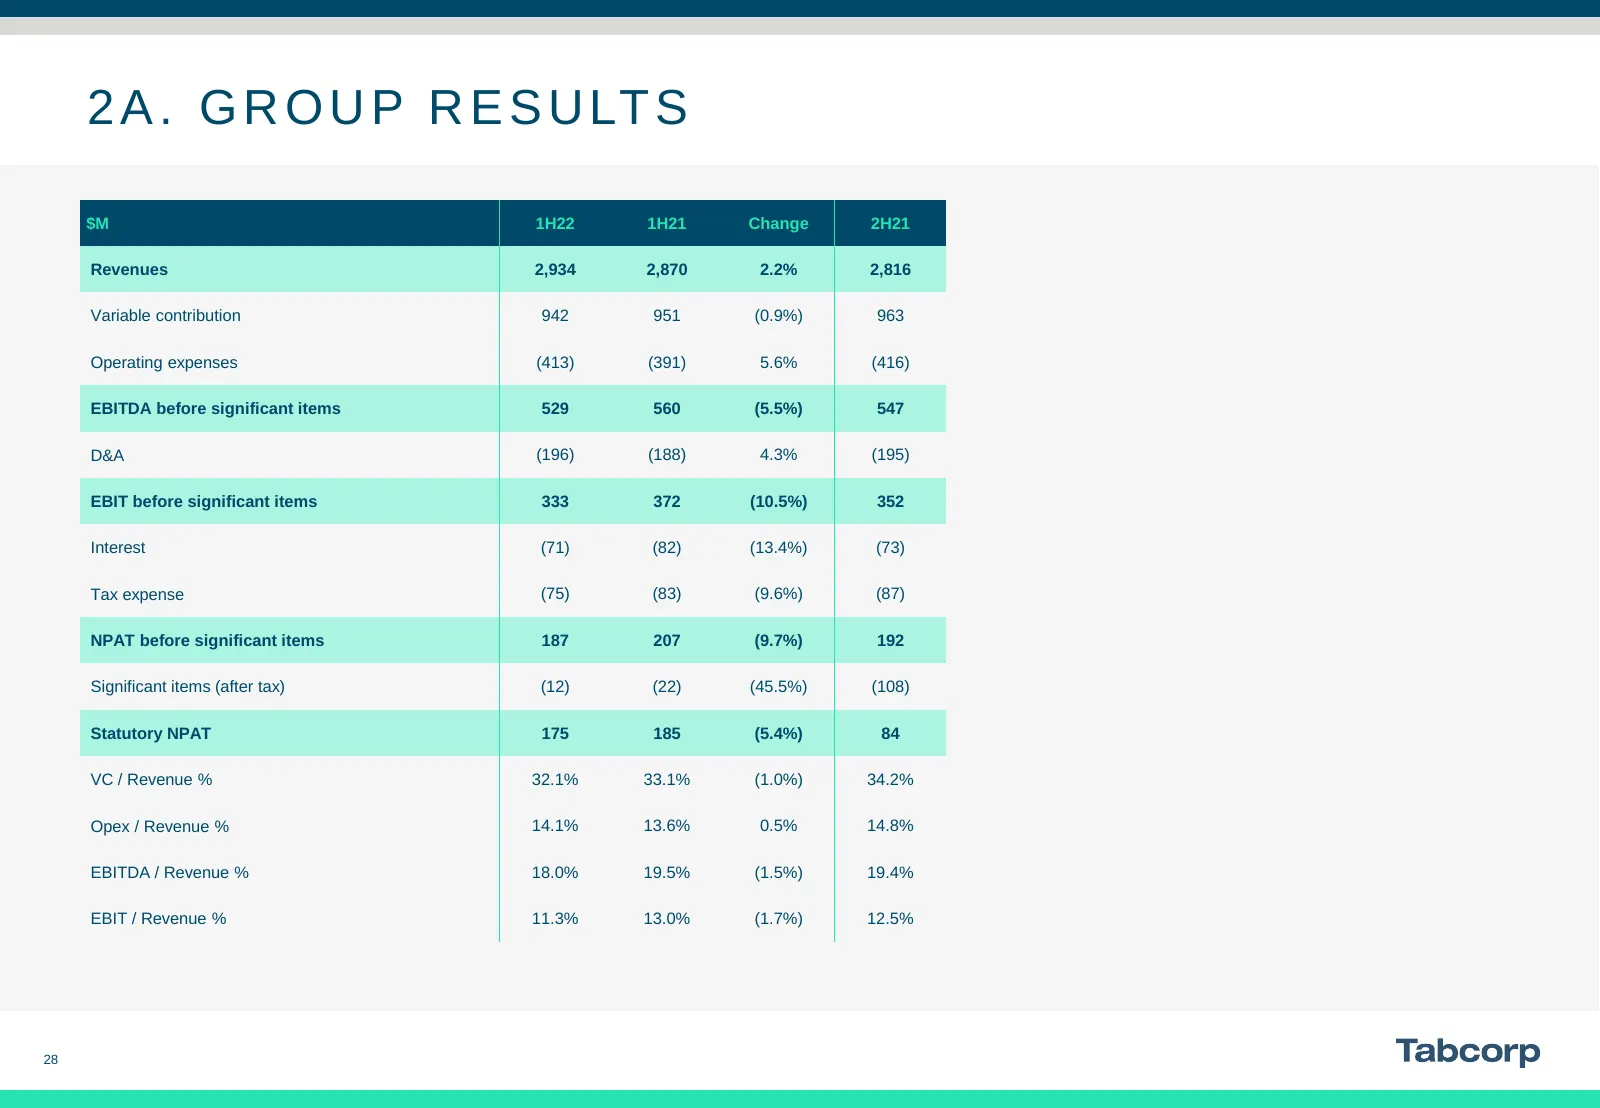
2 A . G R O U P R E S U LT S $M 1H22 1H21 Change 2H21 Revenues 2,934 2,870 2.2% 2,816 Variable contribution 942 951 (0.9%) 963 Operating expenses (413) (391) 5.6% (416) EBITDA before significant items 529 560 (5.5%) 547 D&A (196) (188) 4.3% (195) EBIT before significant items 333 372 (10.5%) 352 Int
Slide 29: Lotteries & Keno Results
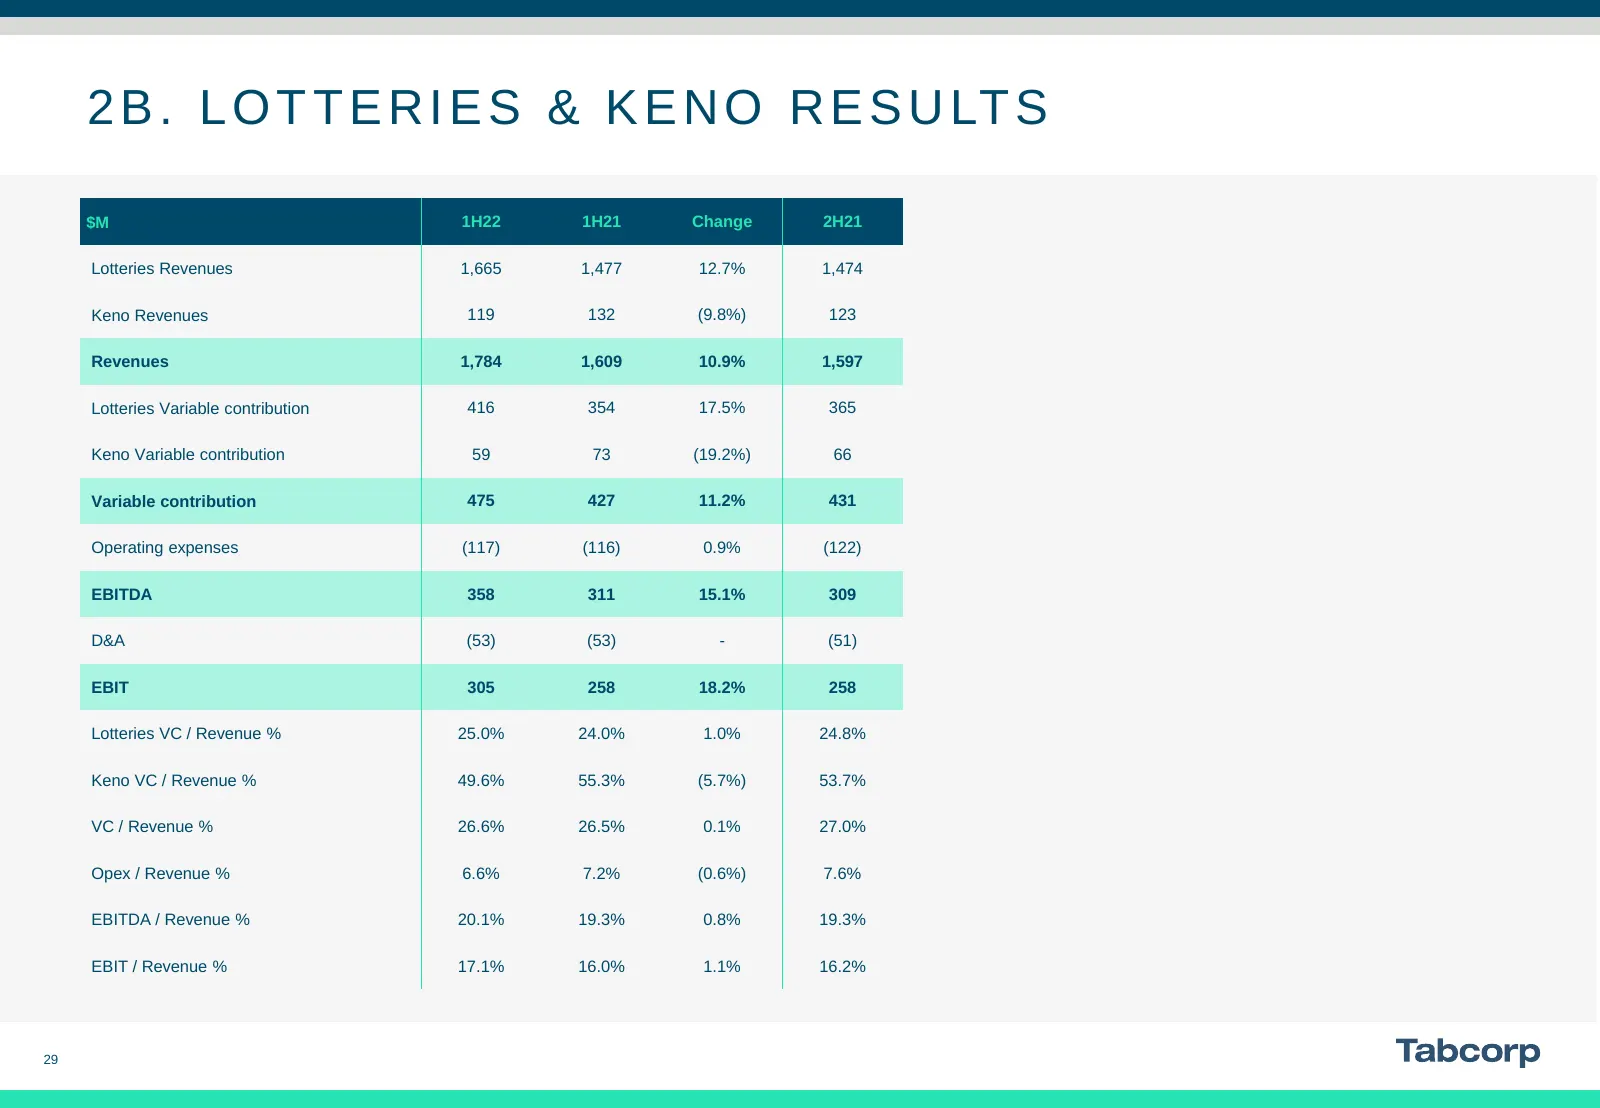
2 B . L O T T E R I E S & K E N O R E S U LT S $M 1H22 1H21 Change 2H21 Lotteries Revenues 1,665 1,477 12.7% 1,474 Keno Revenues 119 132 (9.8%) 123 Revenues 1,784 1,609 10.9% 1,597 Lotteries Variable contribution 416 354 17.5% 365 Keno Variable contribution 59 73 (19.2%) 66 Variable contribution 475
Slide 30: Wagering & Media Results
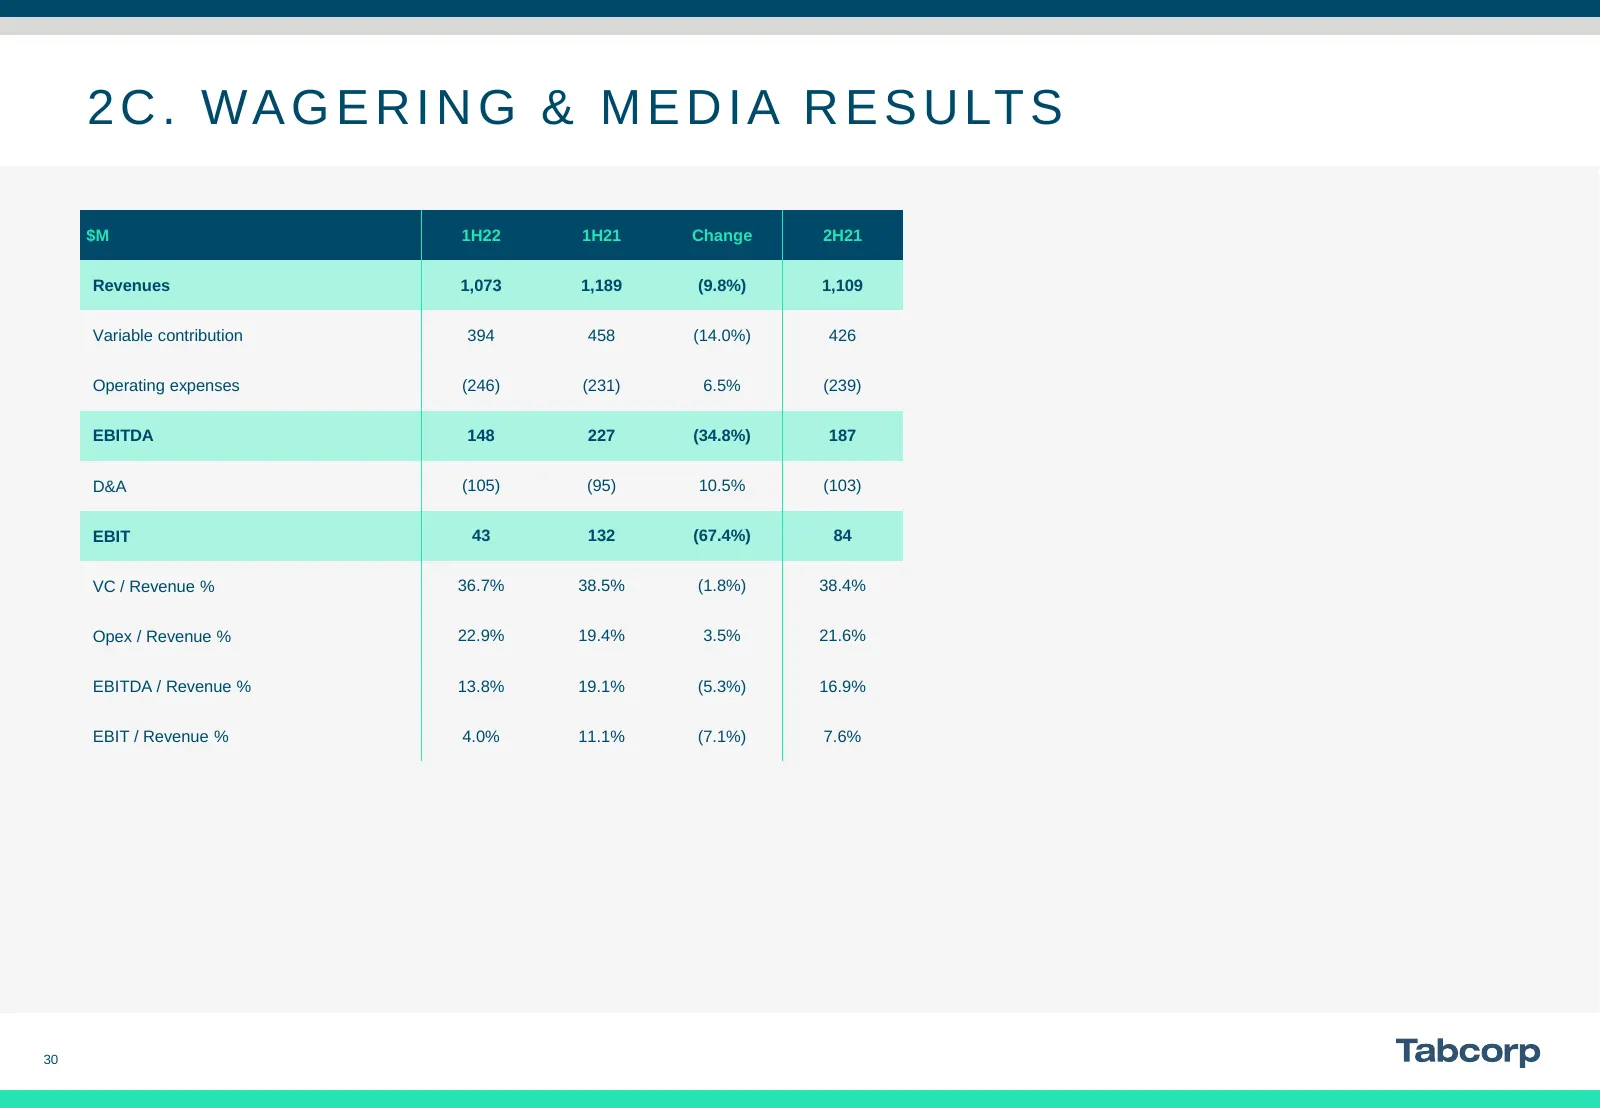
2 C . WA G E R I N G & M E D I A R E S U LT S $M 1H22 1H21 Change 2H21 Revenues 1,073 1,189 (9.8%) 1,109 Variable contribution 394 458 (14.0%) 426 Operating expenses (246) (231) 6.5% (239) EBITDA 148 227 (34.8%) 187 D&A (105) (95) 10.5% (103) EBIT 43 132 (67.4%) 84 VC / Revenue % 36.7% 38.5% (1.8%)
Slide 31: Gaming Services Results
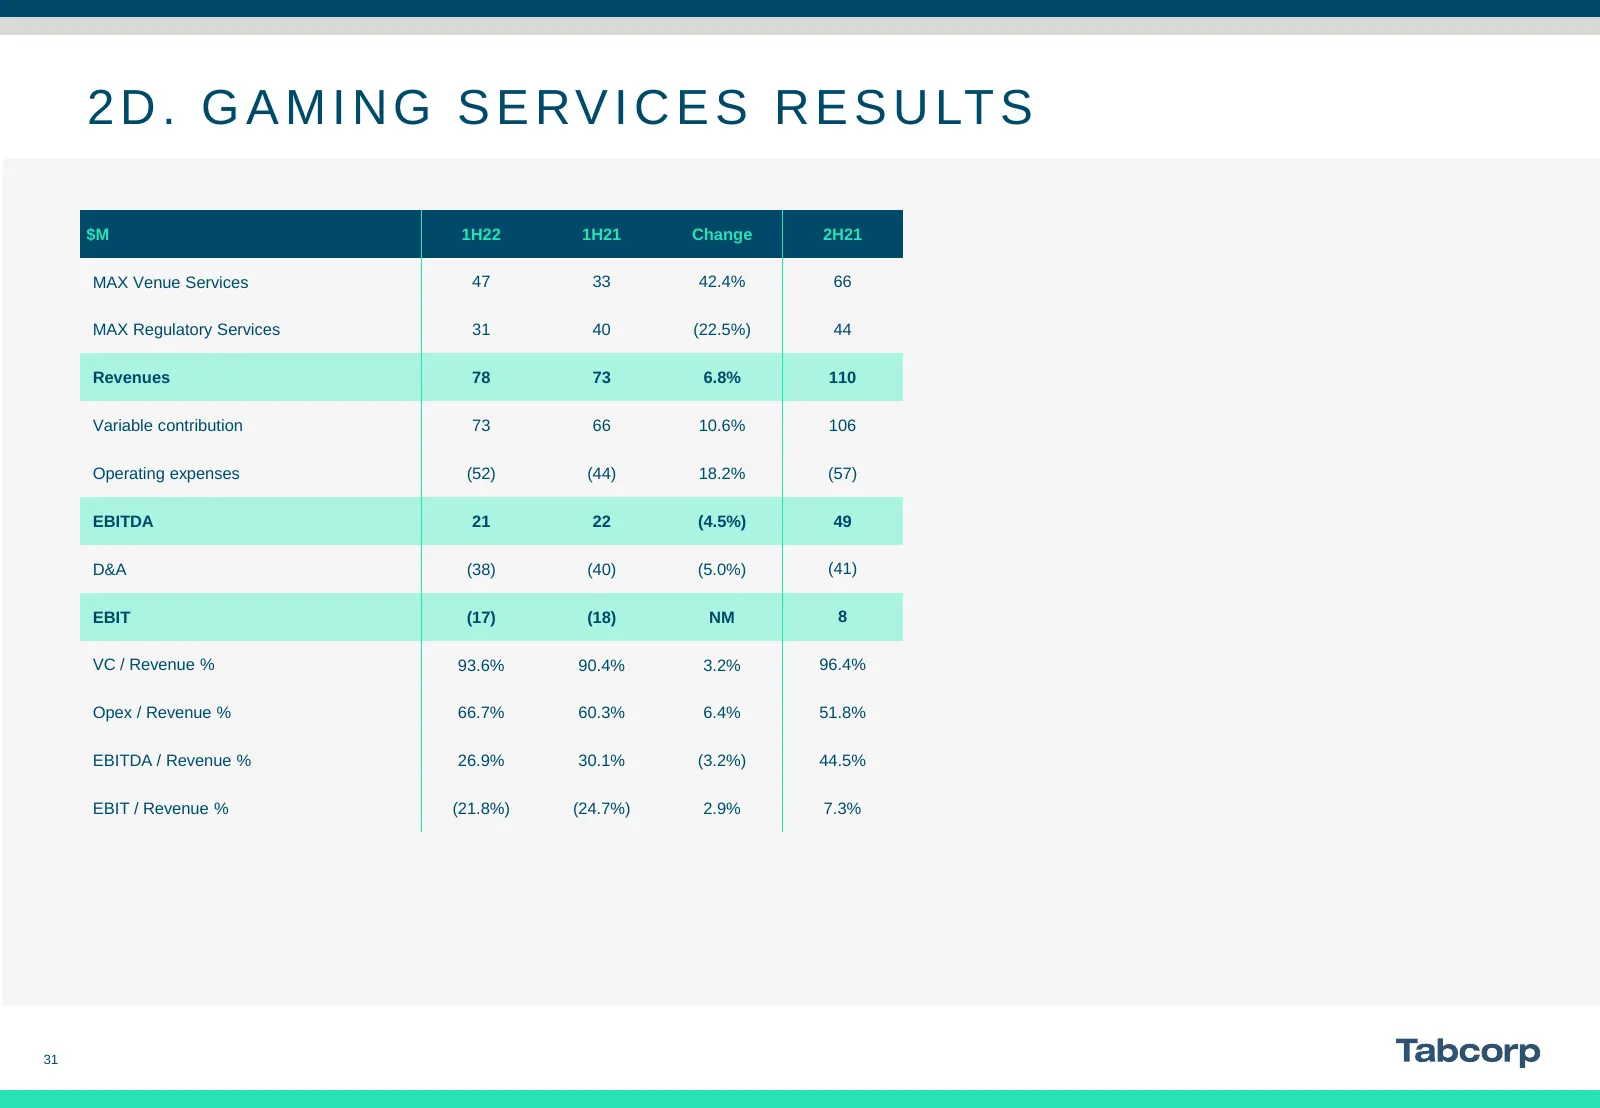
2 D . G A M I N G S E R V I C E S R E S U LT S $M 1H22 1H21 Change 2H21 MAX Venue Services 47 33 42.4% 66 MAX Regulatory Services 31 40 (22.5%) 44 Revenues 78 73 6.8% 110 Variable contribution 73 66 10.6% 106 Operating expenses (52) (44) 18.2% (57) EBITDA 21 22 (4.5%) 49 D&A (38) (40) (5.0%) (41) EB
Slide 32: Additional KPIs
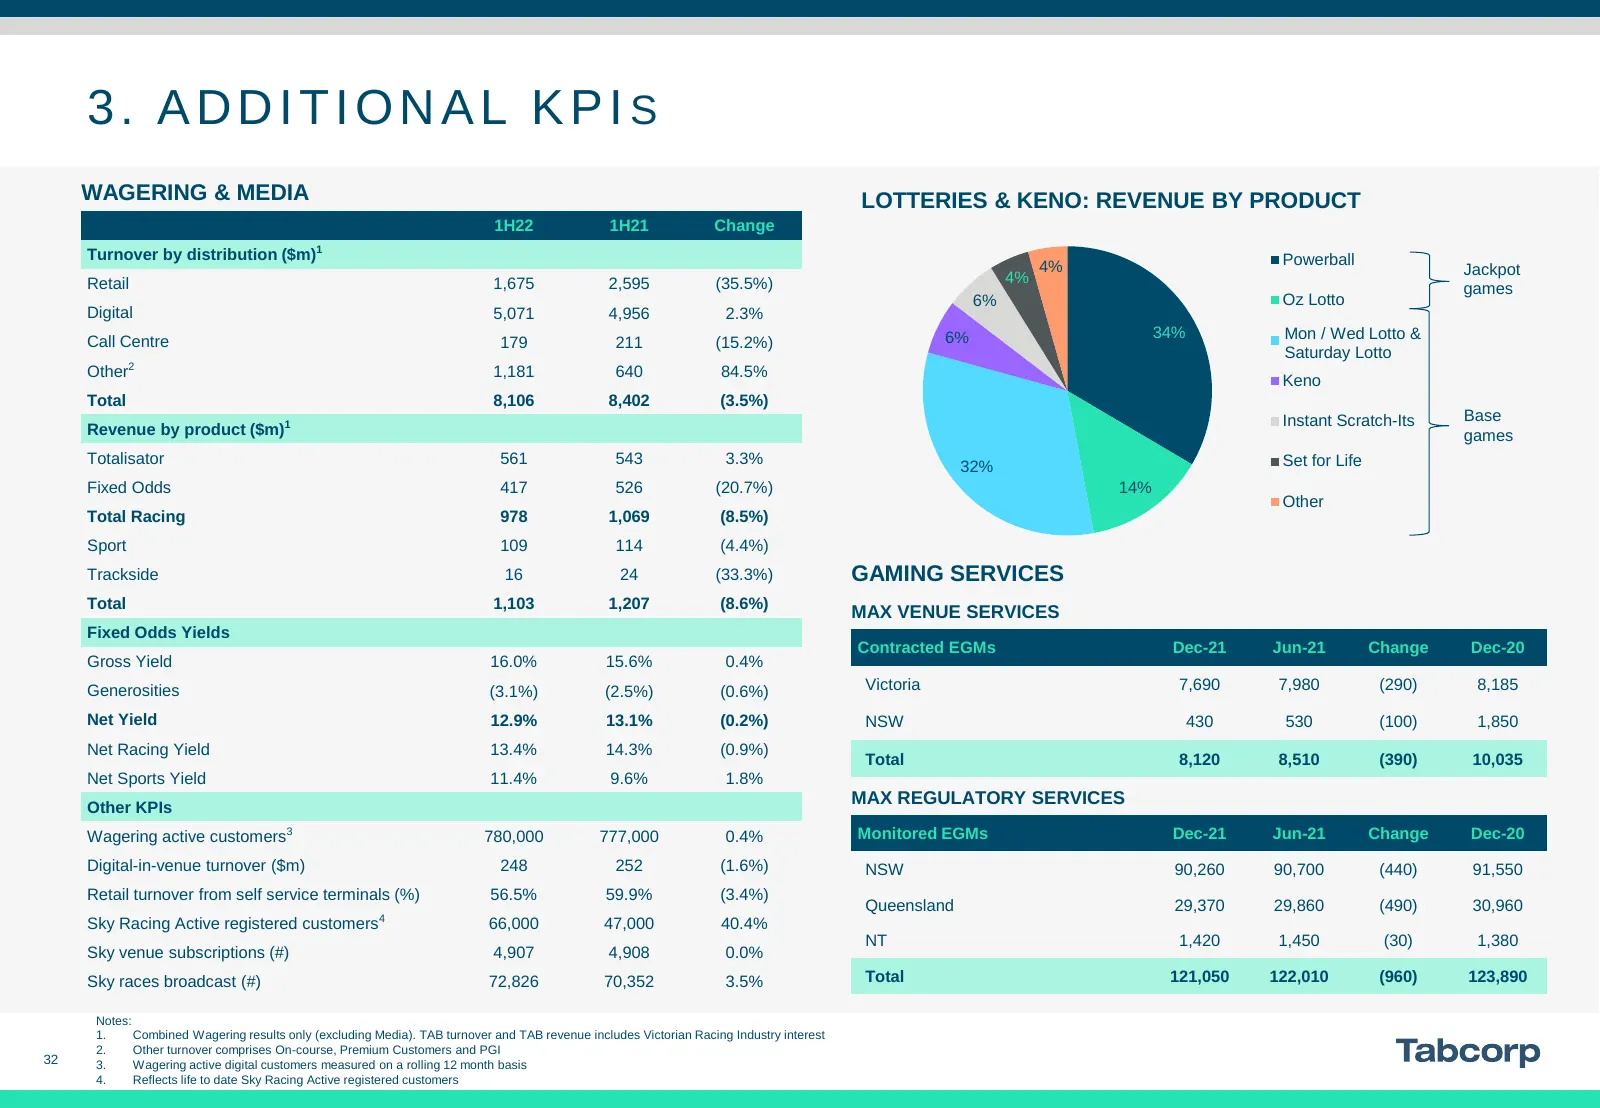
3. ADDITIONAL KPIS WAGERING & MEDIA LOTTERIES & KENO: REVENUE BY PRODUCT 1H22 1H21 Change Turnover by distribution ($m)1 Powerball 4% Jackpot Retail 1,675 2,595 (35.5%) 4% games 6% Oz Lotto Digital 5,071 4,956 2.3% 6% 34% Mon // Wed Mon Wed Lotto Lotto & & Call Centre 179 211 (15.2%) Saturday Lotto
Slide 33: Balance Sheet
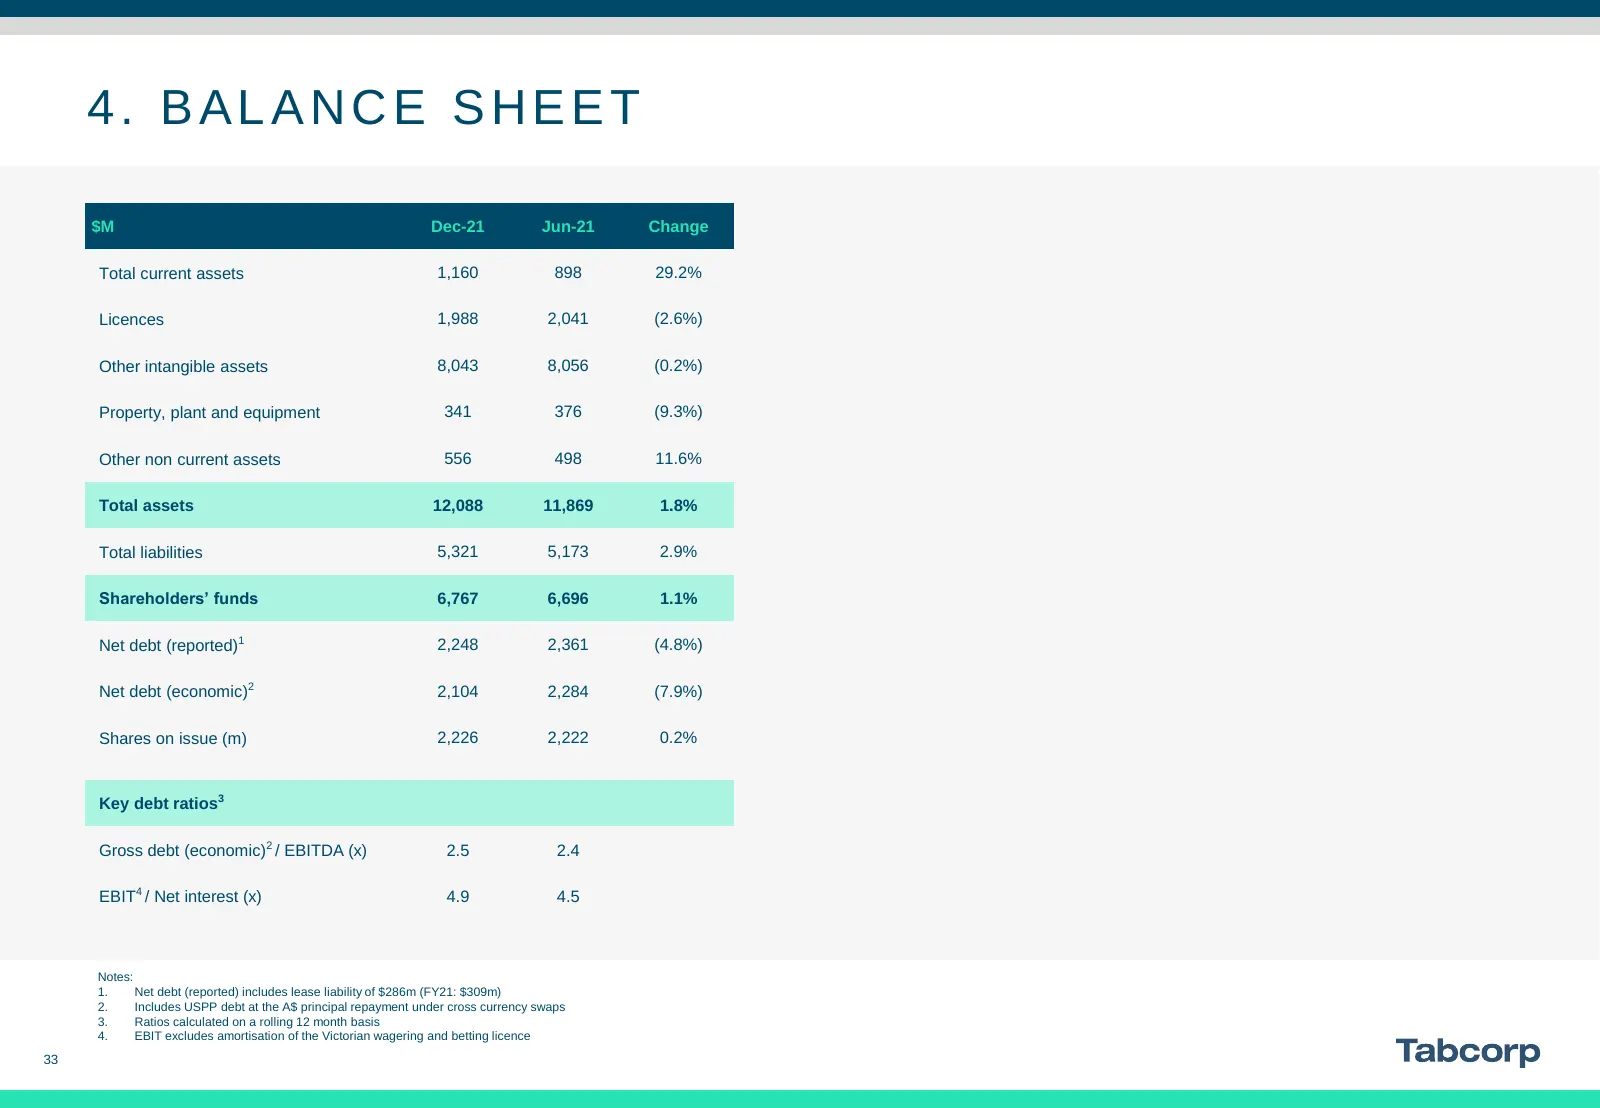
4. BALANCE SHEET $M Dec-21 Jun-21 Change Total current assets 1,160 898 29.2% Licences 1,988 2,041 (2.6%) Other intangible assets 8,043 8,056 (0.2%) Property, plant and equipment 341 376 (9.3%) Other non current assets 556 498 11.6% Total assets 12,088 11,869 1.8% Total liabilities 5,321 5,173 2.9%
Slide 34: Glossary
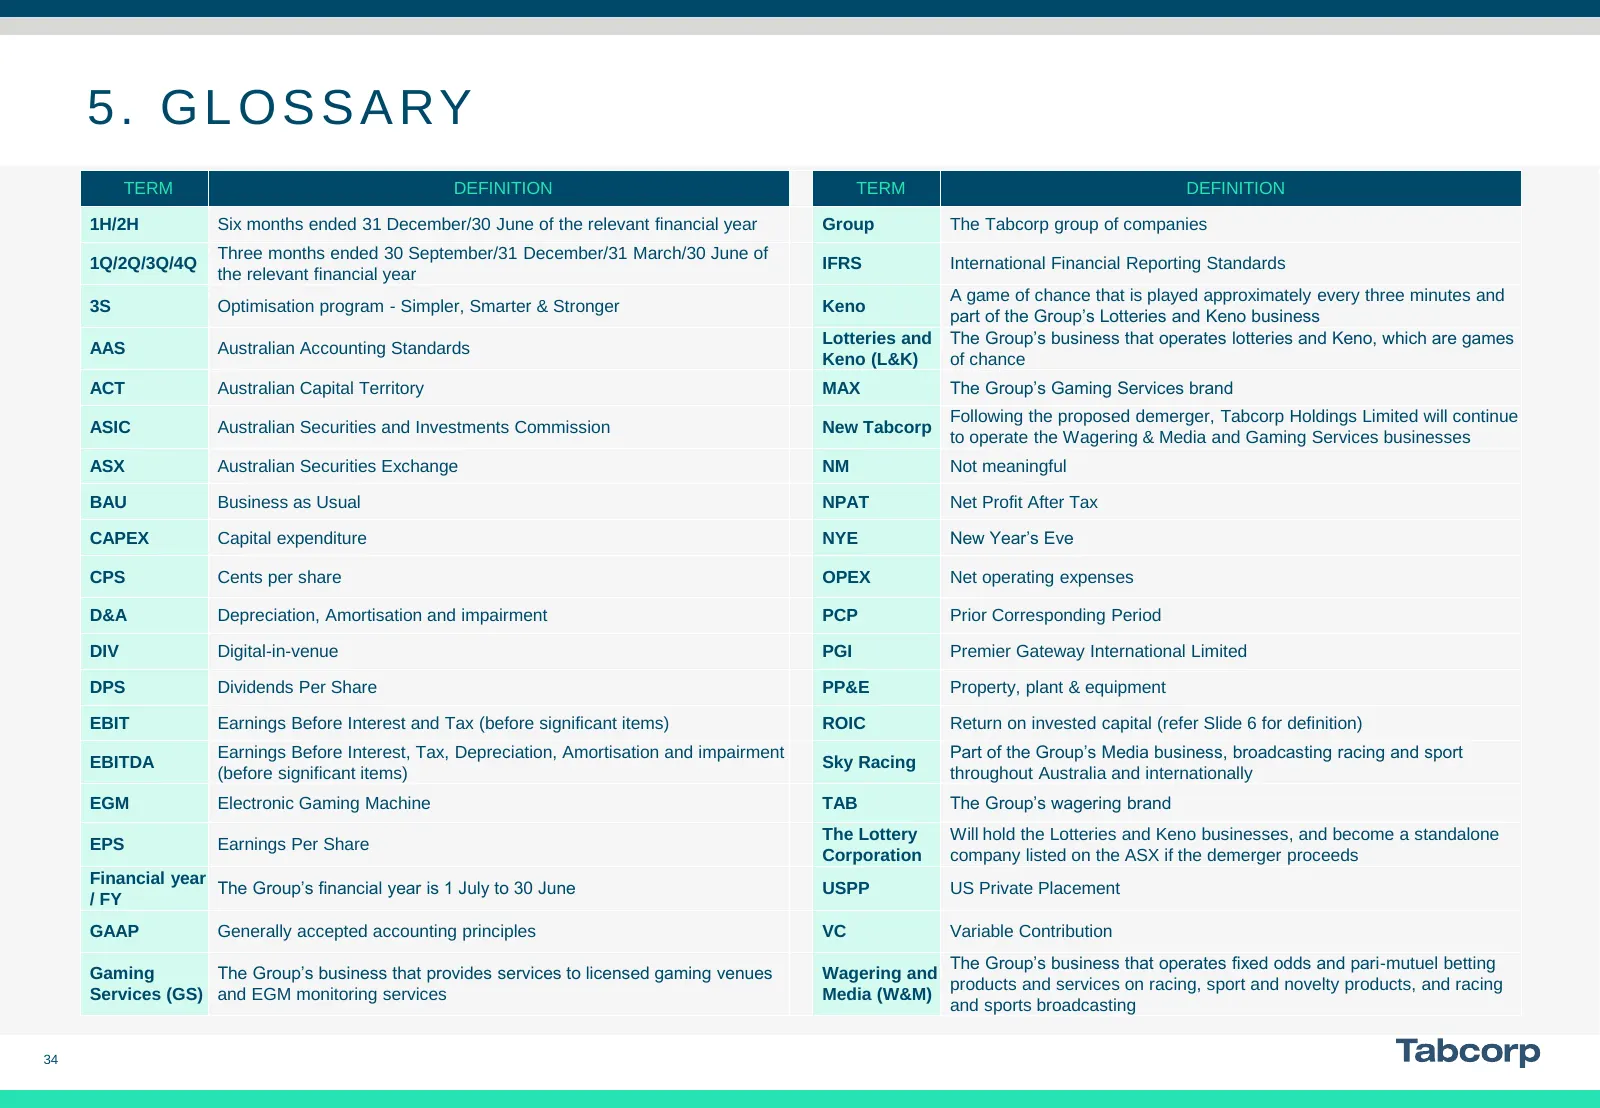
5. GLOSSARY TERM DEFINITION TERM DEFINITION 1H/2H Six months ended 31 December/30 June of the relevant financial year Group The Tabcorp group of companies Three months ended 30 September/31 December/31 March/30 June of 1Q/2Q/3Q/4Q IFRS International Financial Reporting Standards the relevant financi
Slide 35: Disclaimer
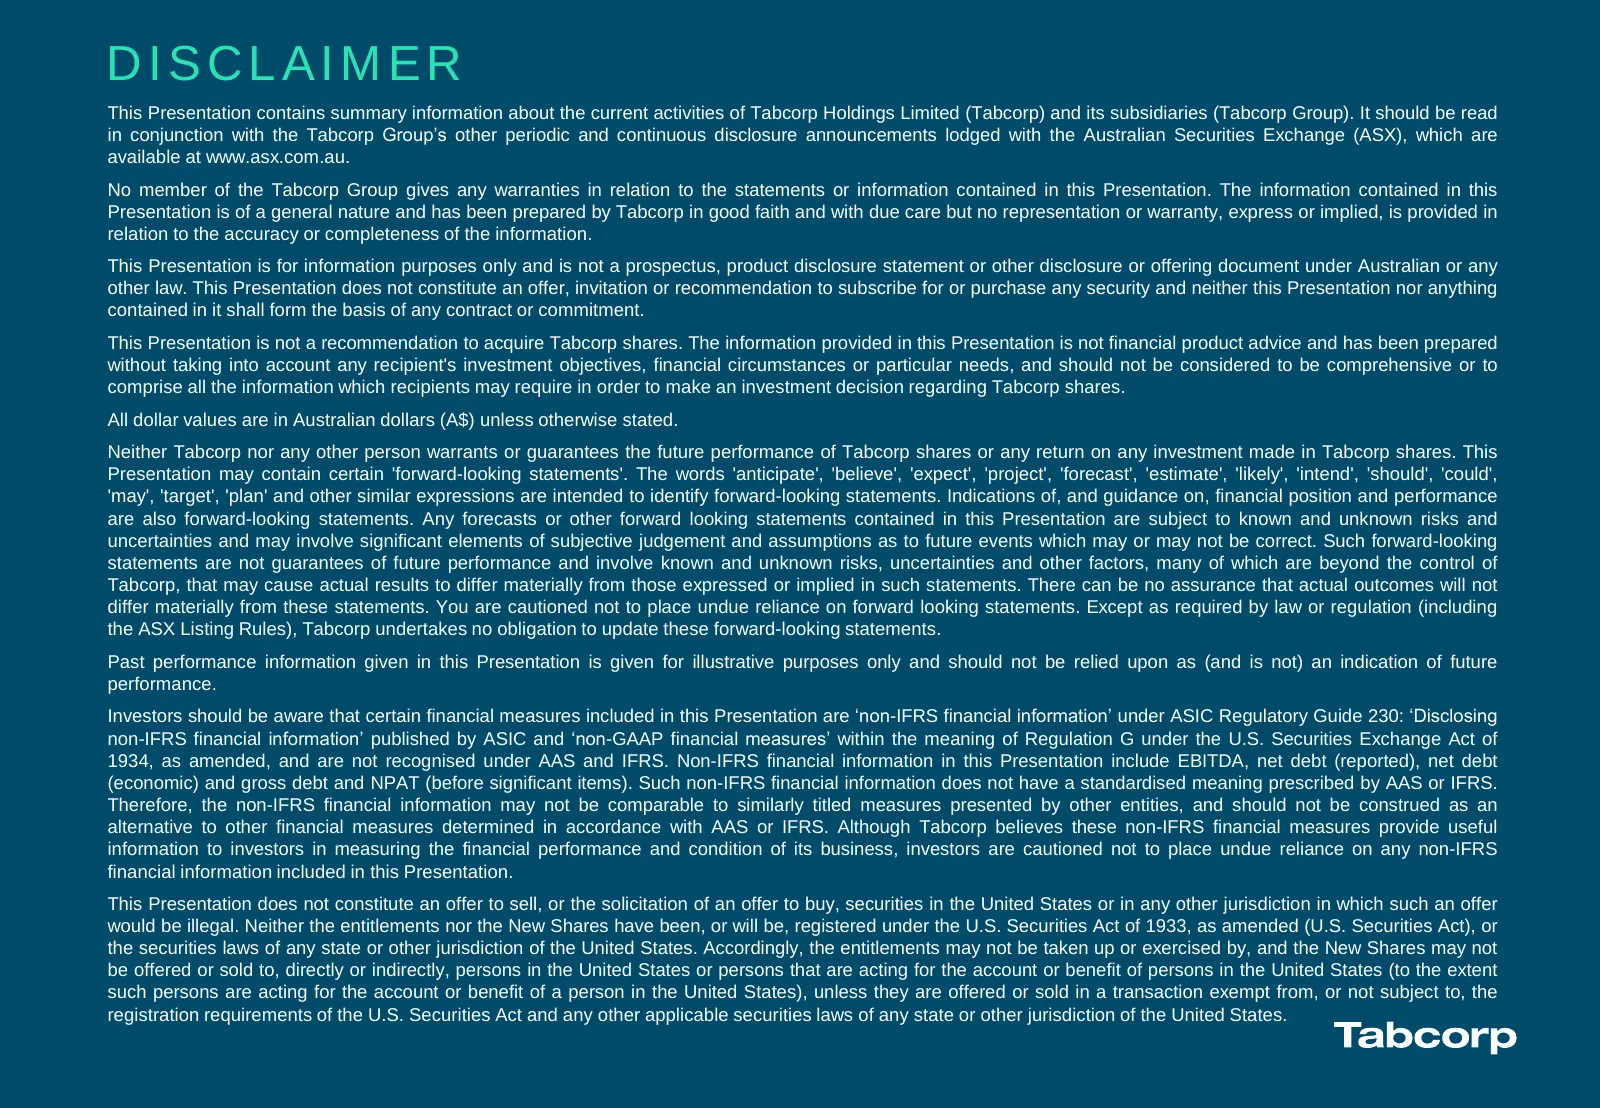
DISCLAIMER This Presentation contains summary information about the current activities of Tabcorp Holdings Limited (Tabcorp) and its subsidiaries (Tabcorp Group). It should be read in conjunction with the Tabcorp Group’s other periodic and continuous disclosure announcements lodged with the Australi
Slide 36: Tabcorp
Tabcorp RACING
Source: Internet Archive copy of tabcorp.com.au
More decks from Tabcorp Holdings Limited
 FY2026 Earnings Presentation40 slides · Aug 26, 2026
 FY2026 Earnings Presentation39 slides · Aug 25, 2026
 Investor Presentation (August 2026)16 slides · Aug 10, 2026
 Macquarie Australia Conference 202614 slides · May 5, 2026
 1H26 Earnings Presentation39 slides · Feb 25, 2026
 Shareholder Meeting (October 2025)17 slides · Oct 20, 2025