Magnetite Mines Ltd. · ASX:MGT
Magnetite Mines — SACOME (March 2013)
22 slides from Magnetite Mines's conference presentation, Mar 21, 2013
Slide 1: Razorback: Making a low grade magnetite work
Razorback: Making a low grade magnetite WO rk 21 March 2013
Slide 2: Disclaimer and Competent Person's Statement
DISCLAIMER AND COMPETENT PERSON’S STATEMENT This presentation has been prepared by Royal Resources Limited (ABN 34 108 102 432) (“Royal”) based on information available to it. No representation or warranty, express or implied, is made as to the fairness, accuracy, completeness or correctness of the
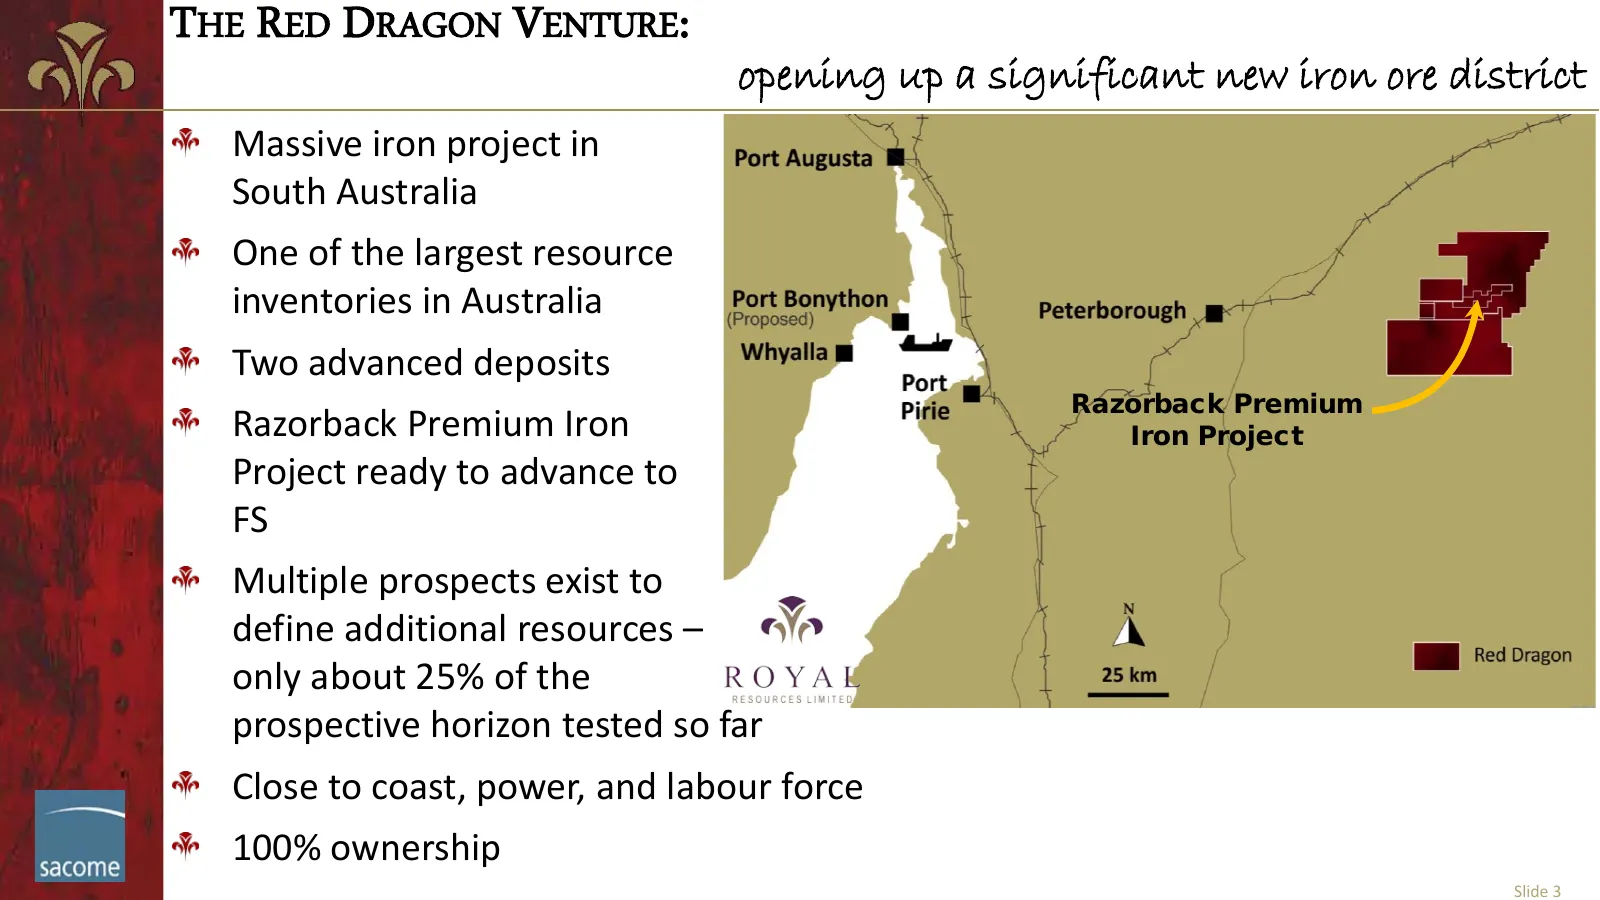
Slide 3: The Red Dragon Venture: opening up a significant new iron ore district
THE RED DRAGON VENTURE: opening up a significant new iron ore district Massive iron project in South Australia One of the largest resource inventories in Australia Two advanced deposits Razorback Premium Razorback Premium Iron Iron Project Project ready to advance to FS Multiple prospects exist to d
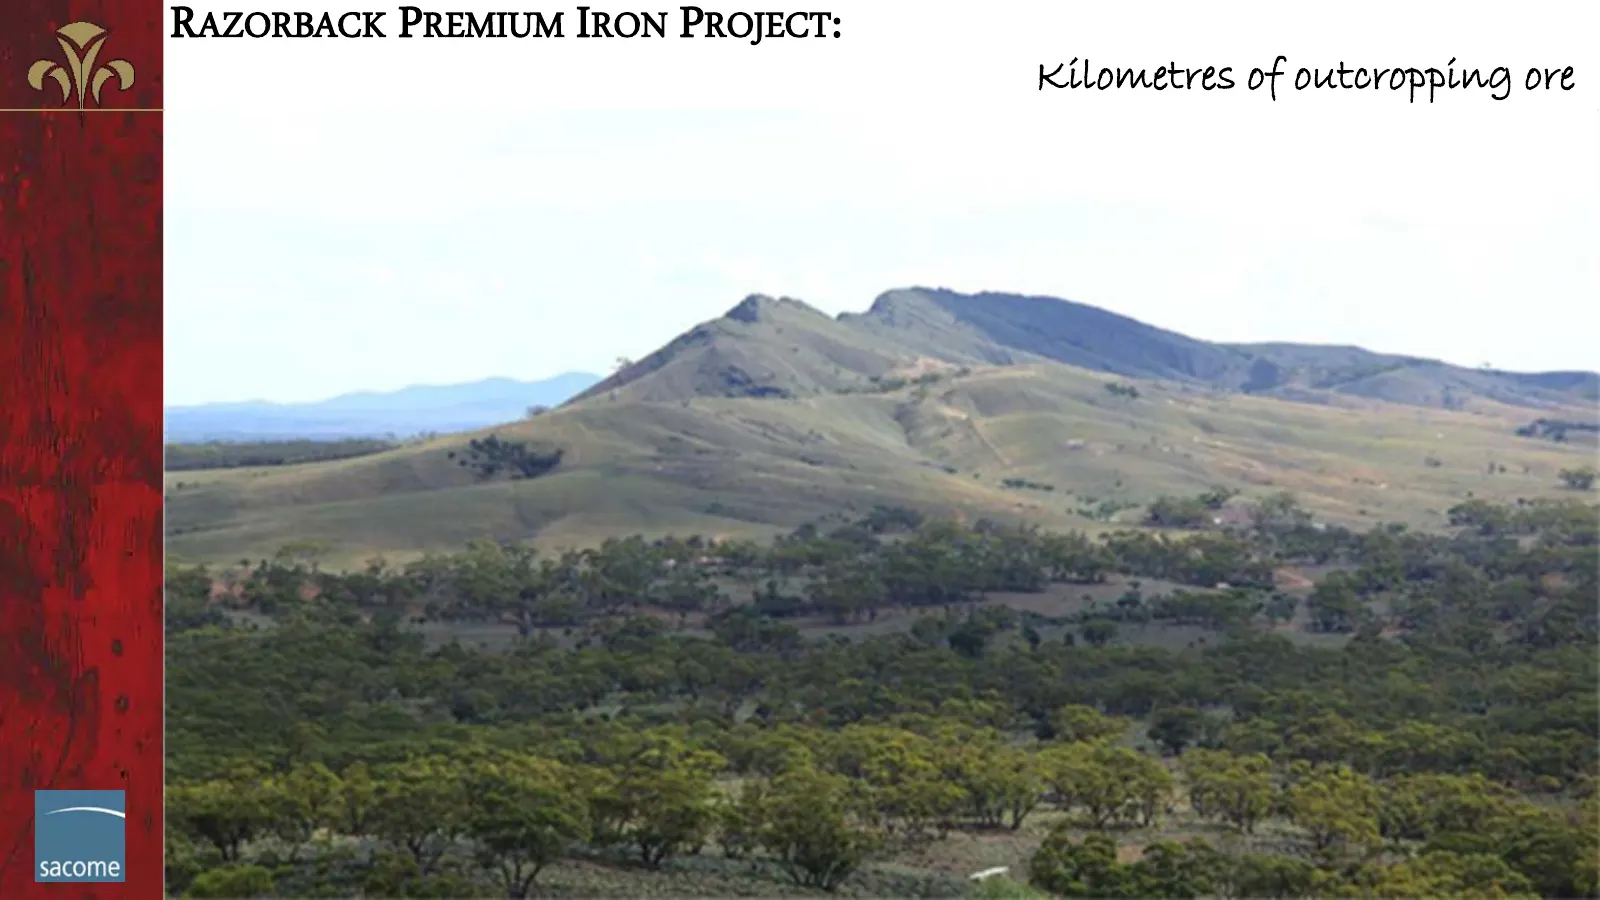
Slide 4: Razorback Premium Iron Project: Kilometres of outcropping ore
RAZORBACK PREMIUM IRON PROJECT: Kilometres of outcropping ore Slide 4
Slide 5: Razorback Premium Iron Project Concept: A company making opportunity
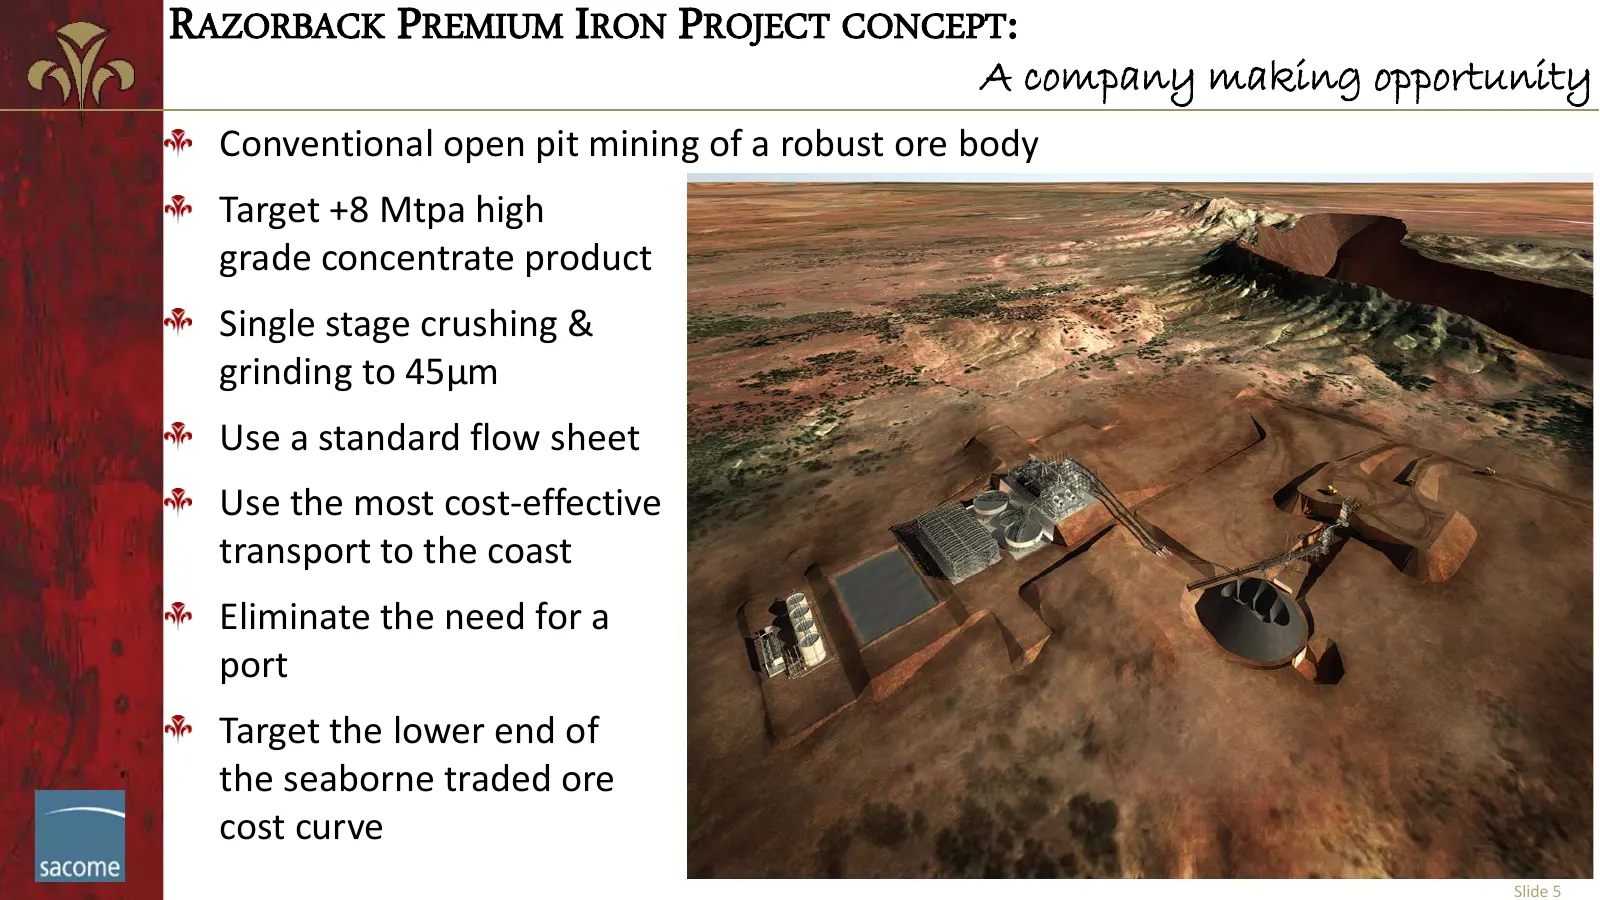
RAZORBACK PREMIUM IRON PROJECT CONCEPT: A company making opportunity Conventional open pit mining of a robust ore body Target +8 Mtpa high grade concentrate product Single stage crushing & grinding to 45µm Use a standard flow sheet Use the most cost-effective transport to the coast Eliminate the nee
Slide 6: Resources: Zero to 3Bt in under three years
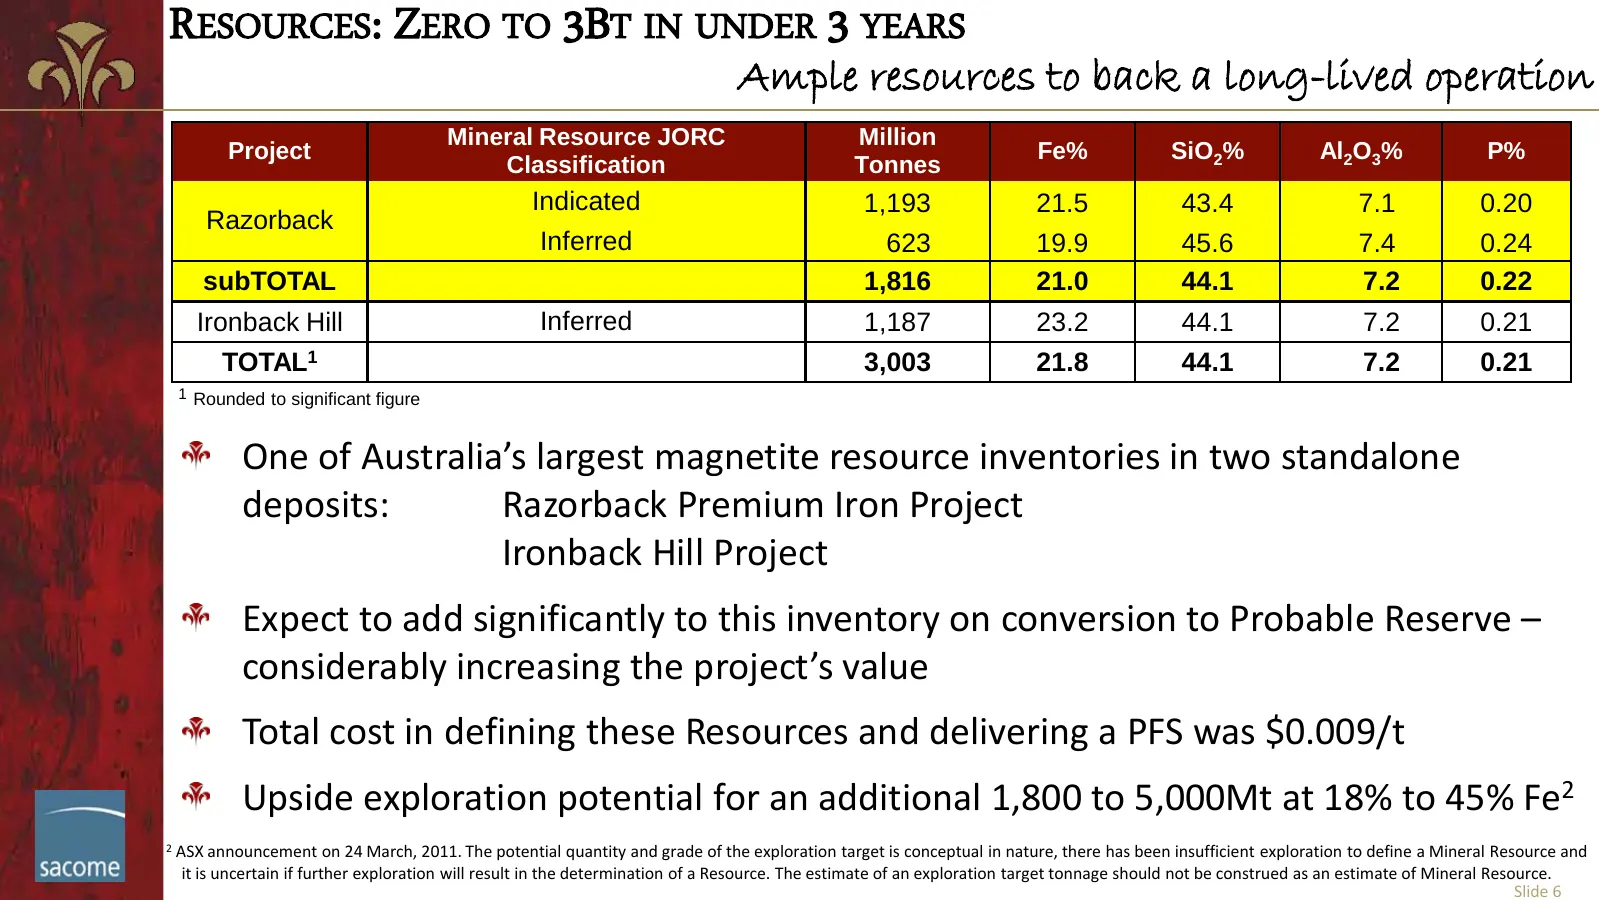
RESOURCES: ZERO TO 3BT IN UNDER 3 YEARS Ample resources to back a long-lived operation Mineral Resource JORC Million Project Fe% SiO2% Al2O3% P% Classification Tonnes Indicated 1,193 21.5 43.4 7.1 0.20 Razorback Inferred 623 19.9 45.6 7.4 0.24 subTOTAL 1,816 21.0 44.1 7.2 0.22 Ironback Hill Inferred
Slide 7: Premium Quality Product
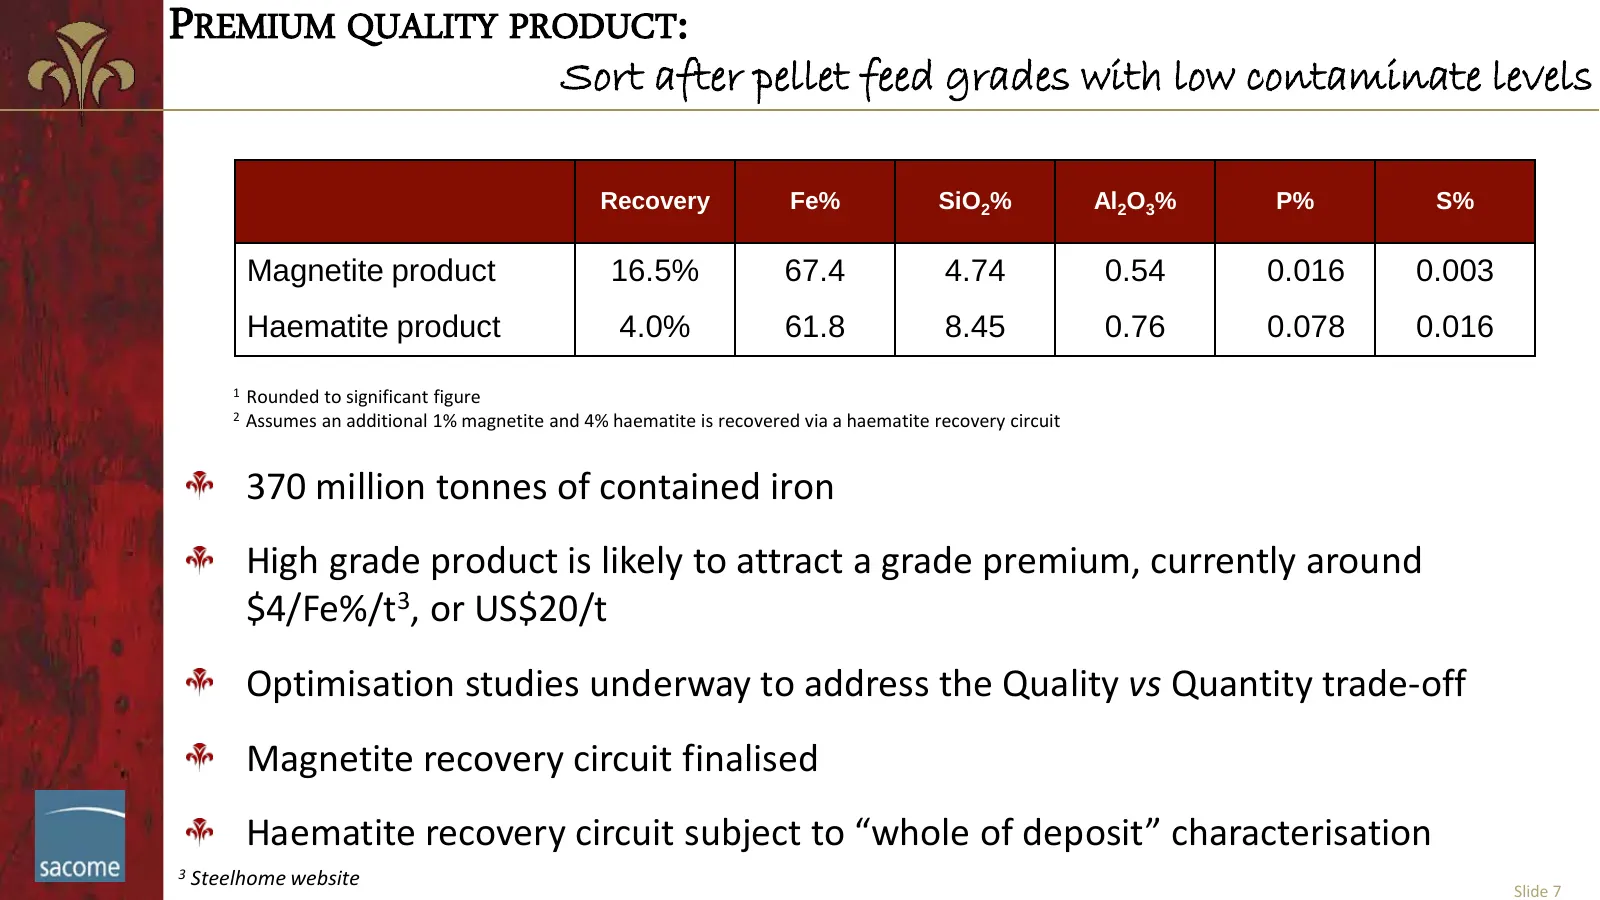
PREMIUM QUALITY PRODUCT: Sort after pellet feed grades with low contaminate levels Recovery Fe% SiO2% Al2O3% P% S% Magnetite product 16.5% 67.4 4.74 0.54 0.016 0.003 Haematite product 4.0% 61.8 8.45 0.76 0.078 0.016 1 Rounded to significant figure 2 Assumes an additional 1% magnetite and 4% haematit
Slide 8: Open Pit Mining: Standard, low risk mining
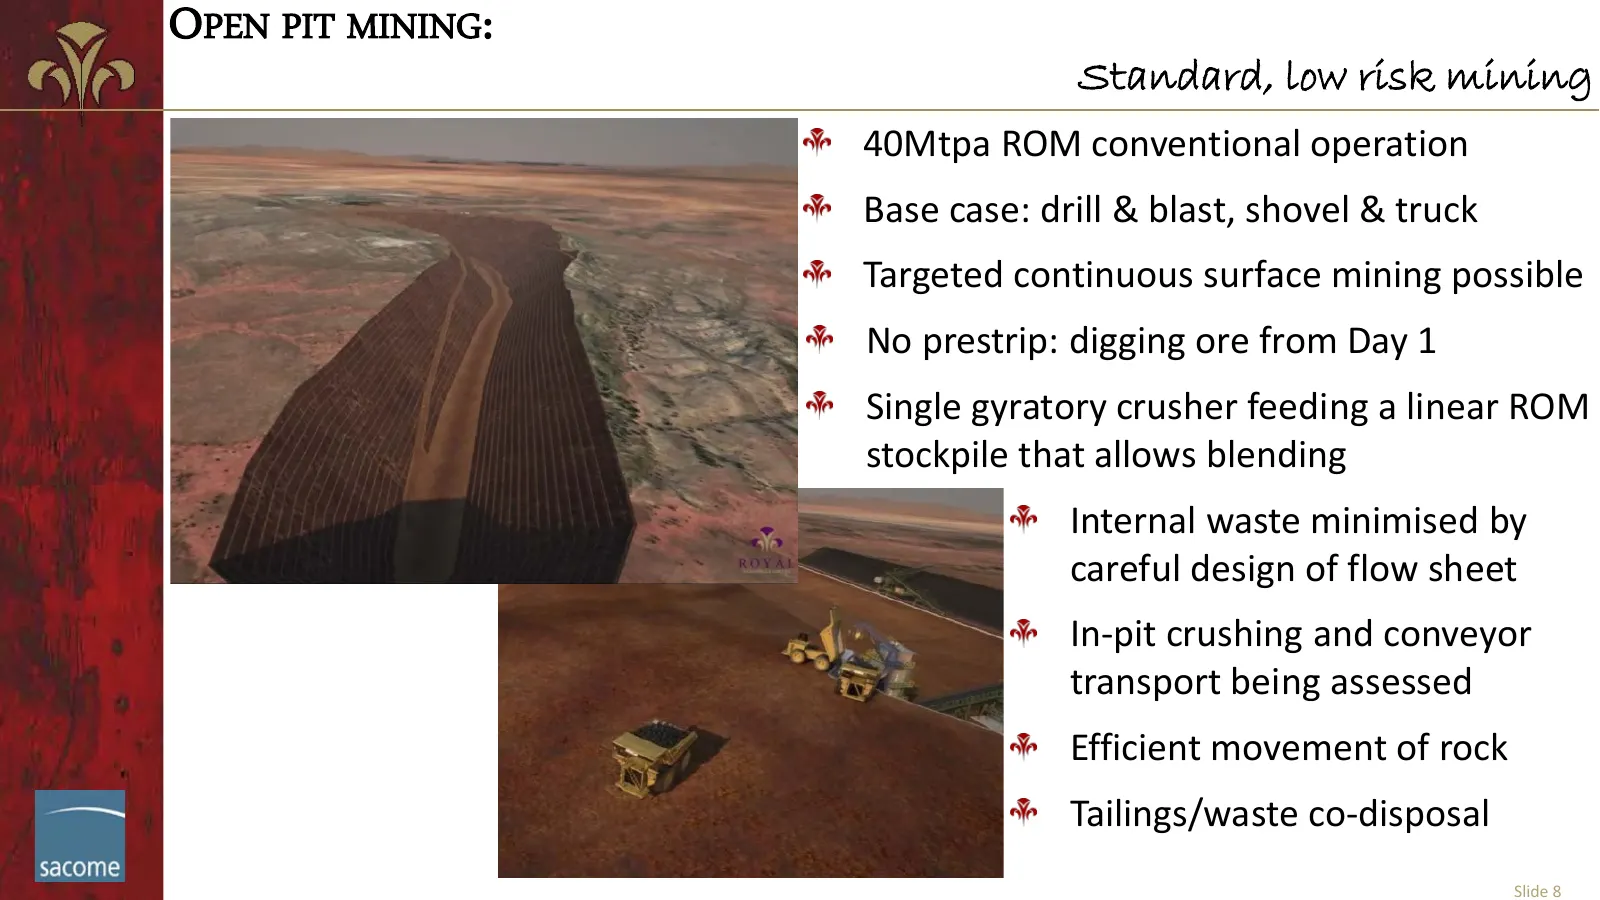
OPEN PIT MINING: Standard, low risk mining 40Mtpa ROM conventional operation Base case: drill & blast, shovel & truck Targeted continuous surface mining possible No prestrip: digging ore from Day 1 Single gyratory crusher feeding a linear ROM stockpile that allows blending Internal waste minimised b
Slide 9: Pit Configuration
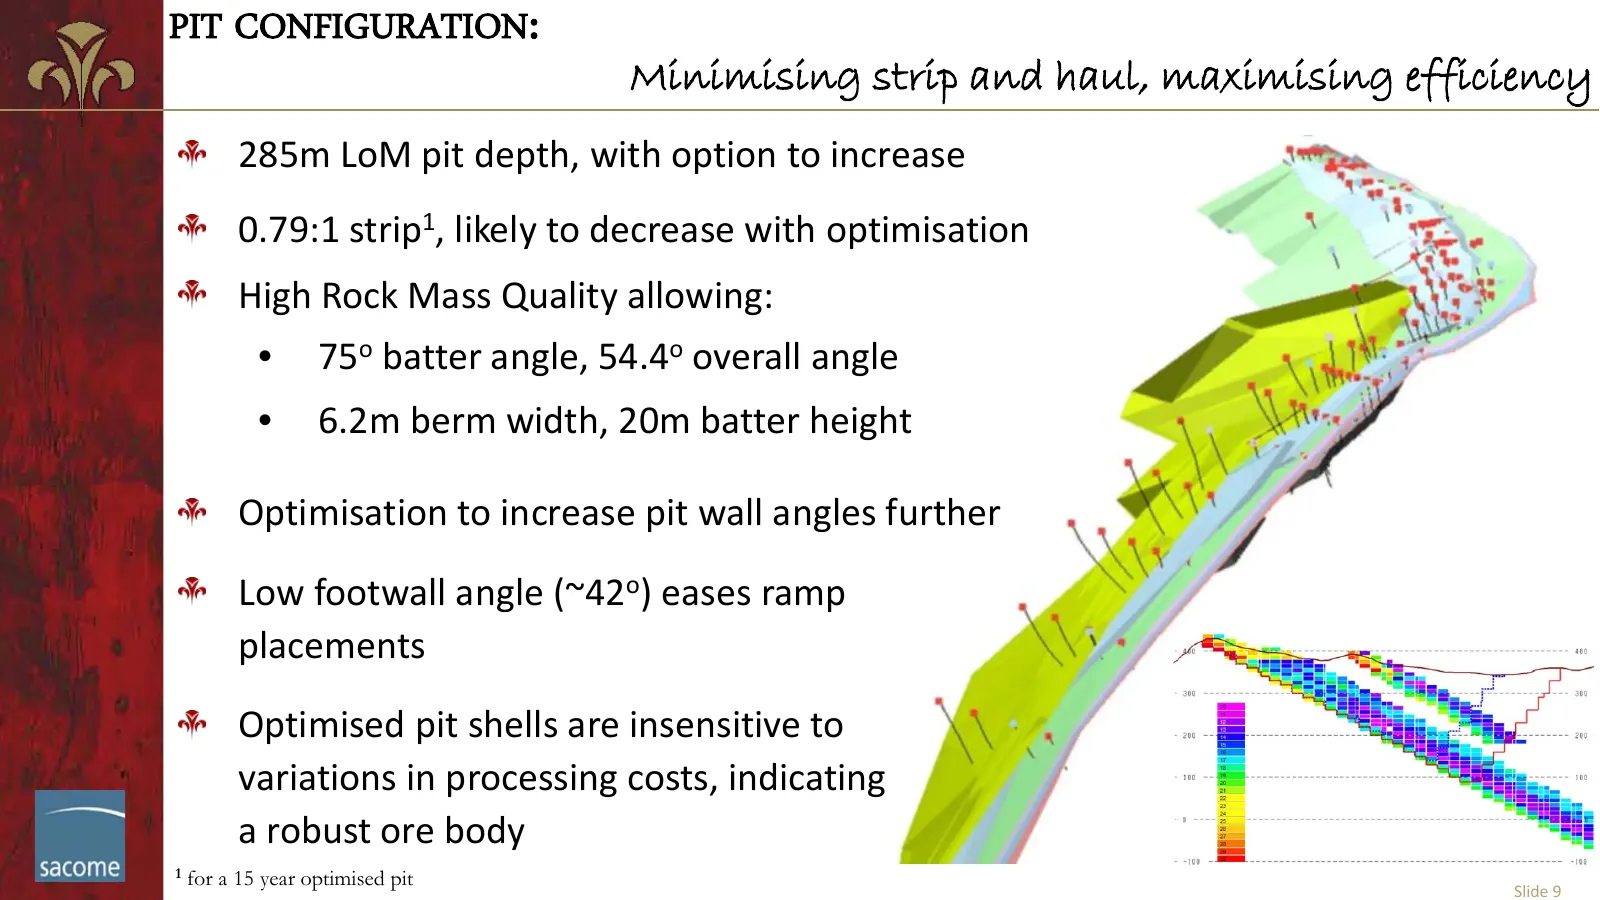
PIT CONFIGURATION: Minimising strip and haul, maximising efficiency 285m LoM pit depth, with option to increase 0.79:1 strip1, likely to decrease with optimisation High Rock Mass Quality allowing: • 75o batter angle, 54.4o overall angle • 6.2m berm width, 20m batter height Optimisation to increase p
Slide 10: Industry Standard Flow Sheet
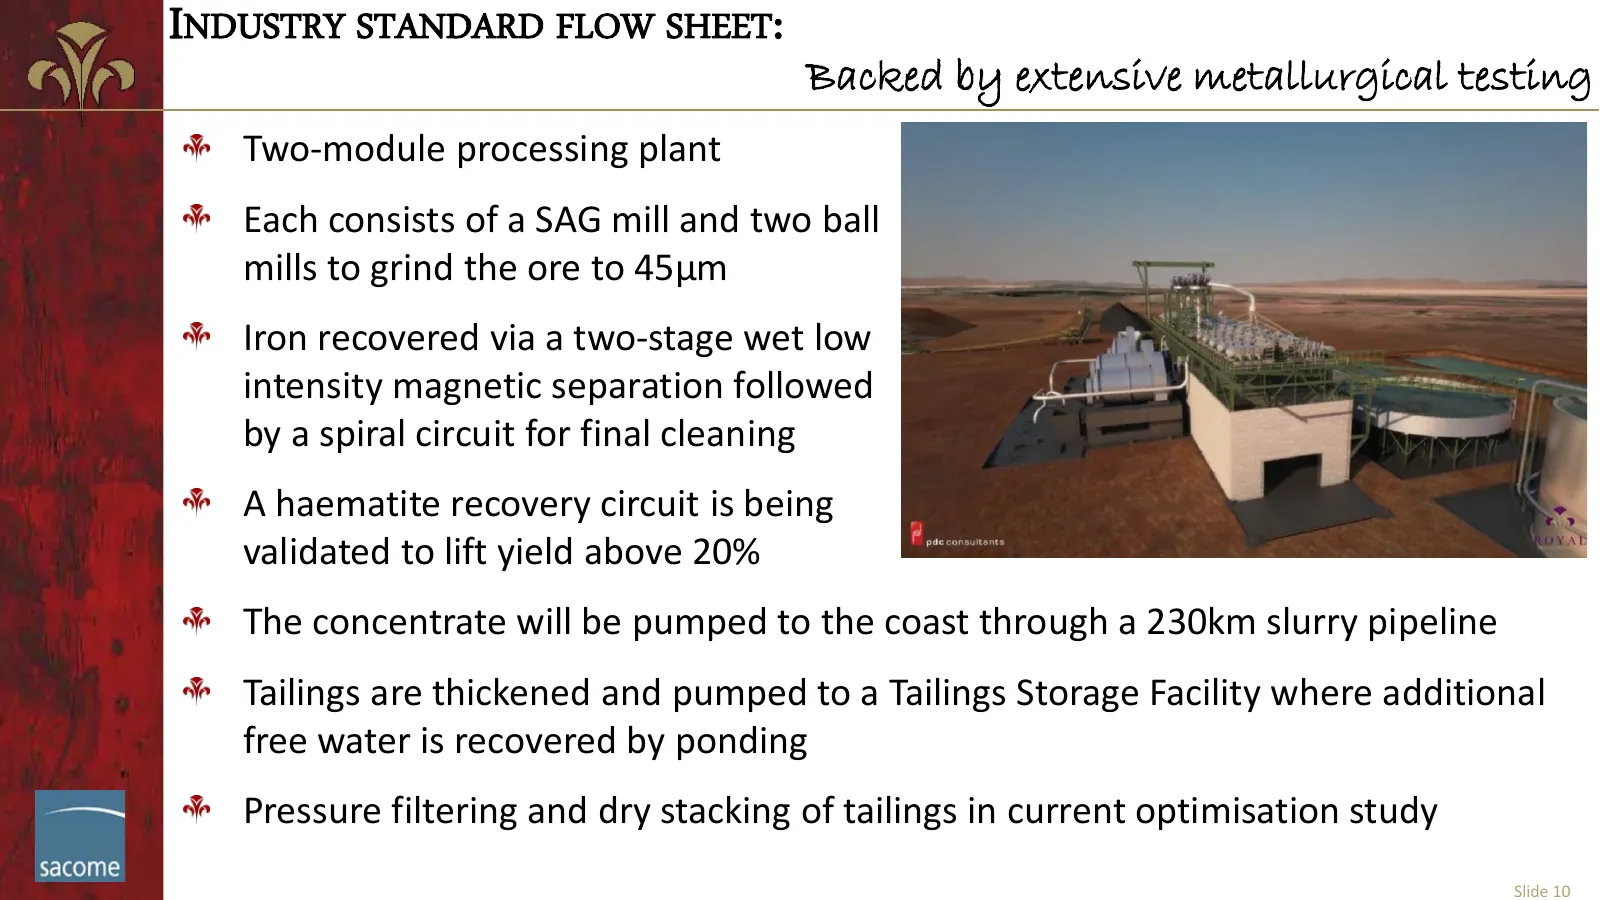
INDUSTRY STANDARD FLOW SHEET: Backed by extensive metallurgical testing Two-module processing plant Each consists of a SAG mill and two ball mills to grind the ore to 45µm Iron recovered via a two-stage wet low intensity magnetic separation followed by a spiral circuit for final cleaning A haematite
Slide 11: Processing Plant: Compact layout reduces costs
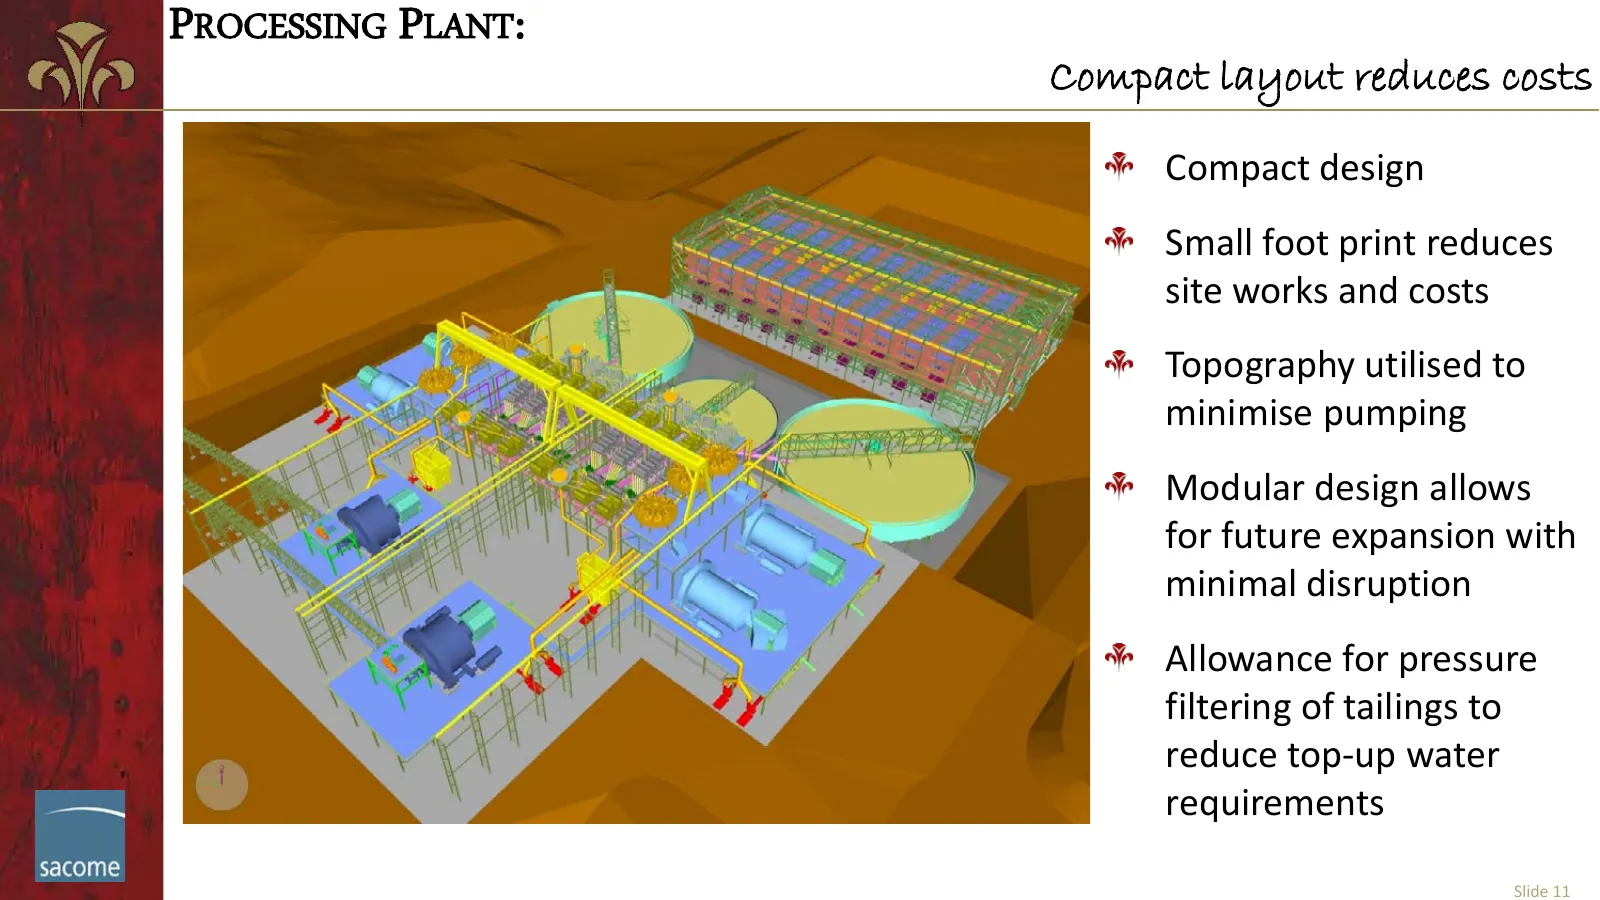
PROCESSING PLANT: Compact layout reduces costs Compact design Small foot print reduces site works and costs Topography utilised to minimise pumping Modular design allows for future expansion with minimal disruption Allowance for pressure filtering of tailings to reduce top-up water requirements Slid
Slide 12: Slurry Transport
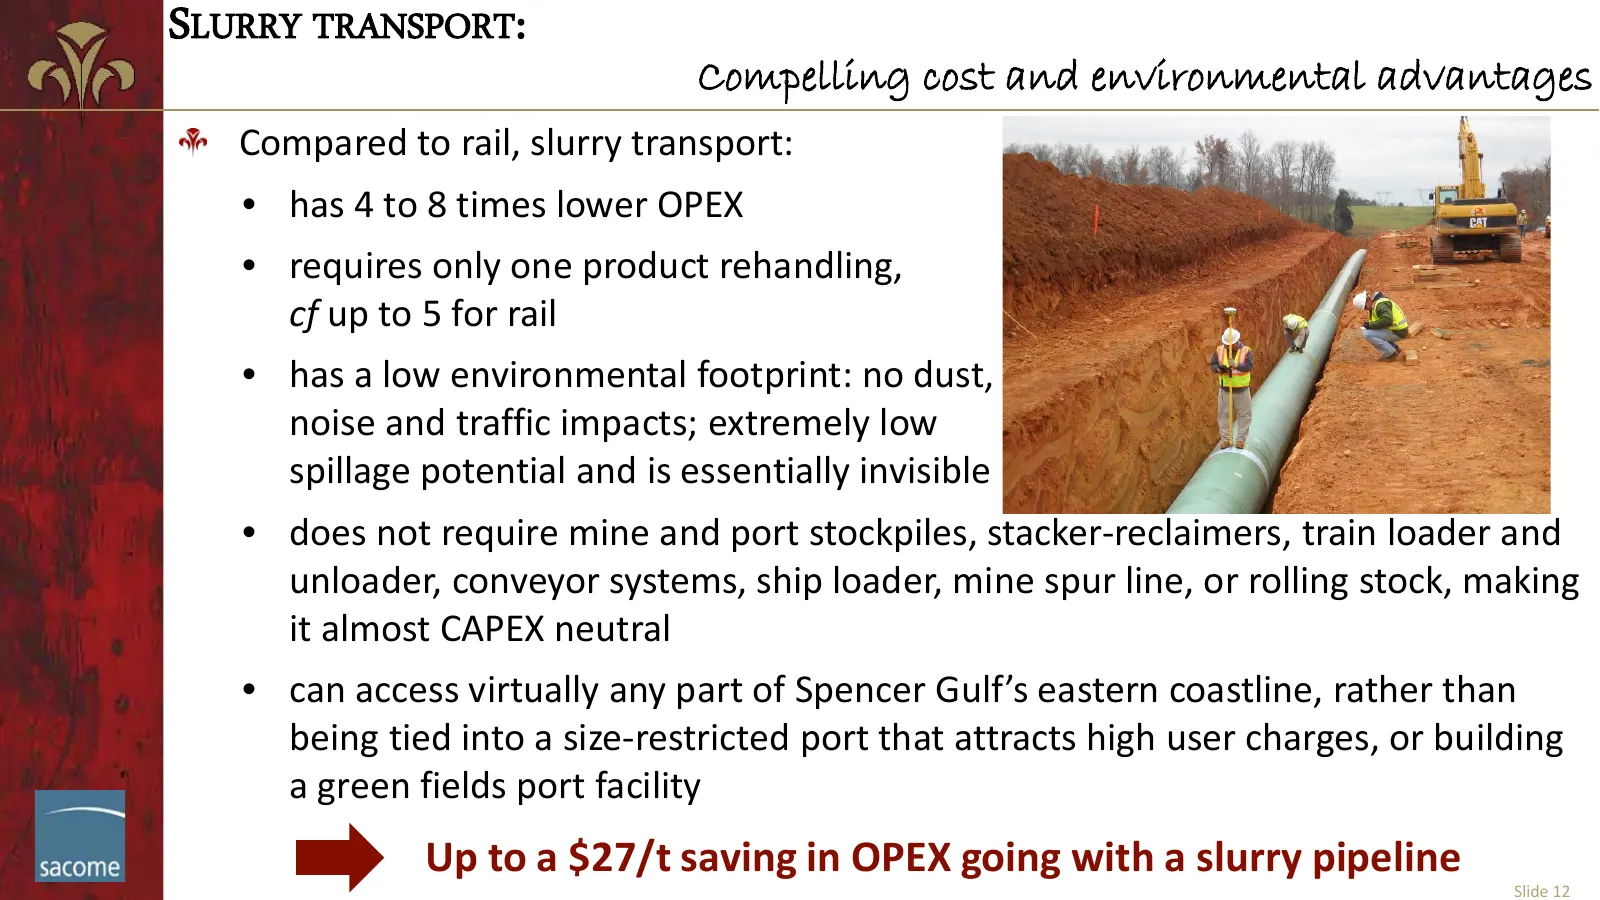
SLURRY TRANSPORT: Compelling cost and environmental advantages Compared to rail, slurry transport: • has 4 to 8 times lower OPEX • requires only one product rehandling, cf up to 5 for rail • has a low environmental footprint: no dust, noise and traffic impacts; extremely low spillage potential and i
Slide 13: Low Cost Export Facility
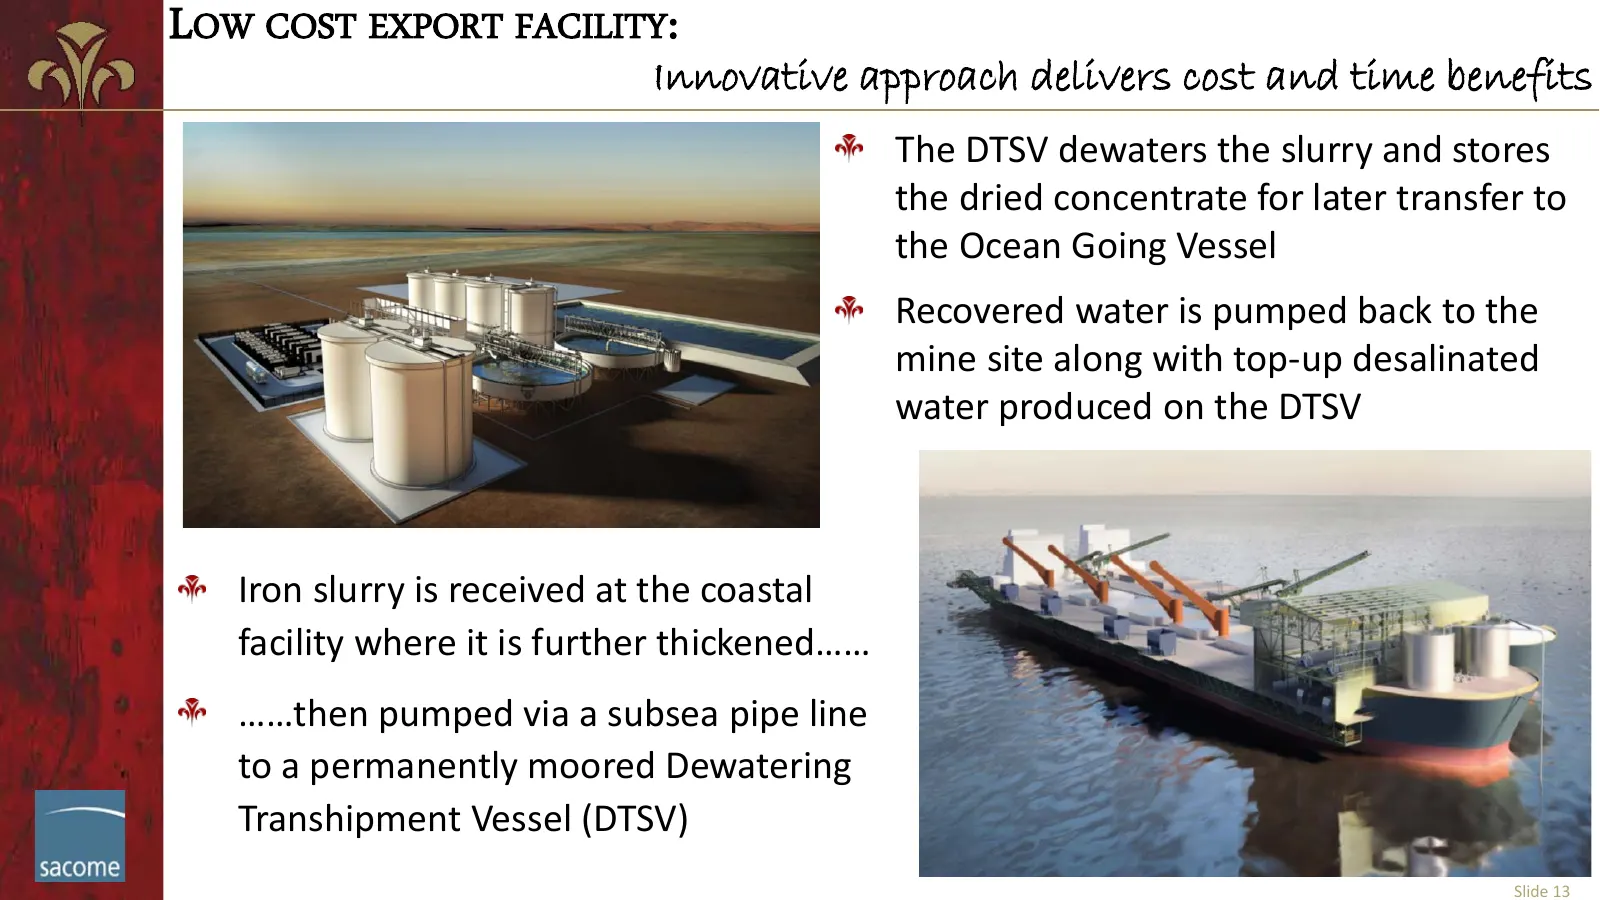
LOW COST EXPORT FACILITY: Innovative approach delivers cost and time benefits The DTSV dewaters the slurry and stores the dried concentrate for later transfer to the Ocean Going Vessel Recovered water is pumped back to the mine site along with top-up desalinated water produced on the DTSV Iron slurr
Slide 14: Key Advantages of Razorback
KEY ADVANTAGES OF RAZORBACK: A robust project in a prime location Grid access to lower cost power: $0.06/kWh indicated (excl carbon tax) Low rock strength: lower power usage than typical bif operations Large resource base with upside: 25 year mine life with blue sky potential Ore from surface: minin
Slide 15: OPEX: At about the 50th percentile of global costs
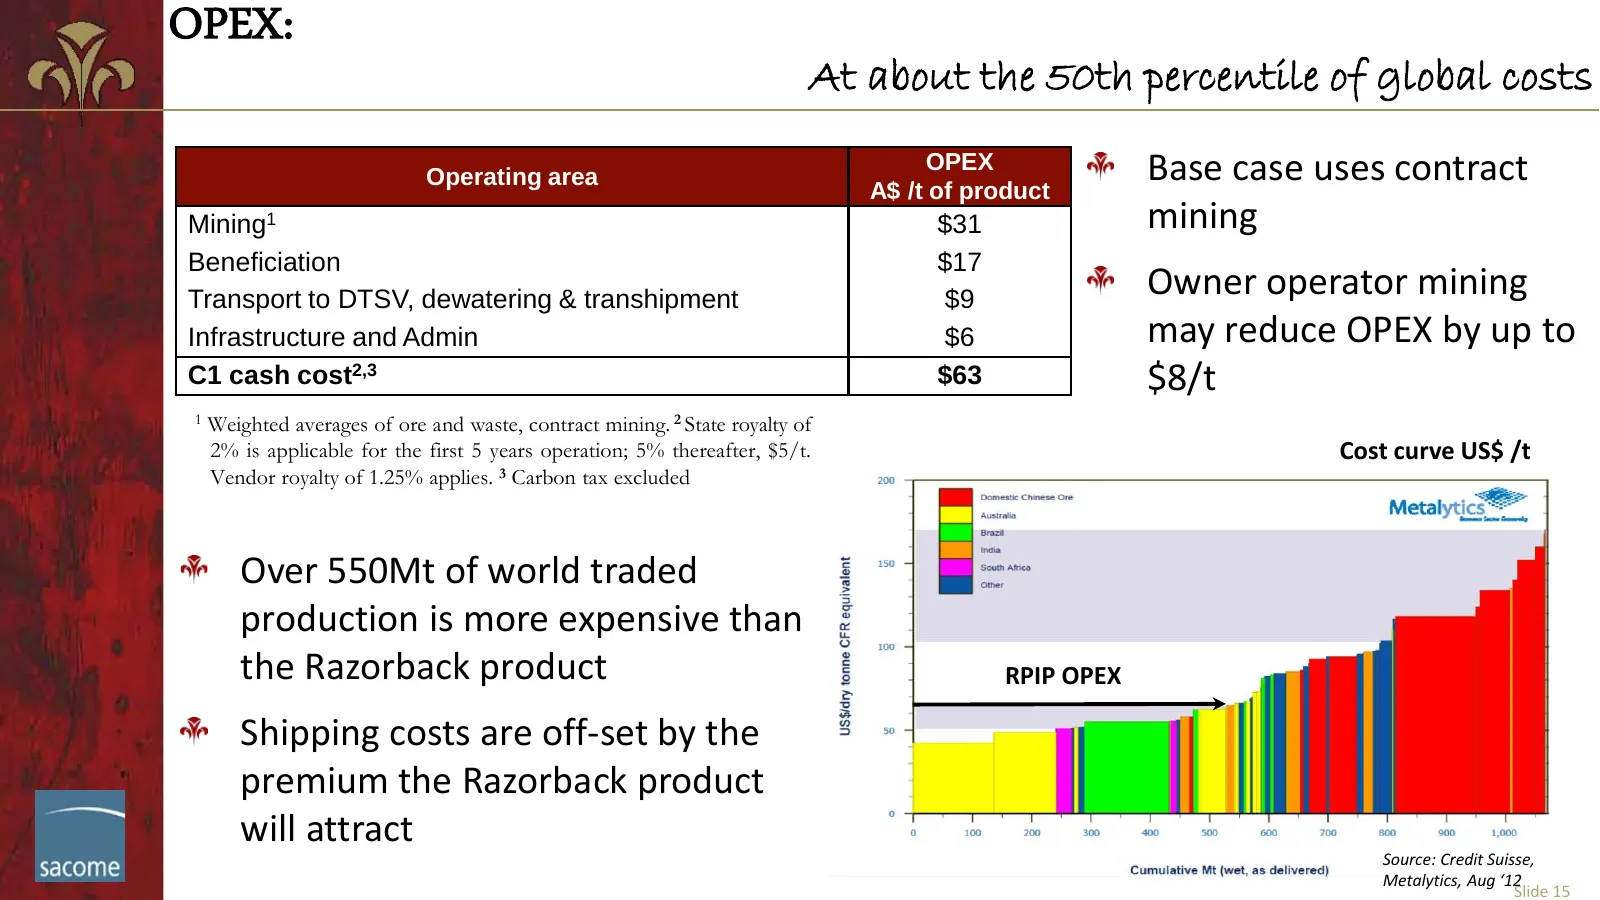
OPEX: At about the 50th percentile of global costs Operating area OPEX A$ /t of product Base case uses contract Mining1 $31 mining Beneficiation $17 Transport to DTSV, dewatering & transhipment $9 Owner operator mining Infrastructure and Admin $6 may reduce OPEX by up to C1 cash cost2,3 $63 $8/t 1 W
Slide 16: Where to the iron price?
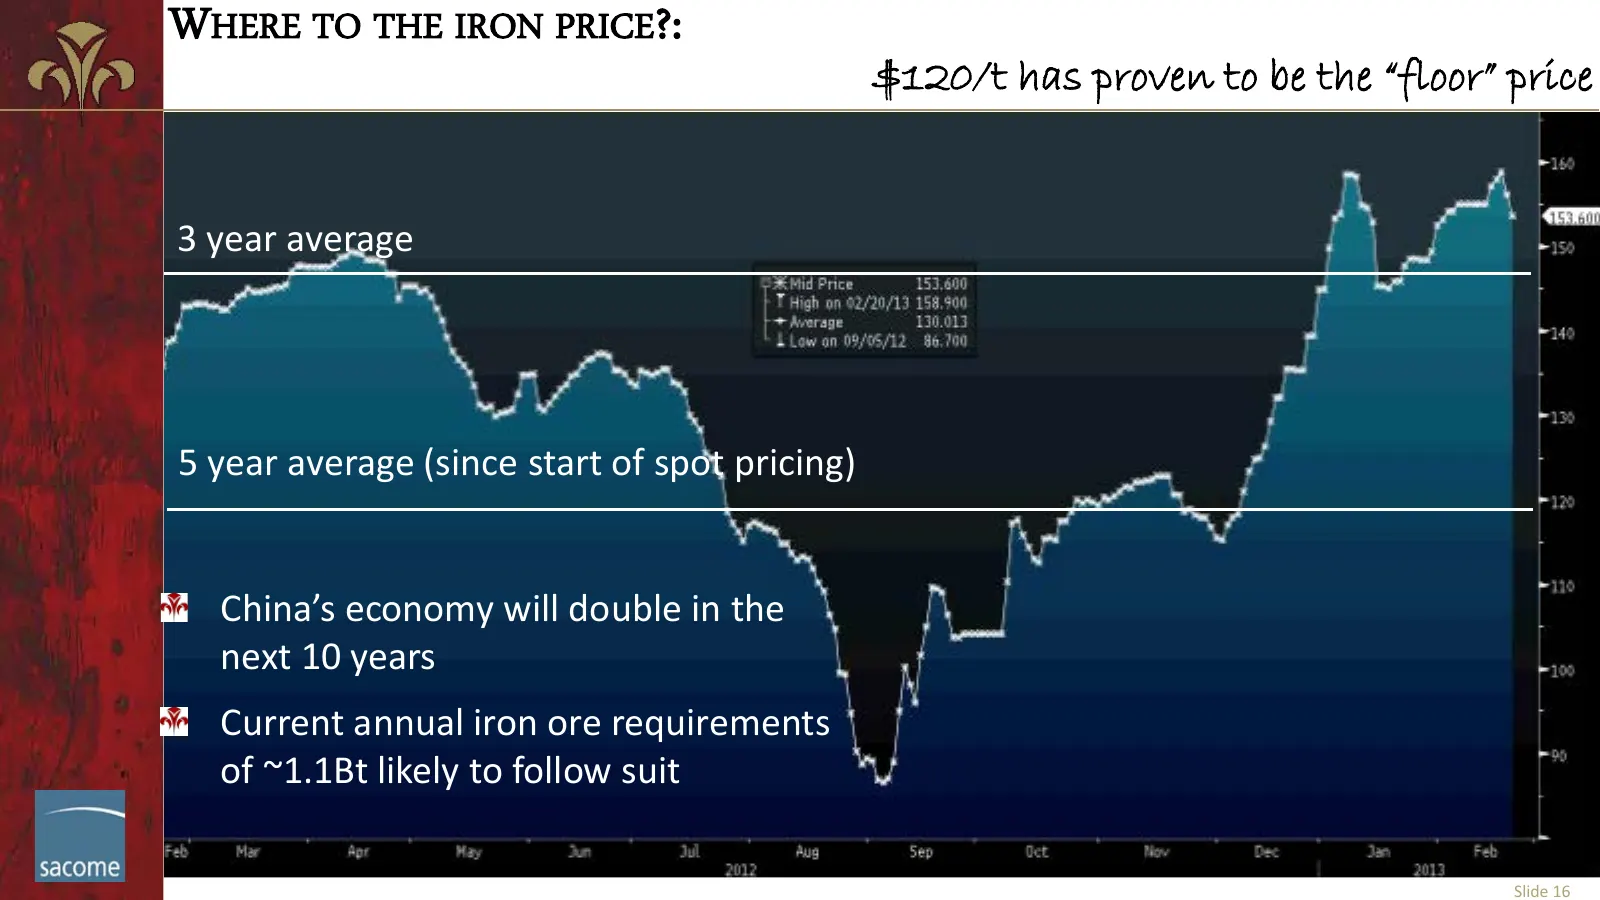
WHERE TO THE IRON PRICE?: $120/t has proven to be the “floor” price 3 year average 5 year average (since start of spot pricing) China’s economy will double in the next 10 years Current annual iron ore requirements of ~1.1Bt likely to follow suit Slide 16
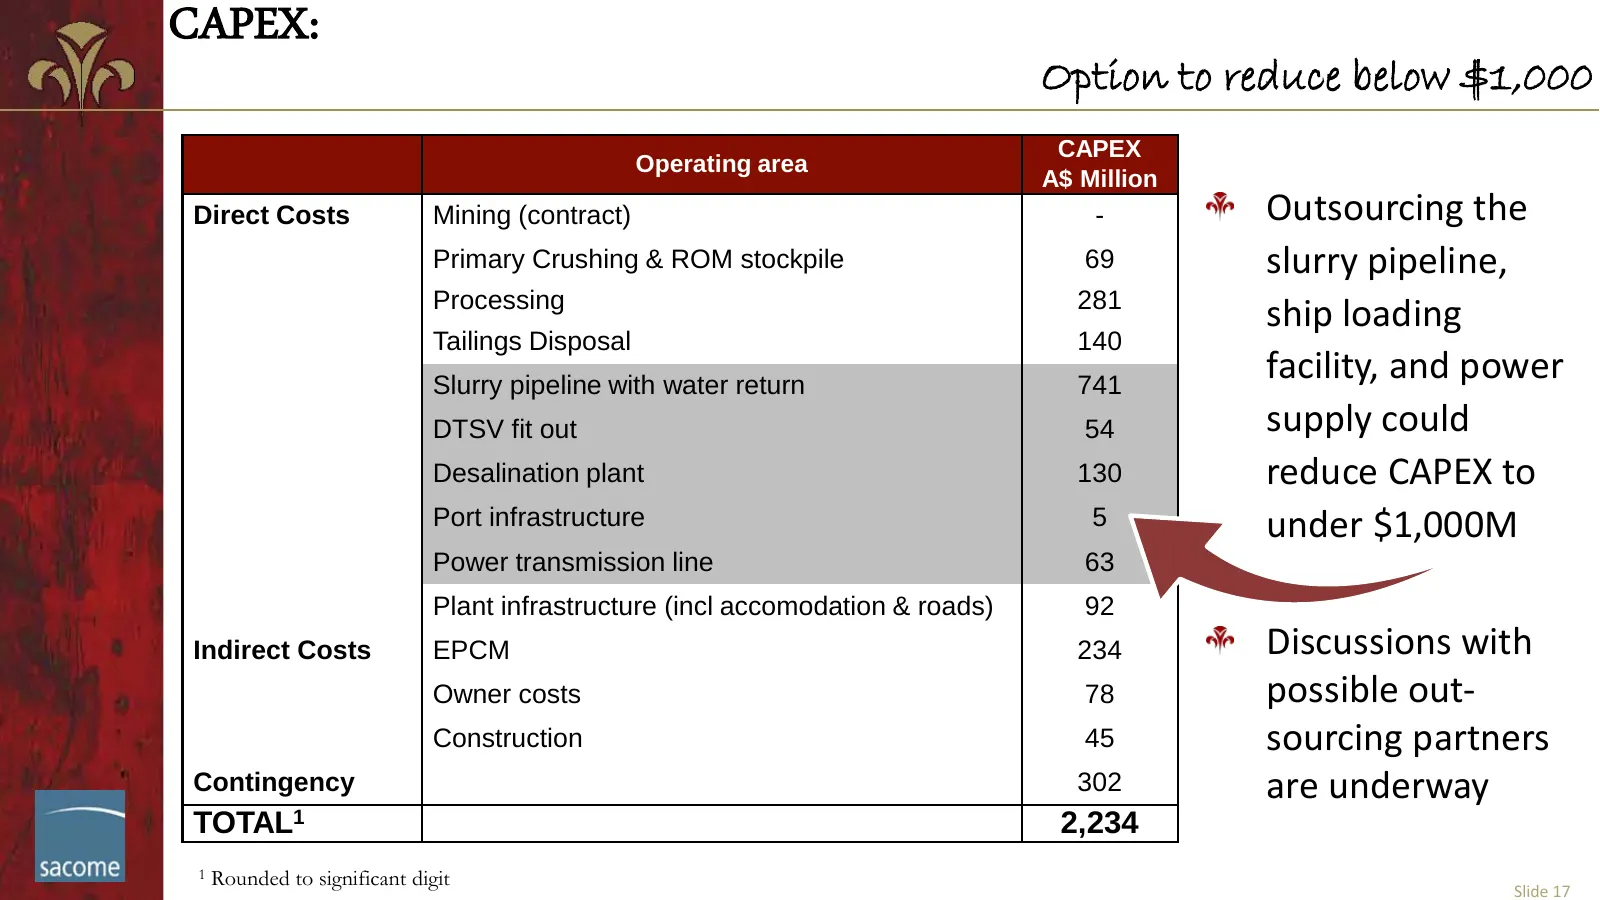
Slide 17: CAPEX: Option to reduce below $1,000
CAPEX: Option to reduce below $1,000 CAPEX Operating area A$ Million Direct Costs Mining (contract) - Outsourcing the Primary Crushing & ROM stockpile 69 slurry pipeline, Processing 281 ship loading Tailings Disposal 140 Slurry pipeline with water return 741 facility, and power DTSV fit out 54 suppl
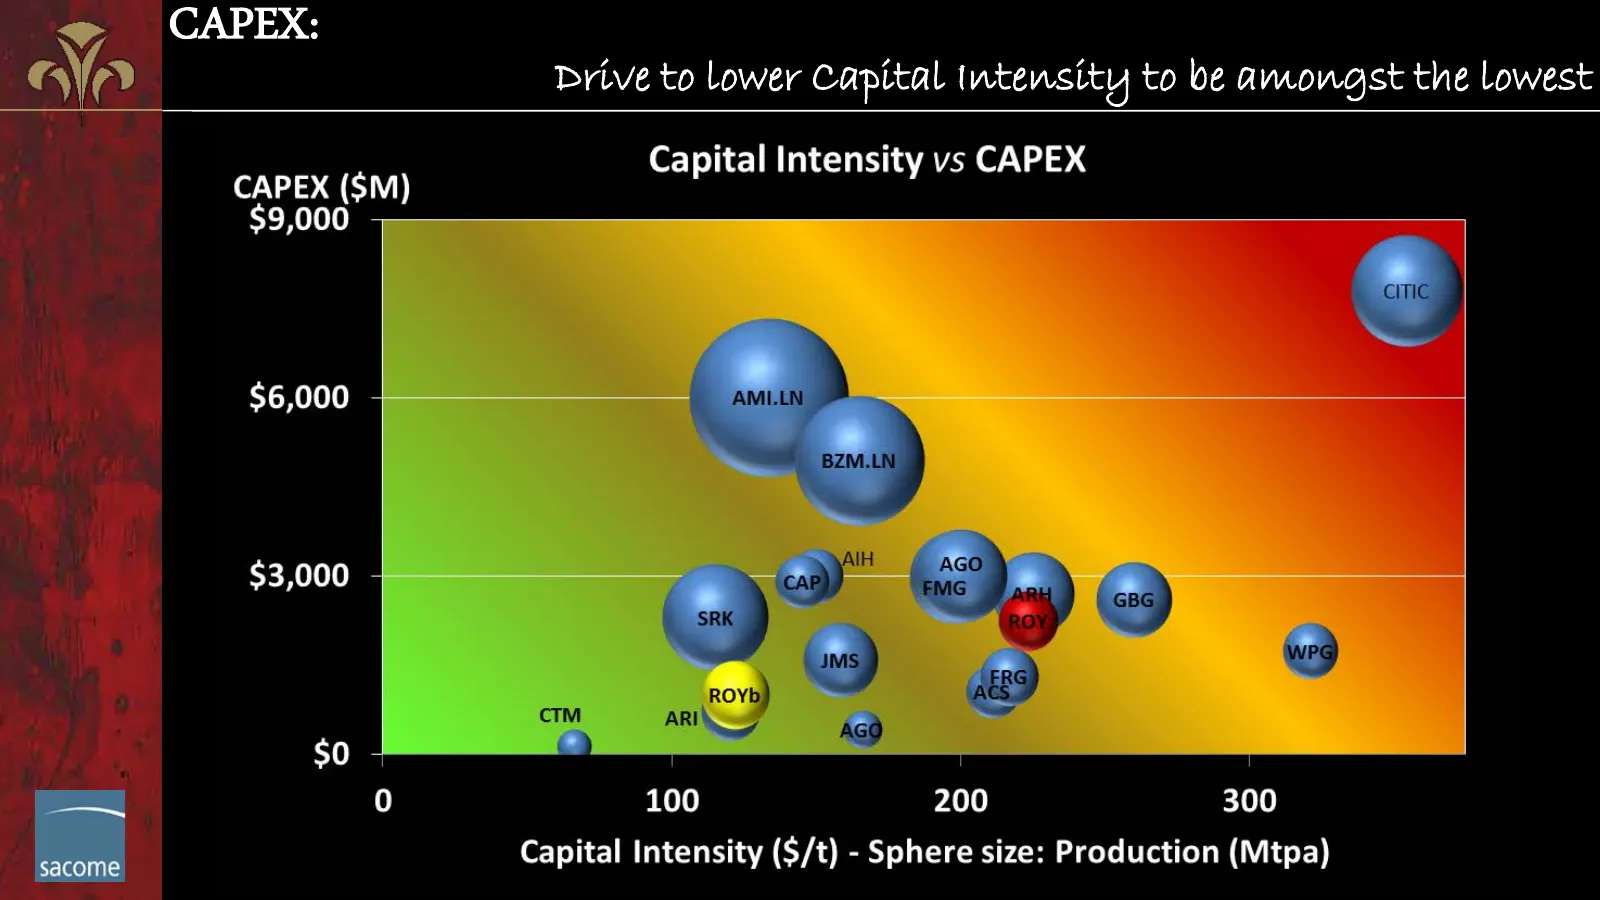
Slide 18: CAPEX: Drive to lower capital intensity
CAPEX: Drive to lower Capital Intensity to be amongst the lowest Slide 18
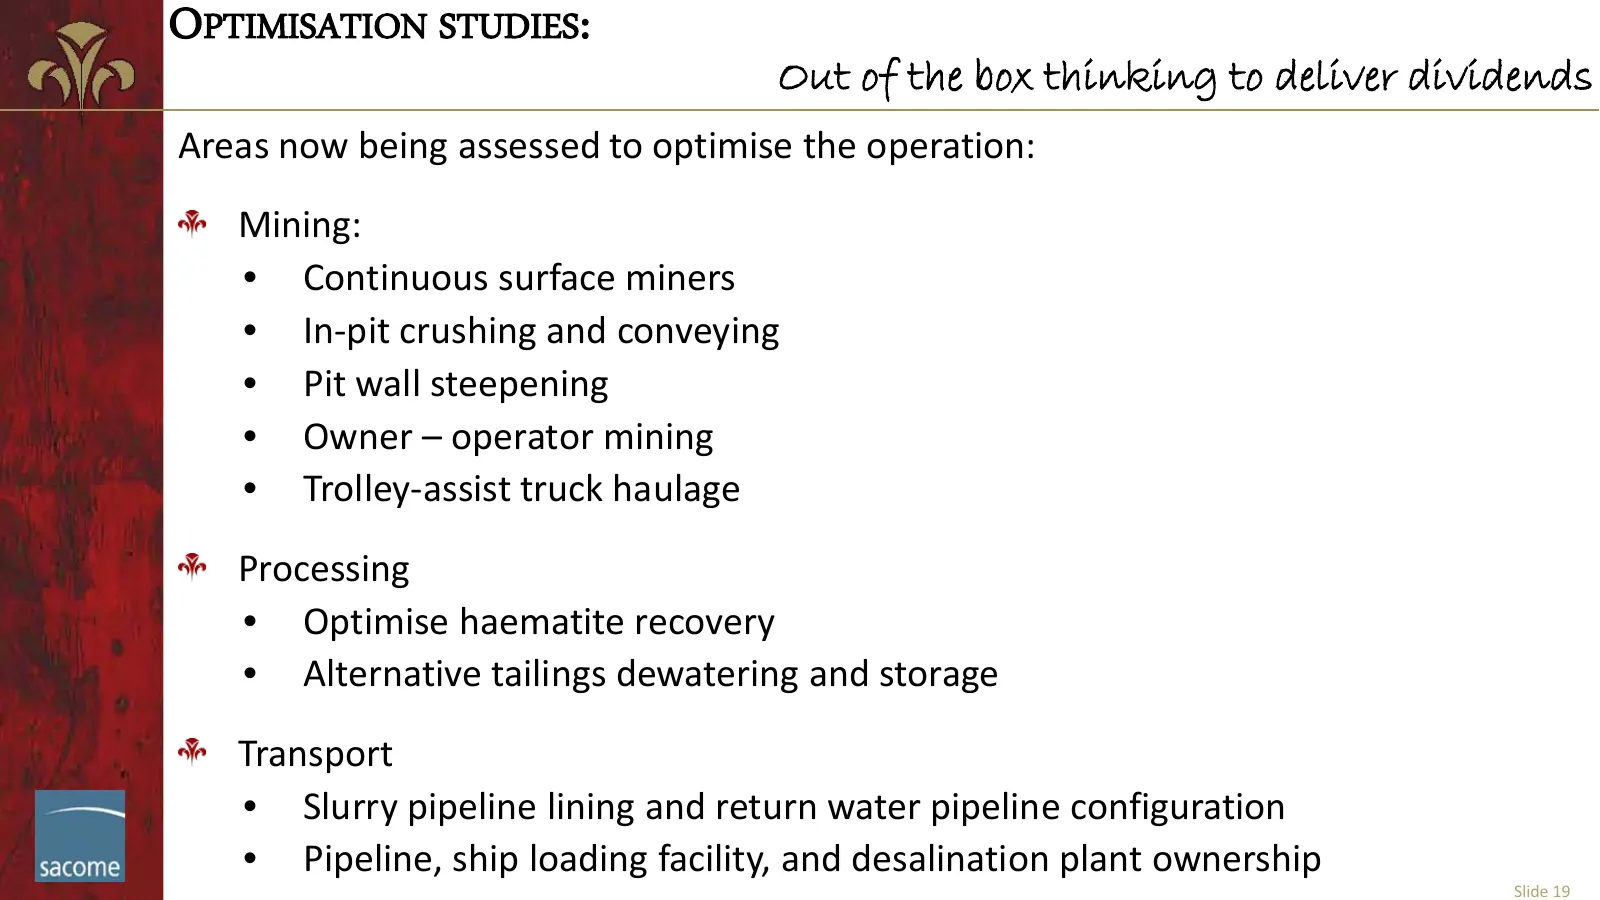
Slide 19: Optimisation Studies
OPTIMISATION STUDIES: Out of the box thinking to deliver dividends Areas now being assessed to optimise the operation: Mining: • Continuous surface miners • In-pit crushing and conveying • Pit wall steepening • Owner – operator mining • Trolley-assist truck haulage Processing • Optimise haematite re
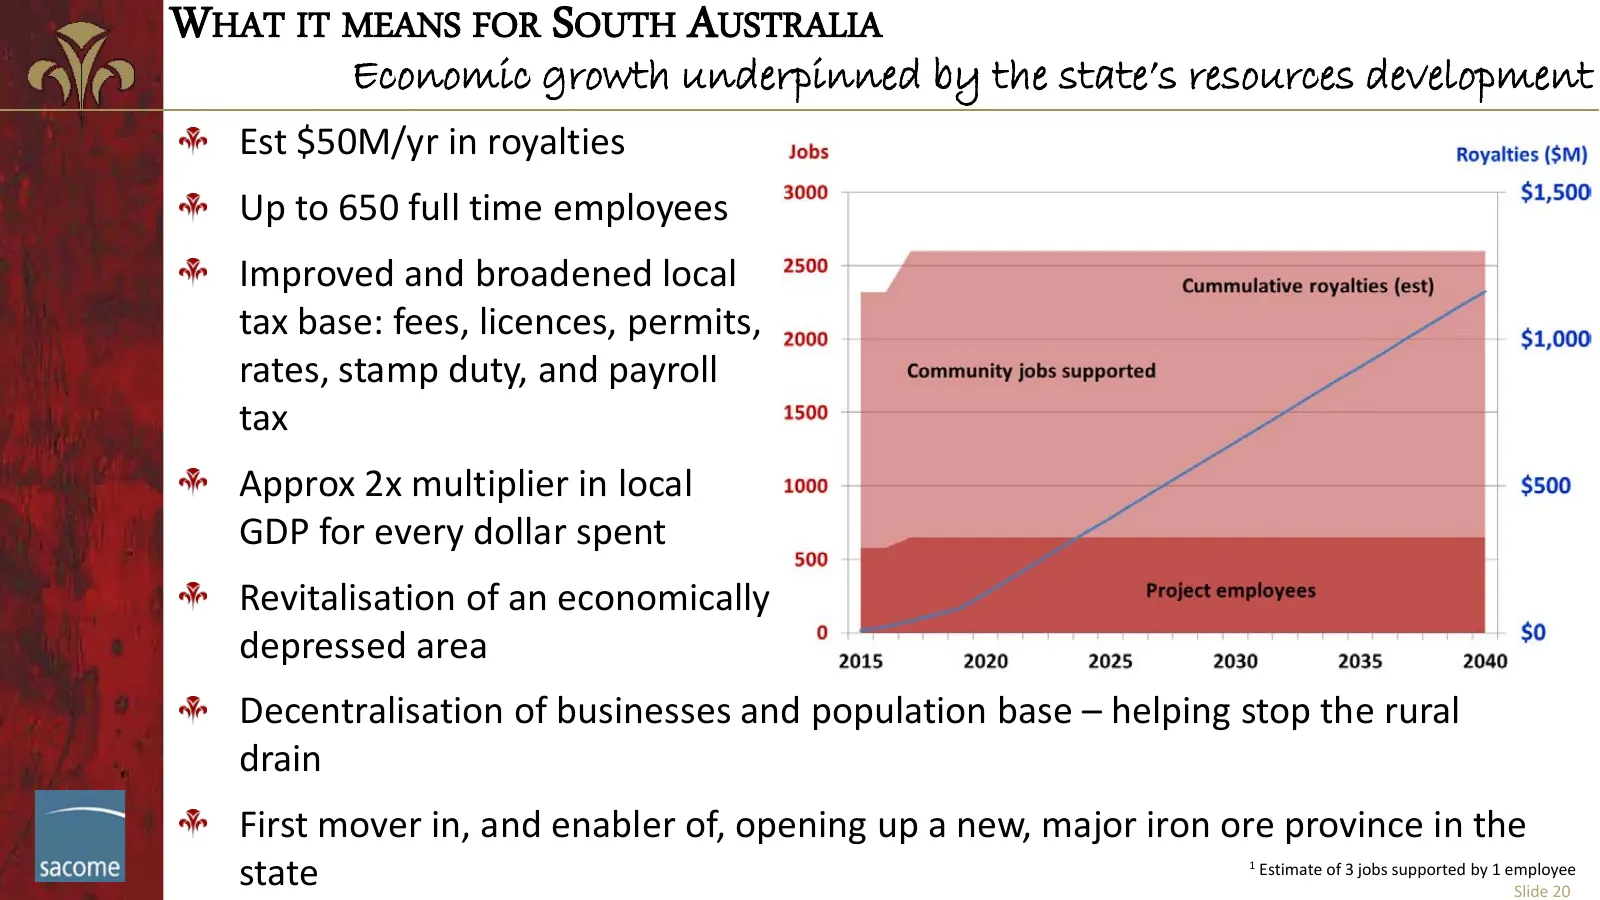
Slide 20: What it means for South Australia
WHAT IT MEANS FOR SOUTH AUSTRALIA Economic growth underpinned by the state’s resources development Est $50M/yr in royalties Up to 650 full time employees Improved and broadened local tax base: fees, licences, permits, rates, stamp duty, and payroll tax Approx 2x multiplier in local GDP for every dol
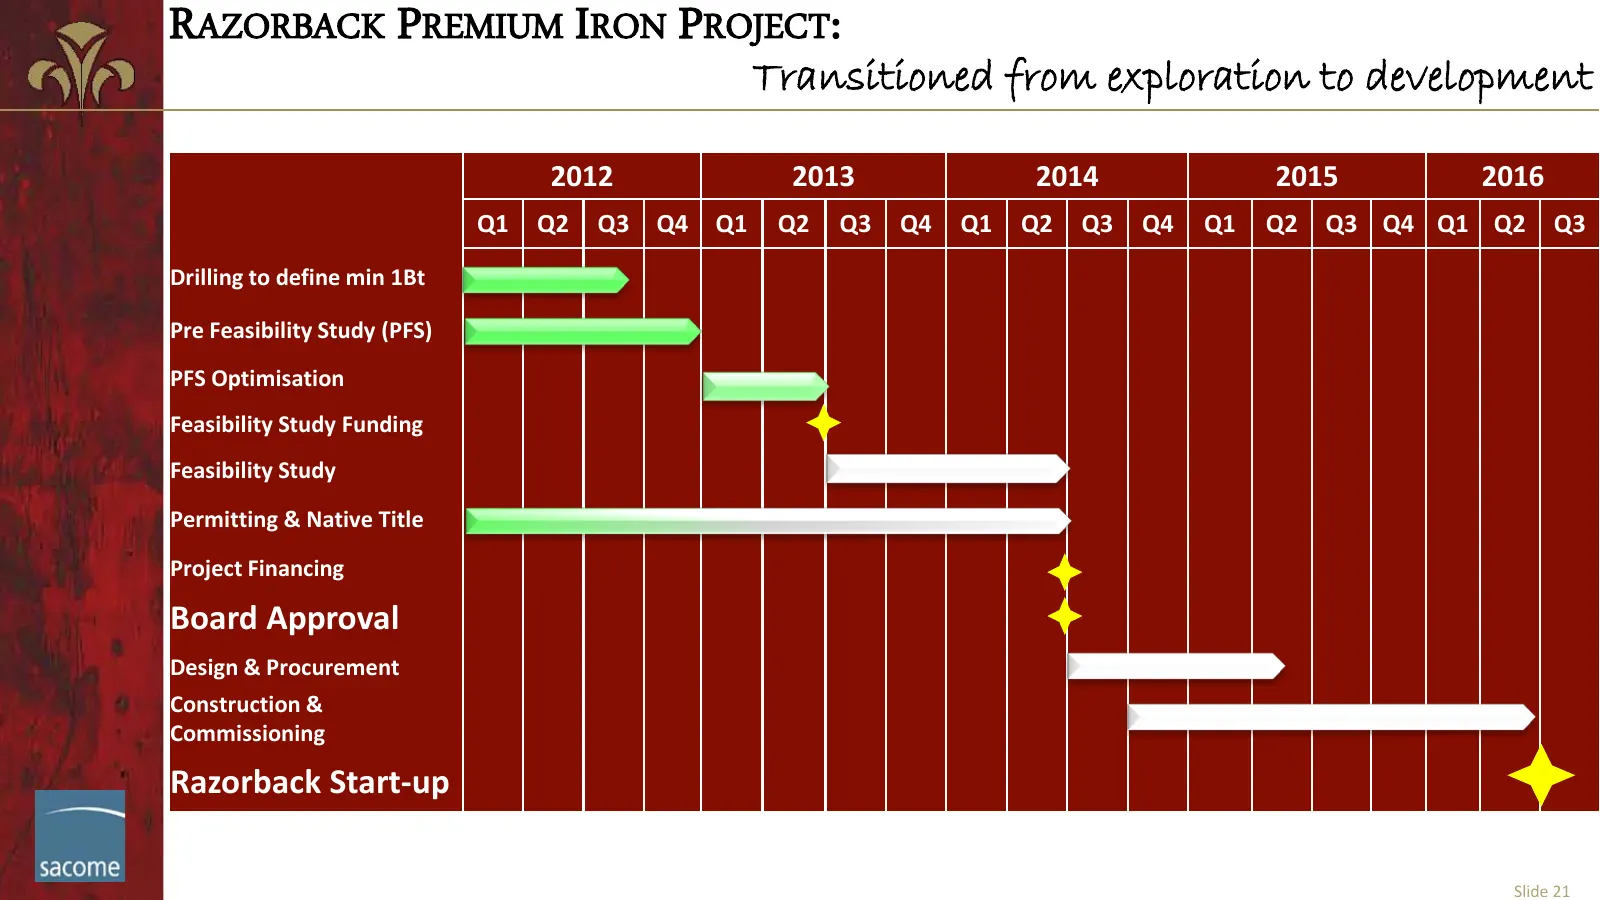
Slide 21: Razorback Premium Iron Project: Transitioned from exploration to development
RAZORBACK PREMIUM IRON PROJECT: Transitioned from exploration to development 2012 2013 2014 2015 2016 Q1 Q2 Q3 Q4 Q1 Q2 Q3 Q4 Q1 Q2 Q3 Q4 Q1 Q2 Q3 Q4 Q1 Q2 Q3 Drilling to define min 1Bt Pre Feasibility Study (PFS) PFS Optimisation Feasibility Study Funding Feasibility Study Permitting & Native Title
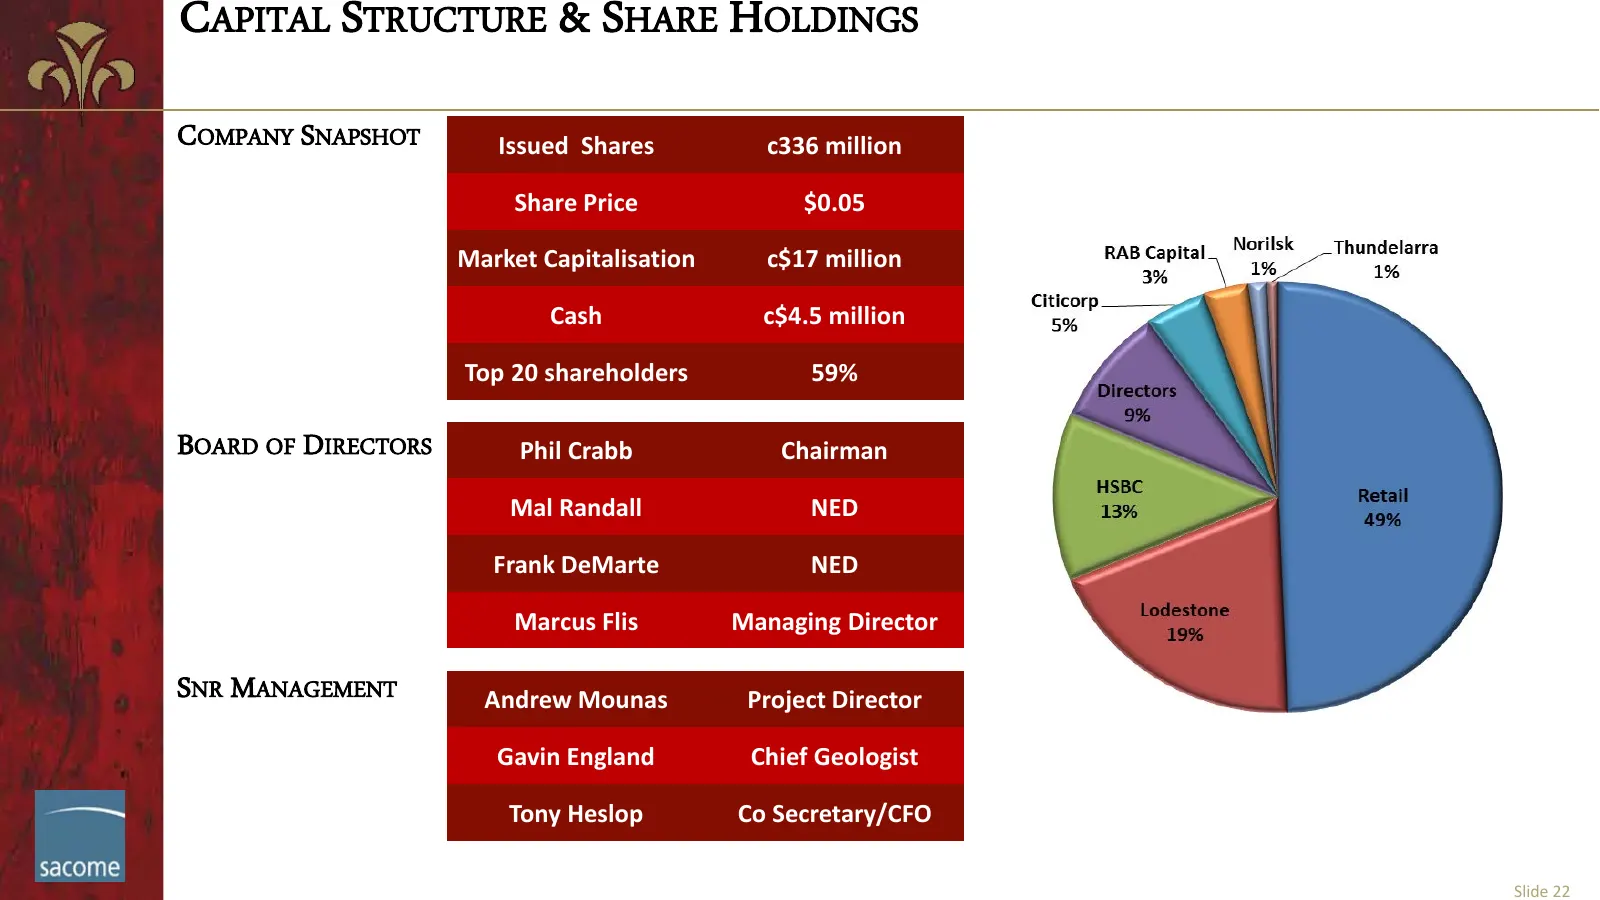
Slide 22: Company Snapshot, Board of Directors, Senior Management
CAPITAL STRUCTURE & SHARE HOLDINGS COMPANY SNAPSHOT Issued Shares c336 million Share Price $0.05 Market Capitalisation c$17 million Cash c$4.5 million Top 20 shareholders 59% BOARD OF DIRECTORS Phil Crabb Chairman Mal Randall NED Frank DeMarte NED Marcus Flis Managing Director SNR MANAGEMENT Andrew
Source: Internet Archive copy of magnetitemines.com
More decks from Magnetite Mines Ltd.
 Investor Presentation (September 2026)41 slides · September 2026
 Investor Presentation (March 2026)22 slides · Mar 10, 2026
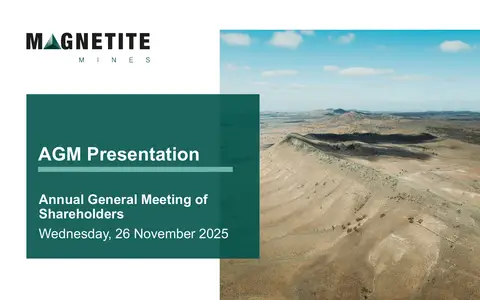 Shareholder Meeting (November 2025)18 slides · Nov 26, 2025
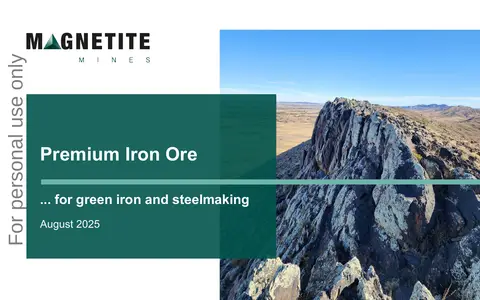 Investor Presentation (August 2025)22 slides · Aug 8, 2025
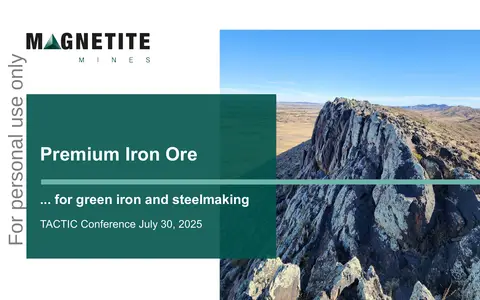 TACTIC Conference 202516 slides · Jul 30, 2025
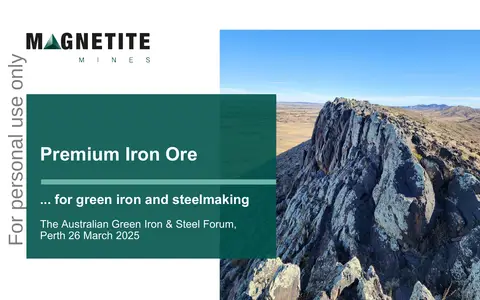 The Australian Green Iron & Steel Forum 202519 slides · Mar 26, 2025