Markwest Energy Partners LP — 2011 Wells Fargo MLP Symposium
33 slides from Markwest Energy Partners LP's conference presentation, Dec 6, 2011
Slide 1: 2011 Wells Fargo MLP Symposium December 2011
2011 Wells Fargo MLP Symposium December 2011
Slide 2: Forward-Looking Statements
Forward-Looking Statements This presentation contains forward-looking statements and information. These forward-looking statements, which in many instances can be identified by words like “could,” “may,” “will,” “should,” “expects,” “plans,” “project,” “anticipates,” “believes,” “planned,” “proposed
Slide 3: Non-GAAP Measures
Non-GAAP Measures Distributable Cash Flow, Adjusted EBITDA , and Net Operating Margin are not measures of performance calculated in accordance with GAAP, and should not be considered separately from or as a substitute for net income, income from operations, or cash flow as reflected in our financial
Slide 4: MarkWest Key Investment Considerations
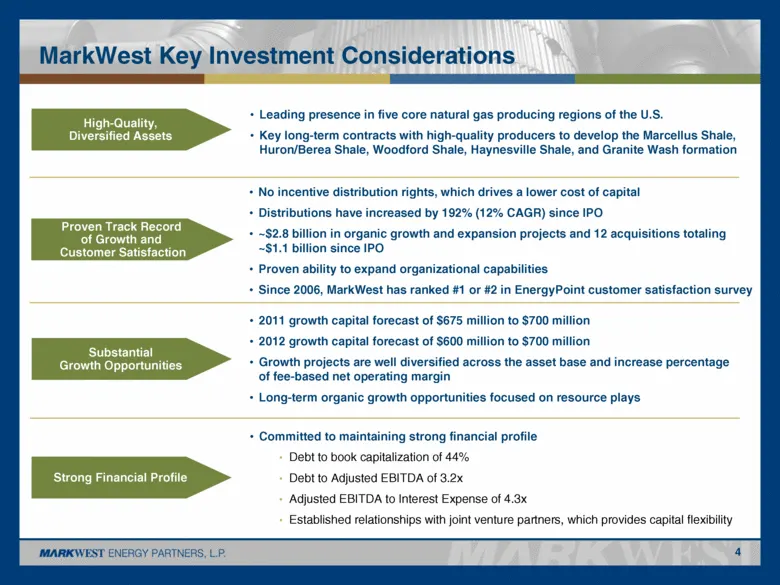
MarkWest Key Investment Considerations 4 Committed to maintaining strong financial profile Debt to book capitalization of 44% Debt to Adjusted EBITDA of 3.2x Adjusted EBITDA to Interest Expense of 4.3x Established relationships with joint venture partners, which provides capital flexibility No incen
Slide 5: Geographic Footprint
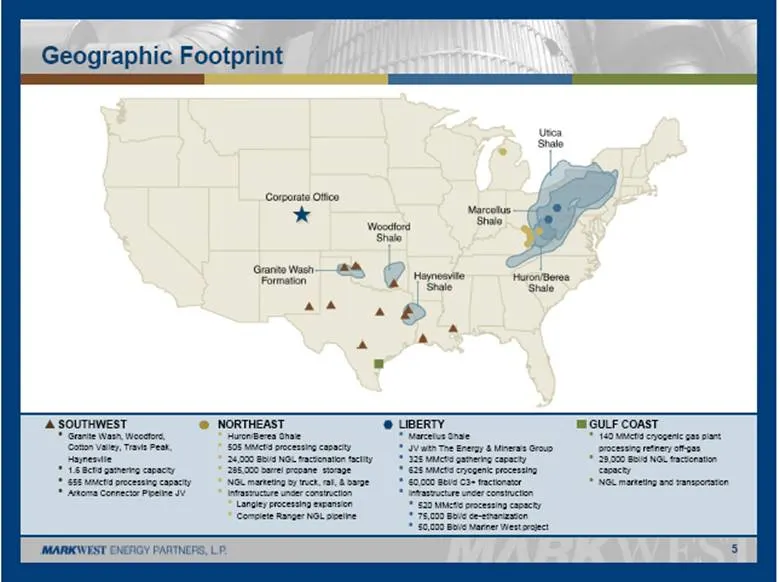
Geographic Footprint SOUTHWEST Granite Wash, Woodford, Cotton Valley, Travis Peak, Haynesville 1.6 Bcf/d gathering capacity 655 MMcf/d processing capacity Arkoma Connector Pipeline JV NORTHEAST Huron/Berea Shale 505 MMcf/d processing capacity 24,000 Bbl/d NGL fractionation facility 285,000 barrel pr
Slide 6: Growth Driven by Customer Satisfaction
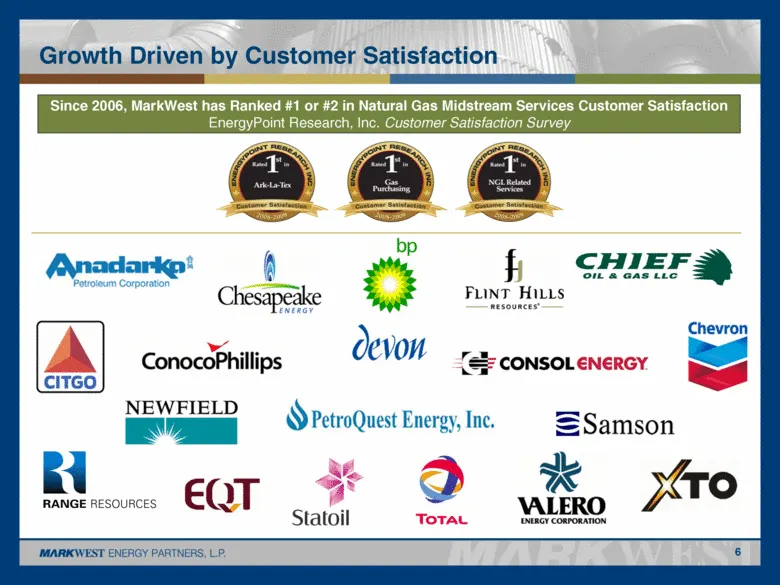
Growth Driven by Customer Satisfaction 6 Since 2006, MarkWest has Ranked #1 or #2 in Natural Gas Midstream Services Customer Satisfaction EnergyPoint Research, Inc. Customer Satisfaction Survey
Slide 7: Shale Plays Are Driving Natural Gas Supply
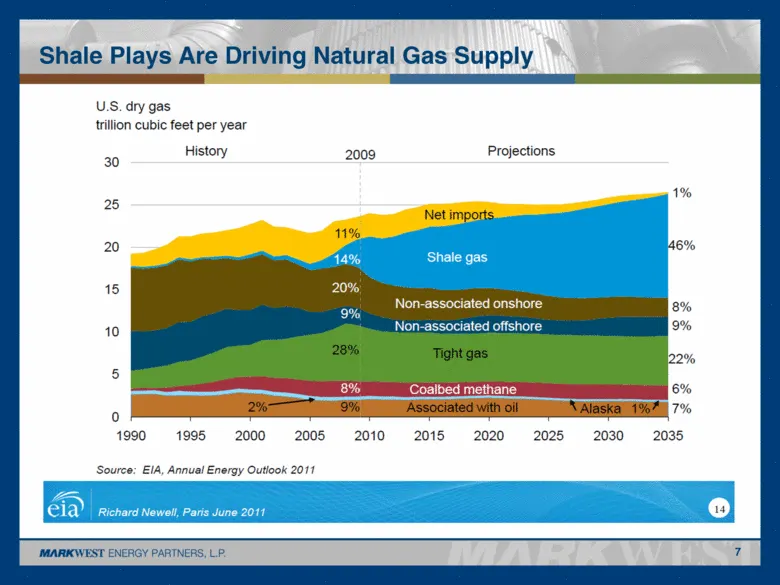
7 Shale Plays Are Driving Natural Gas Supply
Slide 8: Resource Play Economics
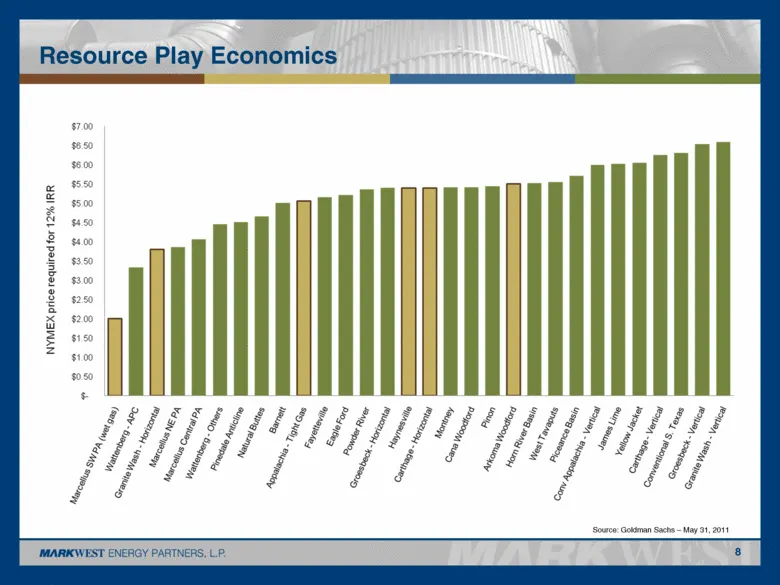
8 Resource Play Economics Source: Goldman Sachs – May 31, 2011
Slide 9: MarkWest's Commitment to Resource Plays
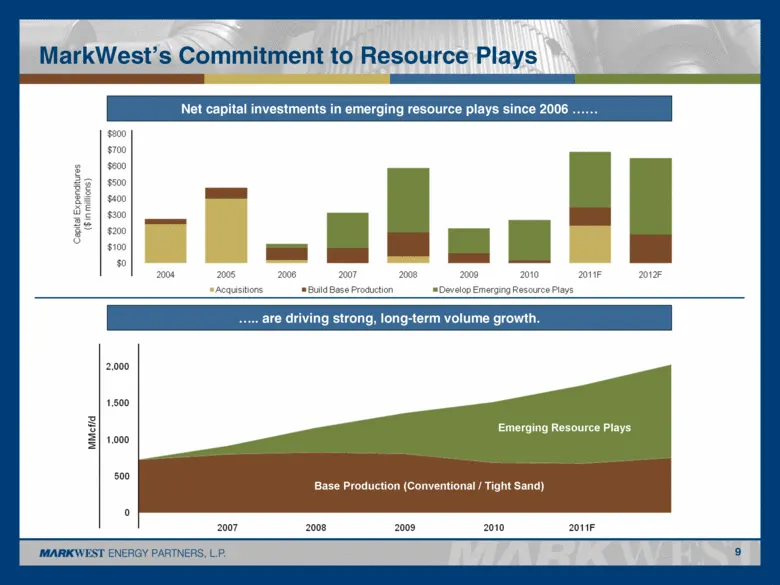
MarkWest’s Commitment to Resource Plays 9 Net capital investments in emerging resource plays since 2006...... .....are driving strong, long-term volume growth. Emerging Resource Plays Base Production (Conventional / Tight Sand).
Slide 10: Long-term Appalachian History
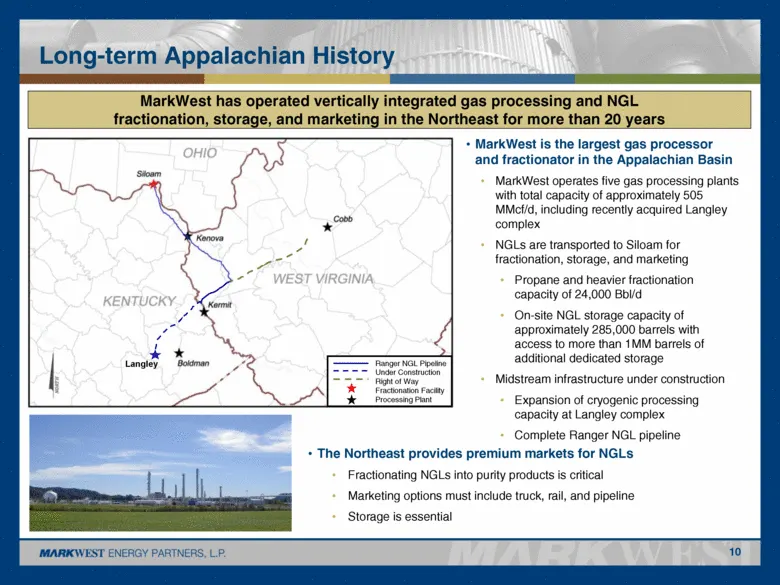
Long-term Appalachian History 10 MarkWest is the largest gas processor and fractionator in the Appalachian Basin MarkWest operates five gas processing plants with total capacity of approximately 505 MMcf/d, including recently acquired Langley complex NGLs are transported to Siloam for fractionation,
Slide 11: MarkWest Liberty Overview
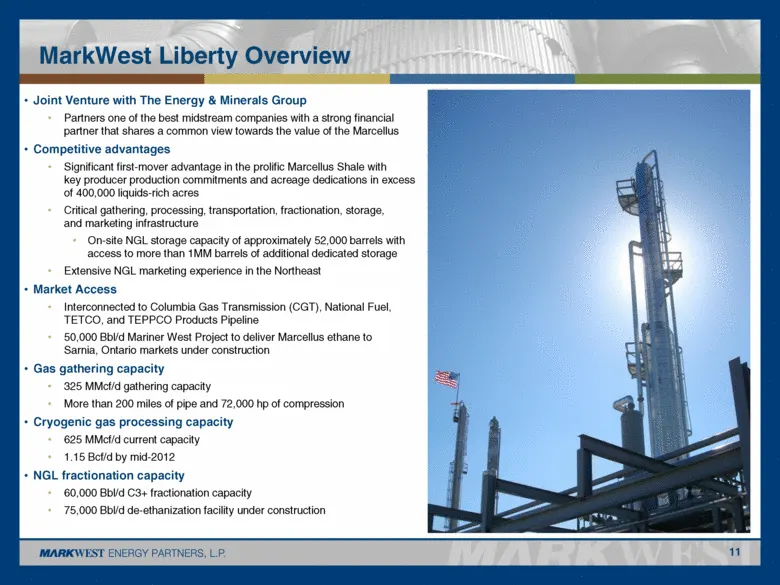
MarkWest Liberty Overview Joint Venture with The Energy & Minerals Group Partners one of the best midstream companies with a strong financial partner that shares a common view towards the value of the Marcellus Competitive advantages Significant first-mover advantage in the prolific Marcellus Shale
Slide 12: MarkWest Liberty Marcellus Project Schedule
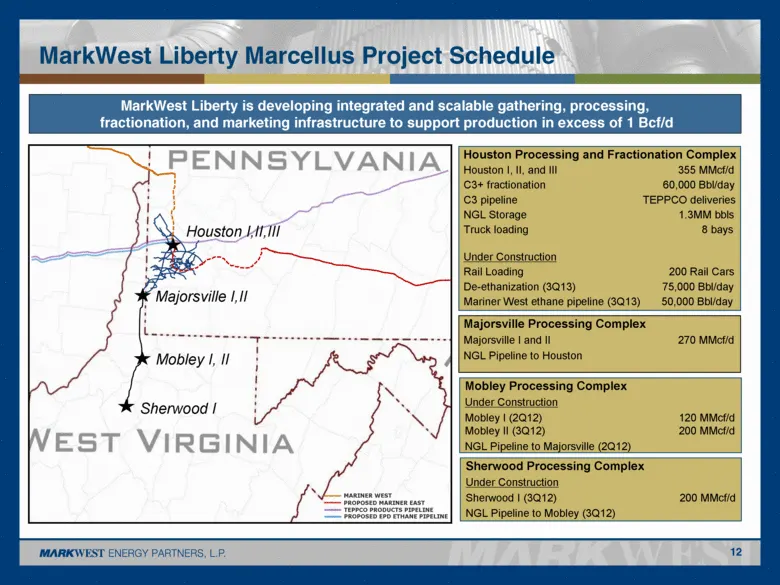
MarkWest Liberty Marcellus Project Schedule 12 Mobley Processing Complex Under Construction Mobley I (2Q12) 120 MMcf/d Mobley II (3Q12) 200 MMcf/d NGL Pipeline to Majorsville (2Q12) Majorsville Processing Complex Majorsville I and II 270 MMcf/d NGL Pipeline to Houston Houston Processing and Fraction
Slide 13: Houston Processing and Fractionation Complex
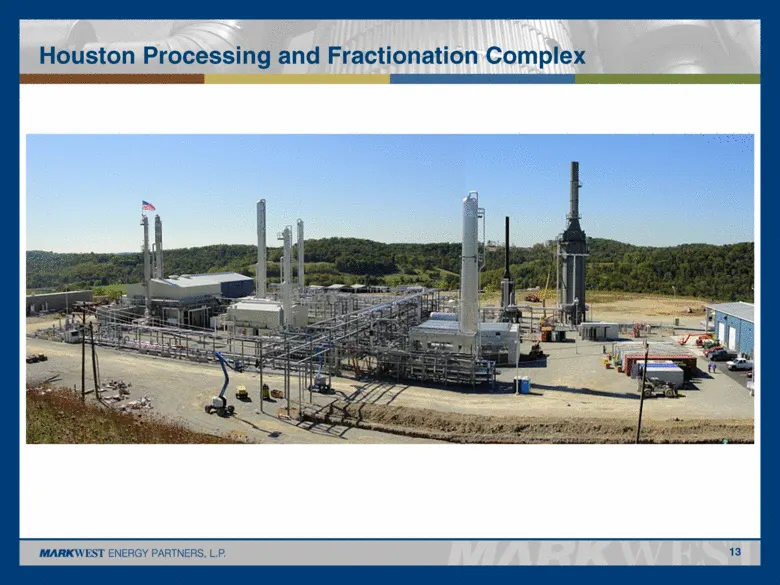
Houston Processing and Fractionation Complex 13
Slide 14: Majorsville Processing Complex
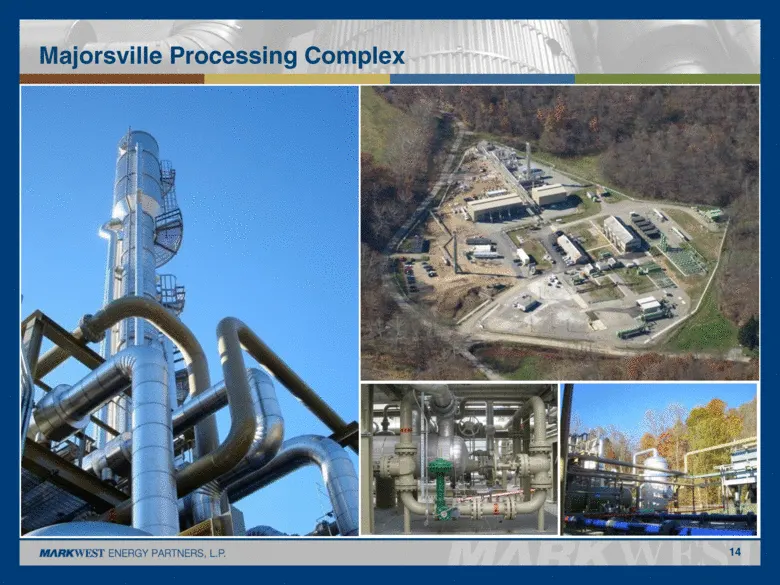
Majorsville Processing Complex 14
Slide 15: Strong Forecasted Growth in Ethane Demand
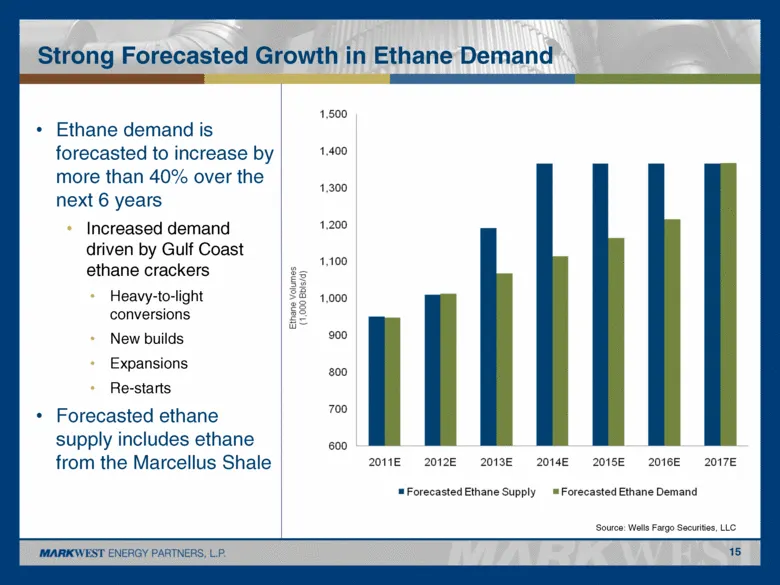
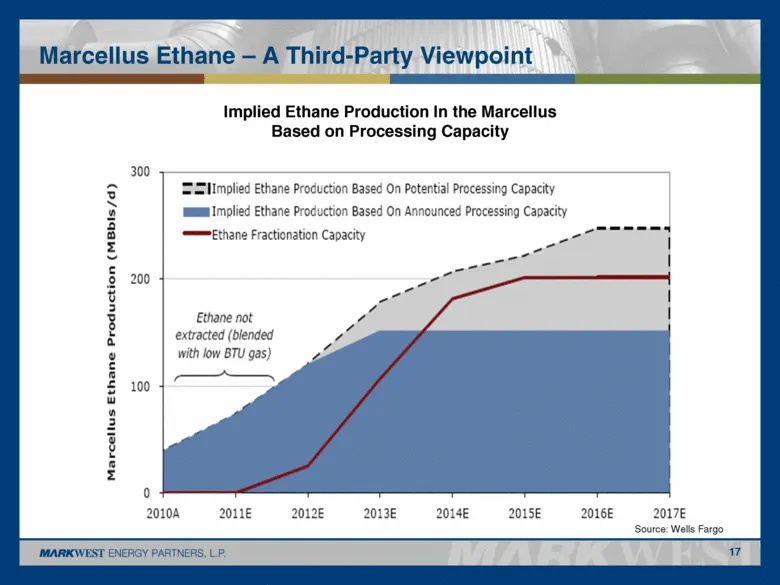
Strong Forecasted Growth in Ethane Demand 15 Source: Wells Fargo Securities, LLC Ethane demand is forecasted to increase by more than 40% over the next 6 years Increased demand driven by Gulf Coast ethane crackers Heavy-to-light conversions New builds Expansions Re-starts Forecasted ethane supply in
Slide 16: Ethane recovery at MarkWest Liberty processing plants
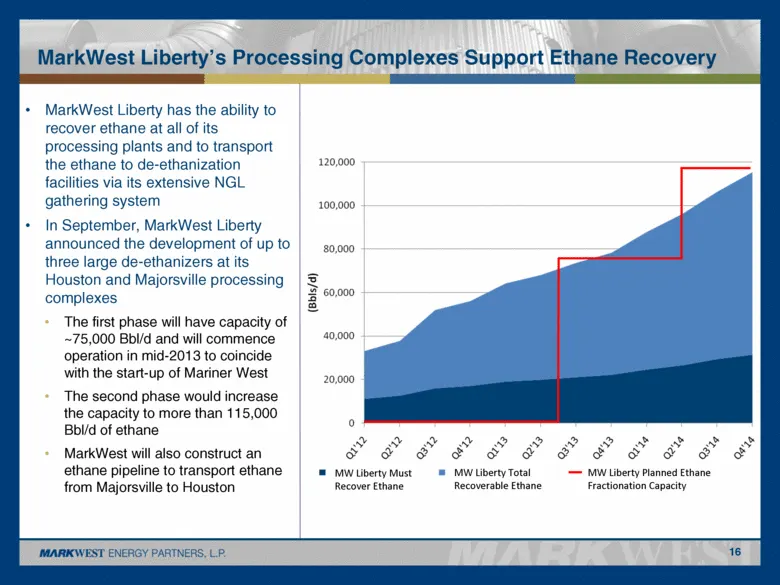
MarkWest Liberty has the ability to recover ethane at all of its processing plants and to transport the ethane to de-ethanization facilities via its extensive NGL gathering system In September, MarkWest Liberty announced the development of up to three large de-ethanizers at its Houston and Majorsvil
Slide 17: Marcellus Ethane – A Third-Party Viewpoint
Marcellus Ethane – A Third-Party Viewpoint 17 Implied Ethane Production In the Marcellus Based on Processing Capacity Source: Wells Fargo
Slide 18: Project Mariner
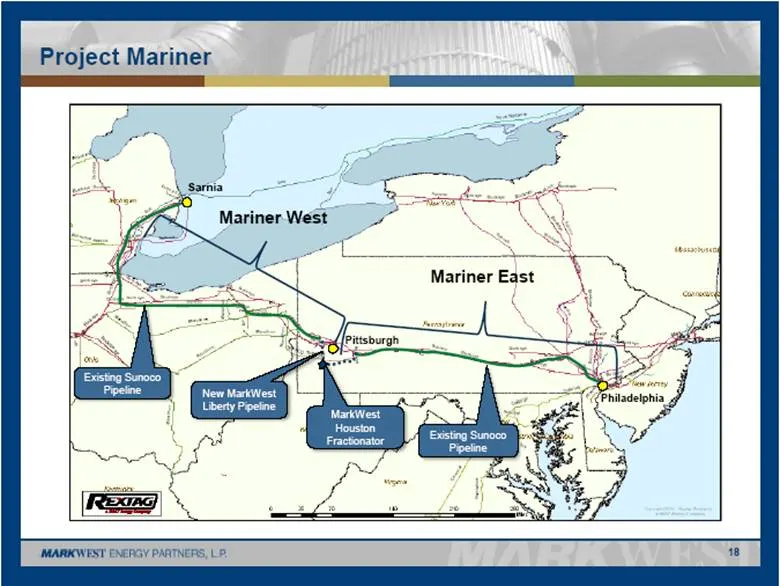
Project Mariner 18 MarkWest Houston Fractionator Mariner East Mariner West New MarkWest Liberty Pipeline Existing Sunoco Pipeline Existing Sunoco Pipeline Sarnia Pittsburgh Philadelphia
Slide 19: Project Mariner: A Comprehensive Ethane Solution
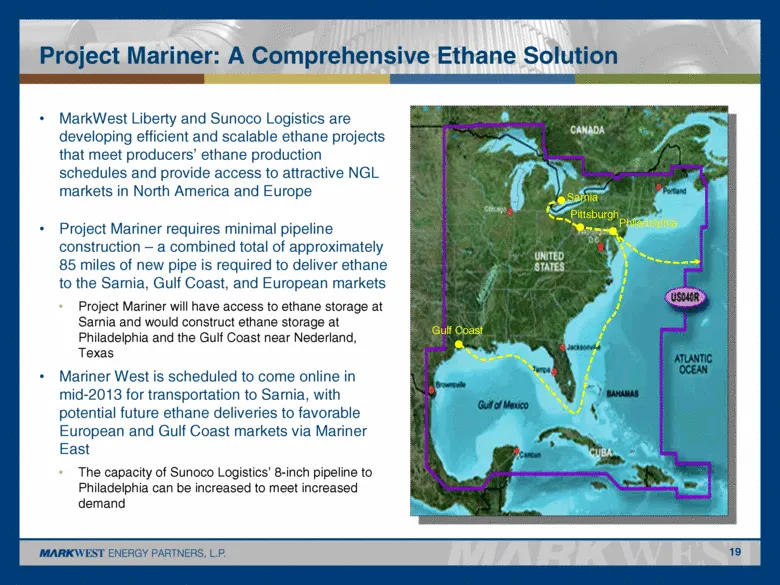
Project Mariner: A Comprehensive Ethane Solution MarkWest Liberty and Sunoco Logistics are developing efficient and scalable ethane projects that meet producers’ ethane production schedules and provide access to attractive NGL markets in North America and Europe Project Mariner requires minimal pipe
Slide 20: In the Heart of the Shale Opportunities
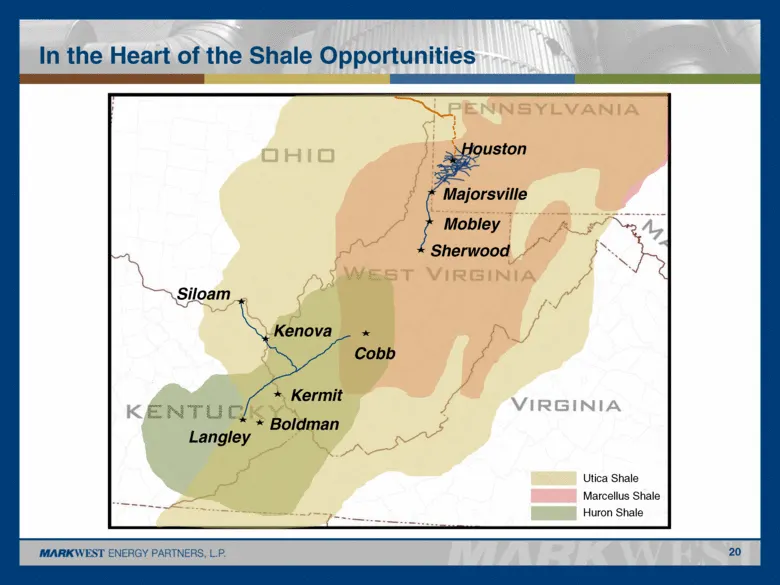
In the Heart of the Shale Opportunities 20 Siloam Langley Kenova Cobb Kermit Boldman Majorsville Houston Mobley Marcellus Shale Huron Shale Utica Shale Sherwood
Slide 21: Financial Overview
Financial Overview
Slide 22: 2011 and 2012 DCF and Capital Expenditure Forecast
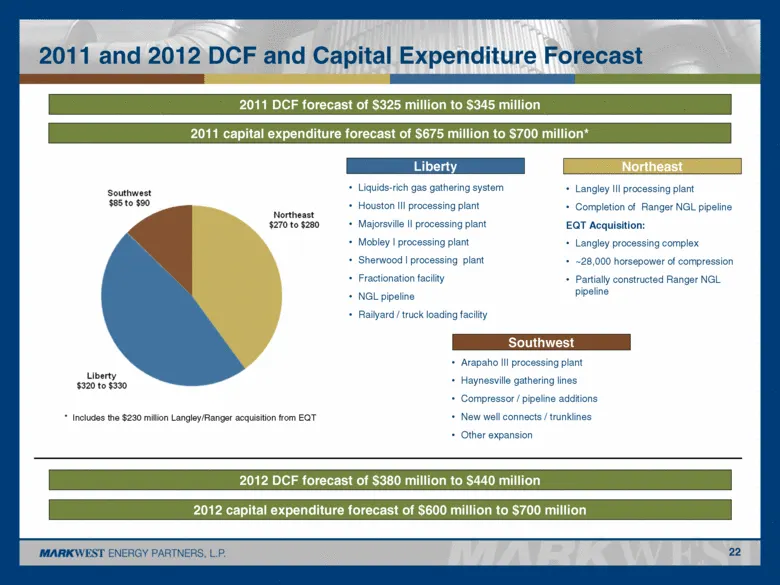
2011 and 2012 DCF and Capital Expenditure Forecast 2011 DCF forecast of $325 million to $345 million 2011 capital expenditure forecast of $675 million to $700 million* * Includes the $230 million Langley/Ranger acquisition from EQT Liquids-rich gas gathering system Houston III processing plant Major
Slide 23: Capital Markets and Liquidity Update
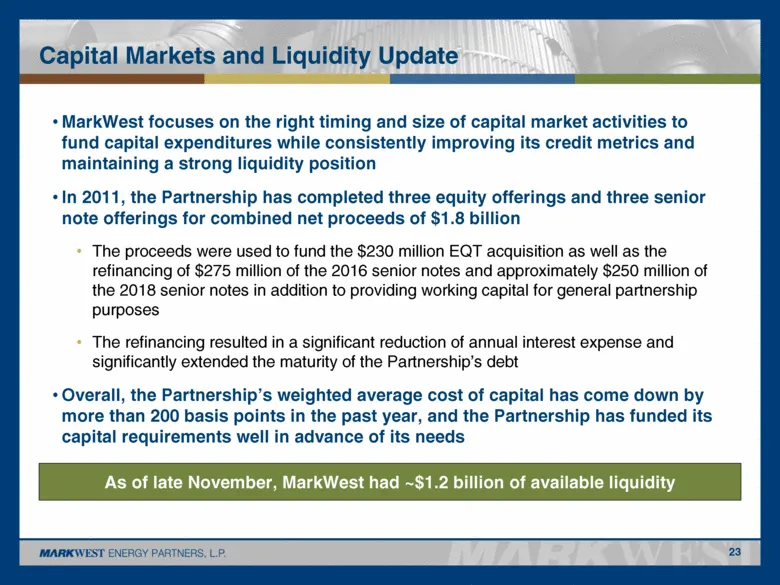
Capital Markets and Liquidity Update MarkWest focuses on the right timing and size of capital market activities to fund capital expenditures while consistently improving its credit metrics and maintaining a strong liquidity position In 2011, the Partnership has completed three equity offerings and t
Slide 24: Capital Structure
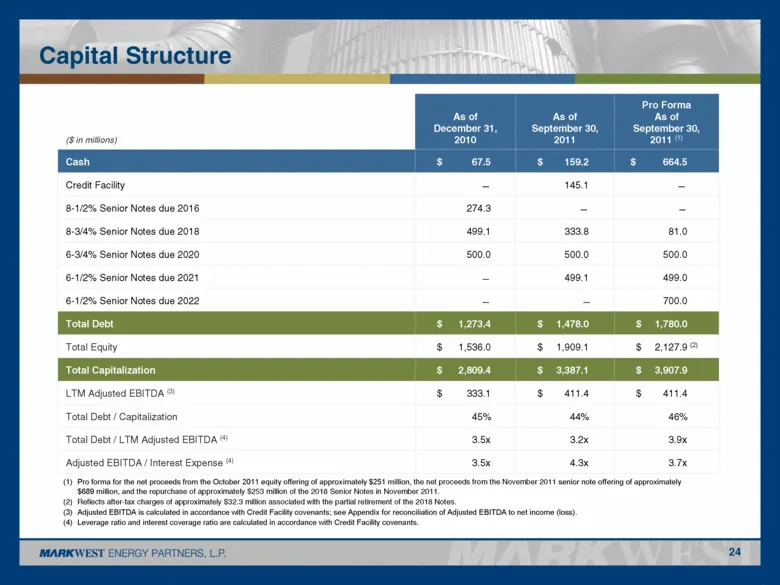
Capital Structure ($ in millions) As of December 31, 2010 As of September 30, 2011 Pro Forma As of September 30, 2011 (1) Cash $ 67.5 $ 159.2 $ 664.5 Credit Facility — 145.1 — 8-1/2% Senior Notes due 2016 274.3 — — 8-3/4% Senior Notes due 2018 499.1 333.8 81.0 6-3/4% Senior Notes due 2020 500.0 500.
Slide 25: Strong Distribution Growth and Unit Performance
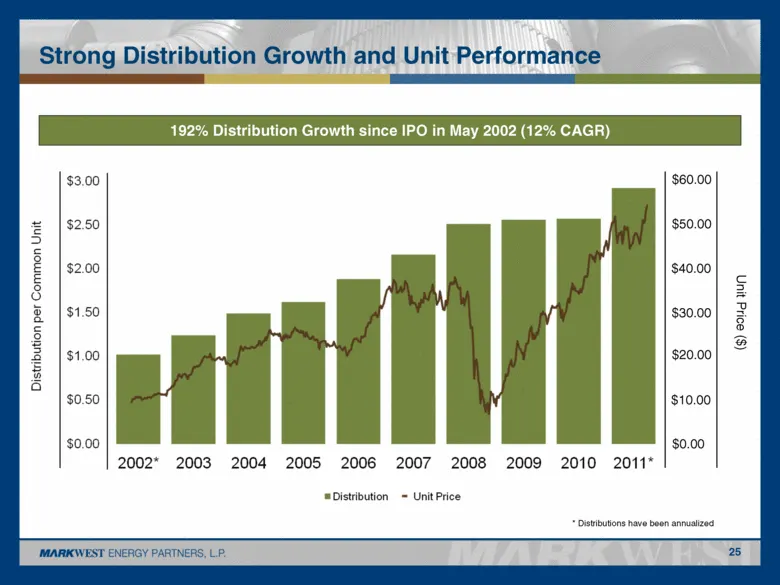
Strong Distribution Growth and Unit Performance 25 * Distributions have been annualized $60.00 $0.00 $10.00 $20.00 $30.00 $50.00 Unit Price ($) 192% Distribution Growth since IPO in May 2002 (12% CAGR) $40.00 -
Slide 26: Cost of Equity Capital
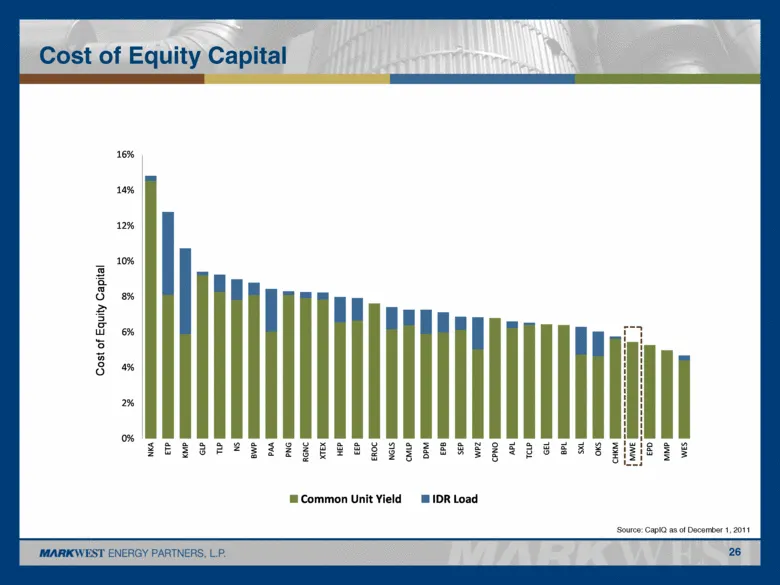
Cost of Equity Capital Source: CapIQ as of December 1, 2011 26 0% 2% 4% 6% 8% 10% 12% 14% 16% NKA ETP KMP GLP TLP NS BWP PAA PNG RGNC XTEX HEP EEP EROC NGLS CMLP DPM EPB SEP WPZ CPNO APL TCLP GEL BPL SXL OKS CHKM MWE EPD MMP WES Cost of Equity Capital Common Unit Yield IDR Load
Slide 27: Risk Management Program
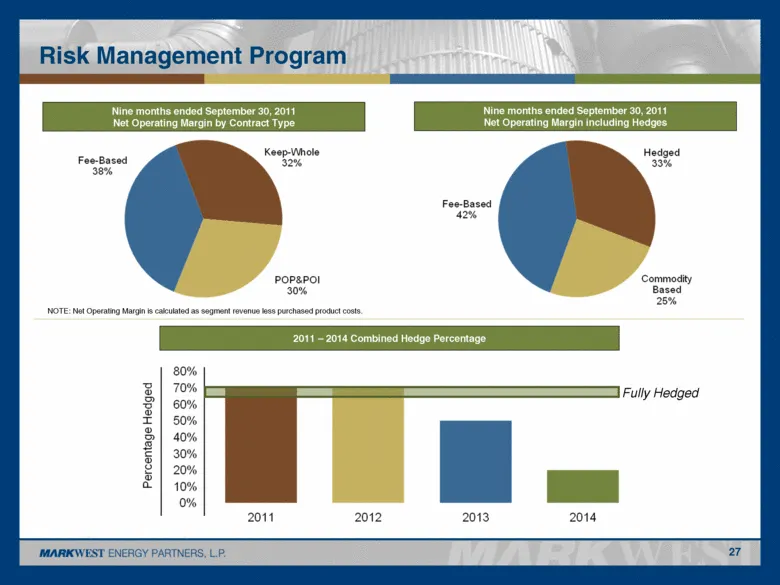
Risk Management Program 27 2011 – 2014 Combined Hedge Percentage NOTE: Net Operating Margin is calculated as segment revenue less purchased product costs. Nine months ended September 30, 2011 Net Operating Margin including Hedges Nine months ended September 30, 2011 Net Operating Margin by Contract
Slide 28: Keys to Success
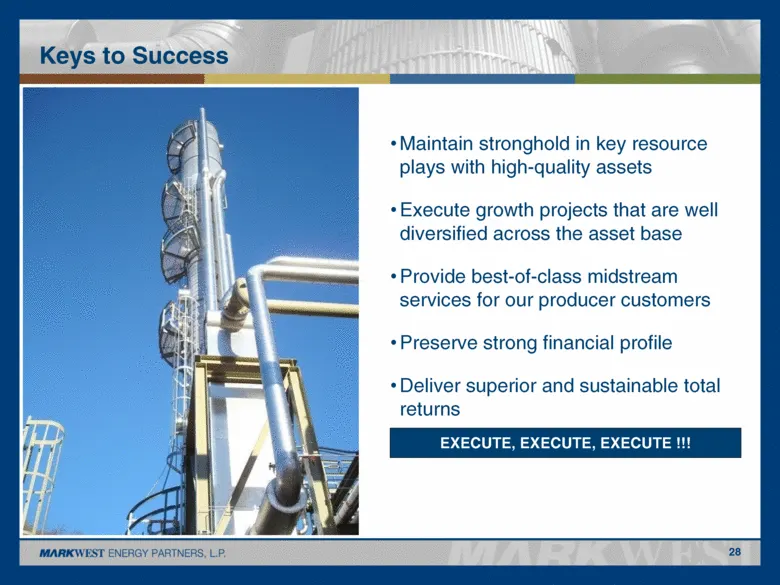
Keys to Success Maintain stronghold in key resource plays with high-quality assets Execute growth projects that are well diversified across the asset base Provide best-of-class midstream services for our producer customers Preserve strong financial profile Deliver superior and sustainable total retu
Slide 29: MarkWest Energy Partners, L.P.
MARKWEST ENERGY PARTNERS, L.P.
Slide 30: Reconciliation of DCF and Distribution Coverage
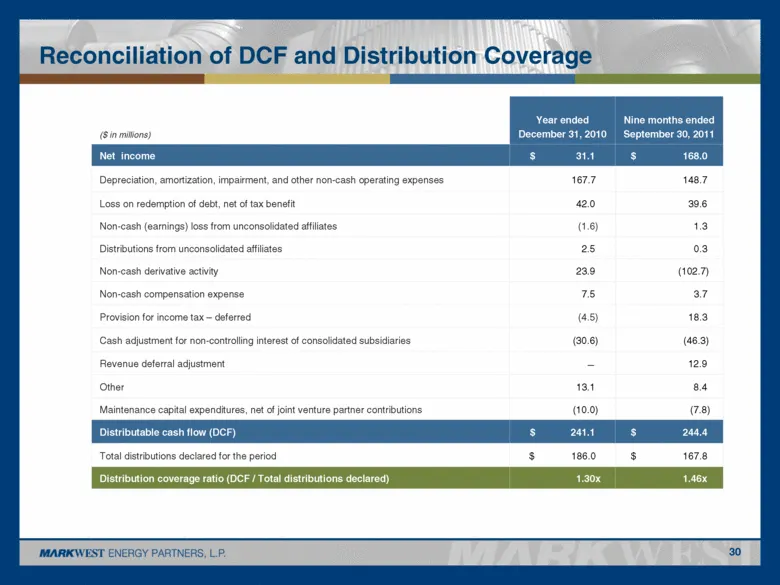
Reconciliation of DCF and Distribution Coverage ($ in millions) Year ended December 31, 2010 Nine months ended September 30, 2011 Net income $ 31.1 $ 168.0 Depreciation, amortization, impairment, and other non-cash operating expenses 167.7 148.7 Loss on redemption of debt, net of tax benefit 42.0 39
Slide 31: Reconciliation of Adjusted EBITDA
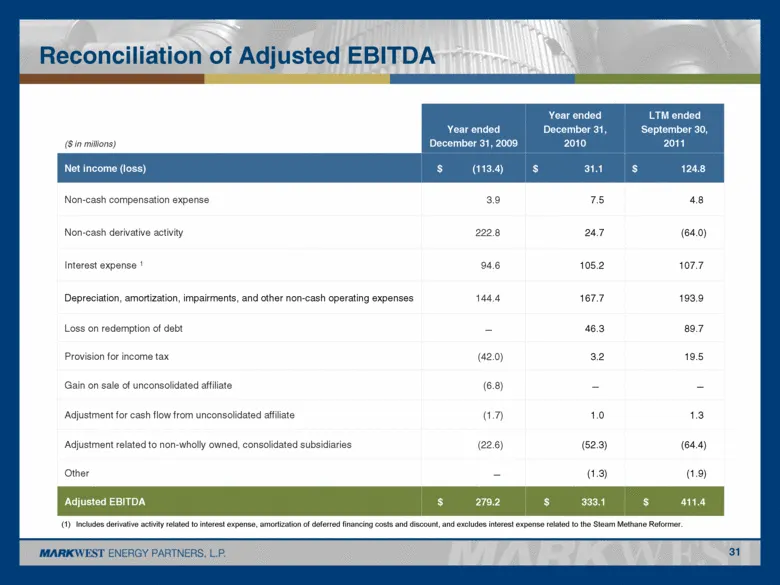
Reconciliation of Adjusted EBITDA ($ in millions) Year ended December 31, 2009 Year ended December 31, 2010 LTM ended September 30, 2011 Net income (loss) $ (113.4) $ 31.1 $ 124.8 Non-cash compensation expense 3.9 7.5 4.8 Non-cash derivative activity 222.8 24.7 (64.0) Interest expense 1 94.6 105.2 1
Slide 32: Reconciliation of Net Operating Margin
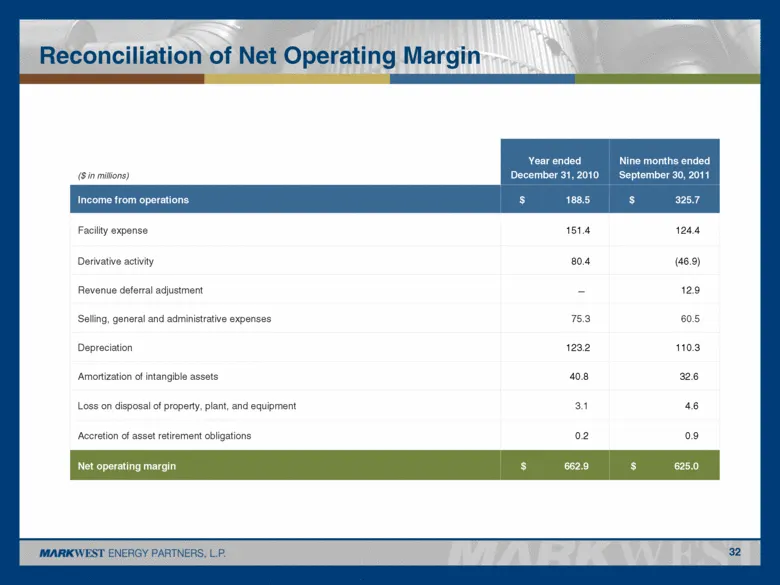
Reconciliation of Net Operating Margin ($ in millions) Year ended December 31, 2010 Nine months ended September 30, 2011 Income from operations $ 188.5 $ 325.7 Facility expense 151.4 124.4 Derivative activity 80.4 (46.9) Revenue deferral adjustment — 12.9 Selling, general and administrative expenses
Slide 33: Contact details
1515 Arapahoe Street Tower 1, Suite 1600 Denver, Colorado 80202 Phone: 303-925-9200 Investor Relations: 866-858-0482 Email: investorrelations@markwest.com Website: www.markwest.com
Source: SEC EDGAR · 8-K filed Dec 6, 2011
More decks from Markwest Energy Partners LP
 Fact Sheet (July 2017)1 slide · July 2017
 Fact Sheet (July 2017)1 slide · July 2017
 Fact Sheet (July 2017)1 slide · July 2017
 Markwest Energy Partners L P — Investor Day (December 2015)116 slides · Dec 3, 2015
 Merger or Acquisition (November 2015)17 slides · Nov 13, 2015
 Merger or Acquisition (November 2015)17 slides · Nov 12, 2015