Spirit Realty Capital — Q4 2015 Earnings Presentation
27 slides from Spirit Realty Capital's earnings presentation, Feb 25, 2016
Slide 1: Supplemental Financial & Operating Information Fourth Quarter Ended December 31, 2015
NYSE:SRC Supplemental Financial & Operating Information FOURTH QUARTER ENDED DECEMBER 31, 2015
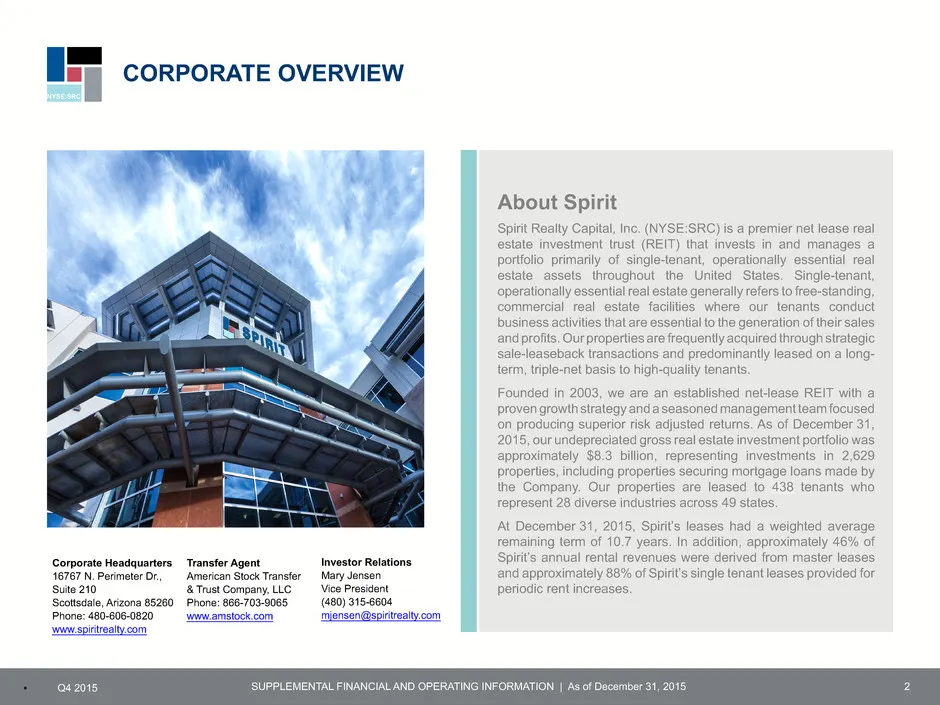
Slide 2: About Spirit / Corporate Overview
NYSE:SRC SUPPLEMENTAL FINANCIAL AND OPERATING INFORMATION | As of December 31, 2015▪ Q4 2015 About Spirit Spirit Realty Capital, Inc. (NYSE:SRC) is a premier net lease real estate investment trust (REIT) that invests in and manages a portfolio primarily of single-tenant, operationally essential real
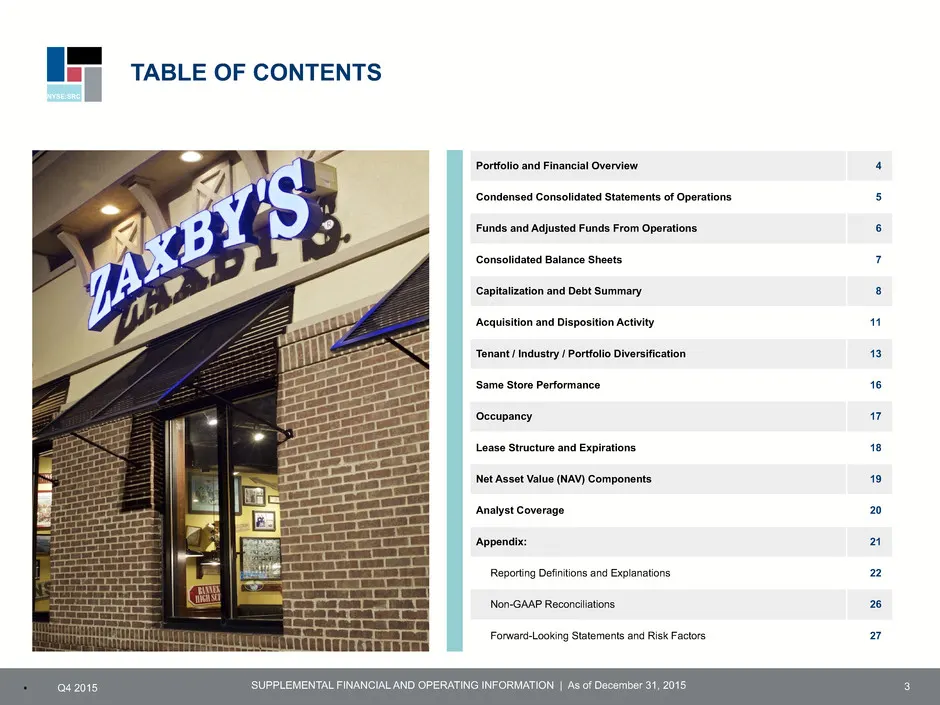
Slide 3: Table of Contents
NYSE:SRC SUPPLEMENTAL FINANCIAL AND OPERATING INFORMATION | As of December 31, 2015▪ Q4 2015 TABLE OF CONTENTS 3 Portfolio and Financial Overview 4 Condensed Consolidated Statements of Operations 5 Funds and Adjusted Funds From Operations 6 Consolidated Balance Sheets 7 Capitalization and Debt Summa
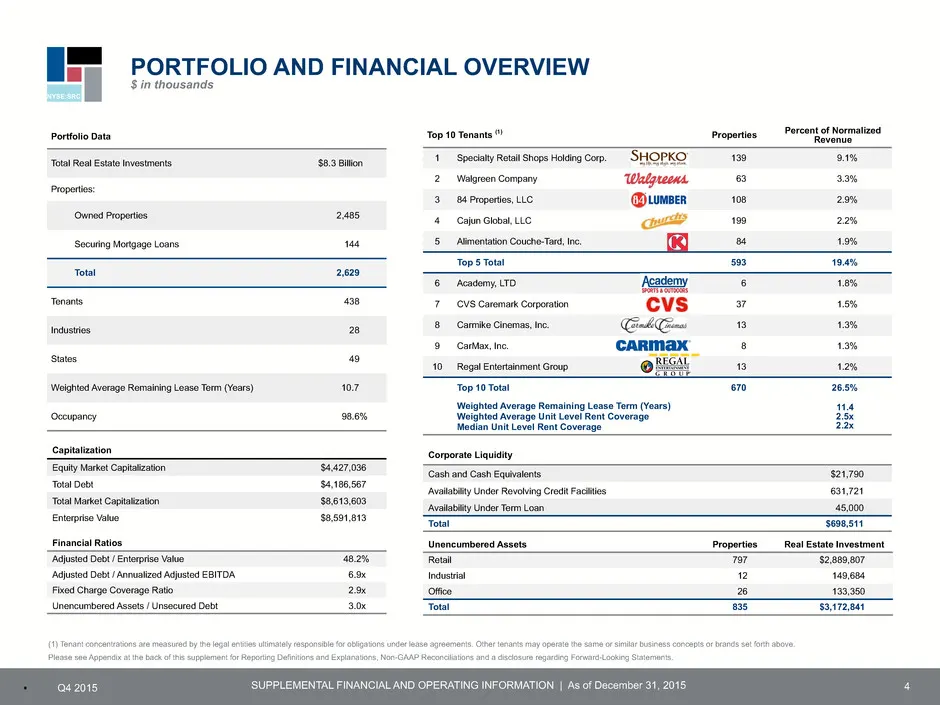
Slide 4: Portfolio and Financial Overview
NYSE:SRC SUPPLEMENTAL FINANCIAL AND OPERATING INFORMATION | As of December 31, 2015▪ Q4 2015 PORTFOLIO AND FINANCIAL OVERVIEW $ in thousands 4 Portfolio Data Total Real Estate Investments $8.3 Billion Properties: Owned Properties 2,485 Securing Mortgage Loans 144 Total 2,629 Tenants 438 Industries 2
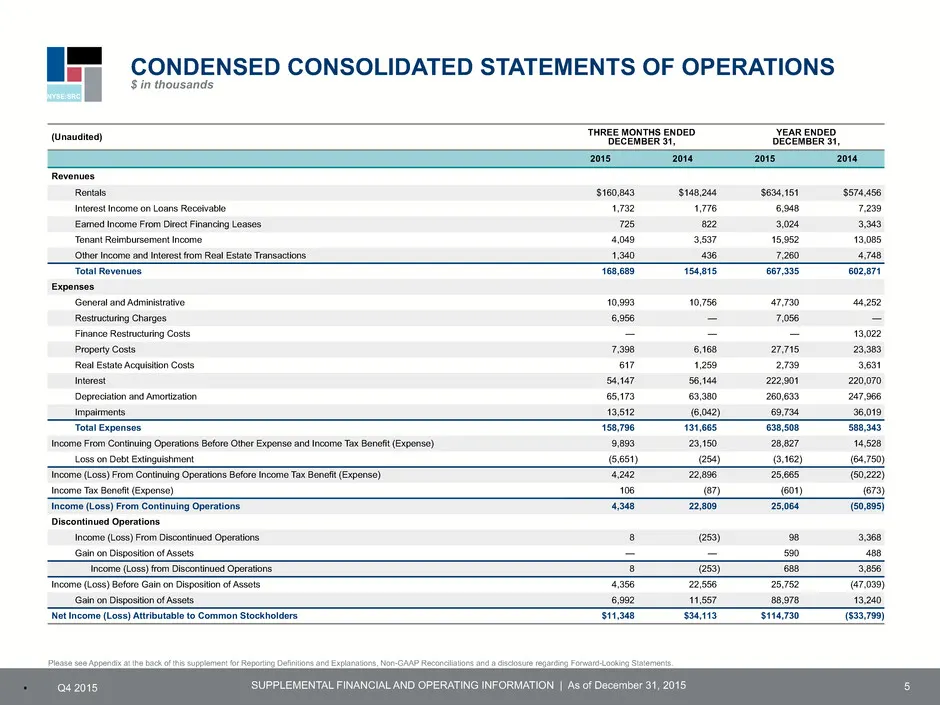
Slide 5: Condensed Consolidated Statements of Operations
NYSE:SRC SUPPLEMENTAL FINANCIAL AND OPERATING INFORMATION | As of December 31, 2015▪ Q4 2015 CONDENSED CONSOLIDATED STATEMENTS OF OPERATIONS $ in thousands 5 (Unaudited) THREE MONTHS ENDED DECEMBER 31, YEAR ENDED DECEMBER 31, 2015 2014 2015 2014 Revenues Rentals $160,843 $148,244 $634,151 $574,456 I
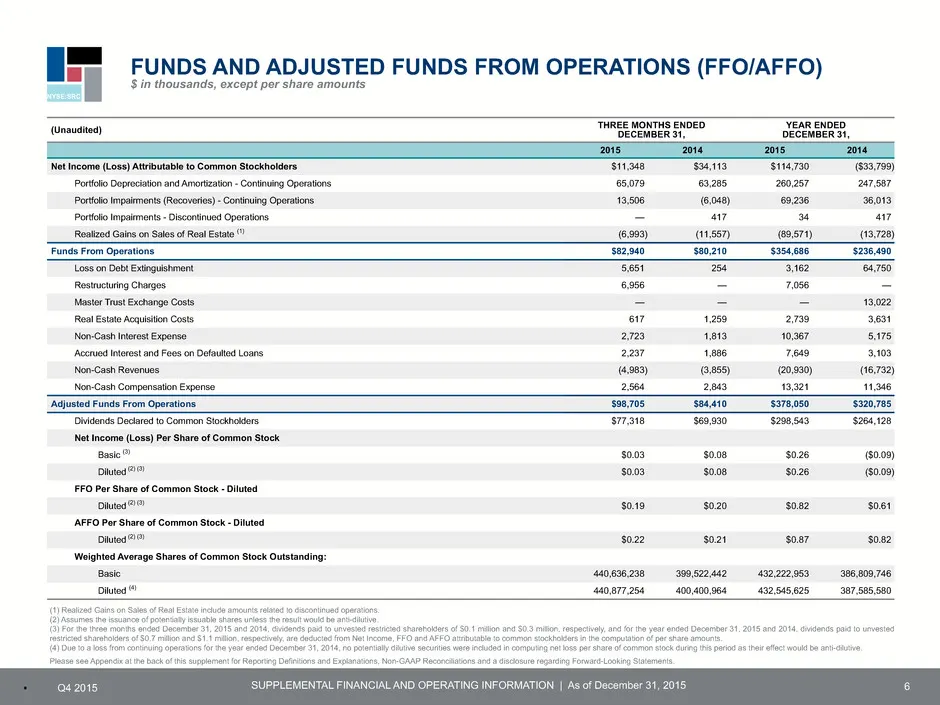
Slide 6: Funds and Adjusted Funds From Operations (FFO/AFFO)
NYSE:SRC SUPPLEMENTAL FINANCIAL AND OPERATING INFORMATION | As of December 31, 2015▪ Q4 2015 FUNDS AND ADJUSTED FUNDS FROM OPERATIONS (FFO/AFFO) $ in thousands, except per share amounts 6 (Unaudited) THREE MONTHS ENDED DECEMBER 31, YEAR ENDED DECEMBER 31, 2015 2014 2015 2014 Net Income (Loss) Attrib
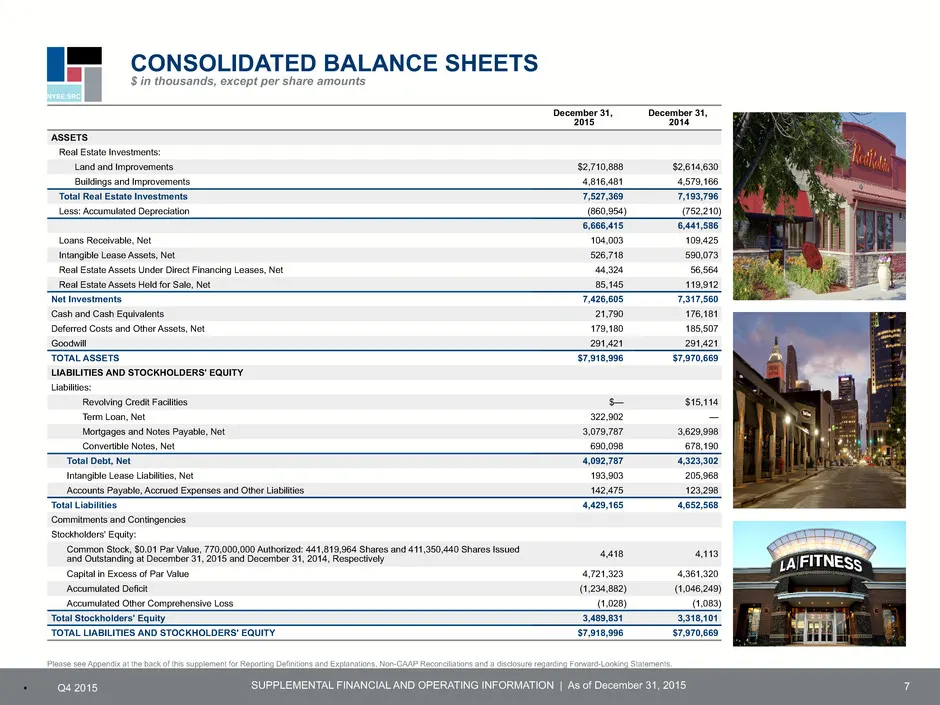
Slide 7: Consolidated Balance Sheets
NYSE:SRC SUPPLEMENTAL FINANCIAL AND OPERATING INFORMATION | As of December 31, 2015▪ Q4 2015 7 December 31, 2015 December 31, 2014 ASSETS Real Estate Investments: Land and Improvements $2,710,888 $2,614,630 Buildings and Improvements 4,816,481 4,579,166 Total Real Estate Investments 7,527,369 7,193,
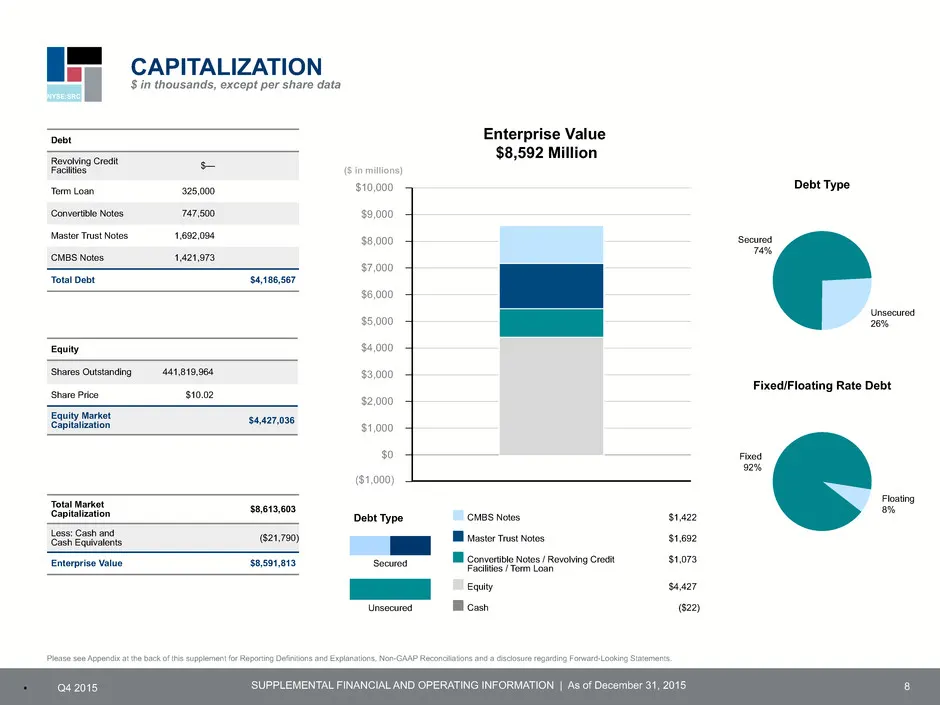
Slide 8: Capitalization
NYSE:SRC SUPPLEMENTAL FINANCIAL AND OPERATING INFORMATION | As of December 31, 2015▪ Q4 2015 Enterprise Value $8,592 Million $10,000 $9,000 $8,000 $7,000 $6,000 $5,000 $4,000 $3,000 $2,000 $1,000 $0 -$1,000 8 Equity Shares Outstanding 441,819,964 Share Price $10.02 Equity Market Capitalization $4,42
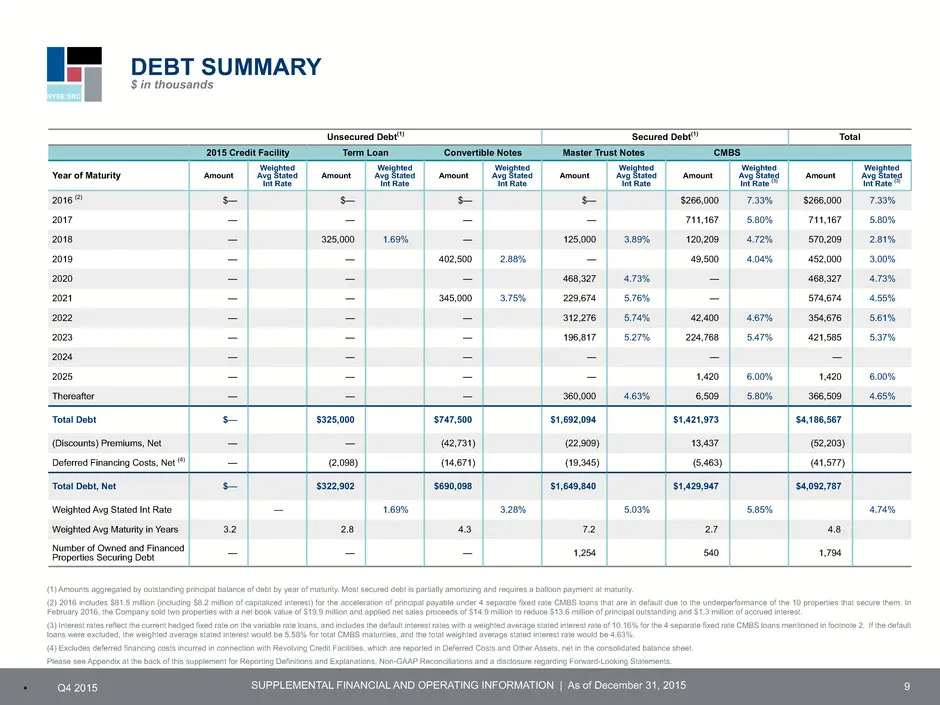
Slide 9: Debt Summary by Year of Maturity
NYSE:SRC SUPPLEMENTAL FINANCIAL AND OPERATING INFORMATION | As of December 31, 2015▪ Q4 2015 9 Unsecured Debt(1) Secured Debt(1) Total 2015 Credit Facility Term Loan Convertible Notes Master Trust Notes CMBS Year of Maturity Amount Weighted Avg Stated Int Rate Amount Weighted Avg Stated Int Rate Amo
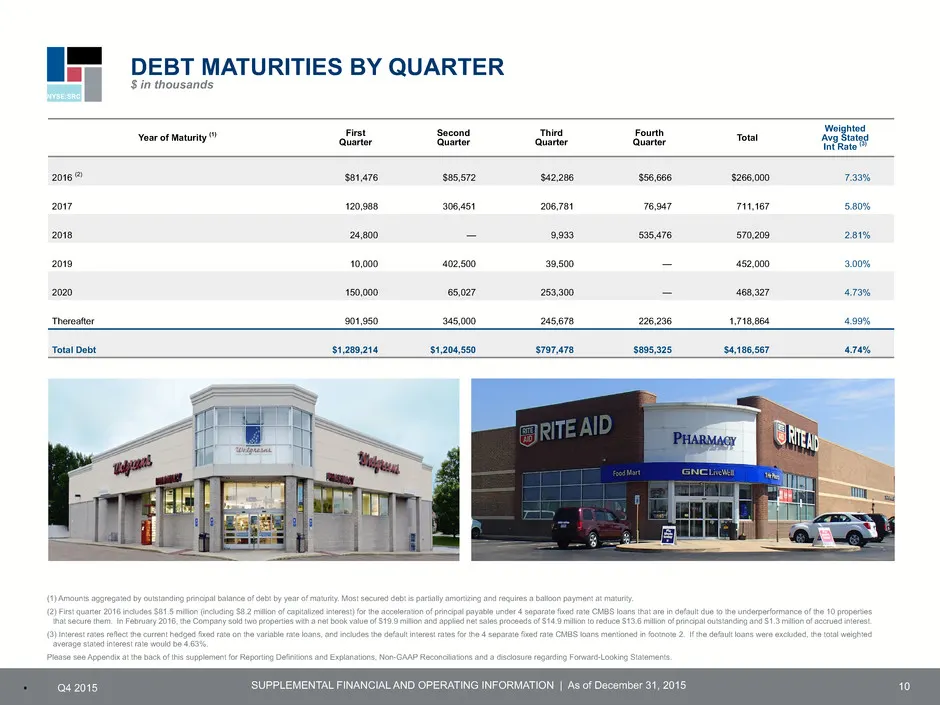
Slide 10: Debt Maturities by Quarter
NYSE:SRC SUPPLEMENTAL FINANCIAL AND OPERATING INFORMATION | As of December 31, 2015▪ Q4 2015 DEBT MATURITIES BY QUARTER $ in thousands Year of Maturity (1) First Quarter Second Quarter Third Quarter Fourth Quarter Total Weighted Avg Stated Int Rate (3) 2016 (2) $81,476 $85,572 $42,286 $56,666 $266,0
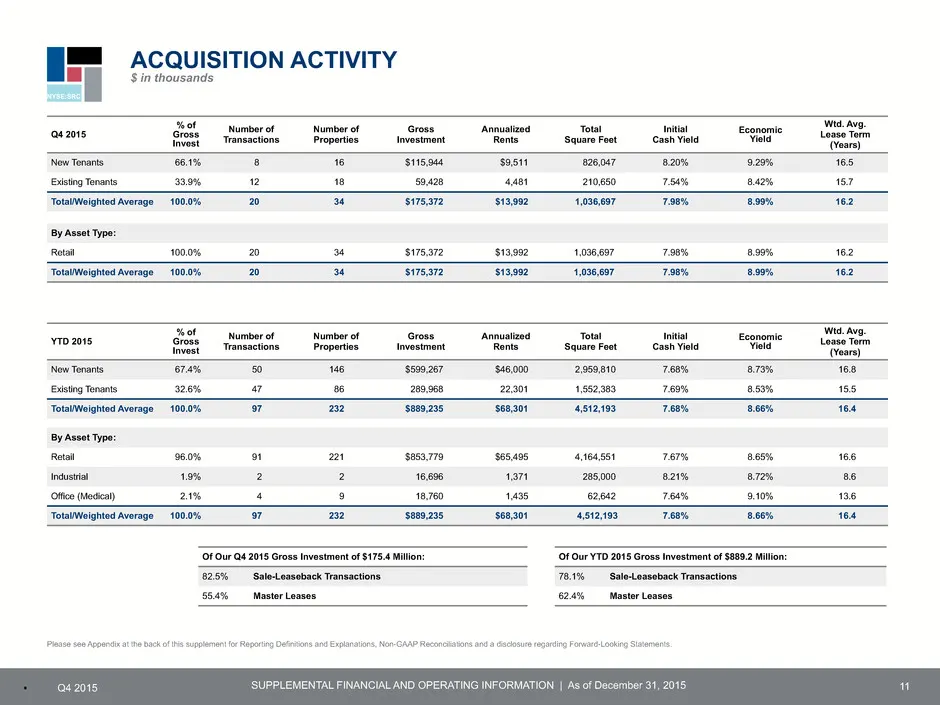
Slide 11: Acquisition Activity
NYSE:SRC SUPPLEMENTAL FINANCIAL AND OPERATING INFORMATION | As of December 31, 2015▪ Q4 2015 11 Q4 2015 % of Gross Invest Number of Transactions Number of Properties Gross Investment Annualized Rents Total Square Feet Initial Cash Yield Economic Yield Wtd. Avg. Lease Term (Years) New Tenants 66.1% 8
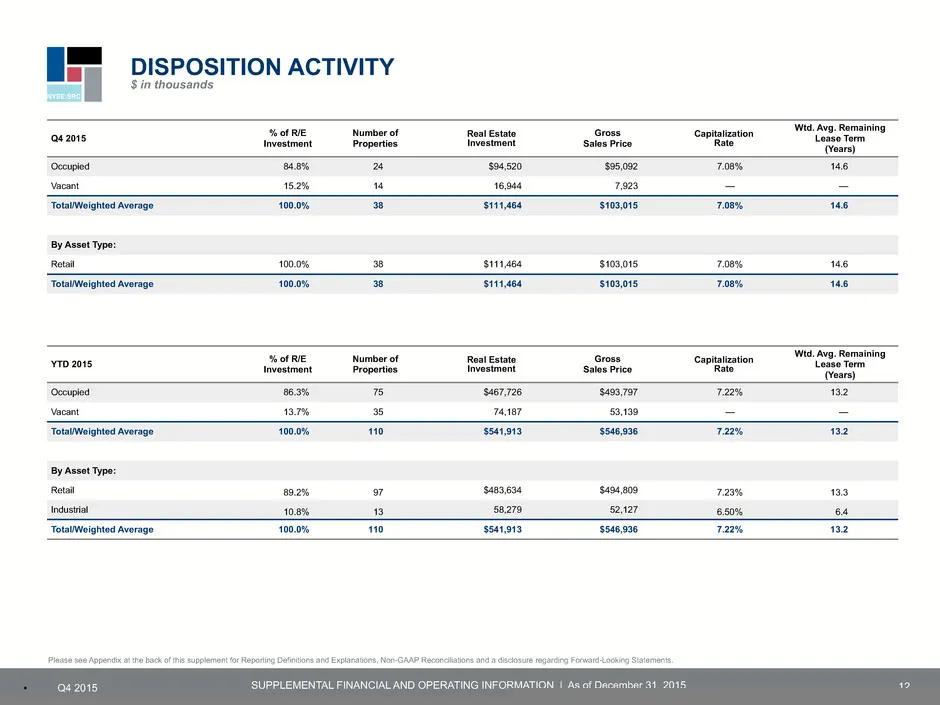
Slide 12: Disposition Activity
NYSE:SRC SUPPLEMENTAL FINANCIAL AND OPERATING INFORMATION | As of December 31, 2015▪ Q4 2015 12 Q4 2015 % of R/EInvestment Number of Properties Real Estate Investment Gross Sales Price Capitalization Rate Wtd. Avg. Remaining Lease Term (Years) Occupied 84.8% 24 $94,520 $95,092 7.08% 14.6 Vacant 15.2
Slide 13: Tenant Diversification – Top 20
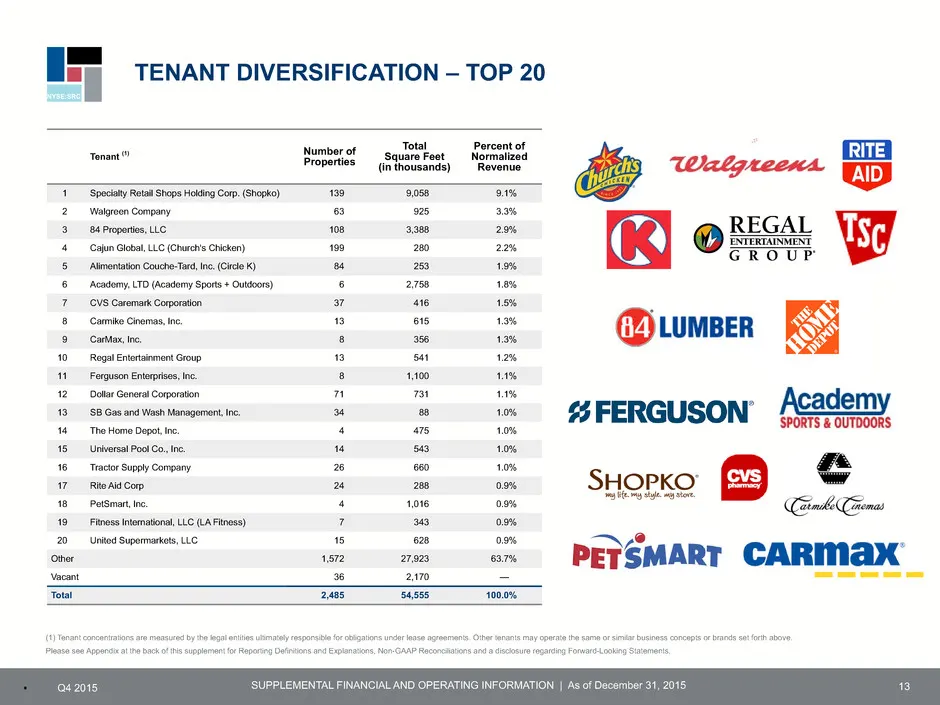
NYSE:SRC SUPPLEMENTAL FINANCIAL AND OPERATING INFORMATION | As of December 31, 2015▪ Q4 2015 TENANT DIVERSIFICATION – TOP 20 13 Tenant (1) Number of Properties Total Square Feet (in thousands) Percent of Normalized Revenue 1 Specialty Retail Shops Holding Corp. (Shopko) 139 9,058 9.1% 2 Walgreen Com
Slide 14: Industry Diversification
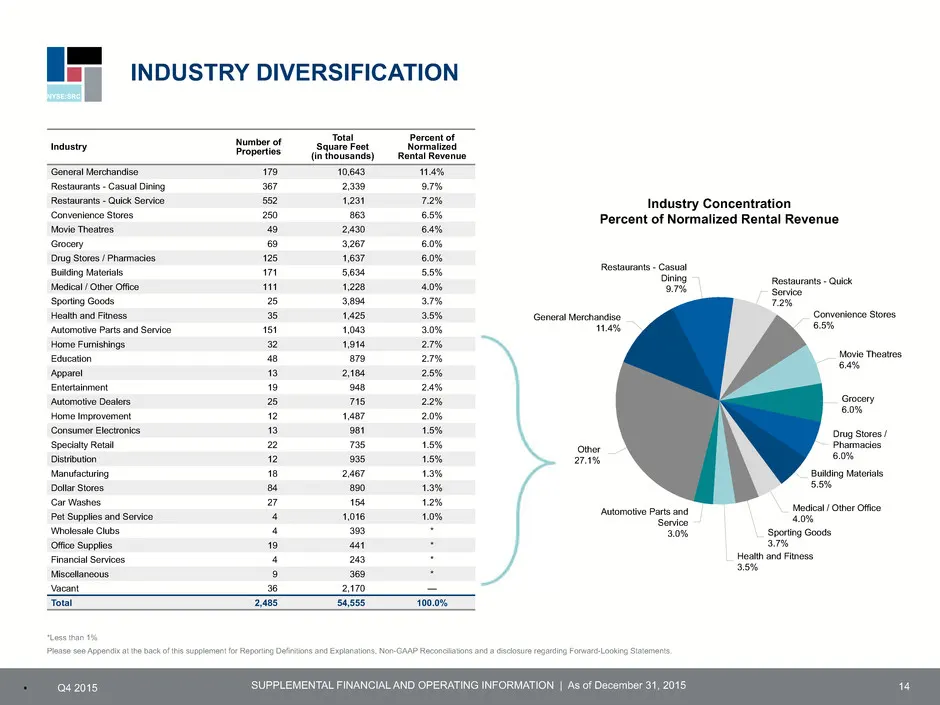
NYSE:SRC SUPPLEMENTAL FINANCIAL AND OPERATING INFORMATION | As of December 31, 2015▪ Q4 2015 INDUSTRY DIVERSIFICATION 14 Industry Number ofProperties Total Square Feet (in thousands) Percent of Normalized Rental Revenue General Merchandise 179 10,643 11.4% Restaurants - Casual Dining 367 2,339 9.7%
Slide 15: Portfolio Diversification
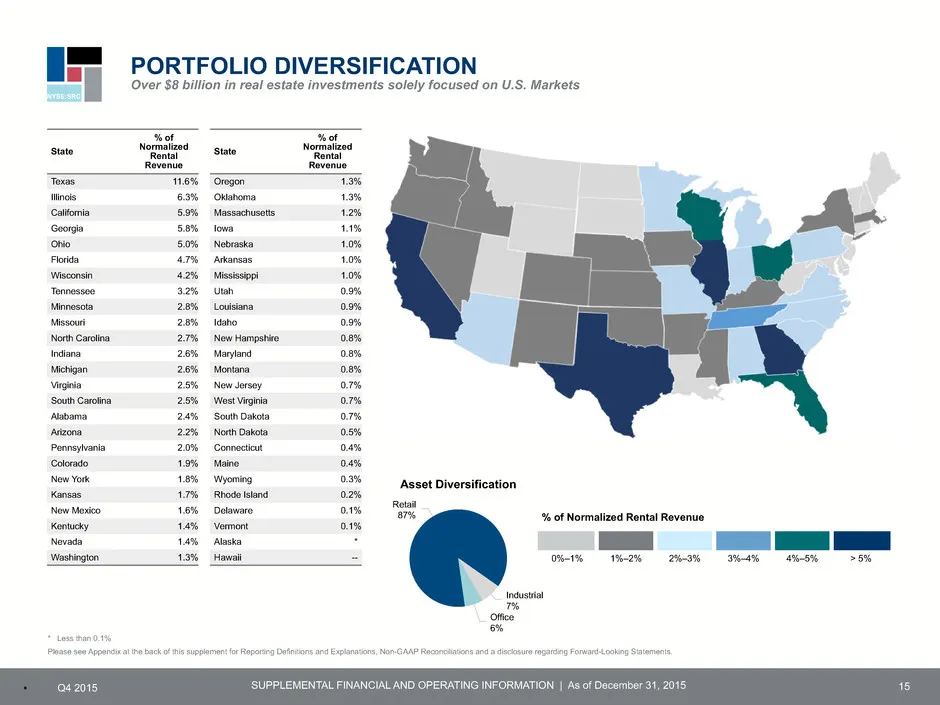
NYSE:SRC SUPPLEMENTAL FINANCIAL AND OPERATING INFORMATION | As of December 31, 2015▪ Q4 2015 PORTFOLIO DIVERSIFICATION Over $8 billion in real estate investments solely focused on U.S. Markets 15 * Less than 0.1% Please see Appendix at the back of this supplement for Reporting Definitions and Explan
Slide 16: Same Store Performance
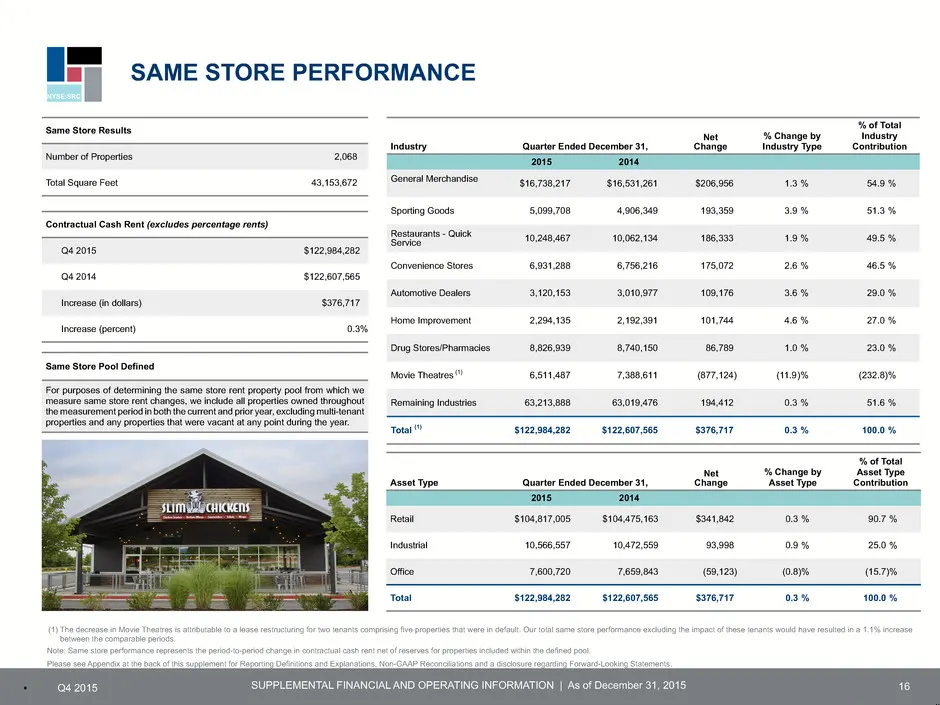
NYSE:SRC SUPPLEMENTAL FINANCIAL AND OPERATING INFORMATION | As of December 31, 2015▪ Q4 2015 SAME STORE PERFORMANCE 16 Note: Same store performance represents the period-to-period change in contractual cash rent net of reserves for properties included within the defined pool. Please see Appendix at
Slide 17: Occupancy
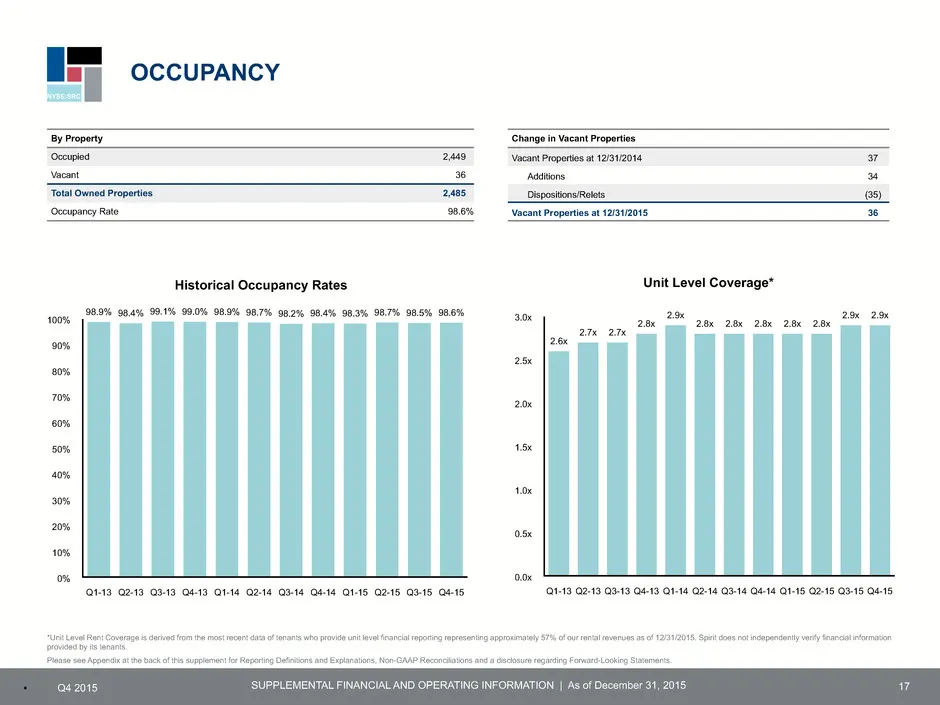
NYSE:SRC SUPPLEMENTAL FINANCIAL AND OPERATING INFORMATION | As of December 31, 2015▪ Q4 2015 OCCUPANCY 17 *Unit Level Rent Coverage is derived from the most recent data of tenants who provide unit level financial reporting representing approximately 57% of our rental revenues as of 12/31/2015. Spiri
Slide 18: Lease Structure and Expirations
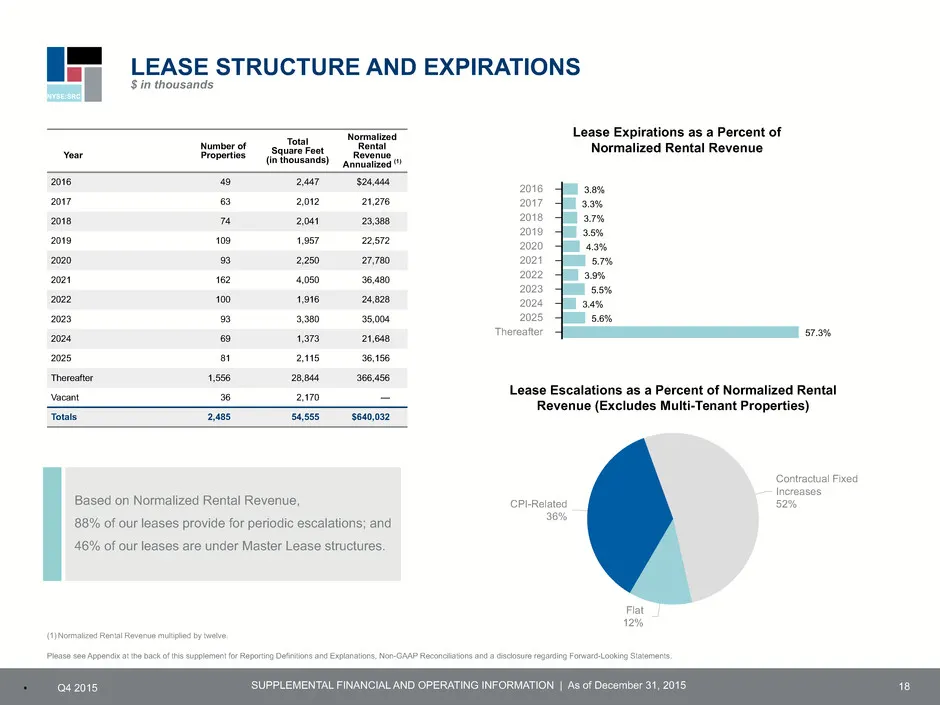
NYSE:SRC SUPPLEMENTAL FINANCIAL AND OPERATING INFORMATION | As of December 31, 2015▪ Q4 2015 18 Please see Appendix at the back of this supplement for Reporting Definitions and Explanations, Non-GAAP Reconciliations and a disclosure regarding Forward-Looking Statements. Year Number of Properties Tot
Slide 19: Net Asset Value (NAV) Components
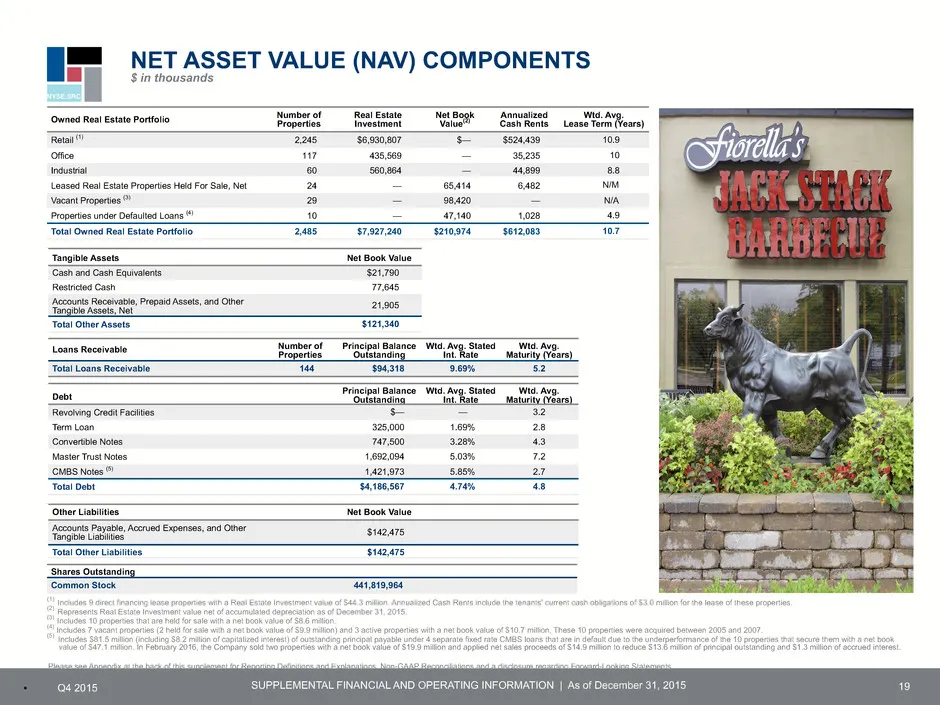
NYSE:SRC SUPPLEMENTAL FINANCIAL AND OPERATING INFORMATION | As of December 31, 2015▪ Q4 2015 19 Owned Real Estate Portfolio Number ofProperties Real Estate Investment Net Book Value(2) Annualized Cash Rents Wtd. Avg. Lease Term (Years) Retail (1) 2,245 $6,930,807 $— $524,439 10.9 Office 117 435,569
Slide 20: Analyst Coverage
NYSE:SRC SUPPLEMENTAL FINANCIAL AND OPERATING INFORMATION | As of December 31, 2015▪ Q4 2015 ANALYST COVERAGE 20 BofA Merrill Lynch Juan Sanabria juan.sanabria@baml.com 646.855.1589 Camille Tan camille.tan@baml.com 646.556.2095 Capital One Chris Lucas christopher.lucas@capitalone.com 571.633.8151 Vi

Slide 21: Appendix
NYSE:SRC SUPPLEMENTAL FINANCIAL AND OPERATING INFORMATION | As of December 31, 2015▪ Q4 2015 Appendix 21
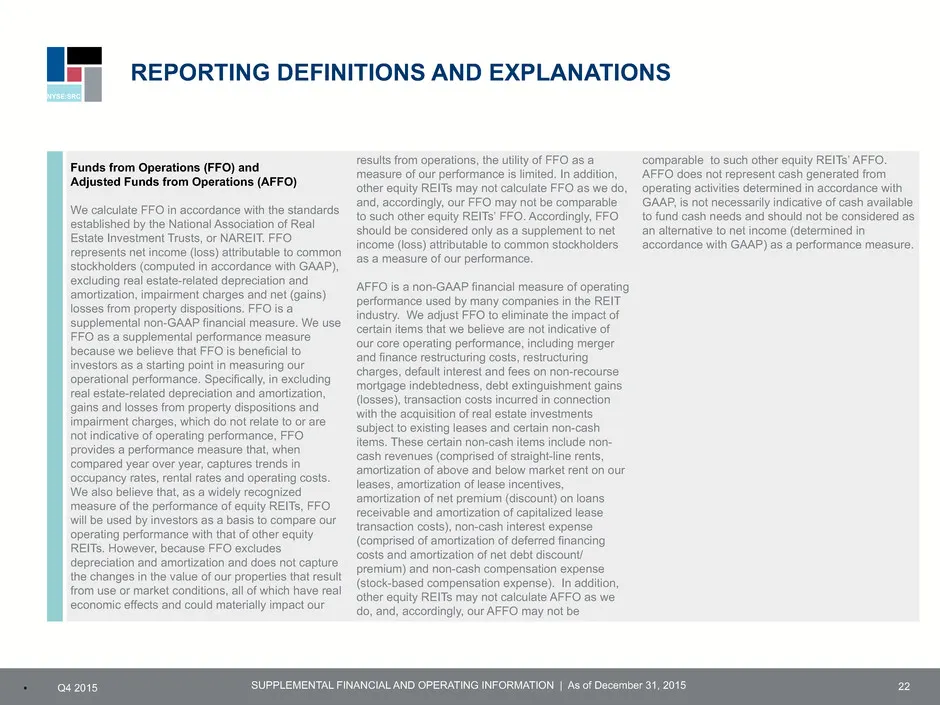
Slide 22: Reporting Definitions and Explanations
NYSE:SRC SUPPLEMENTAL FINANCIAL AND OPERATING INFORMATION | As of December 31, 2015▪ Q4 2015 REPORTING DEFINITIONS AND EXPLANATIONS 22 Funds from Operations (FFO) and Adjusted Funds from Operations (AFFO) We calculate FFO in accordance with the standards established by the National Association of Re
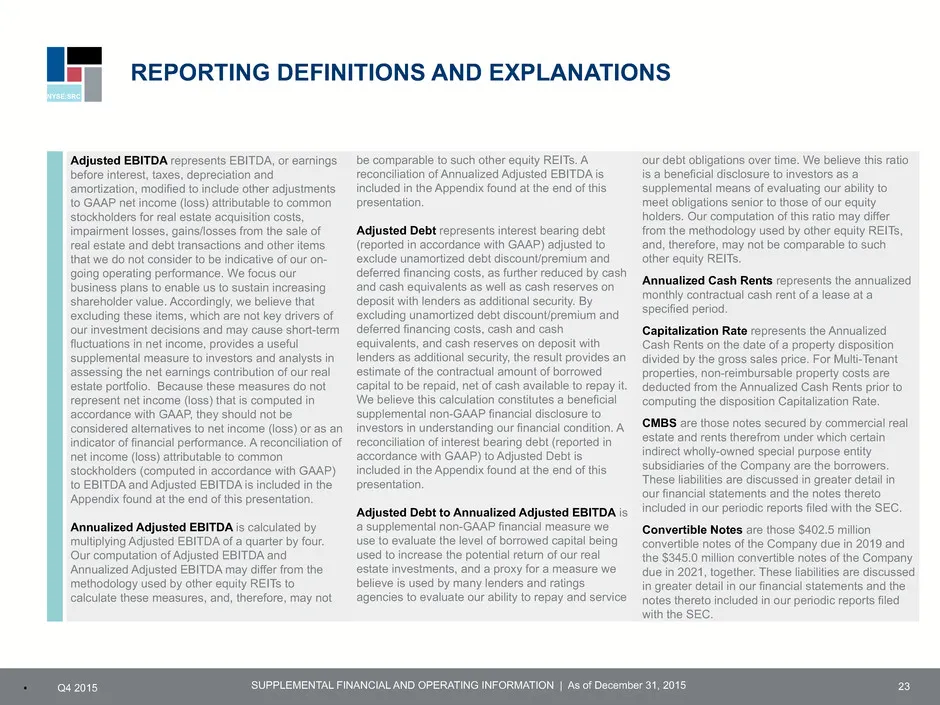
Slide 23: Reporting Definitions and Explanations (Adjusted EBITDA)
NYSE:SRC SUPPLEMENTAL FINANCIAL AND OPERATING INFORMATION | As of December 31, 2015▪ Q4 2015 Adjusted EBITDA represents EBITDA, or earnings before interest, taxes, depreciation and amortization, modified to include other adjustments to GAAP net income (loss) attributable to common stockholders for r
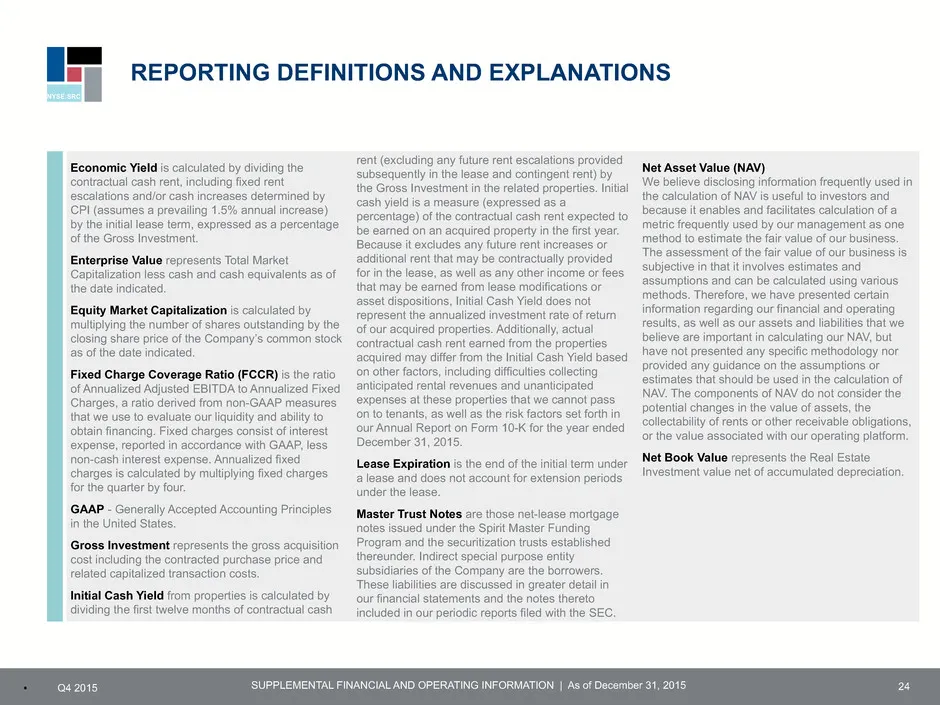
Slide 24: Reporting Definitions and Explanations
NYSE:SRC SUPPLEMENTAL FINANCIAL AND OPERATING INFORMATION | As of December 31, 2015▪ Q4 2015 REPORTING DEFINITIONS AND EXPLANATIONS 24 Economic Yield is calculated by dividing the contractual cash rent, including fixed rent escalations and/or cash increases determined by CPI (assumes a prevailing 1.
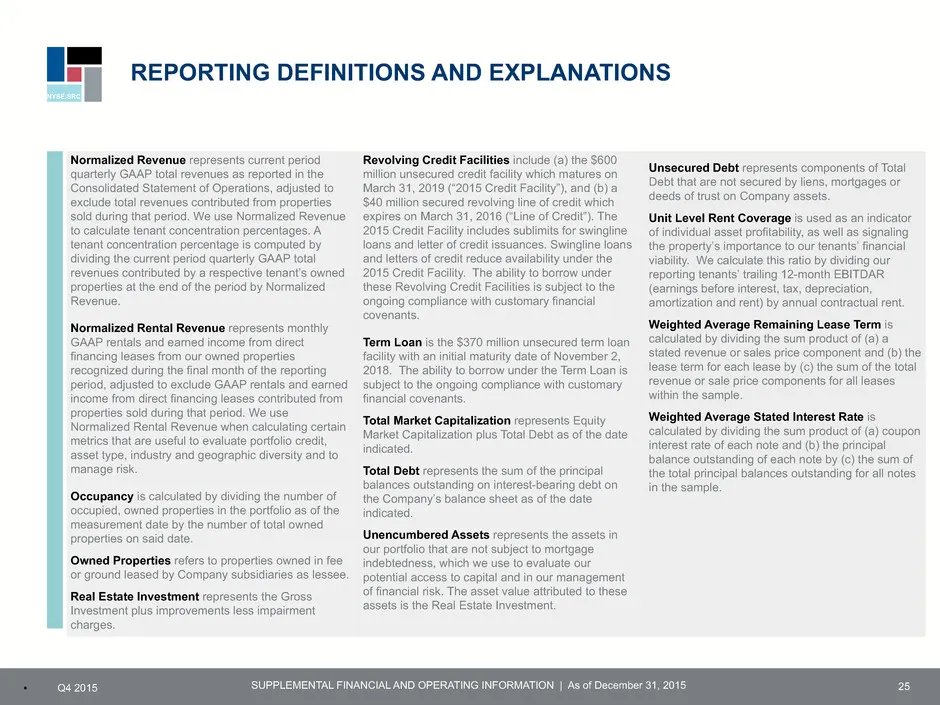
Slide 25: Reporting Definitions and Explanations
NYSE:SRC SUPPLEMENTAL FINANCIAL AND OPERATING INFORMATION | As of December 31, 2015▪ Q4 2015 REPORTING DEFINITIONS AND EXPLANATIONS 25 Normalized Revenue represents current period quarterly GAAP total revenues as reported in the Consolidated Statement of Operations, adjusted to exclude total revenue
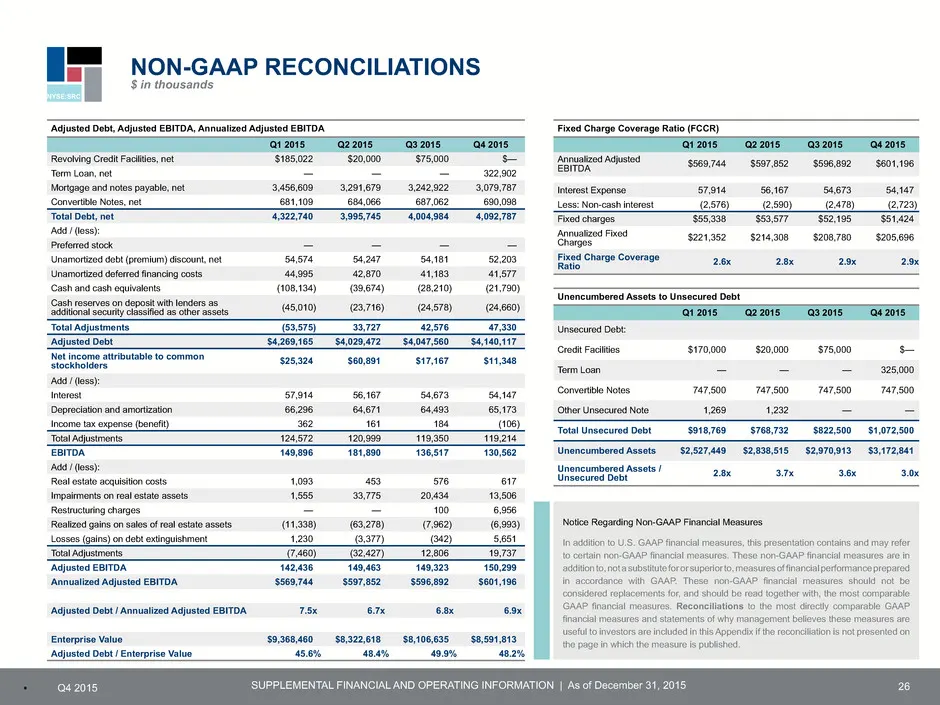
Slide 26: Adjusted Debt, Adjusted EBITDA, Annualized Adjusted EBITDA
NYSE:SRC SUPPLEMENTAL FINANCIAL AND OPERATING INFORMATION | As of December 31, 2015▪ Q4 2015 26 Adjusted Debt, Adjusted EBITDA, Annualized Adjusted EBITDA Q1 2015 Q2 2015 Q3 2015 Q4 2015 Revolving Credit Facilities, net $185,022 $20,000 $75,000 $— Term Loan, net — — — 322,902 Mortgage and notes paya
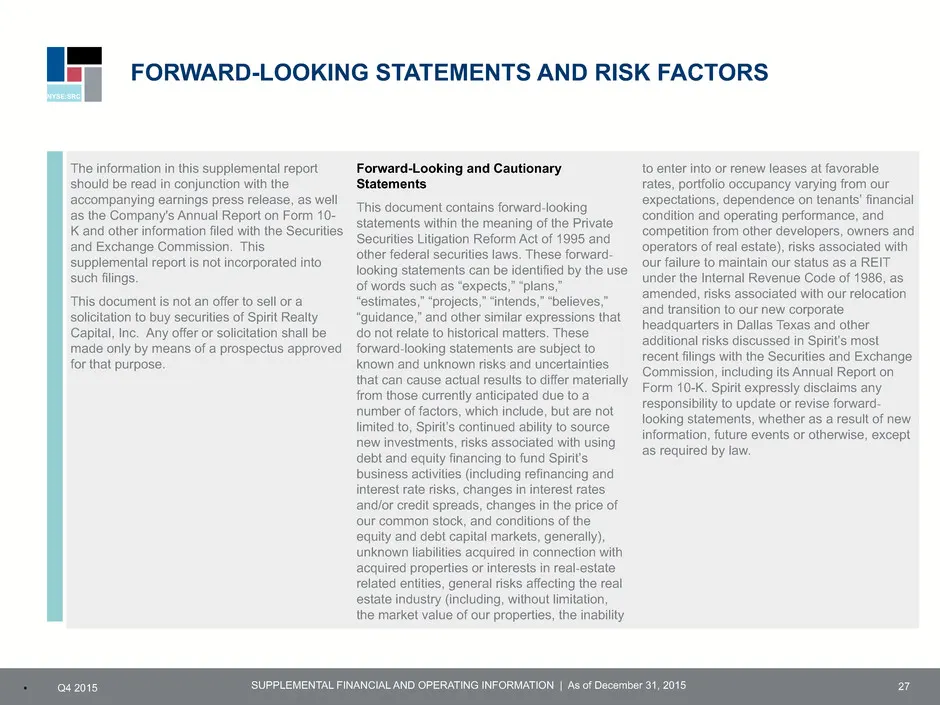
Slide 27: Forward-Looking Statements and Risk Factors
NYSE:SRC SUPPLEMENTAL FINANCIAL AND OPERATING INFORMATION | As of December 31, 2015▪ Q4 2015 FORWARD-LOOKING STATEMENTS AND RISK FACTORS 27 The information in this supplemental report should be read in conjunction with the accompanying earnings press release, as well as the Company's Annual Report o
Source: SEC EDGAR · 8-K filed Feb 25, 2016
More decks from Spirit Realty Capital Inc
 Q3 2023 Earnings Presentation28 slides · Nov 2, 2023
 Merger or Acquisition (October 2023)20 slides · Oct 30, 2023
 Q2 2023 Earnings Presentation26 slides · Aug 7, 2023
 Q2 2023 Earnings Presentation26 slides · August 2023
 Q1 2023 Earnings Presentation27 slides · May 3, 2023
 Q4 2022 Earnings Presentation31 slides · Feb 28, 2023