NN Group N.V. · EURONEXT:NN
NN — H2 2020 Earnings Presentation
24 slides from NN's earnings presentation, Feb 18, 2021

Slide 1: NN Group 2H20 results
NN Group 2H20 results 18 February 2021

Slide 2: 2H20 highlights
2H20 highlights David Knibbe, CEO
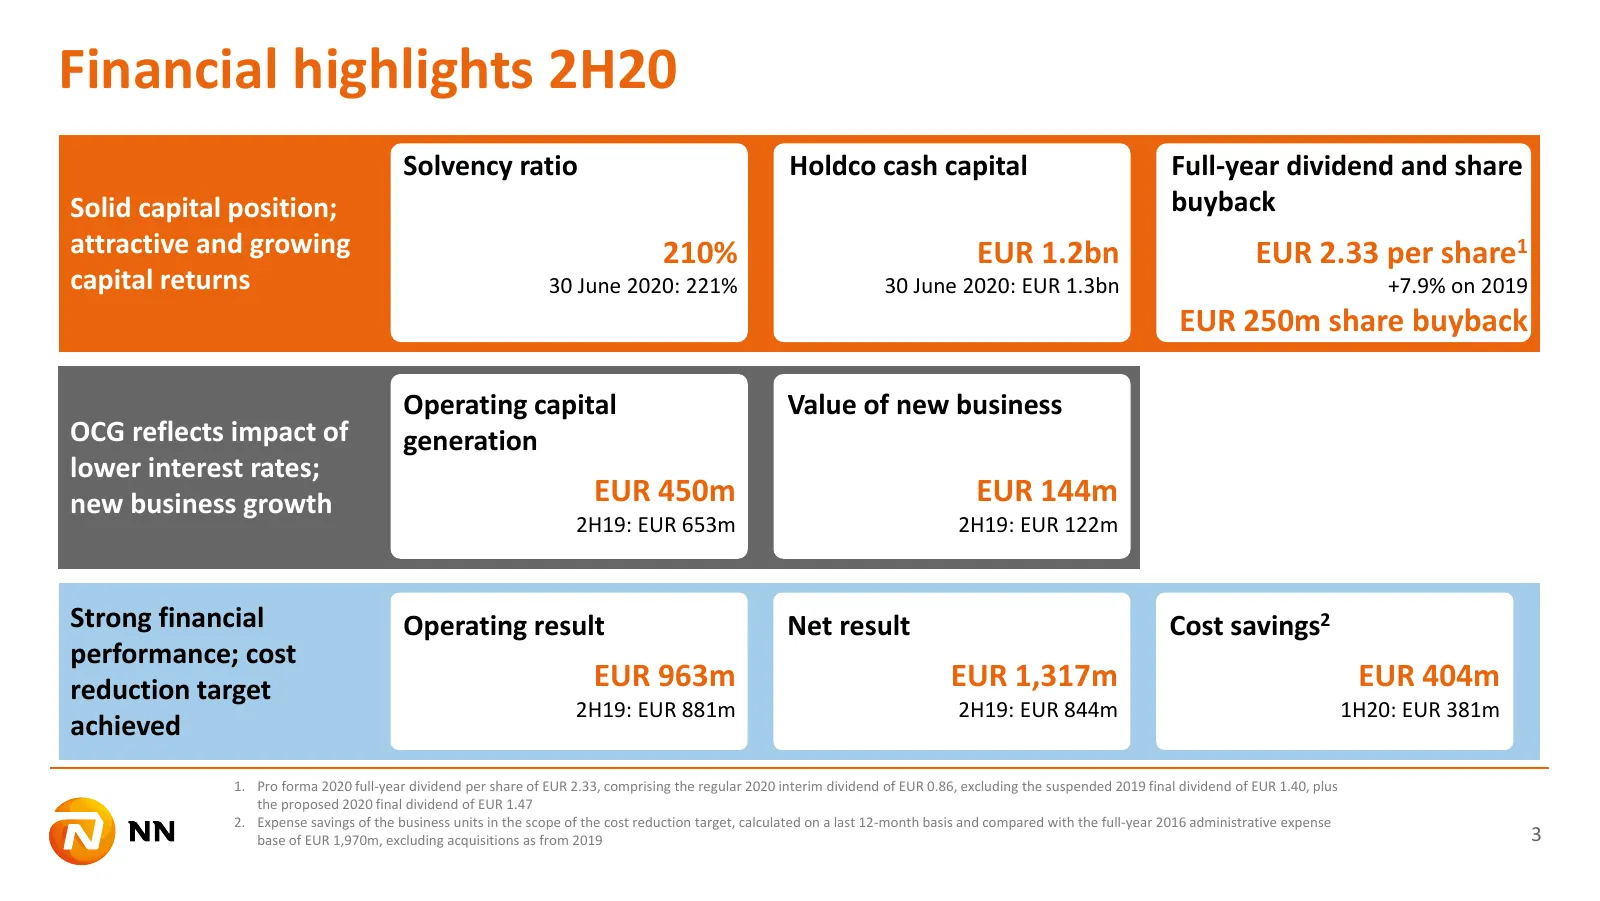
Slide 3: Financial highlights 2H20
Financial highlights 2H20 Solvency ratio Holdco cash capital Full-year dividend and share Solid capital position; buyback attractive and growing 210% EUR 1.2bn EUR 2.33 per share1 capital returns 30 June 2020: 221% 30 June 2020: EUR 1.3bn +7.9% on 2019 EUR 250m share buyback Operating capital Value
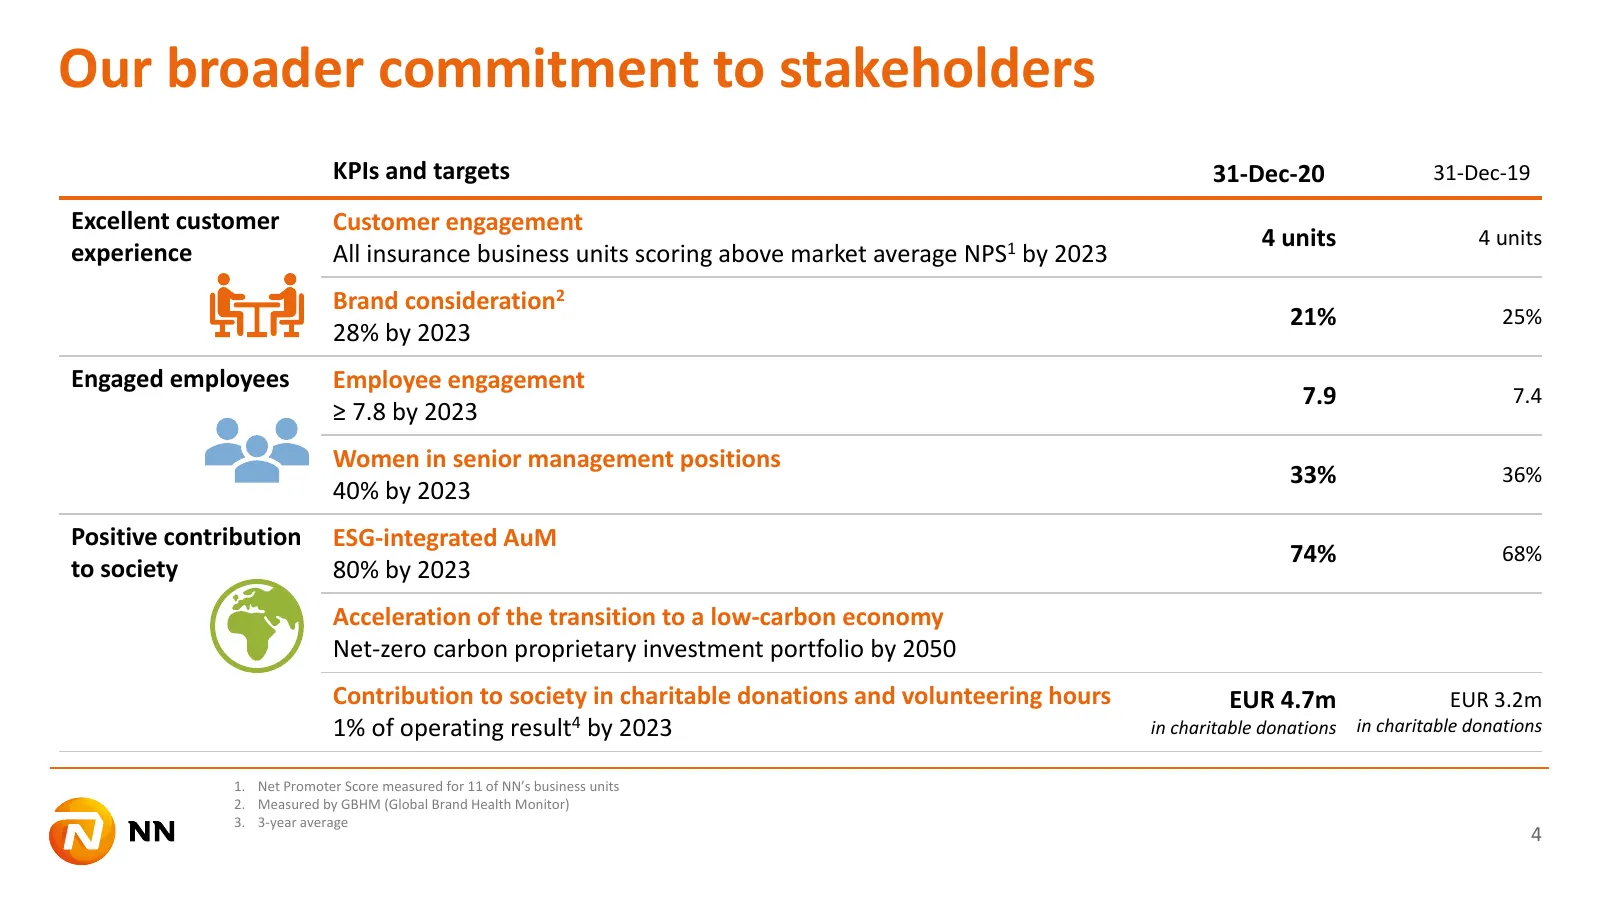
Slide 4: Our broader commitment to stakeholders
Our broader commitment to stakeholders KPIs and targets 31-Dec-20 31-Dec-19 Excellent customer Customer engagement 4 units 4 units experience All insurance business units scoring above market average NPS1 by 2023 Brand consideration2 21% 25% 28% by 2023 Engaged employees Employee engagement 7.9 7.4
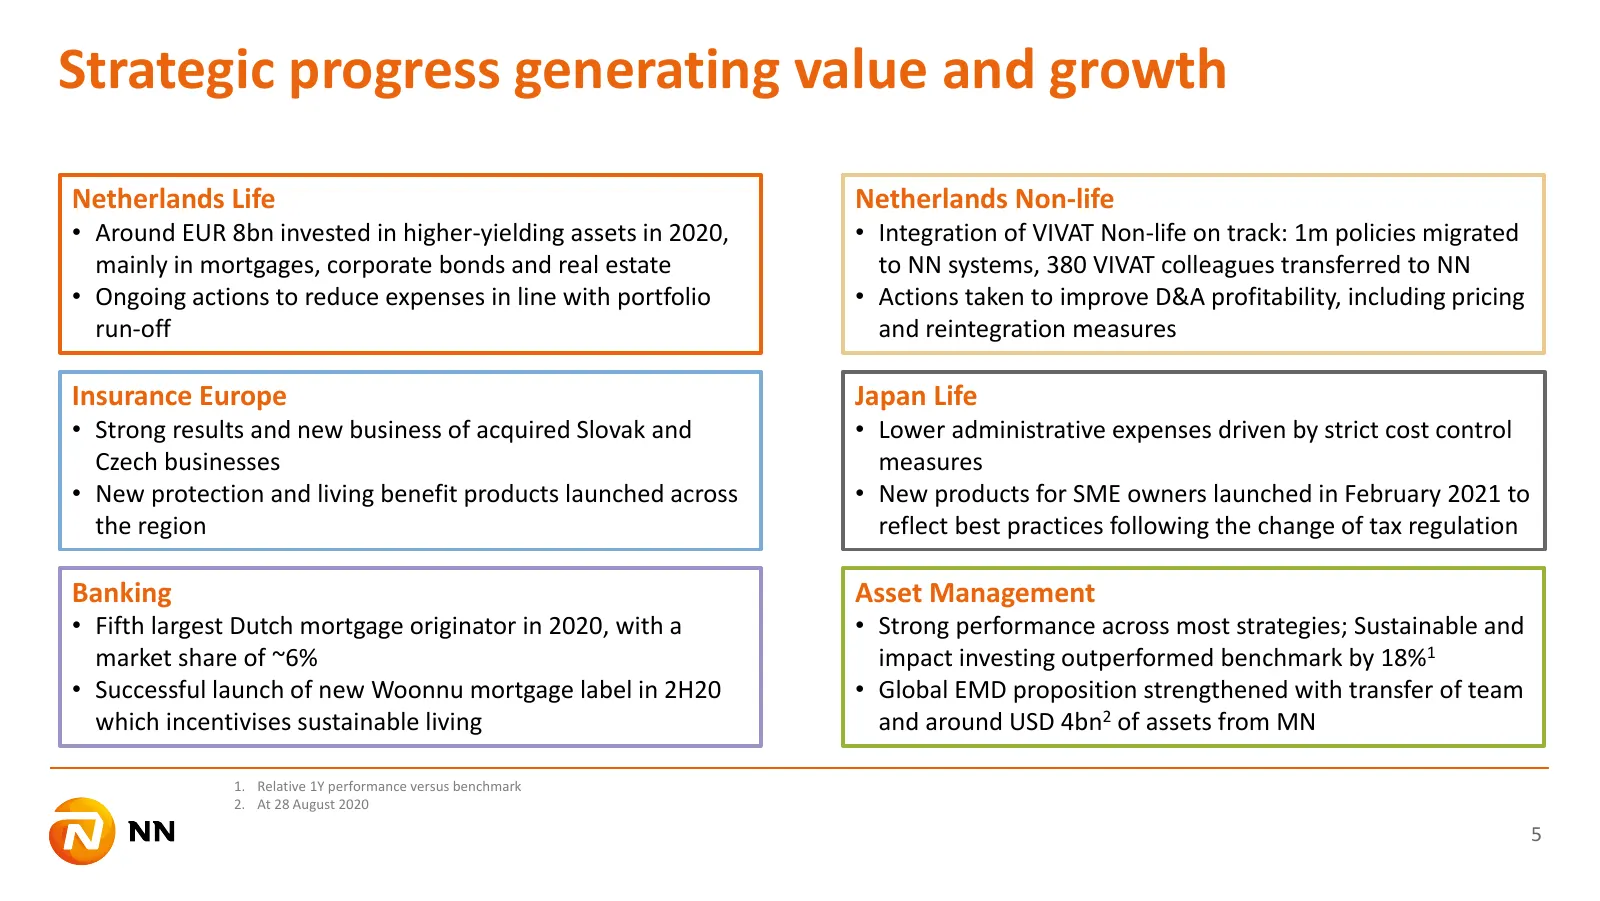
Slide 5: Strategic progress generating value and growth
Strategic progress generating value and growth Netherlands Life Netherlands Non-life • Around EUR 8bn invested in higher-yielding assets in 2020, • Integration of VIVAT Non-life on track: 1m policies migrated mainly in mortgages, corporate bonds and real estate to NN systems, 380 VIVAT colleagues tr
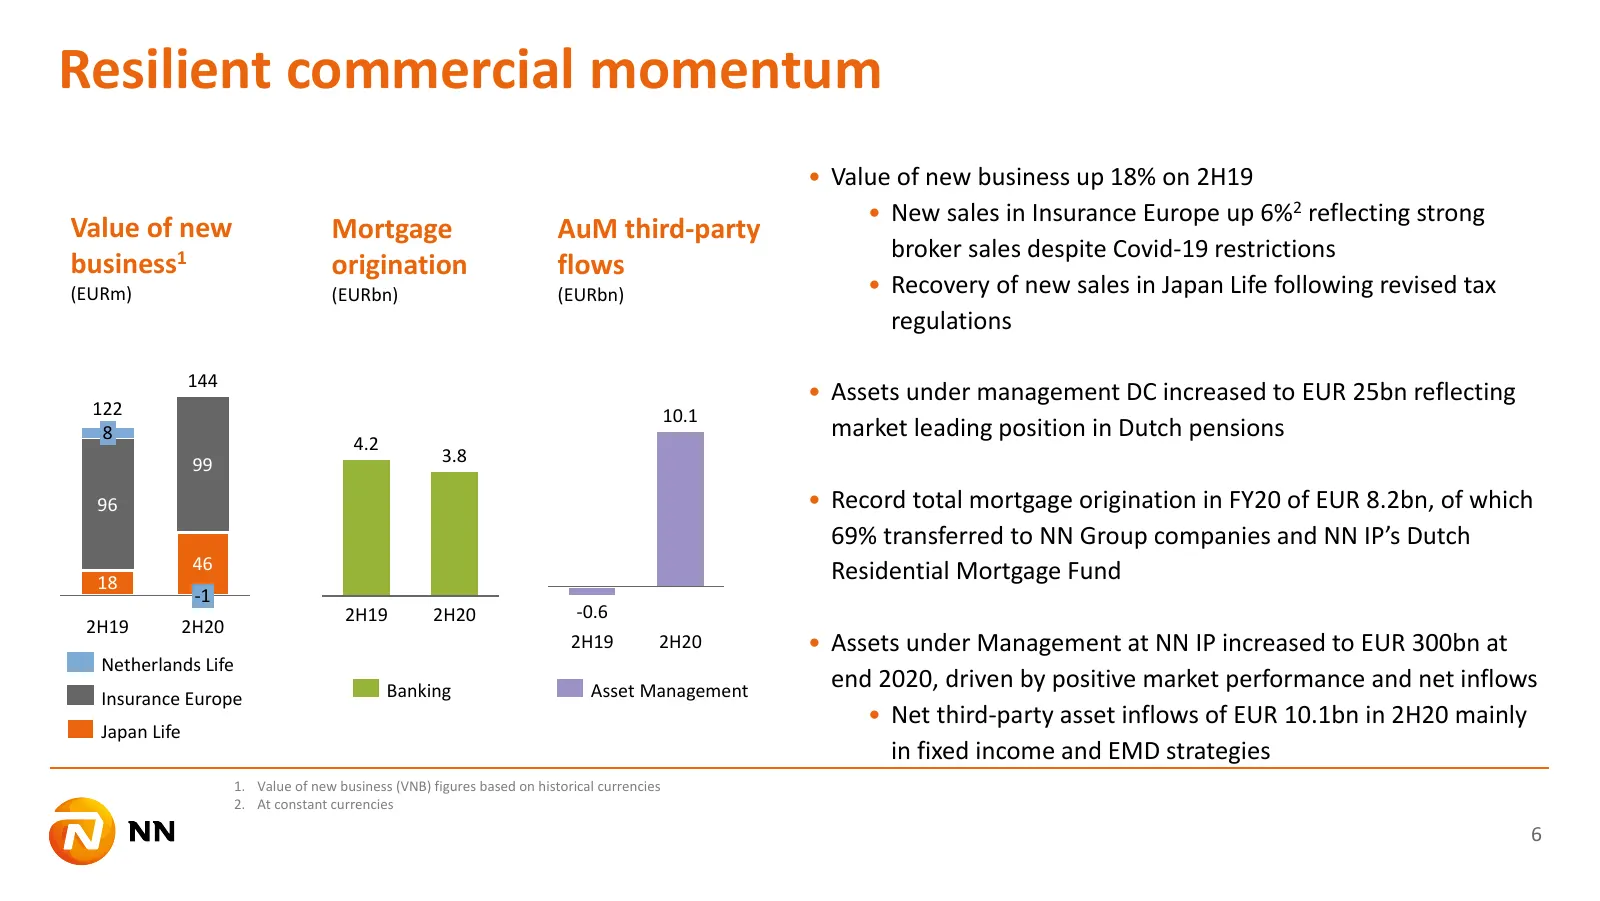
Slide 6: Resilient commercial momentum
Resilient commercial momentum • Value of new business up 18% on 2H19 • New sales in Insurance Europe up 6%2 reflecting strong Value of new Mortgage AuM third-party broker sales despite Covid-19 restrictions business1 origination flows (EURm) (EURbn) (EURbn) • Recovery of new sales in Japan Life foll
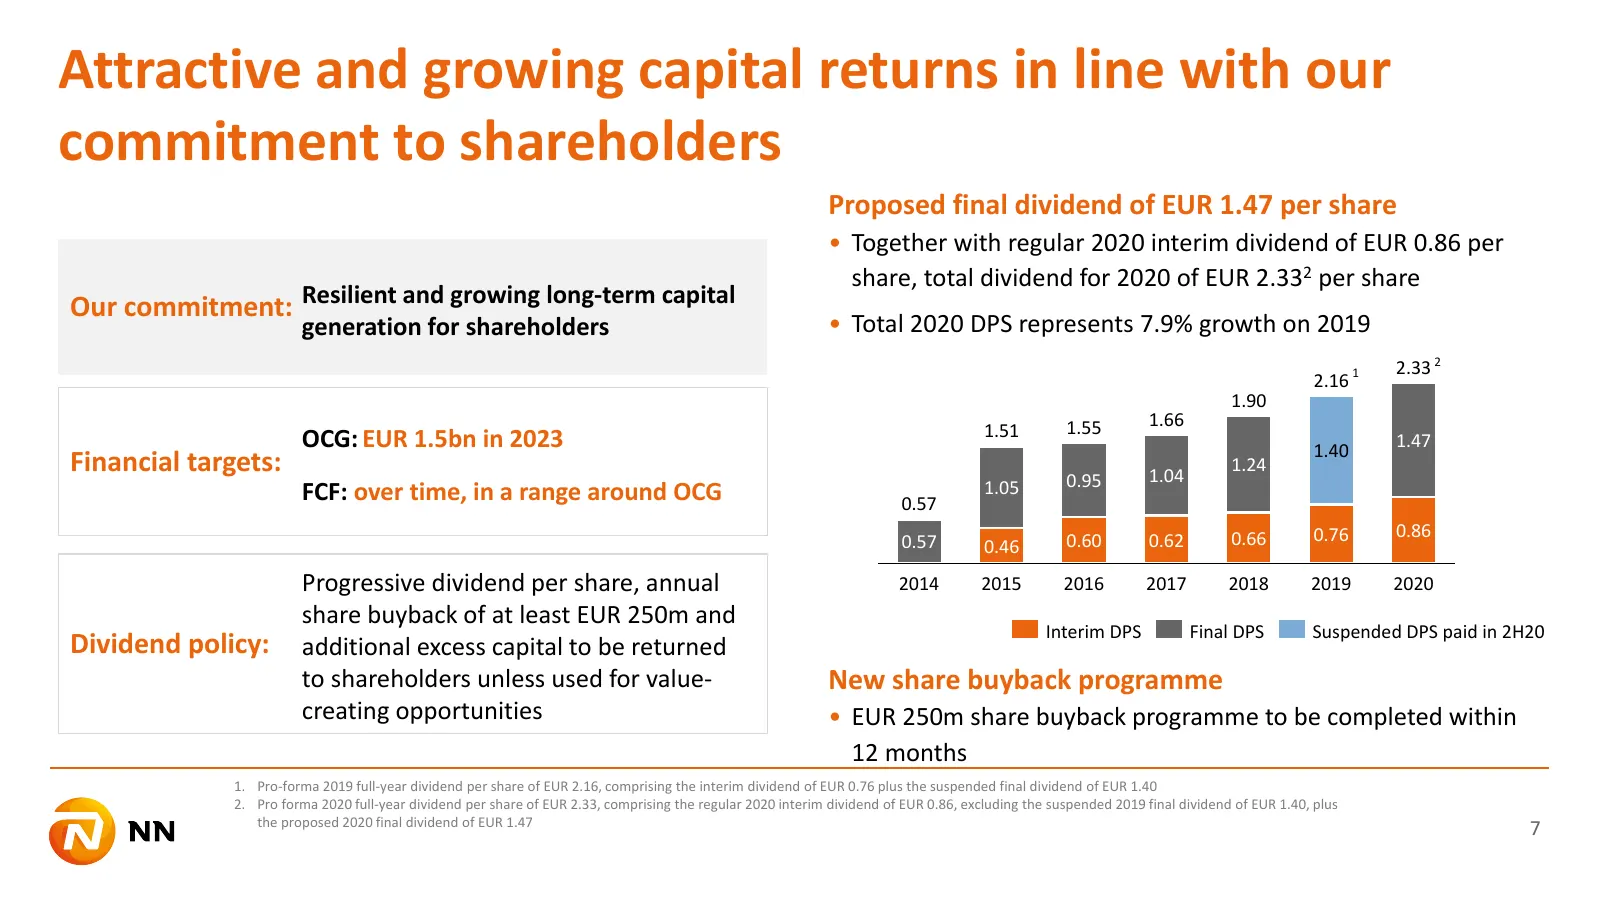
Slide 7: Attractive and growing capital returns in line with our commitment to shareholders
Attractive and growing capital returns in line with our commitment to shareholders Proposed final dividend of EUR 1.47 per share • Together with regular 2020 interim dividend of EUR 0.86 per share, total dividend for 2020 of EUR 2.332 per share Our commitment: Resilient and growing long-term capital
Slide 8: 2H20 results
2H20 results Delfin Rueda, CFO
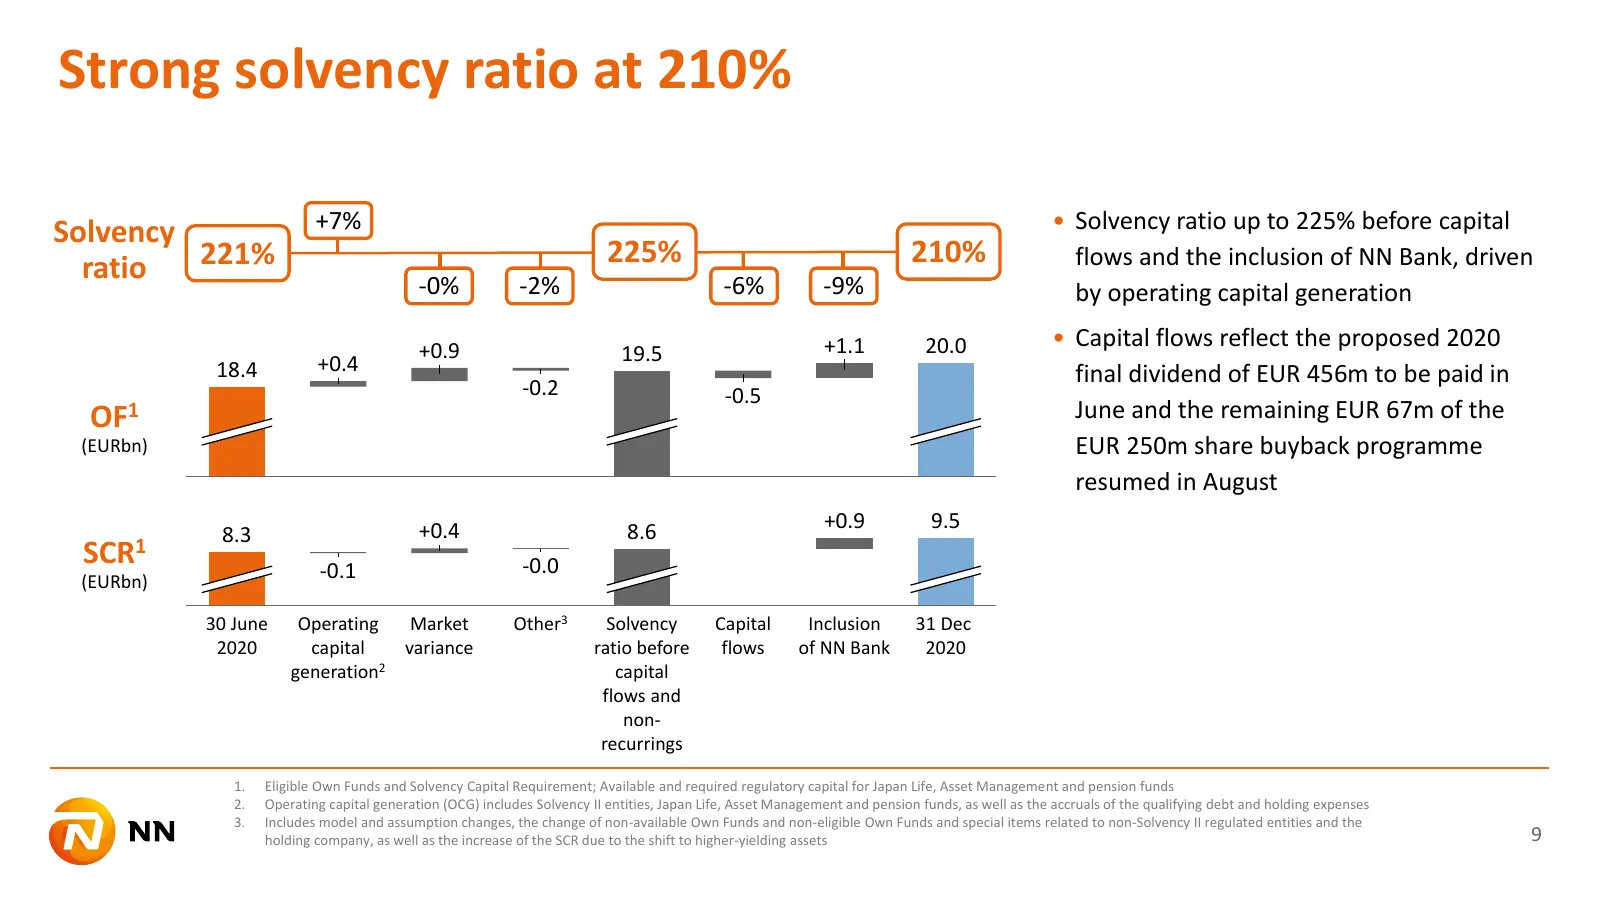
Slide 9: Strong solvency ratio at 210%
Strong solvency ratio at 210% +7% • Solvency ratio up to 225% before capital Solvency ratio 221% 225% 210% flows and the inclusion of NN Bank, driven -0% -2% -6% -9% by operating capital generation +0.9 +1.1 20.0 • Capital flows reflect the proposed 2020 +0.4 19.5 18.4 final dividend of EUR 456m to
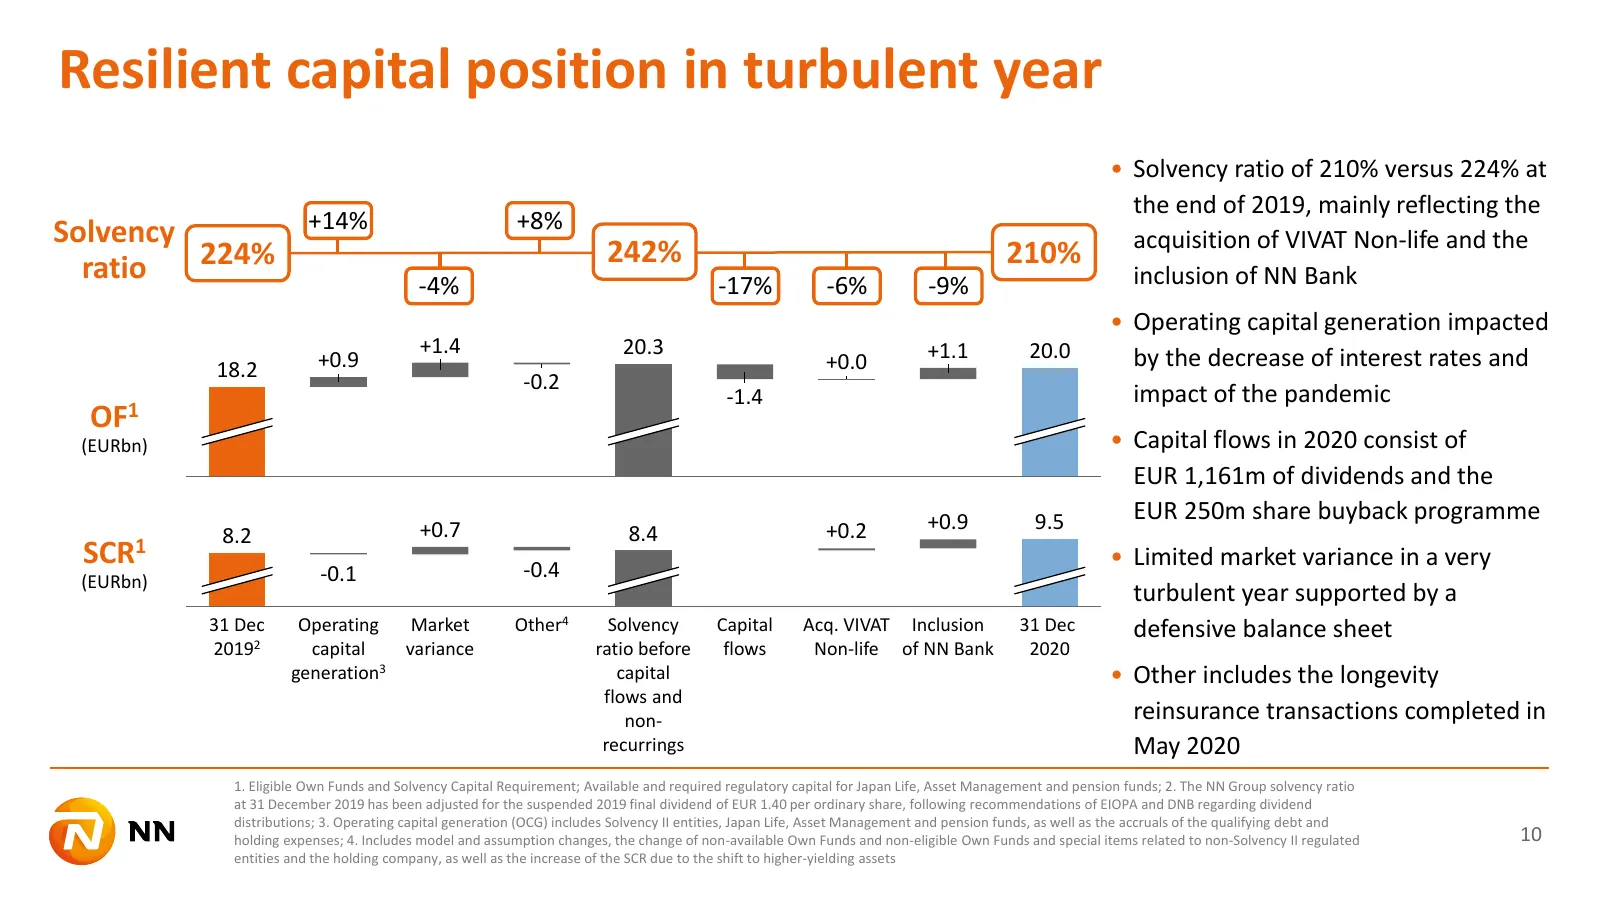
Slide 10: Resilient capital position in turbulent year
Resilient capital position in turbulent year • Solvency ratio of 210% versus 224% at the end of 2019, mainly reflecting the Solvency +14% +8% acquisition of VIVAT Non-life and the ratio 224% 242% 210% -4% -17% -6% -9% inclusion of NN Bank • Operating capital generation impacted +1.4 20.3 +1.1 20.0 1
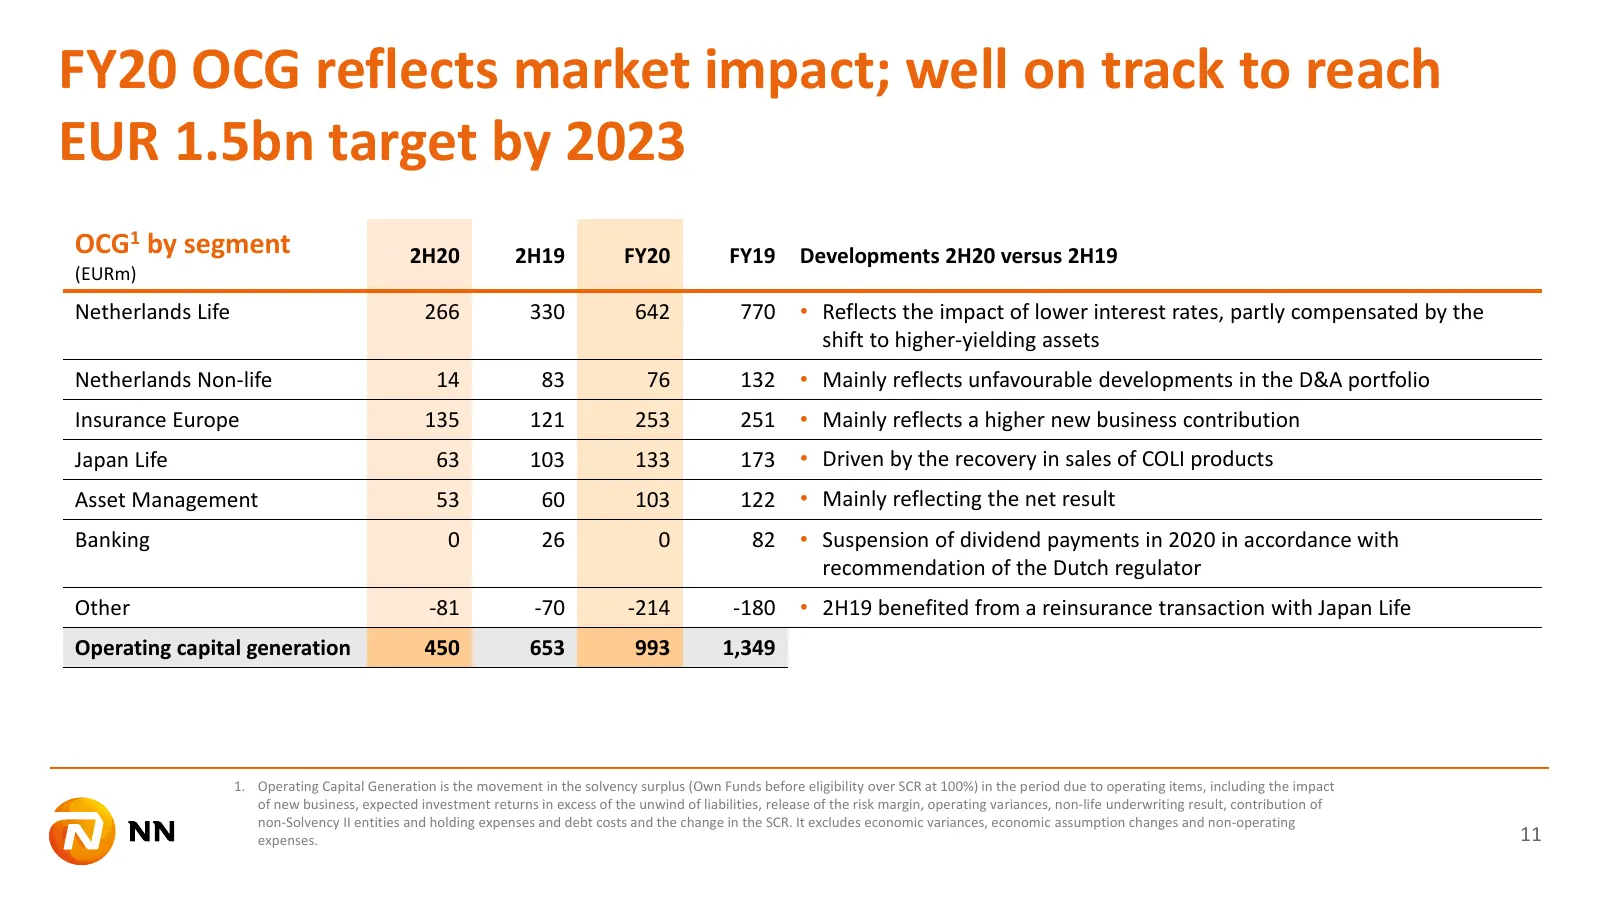
Slide 11: FY20 OCG reflects market impact; well on track to reach EUR 1.5bn target by 2023
FY20 OCG reflects market impact; well on track to reach EUR 1.5bn target by 2023 OCG1 by segment 2H20 2H19 FY20 FY19 Developments 2H20 versus 2H19 (EURm) Netherlands Life 266 330 642 770 • Reflects the impact of lower interest rates, partly compensated by the shift to higher-yielding assets Netherla
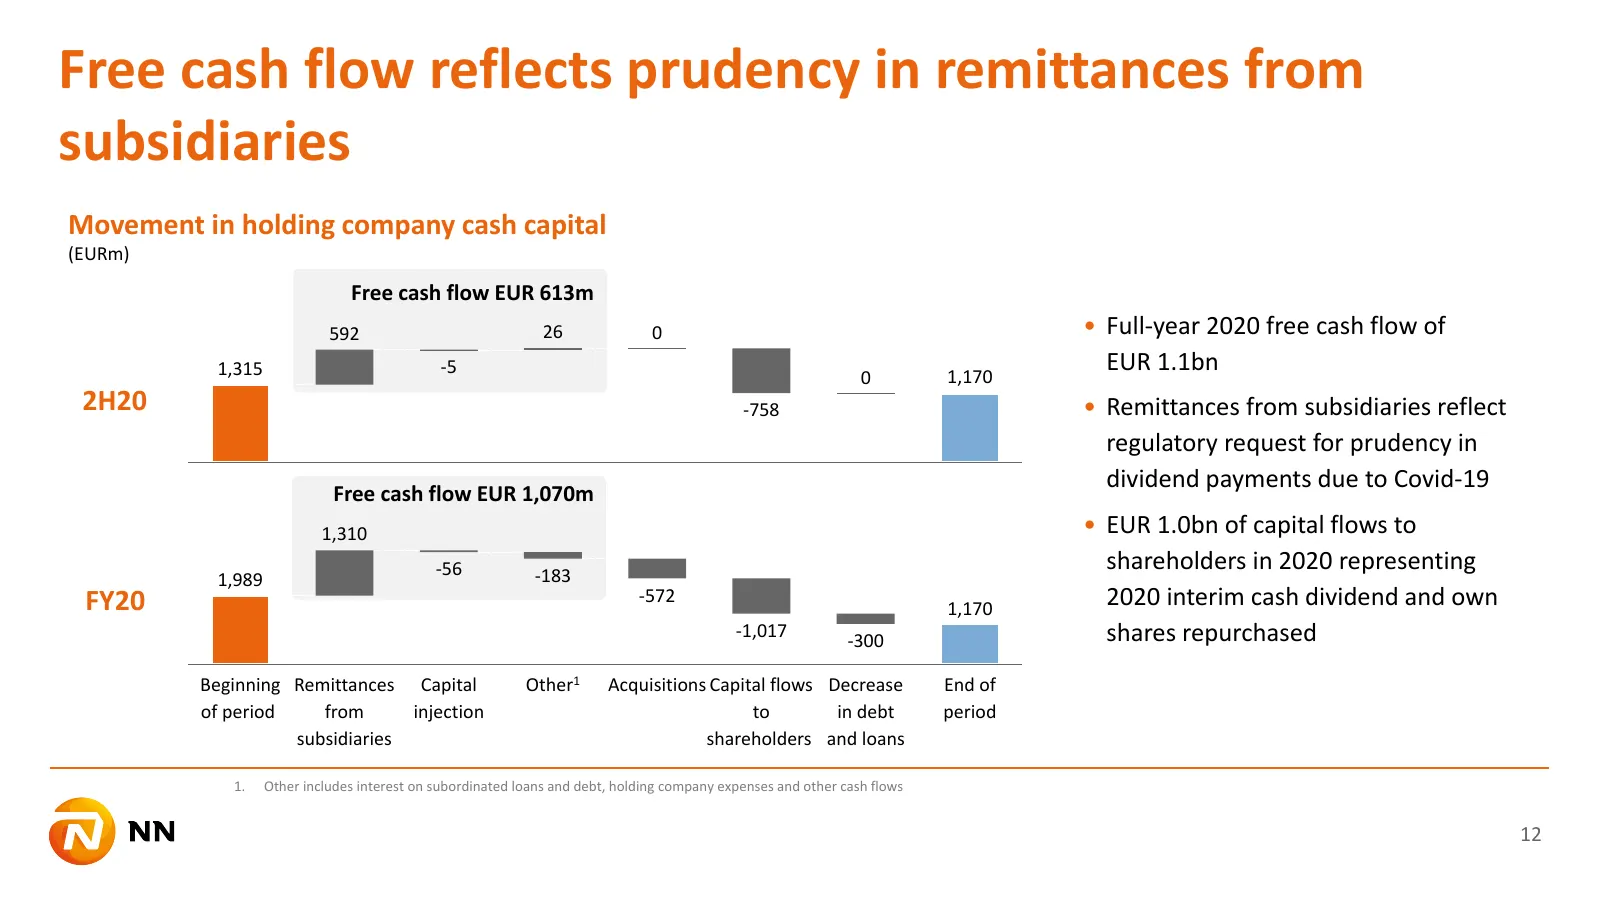
Slide 12: Free cash flow reflects prudency in remittances from subsidiaries
Free cash flow reflects prudency in remittances from subsidiaries Movement in holding company cash capital (EURm) Free cash flow EUR 613m 592 26 0 • Full-year 2020 free cash flow of 1,315 -5 EUR 1.1bn 0 1,170 2H20 -758 • Remittances from subsidiaries reflect regulatory request for prudency in divide
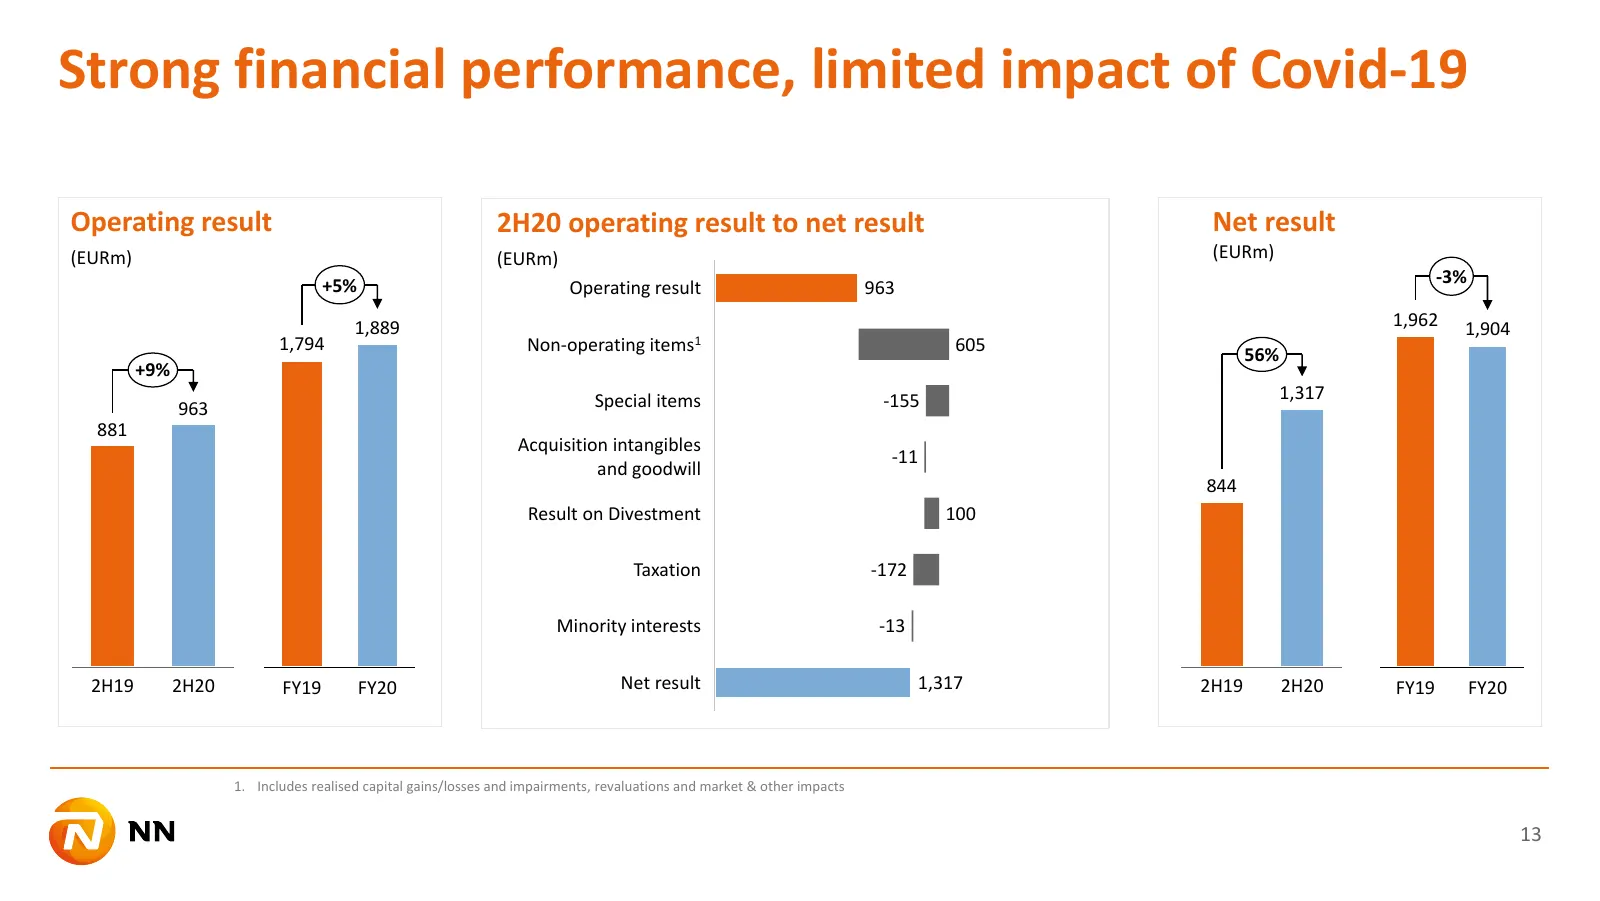
Slide 13: Strong financial performance, limited impact of Covid-19
Strong financial performance, limited impact of Covid-19 Operating result 2H20 operating result to net result Net result (EURm) (EURm) (EURm) +5% -3% Operating result 963 1,889 1,962 1,904 1,794 Non-operating items1 605 56% +9% Special items -155 1,317 963 881 Acquisition intangibles -11 and goodwil
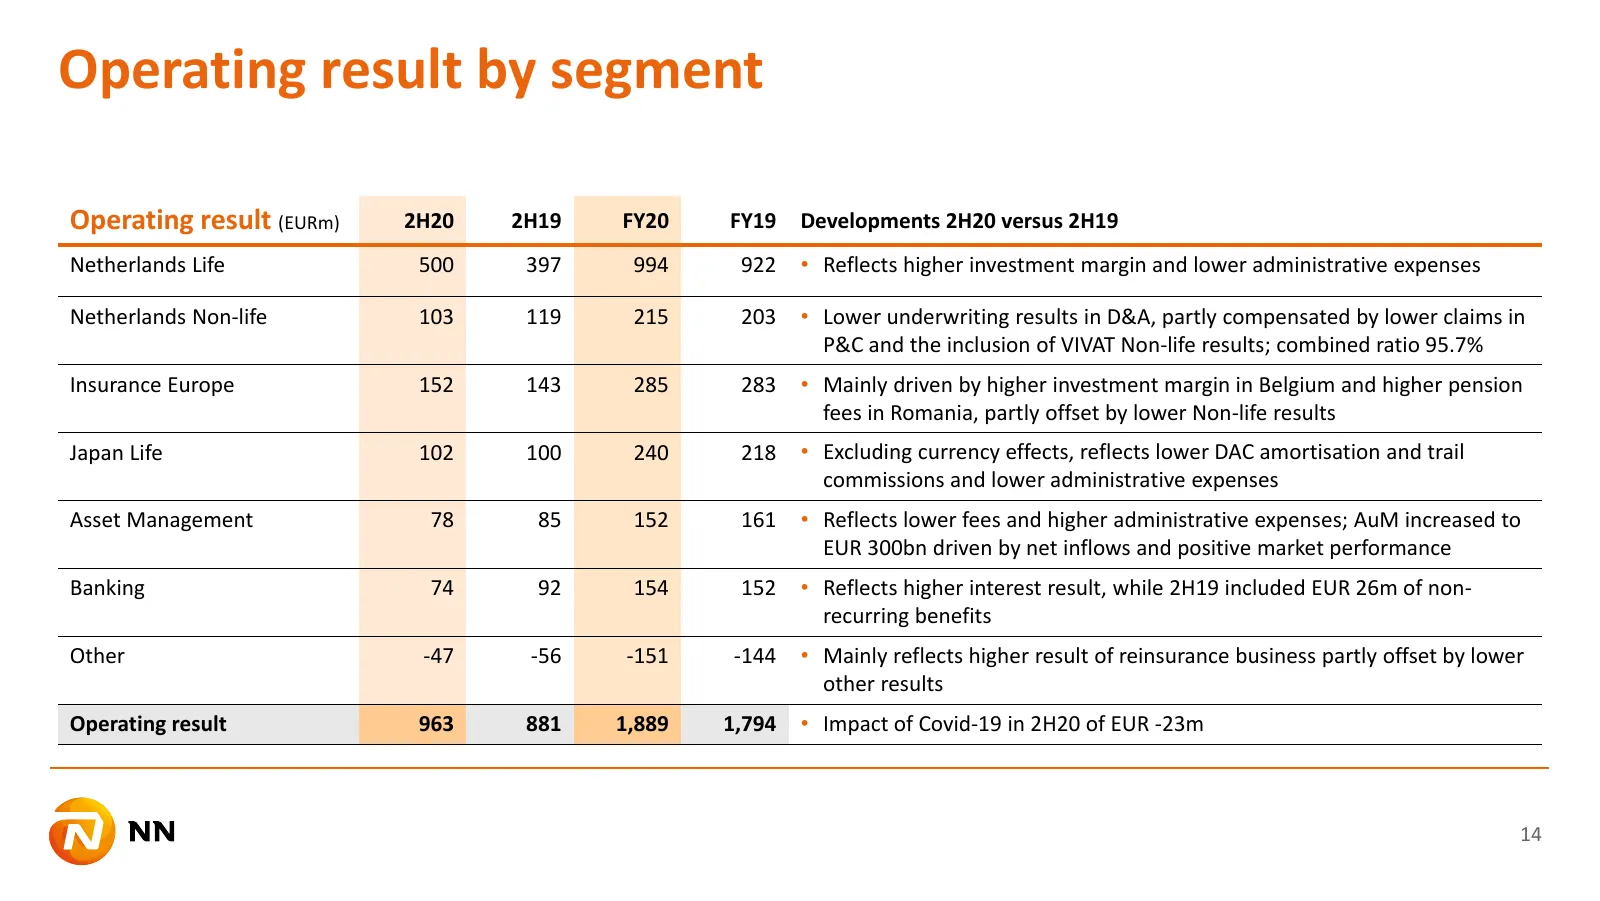
Slide 14: Operating result by segment
Operating result by segment Operating result (EURm) 2H20 2H19 FY20 FY19 Developments 2H20 versus 2H19 Netherlands Life 500 397 994 922 • Reflects higher investment margin and lower administrative expenses Netherlands Non-life 103 119 215 203 • Lower underwriting results in D&A, partly compensated by
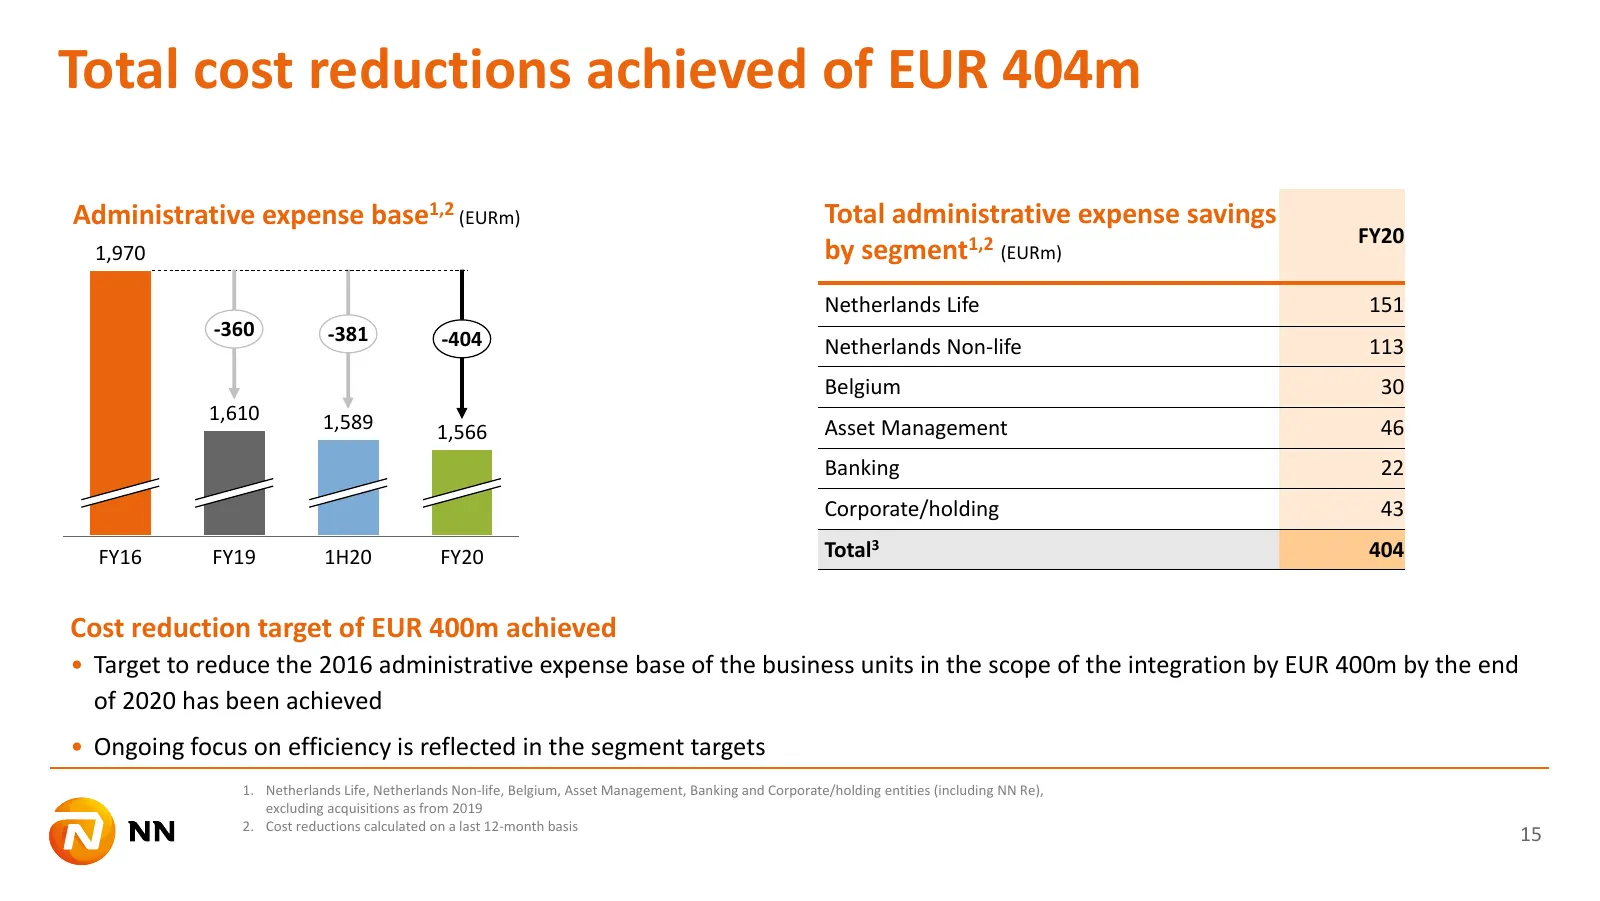
Slide 15: Total cost reductions achieved of EUR 404m
Total cost reductions achieved of EUR 404m Administrative expense base1,2 (EURm) Total administrative expense savings FY20 1,970 by segment1,2 (EURm) Netherlands Life 151 -360 -381 -404 Netherlands Non-life 113 Belgium 30 1,610 1,589 1,566 Asset Management 46 Banking 22 Corporate/holding 43 FY16 FY1

Slide 16: Key takeaways
Key takeaways David Knibbe, CEO
Slide 17: Key takeaways
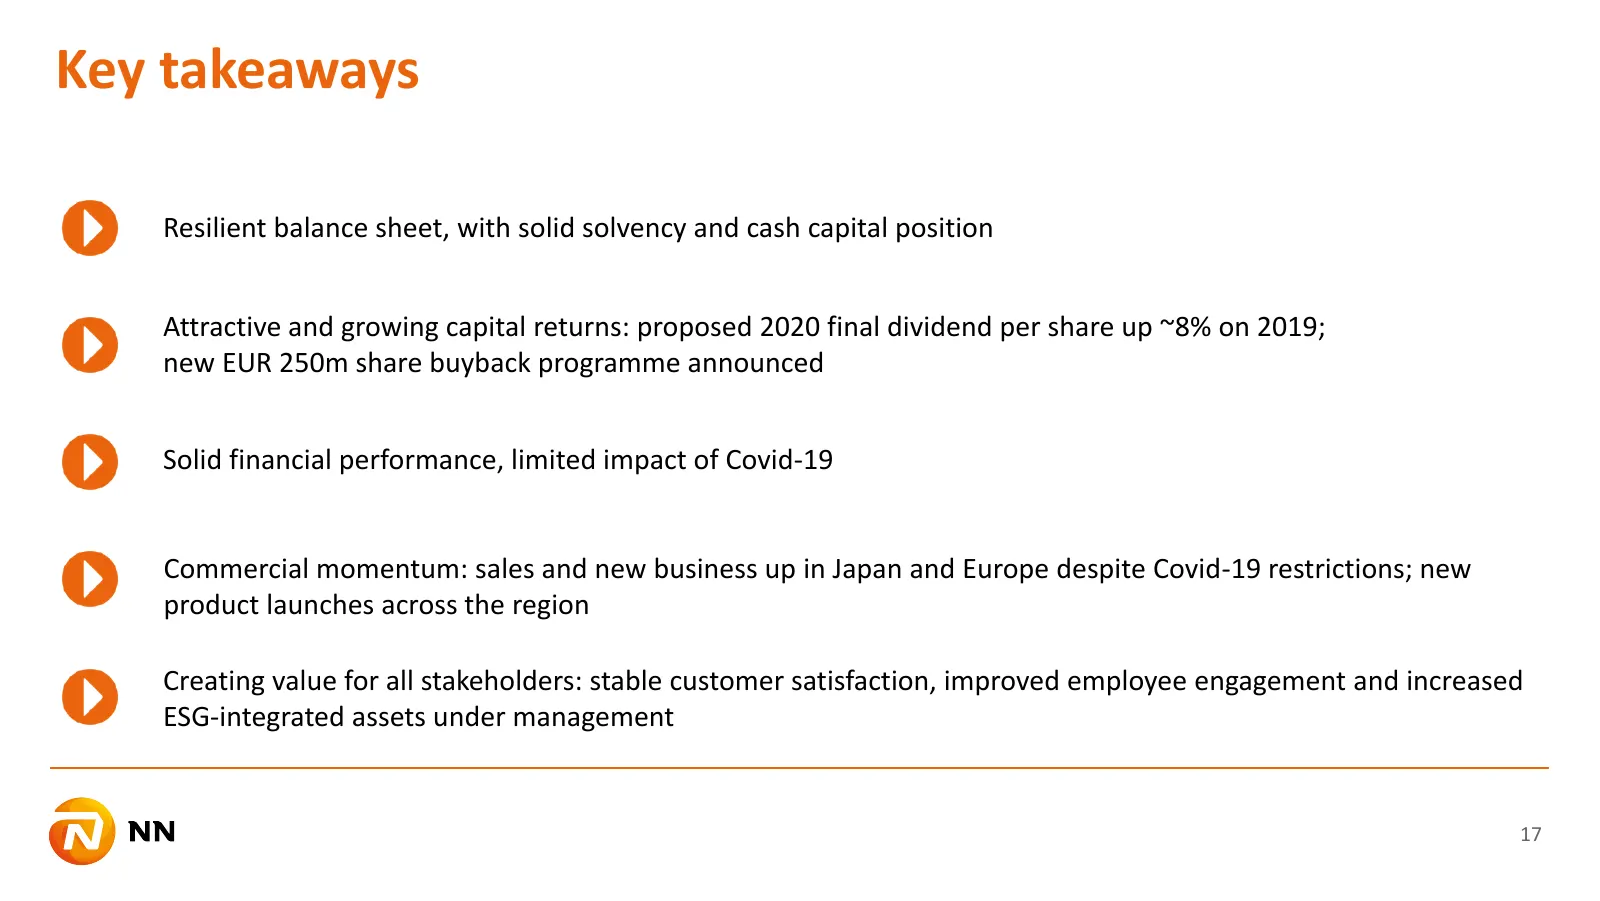
Key takeaways Resilient balance sheet, with solid solvency and cash capital position Attractive and growing capital returns: proposed 2020 final dividend per share up ~8% on 2019; new EUR 250m share buyback programme announced Solid financial performance, limited impact of Covid-19 Commercial moment
Slide 18: Q&A
Q&A David Knibbe, Delfin Rueda, Bernhard Kaufmann

Slide 19: Appendices
Appendices @»s
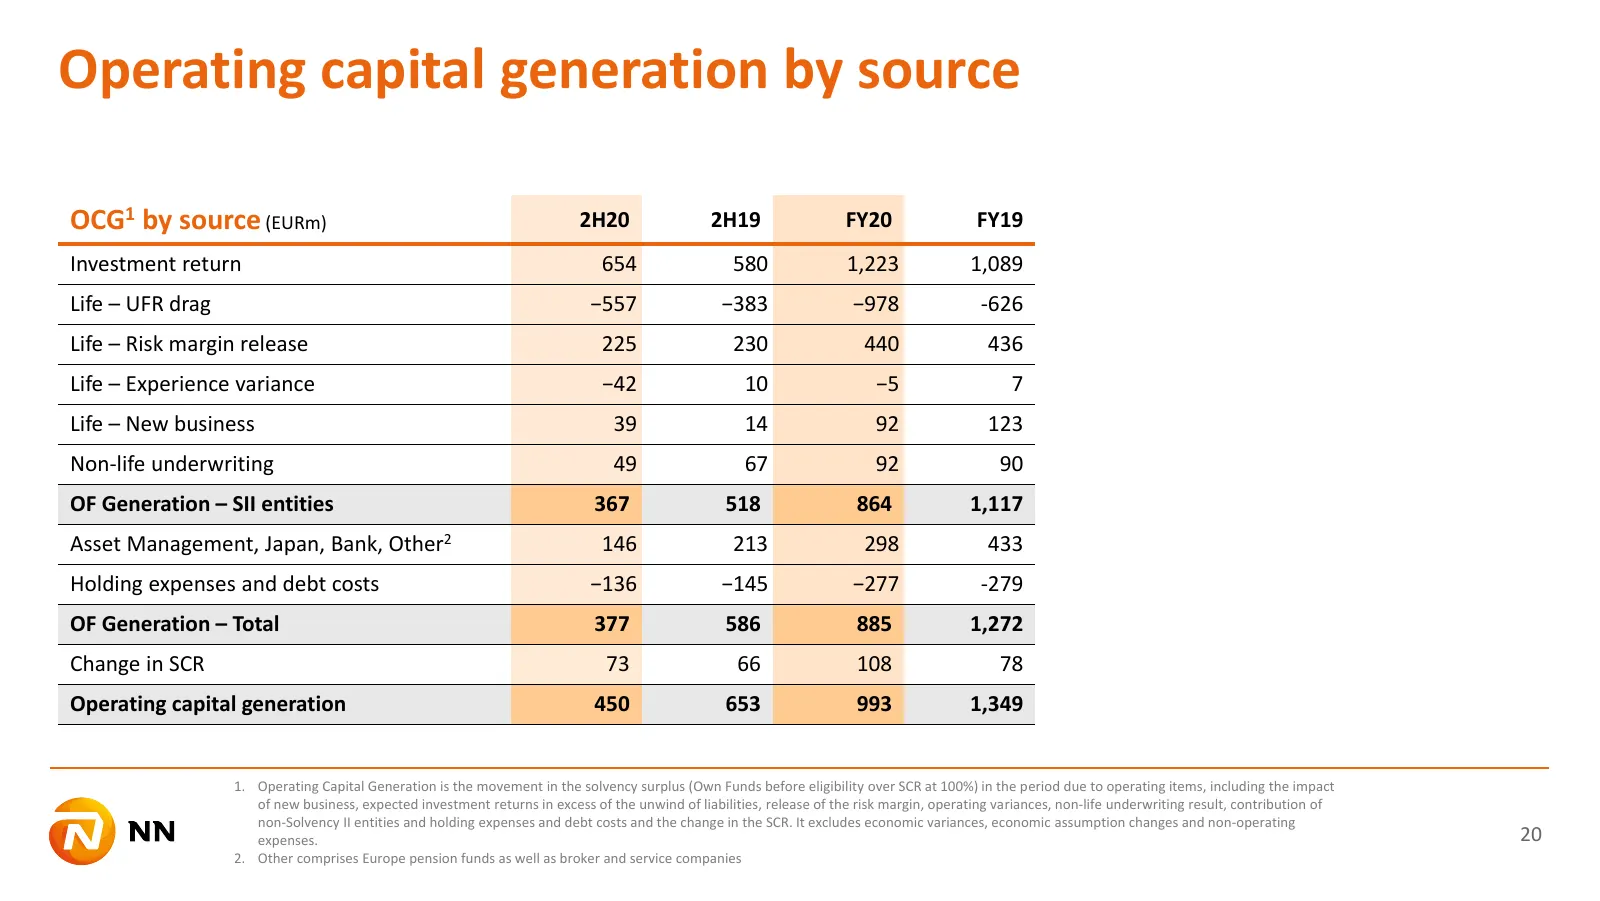
Slide 20: Operating capital generation by source
Operating capital generation by source OCG1 by source (EURm) 2H20 2H19 FY20 FY19 Investment return 654 580 1,223 1,089 Life – UFR drag −557 −383 −978 -626 Life – Risk margin release 225 230 440 436 Life – Experience variance −42 10 −5 7 Life – New business 39 14 92 123 Non-life underwriting 49 67 92
Slide 21: Solvency sensitivities
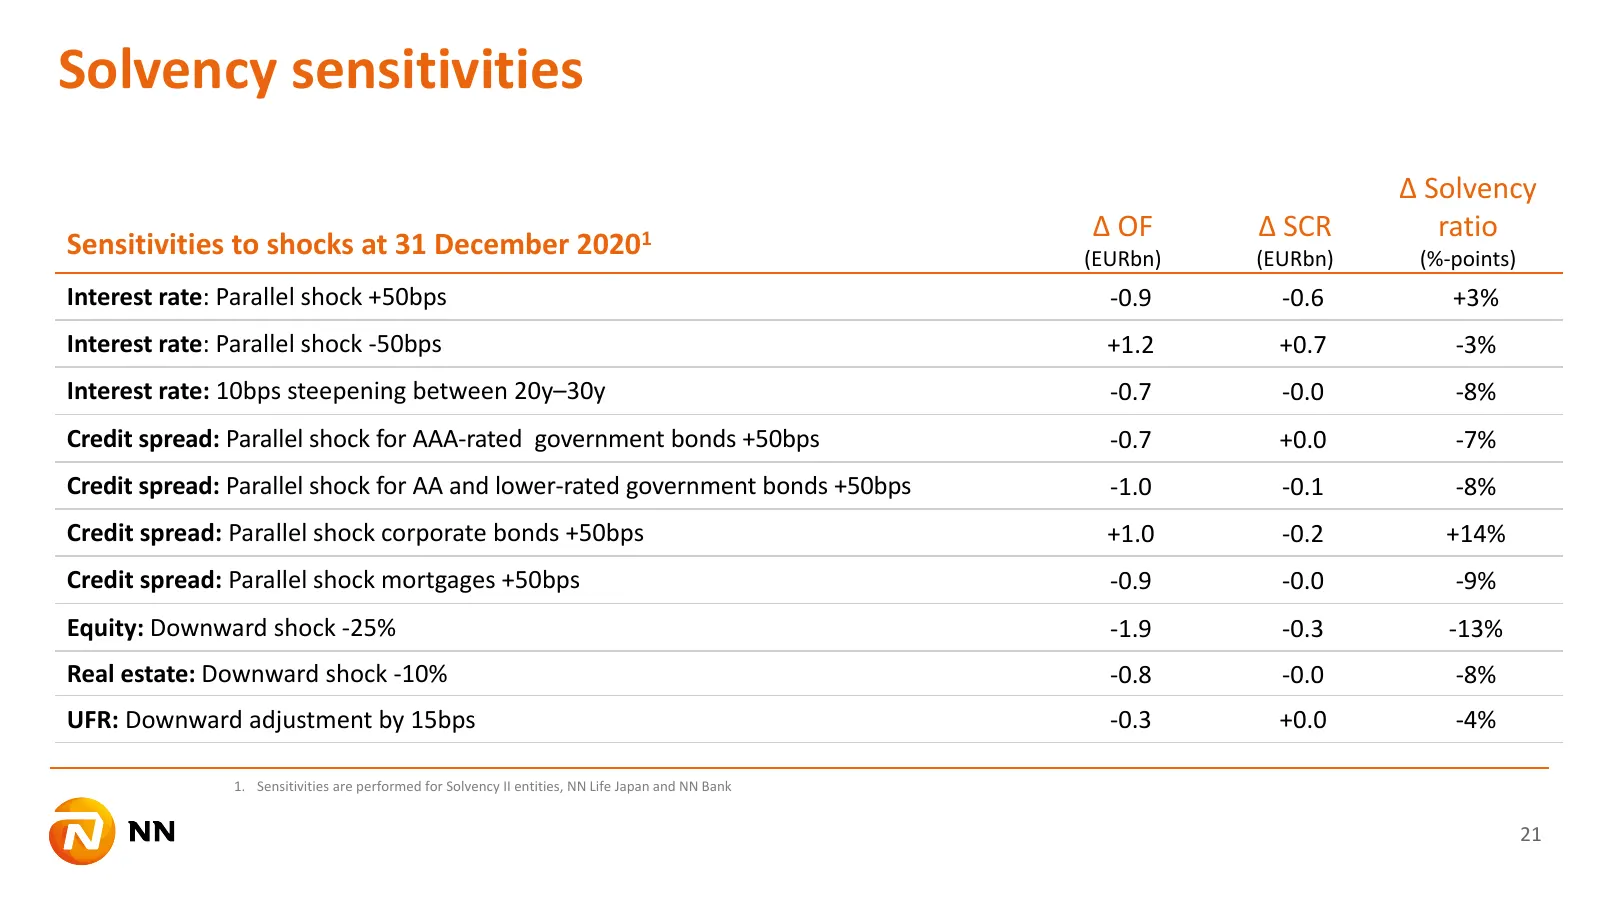
Solvency sensitivities Δ Solvency Δ OF Δ SCR ratio Sensitivities to shocks at 31 December 20201 (EURbn) (EURbn) (%-points) Interest rate: Parallel shock +50bps -0.9 -0.6 +3% Interest rate: Parallel shock -50bps +1.2 +0.7 -3% Interest rate: 10bps steepening between 20y–30y -0.7 -0.0 -8% Credit spread
Slide 22: Remittances from subsidiaries
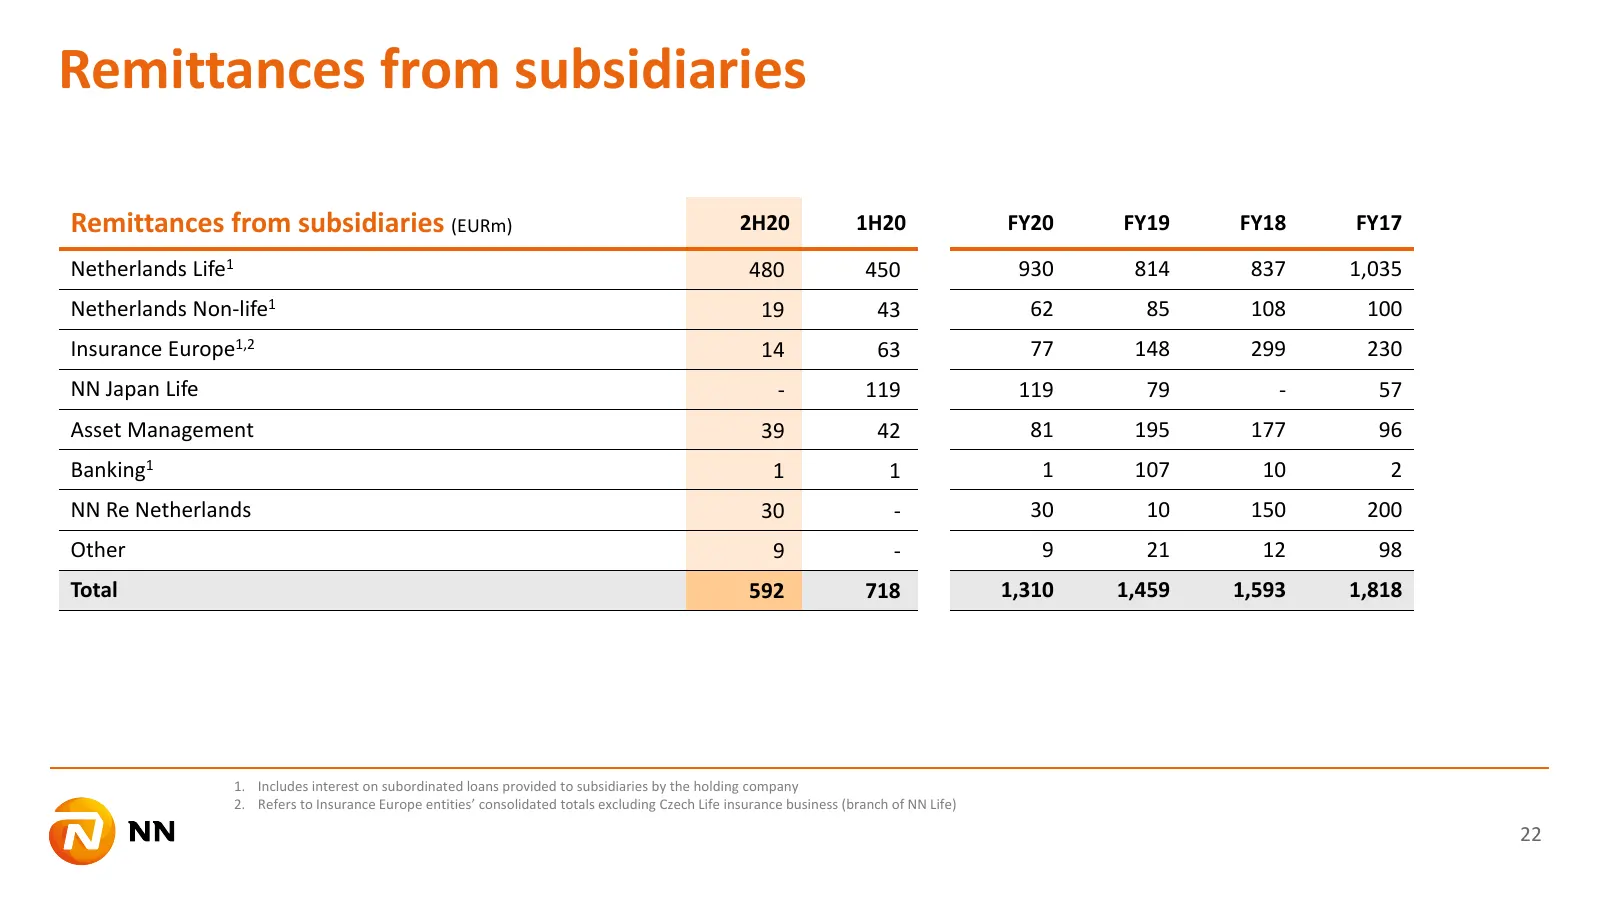
Remittances from subsidiaries Remittances from subsidiaries (EURm) 2H20 1H20 FY20 FY19 FY18 FY17 Netherlands Life1 480 450 930 814 837 1,035 Netherlands Non-life1 19 43 62 85 108 100 Insurance Europe1,2 14 63 77 148 299 230 NN Japan Life - 119 119 79 - 57 Asset Management 39 42 81 195 177 96 Banking
Slide 23: Important legal information
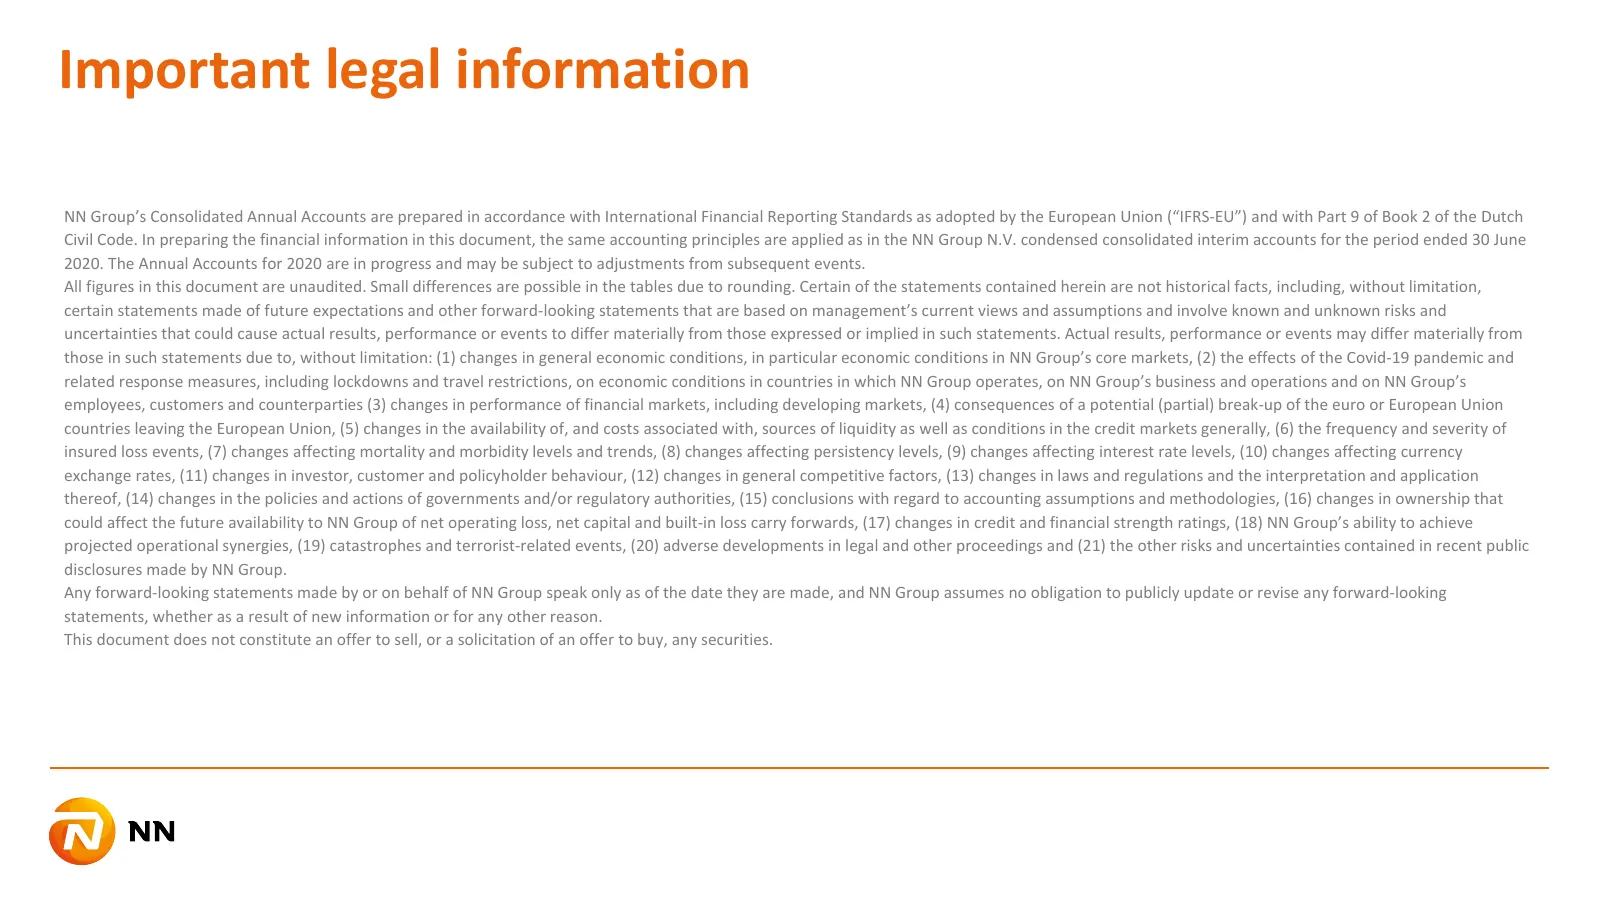
Important legal information NN Group’s Consolidated Annual Accounts are prepared in accordance with International Financial Reporting Standards as adopted by the European Union (“IFRS-EU”) and with Part 9 of Book 2 of the Dutch Civil Code. In preparing the financial information in this document, the

Slide 24
Source: Internet Archive copy of nn-group.com
More decks from NN Group N.V.
 ESG Presentation (August 2026)33 slides · Aug 6, 2026
 1H26 Earnings Presentation31 slides · Aug 6, 2026
 Nationale-Nederlanden Bank — Debt Investor Presentation (April 2026)51 slides · Apr 16, 2026
 ESG Presentation (February 2026)33 slides · Feb 12, 2026
 FY2025 Earnings Presentation37 slides · Feb 12, 2026
 Nationale-Nederlanden Bank — Debt Investor Presentation (September 2025)61 slides · September 2025