Barratt Redrow plc · LSE:BTRW
Barratt Redrow — Barratt Developments — FY2021 Earnings Presentation
46 slides from Barratt Redrow's earnings presentation, Sep 2, 2021
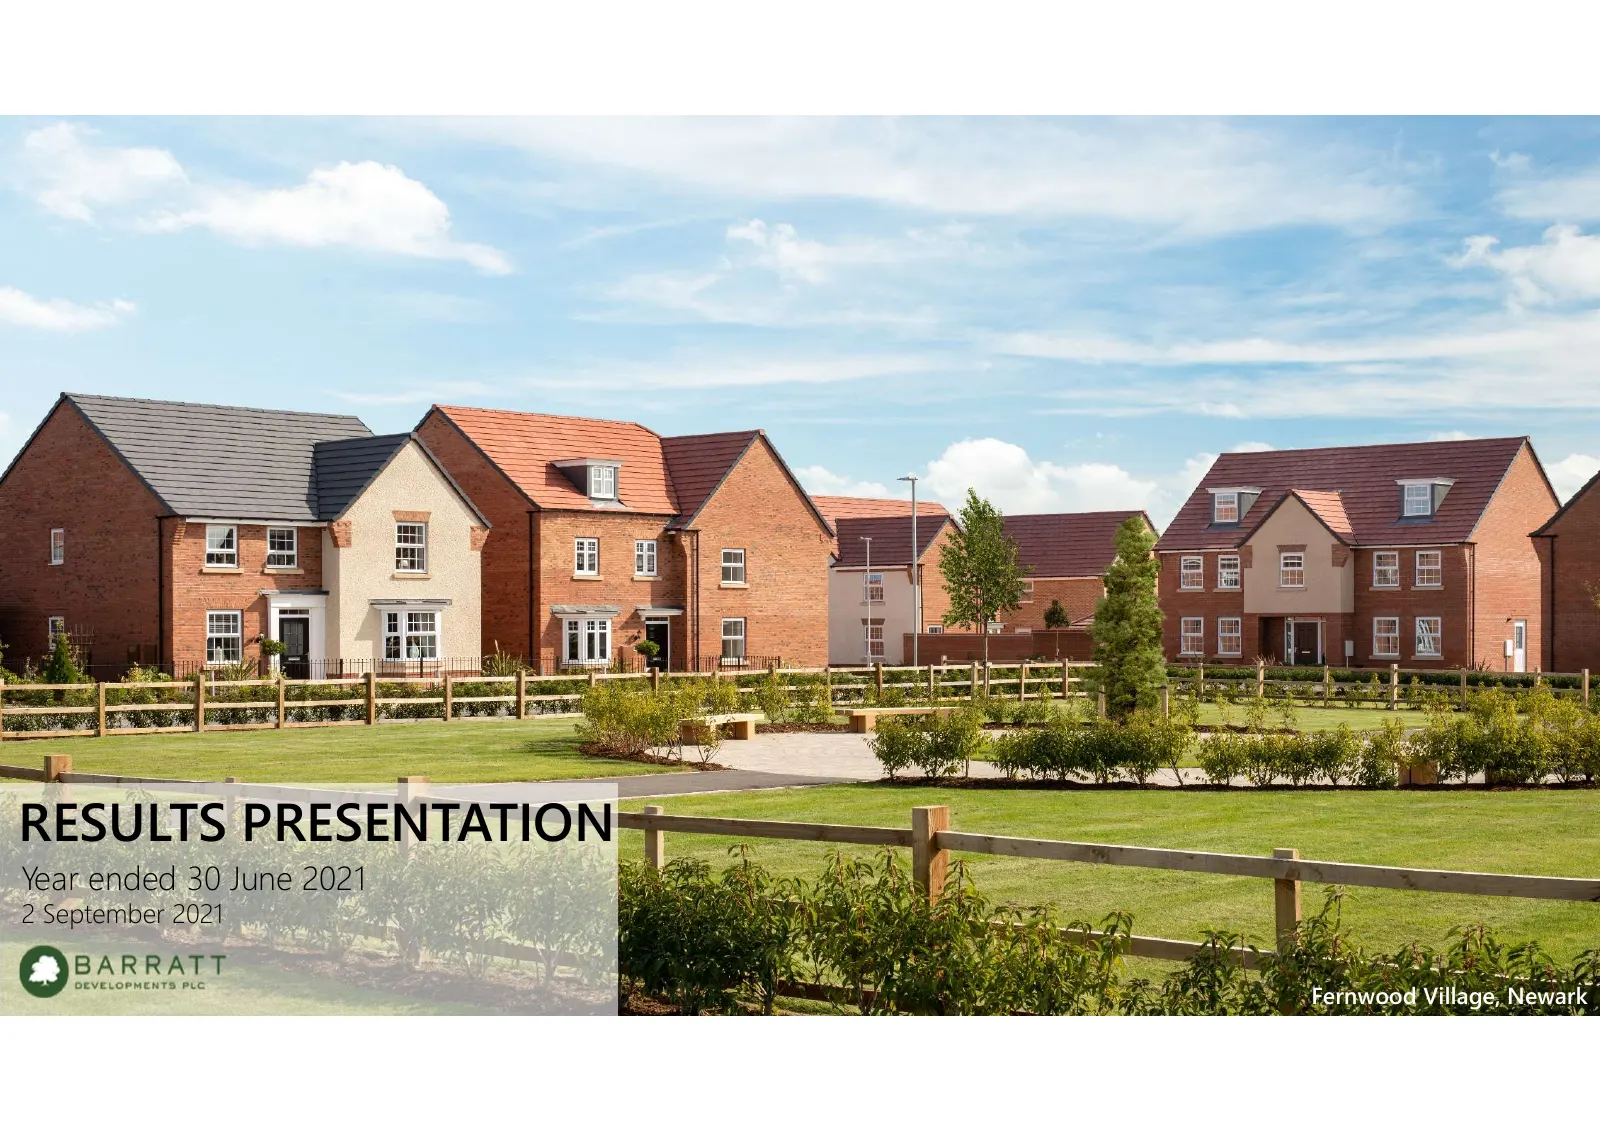
Slide 1: Results Presentation – Year ended 30 June 2021
RESULTS PRESENTATION Year ended 30 June 2021 2 September 2021 1 Fernwood Village, Newark
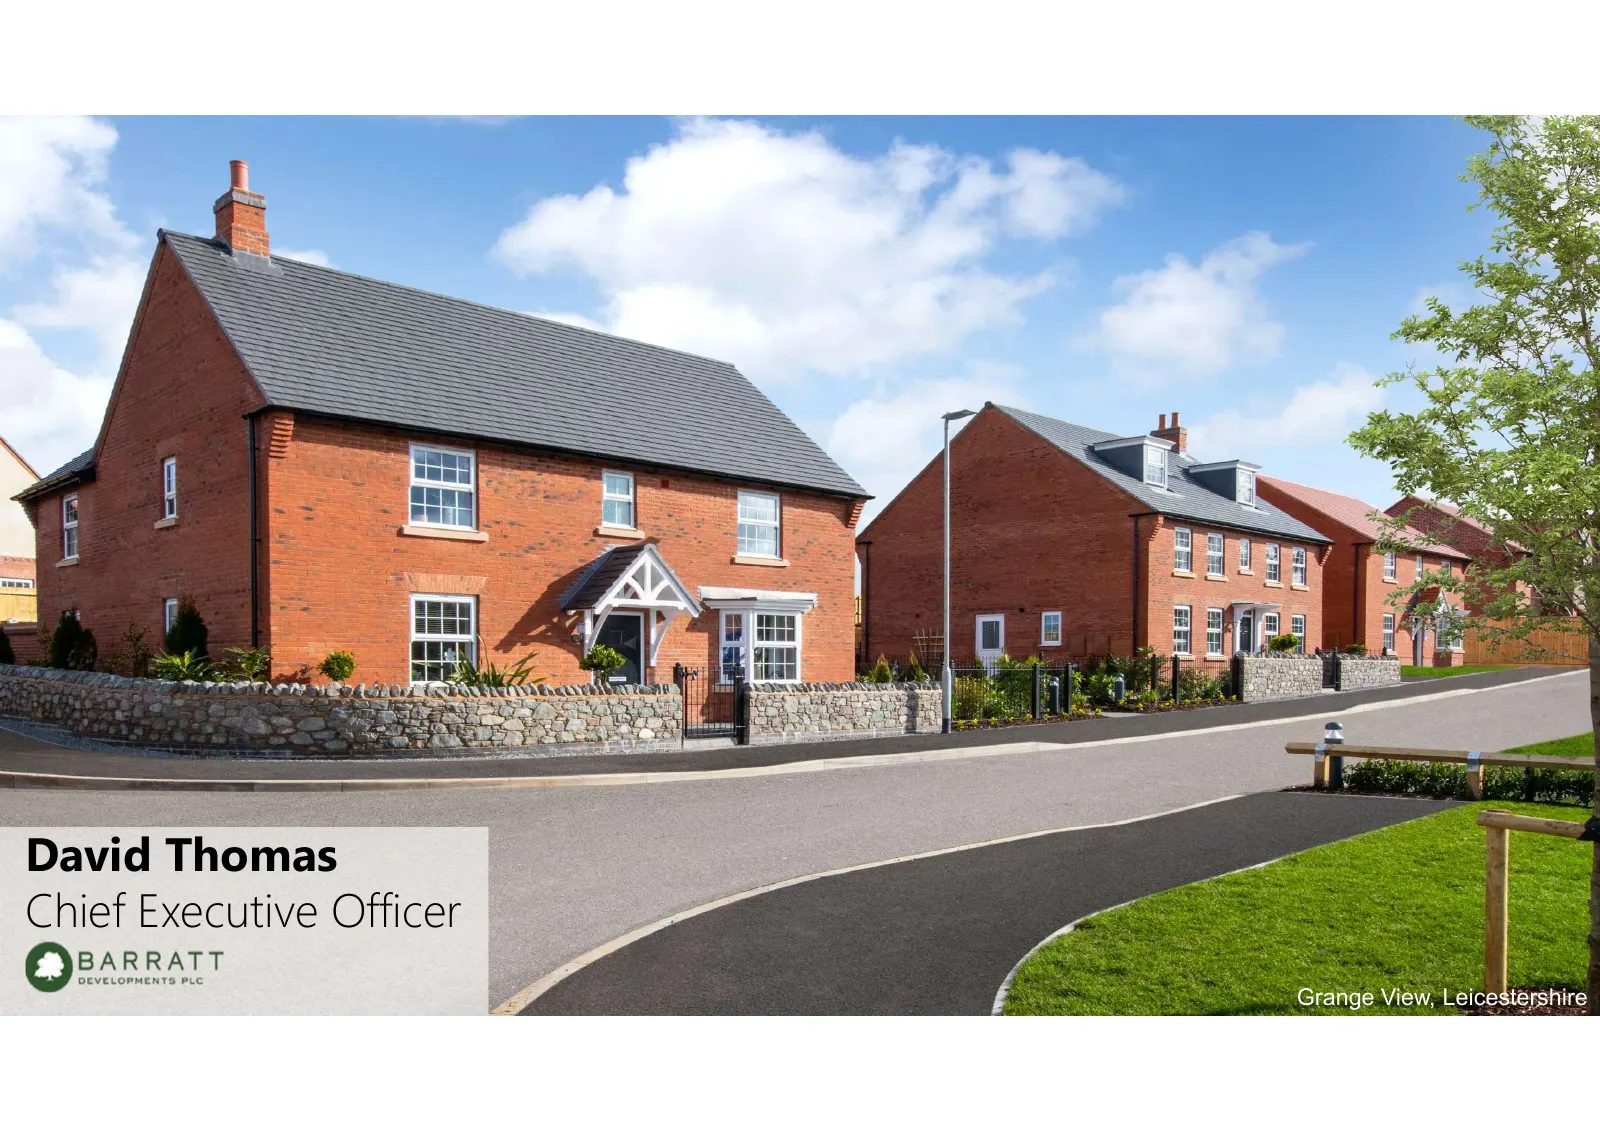
Slide 2: David Thomas, Chief Executive Officer
David Thomas Chief Executive Officer 2 Grange View, Leicestershire
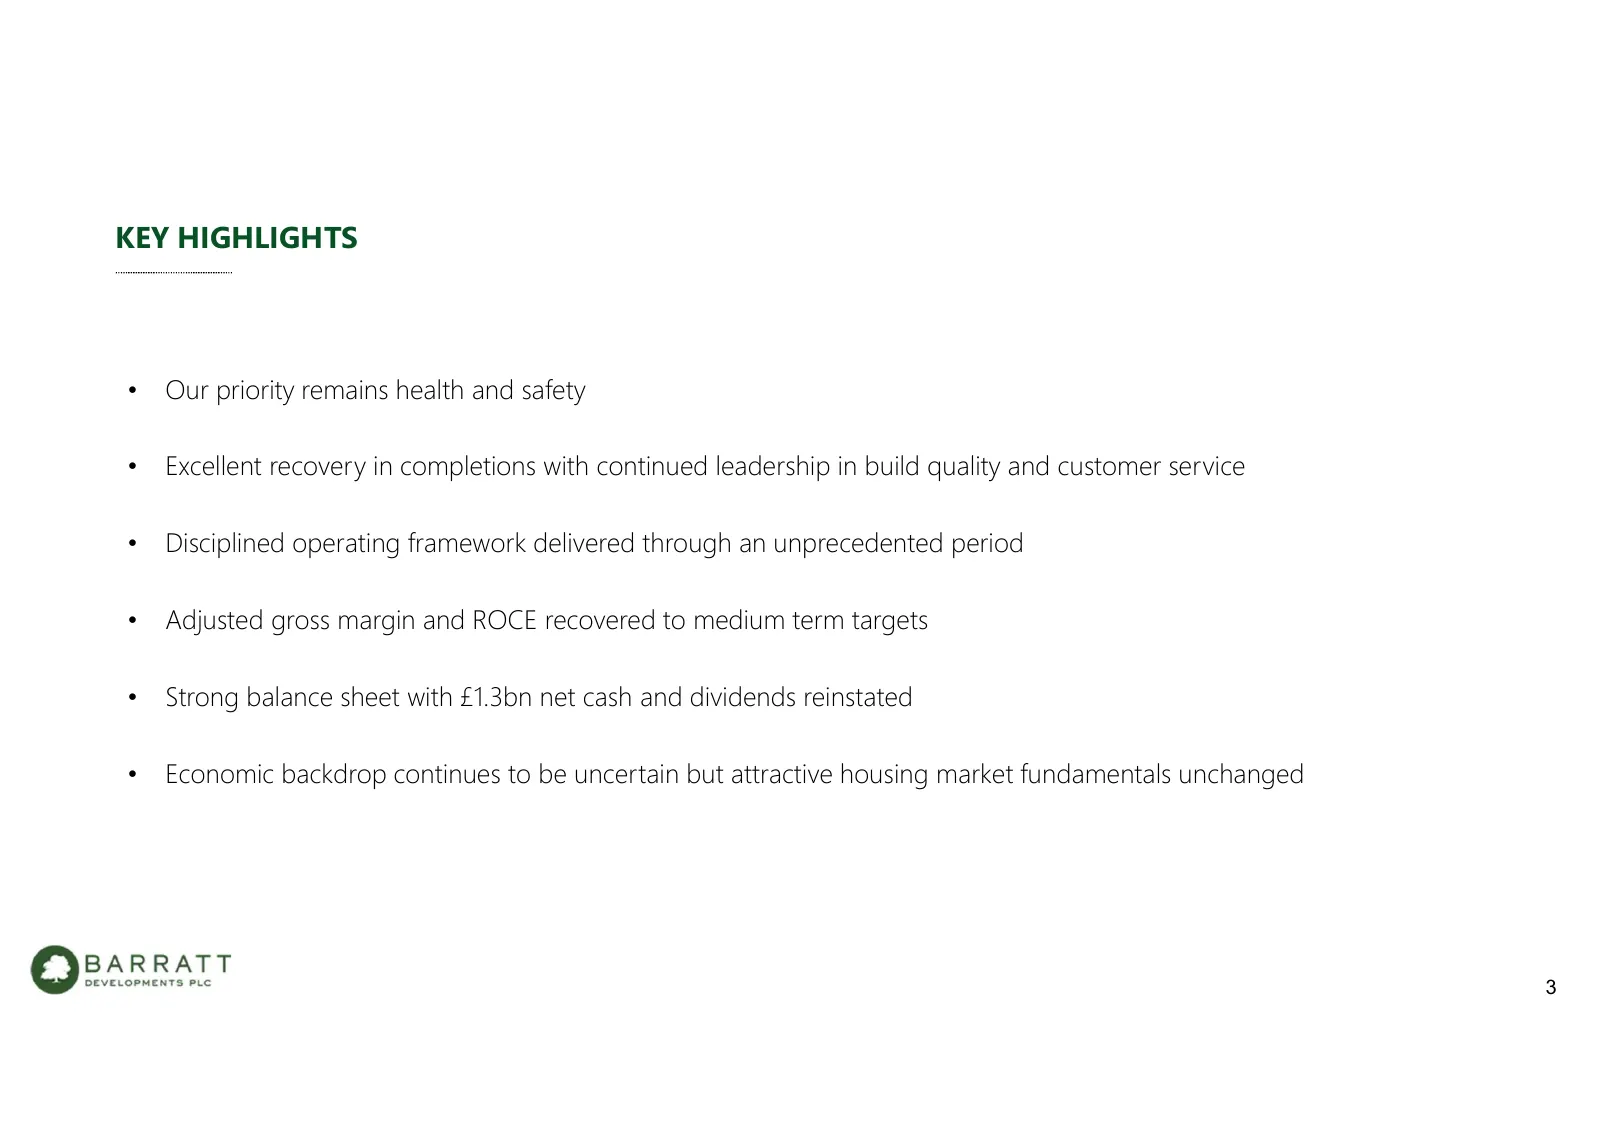
Slide 3: Key Highlights
KEY HIGHLIGHTS • Our priority remains health and safety • Excellent recovery in completions with continued leadership in build quality and customer service • Disciplined operating framework delivered through an unprecedented period • Adjusted gross margin and ROCE recovered to medium term targets •
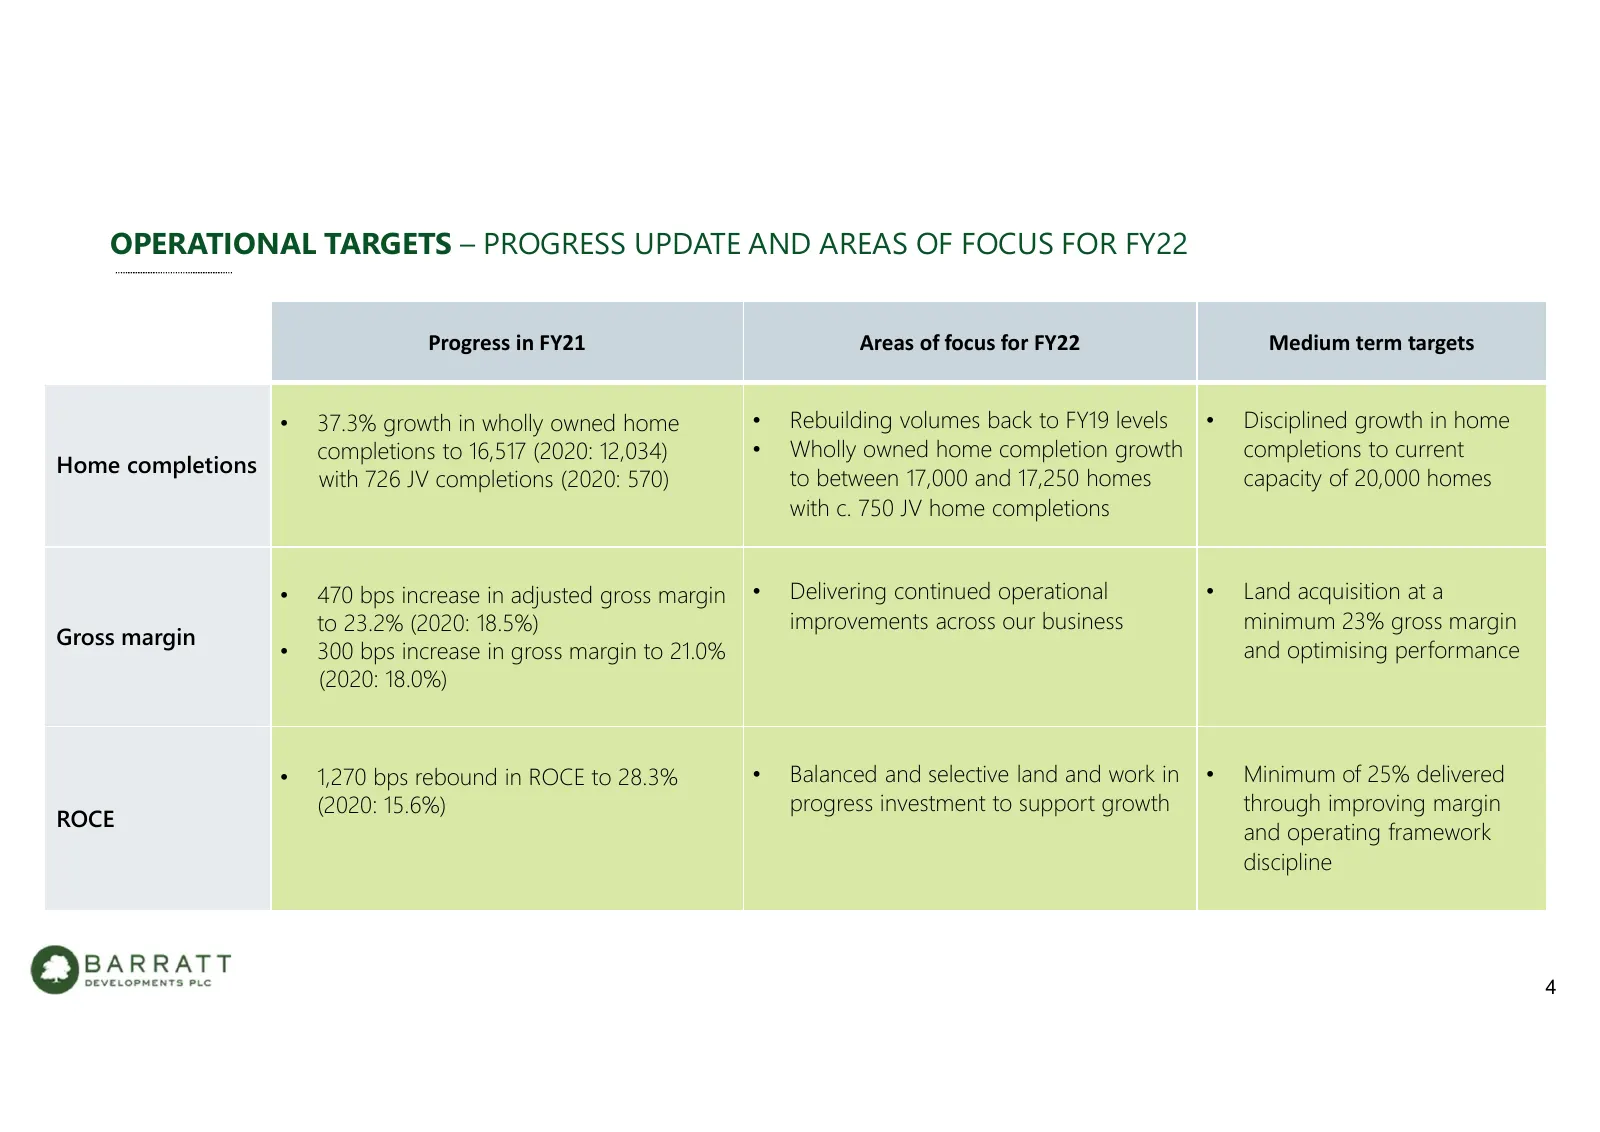
Slide 4: Operational Targets – Progress Update and Areas of Focus for FY22
OPERATIONAL TARGETS – PROGRESS UPDATE AND AREAS OF FOCUS FOR FY22 Progress in FY21 Areas of focus for FY22 Medium term targets • 37.3% growth in wholly owned home • Rebuilding volumes back to FY19 levels • Disciplined growth in home completions to 16,517 (2020: 12,034) • Wholly owned home completion
Slide 5: Steven Boyes, Chief Operating Officer
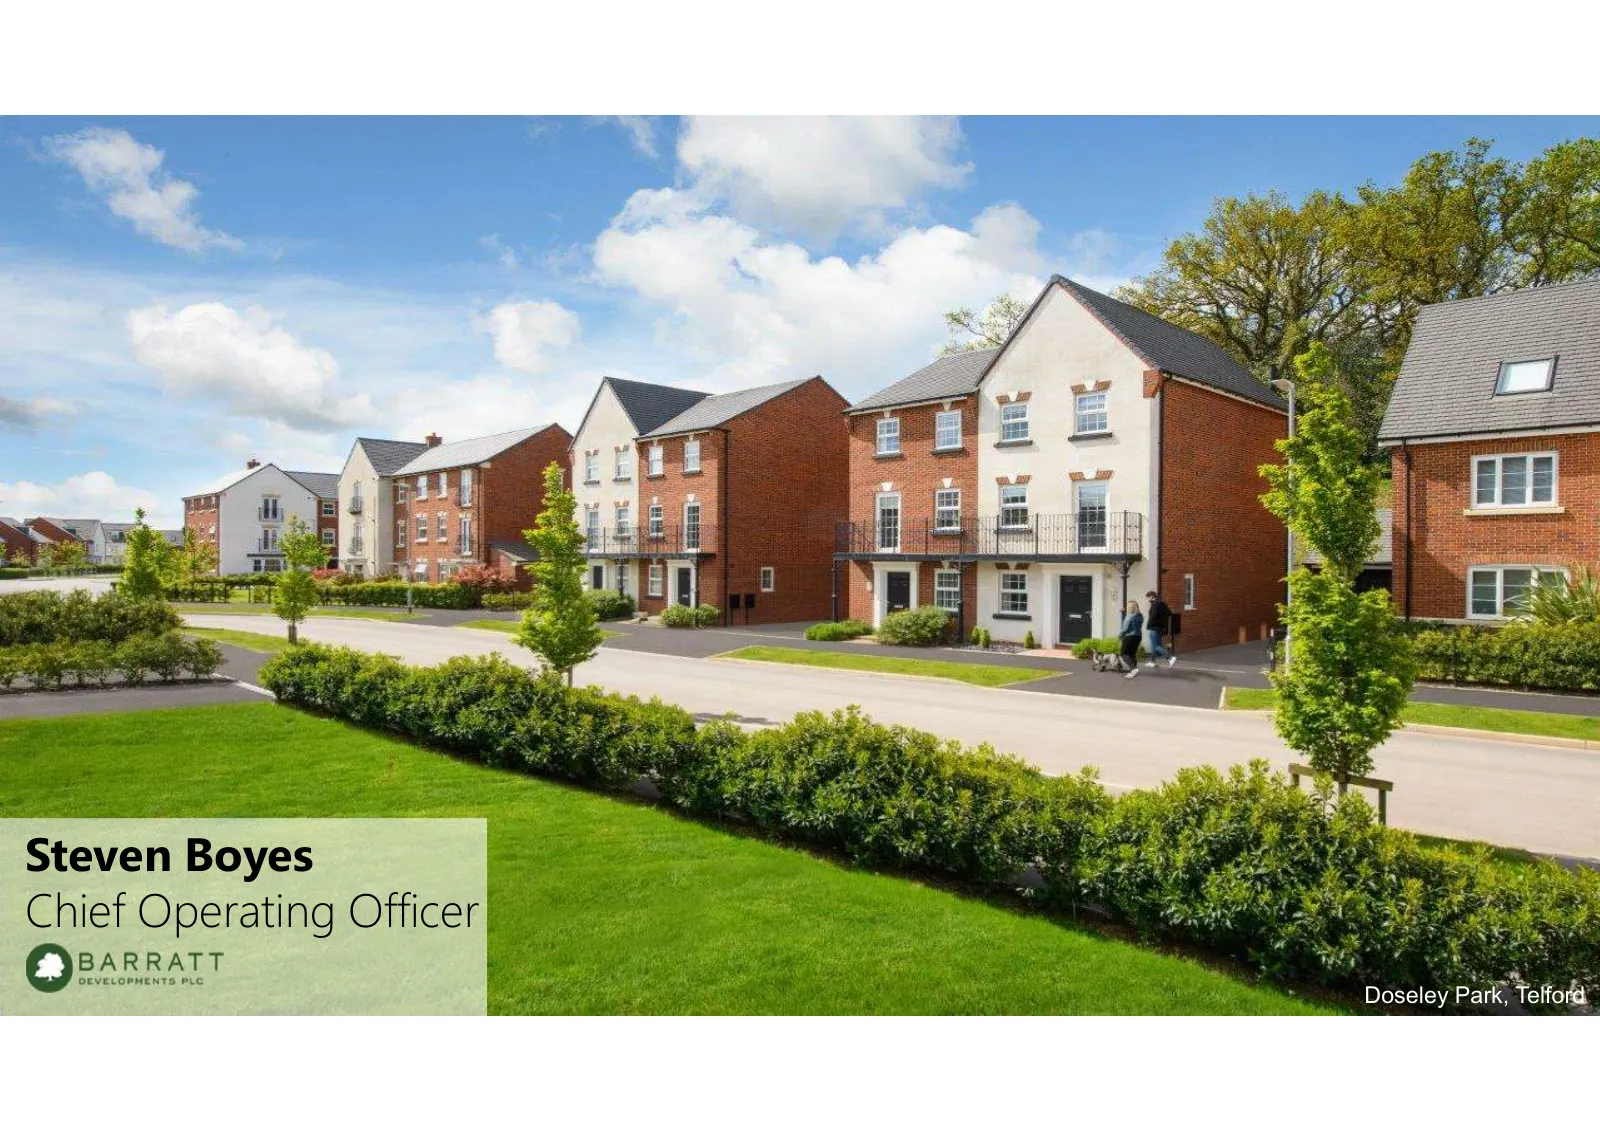
Steven Boyes Chief Operating Officer 5 Doseley Park, Telford
Slide 6: Sales Performance – Sales Rates and Selling Outlets
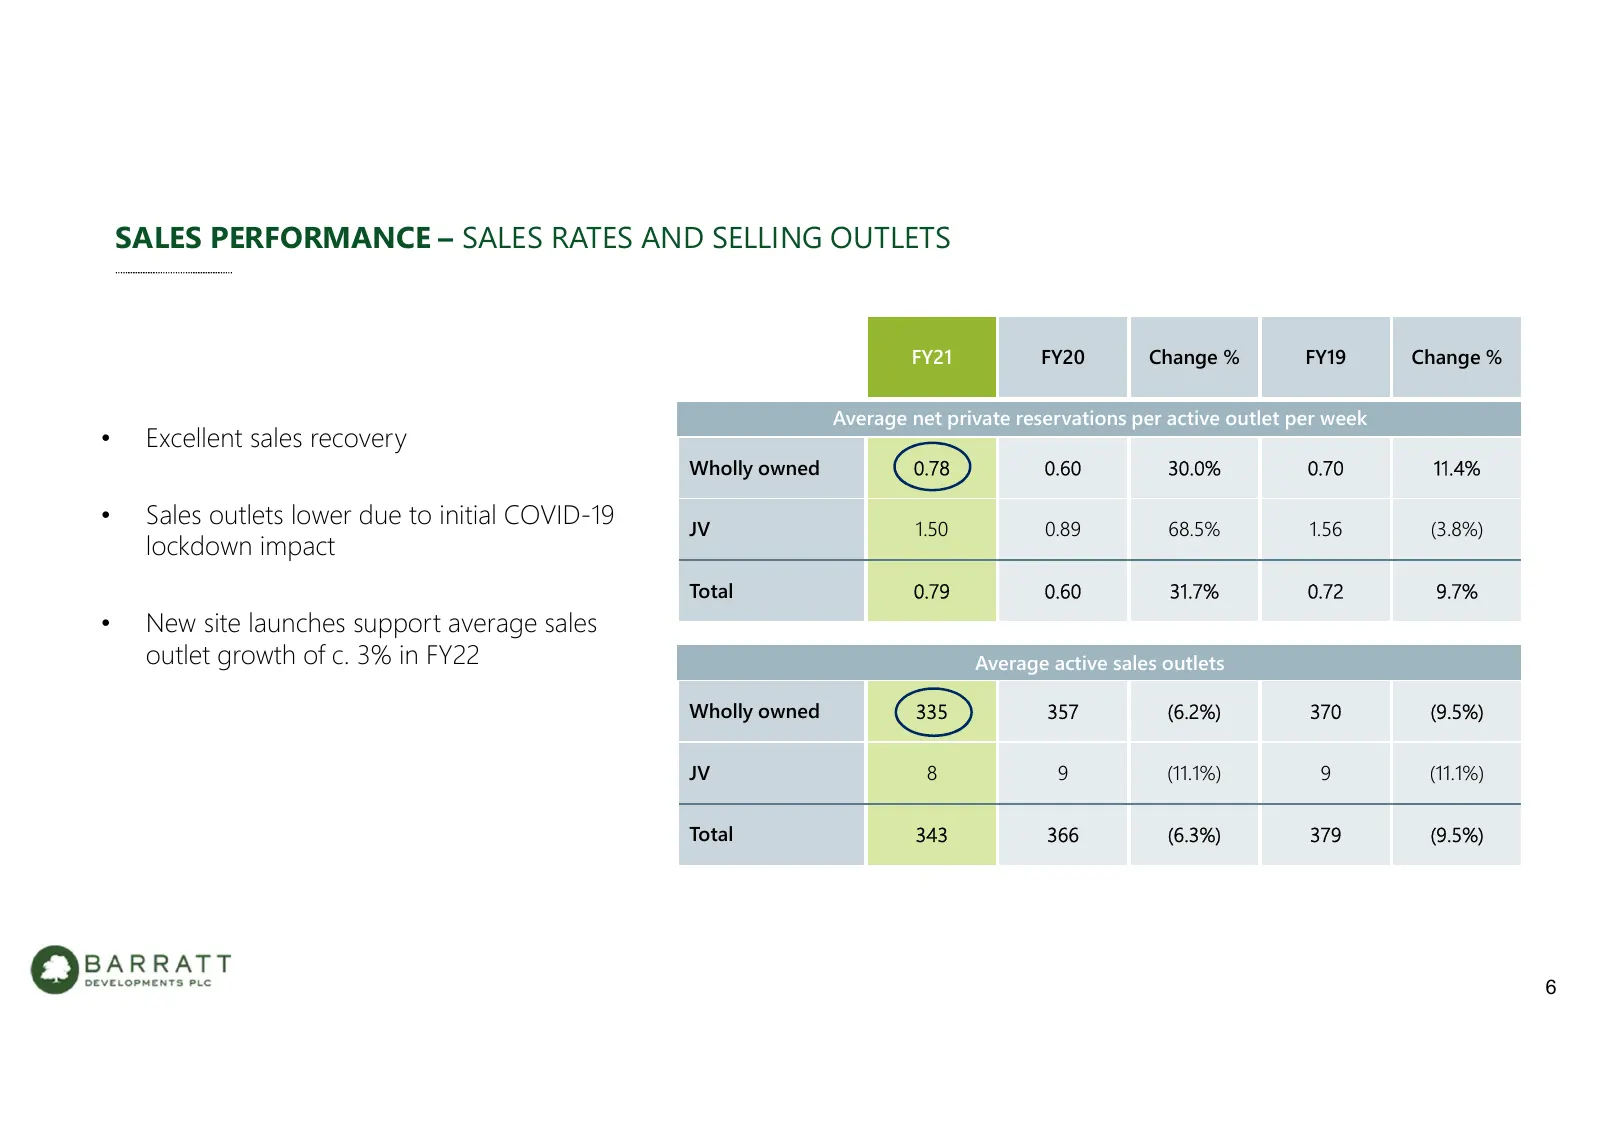
SALES PERFORMANCE – SALES RATES AND SELLING OUTLETS FY21 FY20 Change % FY19 Change % Average net private reservations per active outlet per week • Excellent sales recovery Wholly owned 0.78 0.60 30.0% 0.70 11.4% • Sales outlets lower due to initial COVID-19 JV 1.50 0.89 68.5% 1.56 (3.8%) lockdown im
Slide 7: Completions – Volumes and Pricing
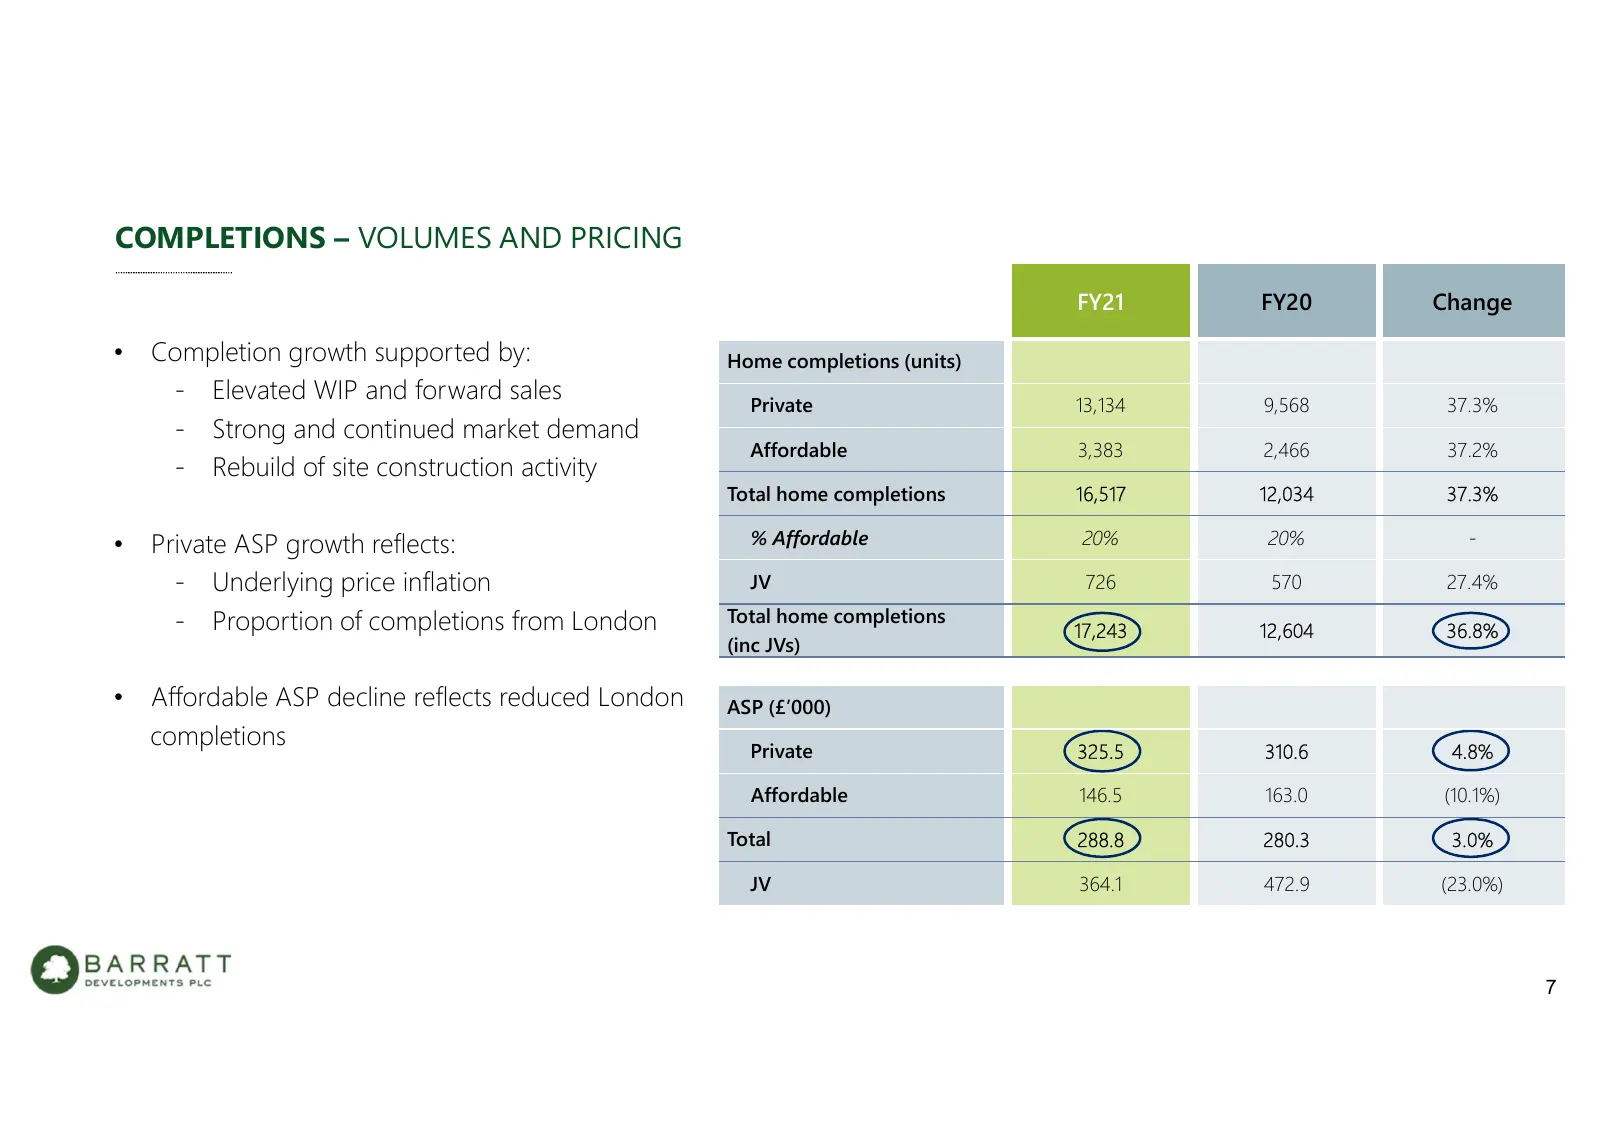
COMPLETIONS – VOLUMES AND PRICING FY21 FY20 Change • Completion growth supported by: Home completions (units) - Elevated WIP and forward sales Private 13,134 9,568 37.3% - Strong and continued market demand Affordable 3,383 2,466 37.2% - Rebuild of site construction activity Total home completions 1
Slide 8: Completions Analysis – Buyer Type
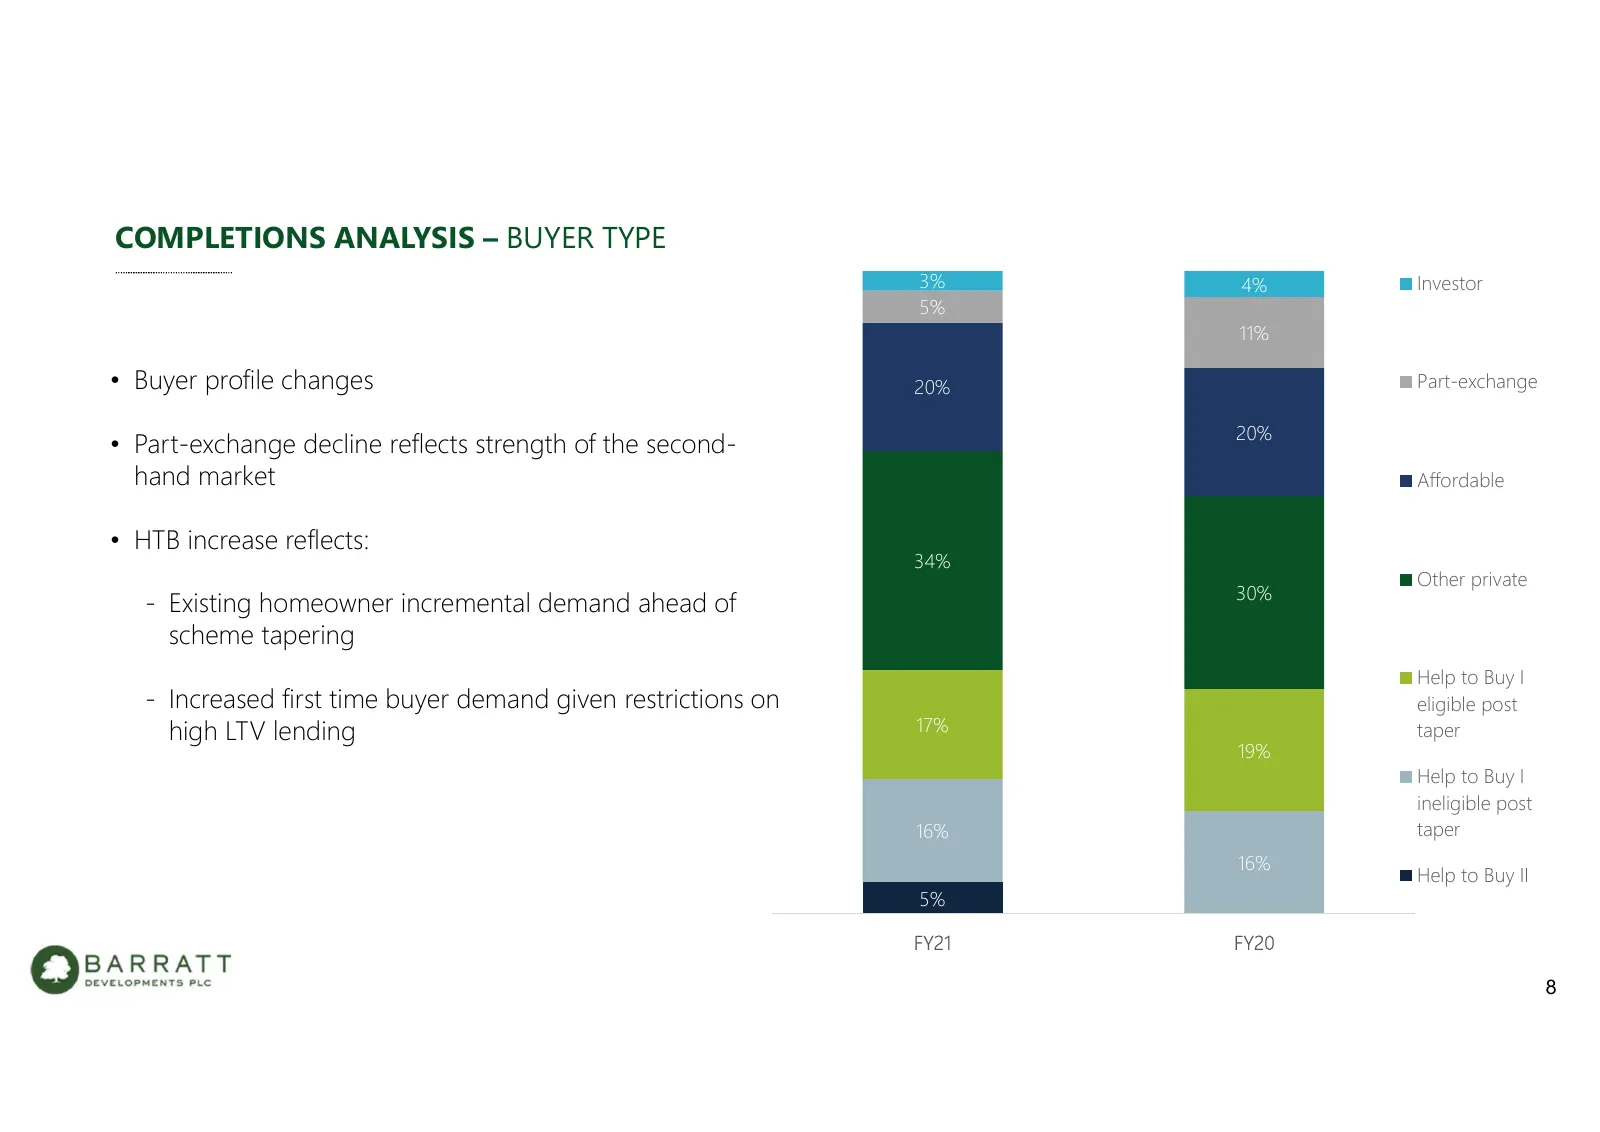
COMPLETIONS ANALYSIS – BUYER TYPE 3% 4% Investor 5% 11% • Buyer profile changes 20% Part-exchange 20% • Part-exchange decline reflects strength of the second- hand market Affordable • HTB increase reflects: 34% Other private 30% - Existing homeowner incremental demand ahead of scheme tapering Help t
Slide 9: Land Bank
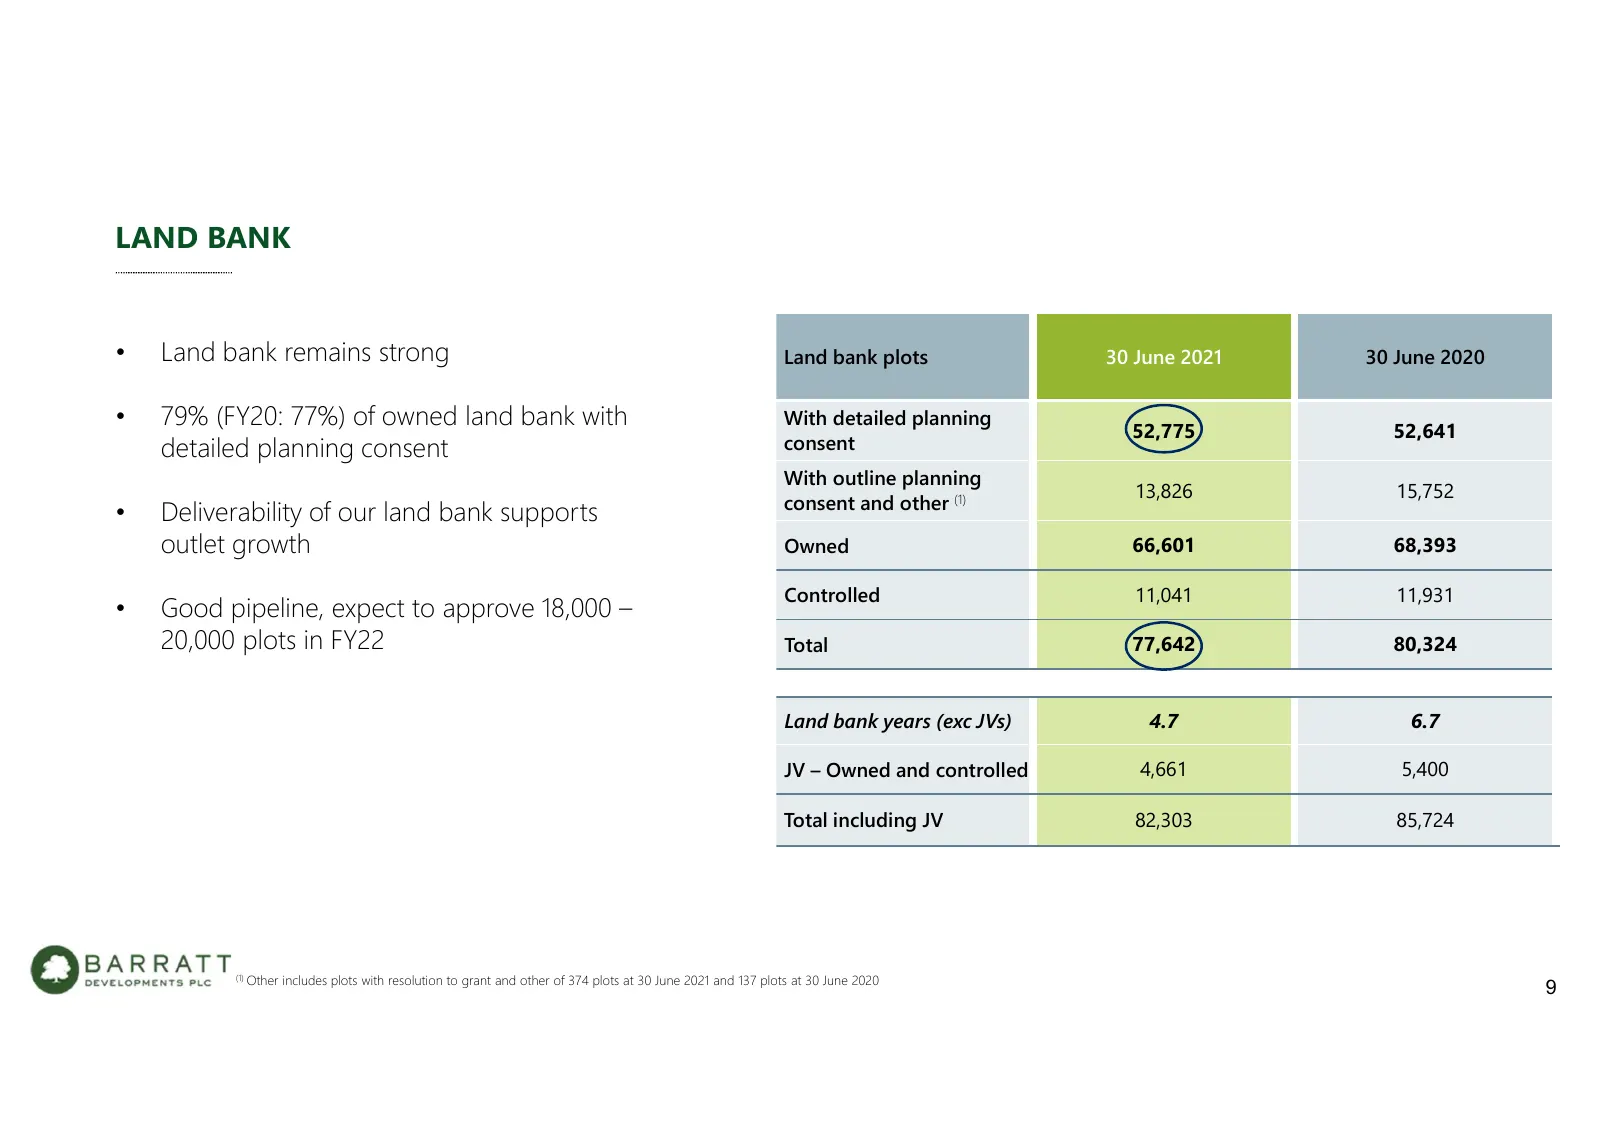
LAND BANK • Land bank remains strong Land bank plots 30 June 2021 30 June 2020 • 79% (FY20: 77%) of owned land bank with With detailed planning 52,775 52,641 detailed planning consent consent With outline planning 13,826 15,752 consent and other (1) • Deliverability of our land bank supports outlet
Slide 10: Securing Our Building Supplies
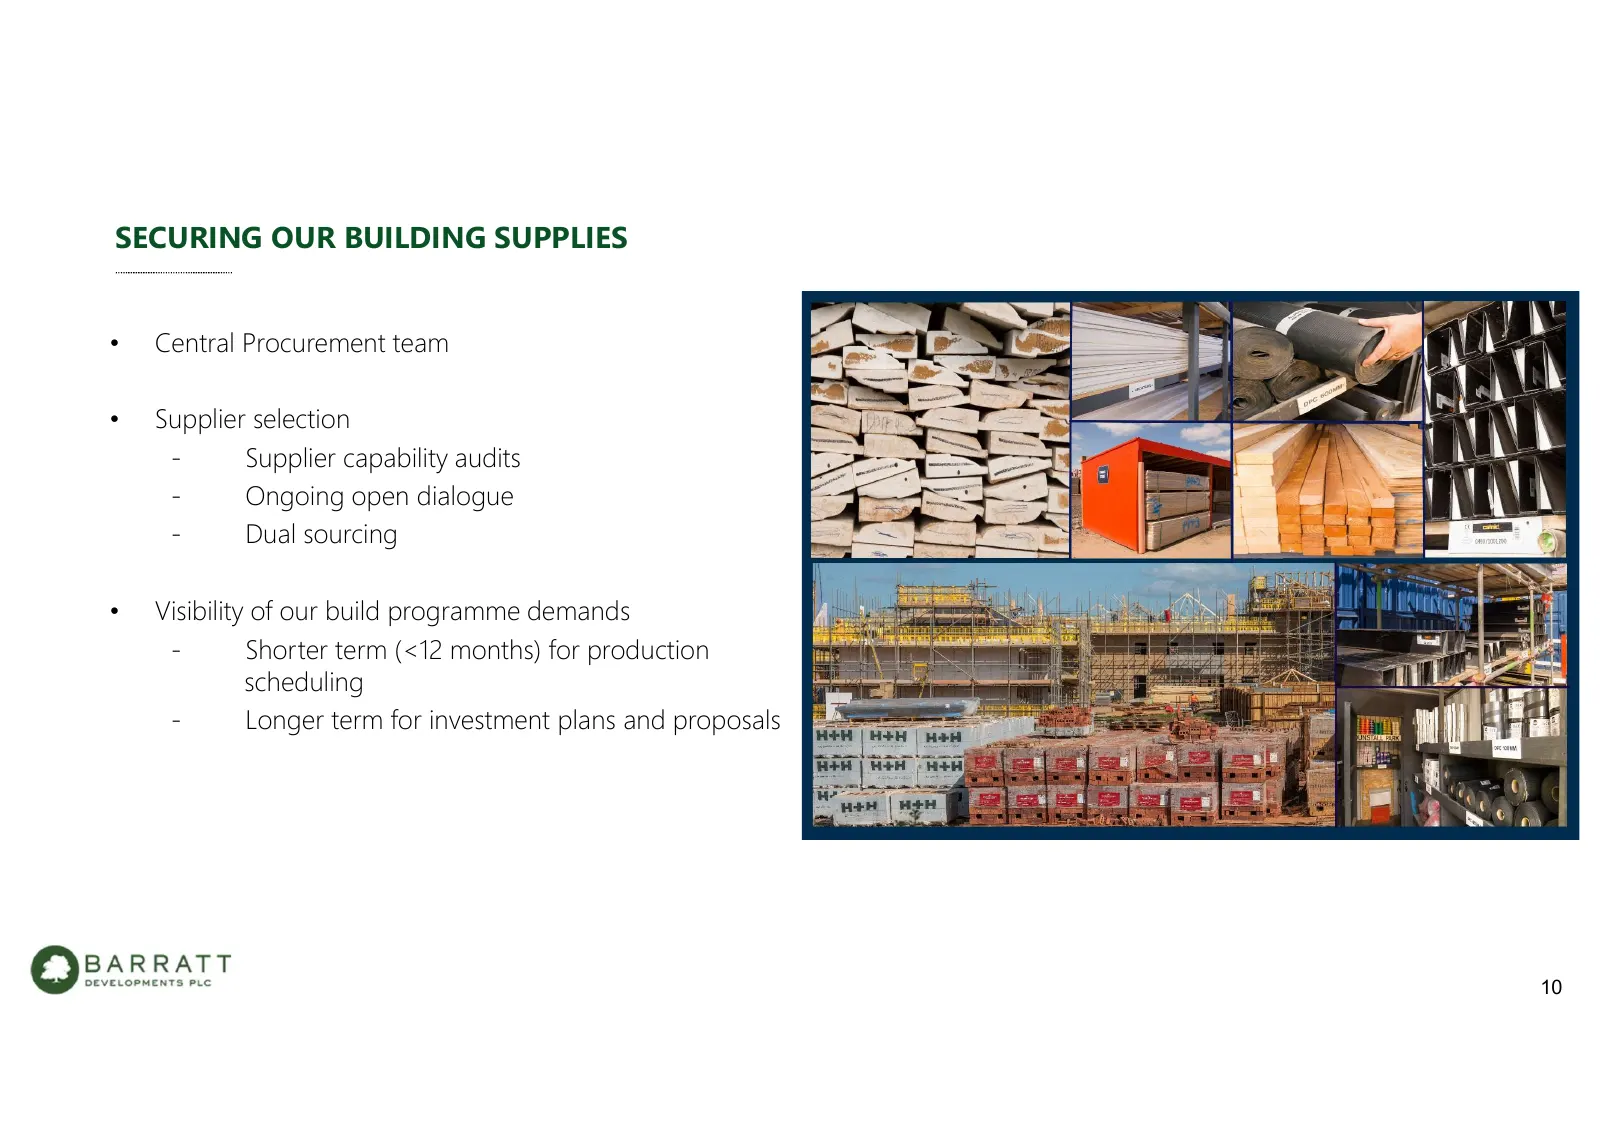
SECURING OUR BUILDING SUPPLIES • Central Procurement team • Supplier selection - Supplier capability audits - Ongoing open dialogue - Dual sourcing • Visibility of our build programme demands - Shorter term (<12 months) for production scheduling - Longer term for investment plans and proposals 10
Slide 11: Managing the Cost Environment
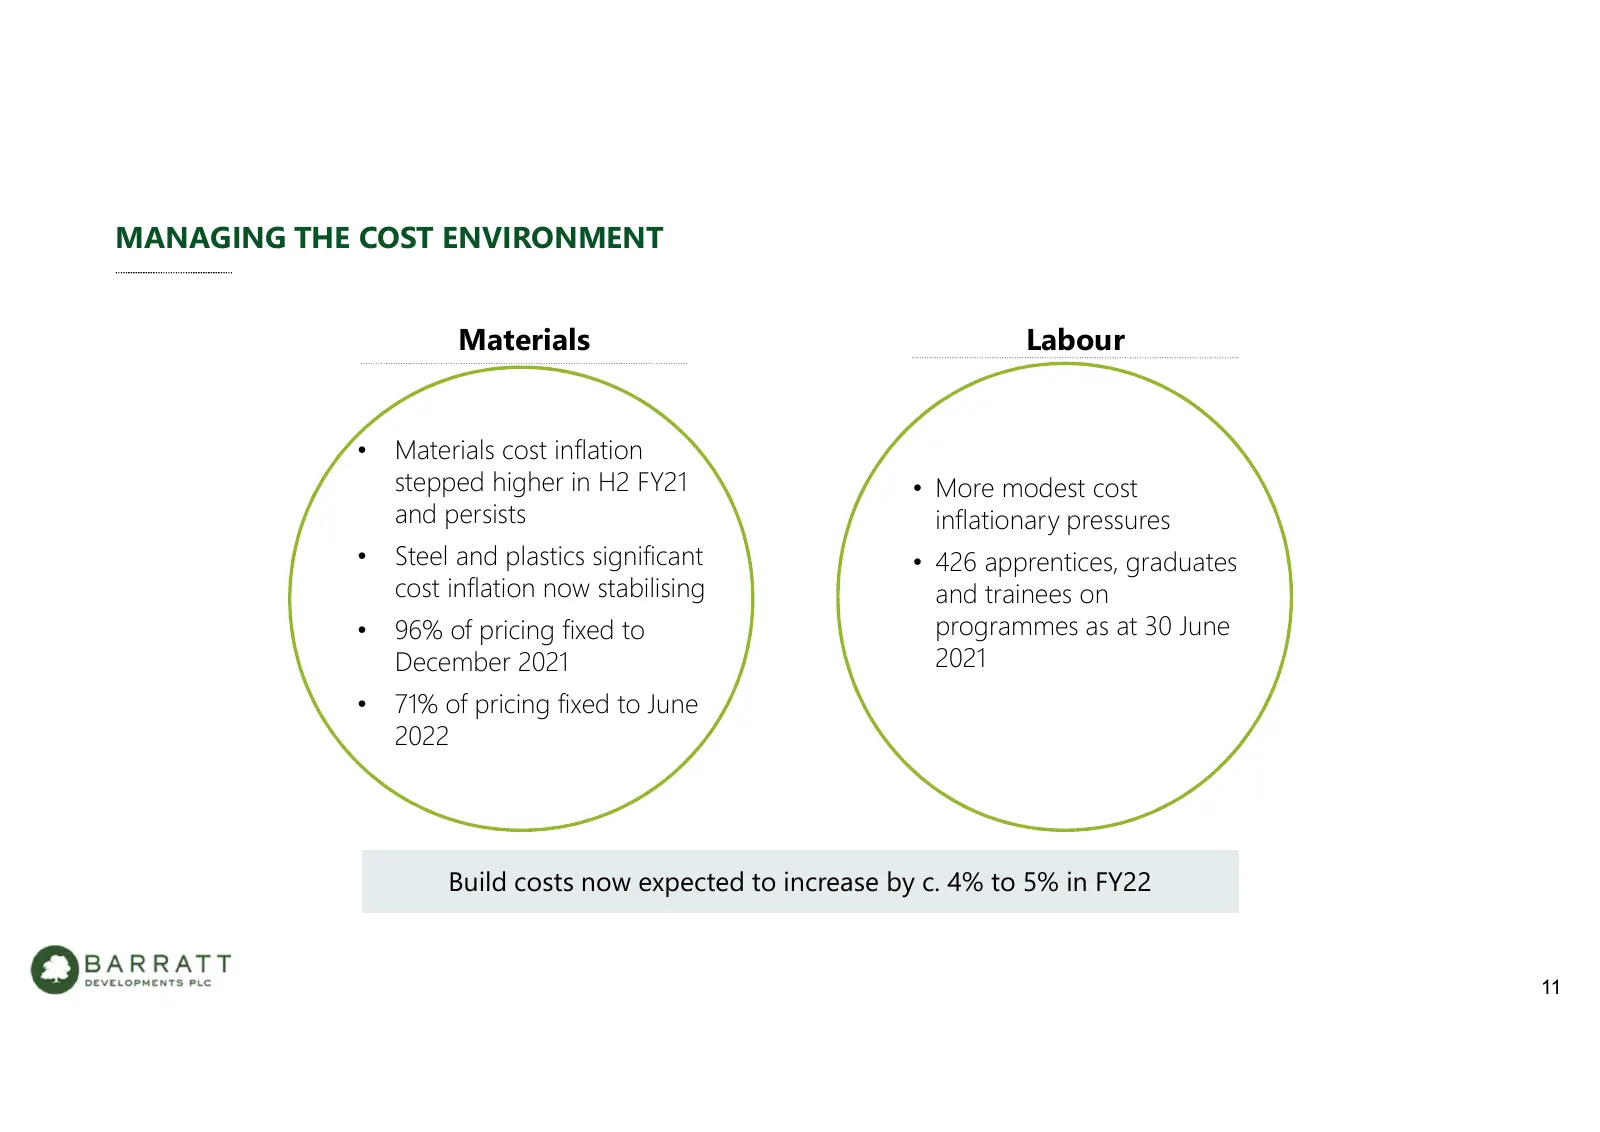
MANAGING THE COST ENVIRONMENT Materials Labour • Materials cost inflation stepped higher in H2 FY21 • More modest cost and persists inflationary pressures • Steel and plastics significant • 426 apprentices, graduates cost inflation now stabilising and trainees on • 96% of pricing fixed to programmes
Slide 12: Summary
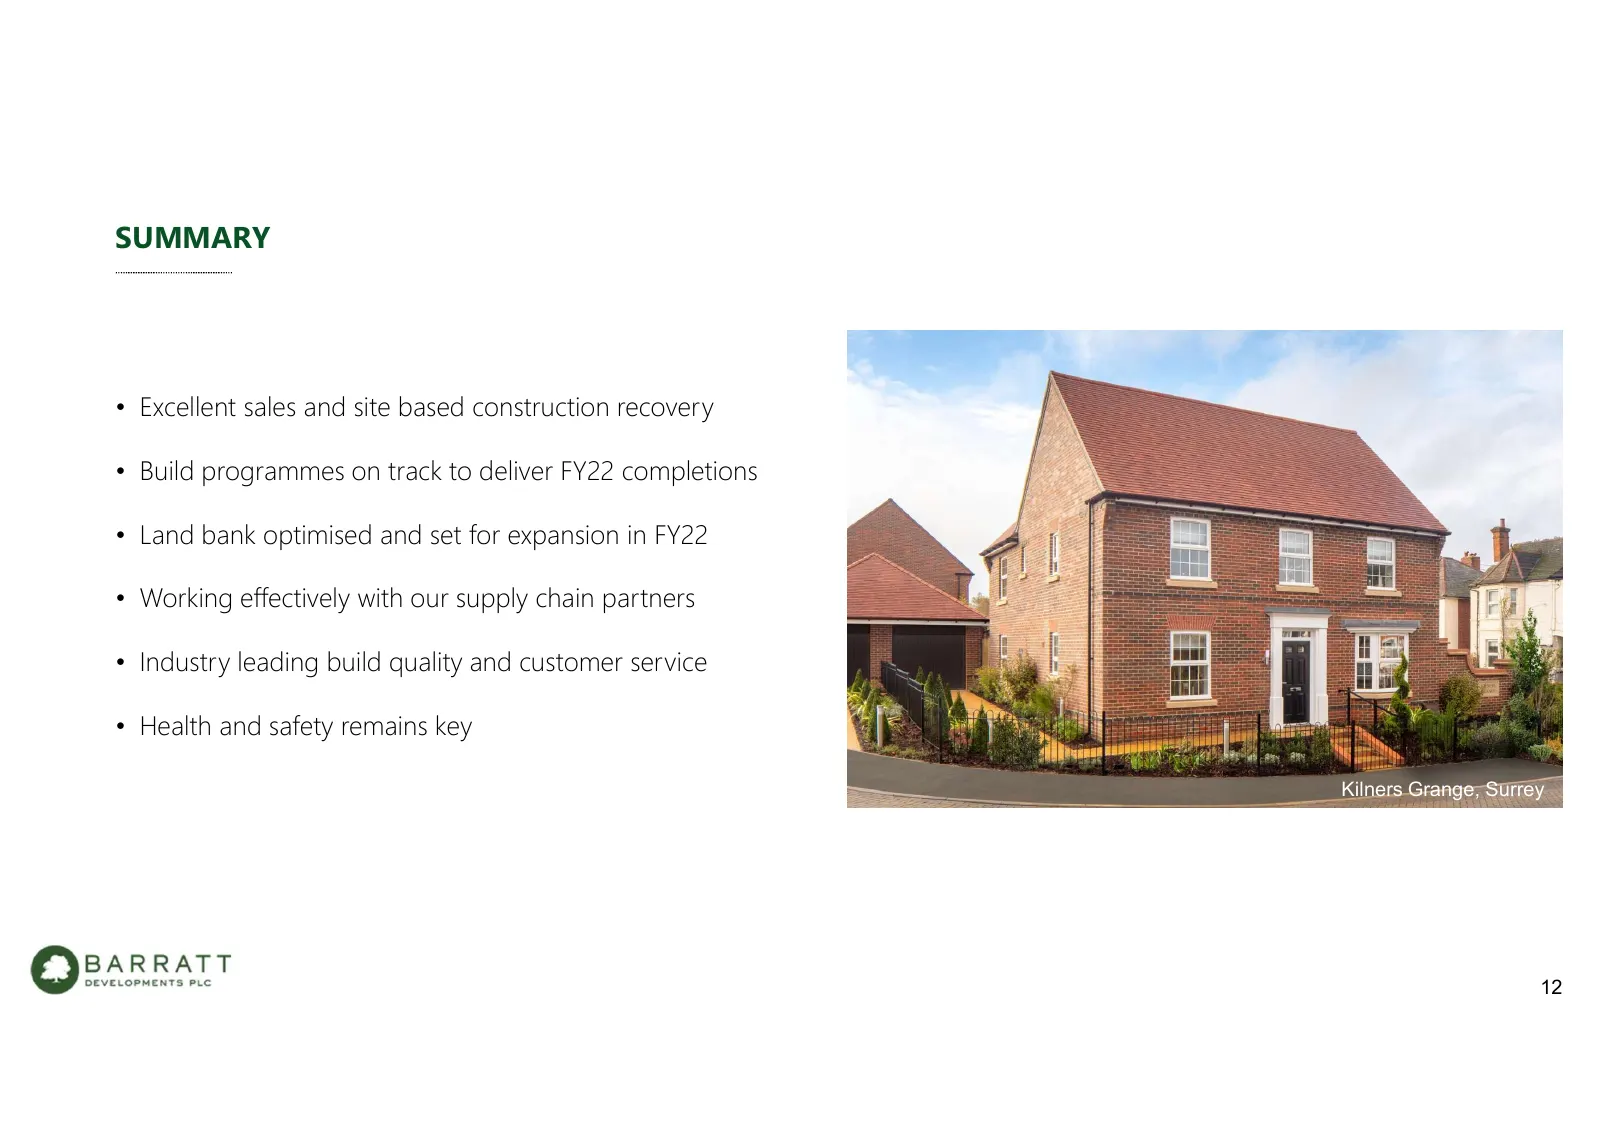
SUMMARY • Excellent sales and site based construction recovery • Build programmes on track to deliver FY22 completions • Land bank optimised and set for expansion in FY22 • Working effectively with our supply chain partners • Industry leading build quality and customer service • Health and safety re
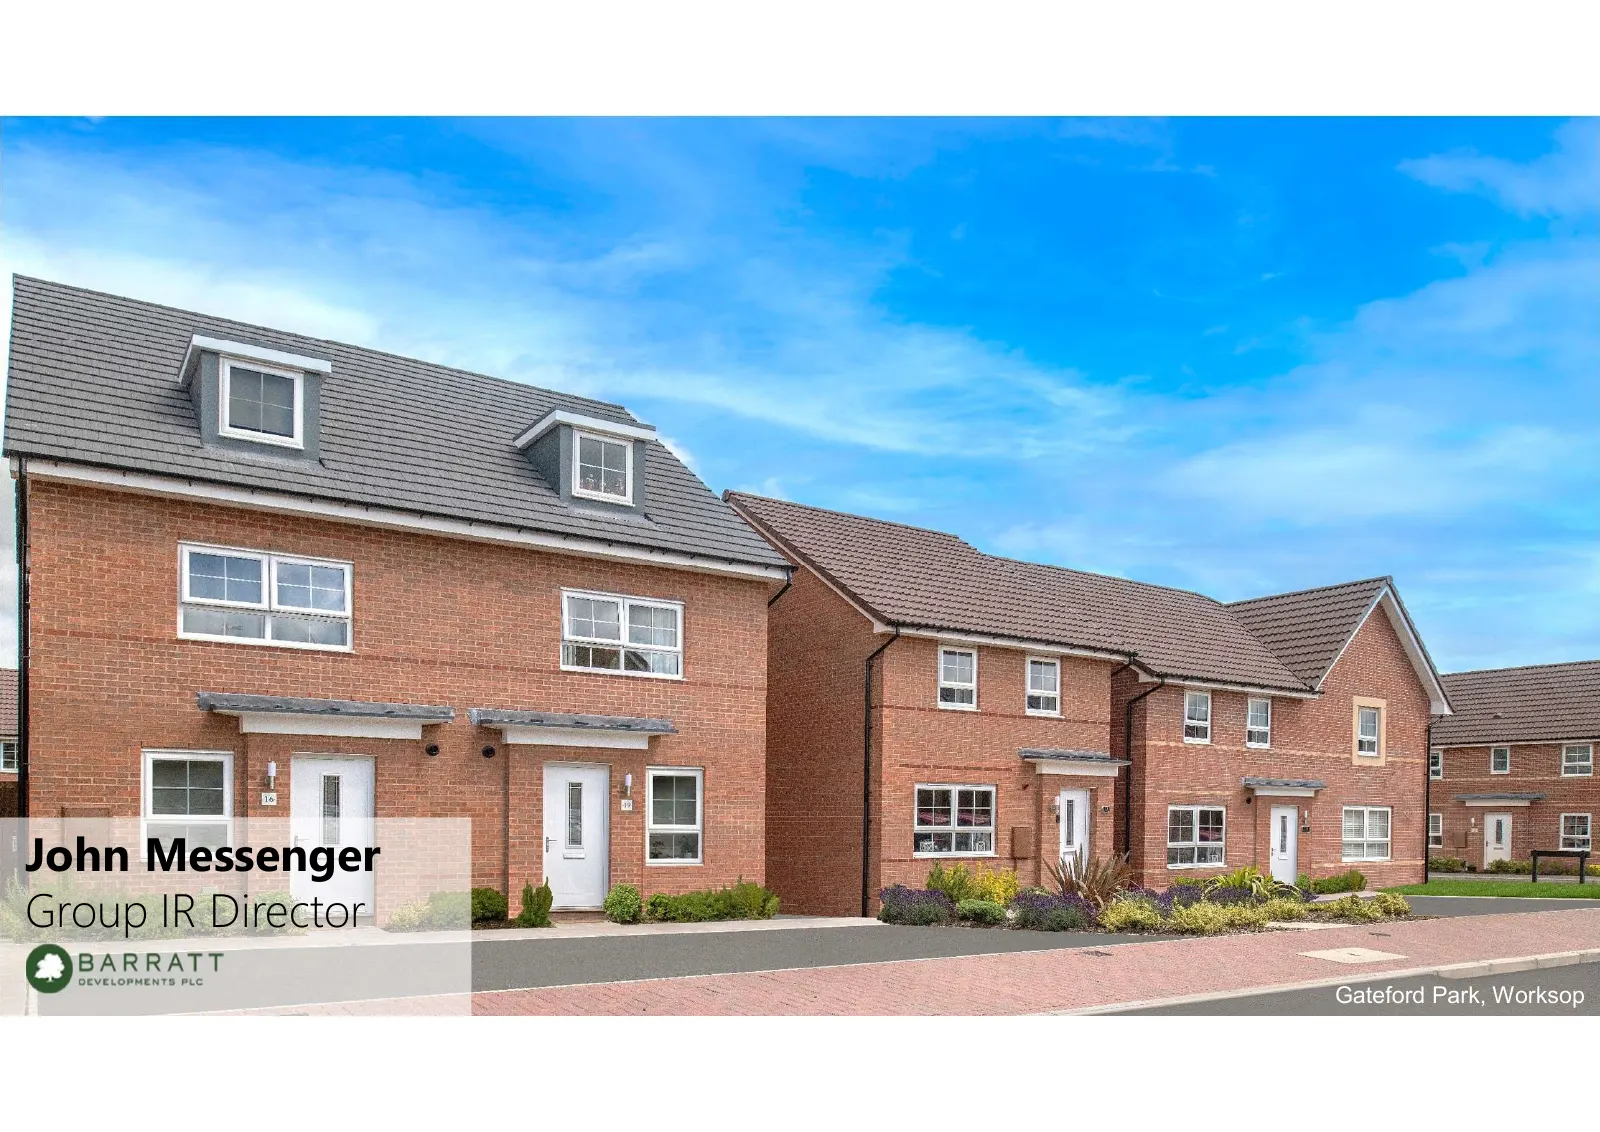
Slide 13: John Messenger, Group IR Director
John Messenger Group IR Director 13 Gateford Park, Worksop
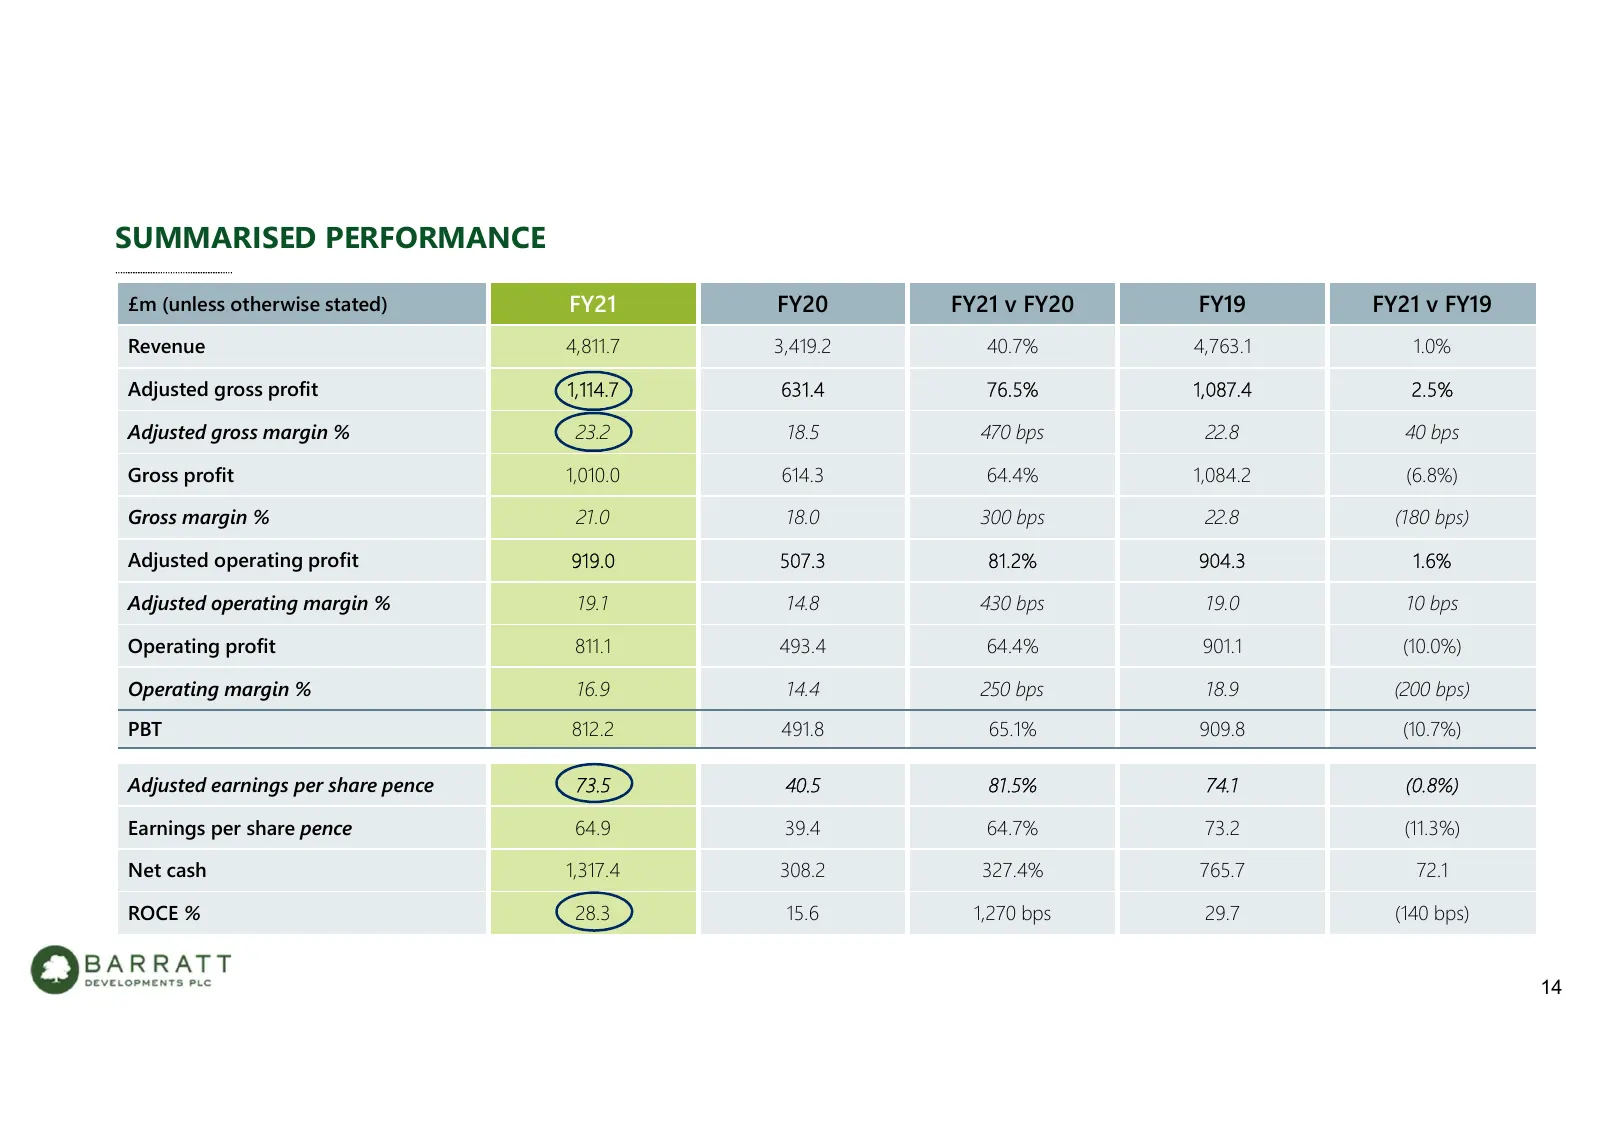
Slide 14: Summarised Performance
SUMMARISED PERFORMANCE £m (unless otherwise stated) FY21 FY20 FY21 v FY20 FY19 FY21 v FY19 Revenue 4,811.7 3,419.2 40.7% 4,763.1 1.0% Adjusted gross profit 1,114.7 631.4 76.5% 1,087.4 2.5% Adjusted gross margin % 23.2 18.5 470 bps 22.8 40 bps Gross profit 1,010.0 614.3 64.4% 1,084.2 (6.8%) Gross mar
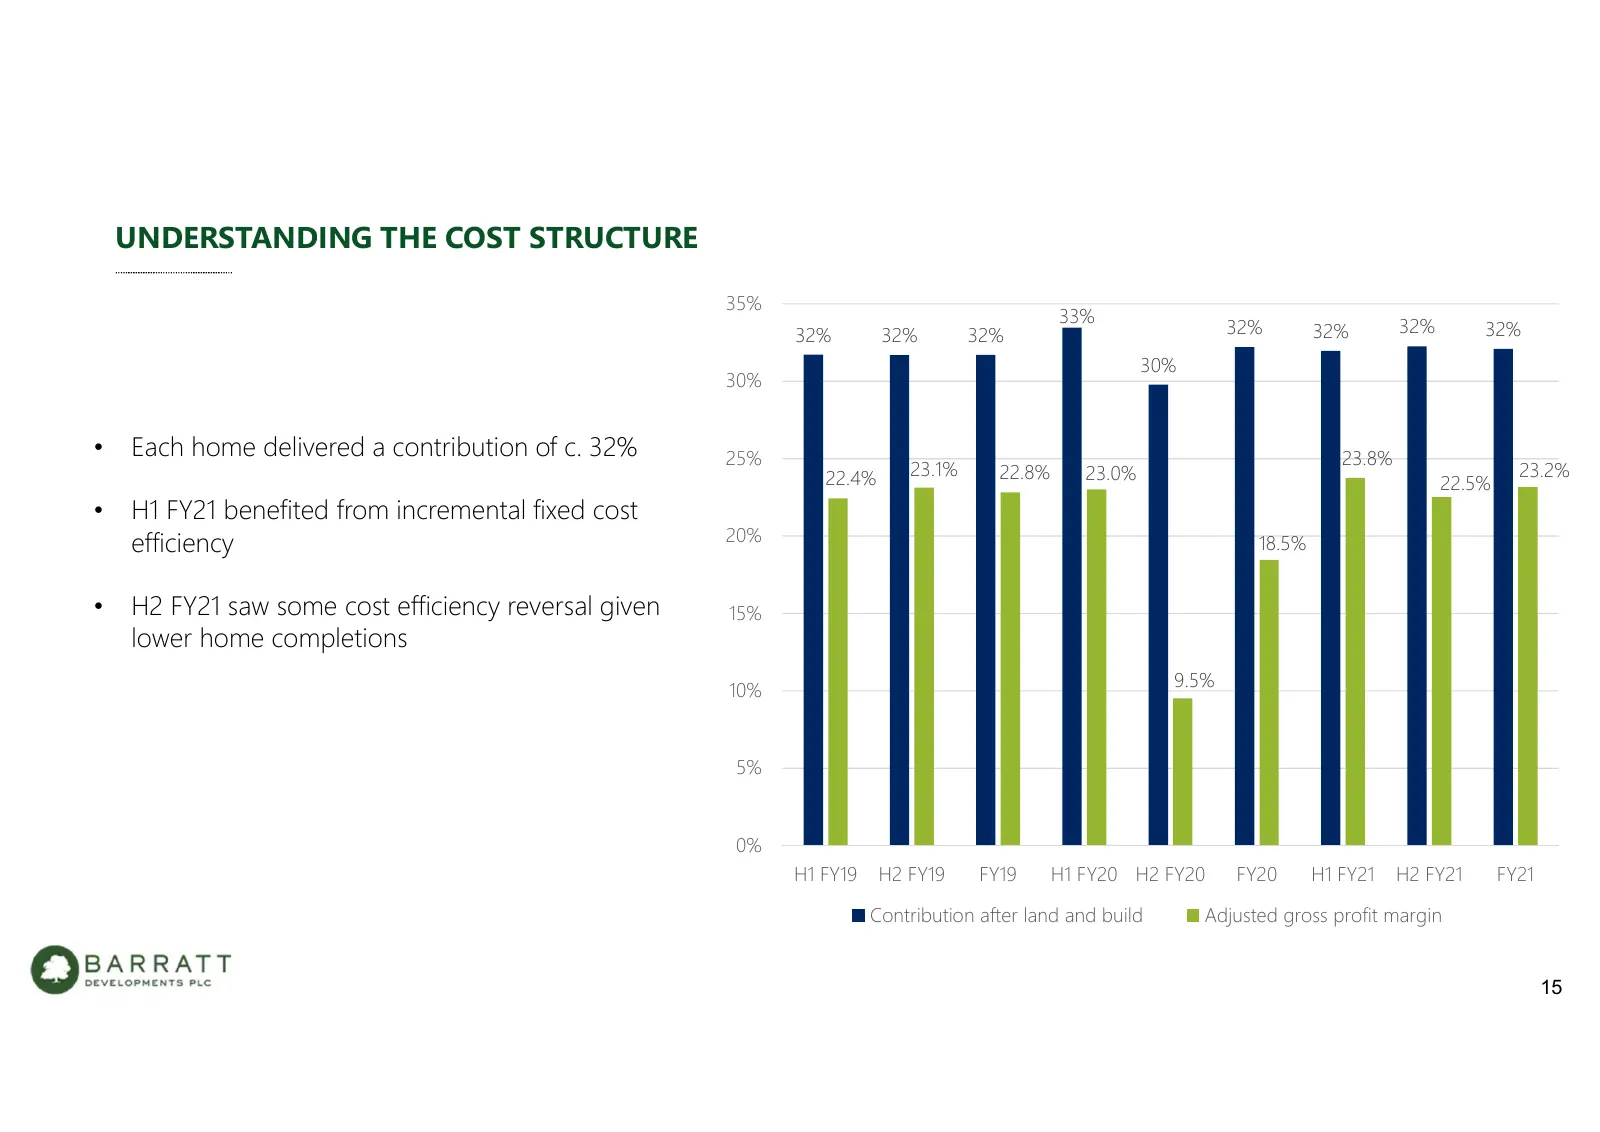
Slide 15: Understanding the Cost Structure
UNDERSTANDING THE COST STRUCTURE 35% 33% 32% 32% 32% 32% 32% 32% 32% 30% 30% • Each home delivered a contribution of c. 32% 25% 23.8% 22.4% 23.1% 22.8% 23.0% 23.2% 22.5% • H1 FY21 benefited from incremental fixed cost efficiency 20% 18.5% • H2 FY21 saw some cost efficiency reversal given 15% lower h
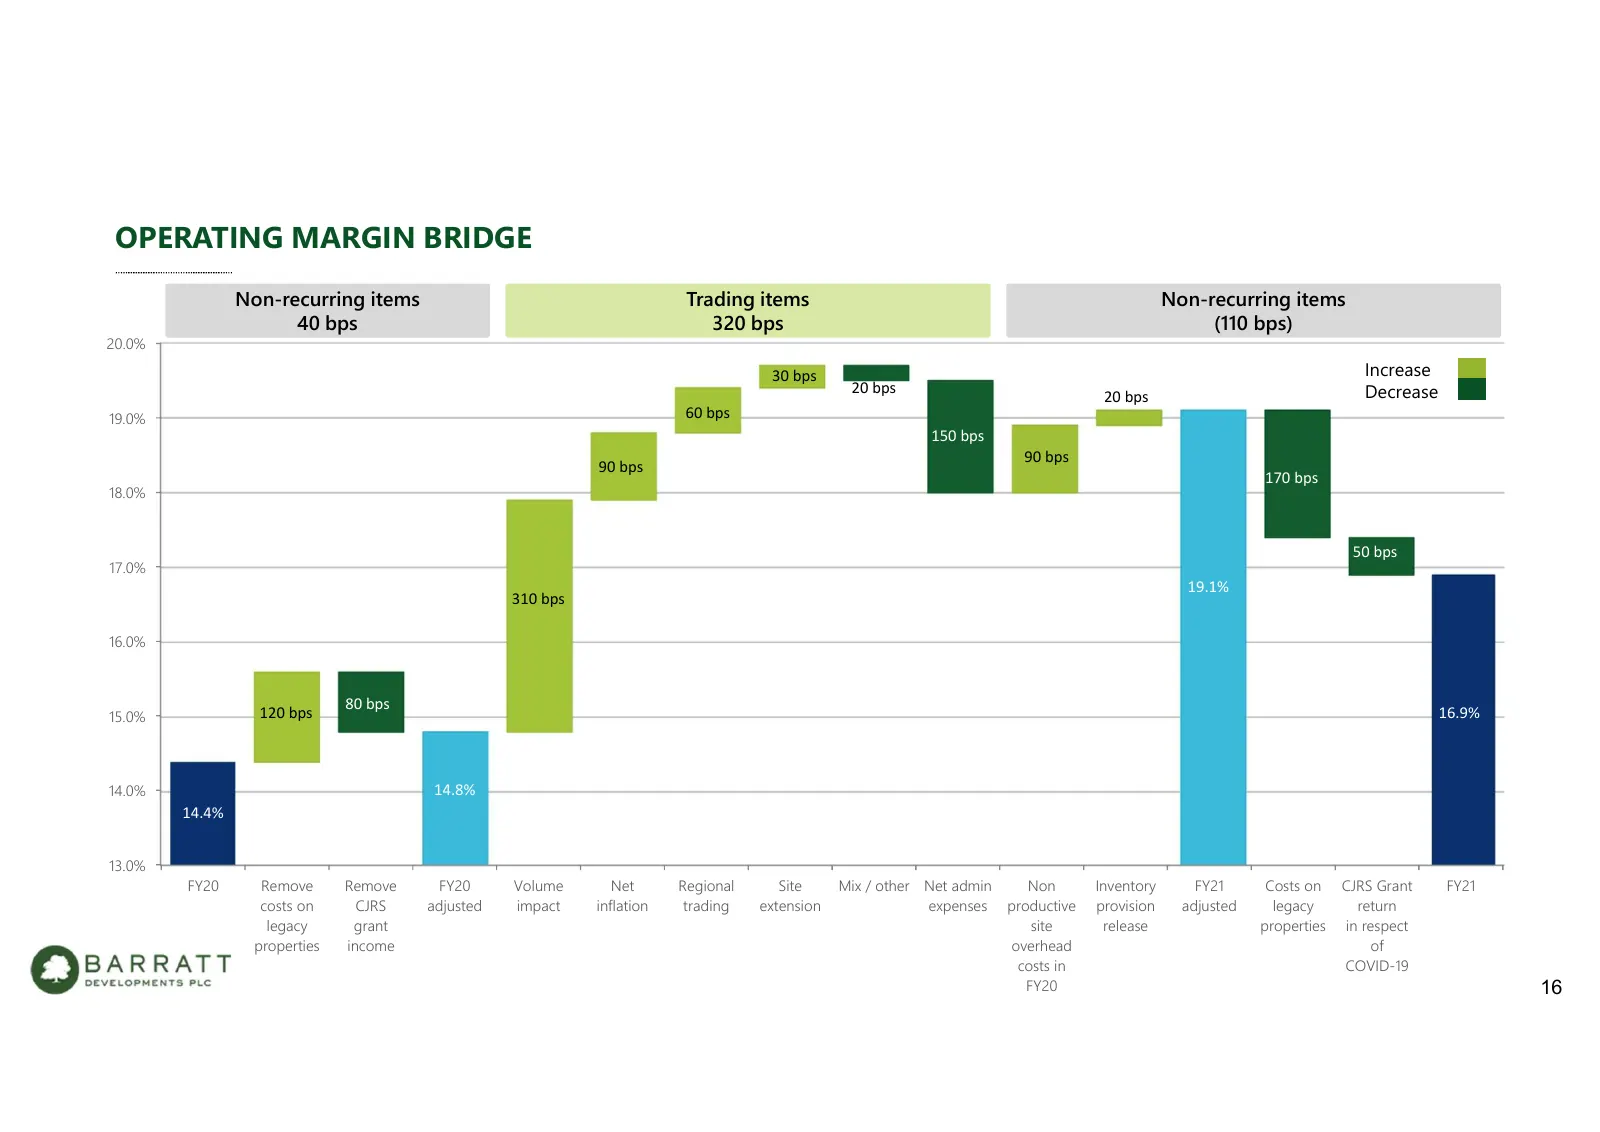
Slide 16: Operating Margin Bridge
OPERATING MARGIN BRIDGE Non-recurring items Trading items Non-recurring items 40 bps 320 bps (110 bps) 20.0% 30 bps Increase 20 bps Decrease 20 bps 19.0% 60 bps 150 bps 90 bps 90 bps 170 bps 18.0% 50 bps 17.0% 19.1% 310 bps 16.0% 80 bps 15.0% 120 bps 16.9% 120 bps 14.0% 14.8% 14.4% 13.0% FY20 Remove
Slide 17: Adjusted Items
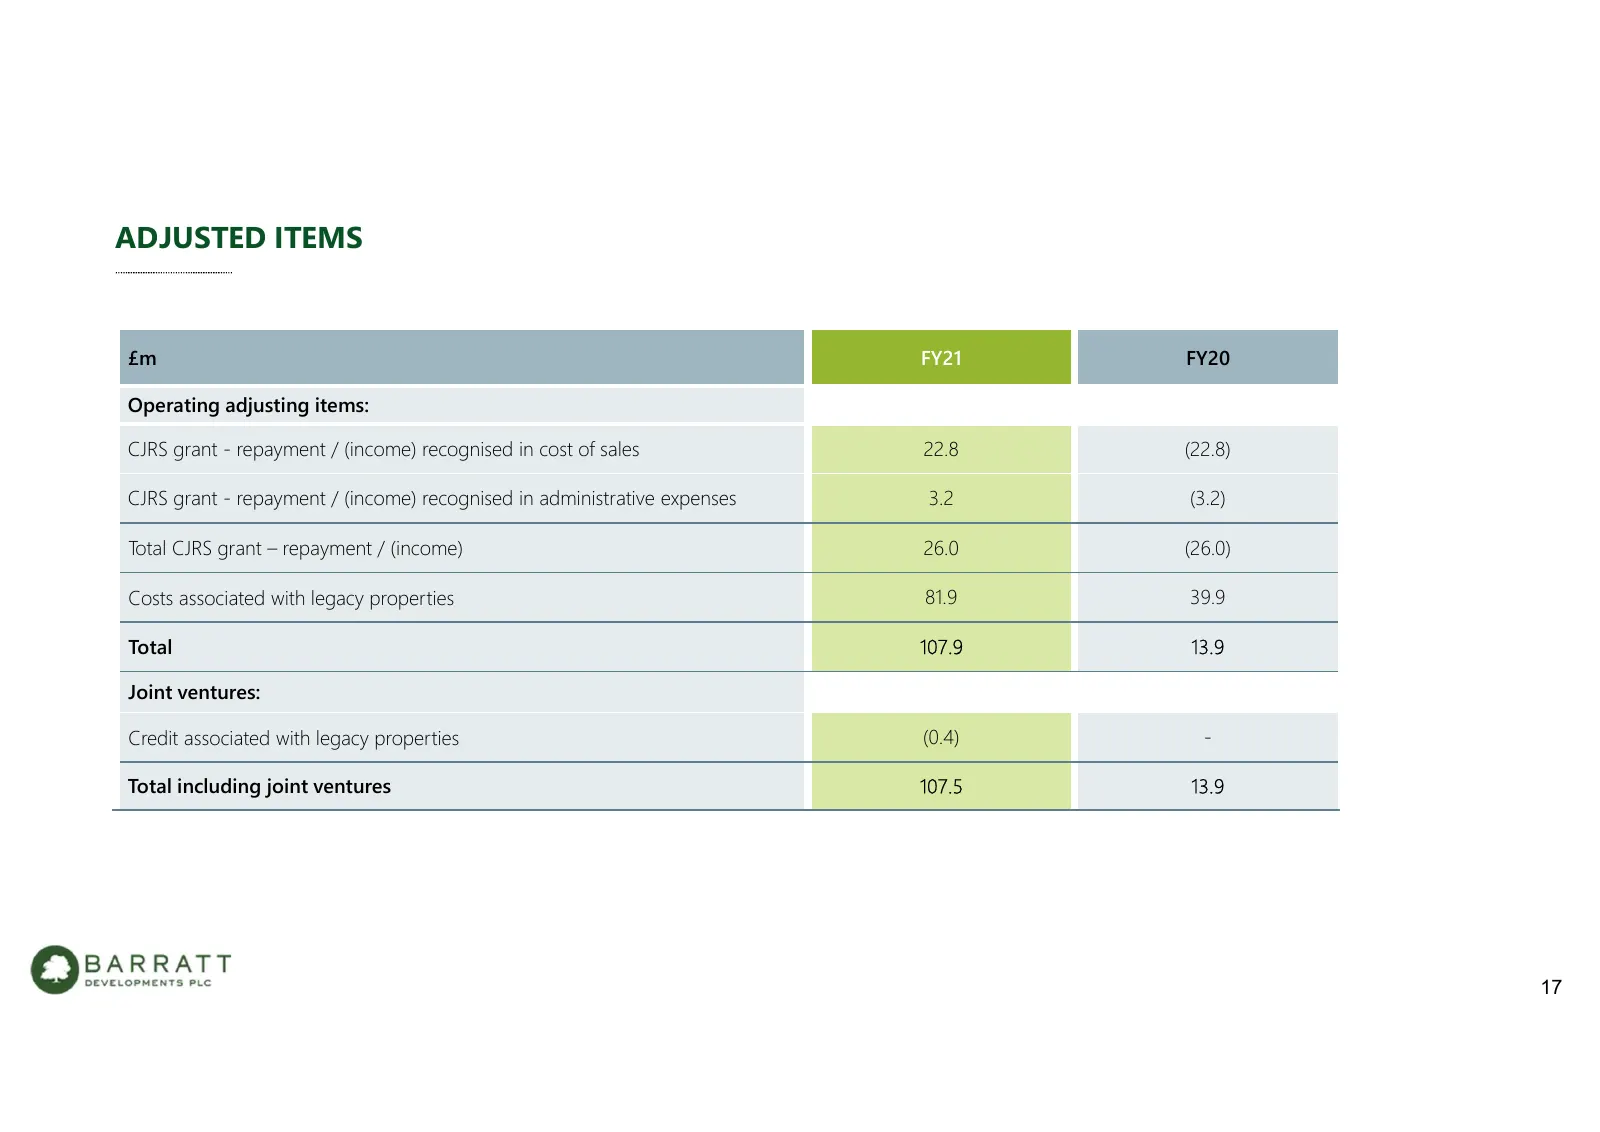
ADJUSTED ITEMS £m FY21 FY20 Operating adjusting items: CJRS grant - repayment / (income) recognised in cost of sales 22.8 (22.8) CJRS grant - repayment / (income) recognised in administrative expenses 3.2 (3.2) Total CJRS grant – repayment / (income) 26.0 (26.0) Costs associated with legacy properti
Slide 18: Operating Framework – Progress Update
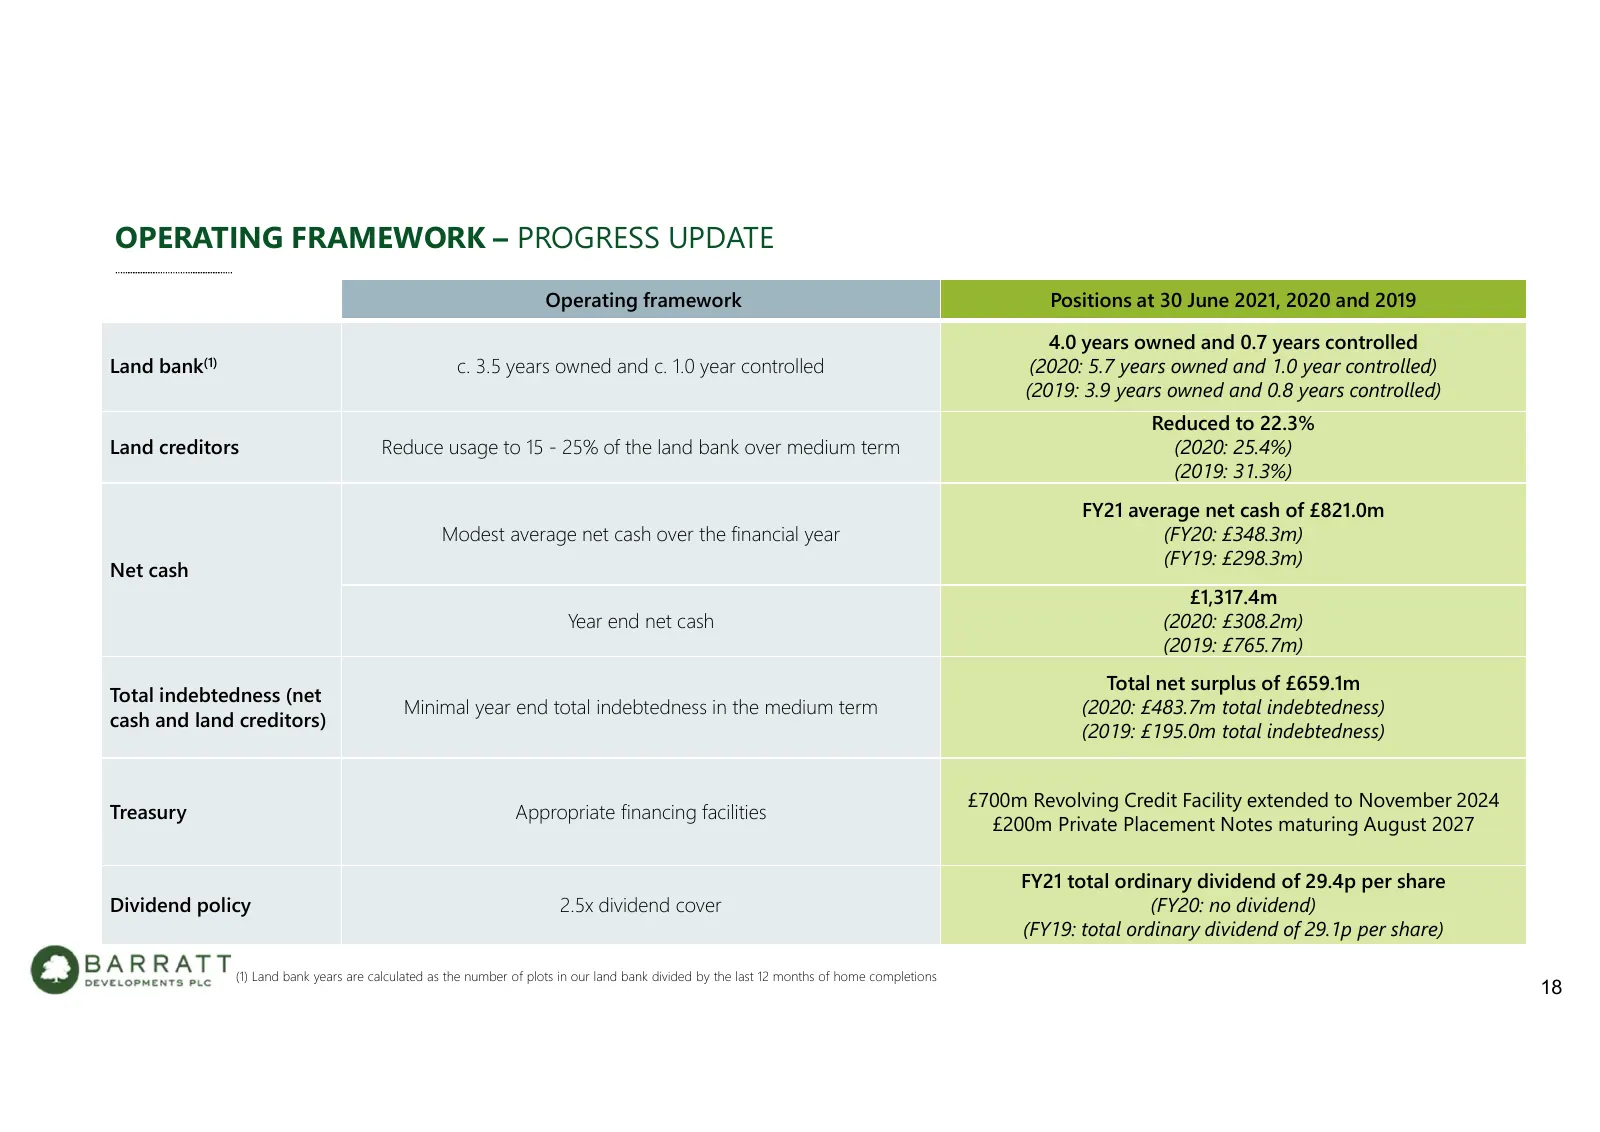
OPERATING FRAMEWORK – PROGRESS UPDATE Operating framework Positions at 30 June 2021, 2020 and 2019 4.0 years owned and 0.7 years controlled Land bank(1) c. 3.5 years owned and c. 1.0 year controlled (2020: 5.7 years owned and 1.0 year controlled) (2019: 3.9 years owned and 0.8 years controlled) Redu
Slide 19: Balance Sheet
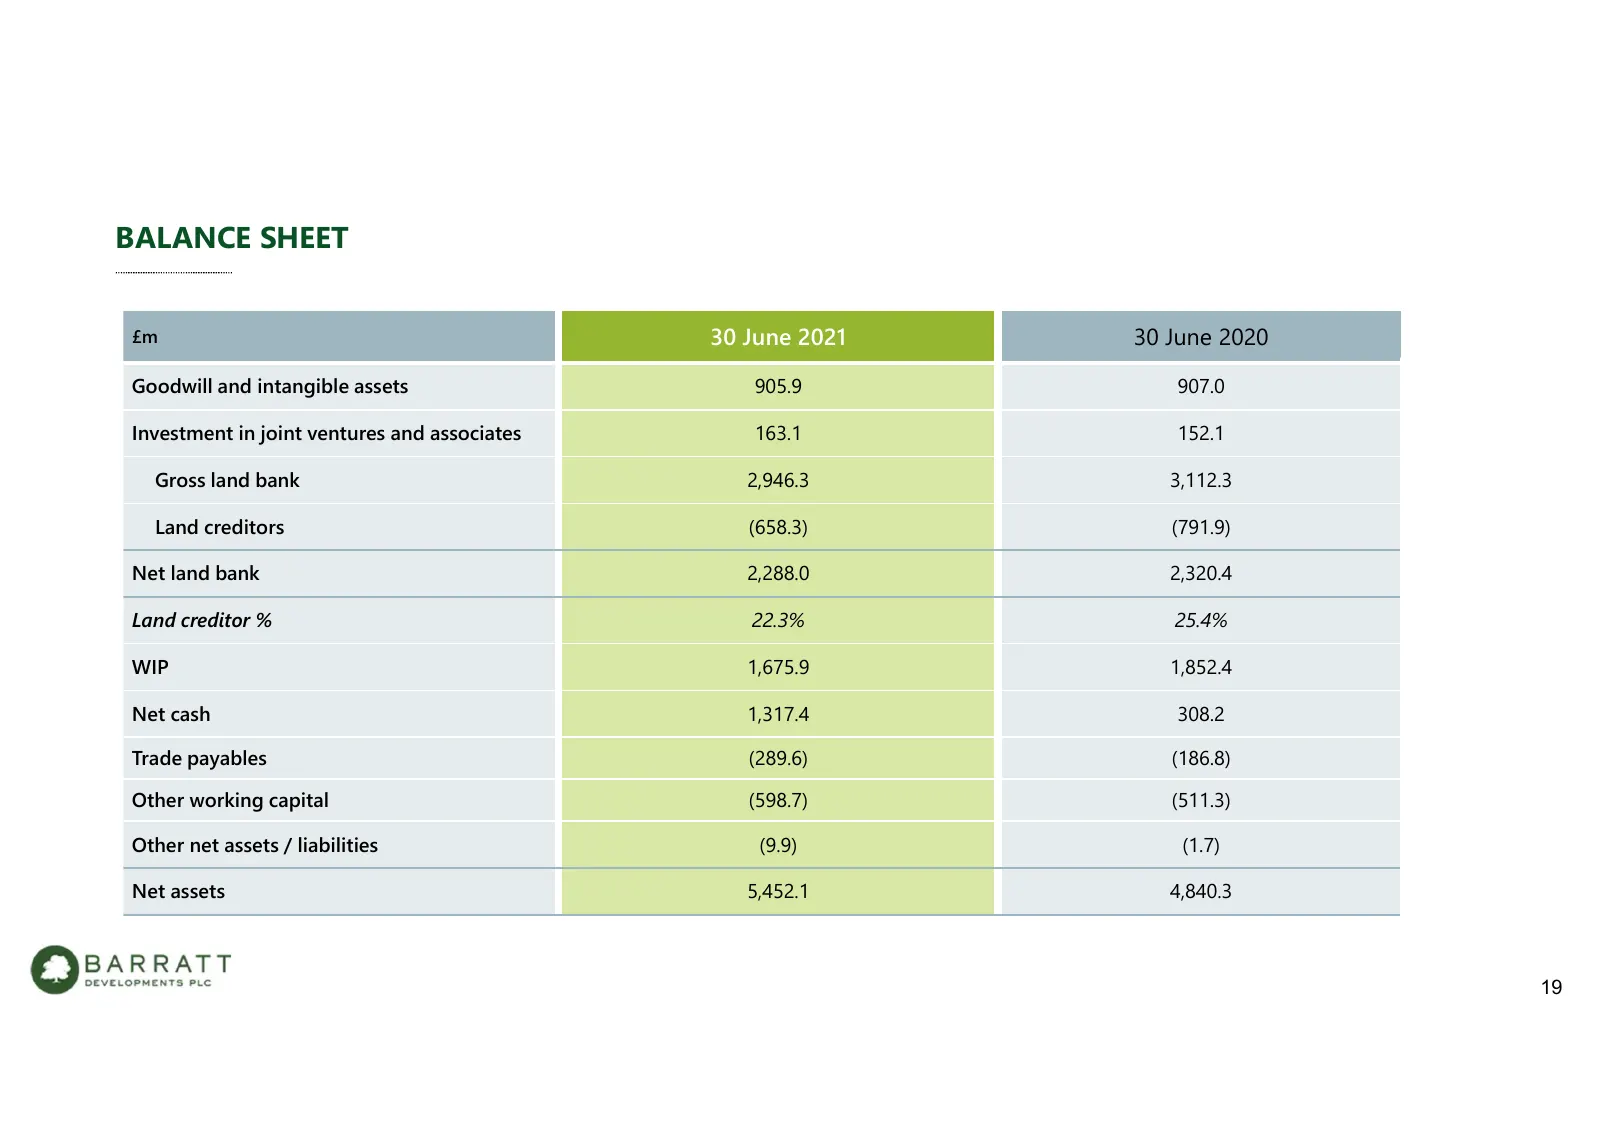
BALANCE SHEET £m 30 June 2021 30 June 2020 Goodwill and intangible assets 905.9 907.0 Investment in joint ventures and associates 163.1 152.1 Gross land bank 2,946.3 3,112.3 Land creditors (658.3) (791.9) Net land bank 2,288.0 2,320.4 Land creditor % 22.3% 25.4% WIP 1,675.9 1,852.4 Net cash 1,317.4
Slide 20: Cash Flow
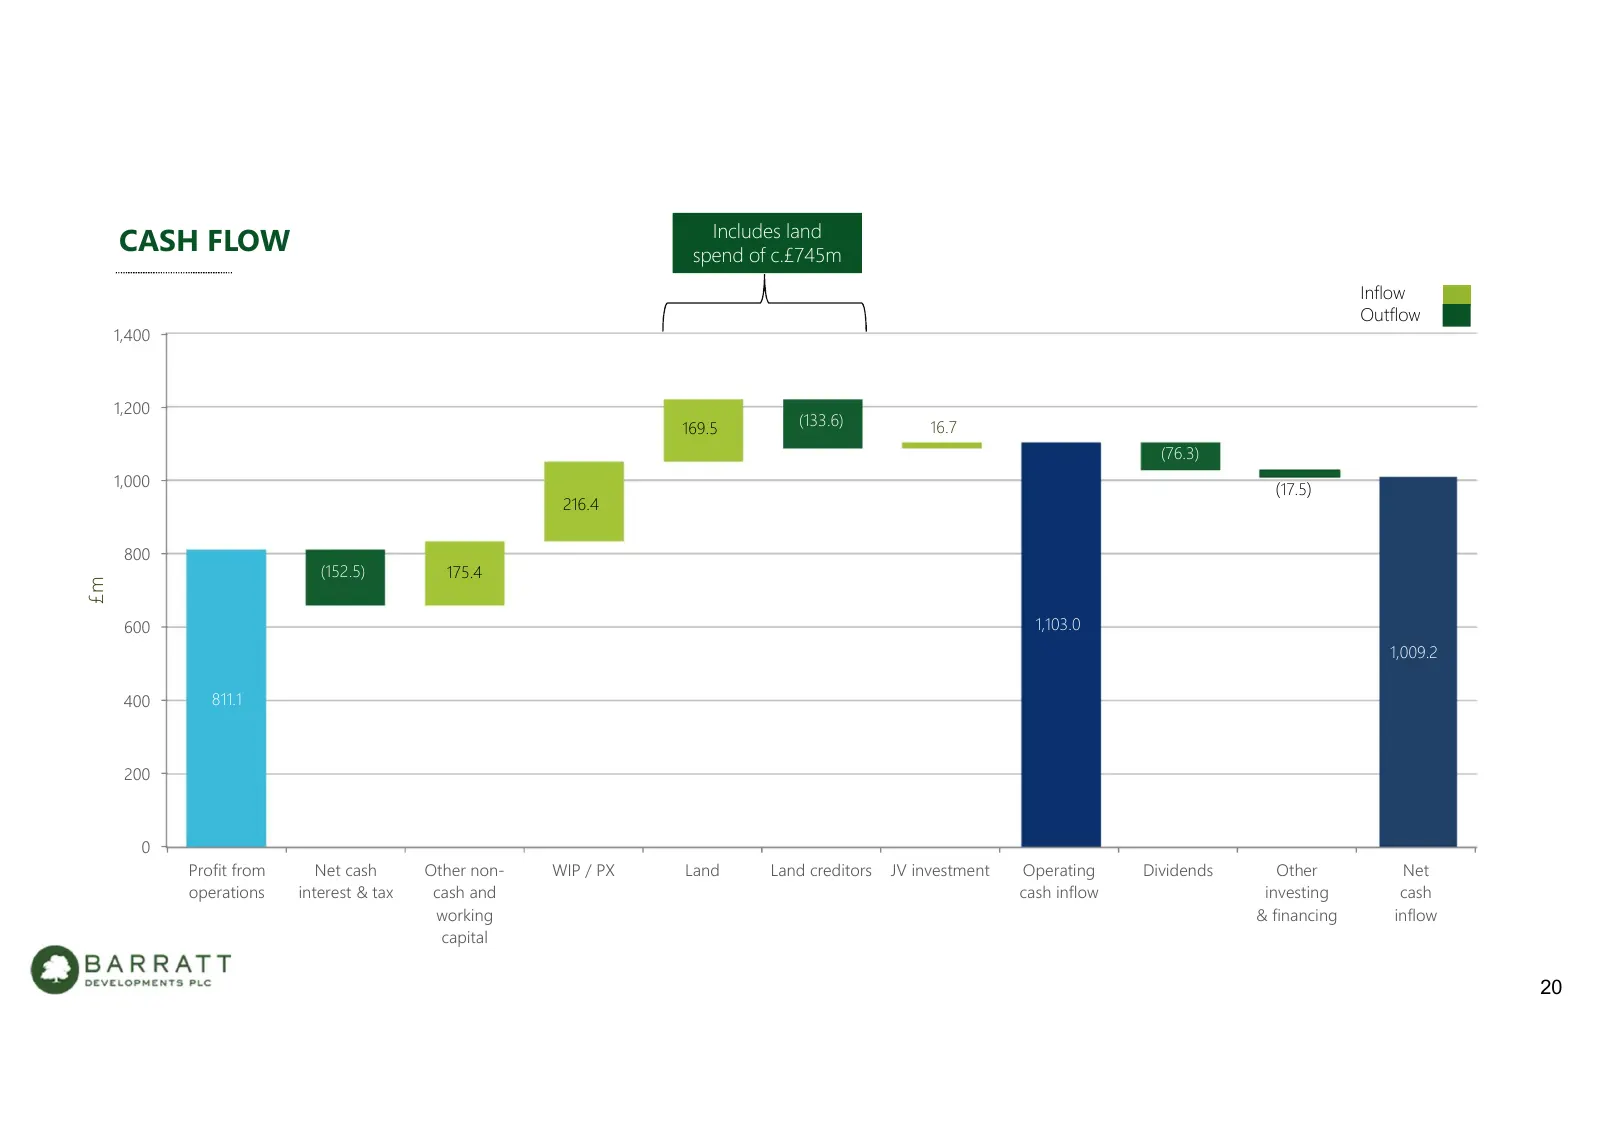
Includes land CASH FLOW spend of c.£745m Inflow Outflow 1,400 1,200 169.5 (133.6) 16.7 (76.3) 1,000 (17.5) 216.4 800 (152.5) 175.4 £m 600 1,103.0 1,009.2 400 811.1 200 0 Profit from Net cash Other non- WIP / PX Land Land creditors JV investment Operating Dividends Other Net operations interest & tax
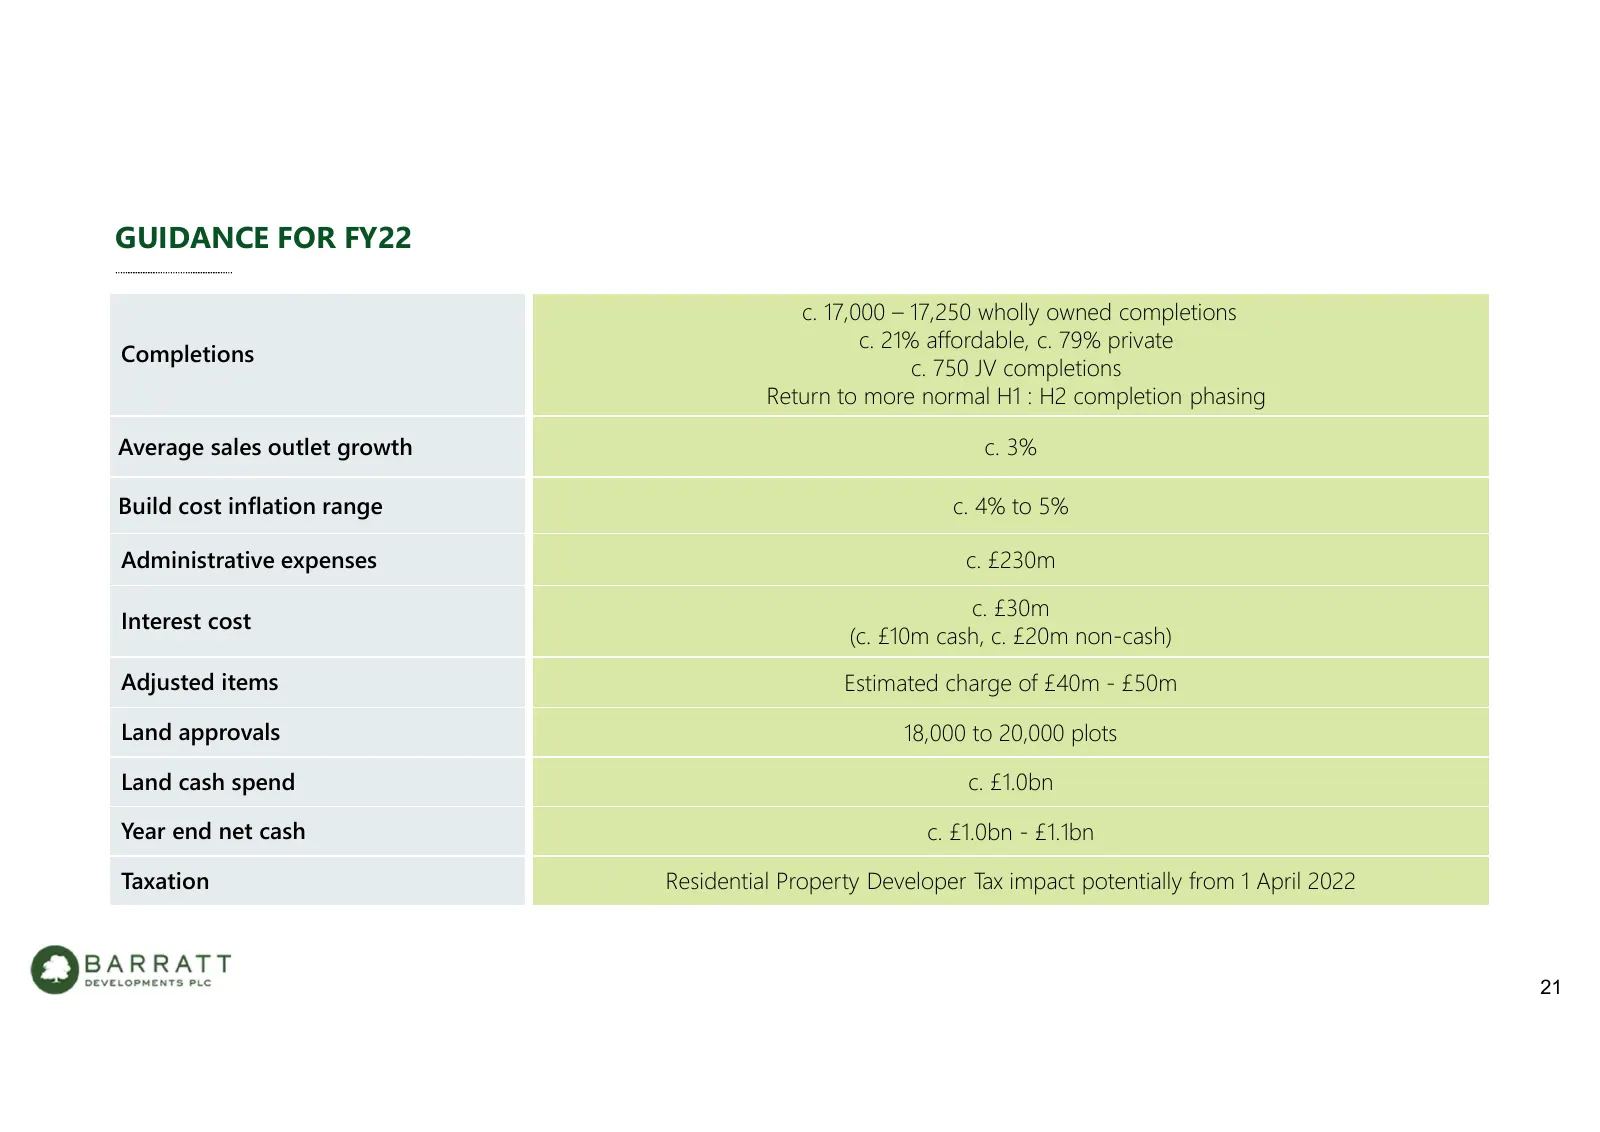
Slide 21: Guidance for FY22
GUIDANCE FOR FY22 c. 17,000 – 17,250 wholly owned completions c. 21% affordable, c. 79% private Completions c. 750 JV completions Return to more normal H1 : H2 completion phasing Average sales outlet growth c. 3% Build cost inflation range c. 4% to 5% Administrative expenses c. £230m c. £30m Interes
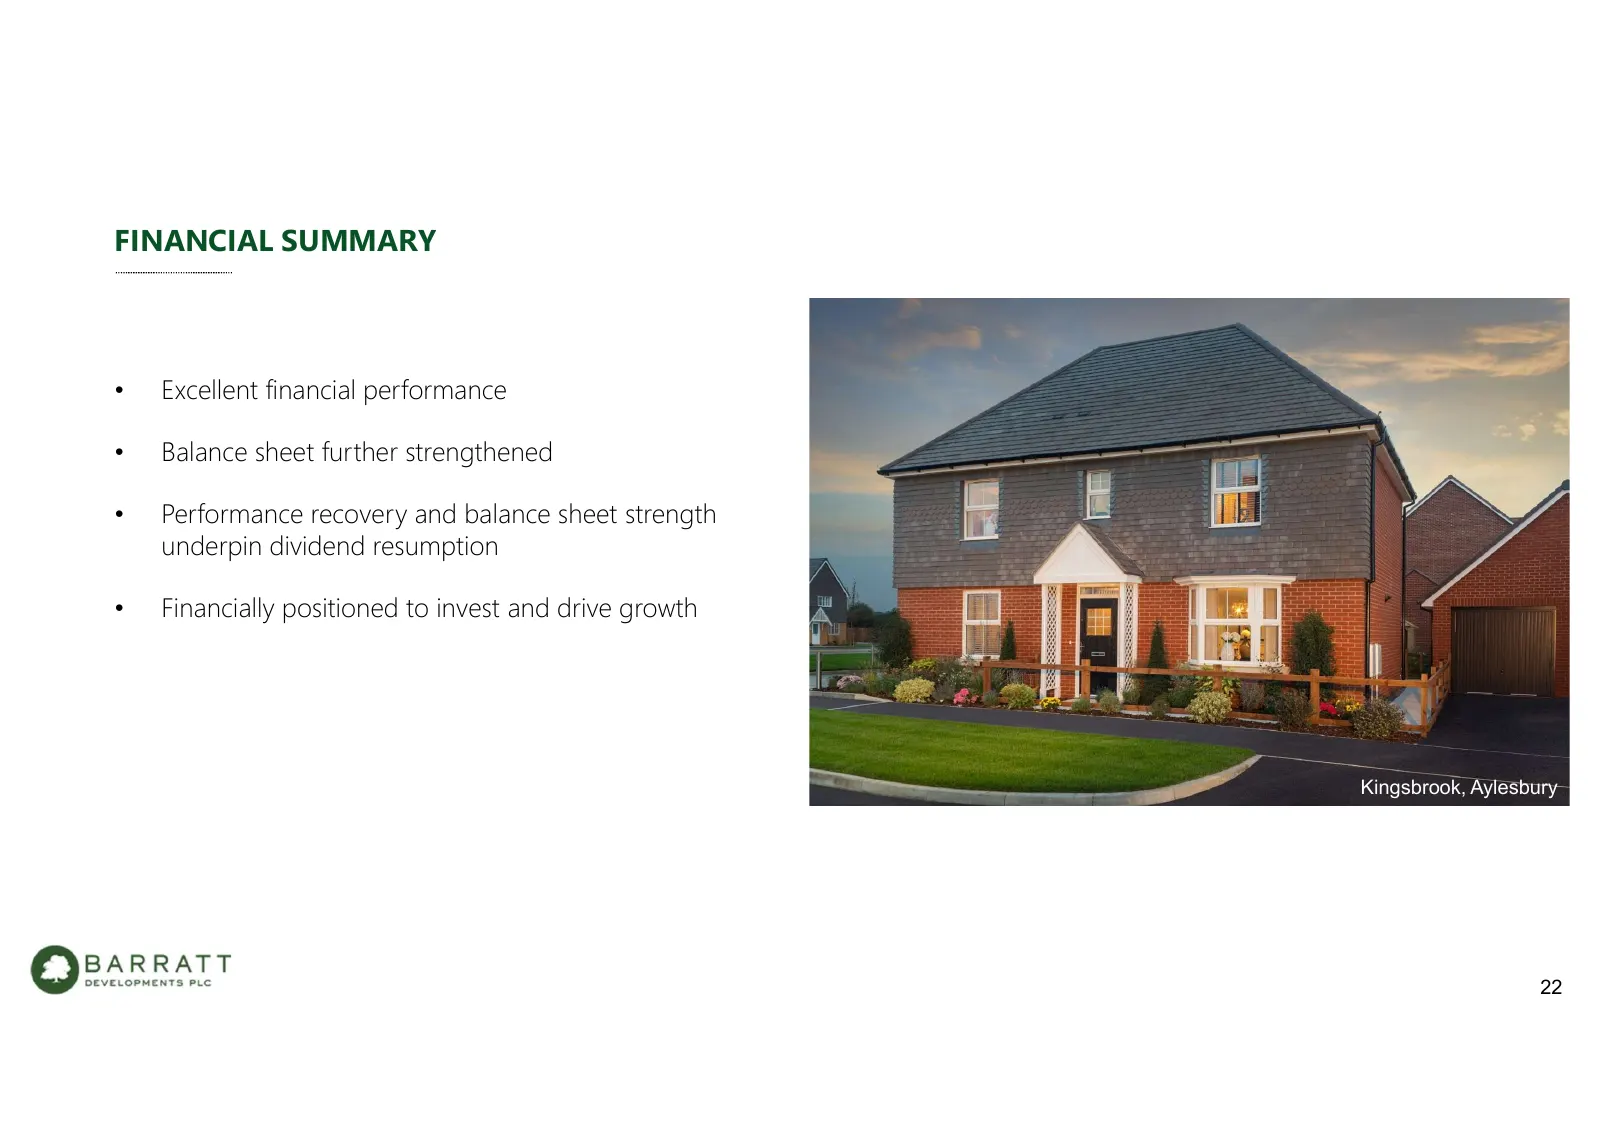
Slide 22: Financial Summary
FINANCIAL SUMMARY • Excellent financial performance • Balance sheet further strengthened • Performance recovery and balance sheet strength underpin dividend resumption • Financially positioned to invest and drive growth Kingsbrook, Aylesbury 22
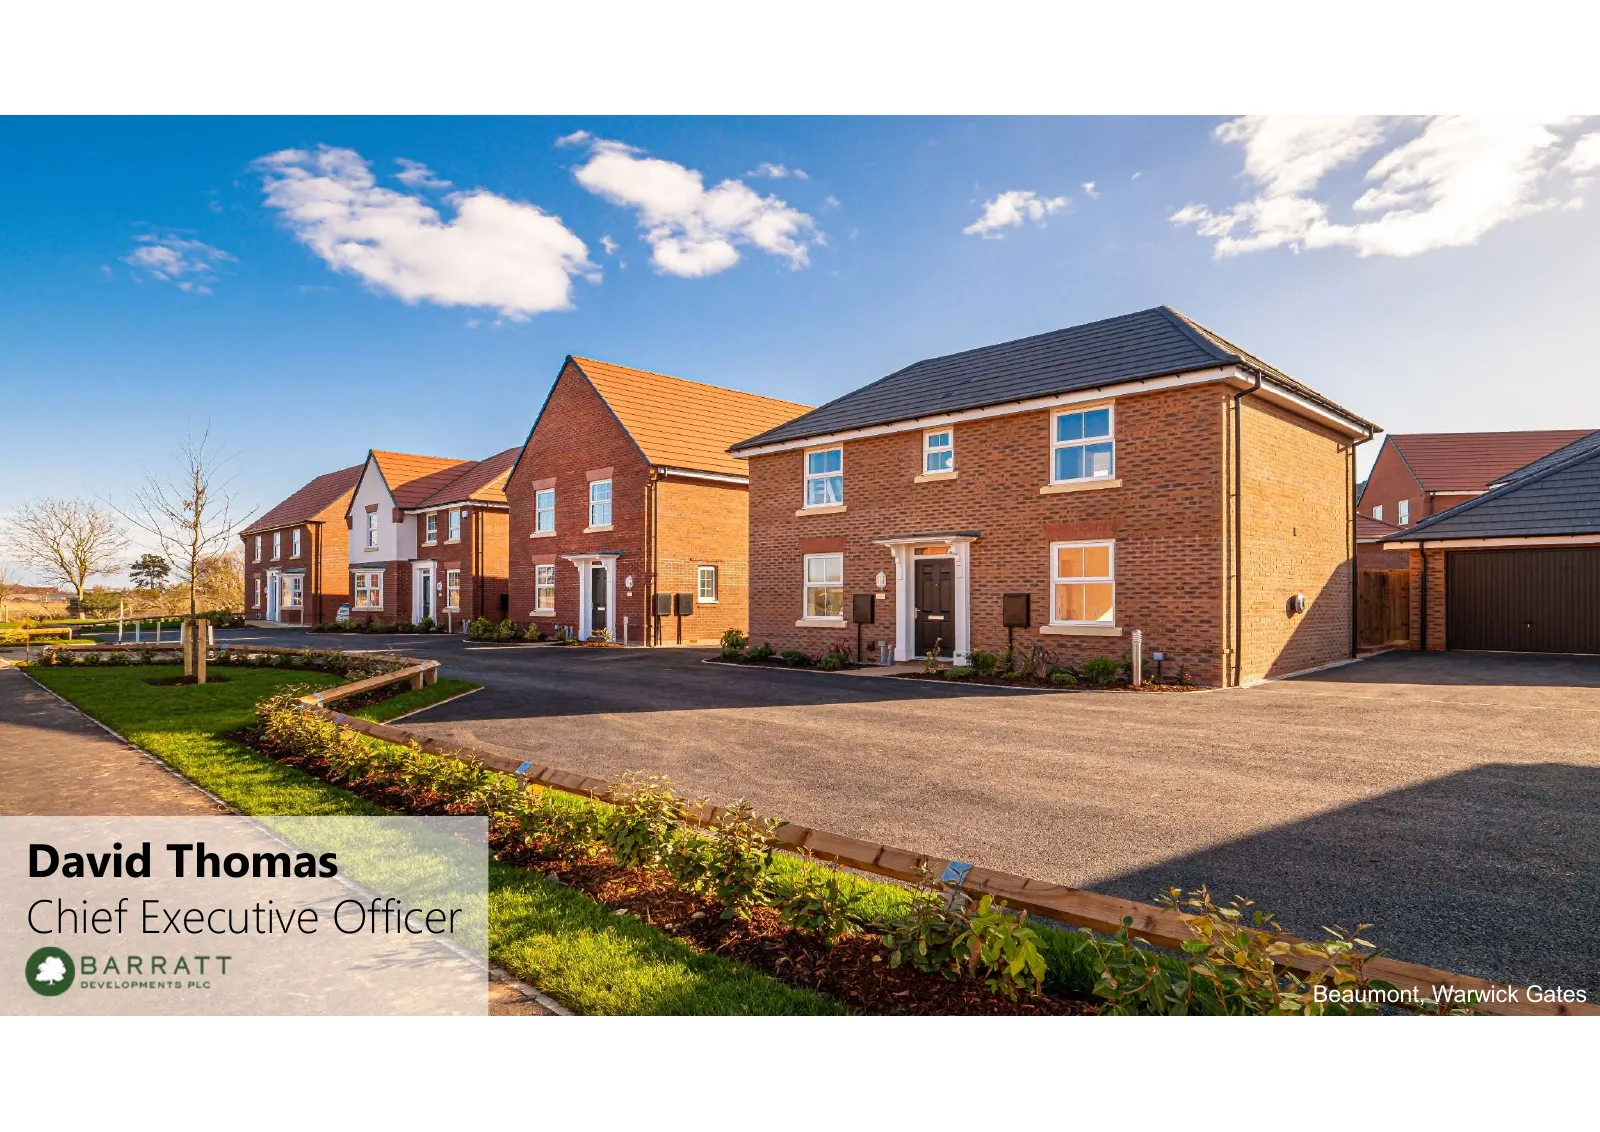
Slide 23: David Thomas, Chief Executive Officer
David Thomas Chief Executive Officer 23 Beaumont, Warwick Gates
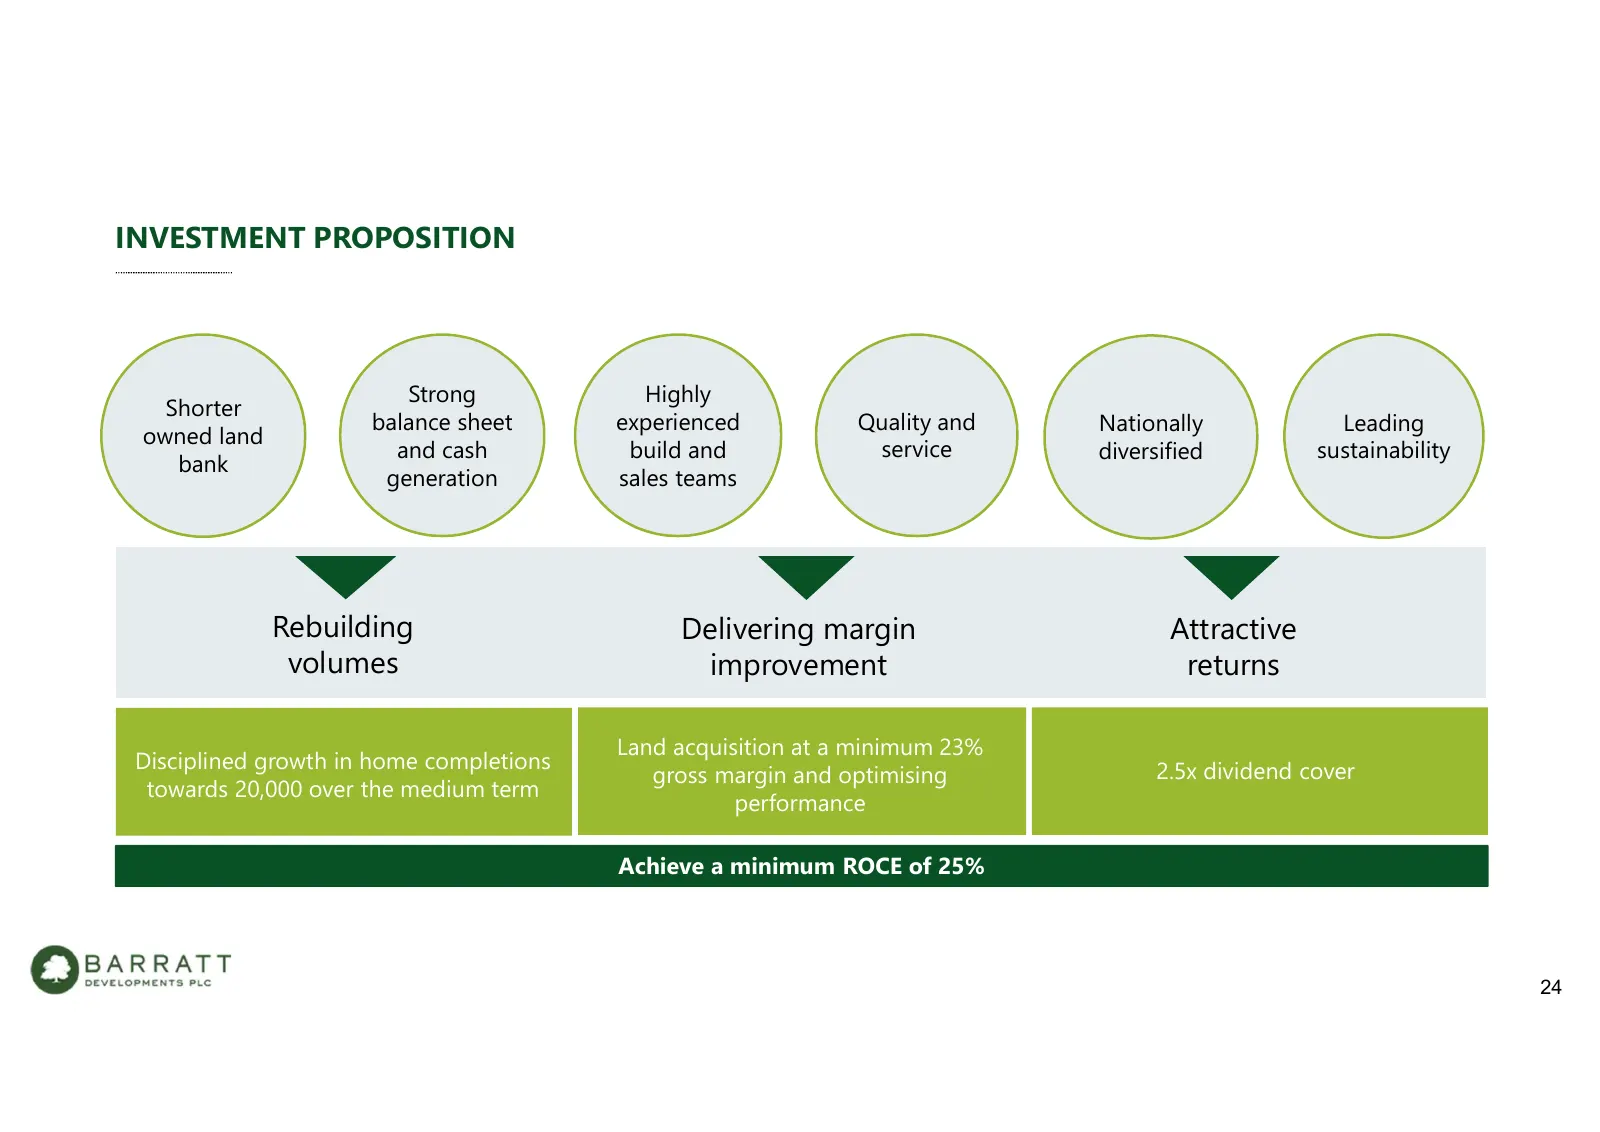
Slide 24: Investment Proposition
INVESTMENT PROPOSITION Strong Highly Shorter balance sheet experienced Quality and Nationally Leading owned land and cash build and service diversified sustainability bank generation sales teams Rebuilding Delivering margin Attractive volumes improvement returns Land acquisition at a minimum 23% Dis
Slide 25: Market Fundamentals
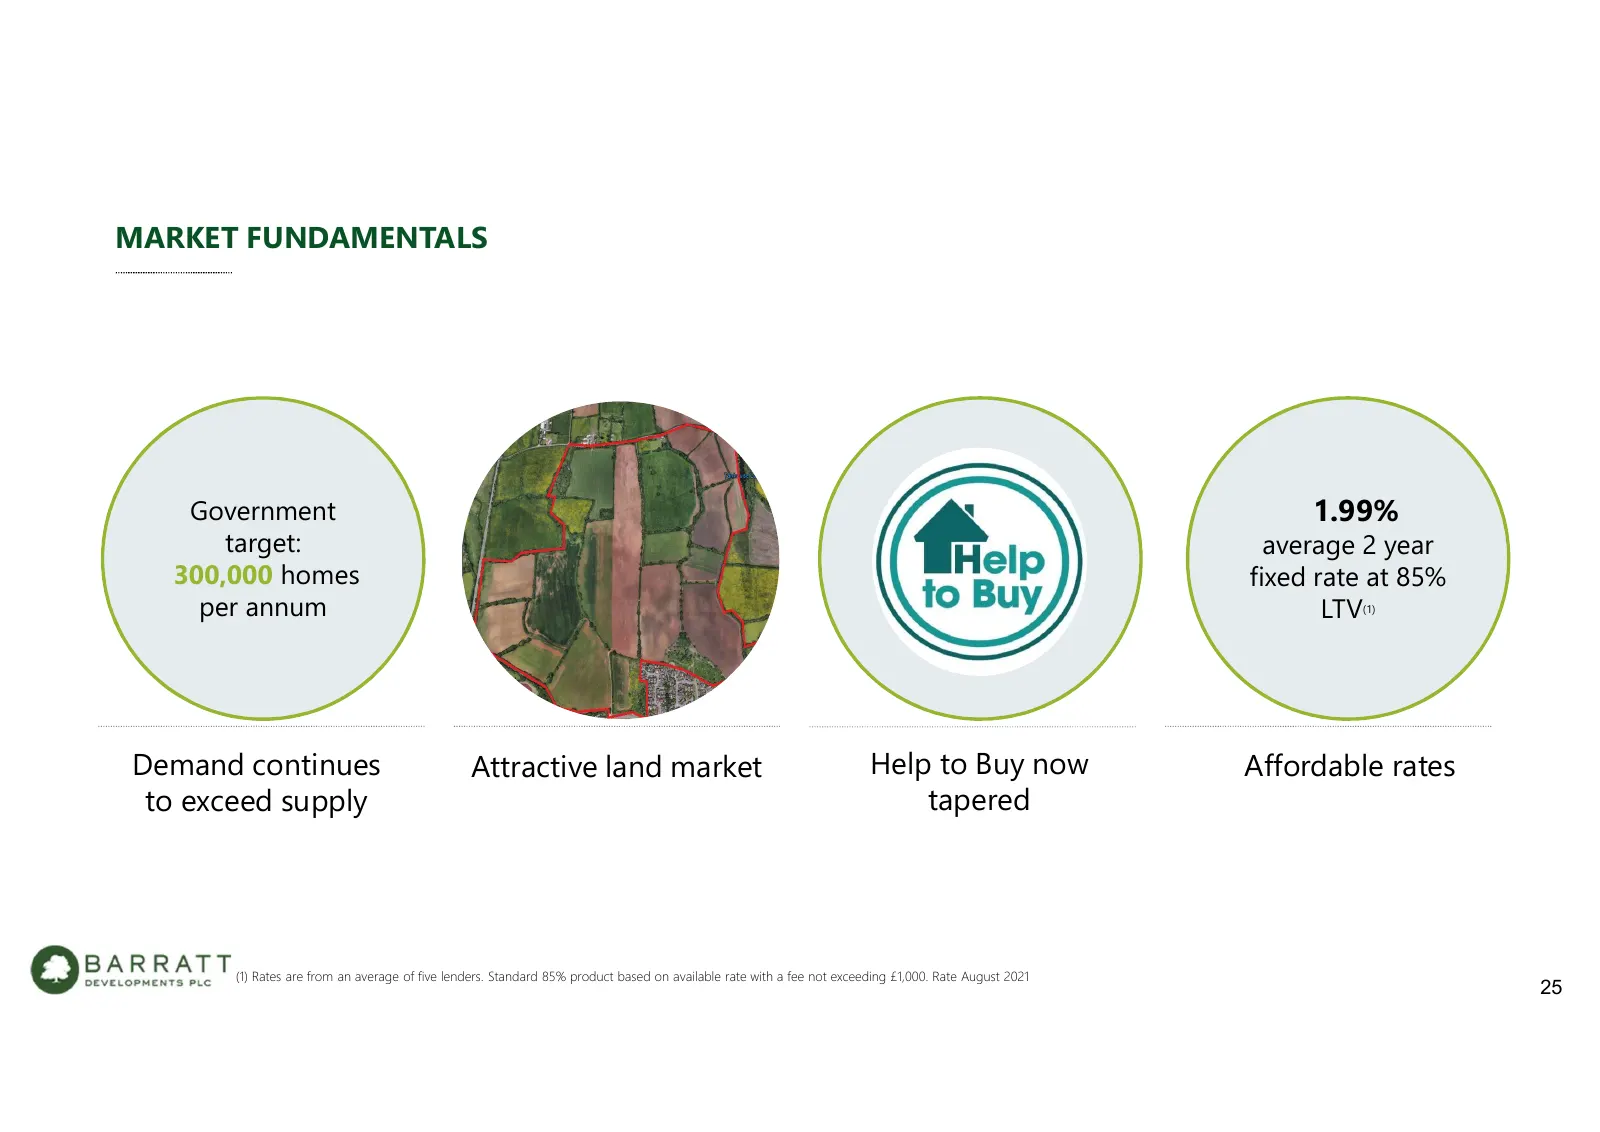
MARKET FUNDAMENTALS Government 1.99% target: average 2 year 300,000 homes fixed rate at 85% per annum LTV(1) Demand continues Attractive land market Help to Buy now Affordable rates to exceed supply tapered (1) Rates are from an average of five lenders. Standard 85% product based on available rate w
Slide 26: Planning and the UK Land Market
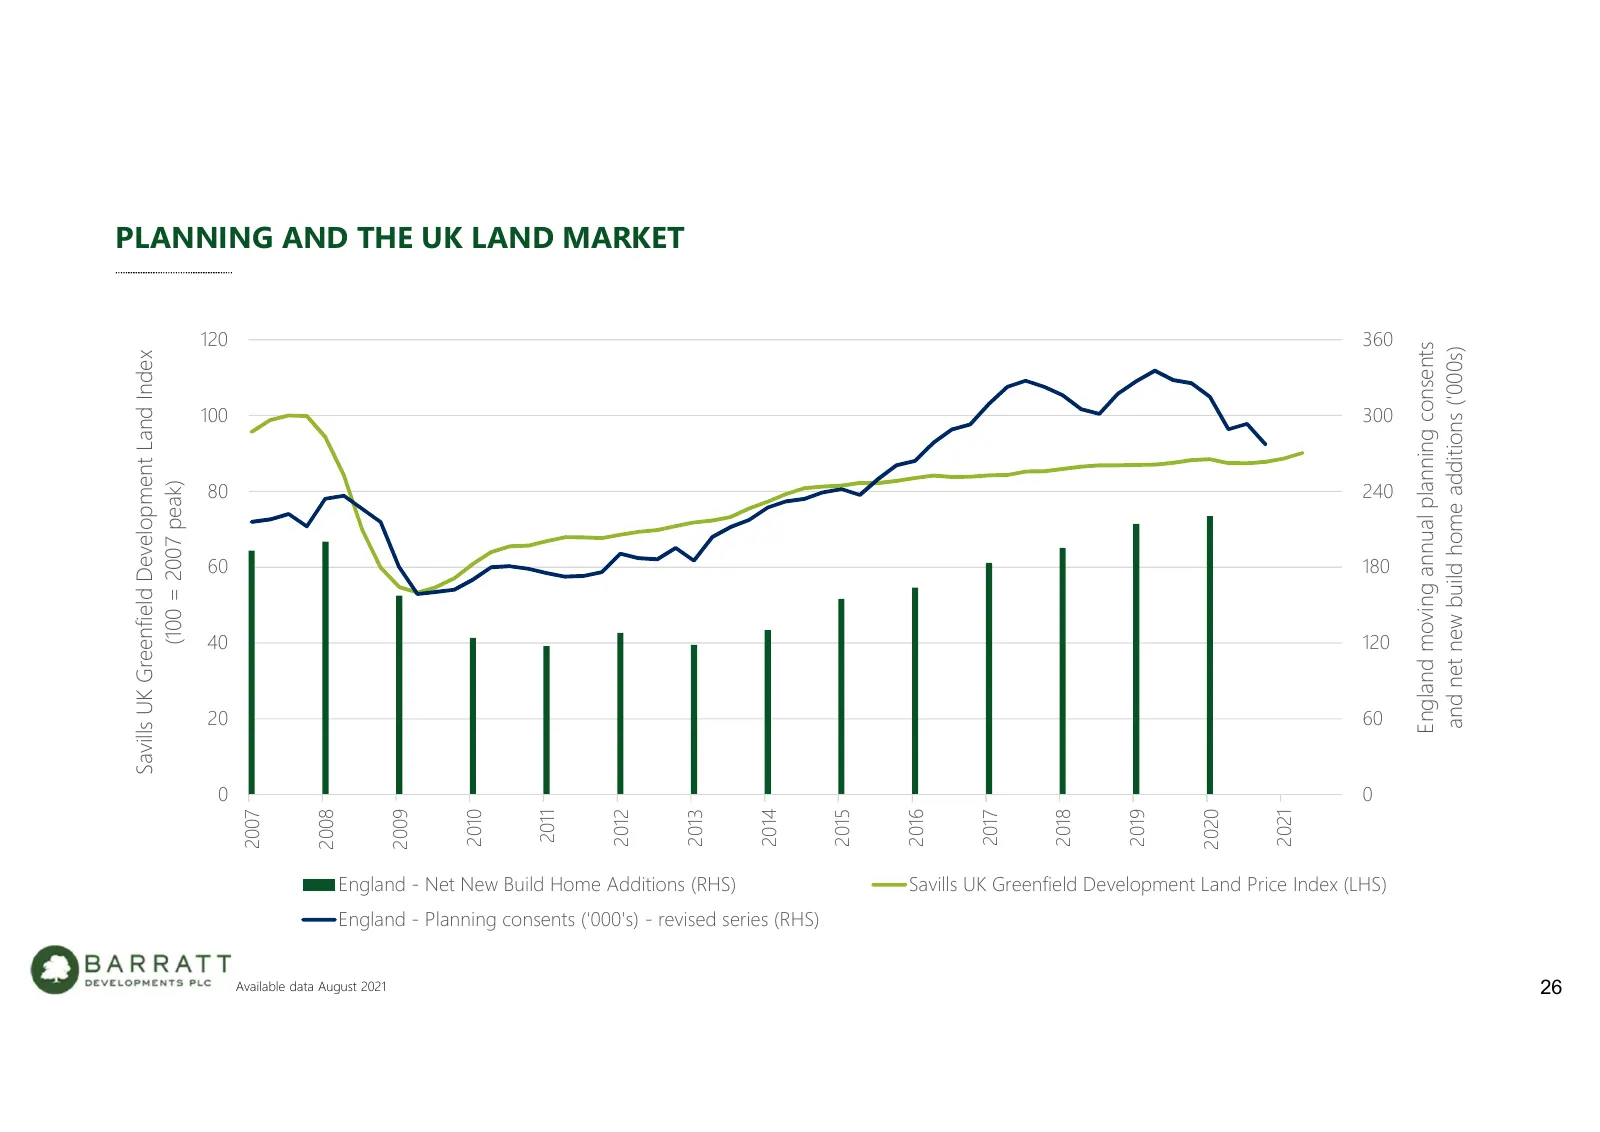
PLANNING AND THE UK LAND MARKET 120 360 England moving annual planning consents and net new build home additions ('000s) Savills UK Greenfield Development Land Index 100 300 80 240 (100 = 2007 peak) 60 180 40 120 20 60 0 0 2008 2009 2020 2007 2017 2014 2011 2021 2010 2012 2013 2015 2016 2018 2019 En
Slide 27: Mortgage Affordability
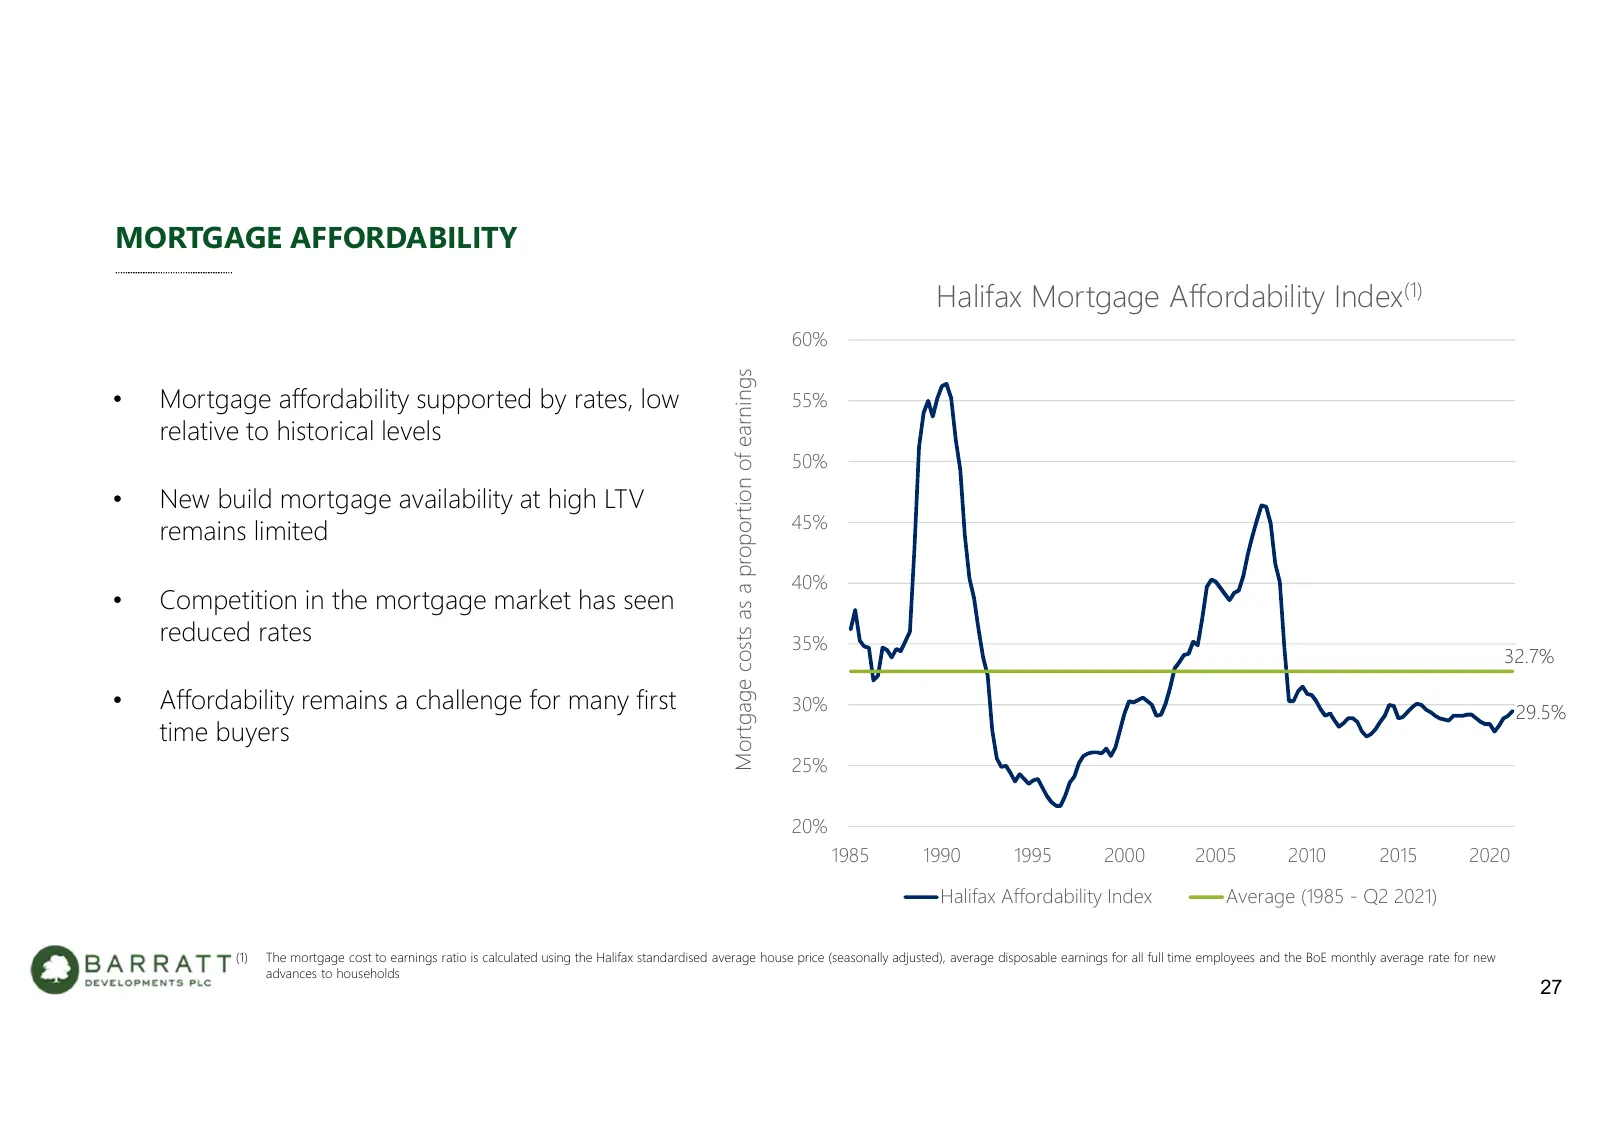
MORTGAGE AFFORDABILITY Halifax Mortgage Affordability Index(1) 60% Mortgage costs as a proportion of earnings • Mortgage affordability supported by rates, low 55% relative to historical levels 50% • New build mortgage availability at high LTV 45% remains limited 40% • Competition in the mortgage mar
Slide 28: Sustainability – Our Carbon Footprint
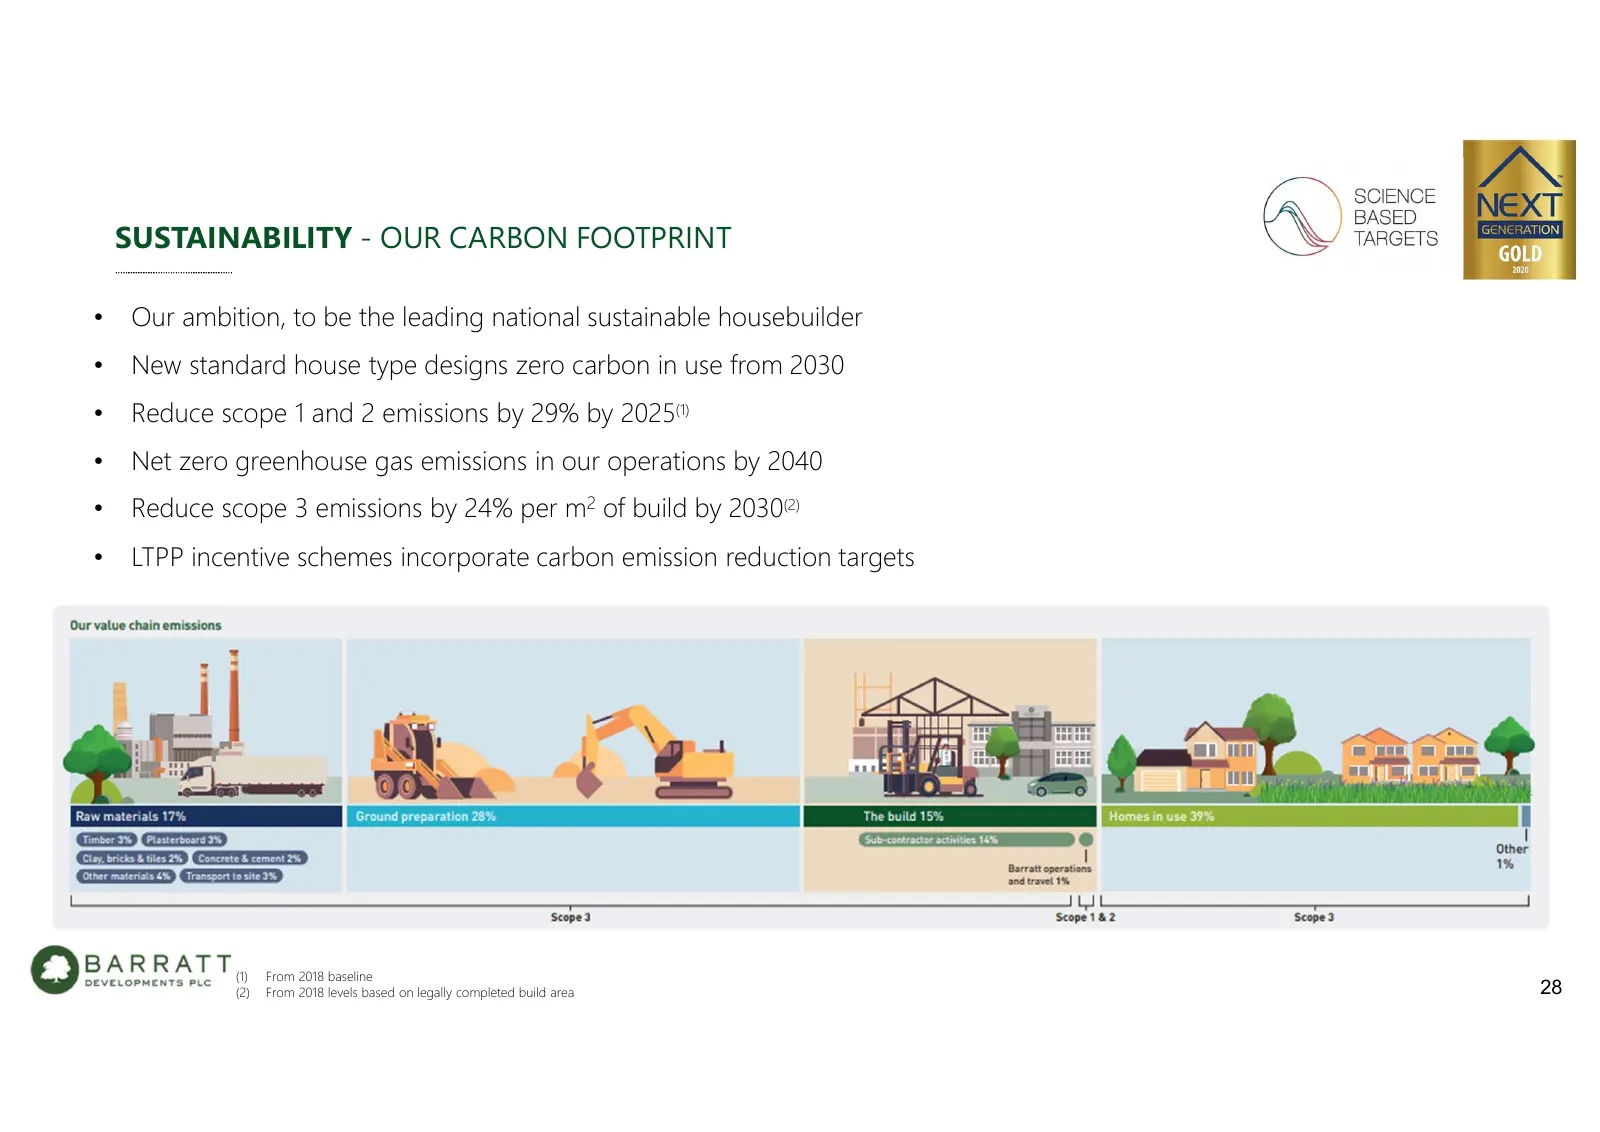
SUSTAINABILITY - OUR CARBON FOOTPRINT • Our ambition, to be the leading national sustainable housebuilder • New standard house type designs zero carbon in use from 2030 • Reduce scope 1 and 2 emissions by 29% by 2025(1) • Net zero greenhouse gas emissions in our operations by 2040 • Reduce scope 3 e
Slide 29: Sustainability – Waste, Future Homes Standard and Biodiversity Net Gain
SUSTAINABILITY – WASTE, THE FUTURE HOMES STANDARD AND BIODIVERSITY NET GAIN • Waste intensity reduction a FY22 priority - Action plans in place and delivering - Waste intensity reduction incorporated in the FY22 annual bonus scheme • The Future Homes Standard - Effective 1 June 2022 (transition peri
Slide 30: Current Trading
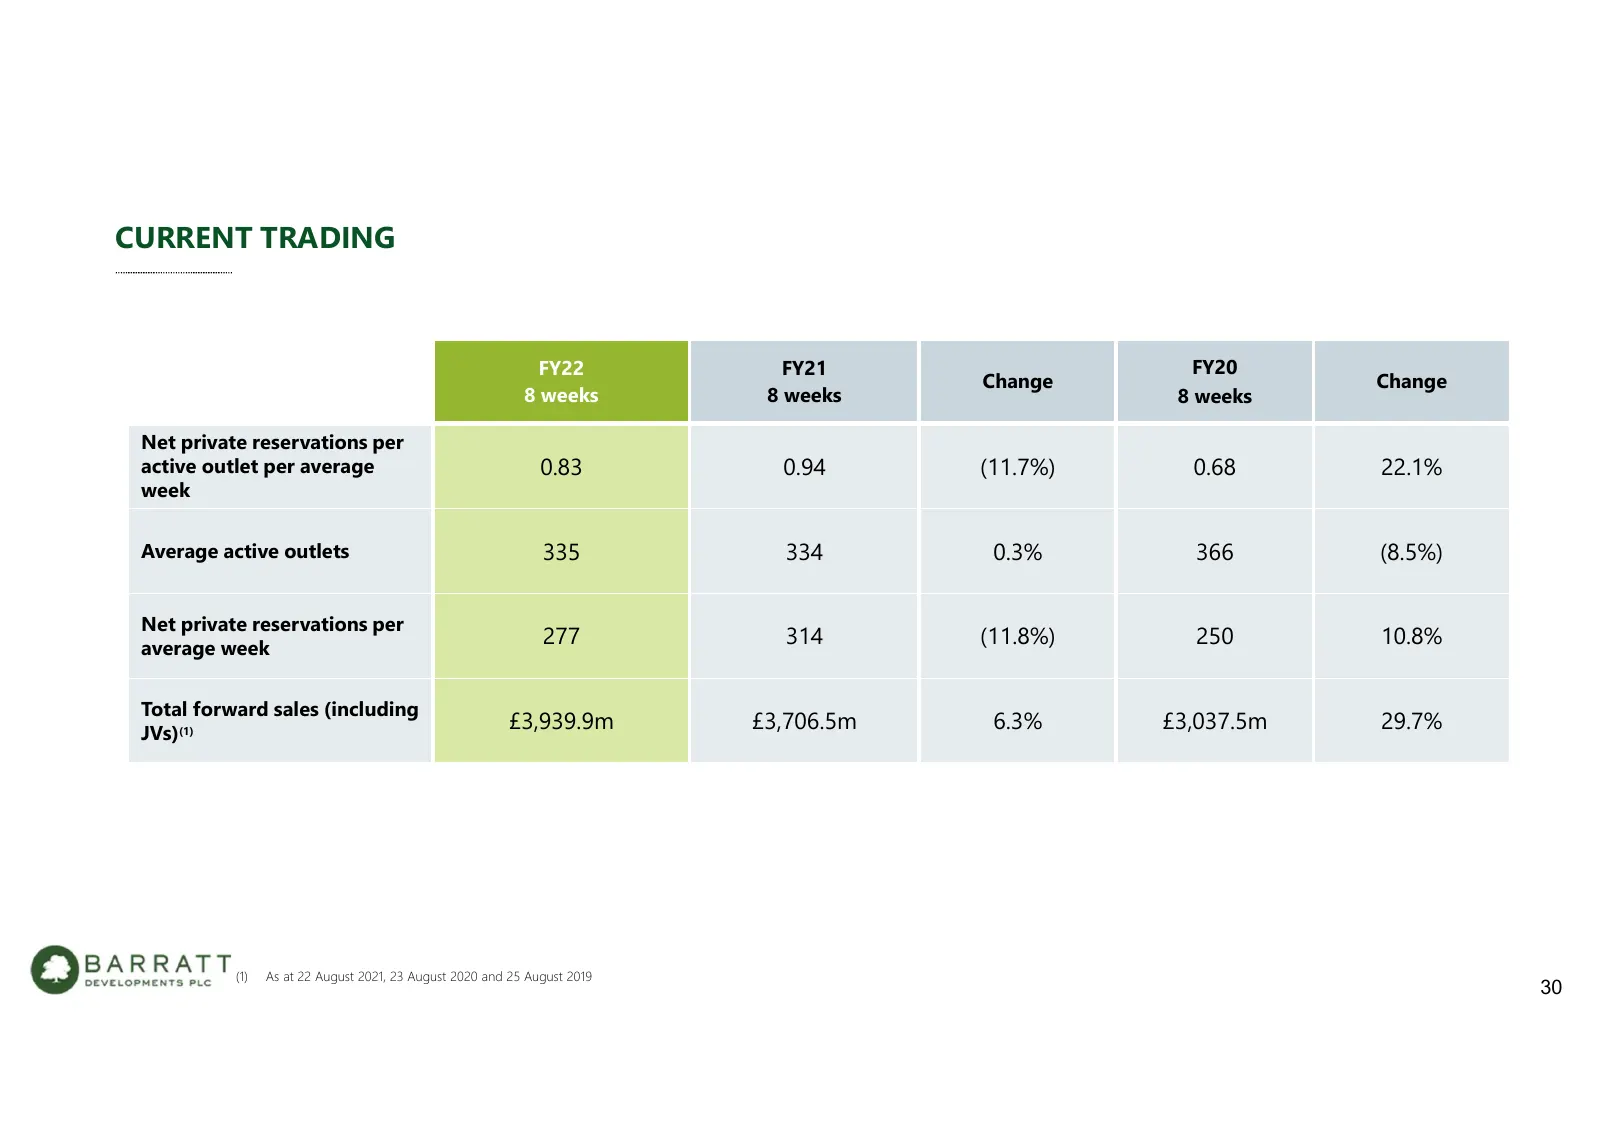
CURRENT TRADING FY22 FY21 FY20 Change Change 8 weeks 8 weeks 8 weeks Net private reservations per active outlet per average 0.83 0.94 (11.7%) 0.68 22.1% week Average active outlets 335 334 0.3% 366 (8.5%) Net private reservations per average week 277 314 (11.8%) 250 10.8% Total forward sales (includ
Slide 31: Conclusion
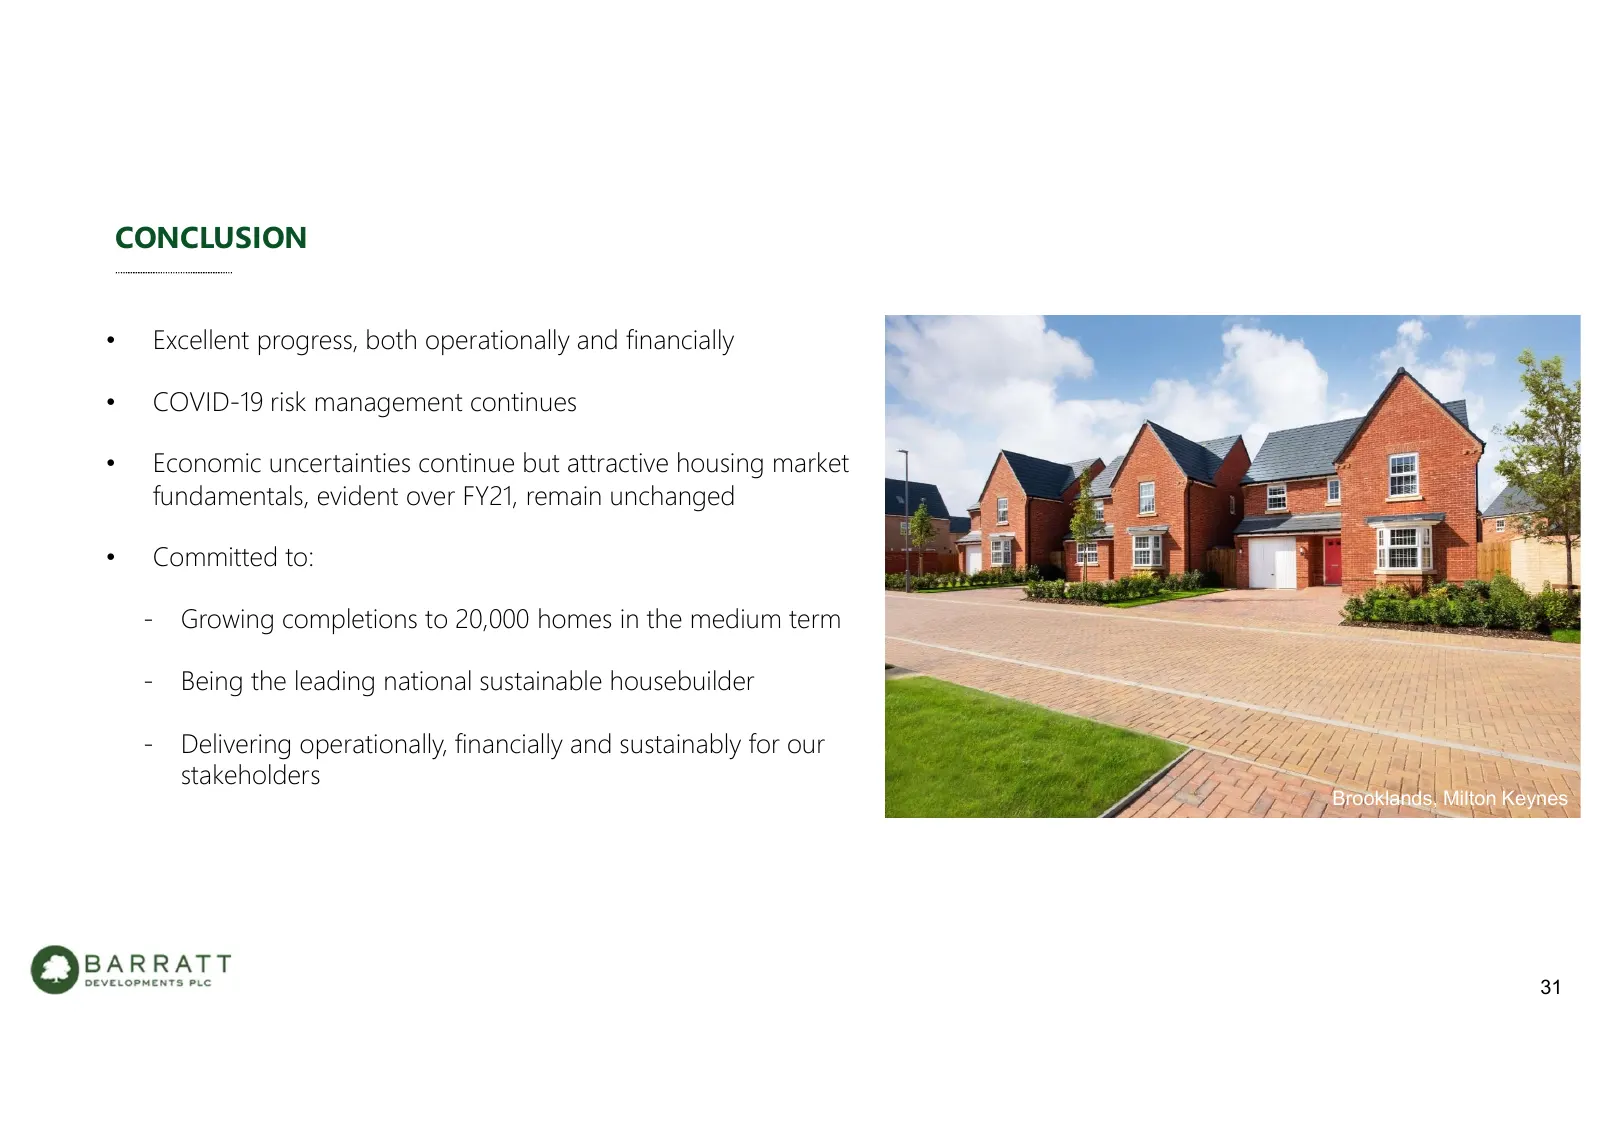
CONCLUSION • Excellent progress, both operationally and financially • COVID-19 risk management continues • Economic uncertainties continue but attractive housing market fundamentals, evident over FY21, remain unchanged • Committed to: - Growing completions to 20,000 homes in the medium term - Being
Slide 32: Q&A
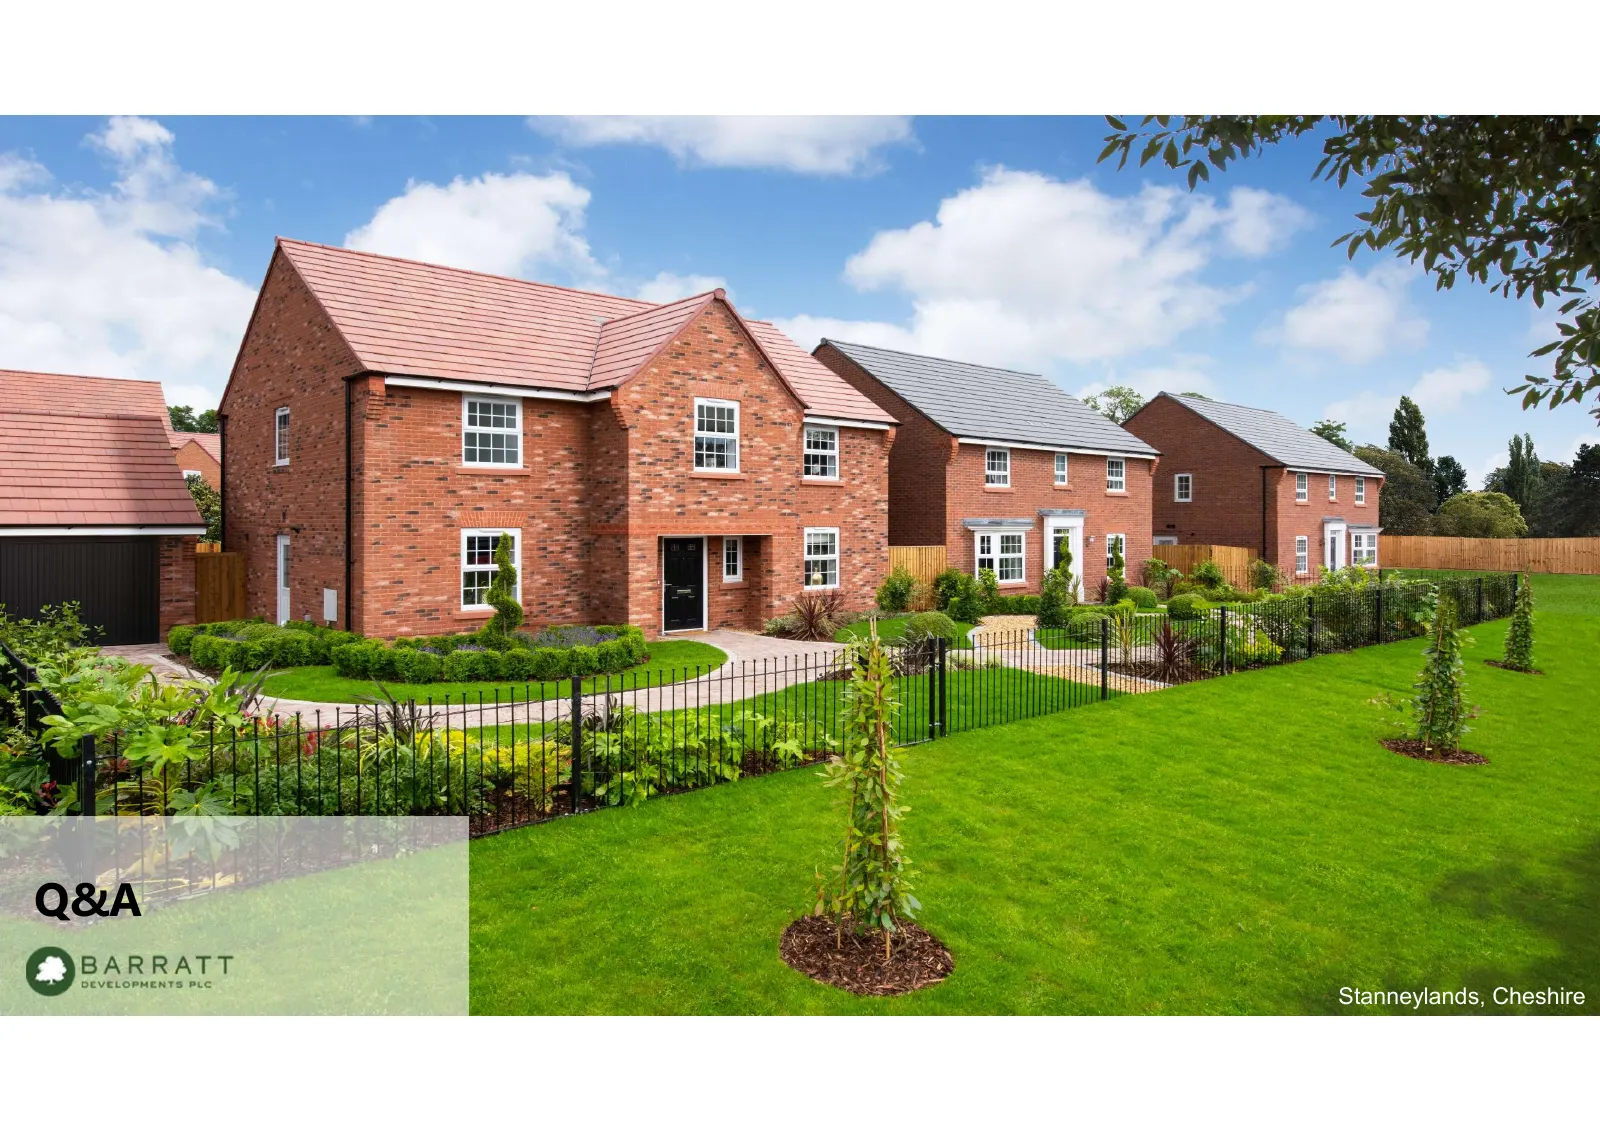
Q&A 32 Stanneylands, Cheshire
Slide 33: Appendices – Index
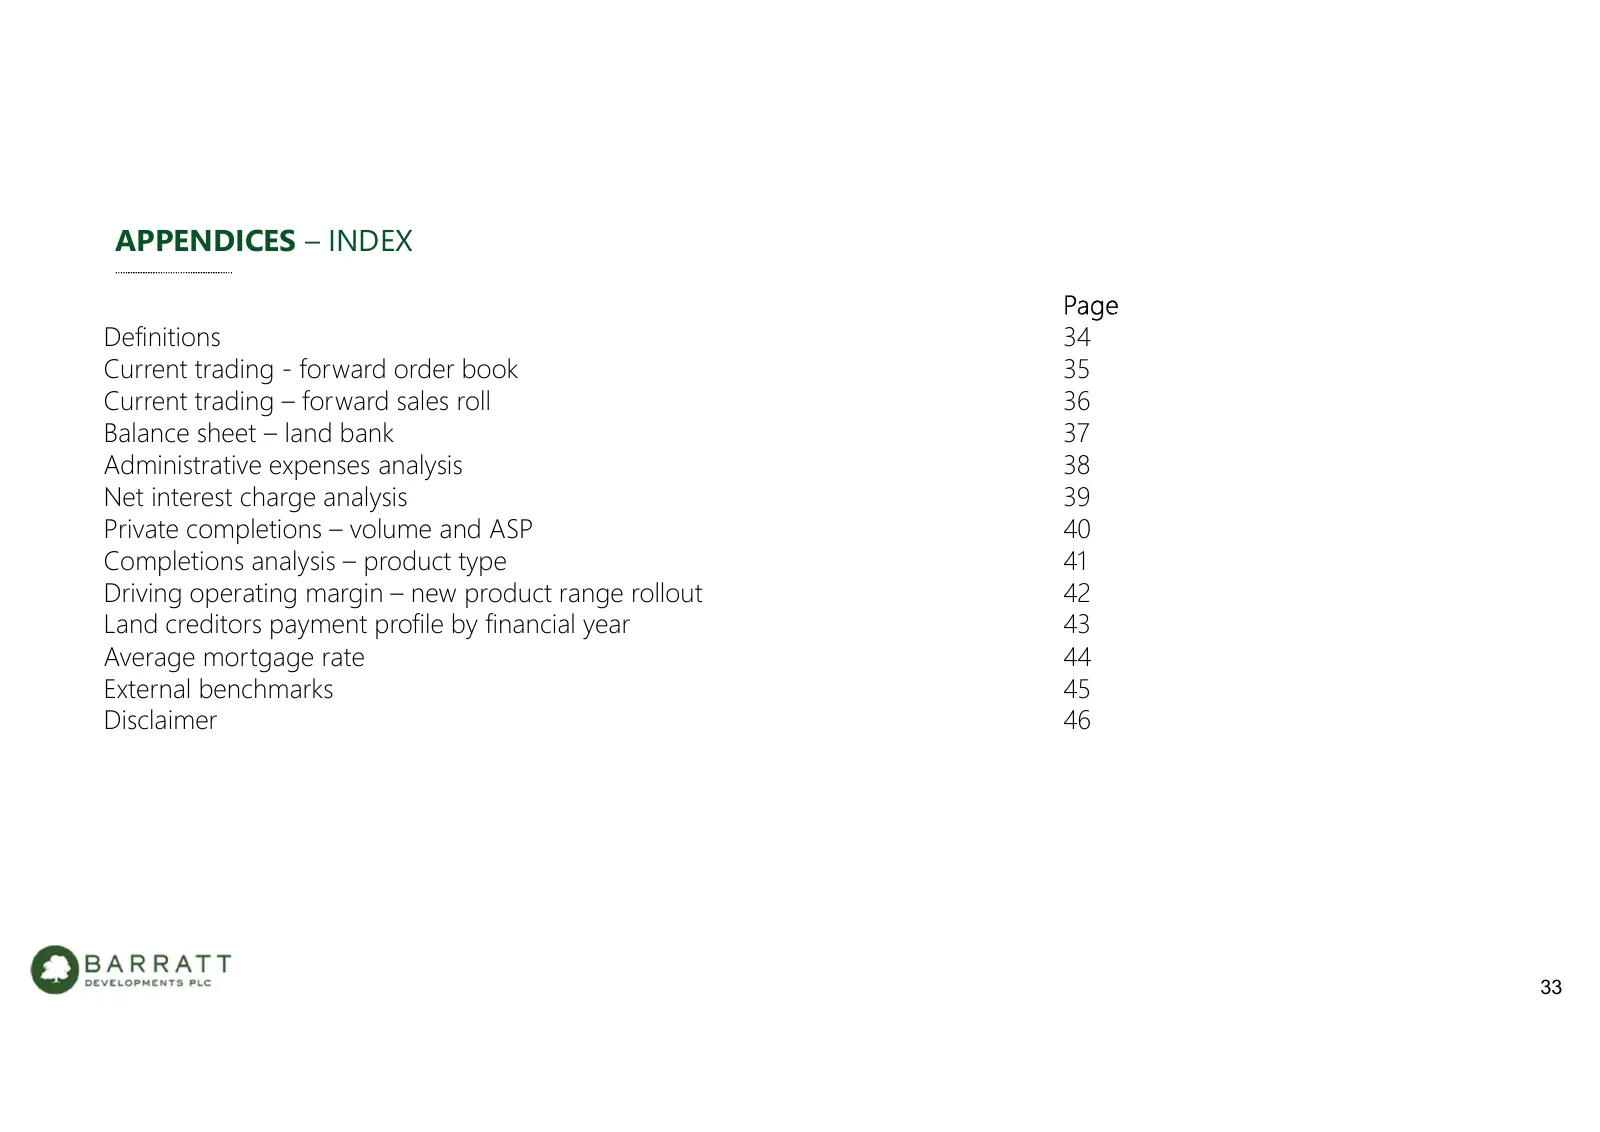
APPENDICES – INDEX Page Definitions 34 Current trading - forward order book 35 Current trading – forward sales roll 36 Balance sheet – land bank 37 Administrative expenses analysis 38 Net interest charge analysis 39 Private completions – volume and ASP 40 Completions analysis – product type 41 Drivi
Slide 34: Definitions
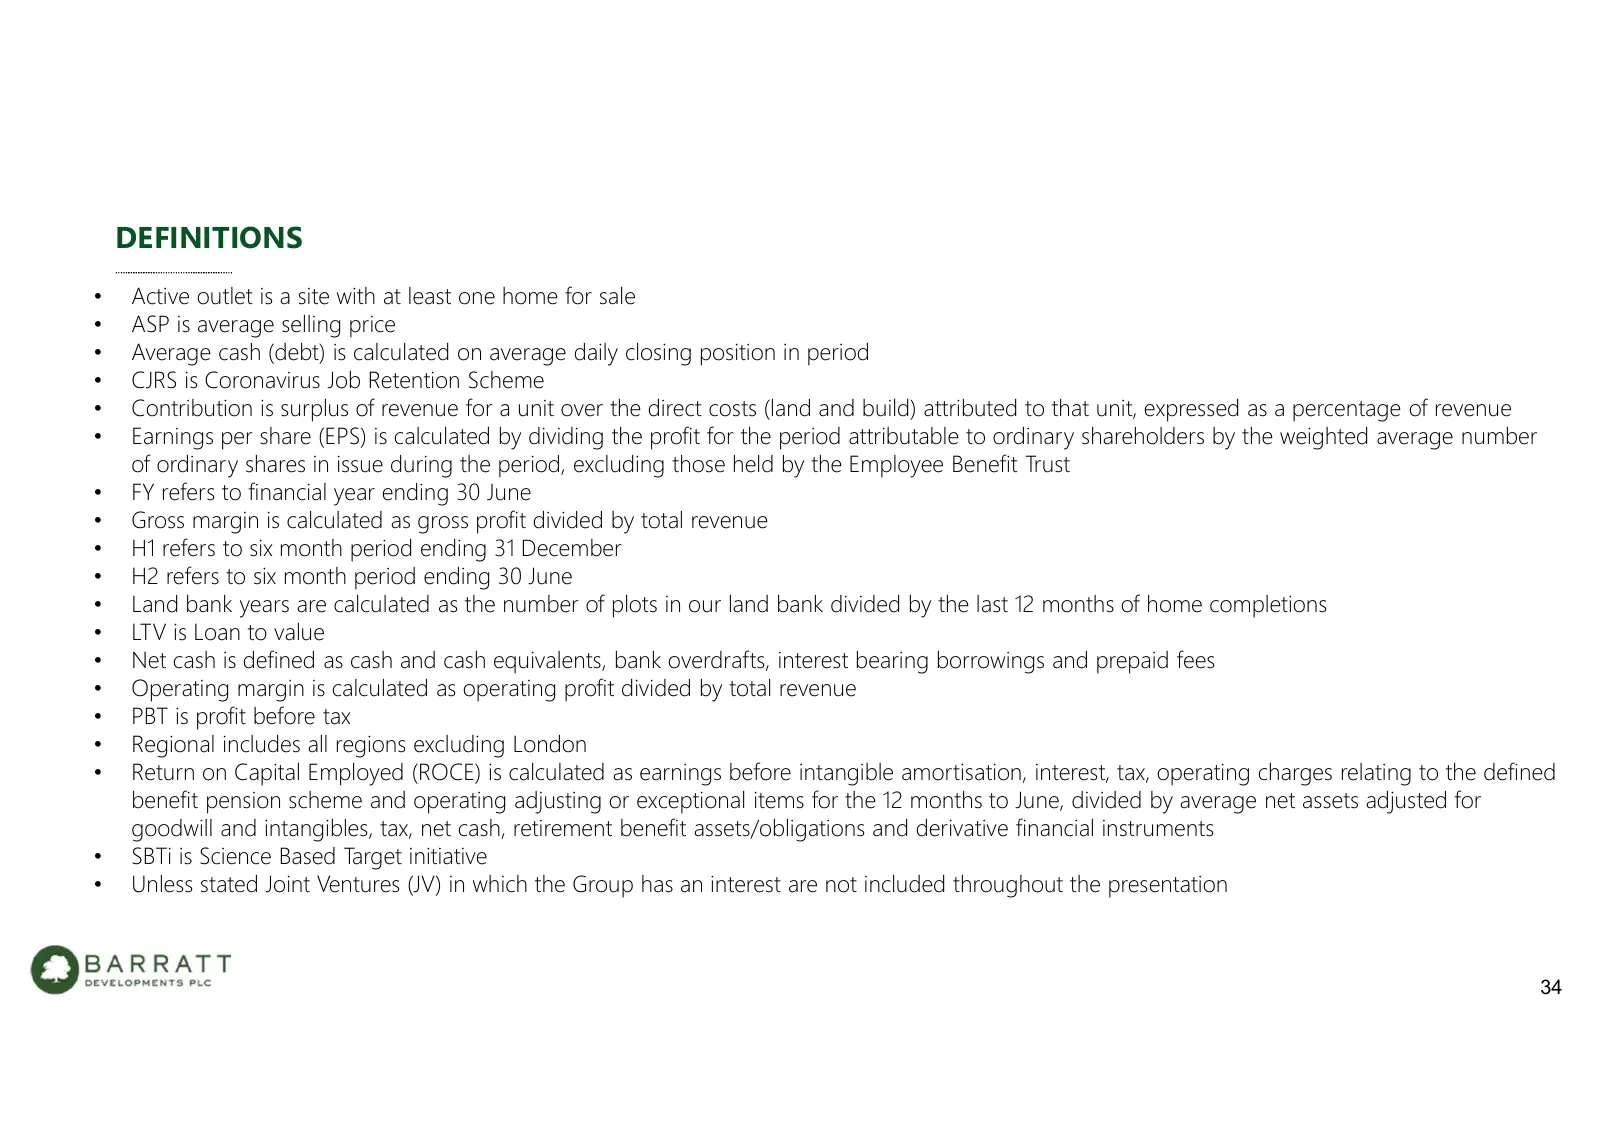
DEFINITIONS • Active outlet is a site with at least one home for sale • ASP is average selling price • Average cash (debt) is calculated on average daily closing position in period • CJRS is Coronavirus Job Retention Scheme • Contribution is surplus of revenue for a unit over the direct costs (land
Slide 35: Current Trading – Forward Order Book
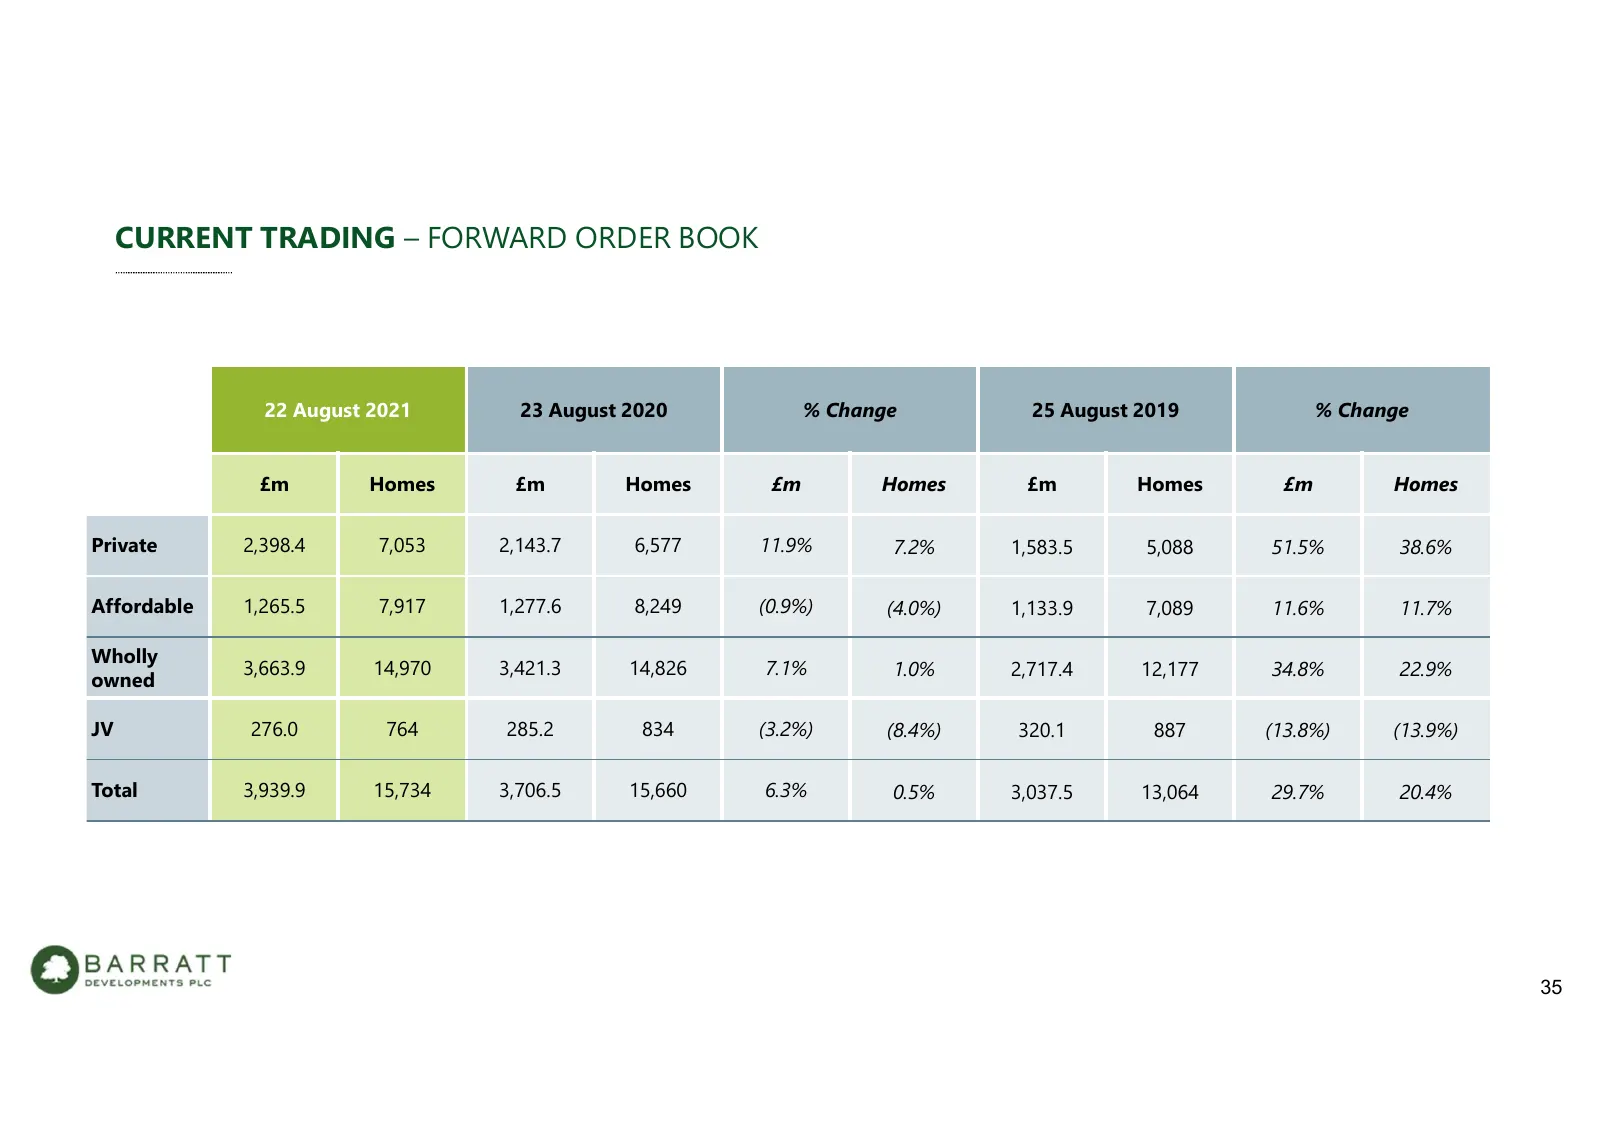
CURRENT TRADING – FORWARD ORDER BOOK 22 August 2021 23 August 2020 % Change 25 August 2019 % Change £m Homes £m Homes £m Homes £m Homes £m Homes Private 2,398.4 7,053 2,143.7 6,577 11.9% 7.2% 1,583.5 5,088 51.5% 38.6% Affordable 1,265.5 7,917 1,277.6 8,249 (0.9%) (4.0%) 1,133.9 7,089 11.6% 11.7% Who
Slide 36: Current Trading – Forward Sales Roll
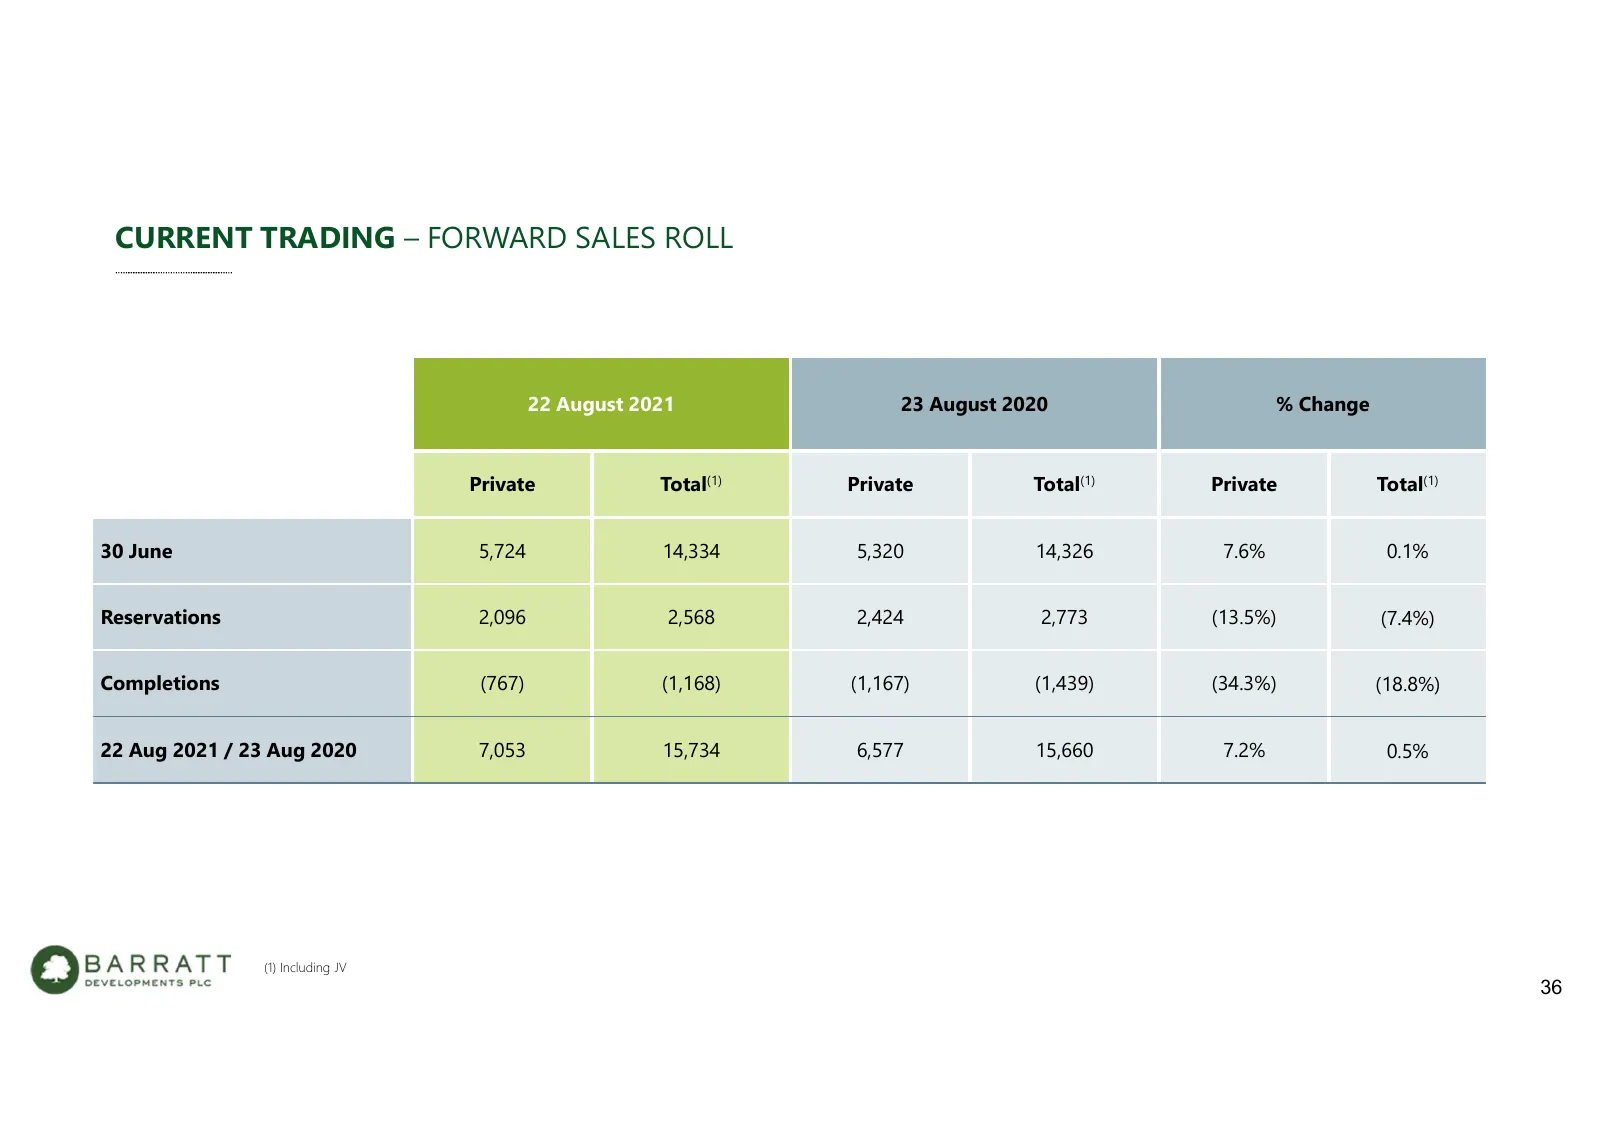
CURRENT TRADING – FORWARD SALES ROLL 22 August 2021 23 August 2020 % Change Private Total(1) Private Total(1) Private Total(1) 30 June 5,724 14,334 5,320 14,326 7.6% 0.1% Reservations 2,096 2,568 2,424 2,773 (13.5%) (7.4%) Completions (767) (1,168) (1,167) (1,439) (34.3%) (18.8%) 22 Aug 2021 / 23 Au
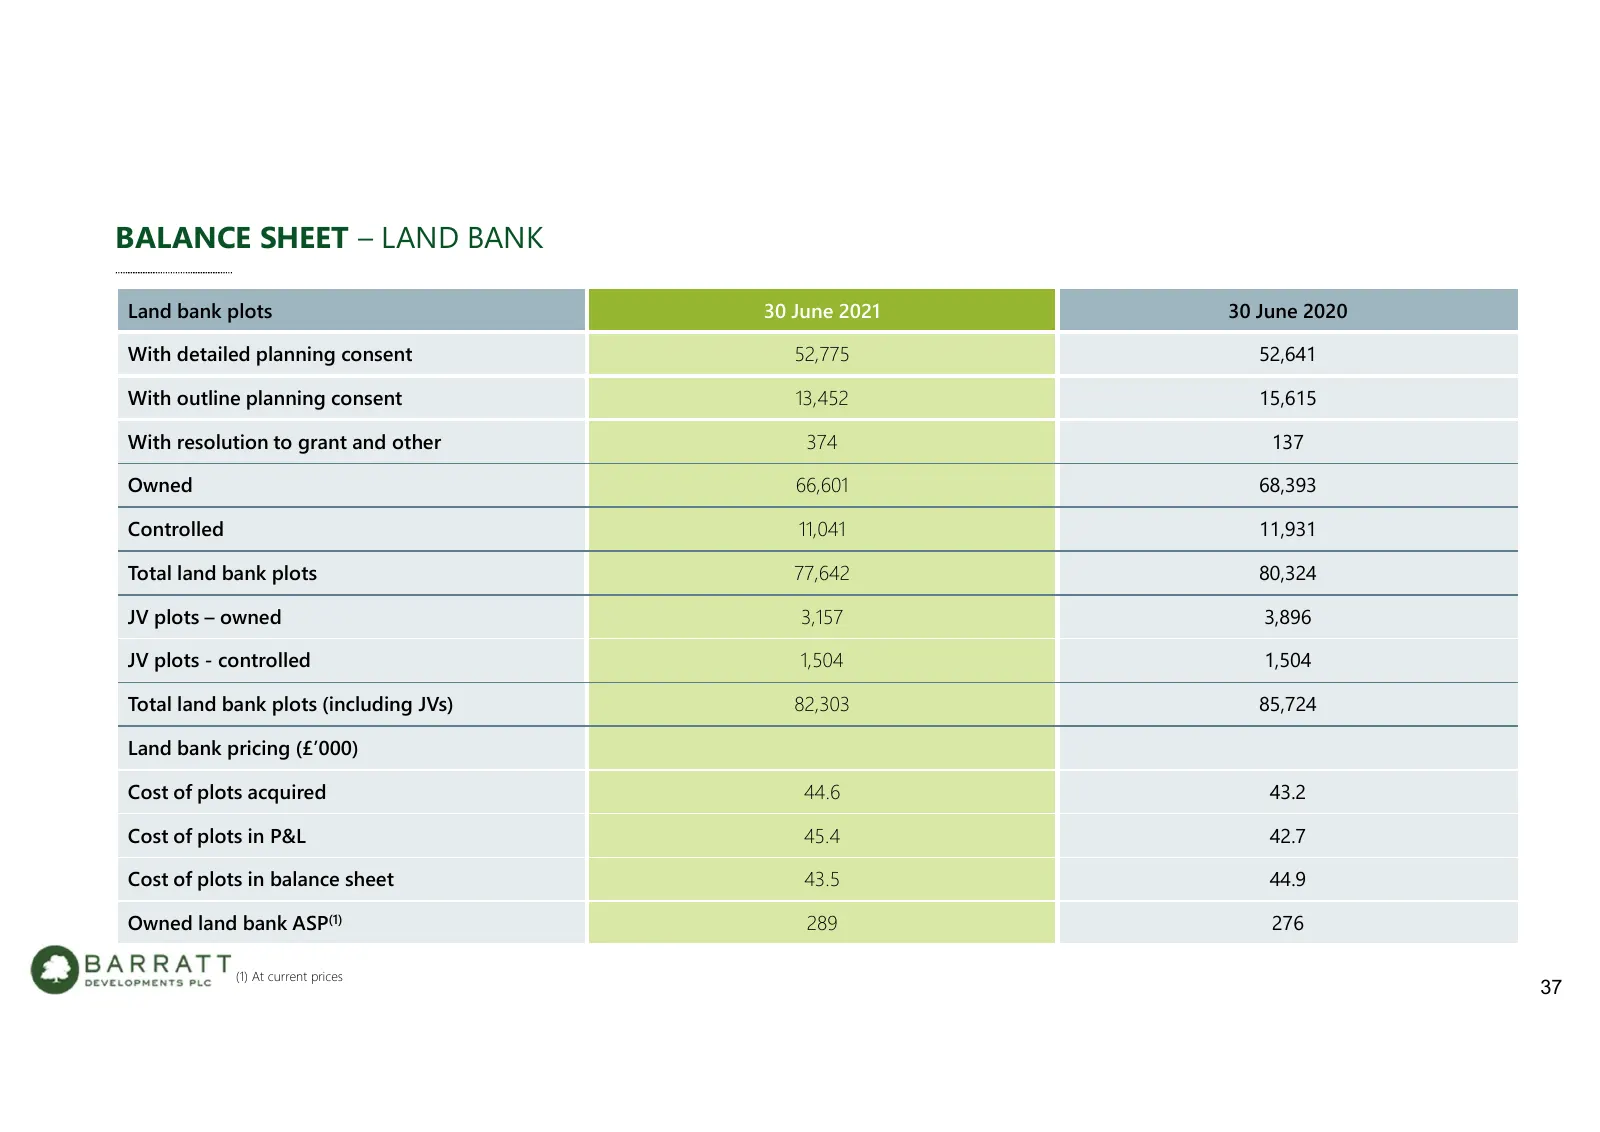
Slide 37: Balance Sheet – Land Bank
BALANCE SHEET – LAND BANK Land bank plots 30 June 2021 30 June 2020 With detailed planning consent 52,775 52,641 With outline planning consent 13,452 15,615 With resolution to grant and other 374 137 Owned 66,601 68,393 Controlled 11,041 11,931 Total land bank plots 77,642 80,324 JV plots – owned 3,
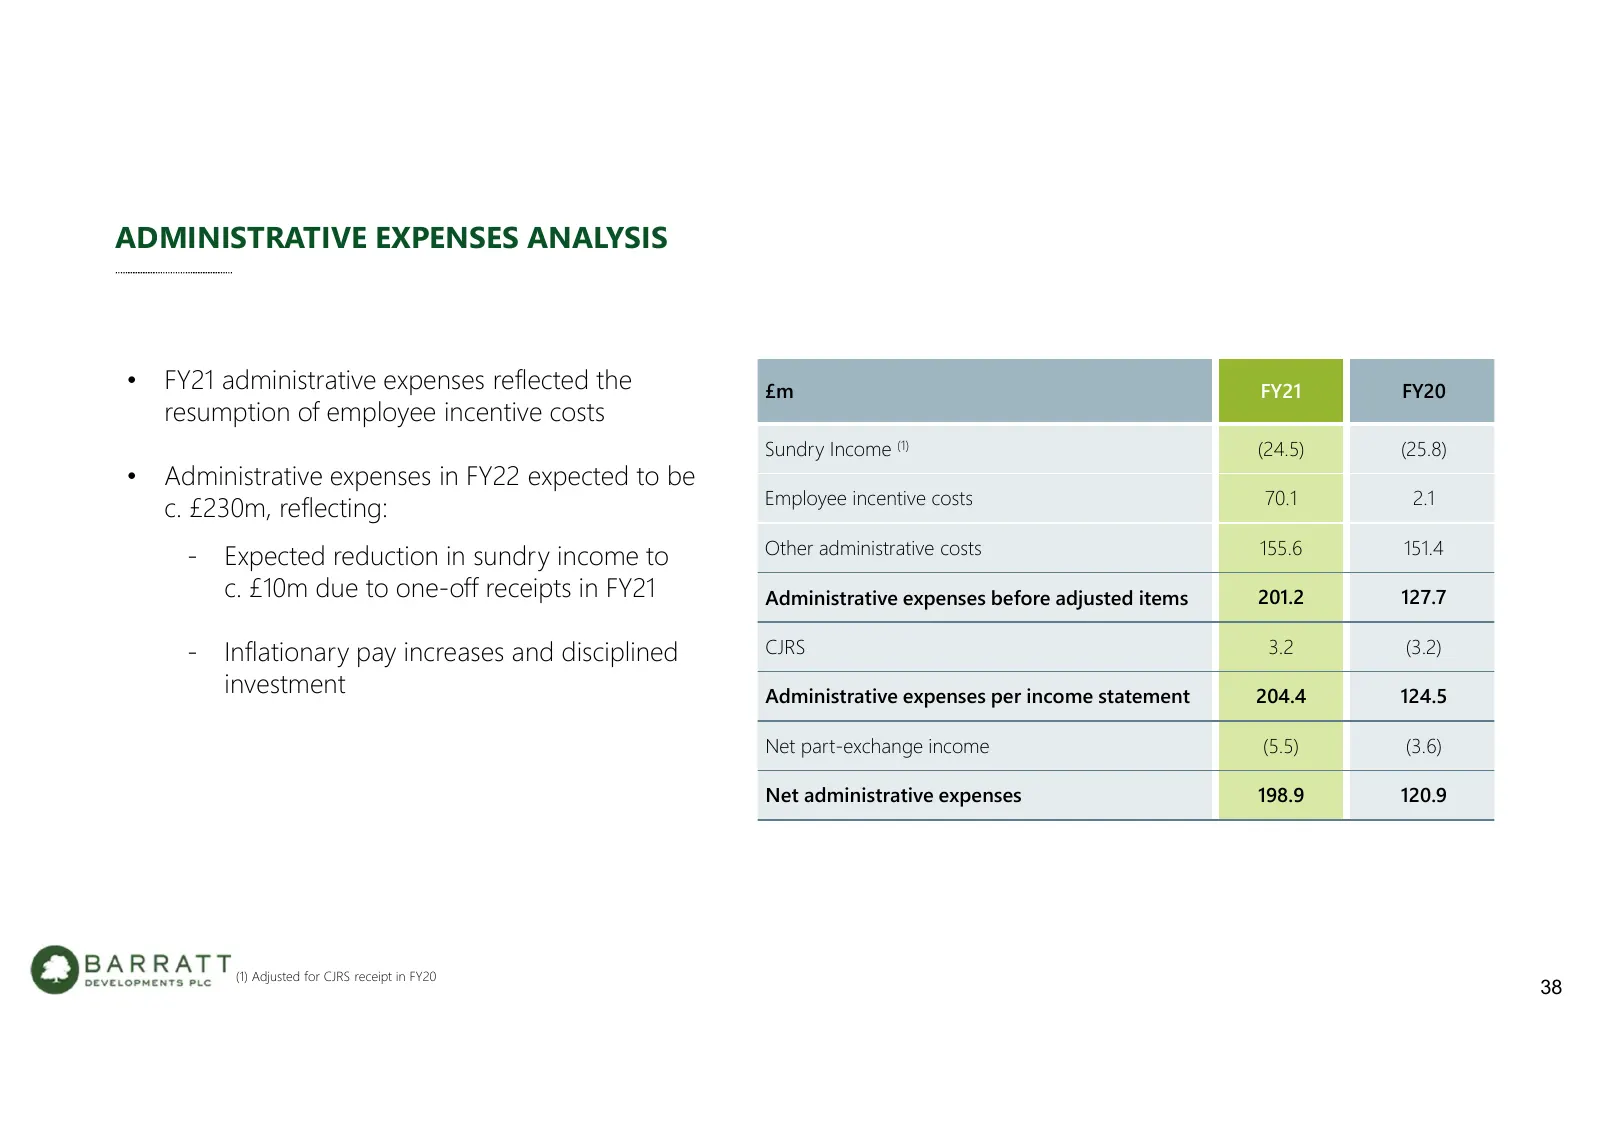
Slide 38: Administrative Expenses Analysis
ADMINISTRATIVE EXPENSES ANALYSIS • FY21 administrative expenses reflected the £m FY21 FY20 resumption of employee incentive costs Sundry Income (1) (24.5) (25.8) • Administrative expenses in FY22 expected to be Employee incentive costs 70.1 2.1 c. £230m, reflecting: Other administrative costs 155.6
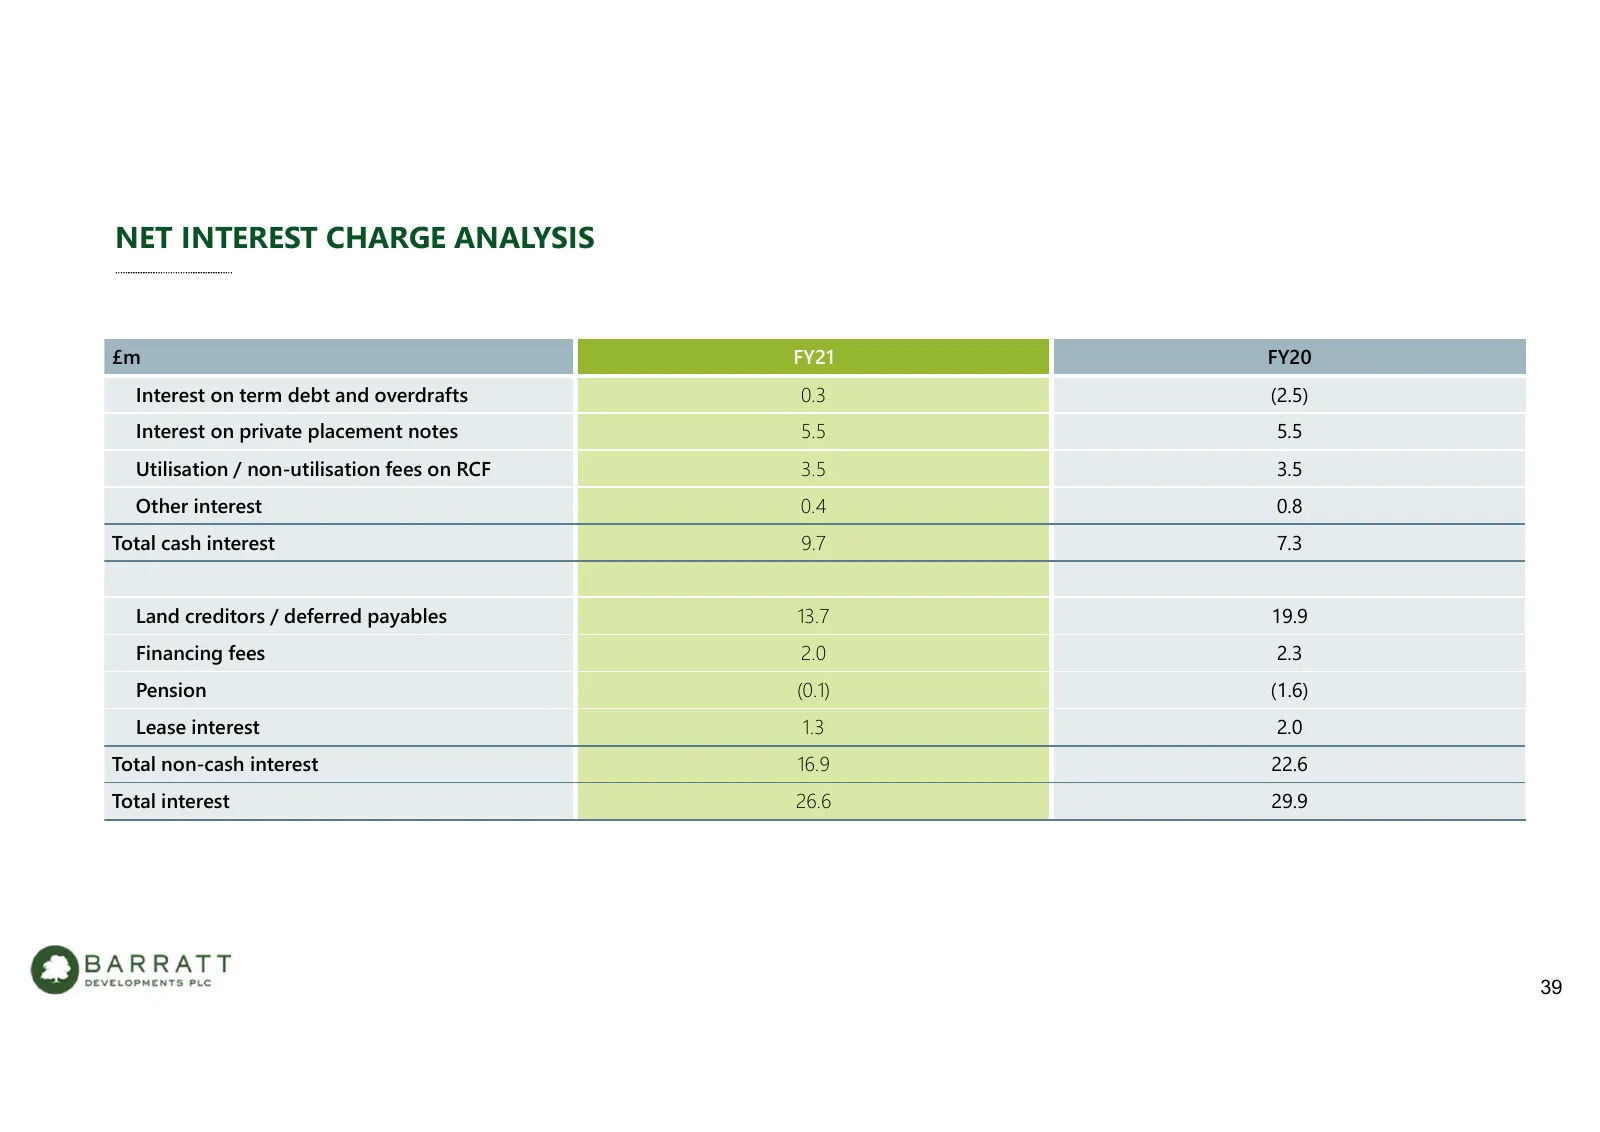
Slide 39: Net Interest Charge Analysis
NET INTEREST CHARGE ANALYSIS £m FY21 FY20 Interest on term debt and overdrafts 0.3 (2.5) Interest on private placement notes 5.5 5.5 Utilisation / non-utilisation fees on RCF 3.5 3.5 Other interest 0.4 0.8 Total cash interest 9.7 7.3 Land creditors / deferred payables 13.7 19.9 Financing fees 2.0 2.
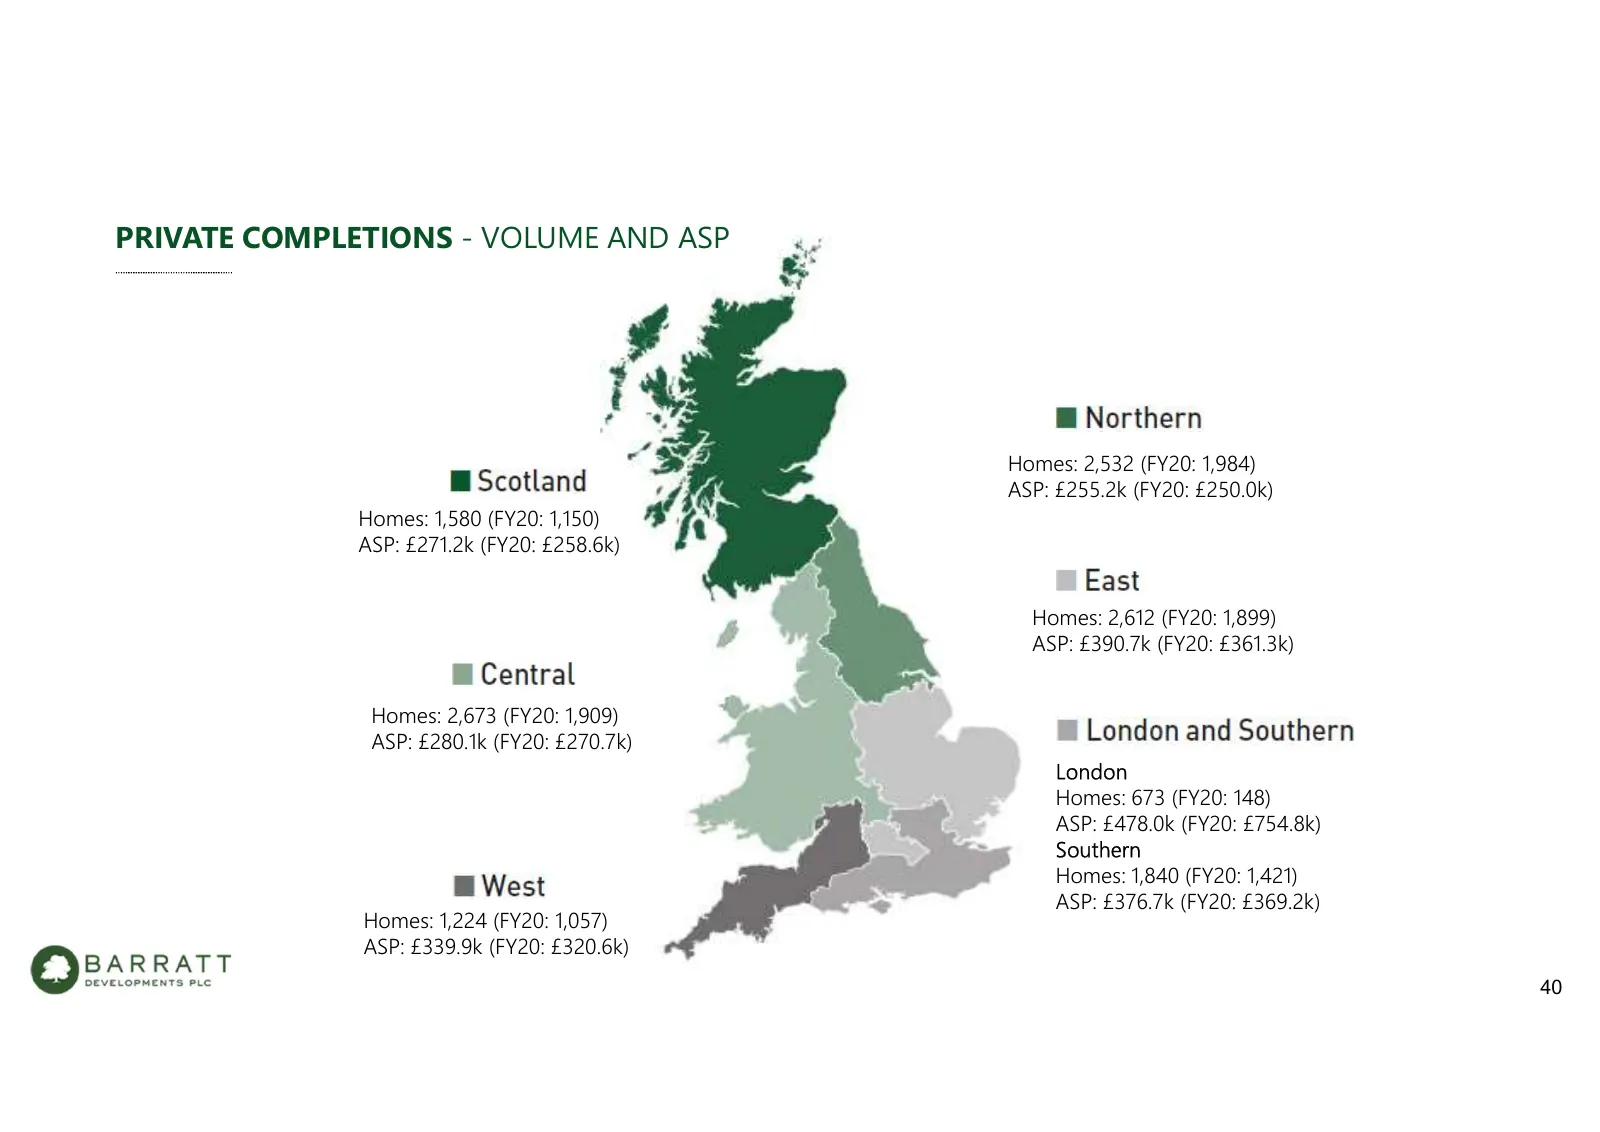
Slide 40: Private Completions – Volume and ASP
PRIVATE COMPLETIONS - VOLUME AND ASP Homes: 2,532 (FY20: 1,984) ASP: £255.2k (FY20: £250.0k) Homes: 1,580 (FY20: 1,150) ASP: £271.2k (FY20: £258.6k) Homes: 2,612 (FY20: 1,899) ASP: £390.7k (FY20: £361.3k) Homes: 2,673 (FY20: 1,909) ASP: £280.1k (FY20: £270.7k) London Homes: 673 (FY20: 148) ASP: £478
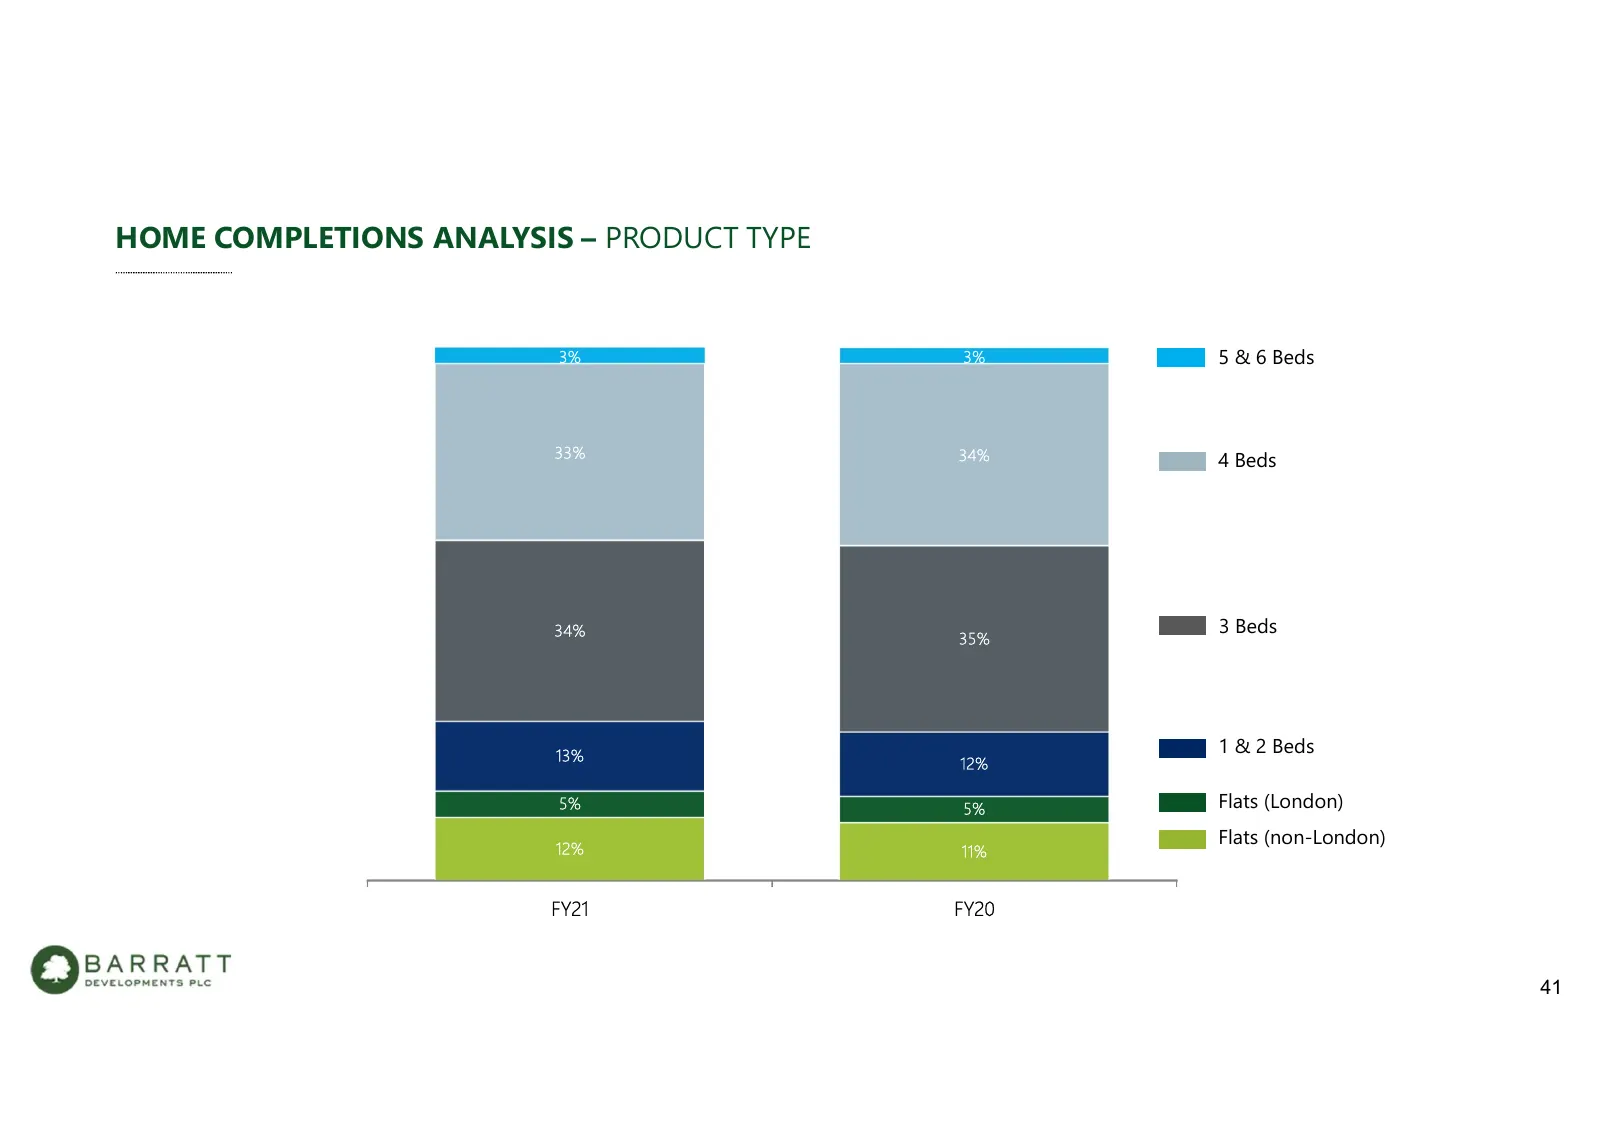
Slide 41: Home Completions Analysis – Product Type
HOME COMPLETIONS ANALYSIS – PRODUCT TYPE 3% 3% 5 & 6 Beds 33% 34% 4 Beds 34% 3 Beds 35% 13% 1 & 2 Beds 12% 5% 5% Flats (London) 12% Flats (non-London) 11% FY21 FY20 41
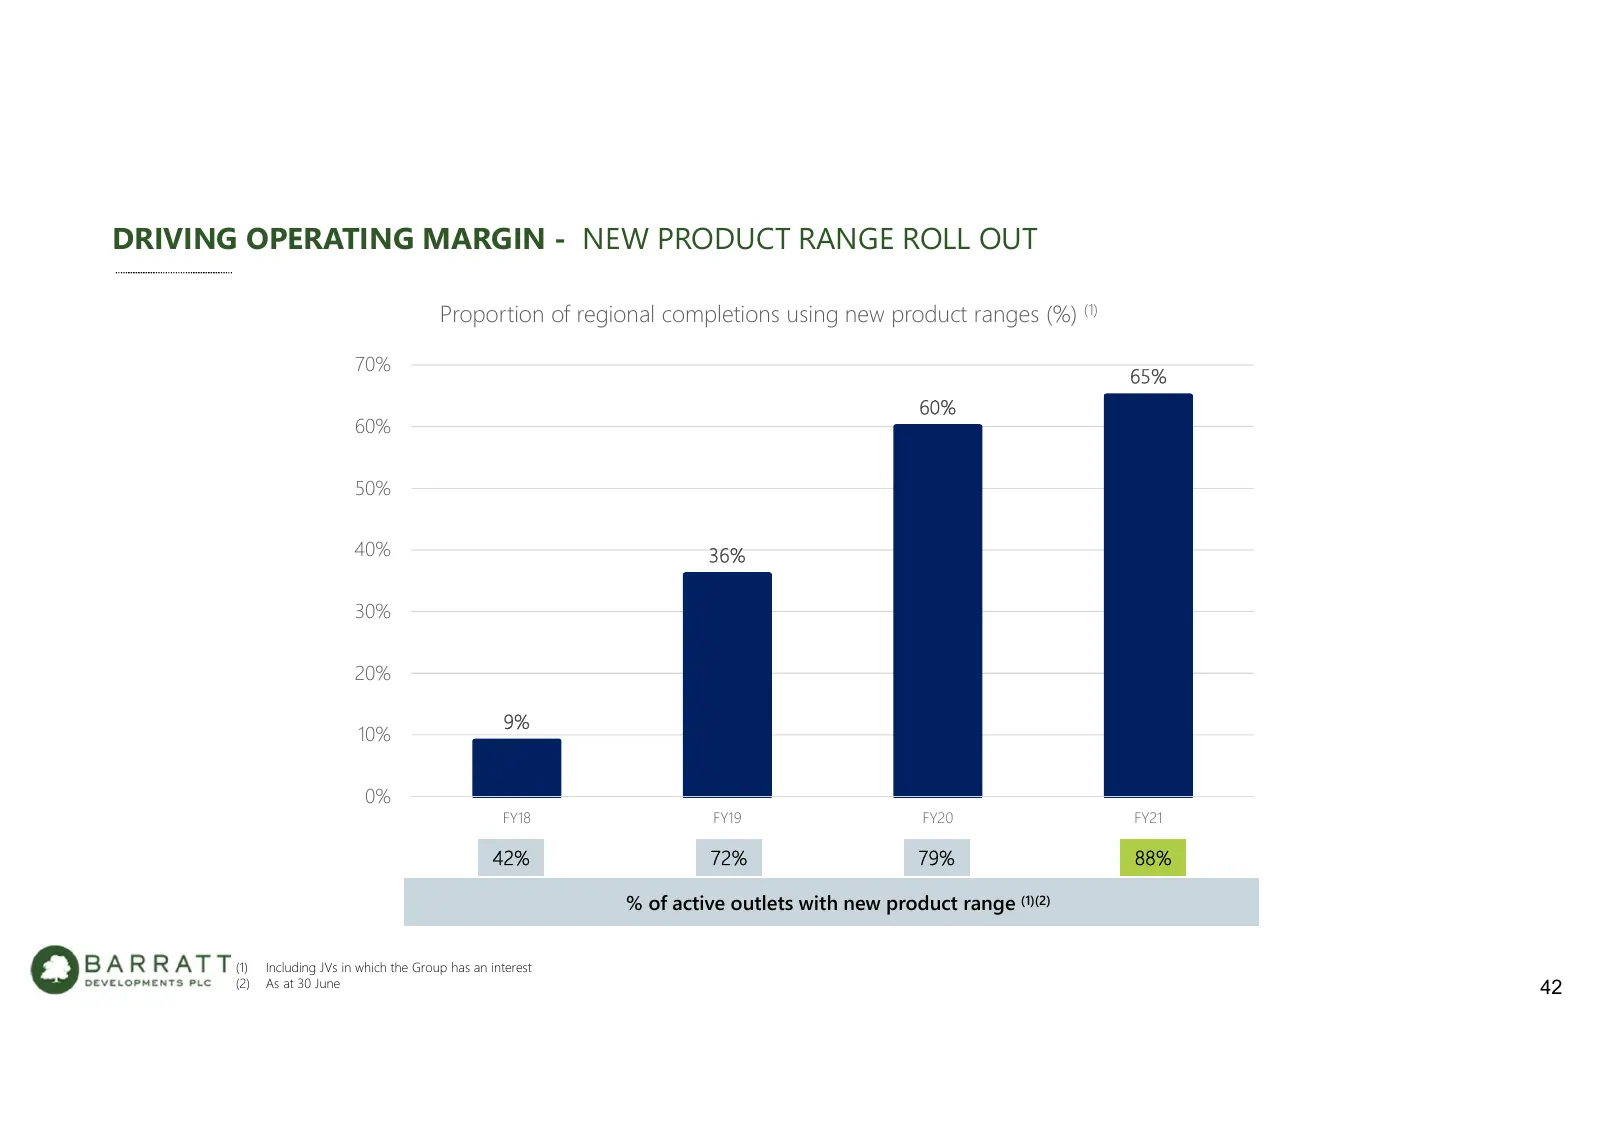
Slide 42: Driving Operating Margin – New Product Range Roll Out
DRIVING OPERATING MARGIN - NEW PRODUCT RANGE ROLL OUT Proportion of regional completions using new product ranges (%) (1) 70% 65% 60% 60% 50% 40% 36% 30% 20% 9% 10% 0% FY18 FY19 FY20 FY21 42% 72% 79% 88% % of active outlets with new product range (1)(2) (1) Including JVs in which the Group has an in
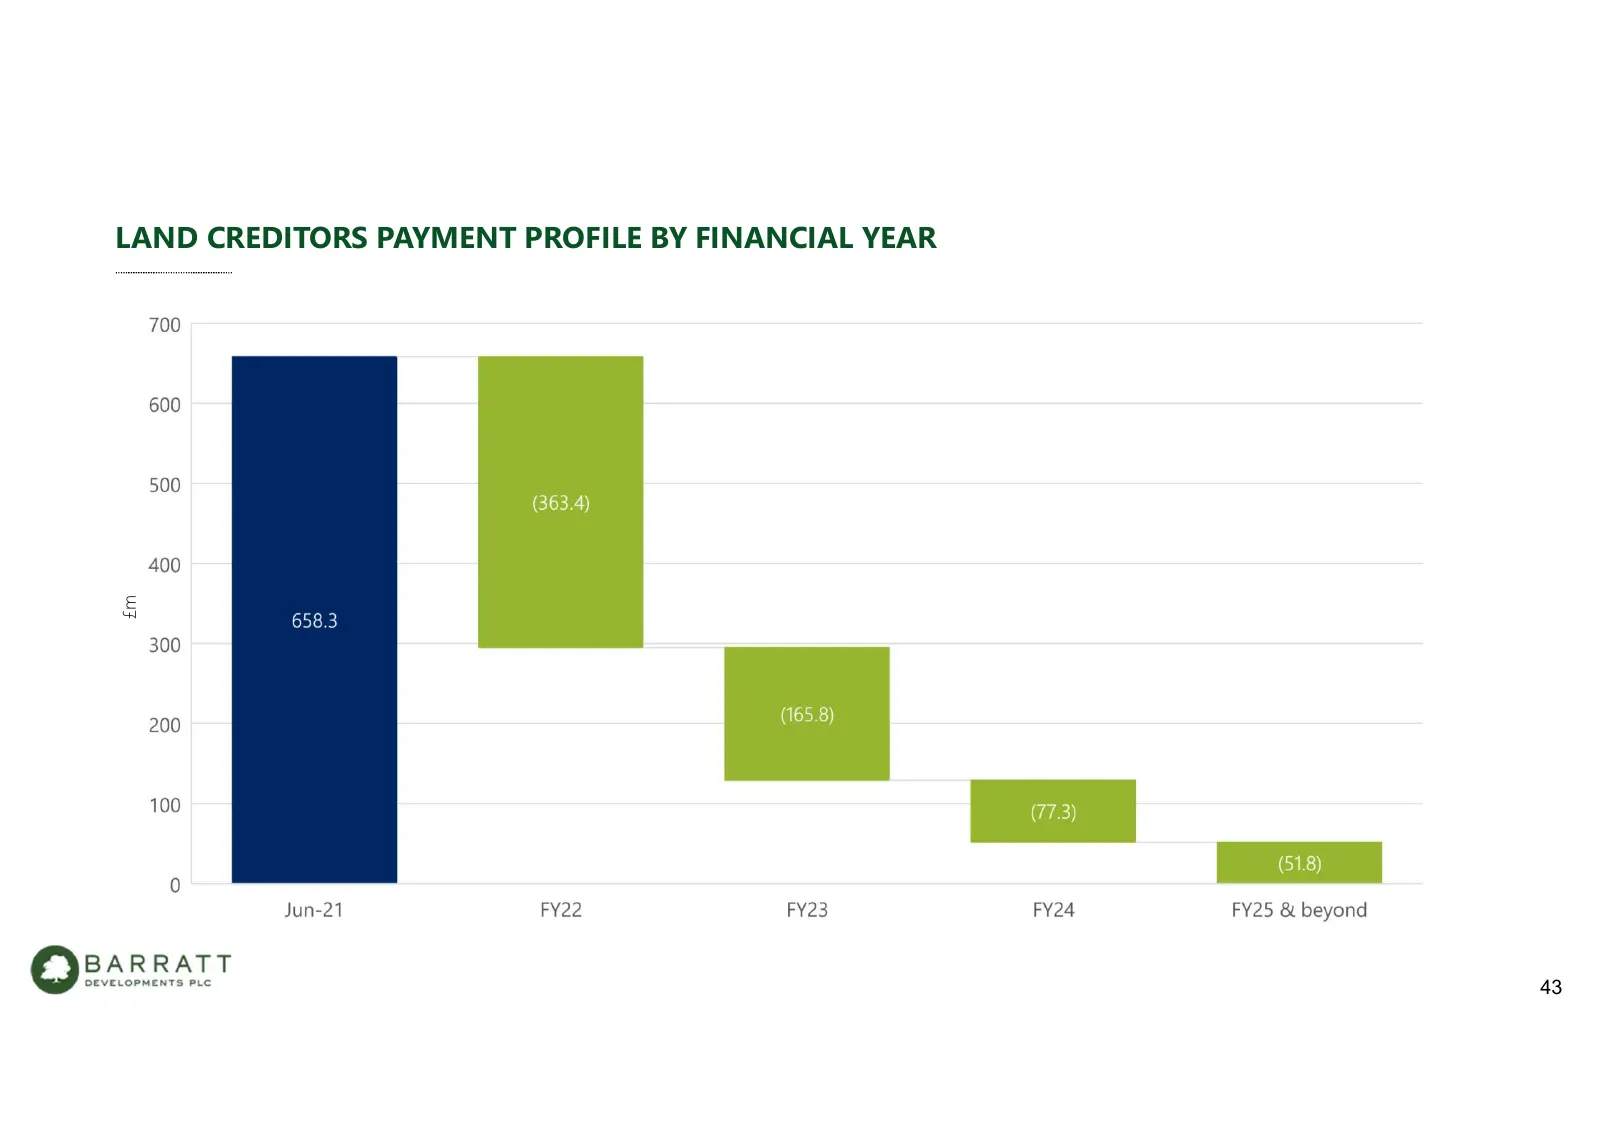
Slide 43: Land Creditors Payment Profile by Financial Year
LAND CREDITORS PAYMENT PROFILE BY FINANCIAL YEAR £m 43
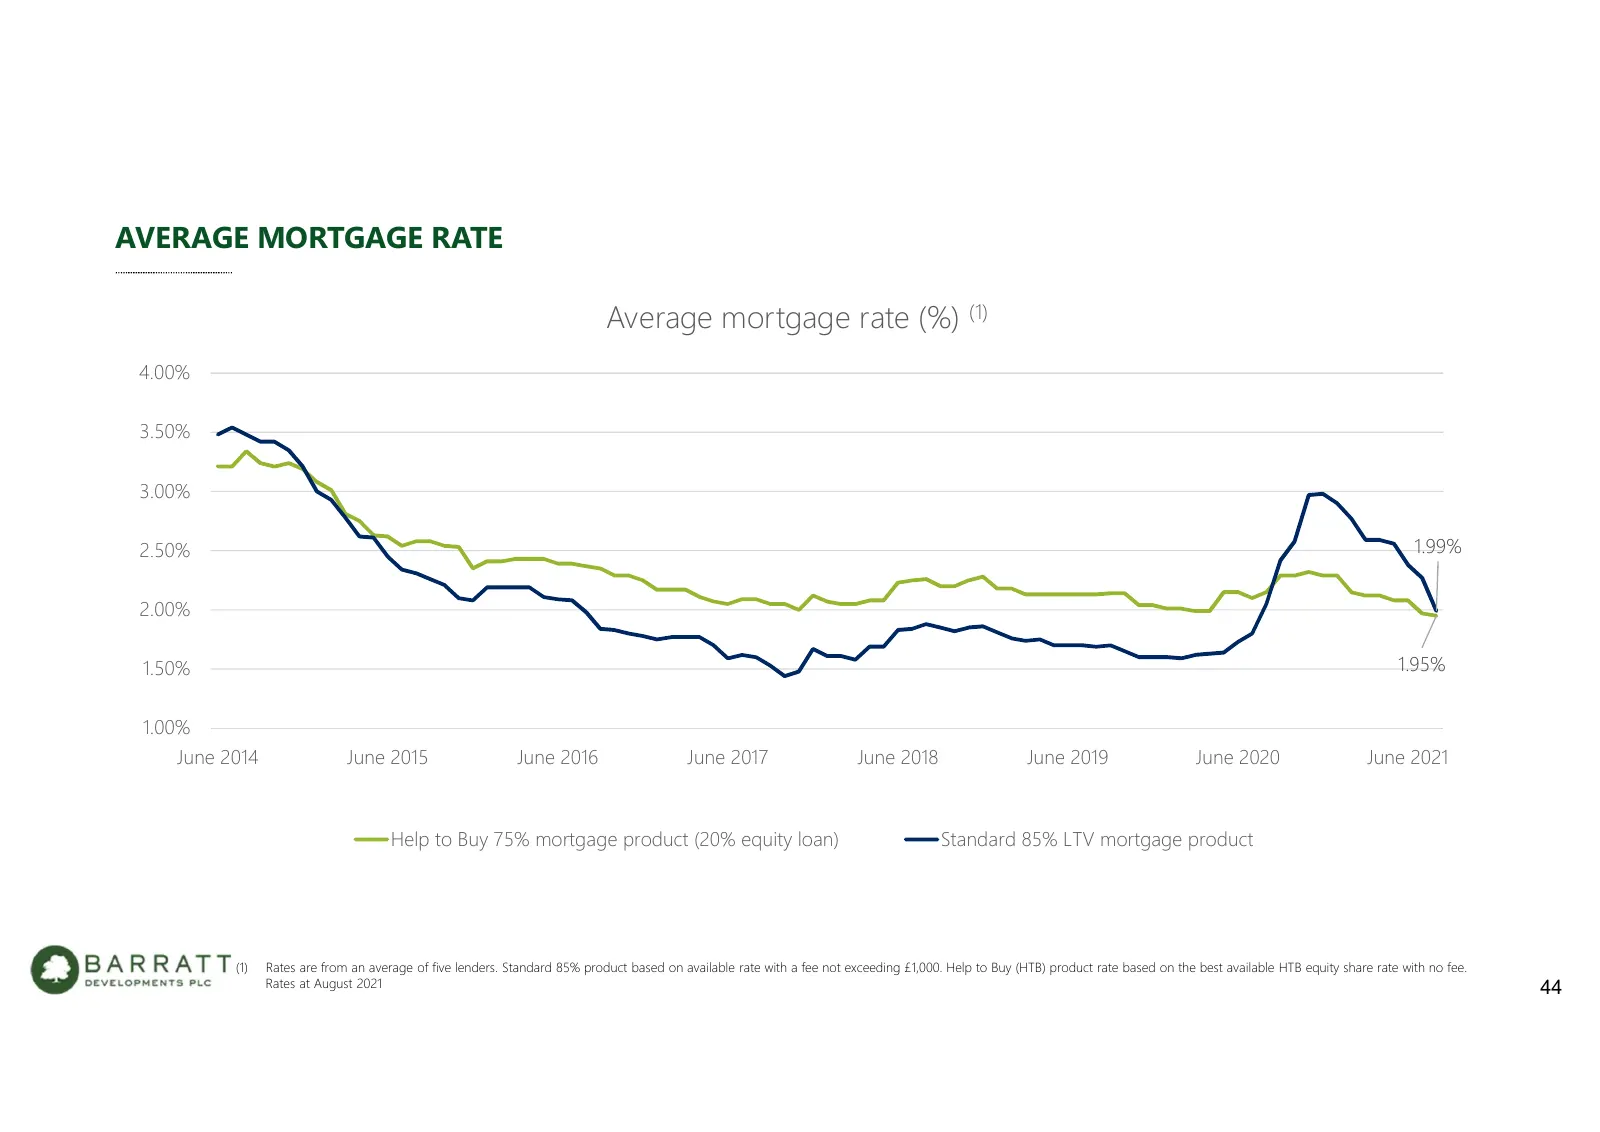
Slide 44: Average Mortgage Rate
AVERAGE MORTGAGE RATE Average mortgage rate (%) (1) 4.00% 3.50% 3.00% 2.50% 1.99% 2.00% 1.50% 1.95% 1.00% June 2014 June 2015 June 2016 June 2017 June 2018 June 2019 June 2020 June 2021 Help to Buy 75% mortgage product (20% equity loan) Standard 85% LTV mortgage product (1) Rates are from an average
Slide 45: External Benchmarks
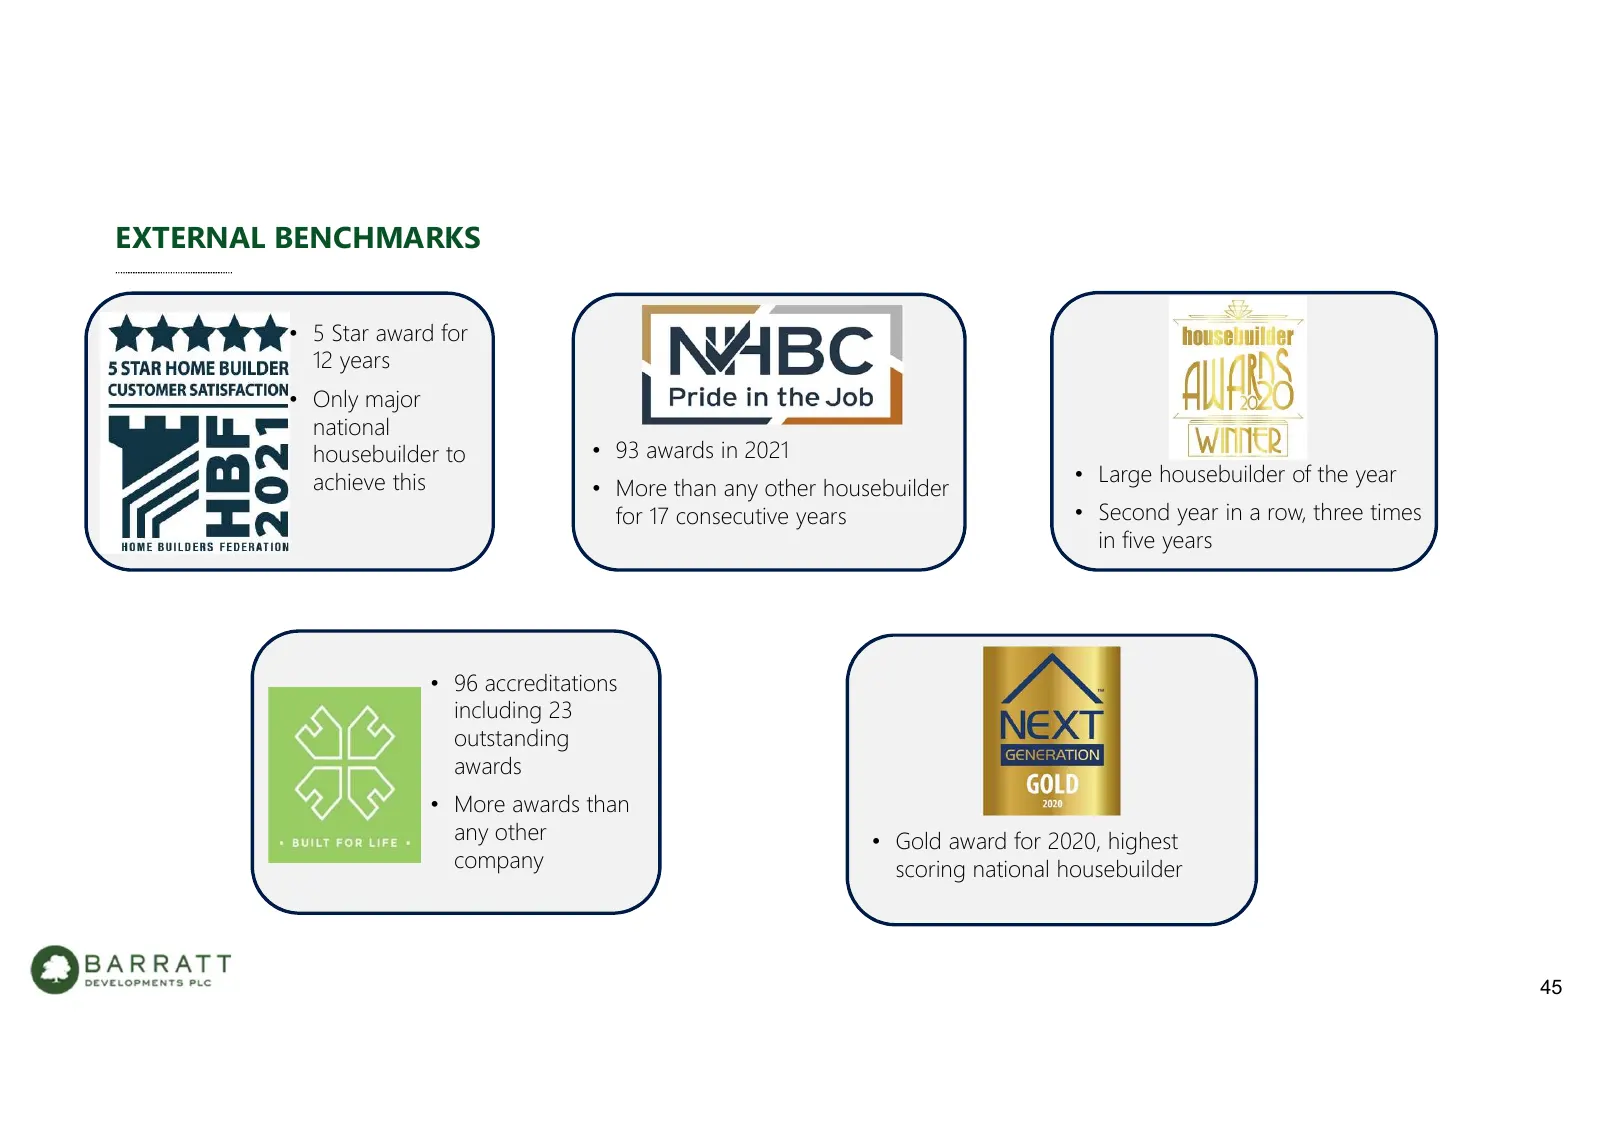
EXTERNAL BENCHMARKS • 5 Star award for 12 years EXTERNAL • Only major BENCHMA national RKS housebuilder to • 93 awards in 2021 achieve this • Large housebuilder of the year • More than any other housebuilder for 17 consecutive years • Second year in a row, three times in five years • 96 accreditatio
Slide 46: Disclaimer
DISCLAIMER This document has been prepared by Barratt Developments PLC (the “Company”) solely for use at a presentation in connection with the Company‘s Results Announcement in respect of the full year ended 30 June 2021. For the purposes of this notice, the presentation (the “Presentation”) shall m
Source: Internet Archive copy of barrattdevelopments.co.uk
More decks from Barratt Redrow plc
 FY2026 Earnings Presentation59 slides · Sep 16, 2026
 HY26 Earnings Presentation59 slides · Feb 11, 2026
 FY2025 Earnings Presentation60 slides · Sep 17, 2025
 Corporate Update (May 2025)30 slides · May 1, 2025
 Investor Day (February 2025)40 slides · Feb 12, 2025
 HY25 Earnings Presentation51 slides · Feb 12, 2025