tronc — Tribune Publishing — Southwest IDEAS 2014 Investor Conference
28 slides from tronc's conference presentation, Nov 19, 2014

Slide 1: Southwest IDEAS 2014 Investor Conference
Southwest IDEAS 2014 Investor Conference November 19, 2014
Slide 2: Company Highlights and Strategy
Company Highlights and Strategy Jack Griffin, Chief Executive Officer 2
Slide 3: Cautionary Statement Regarding Forward-Looking Statements
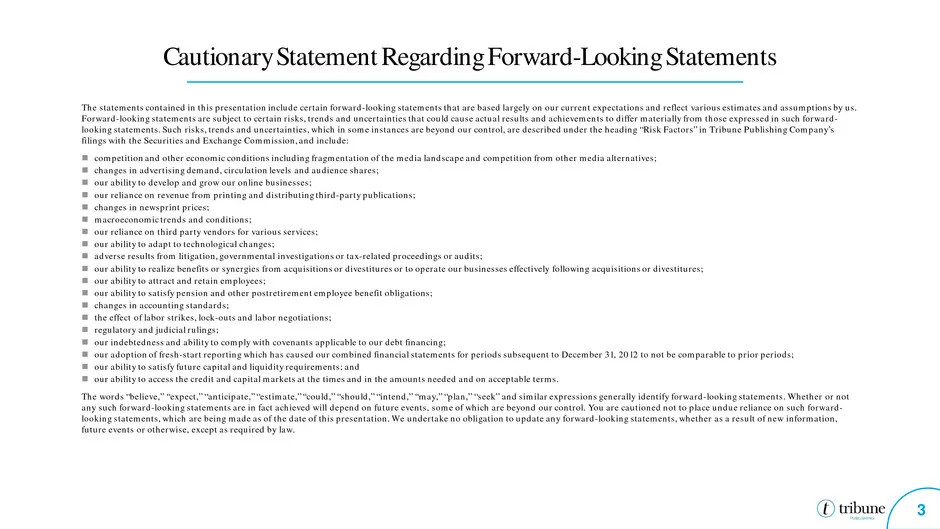
Cautionary Statement Regarding Forward-Looking Statements The statements contained in this presentation include certain forward-looking statements that are based largely on our current expectations and reflect various estimates and assumptions by us. Forward-looking statements are subject to certain
Slide 4: Non-GAAP Financial Measures
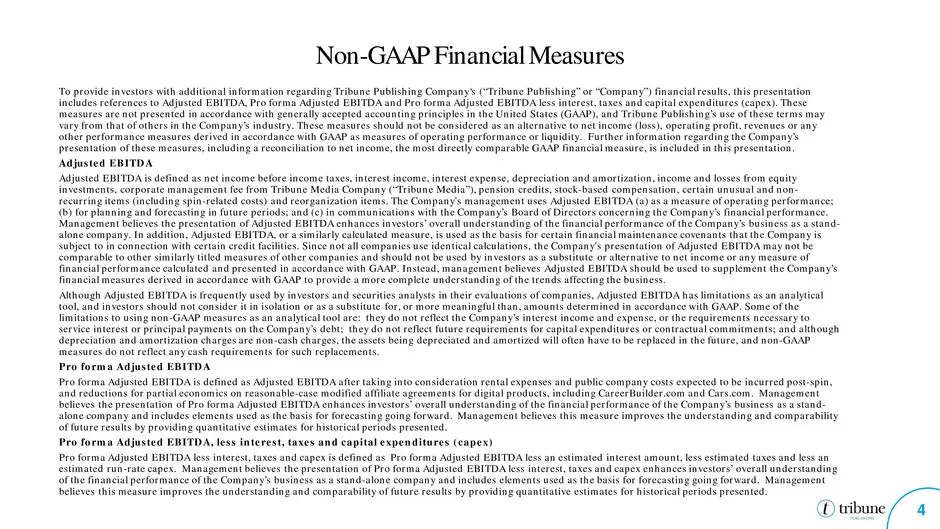
Non-GAAP Financial Measures To provide investors with additional information regarding Tribune Publishing Company‘s (“Tribune Publishing” or “Company”) financial results, this presentation includes references to Adjusted EBITDA, Pro forma Adjusted EBITDA and Pro forma Adjusted EBITDA less interest,
Slide 5: Premier "Blue-Chip" Media Assets
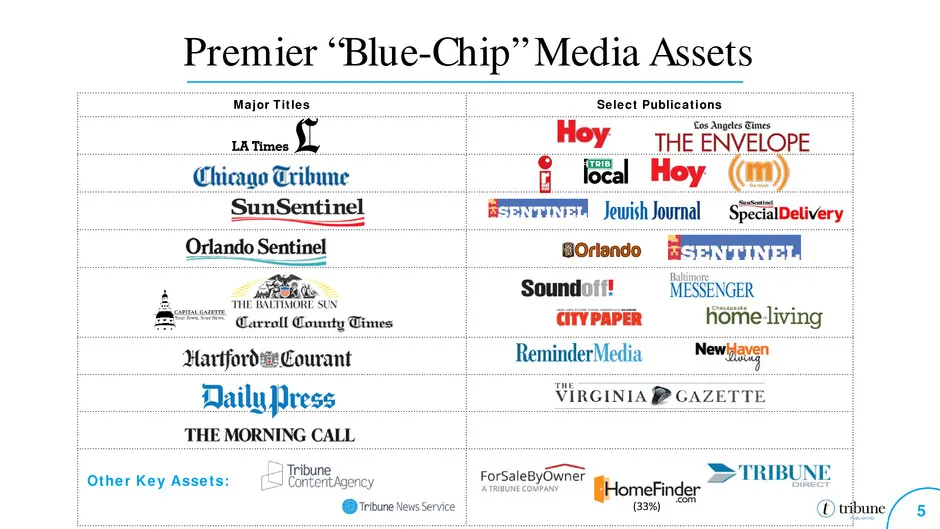
Major Titles Select Publications Other Key Assets: Premier “Blue-Chip” Media Assets (33%) 5
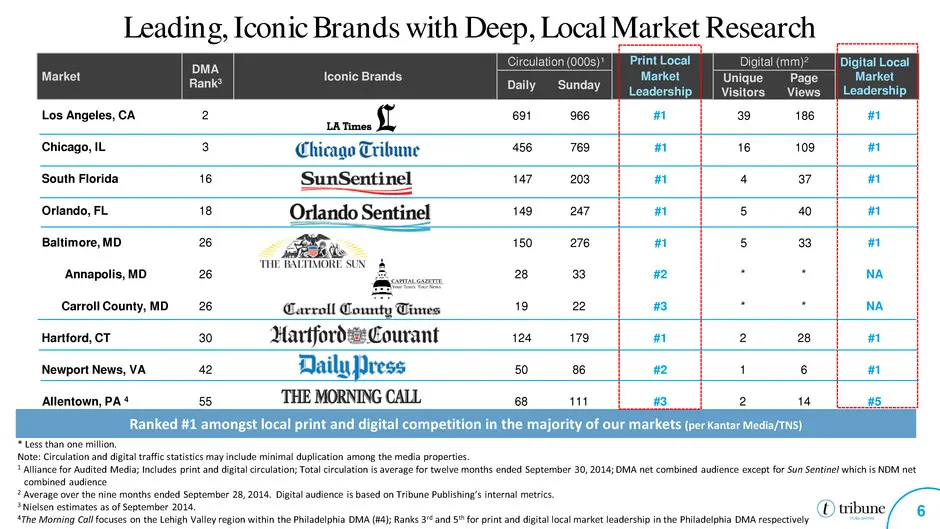
Slide 6: Leading, Iconic Brands with Deep, Local Market Research
Leading, Iconic Brands with Deep, Local Market Research 6 Market DMA Rank3 Iconic Brands Circulation (000s)¹ Print Local Market Leadership Digital (mm)2 Digital Local Market Leadership Daily Sunday Unique Visitors Page Views Los Angeles, CA 2 691 966 #1 39 186 #1 Chicago, IL 3 456 769 #1 16 109 #1 S
Slide 7: Key Investment Highlights
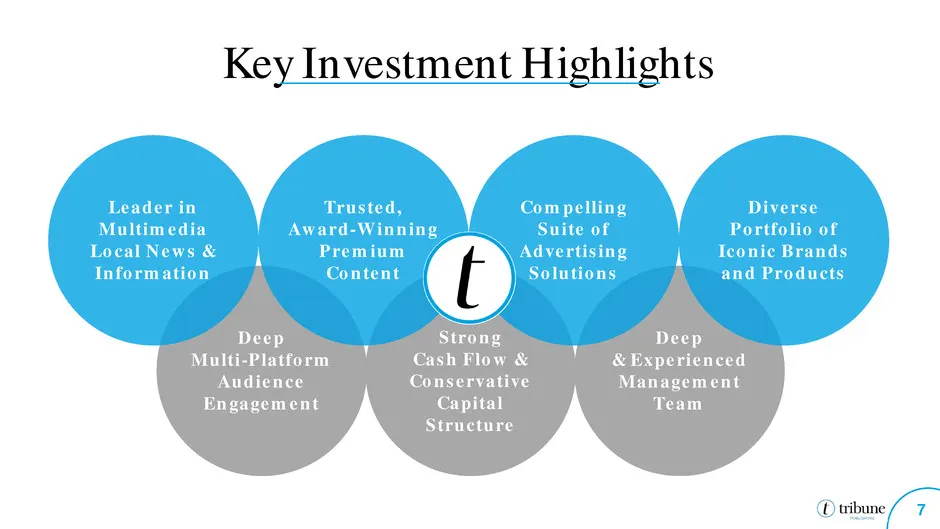
Strong Cash Flow & Conservative Capital Structure Deep & Experienced Management Team Deep Multi-Platform Audience Engagement Compelling Suite of Advertising Solutions Trusted, Award-Winning Premium Content Key Investment Highlights 7 Diverse Portfolio of Iconic Brands and Products Leader in Multimed
Slide 8: Our Strategic Principles
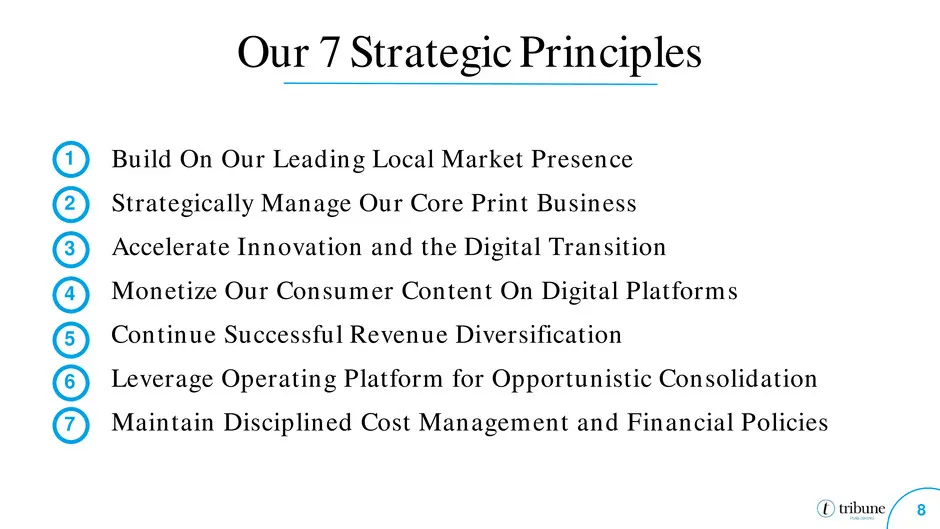
Our 7 Strategic Principles Build On Our Leading Local Market Presence Strategically Manage Our Core Print Business Accelerate Innovation and the Digital Transition Monetize Our Consumer Content On Digital Platforms Continue Successful Revenue Diversification Leverage Operating Platform for Opportuni
Slide 9: Our First Days
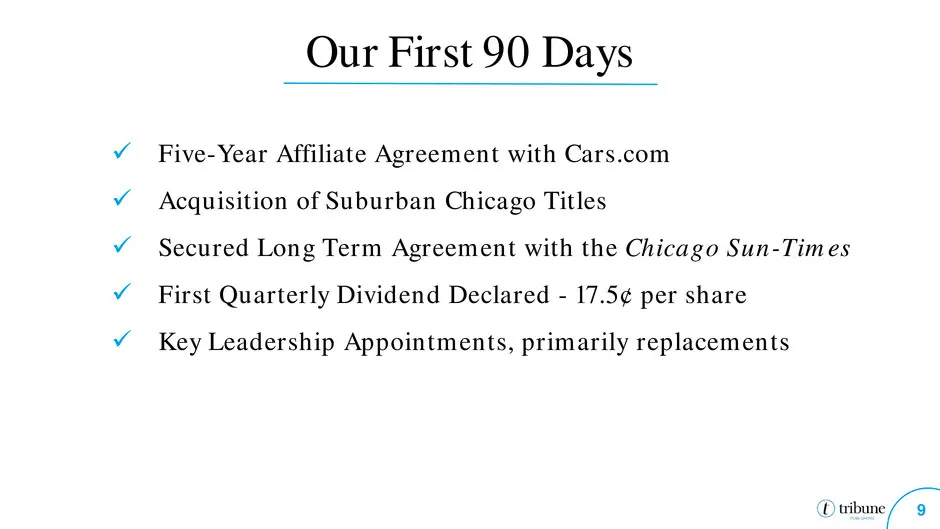
Our First 90 Days Five-Year Affiliate Agreement with Cars.com Acquisition of Suburban Chicago Titles Secured Long Term Agreement with the Chicago Sun-Times First Quarterly Dividend Declared - 17.5¢ per share Key Leadership Appointments, primarily replacements 9
Slide 10: Trusted, Award-Winning Premium Content
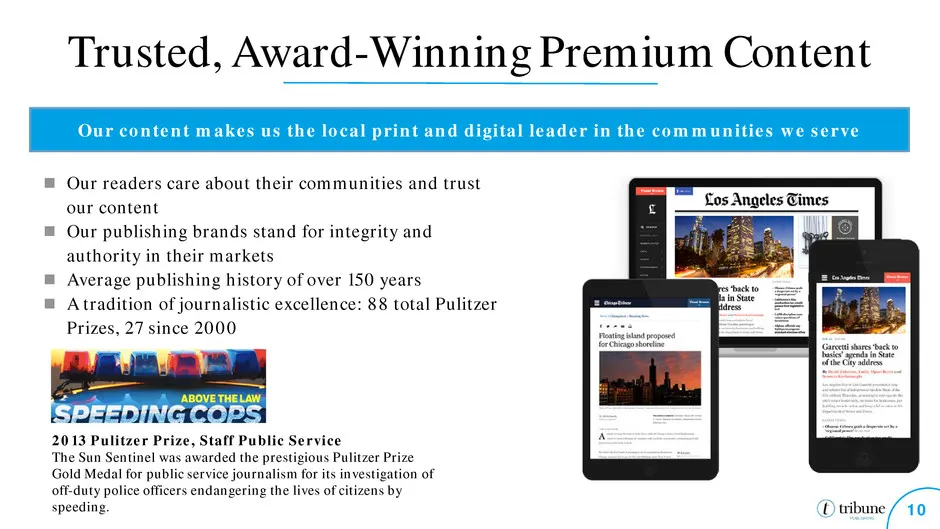
10 Trusted, Award-Winning Premium Content Our content makes us the local print and digital leader in the communities we serve Our readers care about their communities and trust our content Our publishing brands stand for integrity and authority in their markets Average publishing history of ov
Slide 11: M&A "Bolt-On" Strategy
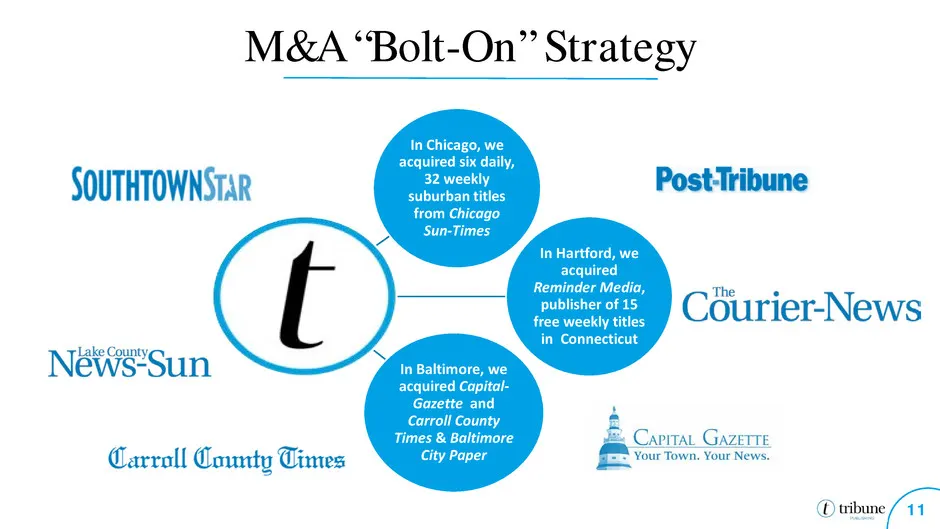
M&A “Bolt-On” Strategy In Chicago, we acquired six daily, 32 weekly suburban titles from Chicago Sun-Times In Hartford, we acquired Reminder Media, publisher of 15 free weekly titles in Connecticut In Baltimore, we acquired Capital- Gazette and Carroll County Times & Baltimore City Paper 11
Slide 12: Print + Digital Penetration By Market
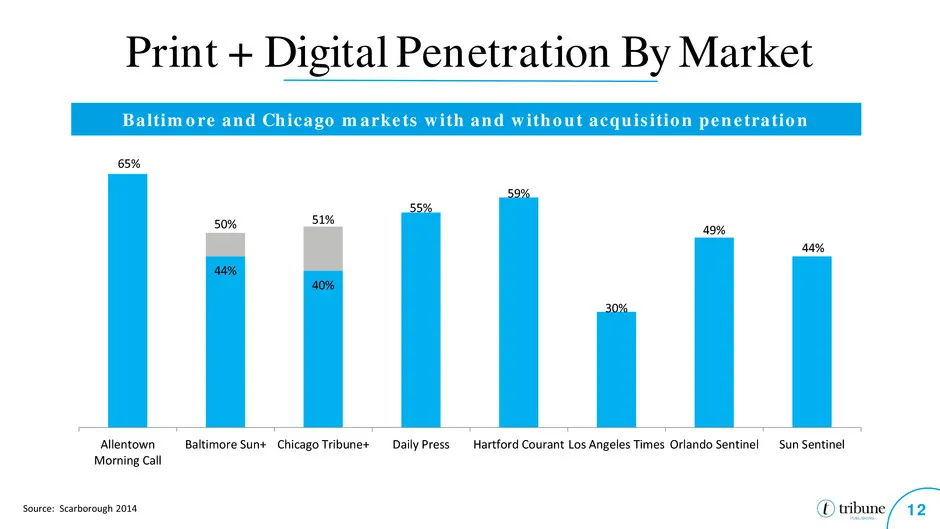
Print + Digital Penetration By Market 12 Source: Scarborough 2014 Baltimore and Chicago markets with and without acquisition penetration 44% 40% 65% 50% 51% 55% 59% 30% 49% 44% Allentown Morning Call Baltimore Sun+ Chicago Tribune+ Daily Press Hartford Courant Los Angeles Times Orlando Sentinel Sun
Slide 13: Our Digital Growth Initiatives
Our Digital Growth Initiatives Leverage NGUX: users, engagement & ad revenue Aggressively grow our digital subscription base Grow our digital marketing services businesses Accelerate video production & monetization Optimize our content & products for mobile Grow our Hispanic businesses & platforms E
Slide 14: Growing Digital Consumer Revenue
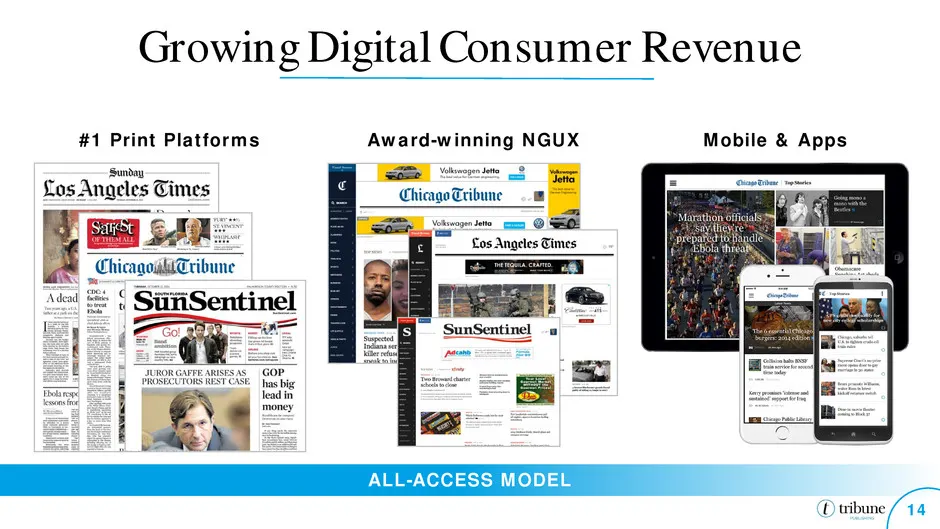
Growing Digital Consumer Revenue ALL-ACCESS MODEL #1 Print Platforms Award-winning NGUX Mobile & Apps 14
Slide 15: Our Paid Consumer Digital Strategy
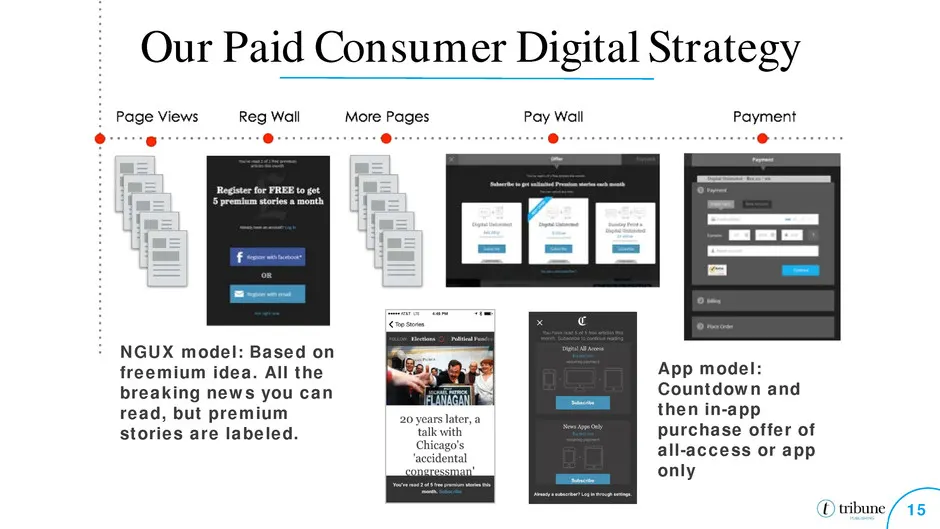
Our Paid Consumer Digital Strategy 15 App model: Countdown and then in-app purchase offer of all-access or app only NGUX model: Based on freemium idea. All the breaking news you can read, but premium stories are labeled.
Slide 16: 2014: A Year of Building and Transition
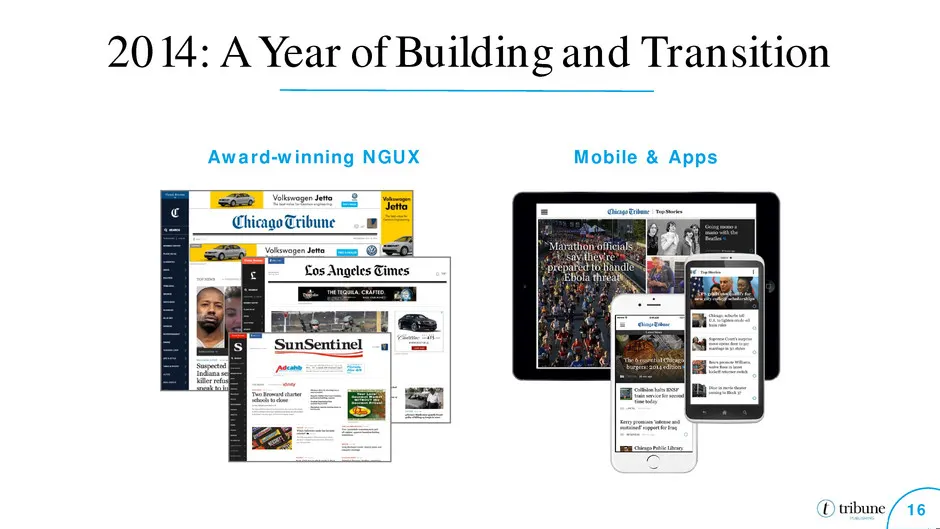
2014: A Year of Building and Transition 16 Award-winning NGUX Mobile & Apps
Slide 17: 2014: Scaling NGUX across TPUB
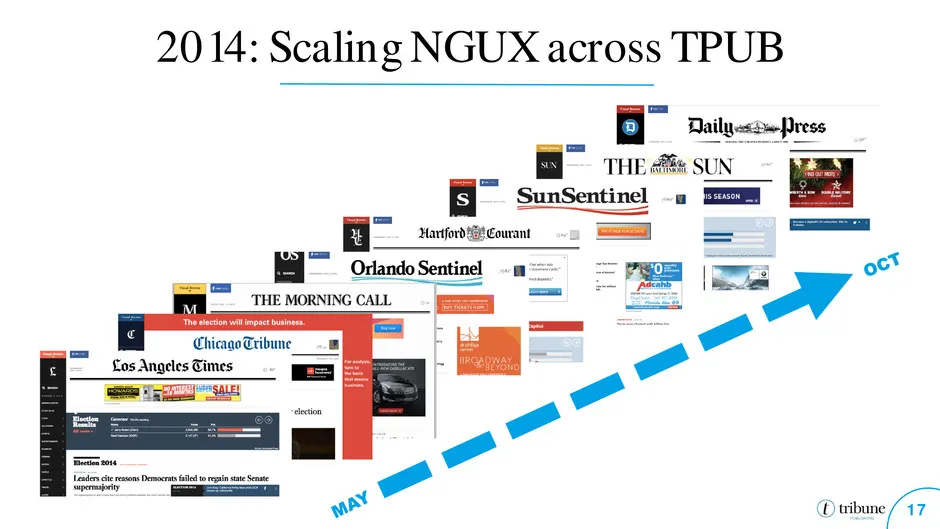
2014: Scaling NGUX across TPUB 17
Slide 18: Financial Profile
Financial Profile John Bode, Chief Financial Officer 18
Slide 19: Example: Digital Vertical
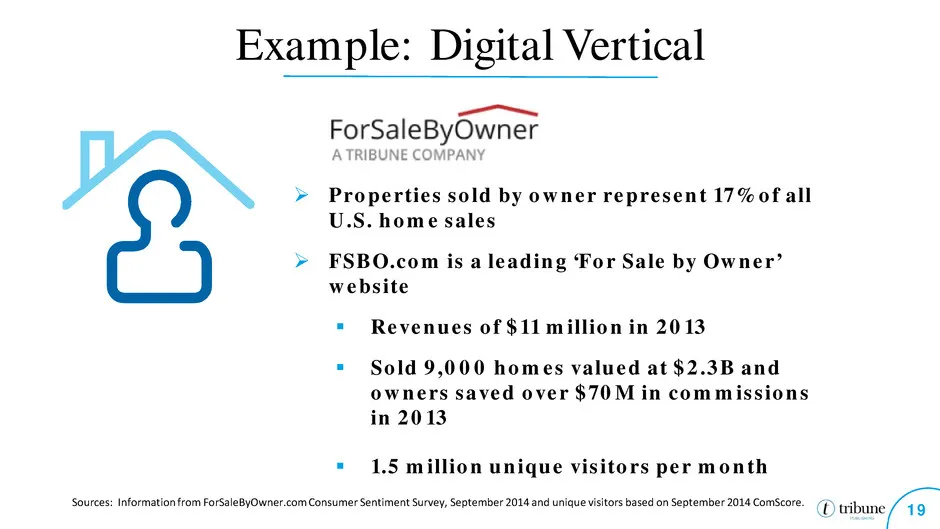
Example: Digital Vertical 19 Sources: Information from ForSaleByOwner.com Consumer Sentiment Survey, September 2014 and unique visitors based on September 2014 ComScore. Properties sold by owner represent 17% of all U.S. home sales FSBO.com is a leading ‘For Sale by Owner’ website Revenues of
Slide 20: Disciplined Approach to Capital Allocation
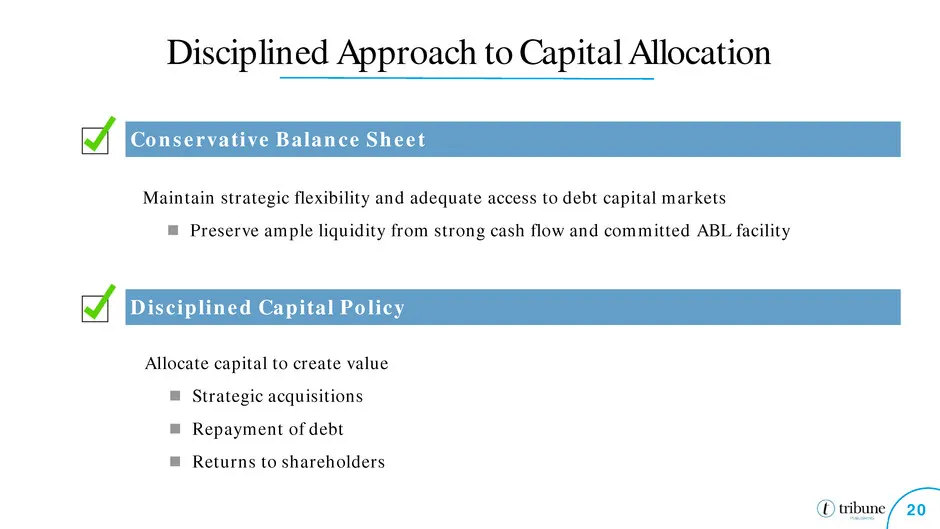
Disciplined Approach to Capital Allocation 20 Conservative Balance Sheet Allocate capital to create value Strategic acquisitions Repayment of debt Returns to shareholders Disciplined Capital Policy Maintain strategic flexibility and adequate access to debt capital markets Preserve ample liqu
Slide 21: Q3 2014 Performance Update – Revenues
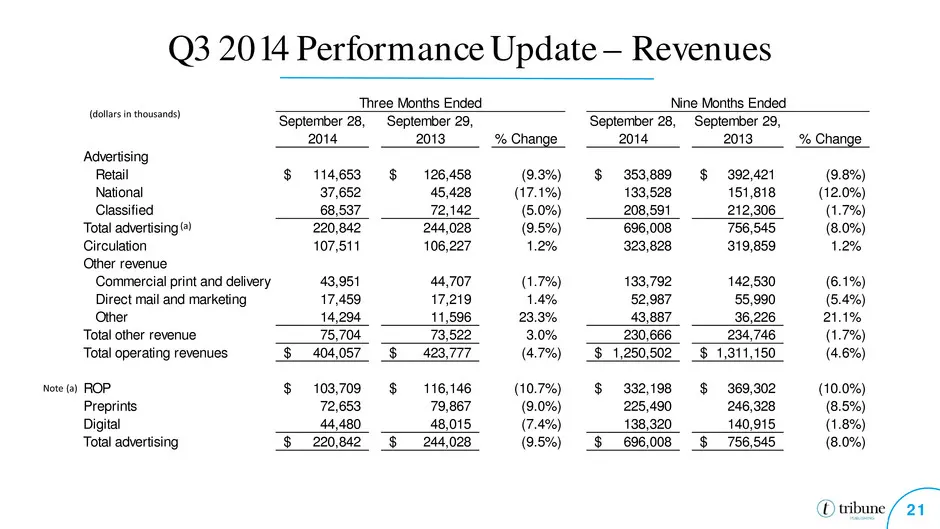
Q3 2014 Performance Update – Revenues 21 September 28, September 29, September 28, September 29, 2014 2013 % Change 2014 2013 % Change Advertising Retail 114,653$ 126,458$ (9.3%) 353,889$ 392,421$ (9.8%) National 37,652 45,428 (17.1%) 133,528 151,818 (12.0%) Classified 68,537 72,142 (5.0%) 208,591 2
Slide 22: Q3 2014 Performance Update – Expenses
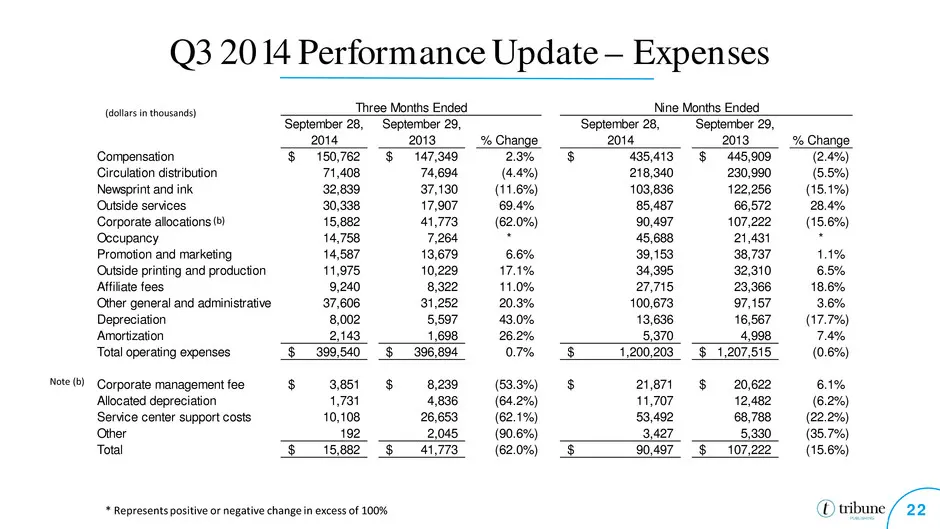
Q3 2014 Performance Update – Expenses 22 September 28, September 29, September 28, September 29, 2014 2013 % Change 2014 2013 % Change Compensation 150,762$ 147,349$ 2.3% 435,413$ 445,909$ (2.4%) Circulation distribution 71,408 74,694 (4.4%) 218,340 230,990 (5.5%) Newsprint and ink 32,839 37,130 (11
Slide 23: GAAP to Non-GAAP Reconciliations
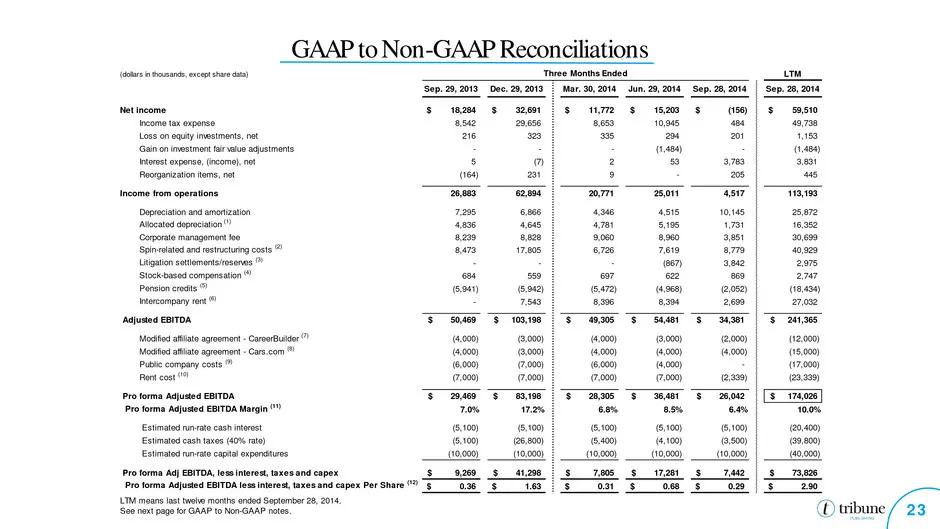
GAAP to Non-GAAP Reconciliations 23 (dollars in thousands, except share data) LTM Sep. 29, 2013 Dec. 29, 2013 Mar. 30, 2014 Jun. 29, 2014 Sep. 28, 2014 Sep. 28, 2014 Net income 18,284$ 32,691$ 11,772$ 15,203$ (156)$ 59,510$ Income tax expense 8,542 29,656 8,653 10,945 484 49,738 Loss on equity inves
Slide 24: Notes: GAAP to Non-GAAP Reconciliations
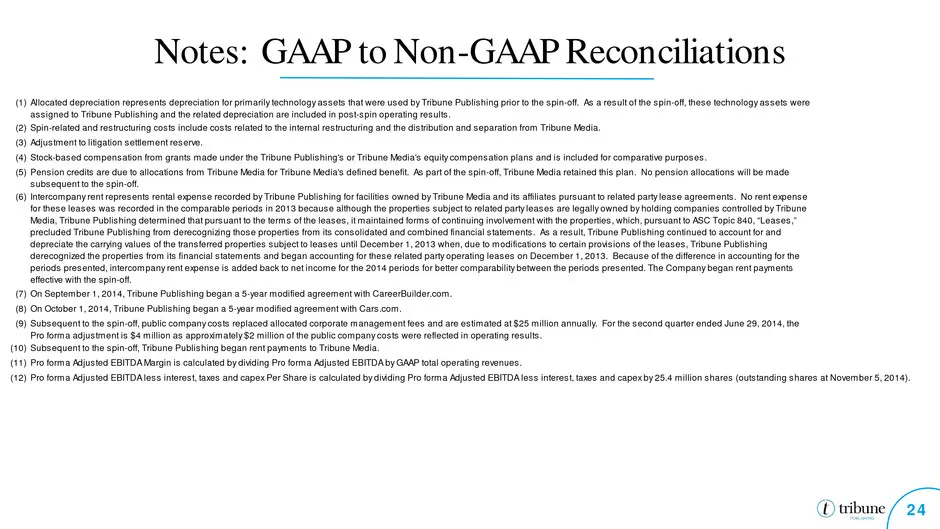
Notes: GAAP to Non-GAAP Reconciliations 24 (1) (2) (3) (4) (5) (6) (7) (8) (9) (10) (11) (12) Pro forma Adjusted EBITDA less interest, taxes and capex Per Share is calculated by dividing Pro forma Adjusted EBITDA less interest, taxes and capex by 25.4 million shares (outstanding shares at November 5

Slide 25: Appendix
Appendix
Slide 26: GAAP Income Statement
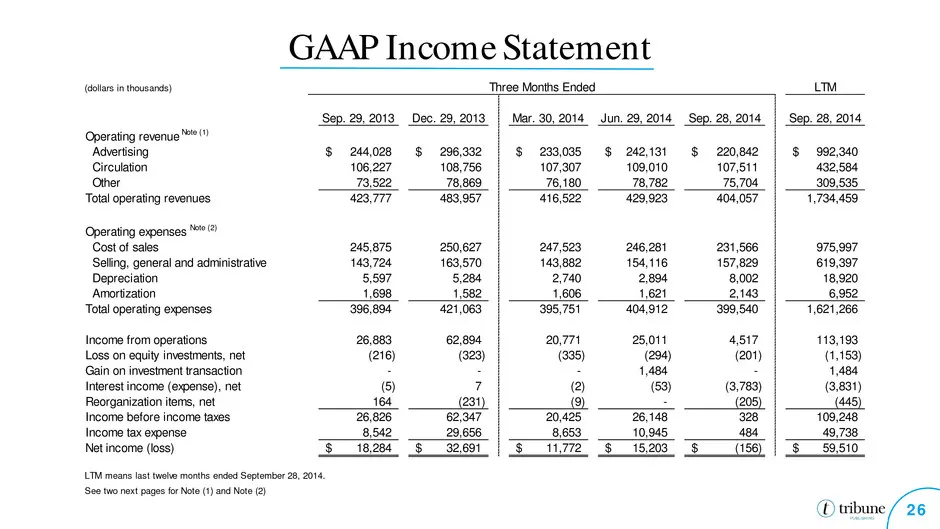
GAAP Income Statement 26 (dollars in thousands) LTM Sep. 29, 2013 Dec. 29, 2013 Mar. 30, 2014 Jun. 29, 2014 Sep. 28, 2014 Sep. 28, 2014 Operating revenue Note (1) Advertising 244,028$ 296,332$ 233,035$ 242,131$ 220,842$ 992,340$ Circulation 106,227 108,756 107,307 109,010 107,511 432,584 Other 73,52
Slide 27: Supplemental Revenue Information
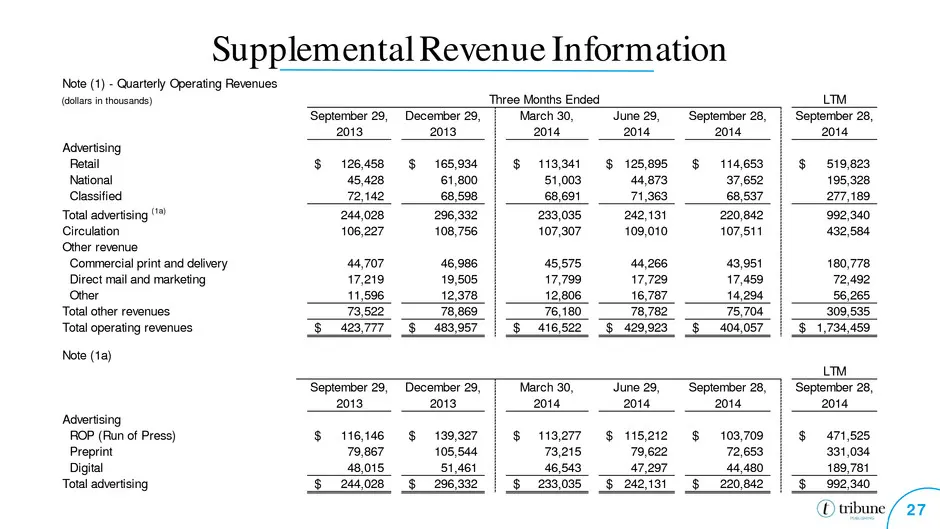
Supplemental Revenue Information 27 Note (1) - Quarterly Operating Revenues (dollars in thousands) LTM September 29, 2013 December 29, 2013 March 30, 2014 June 29, 2014 September 28, 2014 September 28, 2014 Advertising Retail 126,458$ 165,934$ 113,341$ 125,895$ 114,653$ 519,823$ National 45,428 61,8
Slide 28: Supplemental Operating Expense Information
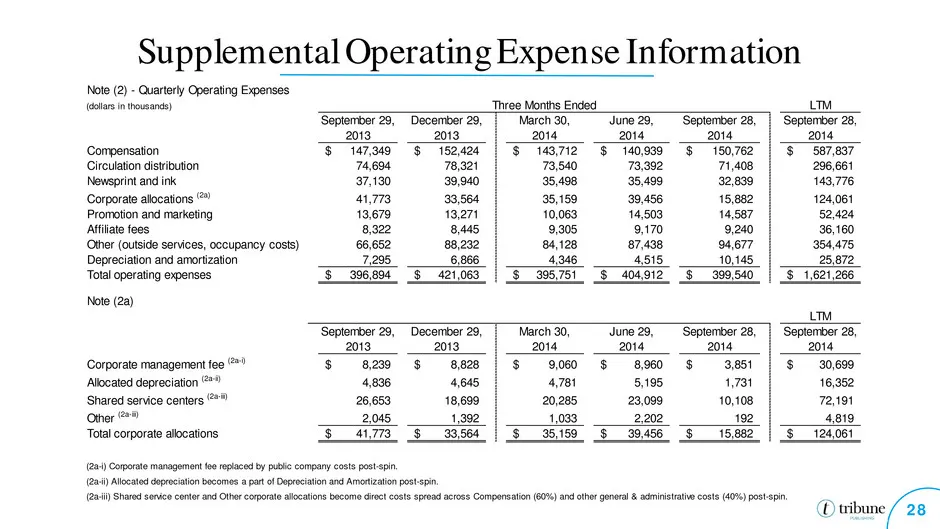
Supplemental Operating Expense Information 28 Note (2) - Quarterly Operating Expenses (dollars in thousands) LTM September 29, 2013 December 29, 2013 March 30, 2014 June 29, 2014 September 28, 2014 September 28, 2014 Compensation 147,349$ 152,424$ 143,712$ 140,939$ 150,762$ 587,837$ Circulation dist
Source: SEC EDGAR · 8-K filed Nov 19, 2014
More decks from tronc Inc
 NobleCon13 (January 2017)12 slides · Jan 30, 2017
 Q2 2016 Earnings Presentation20 slides · Aug 3, 2016
 Tribune Publishing — Proxy Contest (May 2016)40 slides · May 13, 2016
 Tribune Publishing — UBS 43rd Annual Global Media and Communications Conference 201521 slides · Dec 9, 2015
 Tribune Publishing — Q2 2015 Earnings Presentation27 slides · Aug 19, 2015
 Tribune Publishing — Investor Presentation (June 2015)25 slides · Jun 9, 2015