Scatec ASA · OSL:SCATC
Scatec ASA — Q1 2021 Earnings Presentation
30 slides from Scatec ASA's earnings presentation, April 2021
Slide 1: First quarter 2021: Strong growth and solid cash flow
First quarter 2021 Strong growth and solid cash flow
Slide 2: Disclaimer
Disclaimer The following presentation is being made only to, and is only directed at, persons to whom such presentation may lawfully be communicated (’relevant persons’). Any person who is not a relevant person should not rely, act or make assessment on the basis of this presentation or anything inc
Slide 3: Agenda
Agenda • Highlights and project update Raymond Carlsen, CEO • Financial review Mikkel Tørud, CFO • Market & outlook Raymond Carlsen, CEO 3
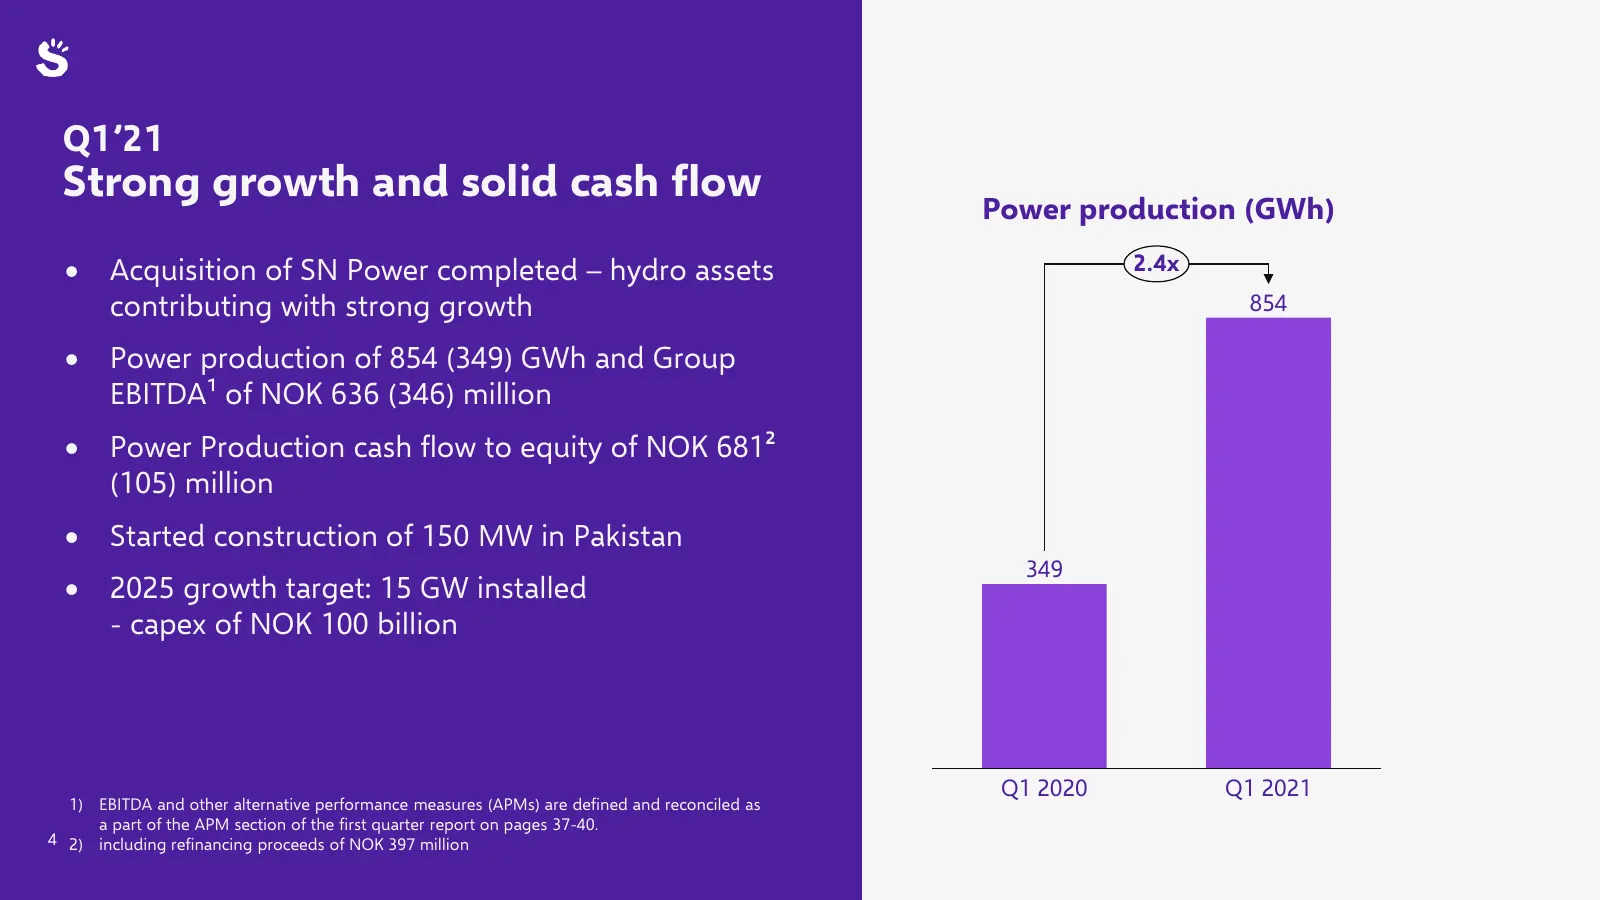
Slide 4: Strong growth and solid cash flow
Q1’21 Strong growth and solid cash flow Power production (GWh) • Acquisition of SN Power completed – hydro assets 2.4x contributing with strong growth 854 • Power production of 854 (349) GWh and Group EBITDA¹ of NOK 636 (346) million • Power Production cash flow to equity of NOK 681² (105) million •
Slide 5: A broad and growing asset portfolio
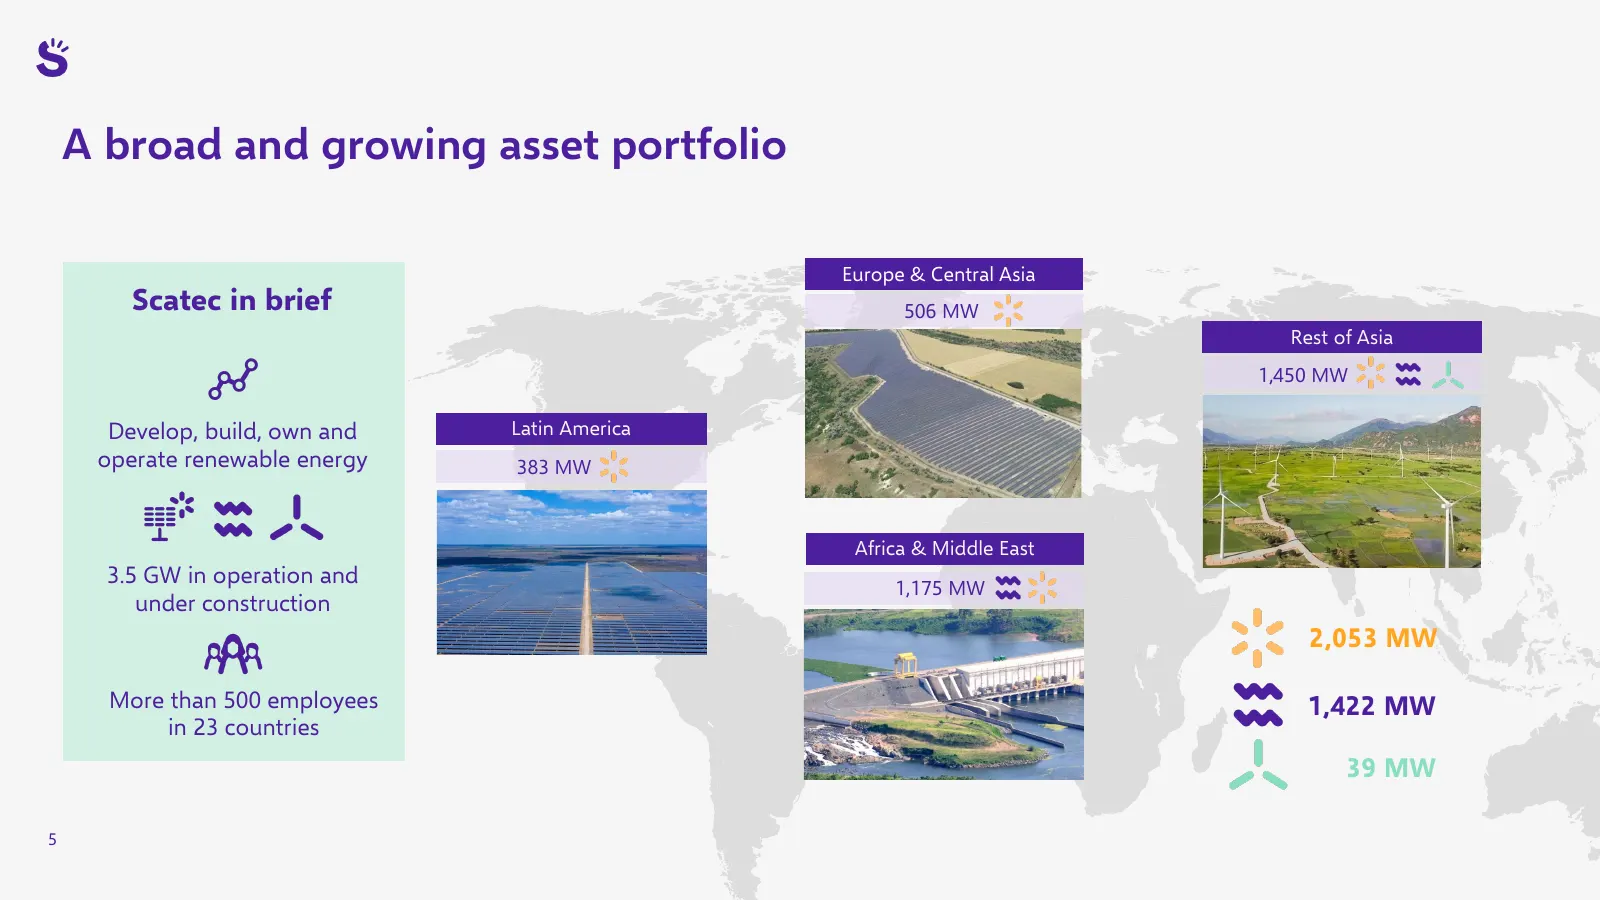
A broad and growing asset portfolio Europe & Central Asia Scatec in brief 506 MW Rest of Asia 1,450 MW Develop, build, own and Latin America operate renewable energy 383 MW Africa & Middle East 3.5 GW in operation and 1,175 MW under construction 2,053 MW More than 500 employees 1,422 MW in 23 countr
Slide 6: Mature projects expected to start construction in 2021
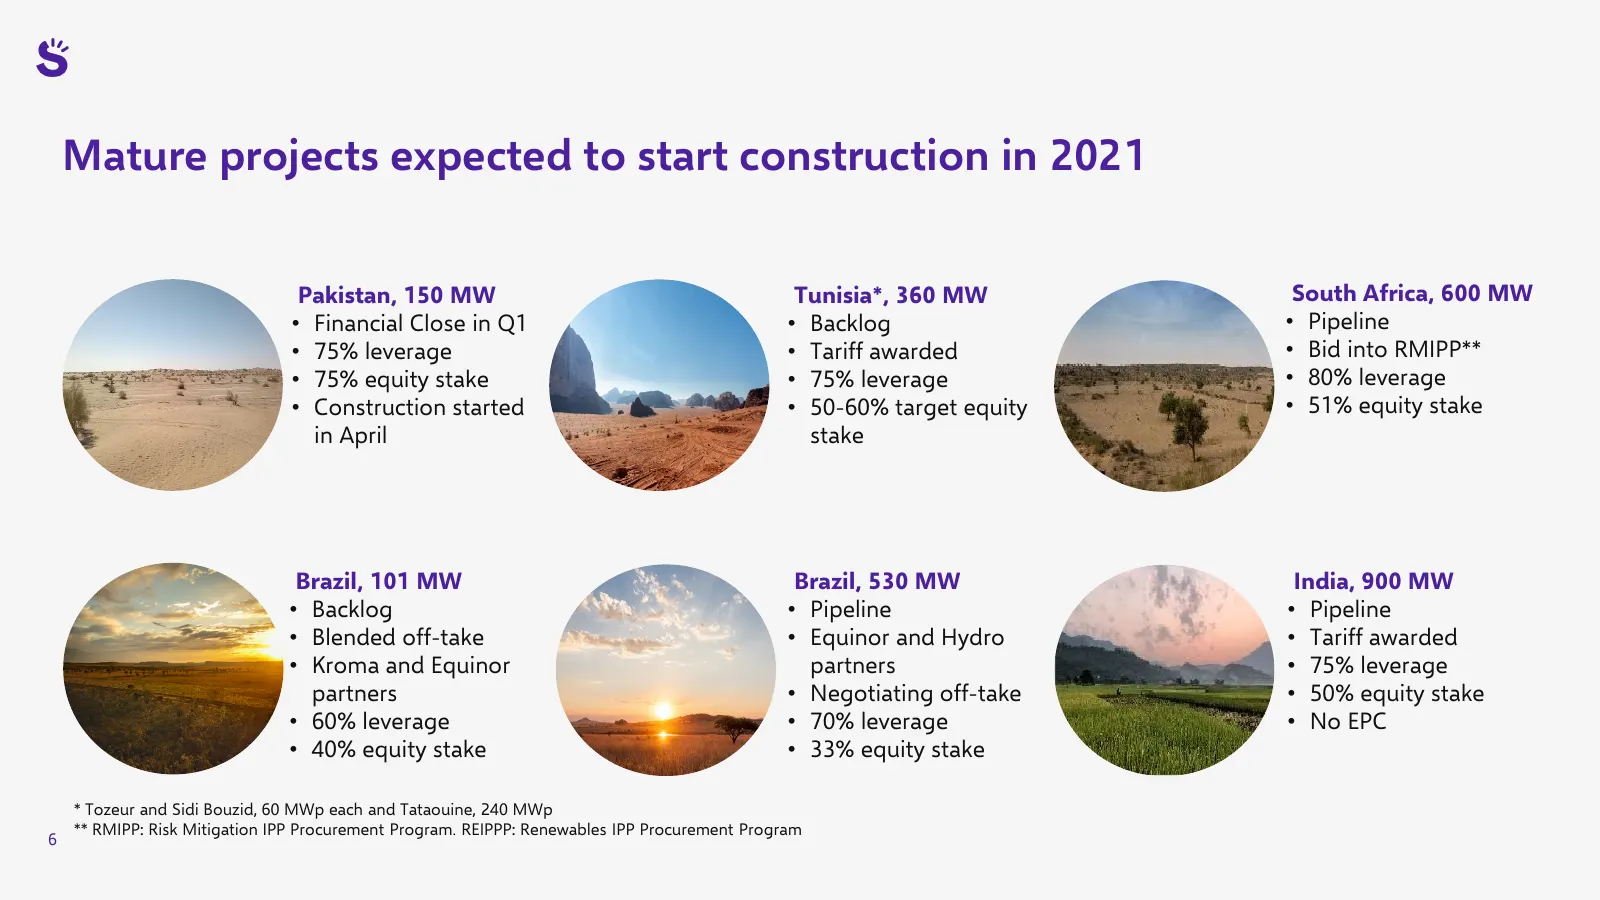
Mature projects expected to start construction in 2021 Pakistan, 150 MW Tunisia*, 360 MW South Africa, 600 MW • Financial Close in Q1 • Backlog • Pipeline • 75% leverage • Tariff awarded • Bid into RMIPP** • 75% equity stake • 75% leverage • 80% leverage • Construction started • 50-60% target equity
Slide 7: ESG: Maintaining our strong presence in local communities
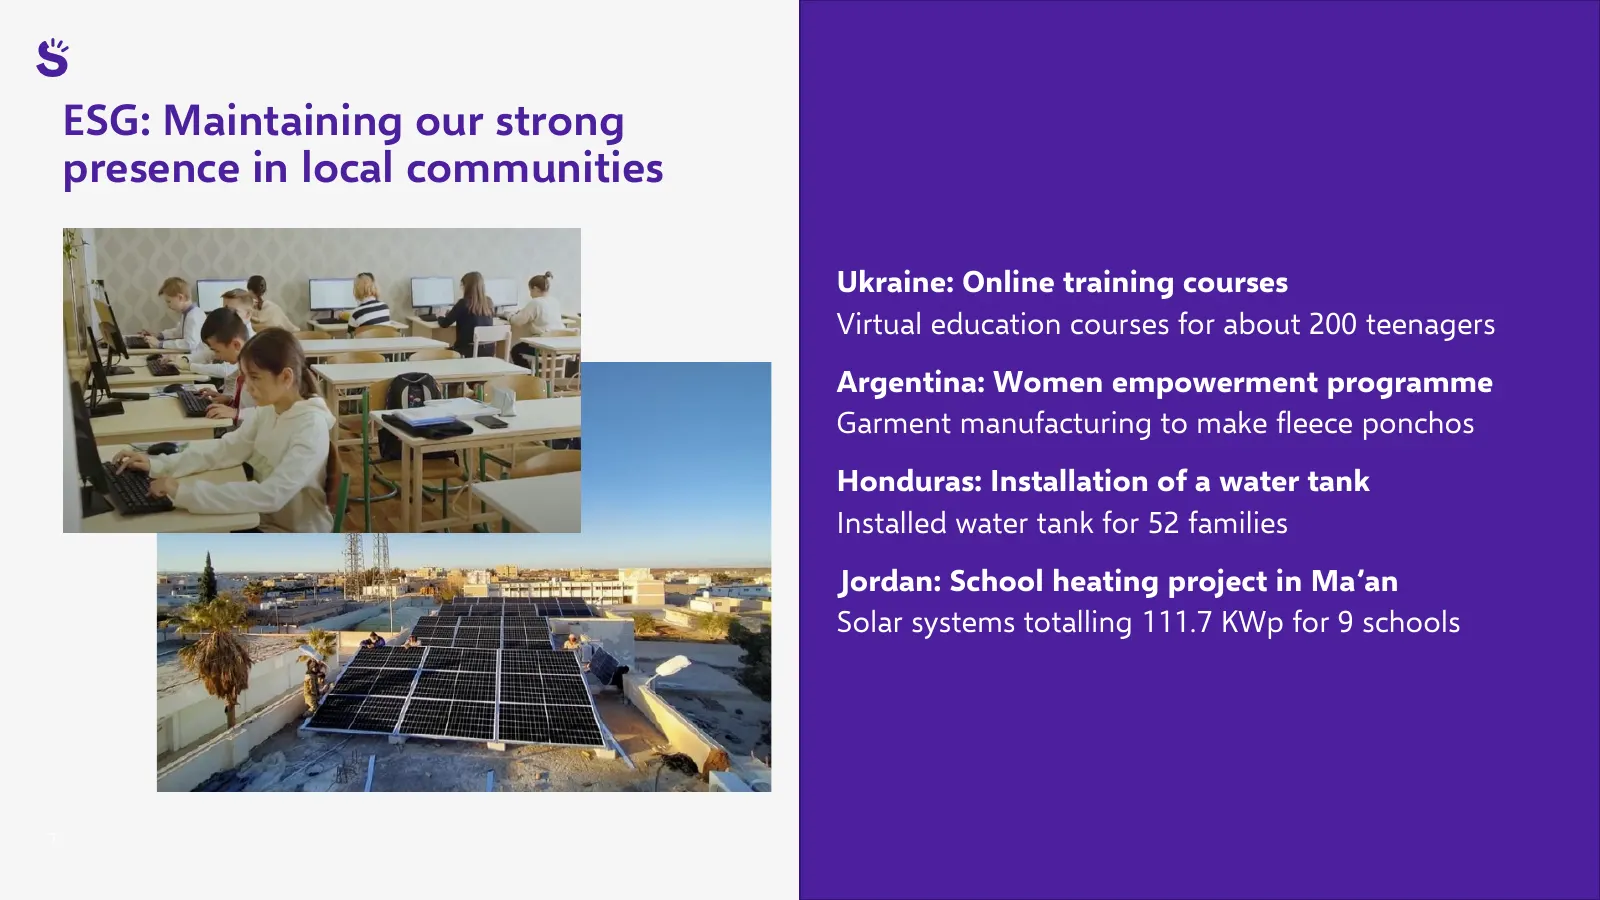
ESG: Maintaining our strong presence in local communities Ukraine: Online training courses Virtual education courses for about 200 teenagers Argentina: Women empowerment programme Garment manufacturing to make fleece ponchos Honduras: Installation of a water tank Installed water tank for 52 families
Slide 8: ESG ambitions and key focus areas
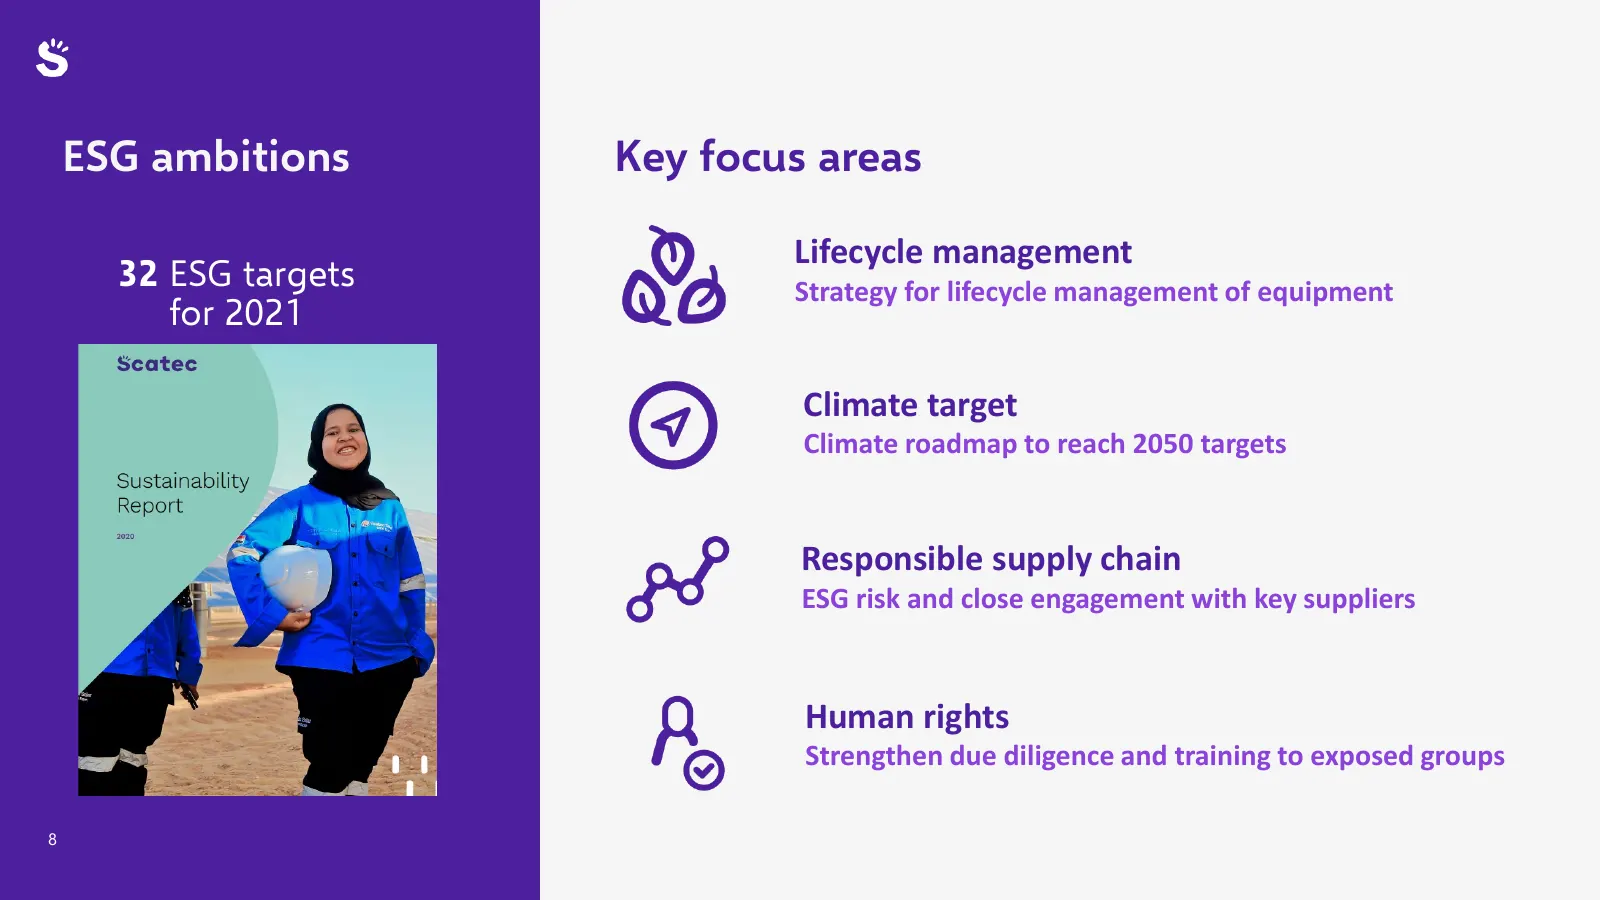
ESG ambitions Key focus areas Lifecycle management 32 ESG targets Strategy for lifecycle management of equipment for 2021 Climate target Climate roadmap to reach 2050 targets Responsible supply chain ESG risk and close engagement with key suppliers Human rights Strengthen due diligence and training

Slide 9: Financial review
Financial review Mikkel Tørud, CFO 9
Slide 10: Strong growth in revenues and EBITDA
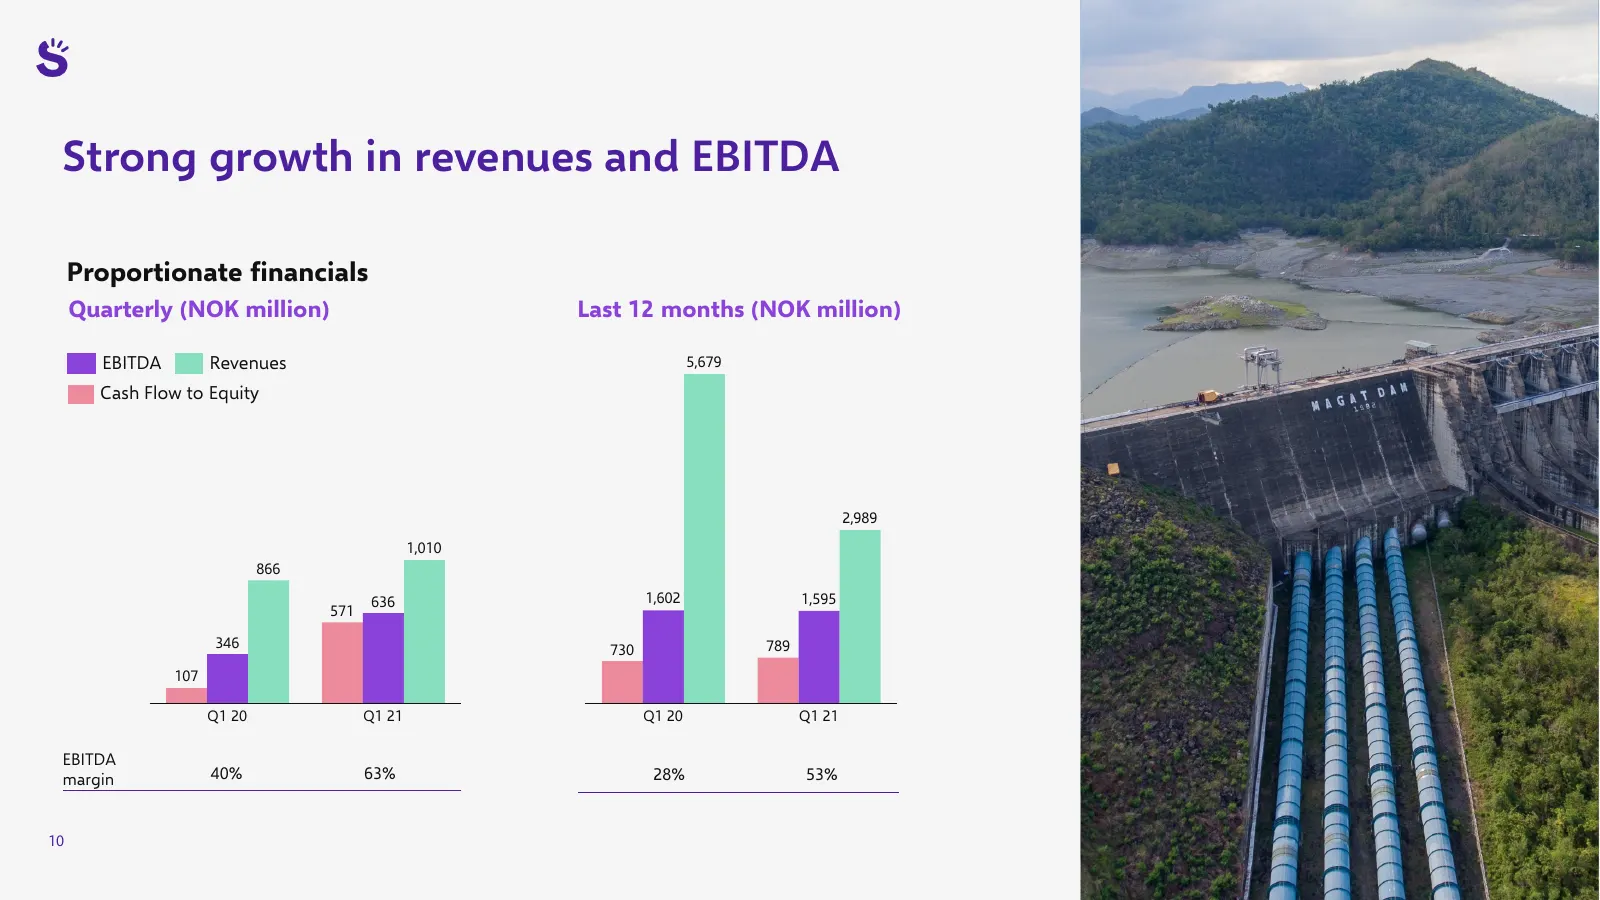
Strong growth in revenues and EBITDA Proportionate financials Quarterly (NOK million) Last 12 months (NOK million) EBITDA Revenues 5,679 Cash Flow to Equity 2,989 1,010 866 636 1,602 1,595 571 346 730 789 107 Q1 20 Q1 21 Q1 20 Q1 21 EBITDA margin 40% 63% 28% 53% 10
Slide 11: Growth in Power Production partly offset by D&C
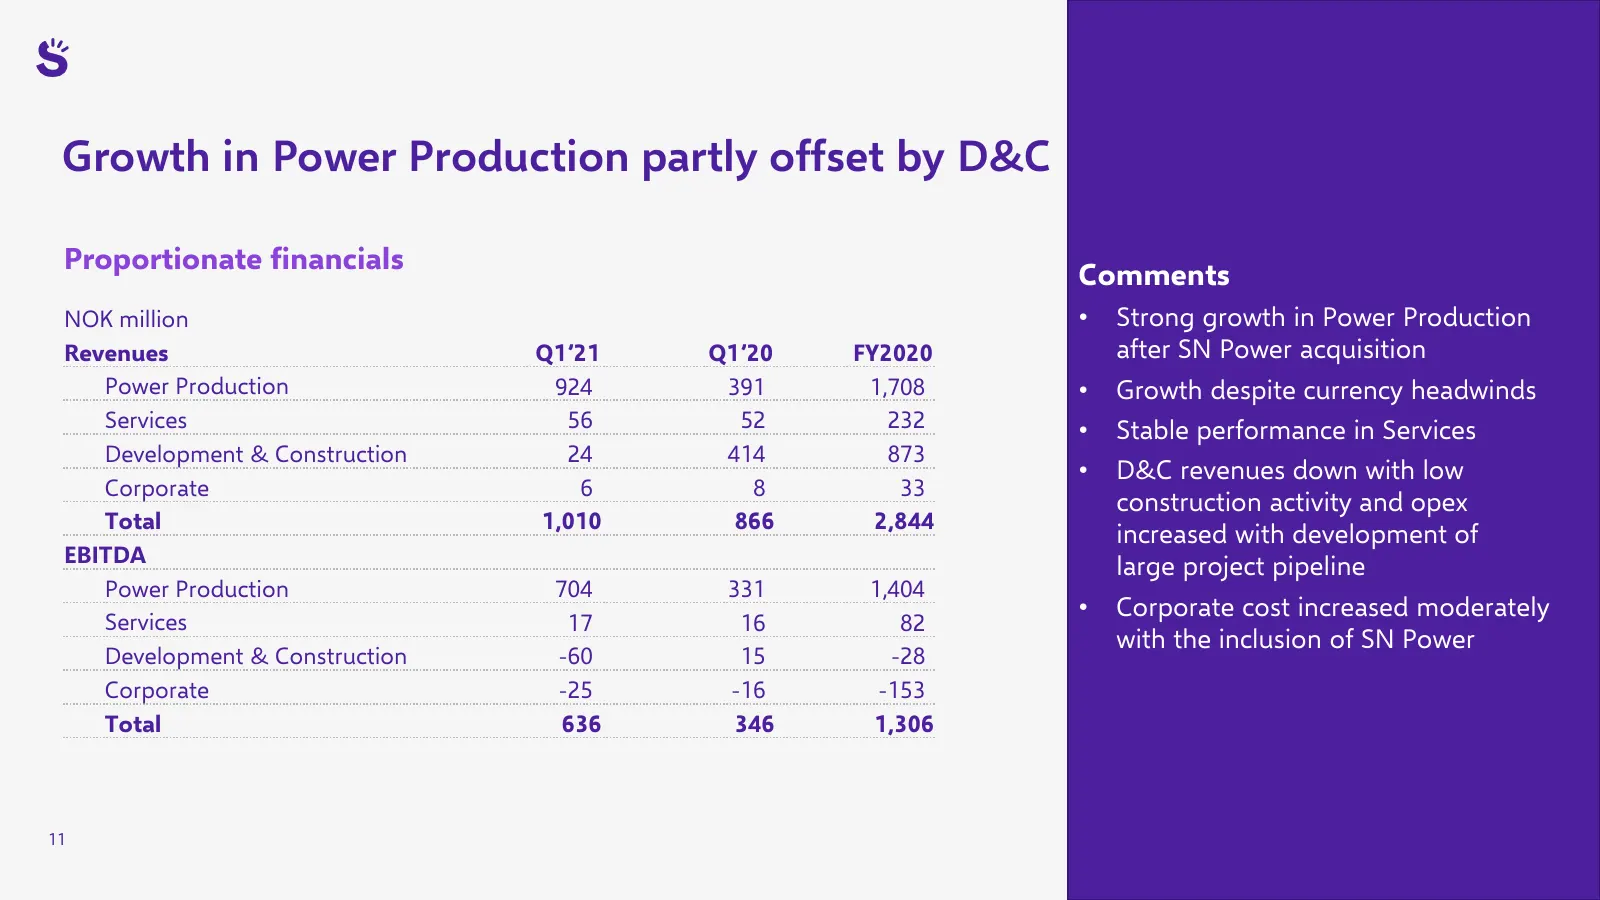
Growth in Power Production partly offset by D&C Proportionate financials Comments NOK million • Strong growth in Power Production Revenues Q1’21 Q1’20 FY2020 after SN Power acquisition Power Production 924 391 1,708 • Growth despite currency headwinds Services 56 52 232 • Stable performance in Servi
Slide 12: Power Production: Strong increase in power production
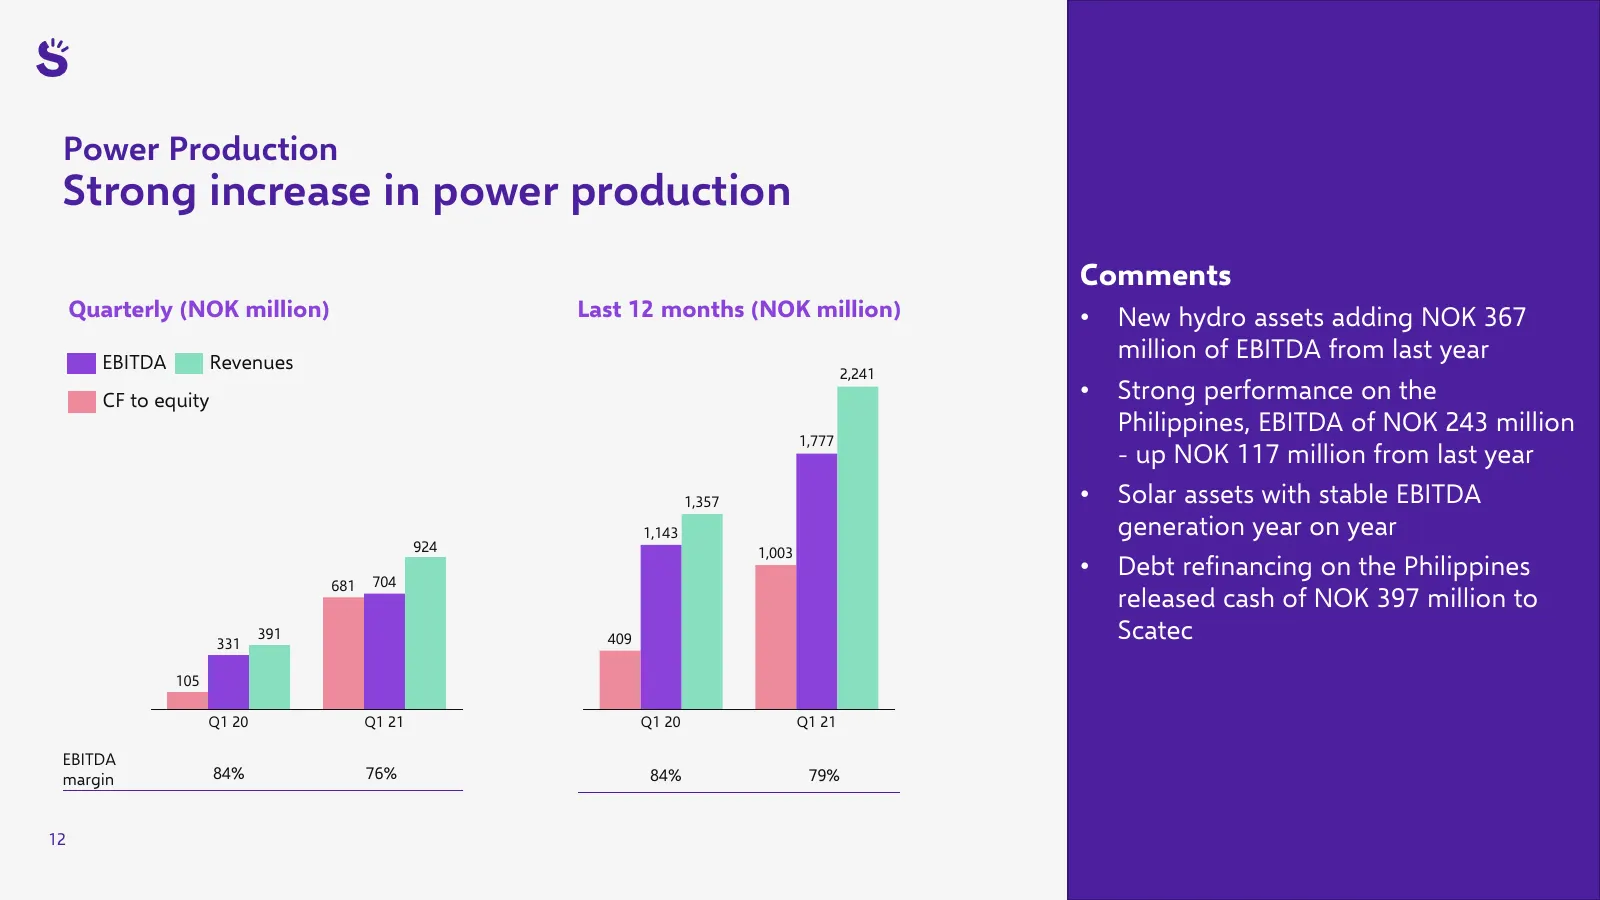
Power Production Strong increase in power production Comments Quarterly (NOK million) Last 12 months (NOK million) • New hydro assets adding NOK 367 EBITDA Revenues million of EBITDA from last year 2,241 CF to equity • Strong performance on the Philippines, EBITDA of NOK 243 million 1,777 - up NOK 1
Slide 13: A well diversified power plant portfolio
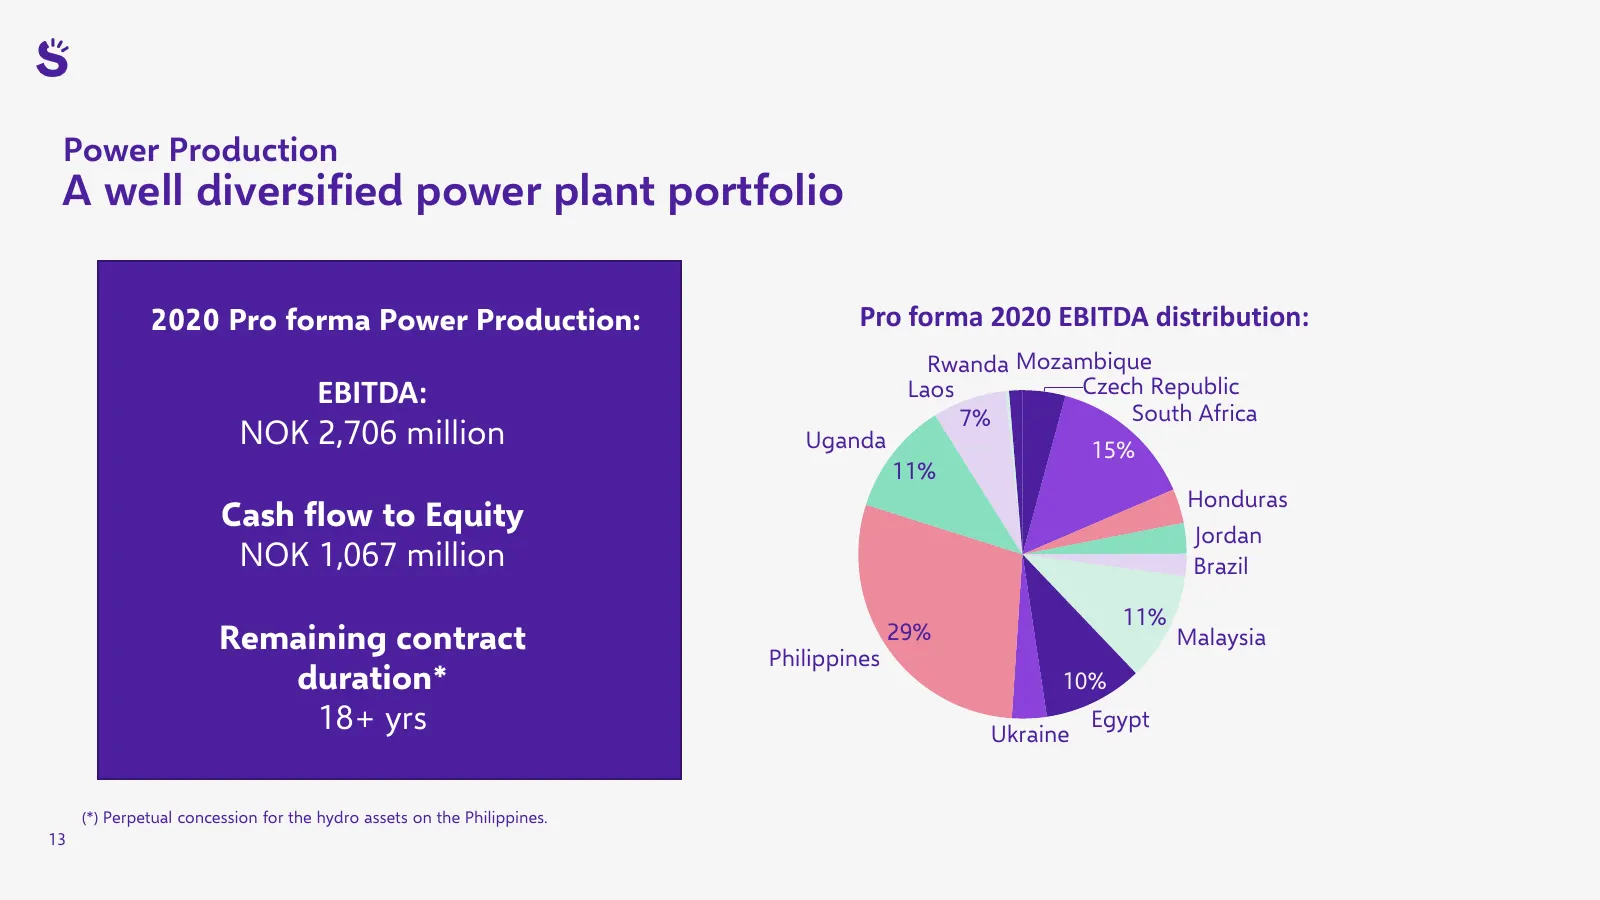
Power Production A well diversified power plant portfolio 2020 Pro forma Power Production: Pro forma 2020 EBITDA distribution: Rwanda Mozambique EBITDA: Laos Czech Republic 7% South Africa NOK 2,706 million Uganda 15% 11% Honduras Cash flow to Equity Jordan NOK 1,067 million Brazil 11% Remaining con
Slide 14: Services: Stable financial performance
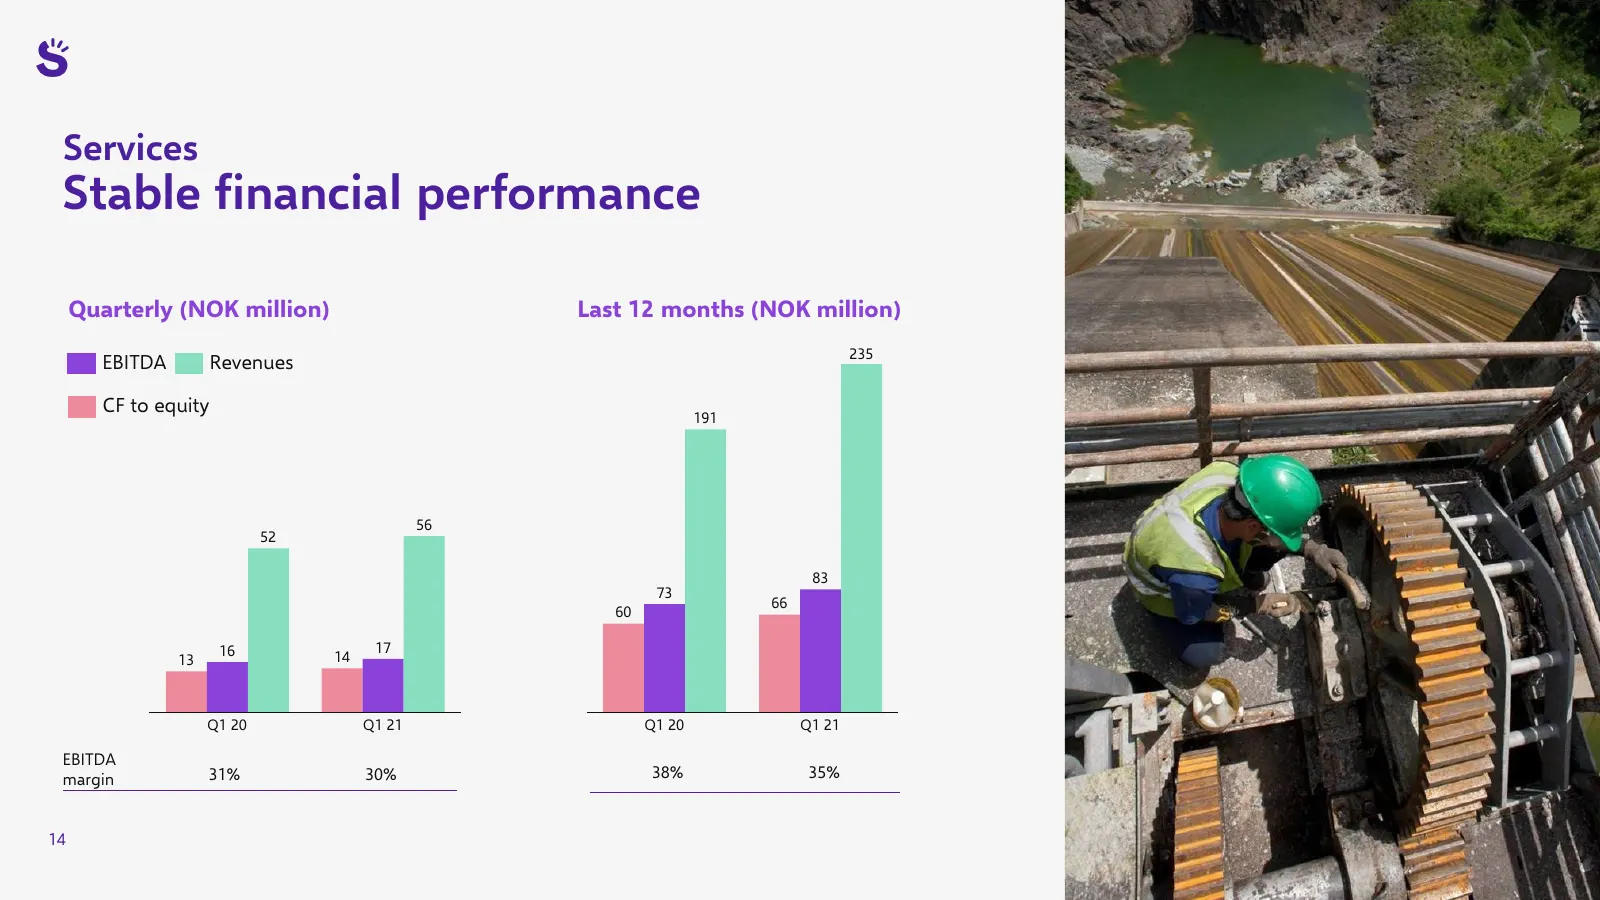
Services Stable financial performance Quarterly (NOK million) Last 12 months (NOK million) 235 EBITDA Revenues CF to equity 191 56 52 83 73 66 60 16 17 13 14 Q1 20 Q1 21 Q1 20 Q1 21 EBITDA margin 31% 30% 38% 35% 14
Slide 15: Development & Construction: Increased project development efforts
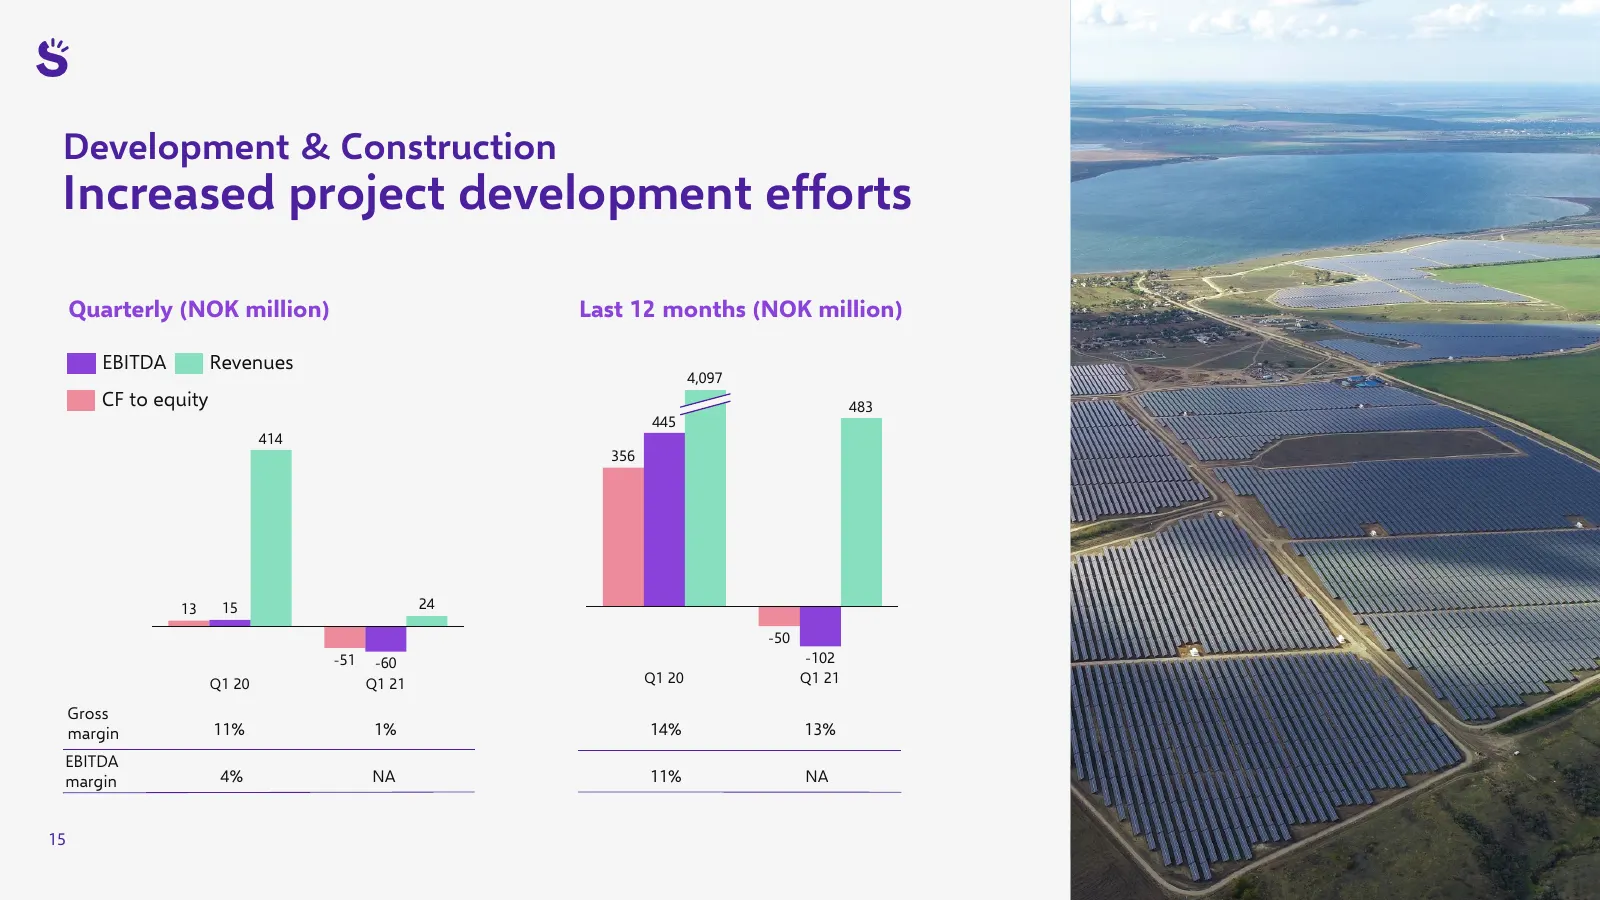
Development & Construction Increased project development efforts Quarterly (NOK million) Last 12 months (NOK million) EBITDA Revenues 4,097 CF to equity 483 445 414 356 13 15 24 -50 -51 -60 -102 Q1 20 Q1 21 Q1 20 Q1 21 Gross margin 11% 1% 14% 13% EBITDA margin 4% NA 11% NA 15
Slide 16: Bridging proportionate to consolidated P&L
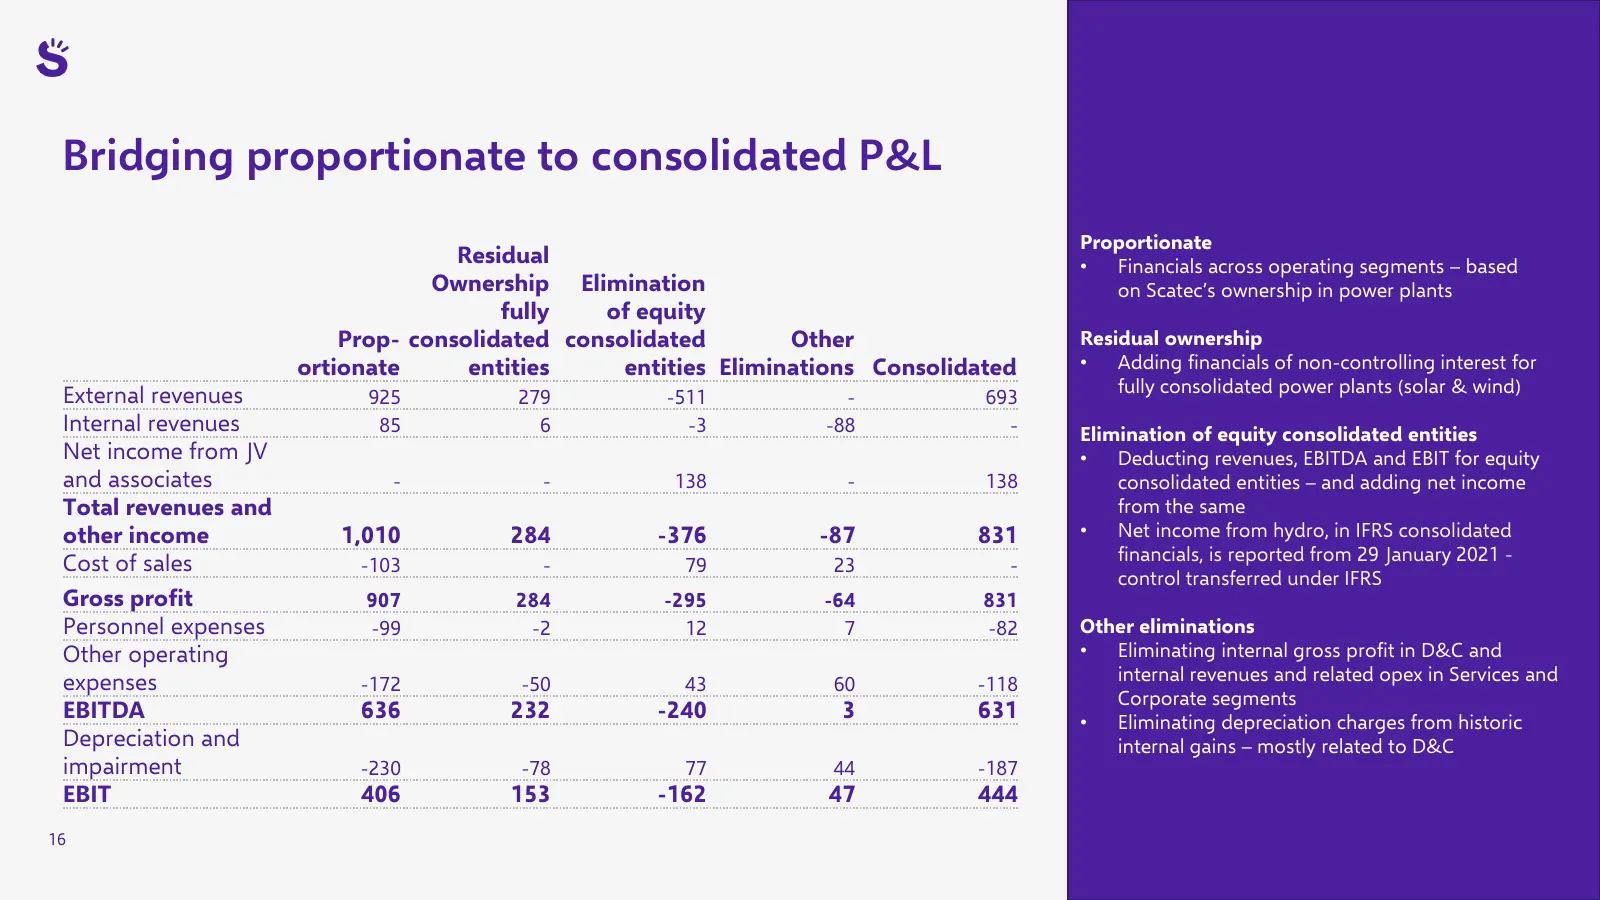
Bridging proportionate to consolidated P&L Proportionate Residual • Financials across operating segments – based Ownership Elimination on Scatec’s ownership in power plants fully of equity Prop- consolidated consolidated Other Residual ownership ortionate entities entities Eliminations Consolidated
Slide 17: A solid financial position
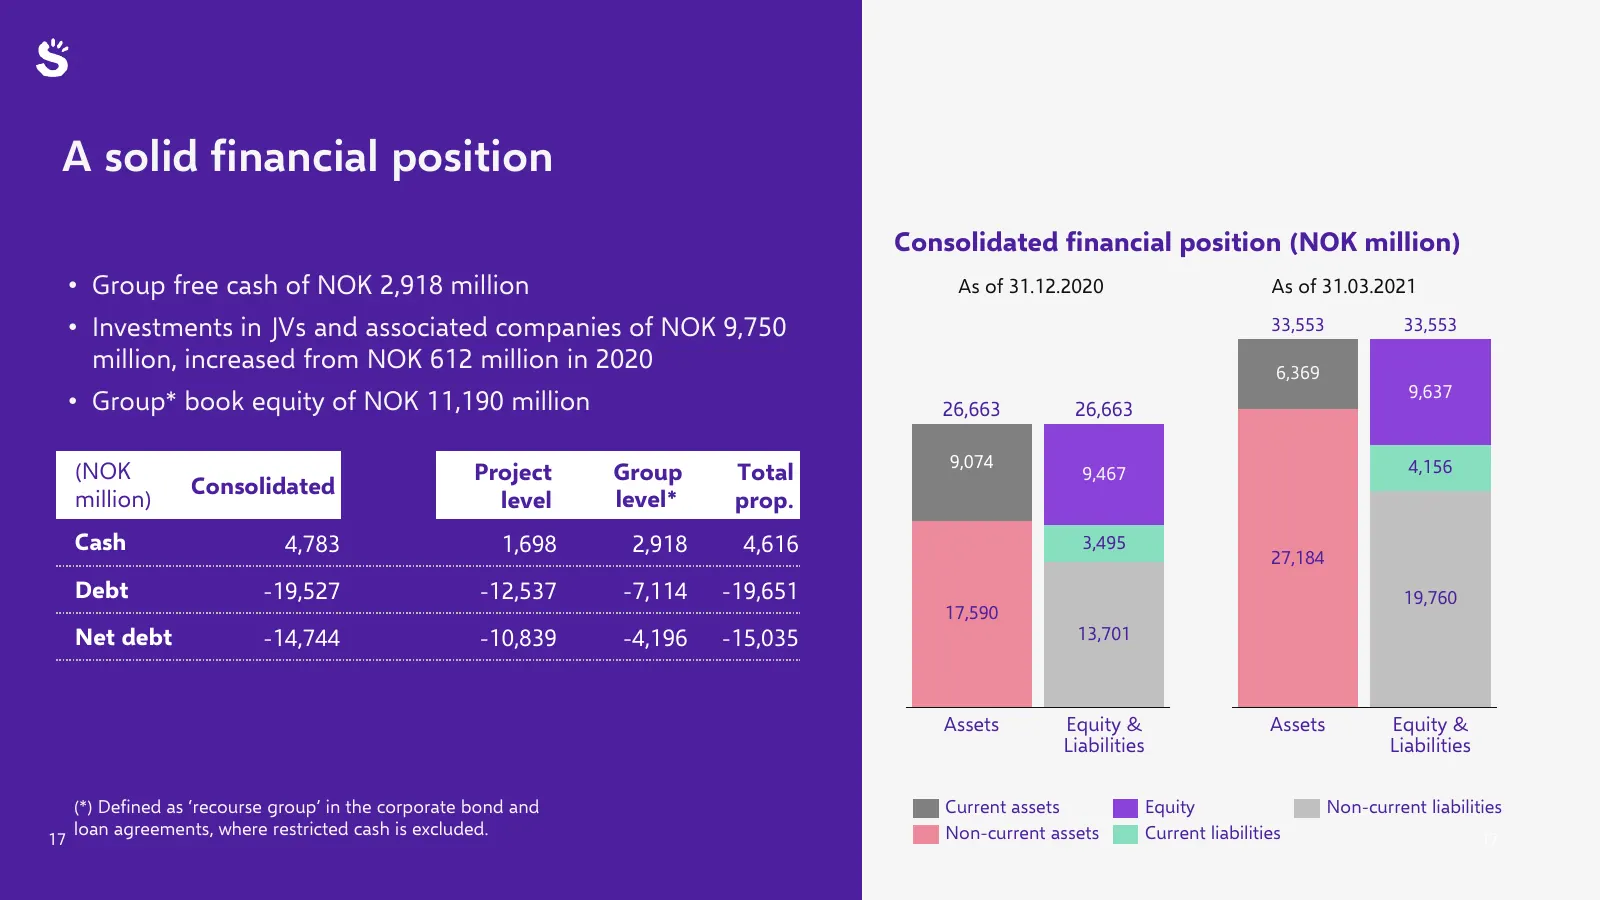
A solid financial position Consolidated financial position (NOK million) • Group free cash of NOK 2,918 million As of 31.12.2020 As of 31.03.2021 • Investments in JVs and associated companies of NOK 9,750 33,553 33,553 million, increased from NOK 612 million in 2020 6,369 9,637 • Group* book equity
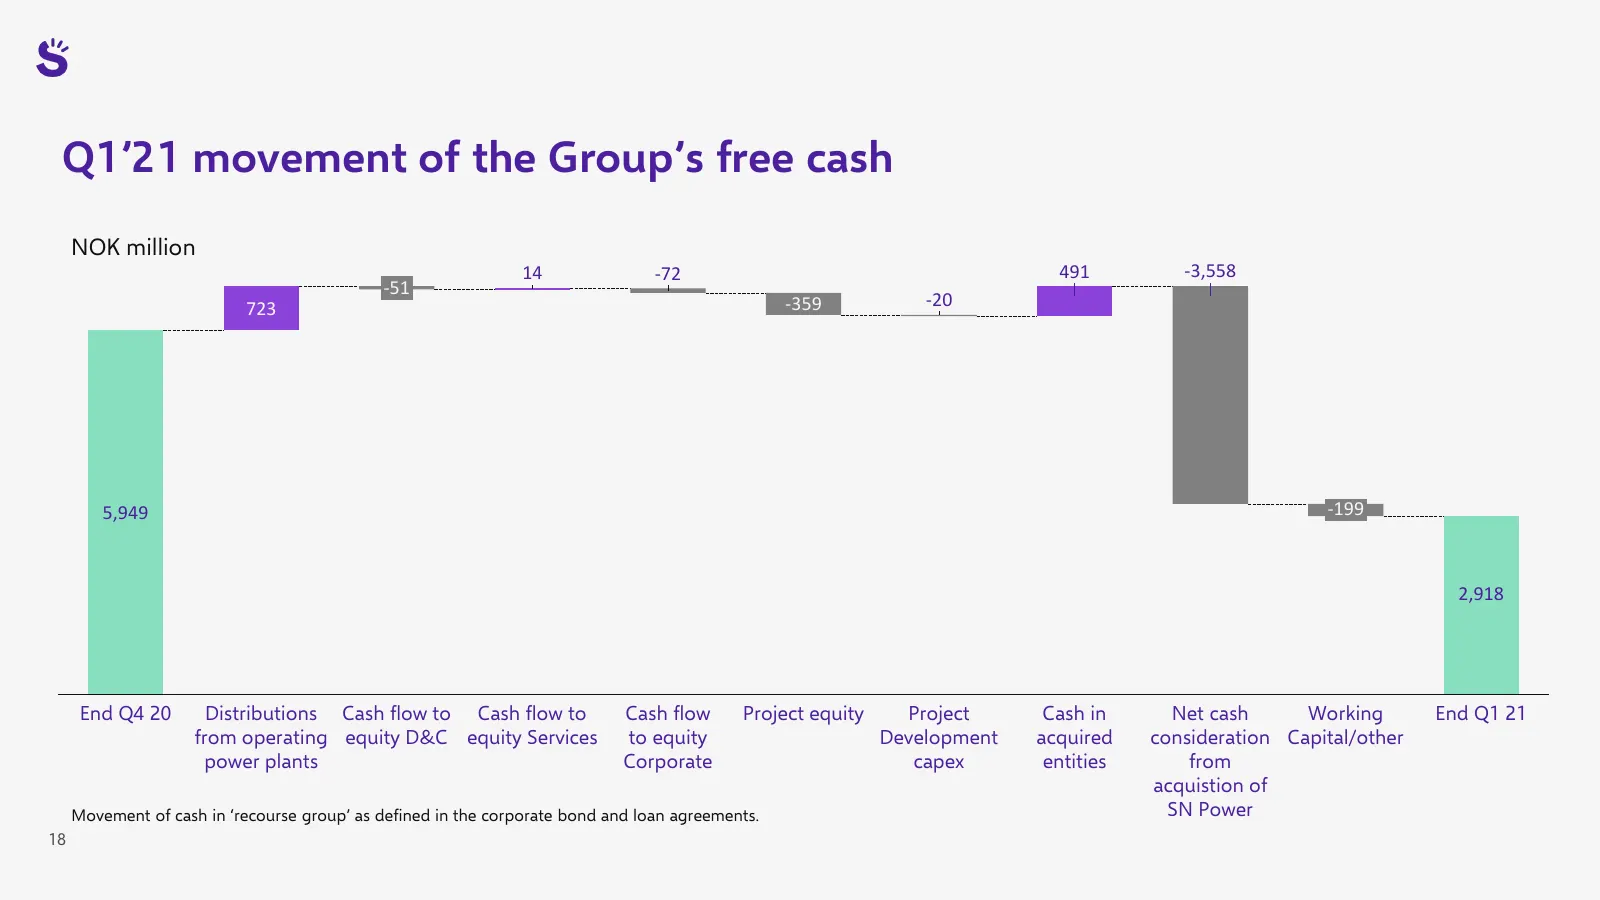
Slide 18: Q1'21 movement of the Group's free cash
Q1’21 movement of the Group’s free cash NOK million 14 -72 491 -3,558 -51 723 -359 -20 5,949 -199 2,918 End Q4 20 Distributions Cash flow to Cash flow to Cash flow Project equity Project Cash in Net cash Working End Q1 21 from operating equity D&C equity Services to equity Development acquired consi
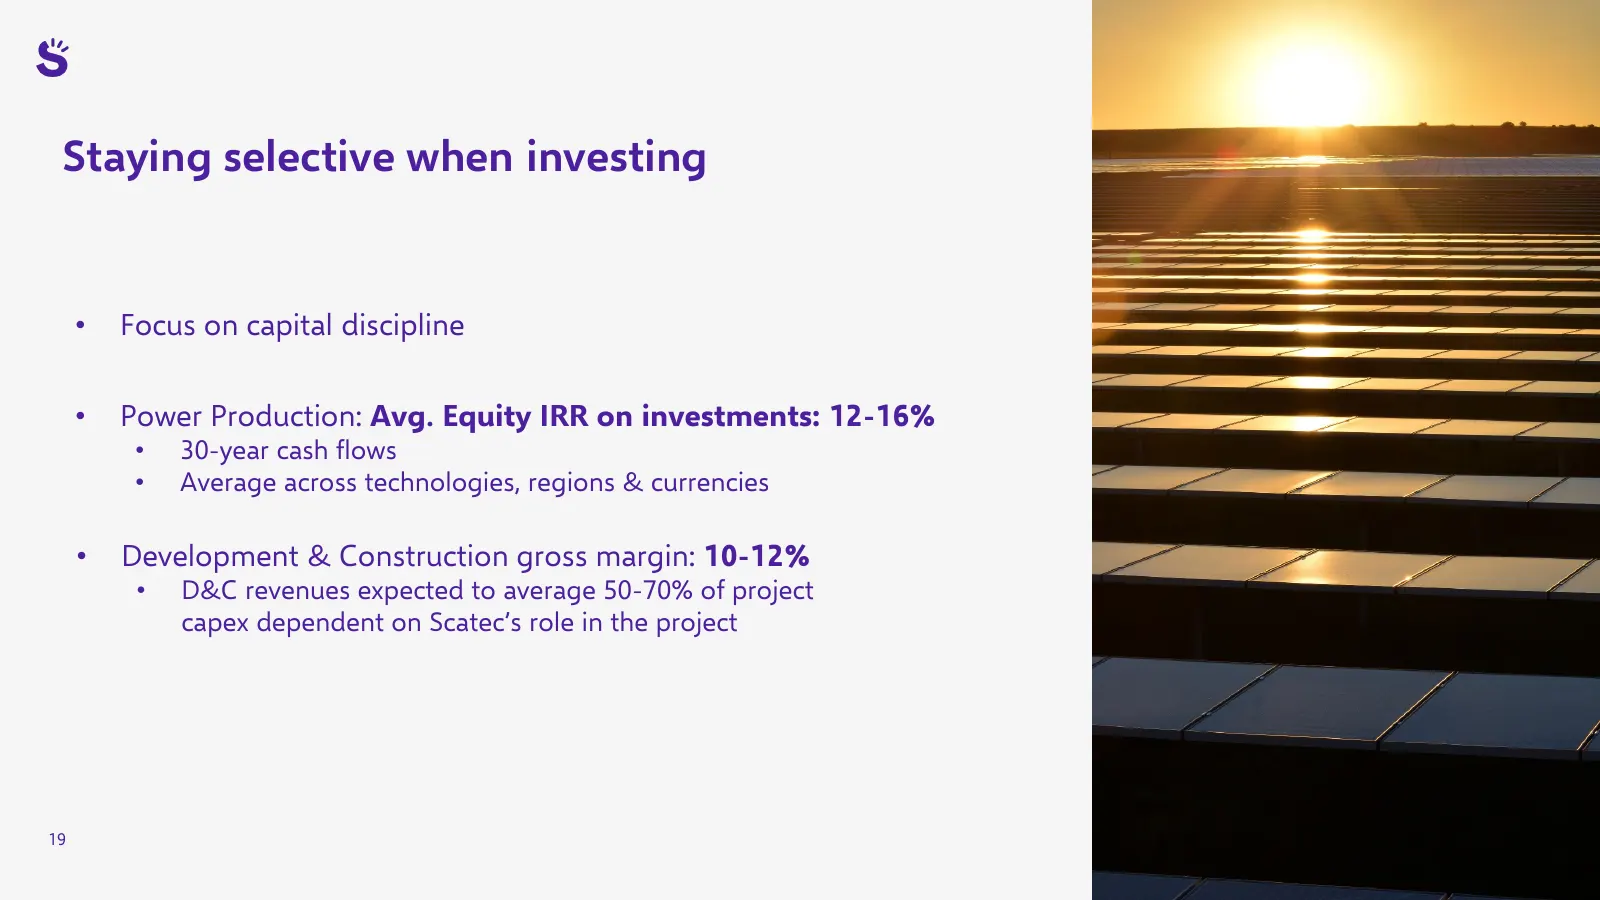
Slide 19: Staying selective when investing
Staying selective when investing • Focus on capital discipline • Power Production: Avg. Equity IRR on investments: 12-16% • 30-year cash flows • Average across technologies, regions & currencies • Development & Construction gross margin: 10-12% • D&C revenues expected to average 50-70% of project ca
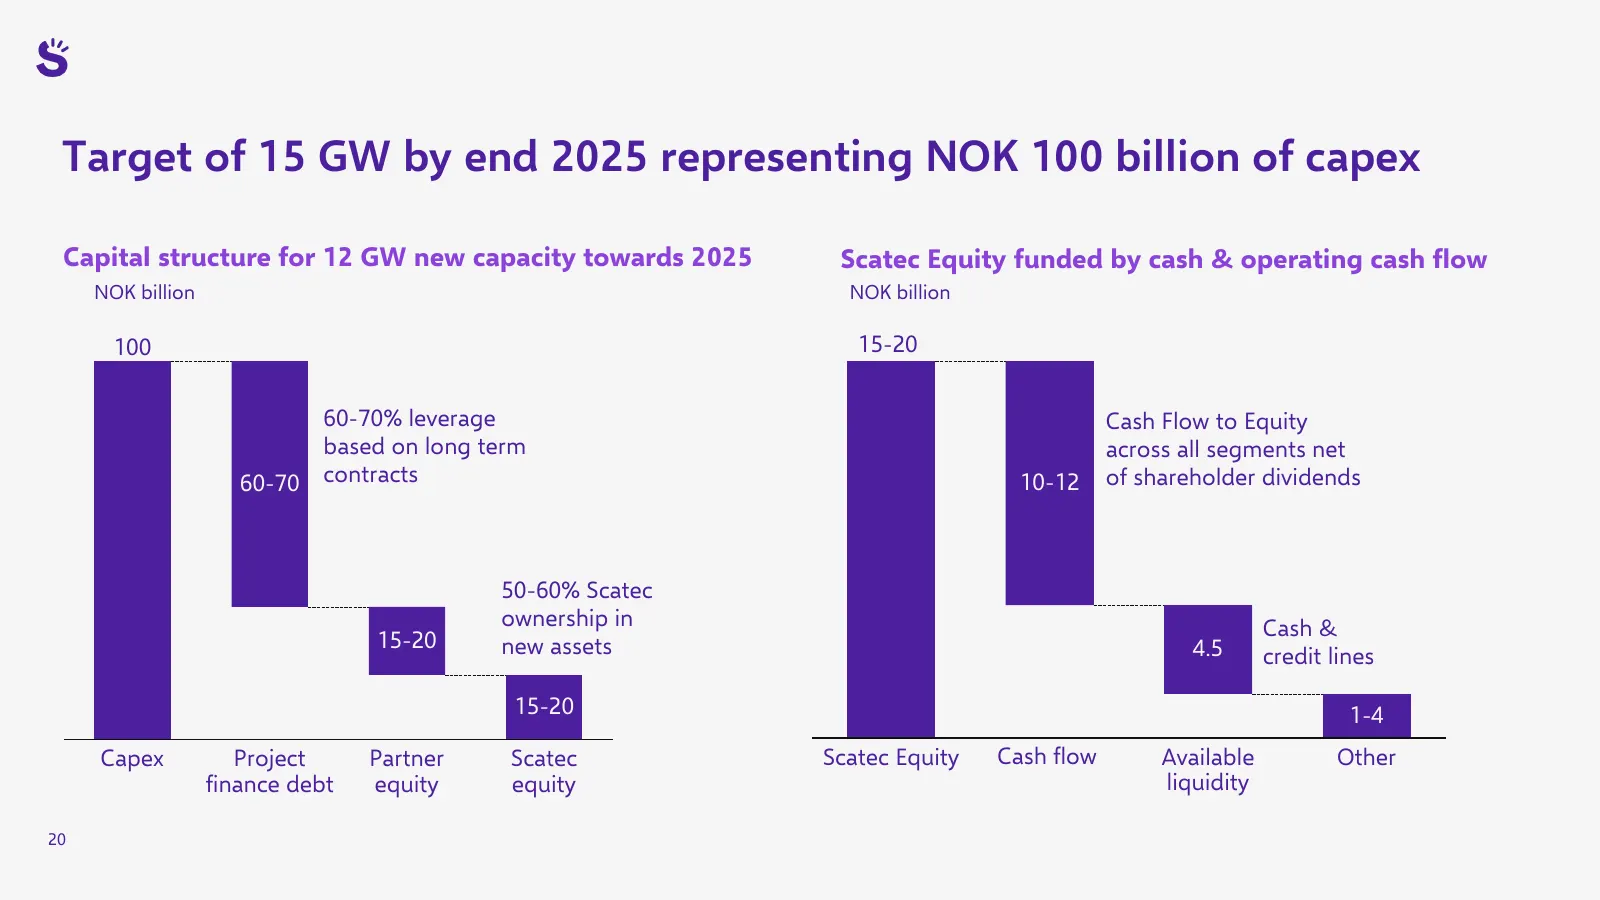
Slide 20: Target of 15 GW by end 2025 representing NOK 100 billion of capex
Target of 15 GW by end 2025 representing NOK 100 billion of capex Capital structure for 12 GW new capacity towards 2025 Scatec Equity funded by cash & operating cash flow NOK billion NOK billion 100 15-20 60-70% leverage Cash Flow to Equity based on long term across all segments net 60-70 contracts
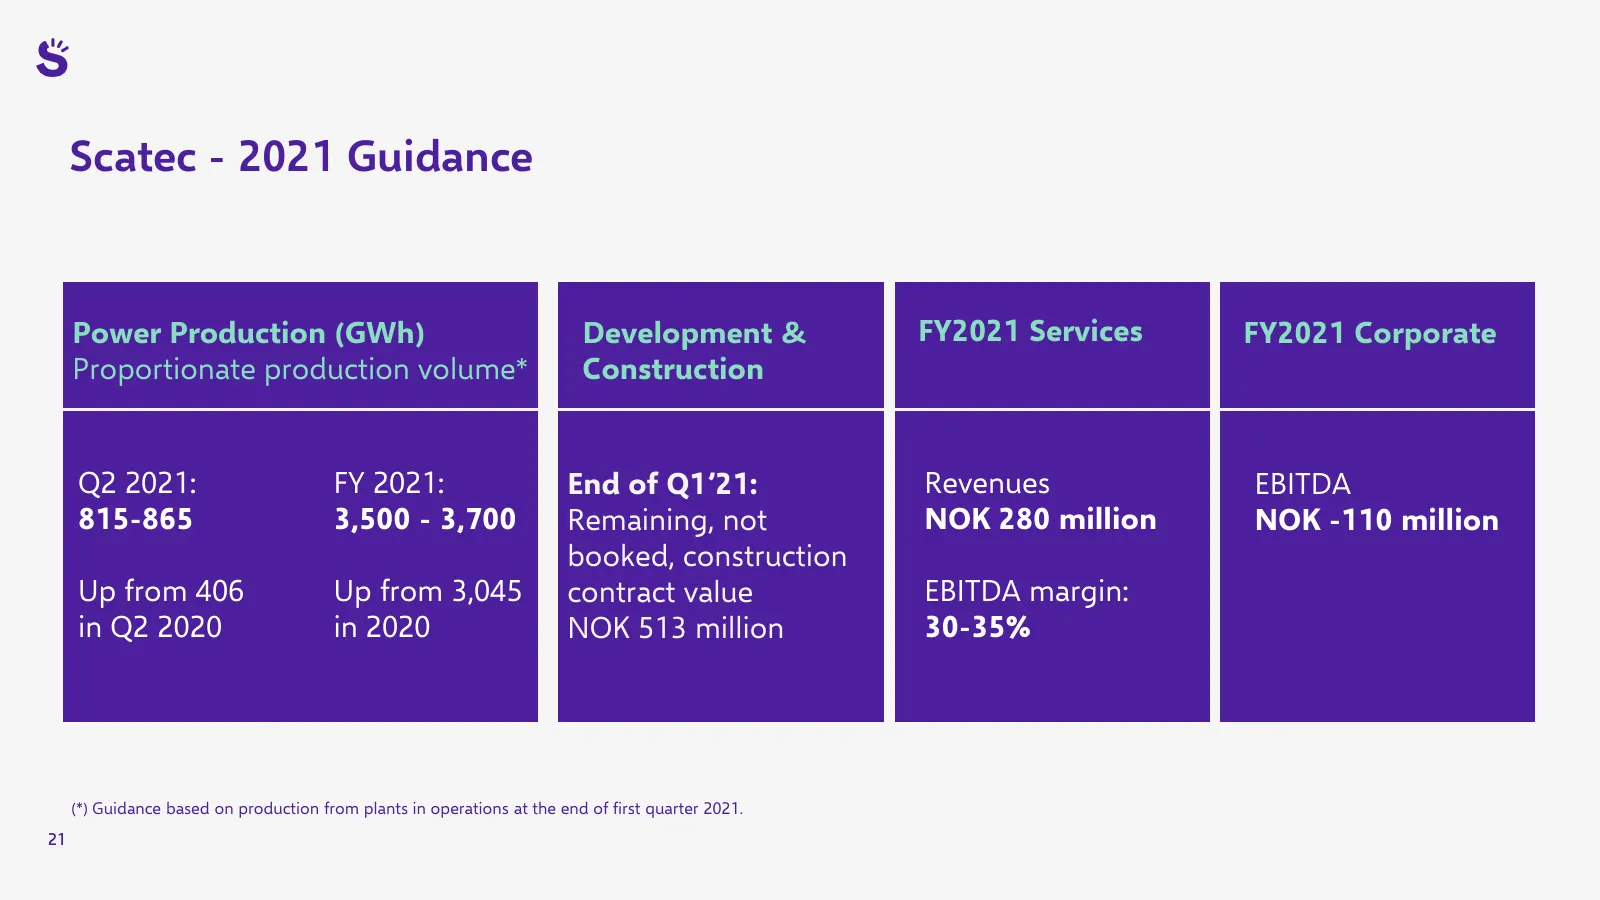
Slide 21: Scatec - 2021 Guidance
Scatec - 2021 Guidance Power Production (GWh) Development & FY2021 Services FY2021 Corporate Proportionate production volume* Construction Q2 2021: FY 2021: End of Q1’21: Revenues EBITDA 815-865 3,500 - 3,700 Remaining, not NOK 280 million NOK -110 million booked, construction Up from 406 Up from 3,

Slide 22: Market & outlook
Market & outlook Raymond Carlsen, CEO 22
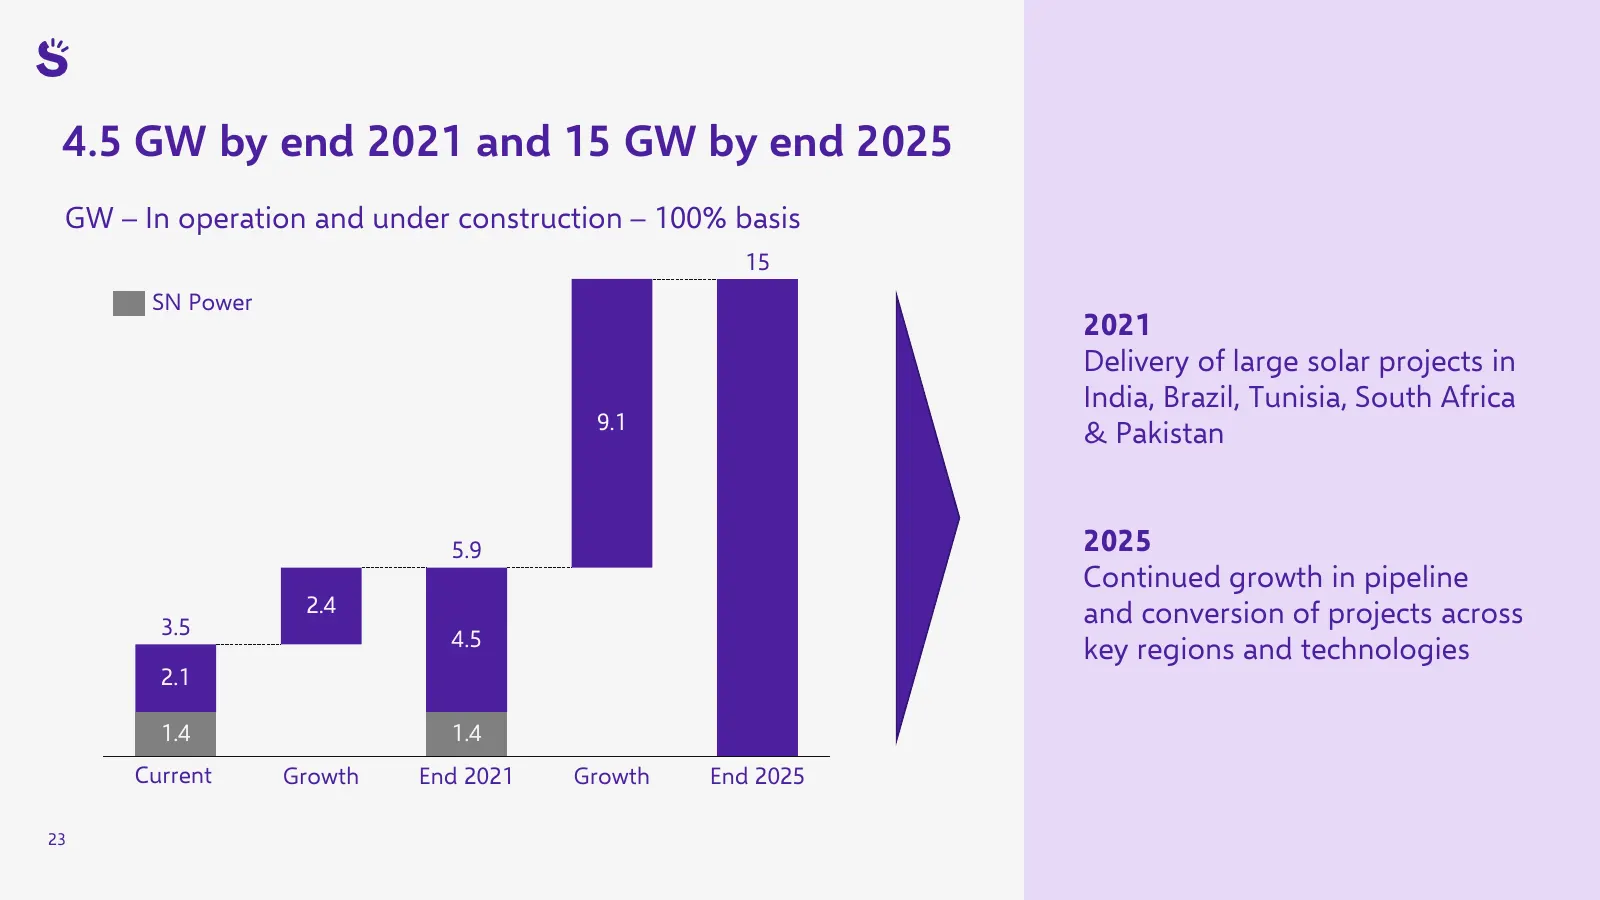
Slide 23: 4.5 GW by end 2021 and 15 GW by end 2025
4.5 GW by end 2021 and 15 GW by end 2025 GW – In operation and under construction – 100% basis 15 SN Power 2021 Delivery of large solar projects in India, Brazil, Tunisia, South Africa 9.1 & Pakistan 5.9 2025 Continued growth in pipeline 2.4 and conversion of projects across 3.5 4.5 key regions and
Slide 24: Our renewables universe
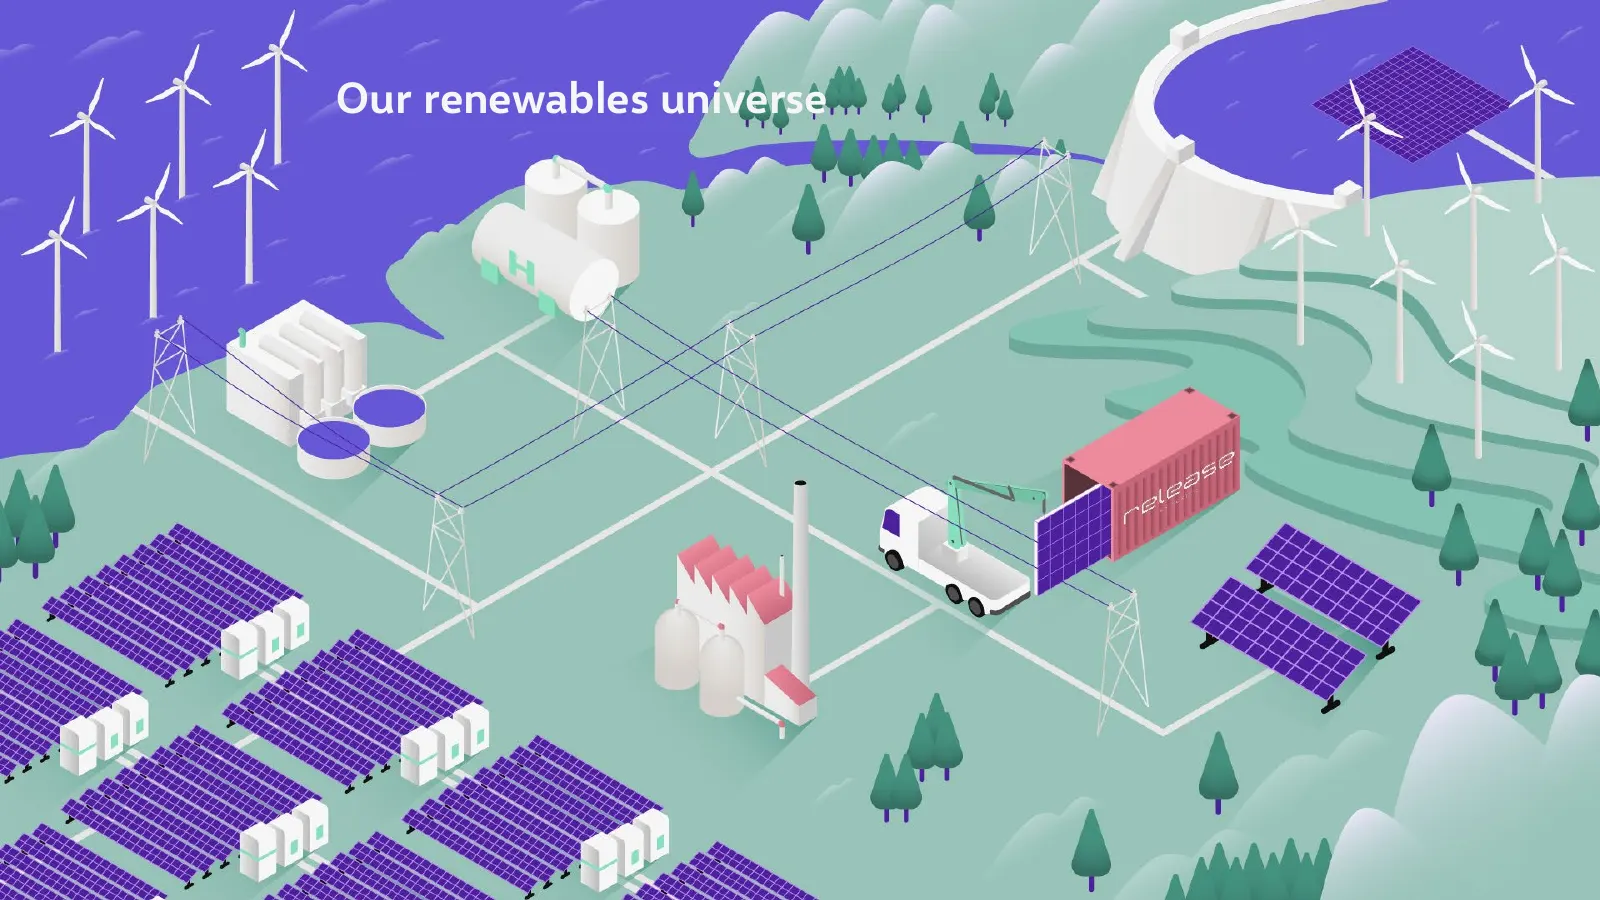
Our renewables universe
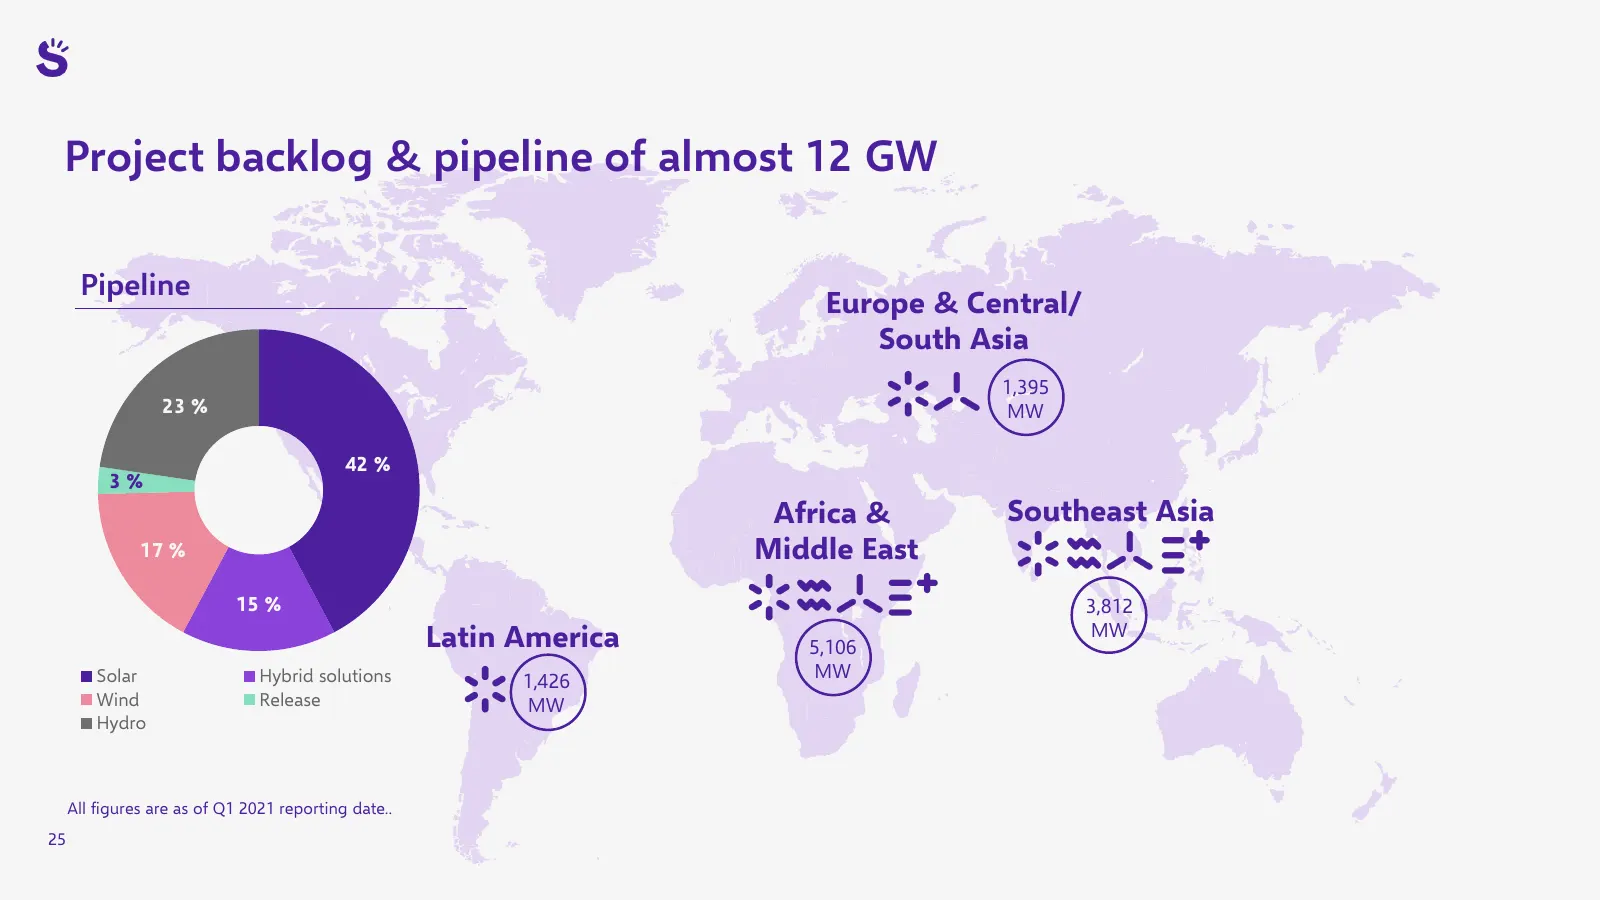
Slide 25: Project backlog & pipeline of almost 12 GW
Project backlog & pipeline of almost 12 GW Pipeline Europe & Central/ South Asia 1,395 23 % MW 42 % 3% Africa & Southeast Asia 17 % Middle East 15 % 3,812 MW Latin America 5,106 Solar Hybrid solutions MW 1,426 Wind Release MW Hydro All figures are as of Q1 2021 reporting date.. 25
Slide 26: 8.5 MW flexible lease agreement
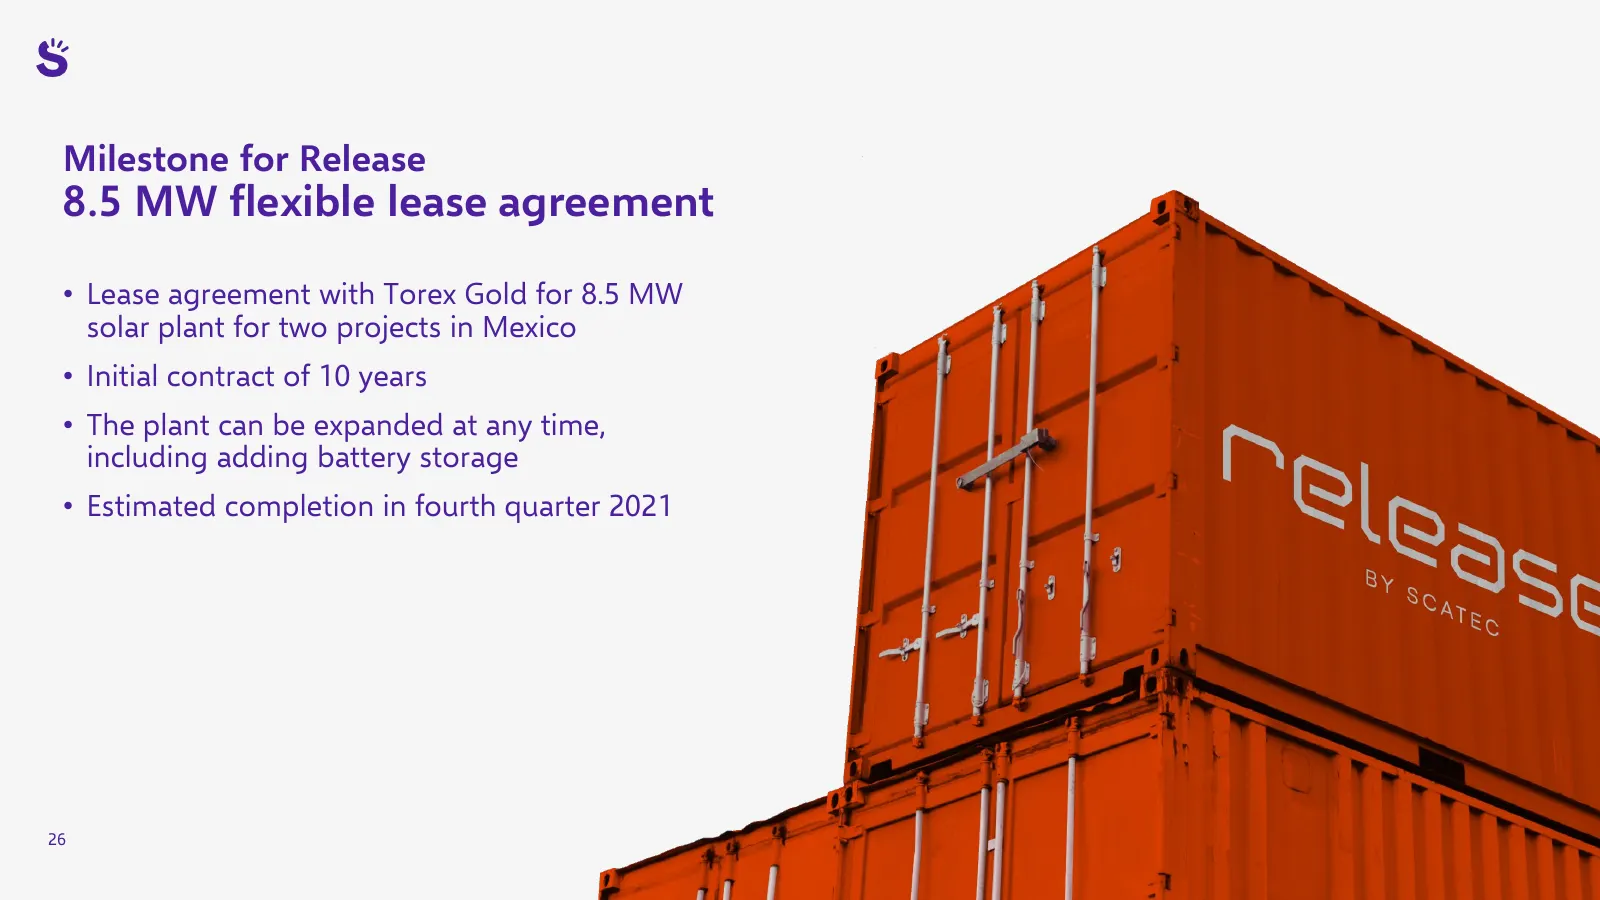
Milestone for Release 8.5 MW flexible lease agreement • Lease agreement with Torex Gold for 8.5 MW solar plant for two projects in Mexico • Initial contract of 10 years • The plant can be expanded at any time, including adding battery storage • Estimated completion in fourth quarter 2021 26
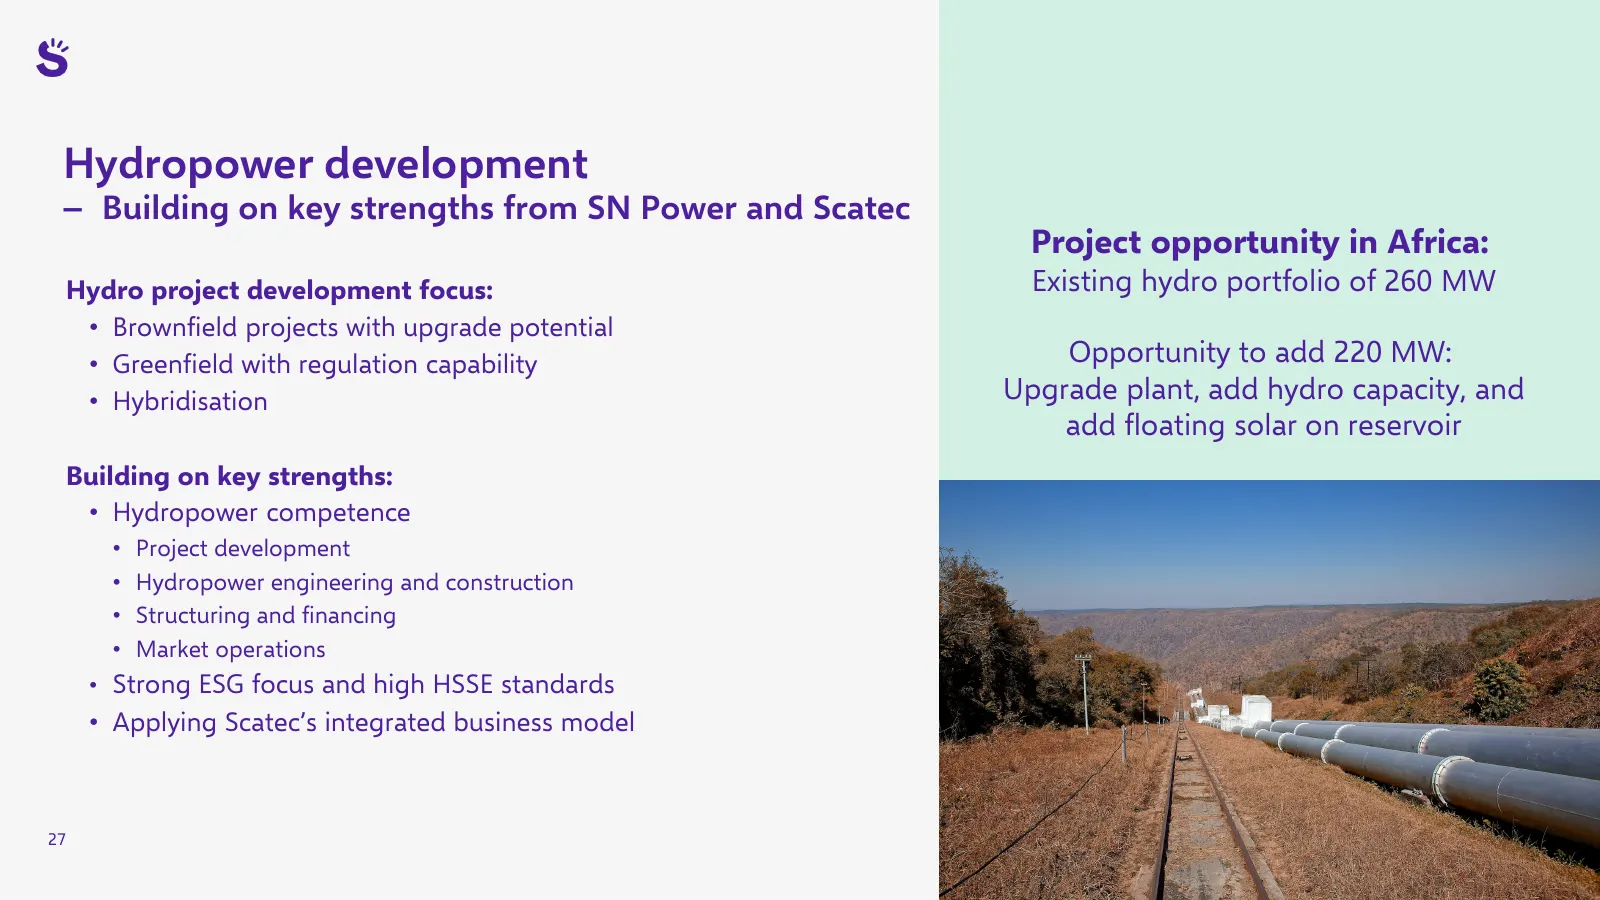
Slide 27: Hydropower development
Hydropower development – Building on key strengths from SN Power and Scatec Project opportunity in Africa: Hydro project development focus: Existing hydro portfolio of 260 MW • Brownfield projects with upgrade potential • Greenfield with regulation capability Opportunity to add 220 MW: • Hybridisati
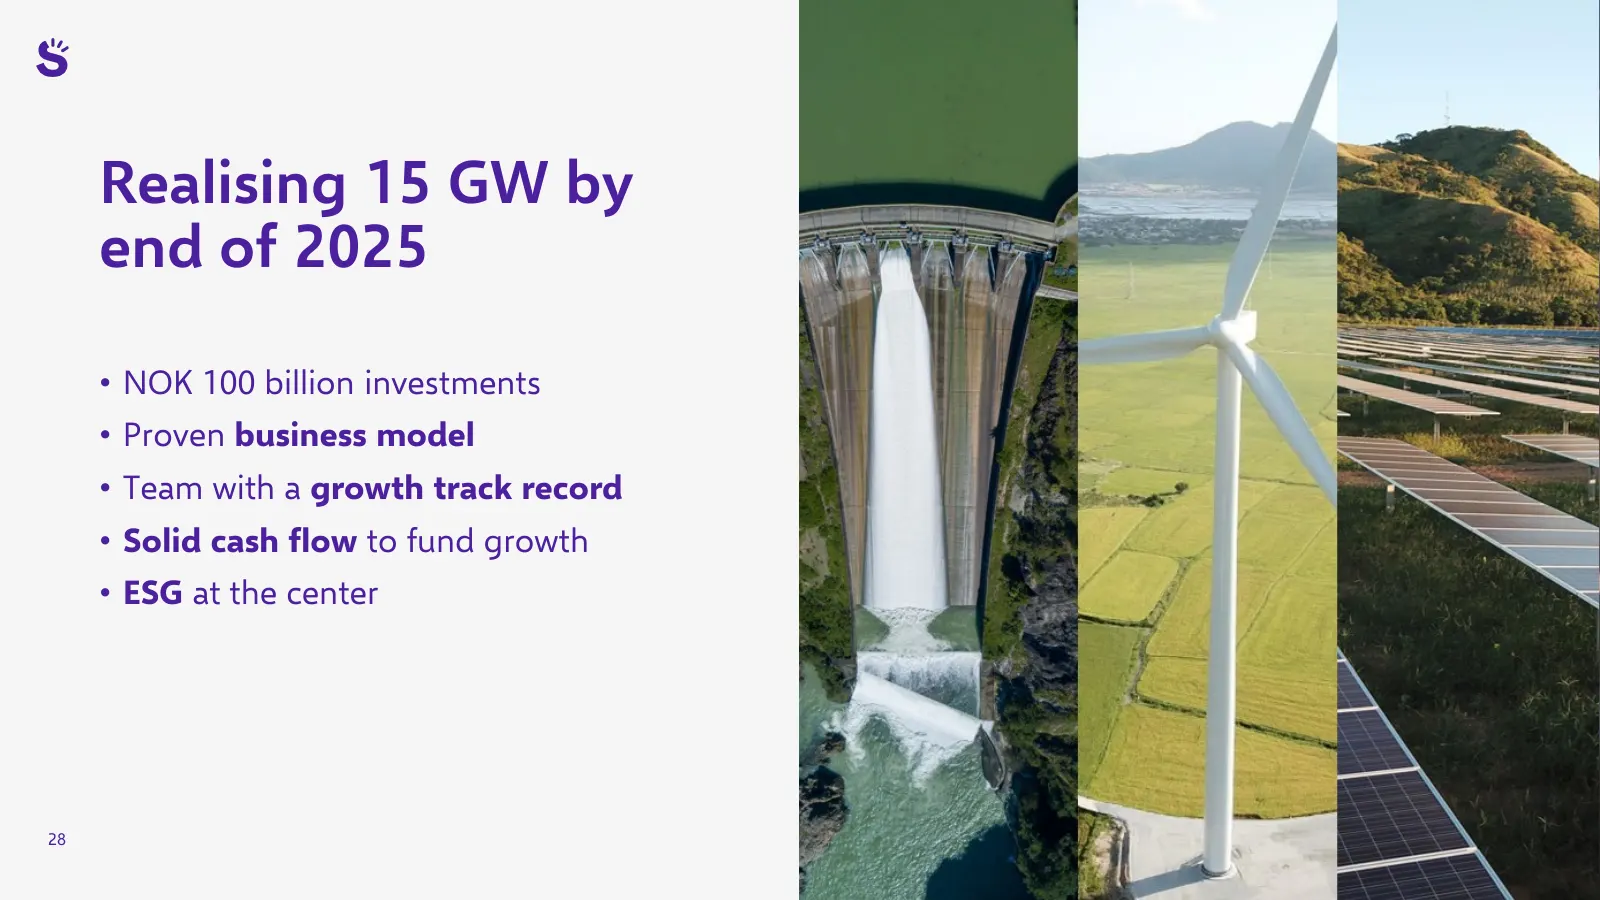
Slide 28: Realising 15 GW by end of 2025
Realising 15 GW by end of 2025 • NOK 100 billion investments • Proven business model • Team with a growth track record • Solid cash flow to fund growth • ESG at the center 28
Slide 29: Scatec - improving our future
Scate improving our future
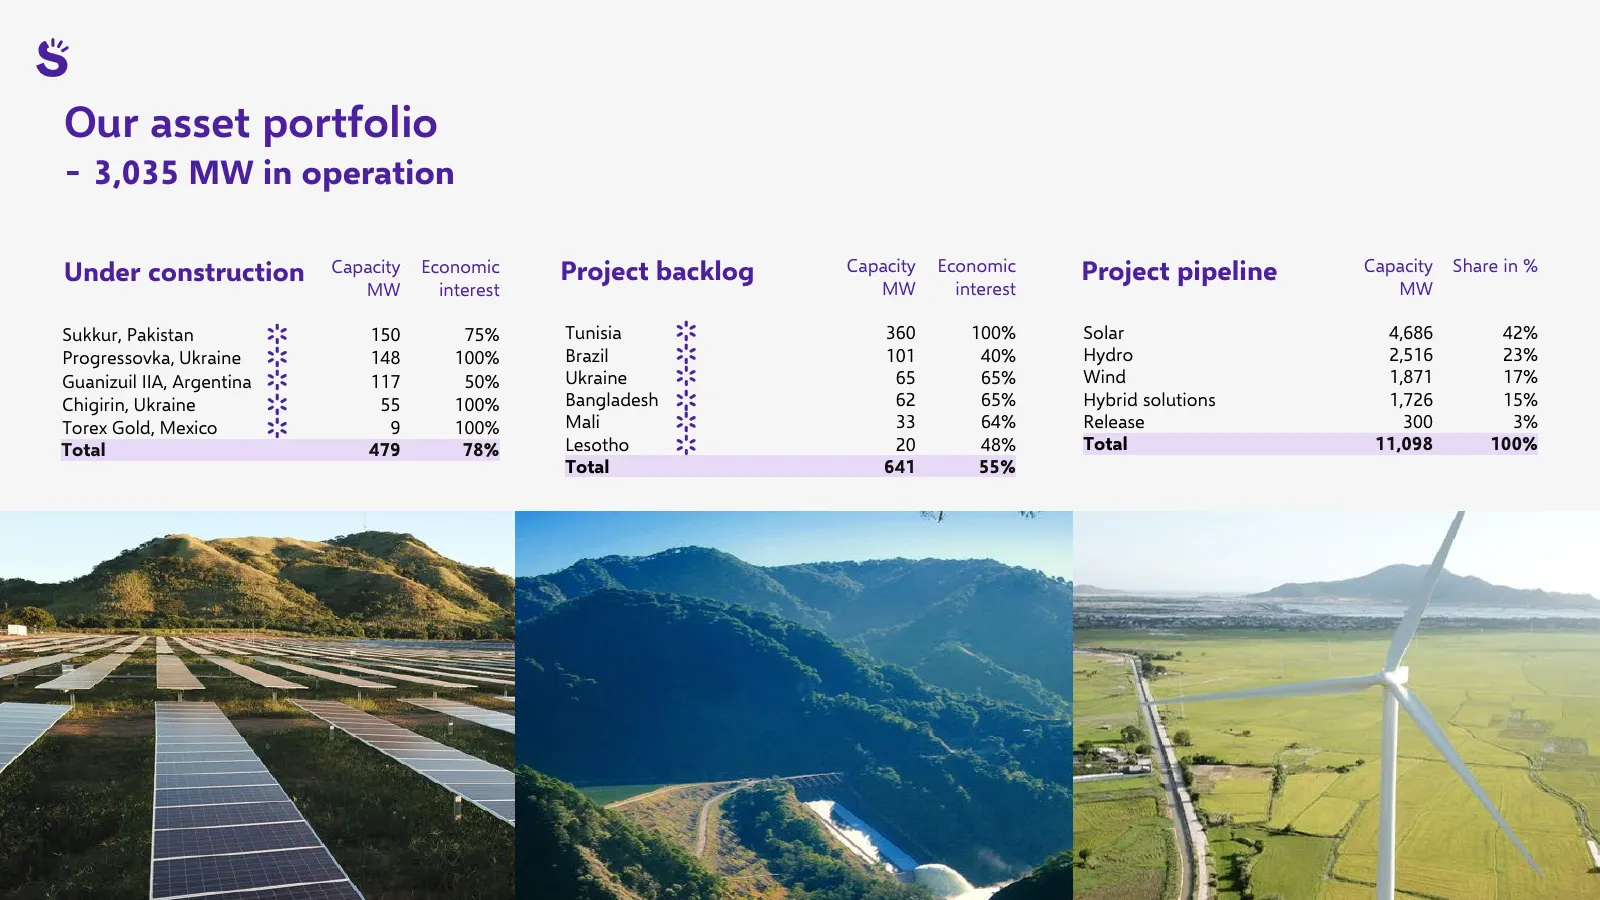
Slide 30: Our asset portfolio - 3,035 MW in operation
Our asset portfolio - 3,035 MW in operation Under construction Capacity Economic Project backlog Capacity Economic Project pipeline Capacity Share in % MW interest MW interest MW Sukkur, Pakistan 150 75% Tunisia 360 100% Solar 4,686 42% Progressovka, Ukraine 148 100% Brazil 101 40% Hydro 2,516 23% G
Source: Internet Archive copy of scatec.com
More decks from Scatec ASA
 Q3 2026 Earnings Presentation32 slides · Oct 30, 2026
 Q2 2026 Earnings Presentation23 slides · Aug 21, 2026
 Investor Presentation (August 2026)22 slides · August 2026
 Q1 2026 Earnings Presentation23 slides · May 6, 2026
 Investor Presentation (March 2026)22 slides · March 2026
 Q4 2025 Earnings Presentation24 slides · Jan 30, 2026