Spire Healthcare Group PLC · LSE:SPI
Spire Healthcare — FY2022 Earnings Presentation
52 slides from Spire Healthcare's earnings presentation, Mar 2, 2023

Slide 1: FY22 Results Presentation
FY22 Results Presentation 2 March 2023
Slide 2: Disclaimer
Disclaimer These materials contain certain forward-looking statements relating to the business of Spire Healthcare Group plc (the “Company”), including with respect to the progress, timing and completion of the Company’s development, the Company’s ability to treat, attract, and retain patients and c
Slide 3: Zoom webinar rules of engagement
Zoom webinar rules of engagement All attendee lines are muted The chat function is disabled Please submit your name and organisation using the Q&A function Angus will moderate the session and unmute your line for you to ask your question Any problems please email Laura.Young@spirehealthcare.com 3
Slide 4: Agenda
Agenda FY22 Overview Justin Ash, Chief Executive Officer FY22 Financial review Jitesh Sodha, Chief Financial Officer Strategic developments Justin Ash, Chief Executive Officer Expanding our proposition Peter Corfield, Chief Commercial Officer Outlook for FY23 Justin Ash, Chief Executive Officer Q&A

Slide 5: FY22 Overview
FY22 Overview Justin Ash, Chief Executive Officer
Slide 6: Our purpose: Making a positive difference to people's lives through outstanding personalised care
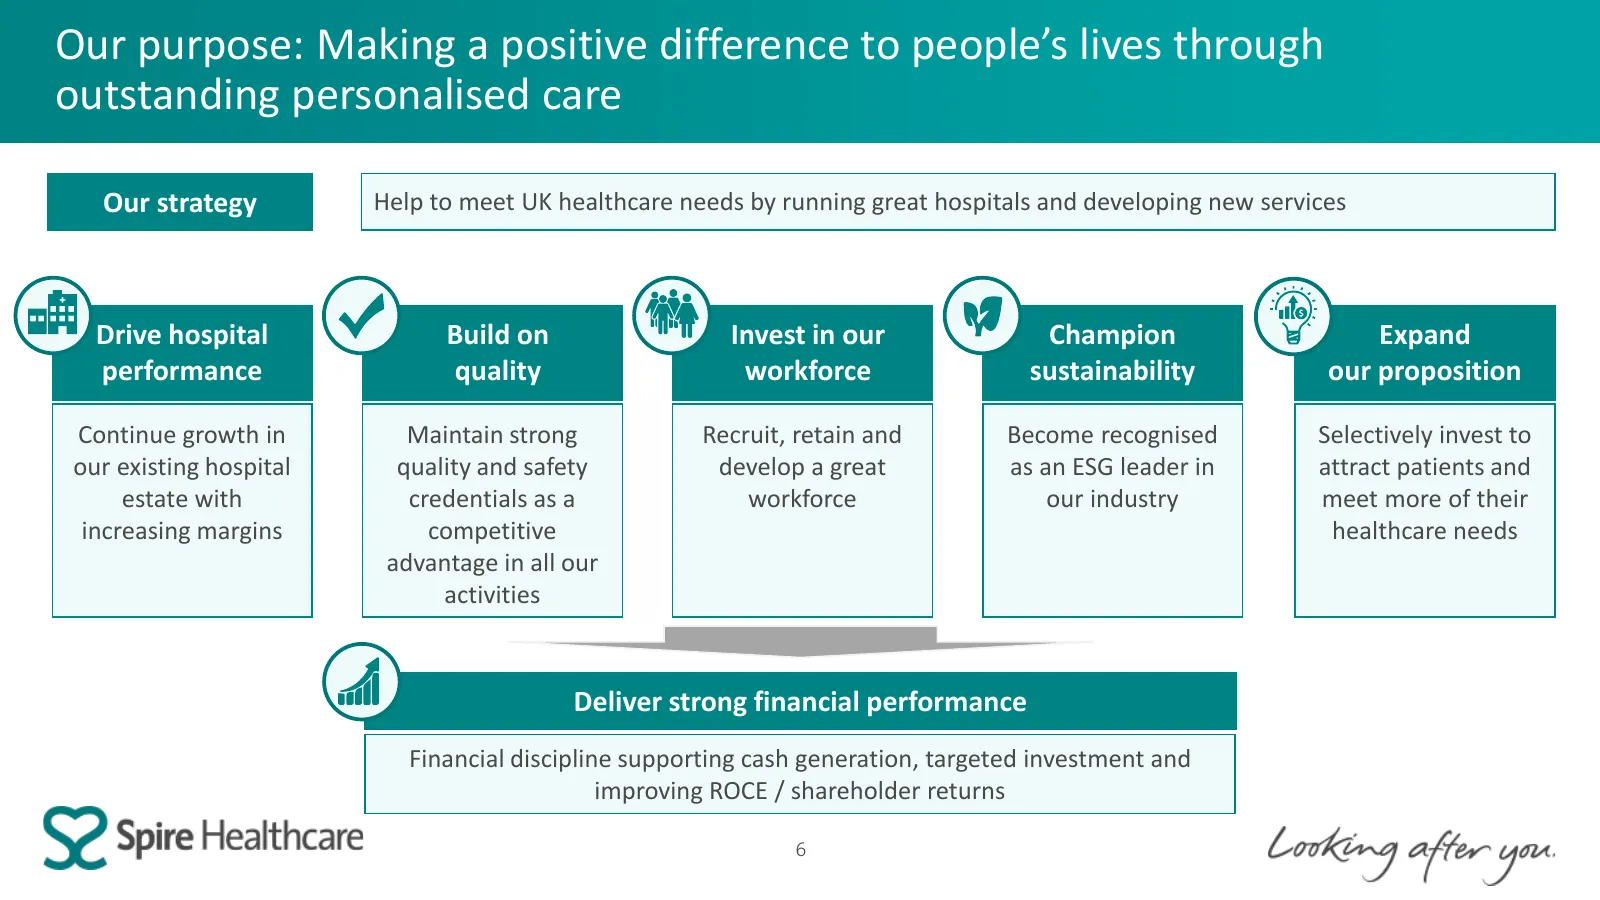
Our purpose: Making a positive difference to people’s lives through outstanding personalised care Our strategy Help to meet UK healthcare needs by running great hospitals and developing new services Drive hospital Build on Invest in our Champion Expand performance quality workforce sustainability ou
Slide 7: FY22 – a period of good progress
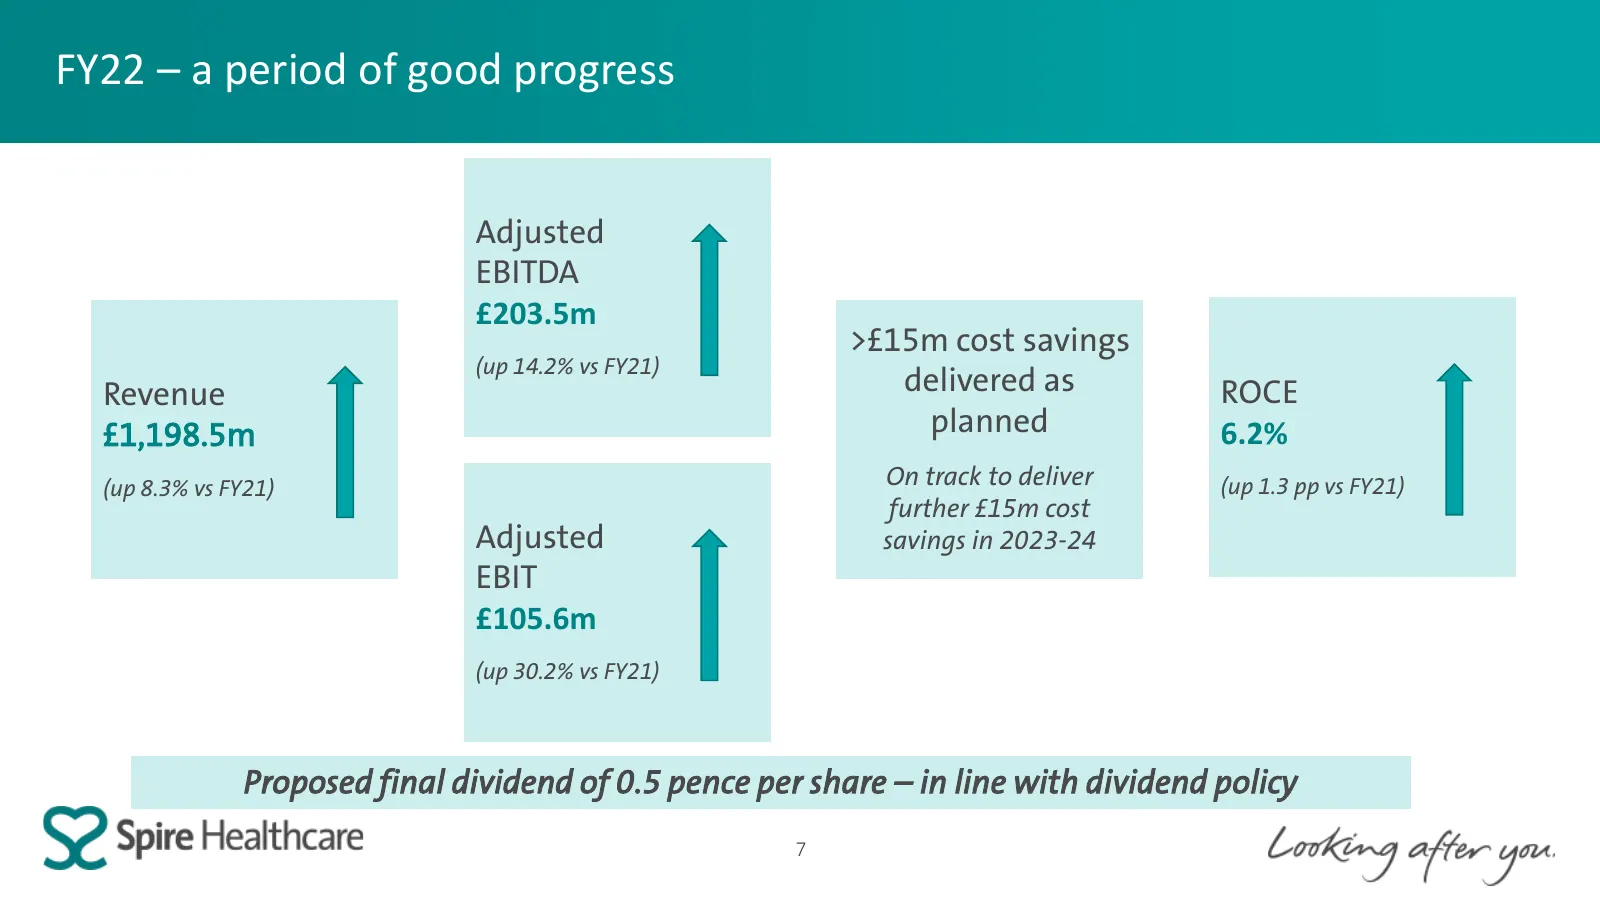
FY22 – a period of good progress Adjusted EBITDA £203.5m >£15m cost savings (up 14.2% vs FY21) Revenue delivered as ROCE £1,198.5m planned 6.2% (up 8.3% vs FY21) On track to deliver (up 1.3 pp vs FY21) further £15m cost Adjusted savings in 2023-24 EBIT £105.6m (up 30.2% vs FY21) Proposed final divid
Slide 8: Continued strong demand
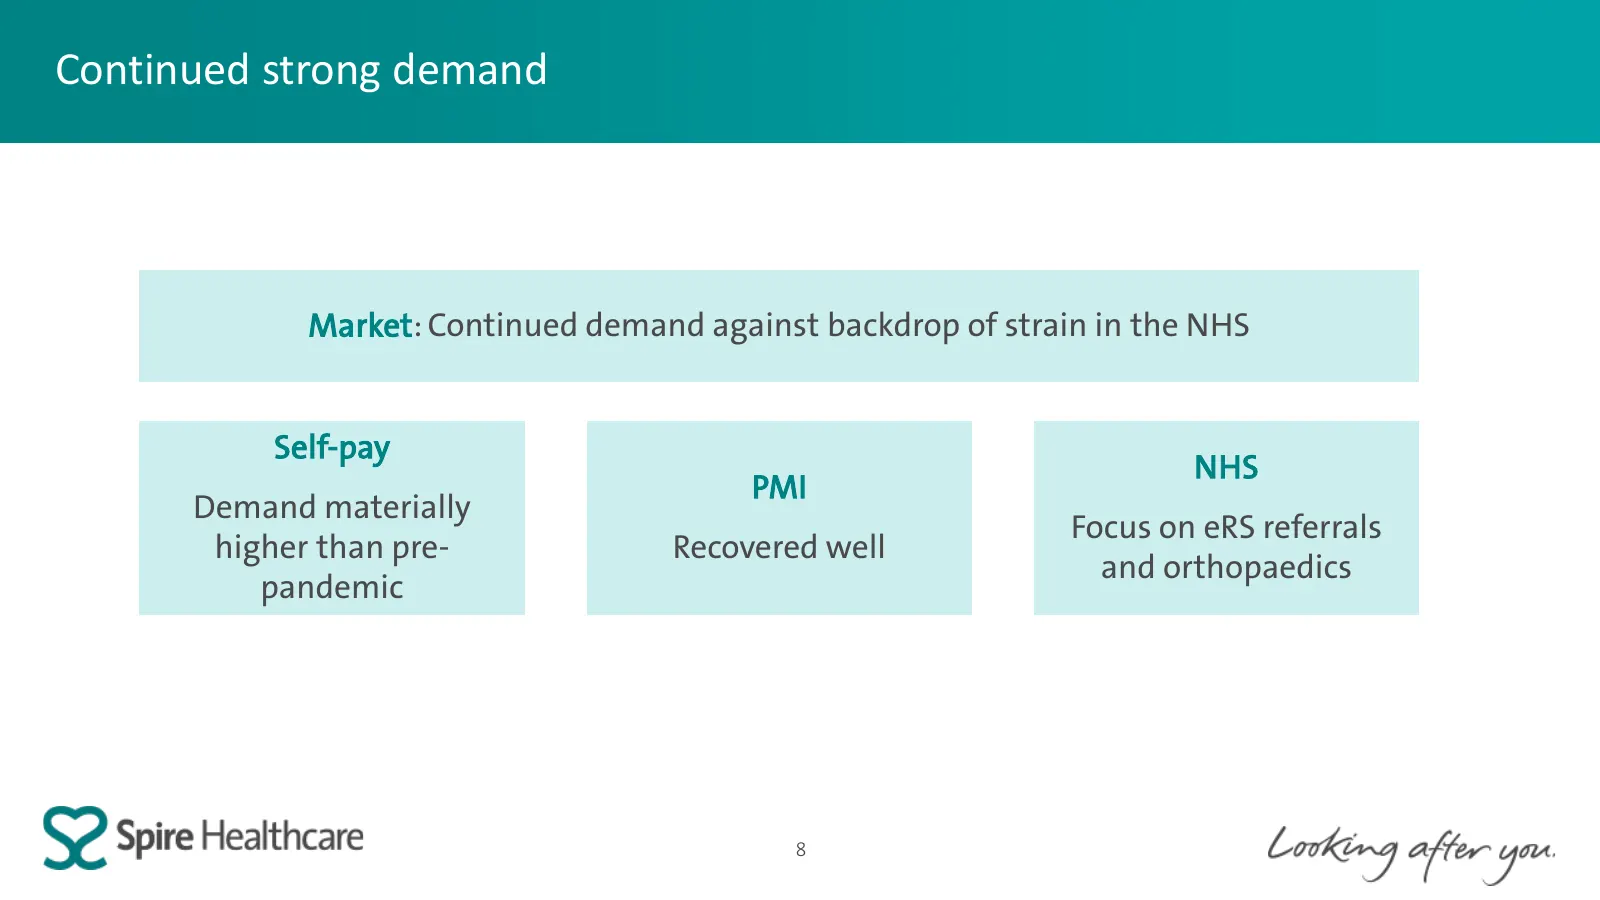
Continued strong demand Market: Continued demand against backdrop of strain in the NHS Self-pay NHS PMI Demand materially Focus on eRS referrals higher than pre- Recovered well and orthopaedics pandemic 8
Slide 9: Managing in a challenging environment
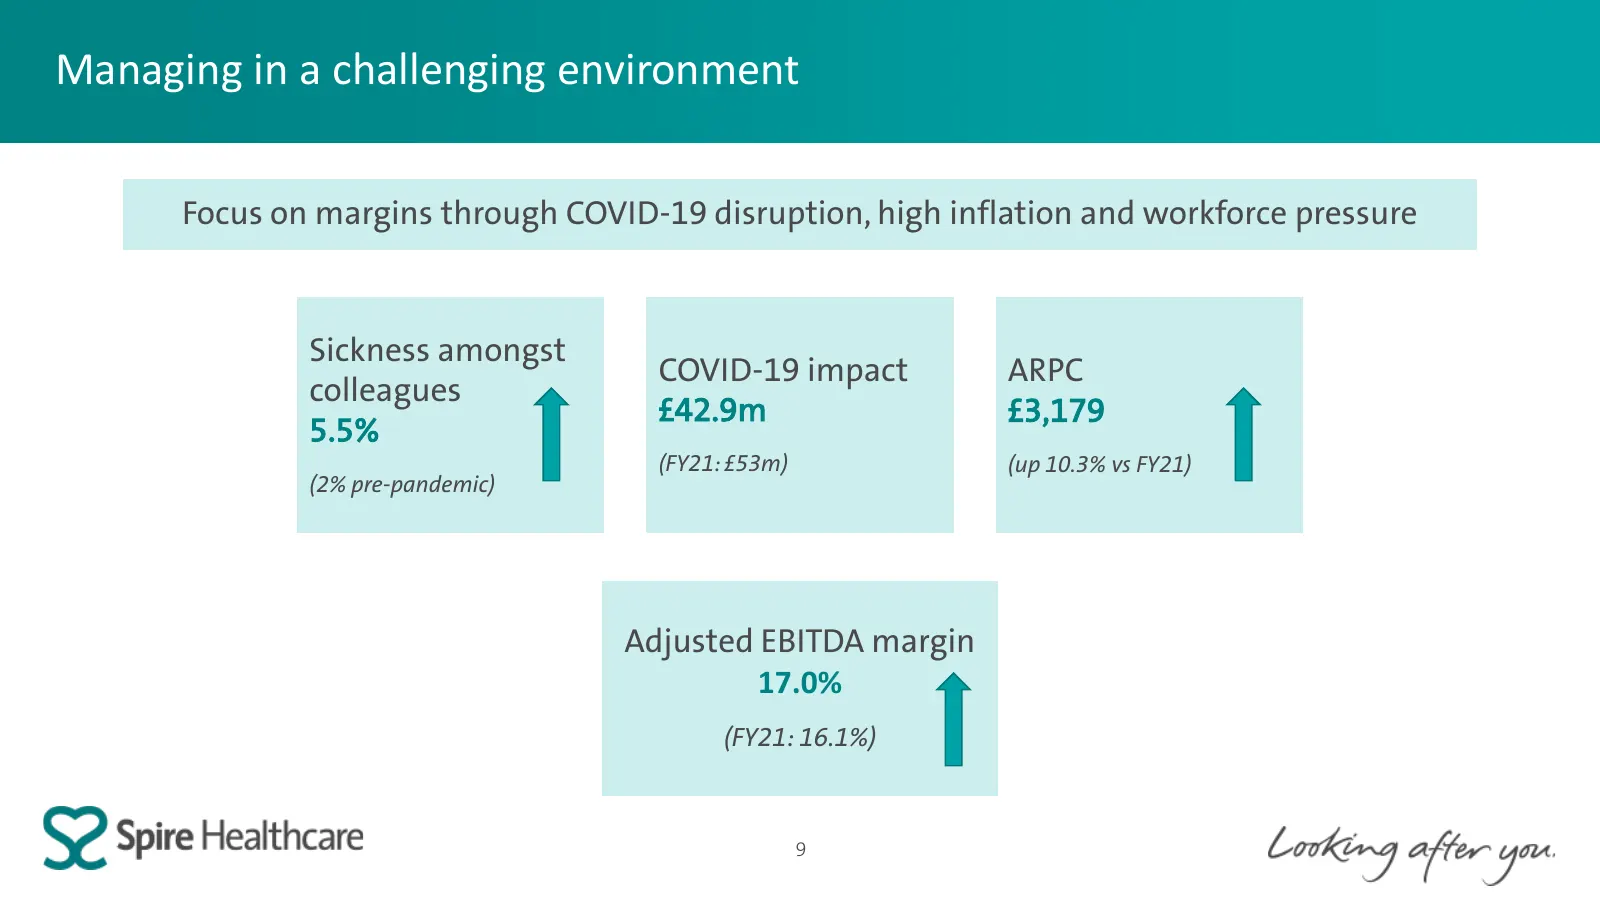
Managing in a challenging environment Focus on margins through COVID-19 disruption, high inflation and workforce pressure Sickness amongst COVID-19 impact ARPC colleagues £42.9m £3,179 5.5% (FY21: £53m) (up 10.3% vs FY21) (2% pre-pandemic) Adjusted EBITDA margin 17.0% (FY21: 16.1%) 9
Slide 10: Delivering on our purpose
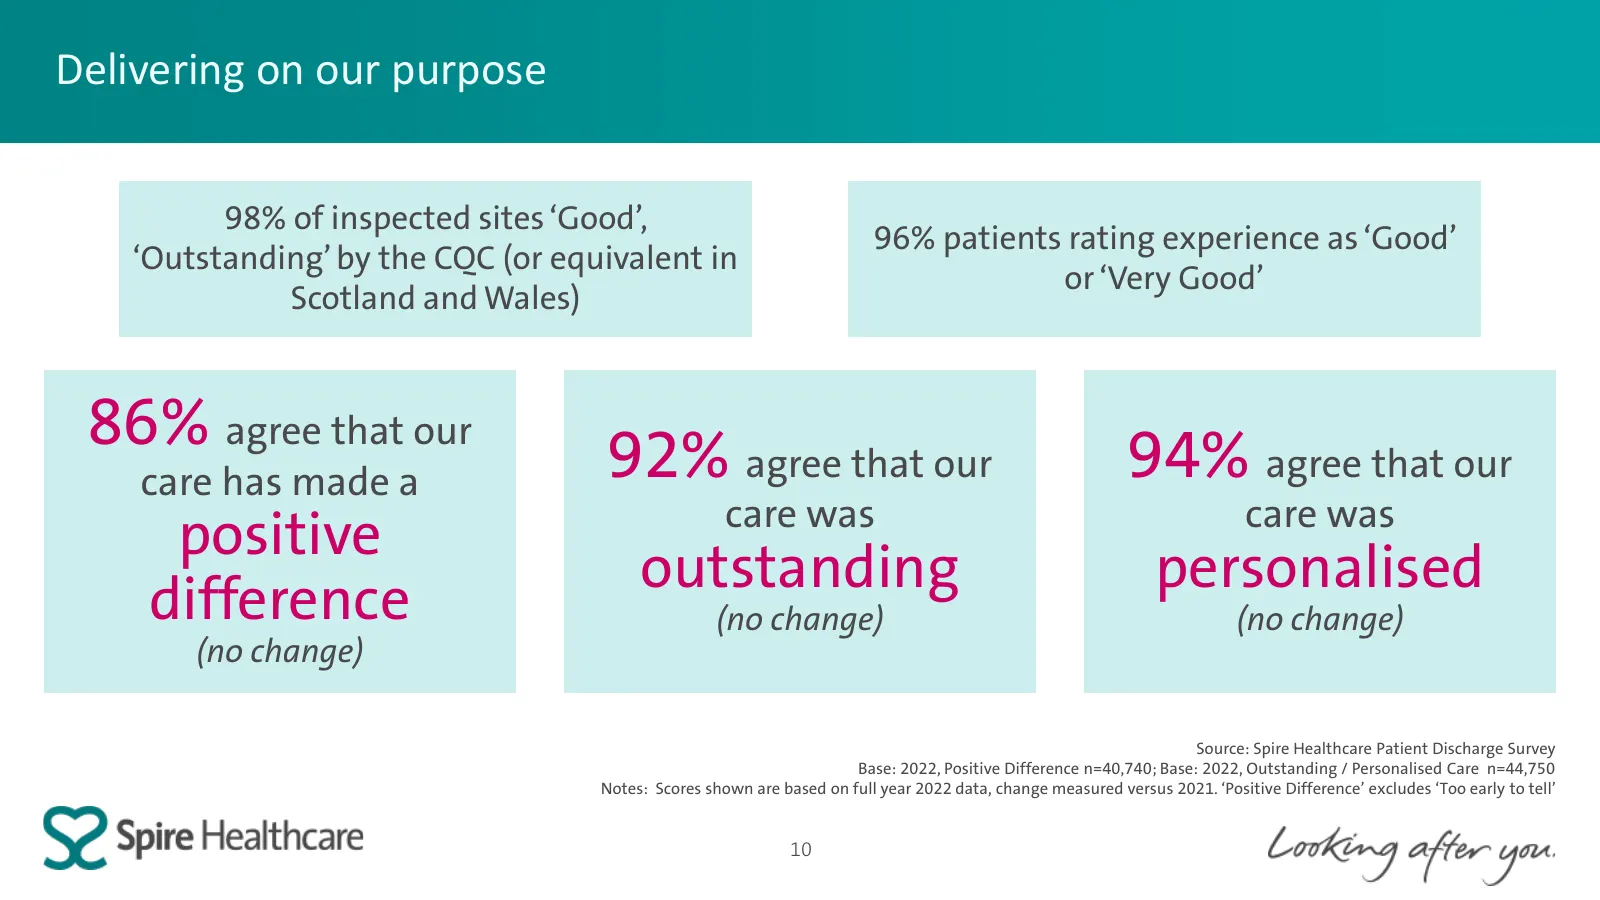
Delivering on our purpose 98% of inspected sites ‘Good’, 96% patients rating experience as ‘Good’ ‘Outstanding’ by the CQC (or equivalent in or ‘Very Good’ Scotland and Wales) 86% agree that our 92% agree that our 94% agree that our care has made a care was care was positive outstanding personalised
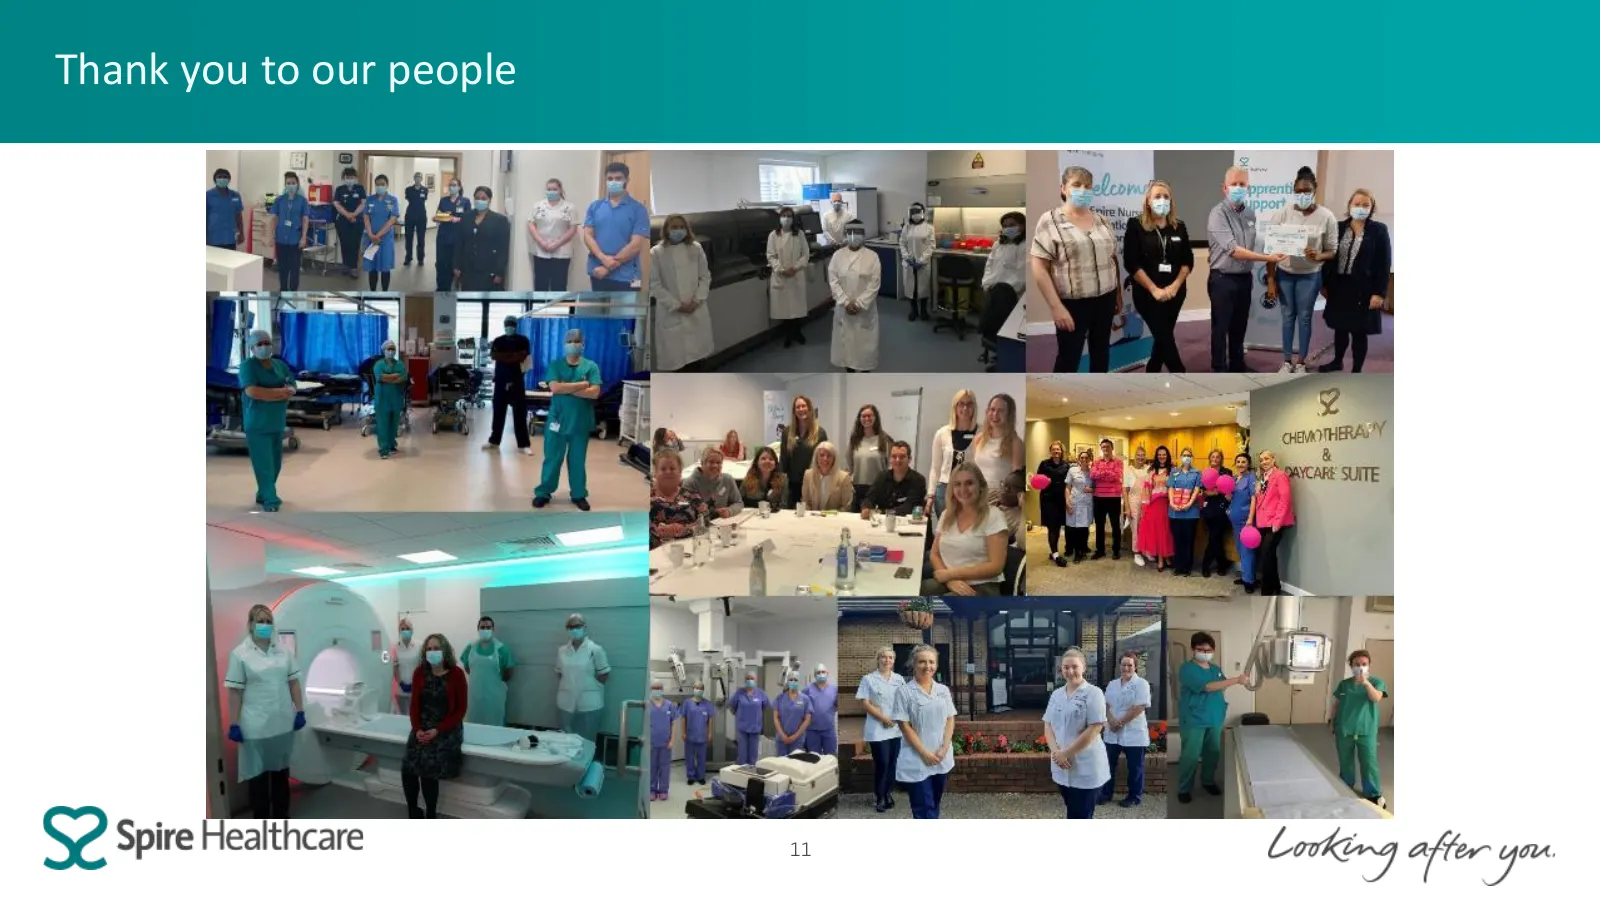
Slide 11: Thank you to our people
Thank you to our people LQ Spire Healthcare

Slide 12: FY22 Financial Review
FY22 Financial Review Jitesh Sodha, Chief Financial Officer
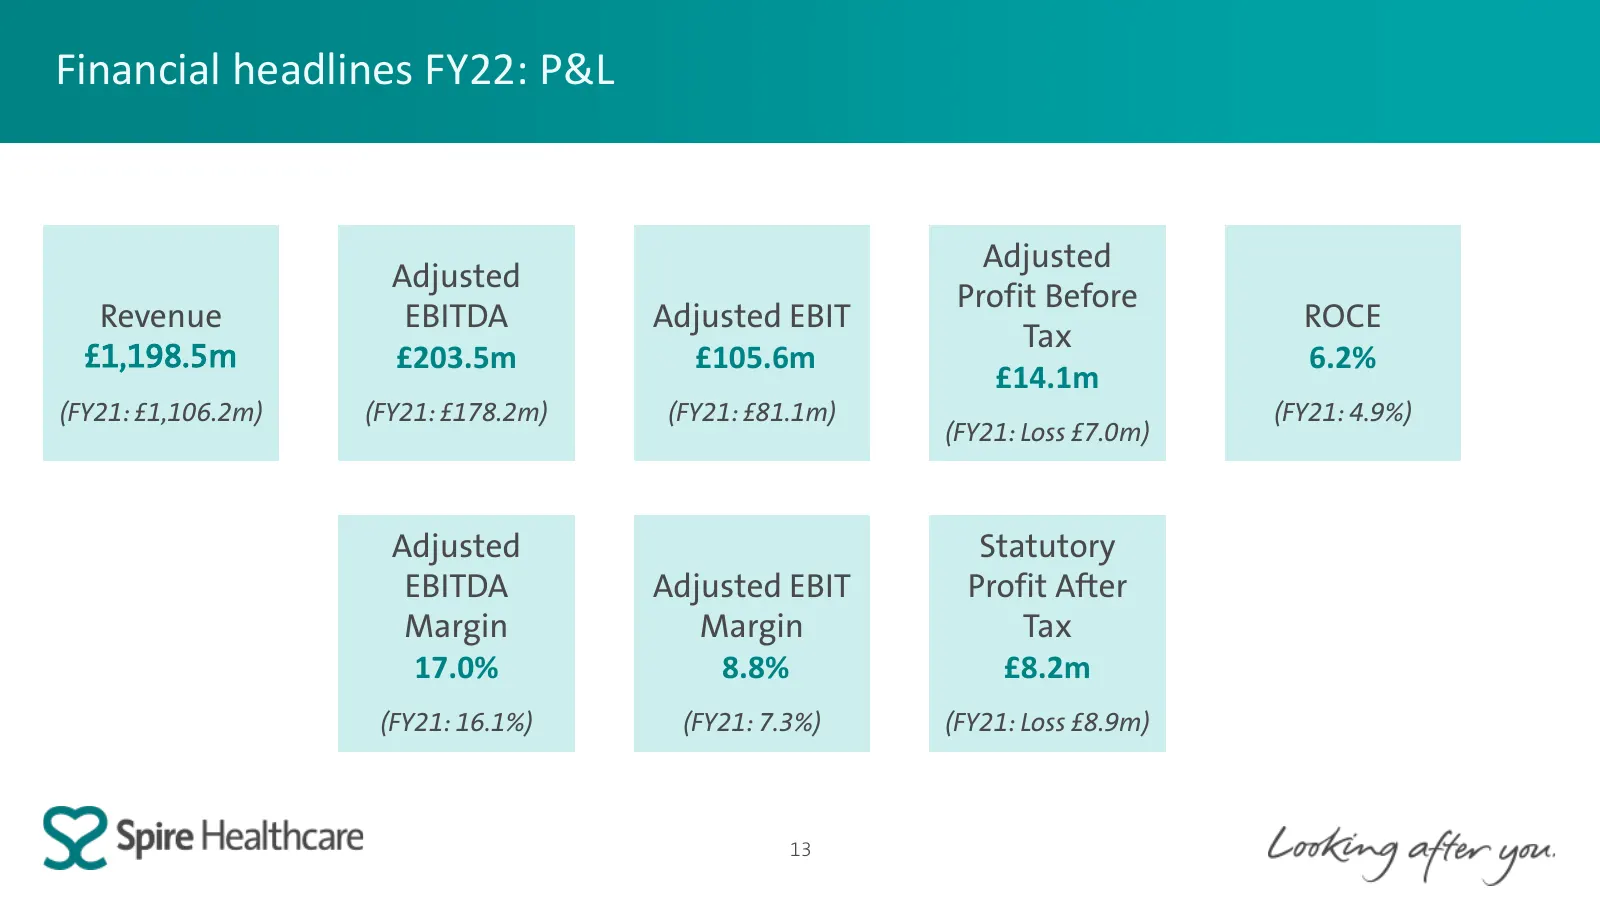
Slide 13: Financial headlines FY22: P&L
Financial headlines FY22: P&L Adjusted Adjusted Profit Before Revenue EBITDA Adjusted EBIT ROCE Tax £1,198.5m £203.5m £105.6m 6.2% £14.1m (FY21: £1,106.2m) (FY21: £178.2m) (FY21: £81.1m) (FY21: 4.9%) (FY21: Loss £7.0m) Adjusted Statutory EBITDA Adjusted EBIT Profit After Margin Margin Tax 17.0% 8.8%
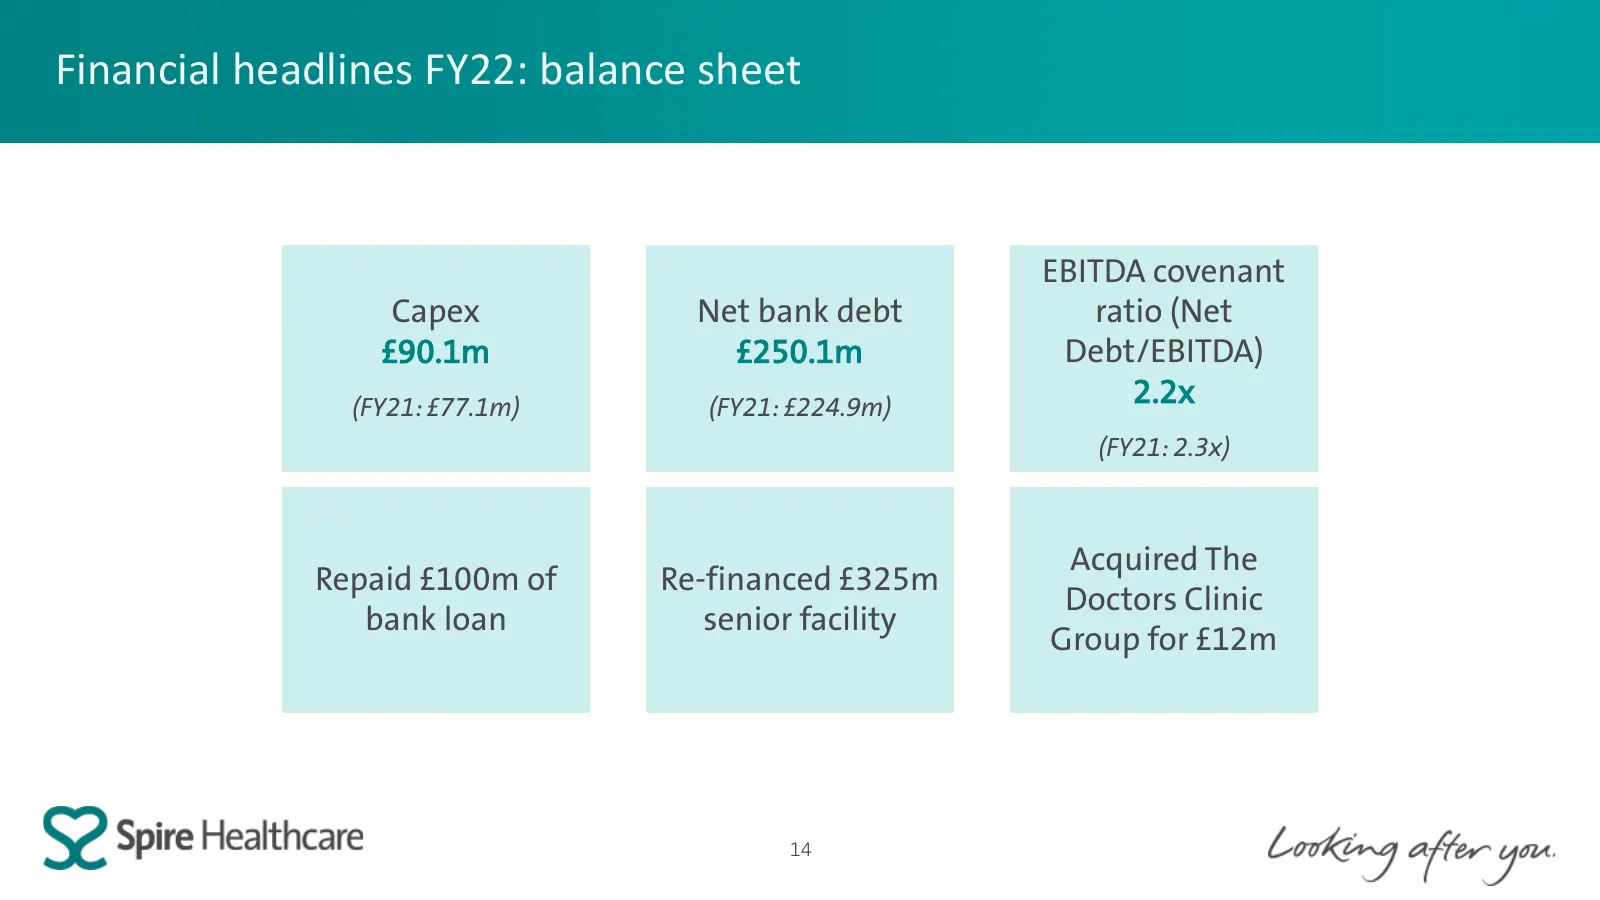
Slide 14: Financial headlines FY22: balance sheet
Financial headlines FY22: balance sheet EBITDA covenant Capex Net bank debt ratio (Net £90.1m £250.1m Debt/EBITDA) (FY21: £77.1m) (FY21: £224.9m) 2.2x (FY21: 2.3x) Acquired The Repaid £100m of Re-financed £325m Doctors Clinic bank loan senior facility Group for £12m 14
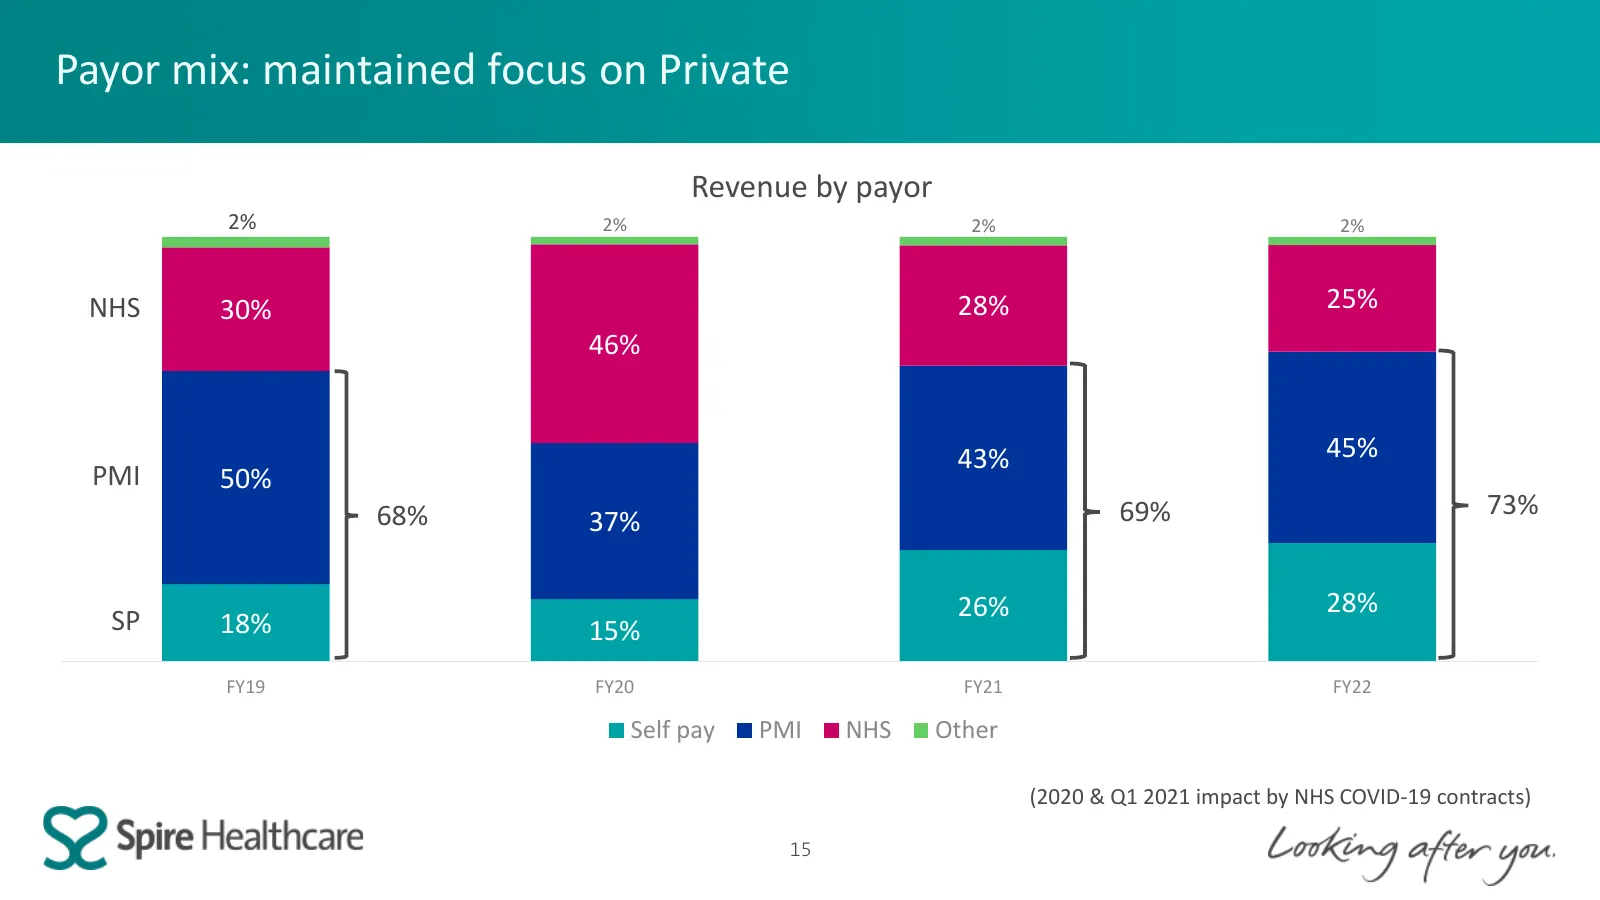
Slide 15: Payor mix: maintained focus on Private
Payor mix: maintained focus on Private Revenue by payor 2% 2% 2% 2% NHS 30% 28% 25% 46% 43% 45% PMI 50% 68% 69% 73% 37% 26% 28% SP 18% 15% FY19 FY20 FY21 FY22 Self pay PMI NHS Other (2020 & Q1 2021 impact by NHS COVID-19 contracts) 15
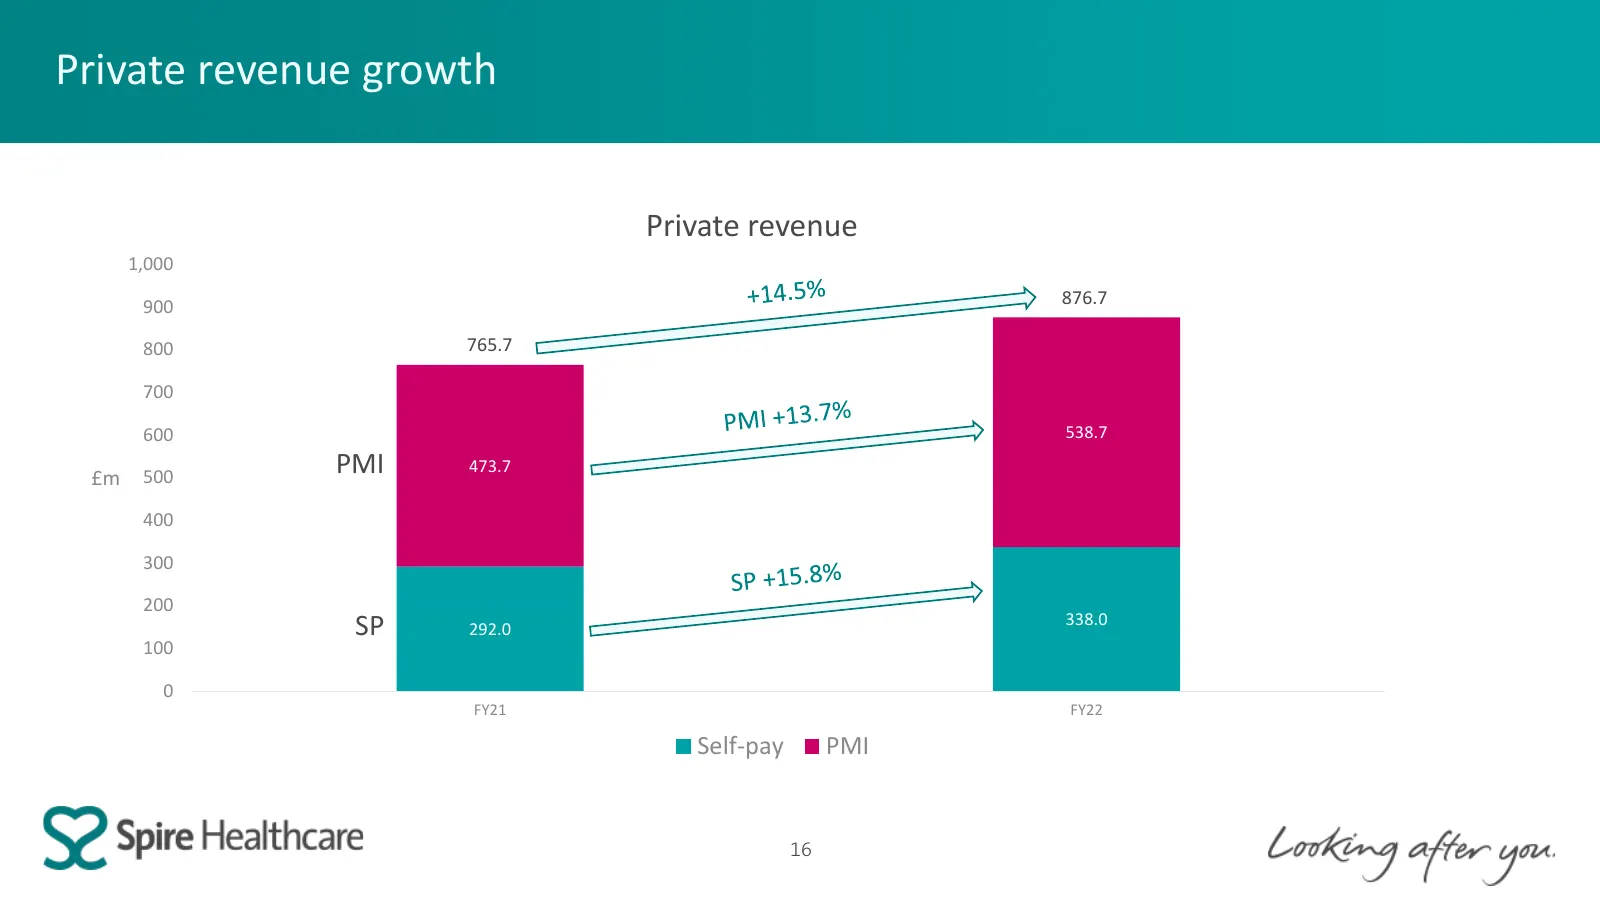
Slide 16: Private revenue growth
Private revenue growth Private revenue 1,000 900 876.7 800 765.7 700 600 538.7 £m 500 PMI 473.7 400 300 200 338.0 SP 292.0 100 0 FY21 FY22 Self-pay PMI 16
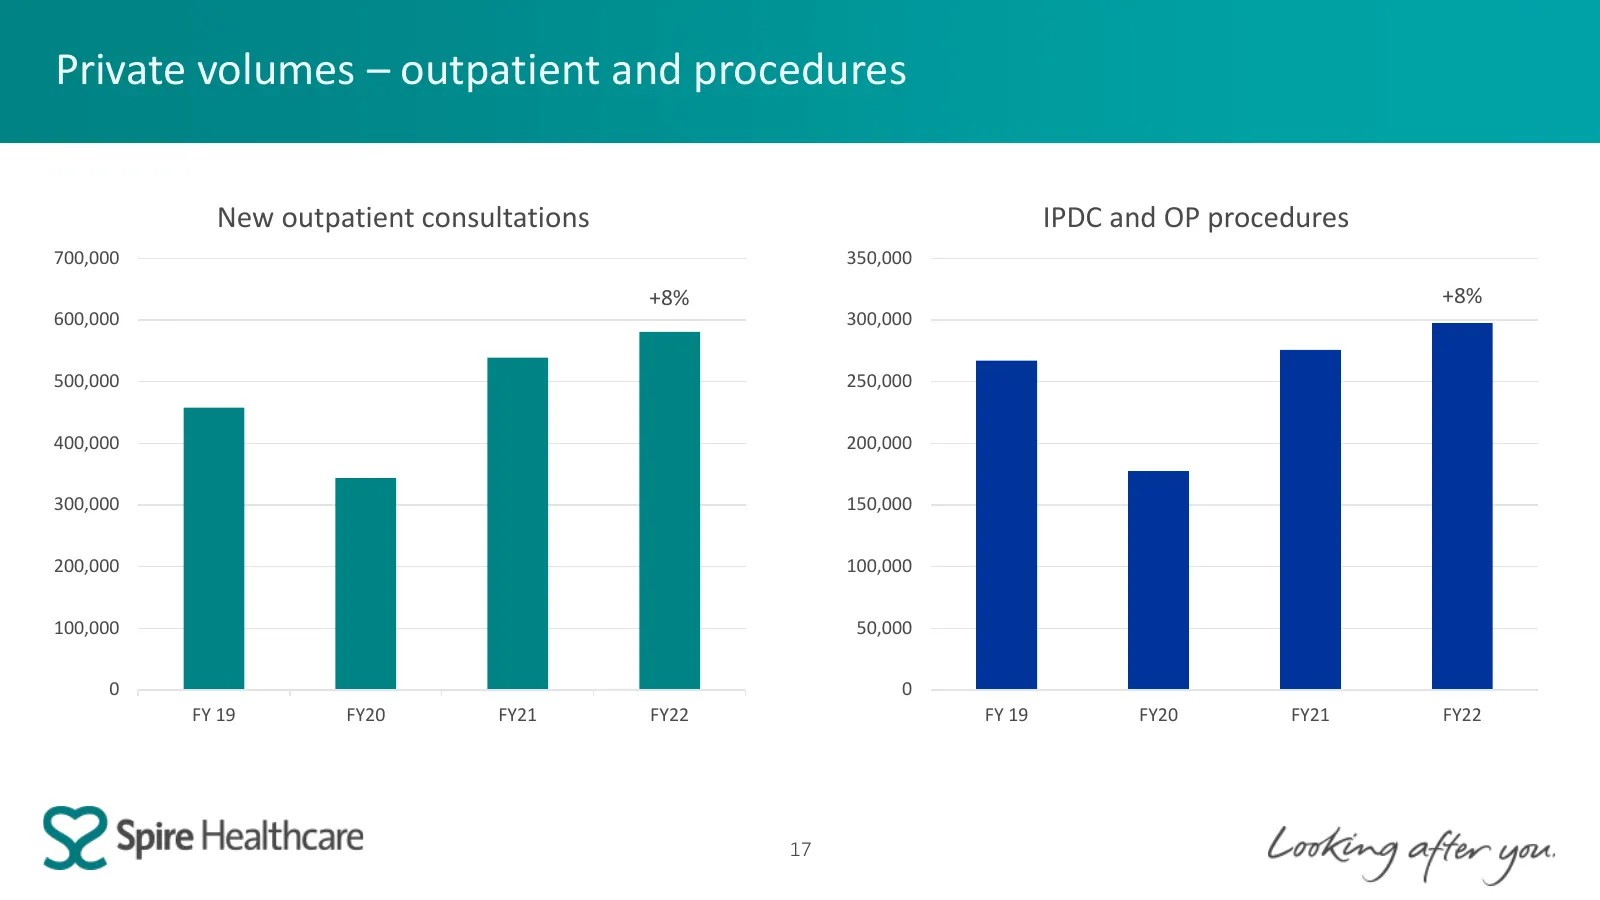
Slide 17: Private volumes – outpatient and procedures
Private volumes – outpatient and procedures New outpatient consultations IPDC and OP procedures 700,000 350,000 +8% +8% 600,000 300,000 500,000 250,000 400,000 200,000 300,000 150,000 200,000 100,000 100,000 50,000 0 0 FY 19 FY20 FY21 FY22 FY 19 FY20 FY21 FY22 17
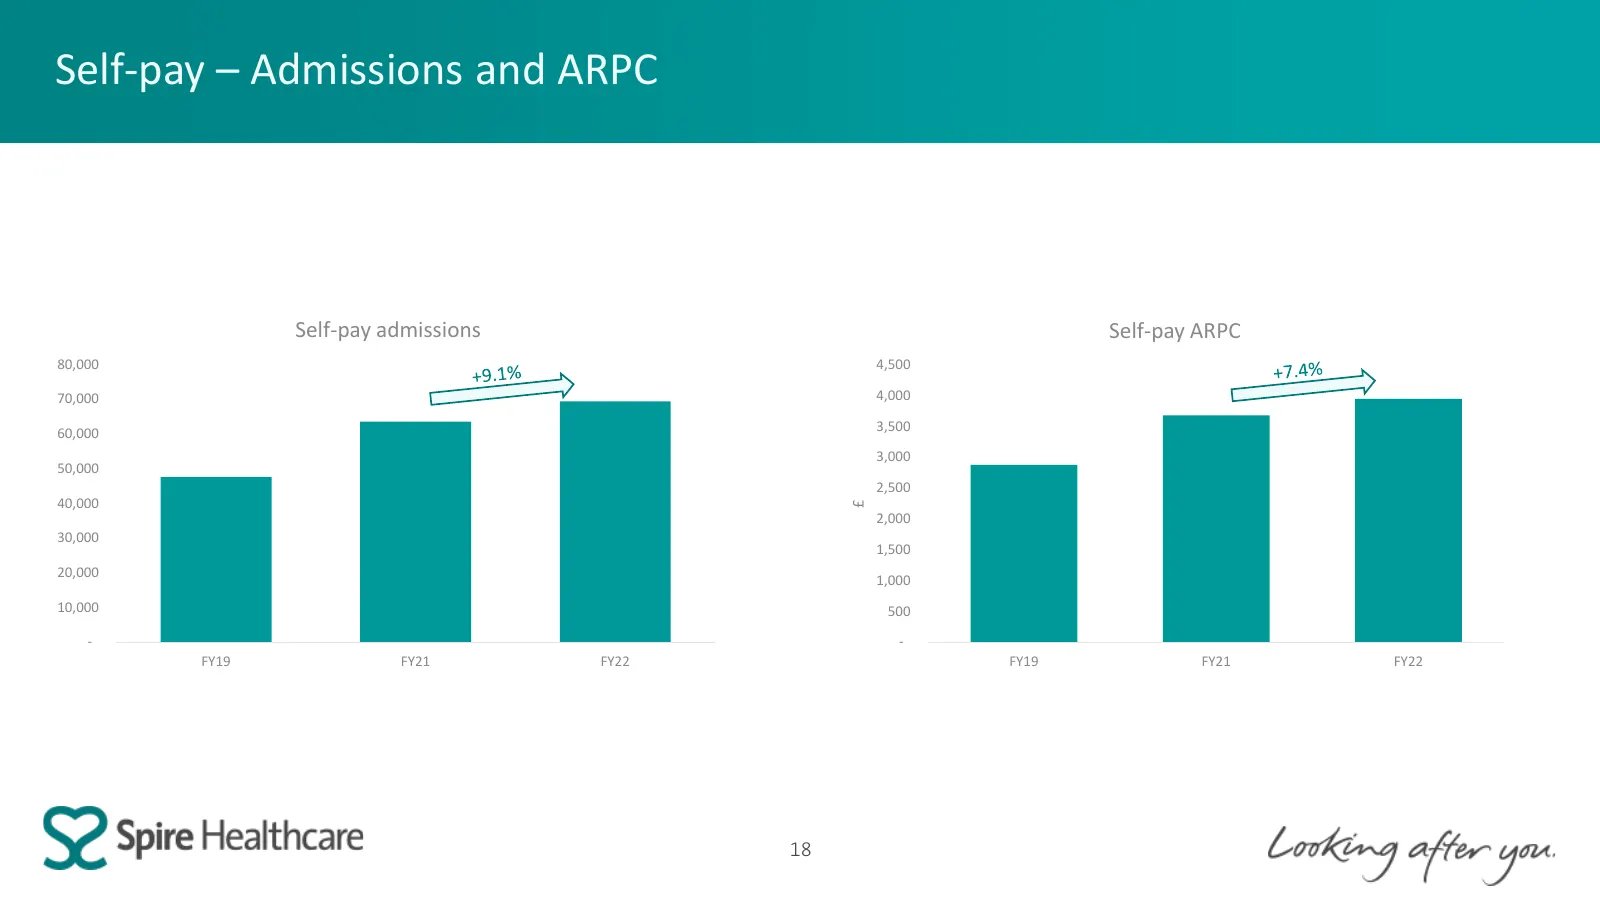
Slide 18: Self-pay – Admissions and ARPC
Self-pay – Admissions and ARPC Self-pay admissions Self-pay ARPC 80,000 4,500 70,000 4,000 3,500 60,000 3,000 50,000 2,500 40,000 £ 2,000 30,000 1,500 20,000 1,000 10,000 500 - - FY19 FY21 FY22 FY19 FY21 FY22 18
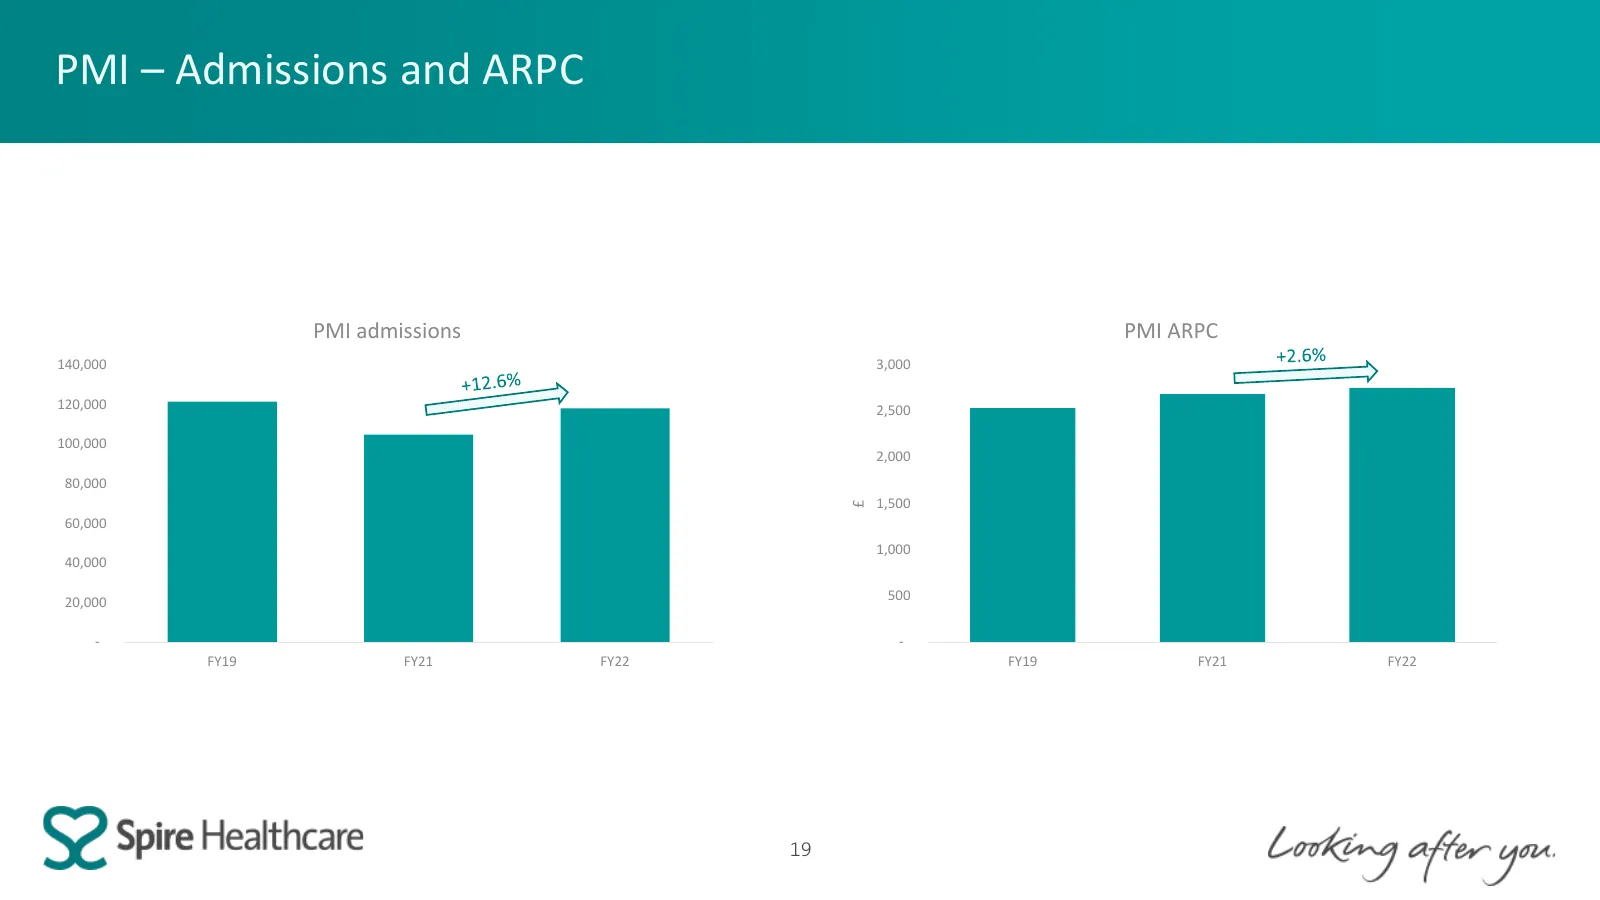
Slide 19: PMI – Admissions and ARPC
PMI – Admissions and ARPC PMI admissions PMI ARPC 140,000 3,000 120,000 2,500 100,000 2,000 80,000 1,500 £ 60,000 1,000 40,000 20,000 500 - - FY19 FY21 FY22 FY19 FY21 FY22 19
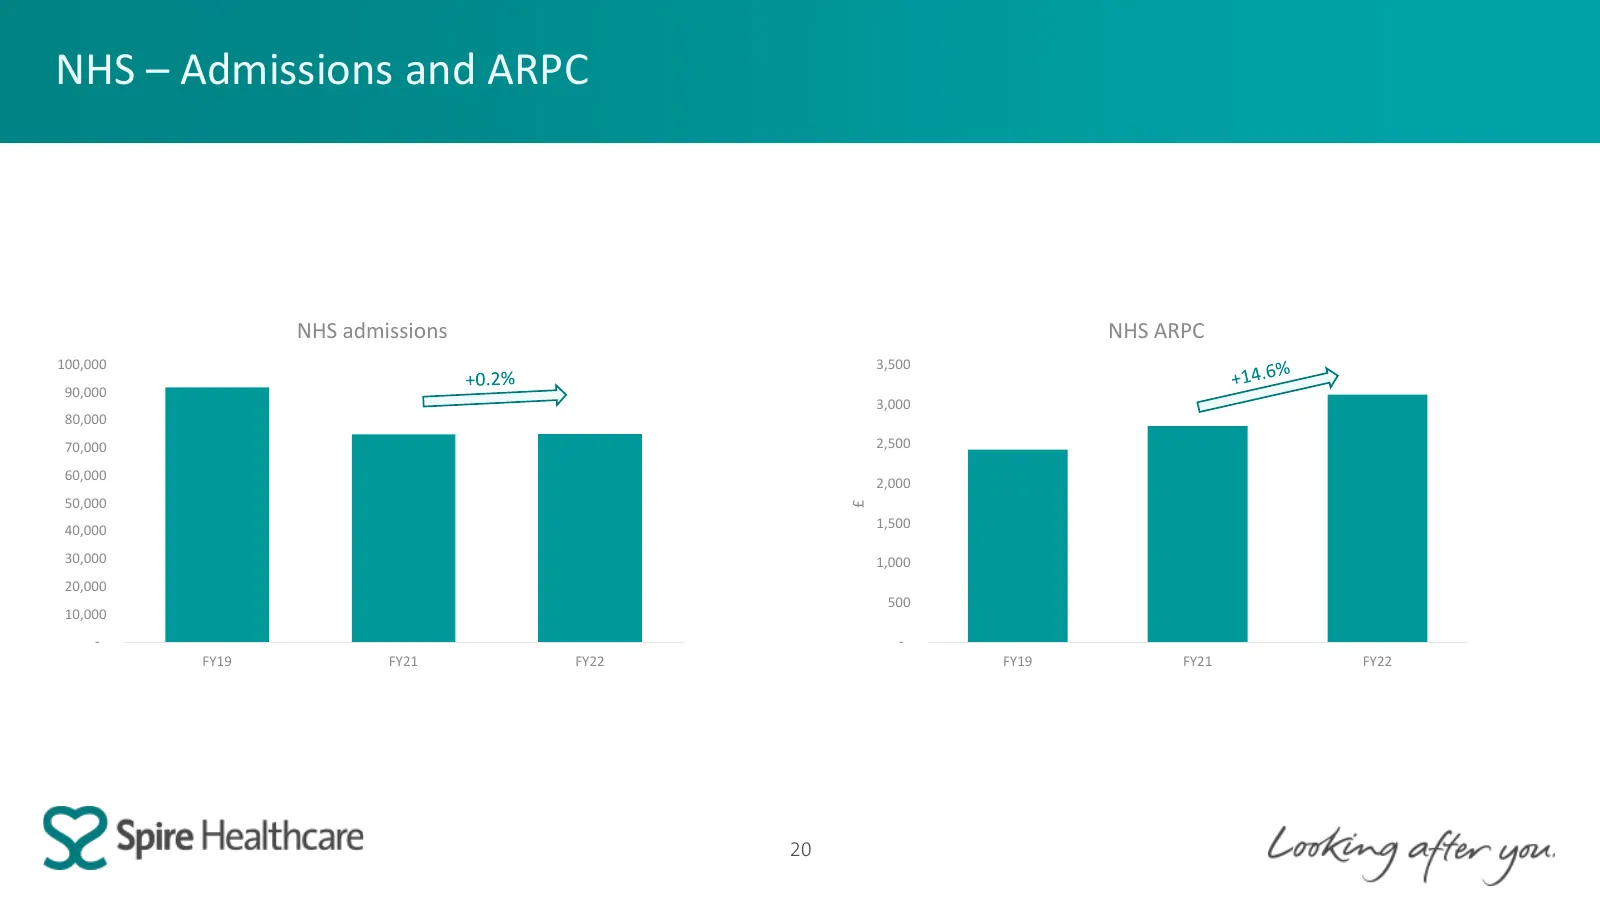
Slide 20: NHS – Admissions and ARPC
NHS – Admissions and ARPC NHS admissions NHS ARPC 100,000 3,500 90,000 3,000 80,000 70,000 2,500 60,000 2,000 50,000 £ 1,500 40,000 30,000 1,000 20,000 500 10,000 - - FY19 FY21 FY22 FY19 FY21 FY22 20
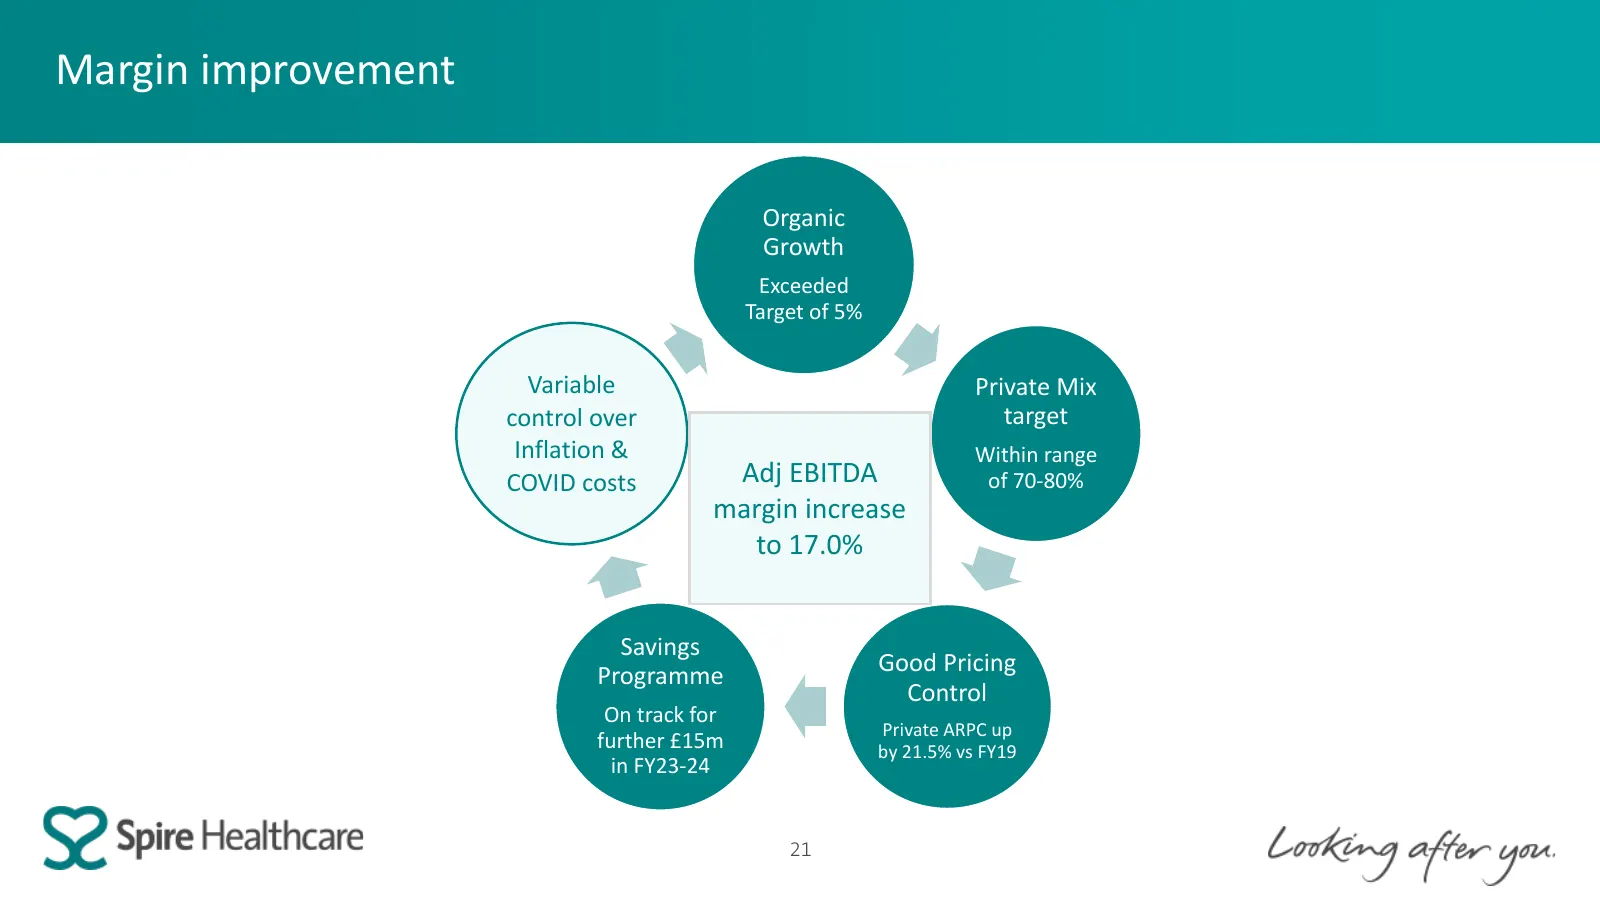
Slide 21: Margin improvement
Margin improvement Organic Growth Exceeded Target of 5% Variable Private Mix control over target Inflation & Within range COVID costs Adj EBITDA of 70-80% margin increase to 17.0% Savings Programme Good Pricing Control On track for Private ARPC up further £15m by 21.5% vs FY19 in FY23-24 21
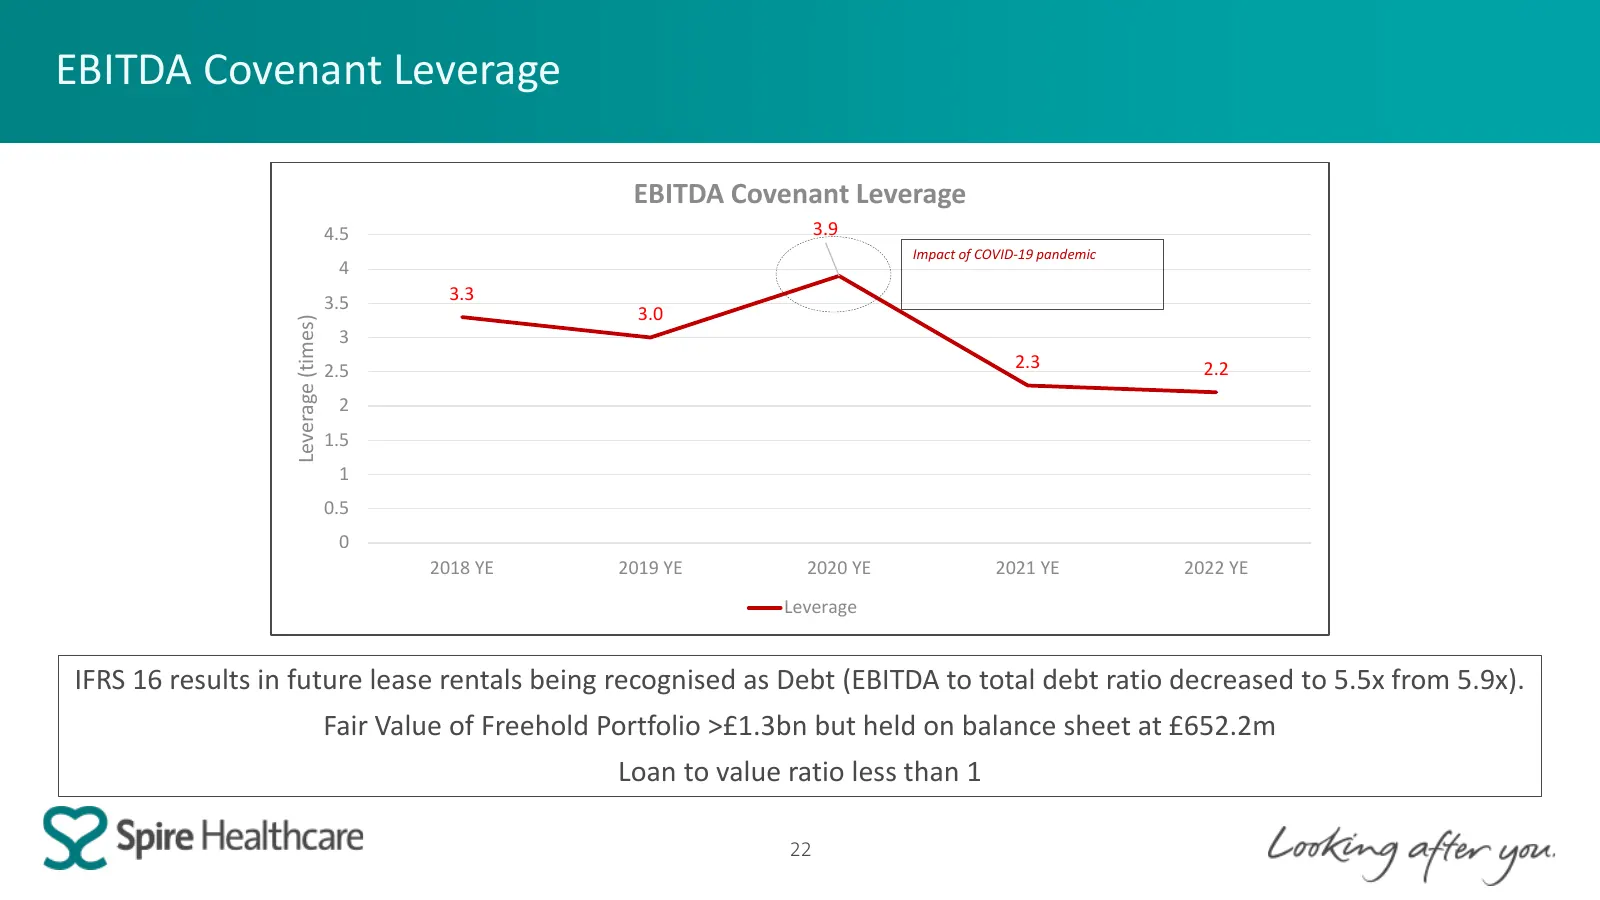
Slide 22: EBITDA Covenant Leverage
EBITDA Covenant Leverage EBITDA Covenant Leverage 4.5 3.9 Impact of COVID-19 pandemic 4 3.5 3.3 Leverage (times) 3.0 3 2.5 2.3 2.2 2 1.5 1 0.5 0 2018 YE 2019 YE 2020 YE 2021 YE 2022 YE Leverage IFRS 16 results in future lease rentals being recognised as Debt (EBITDA to total debt ratio decreased to
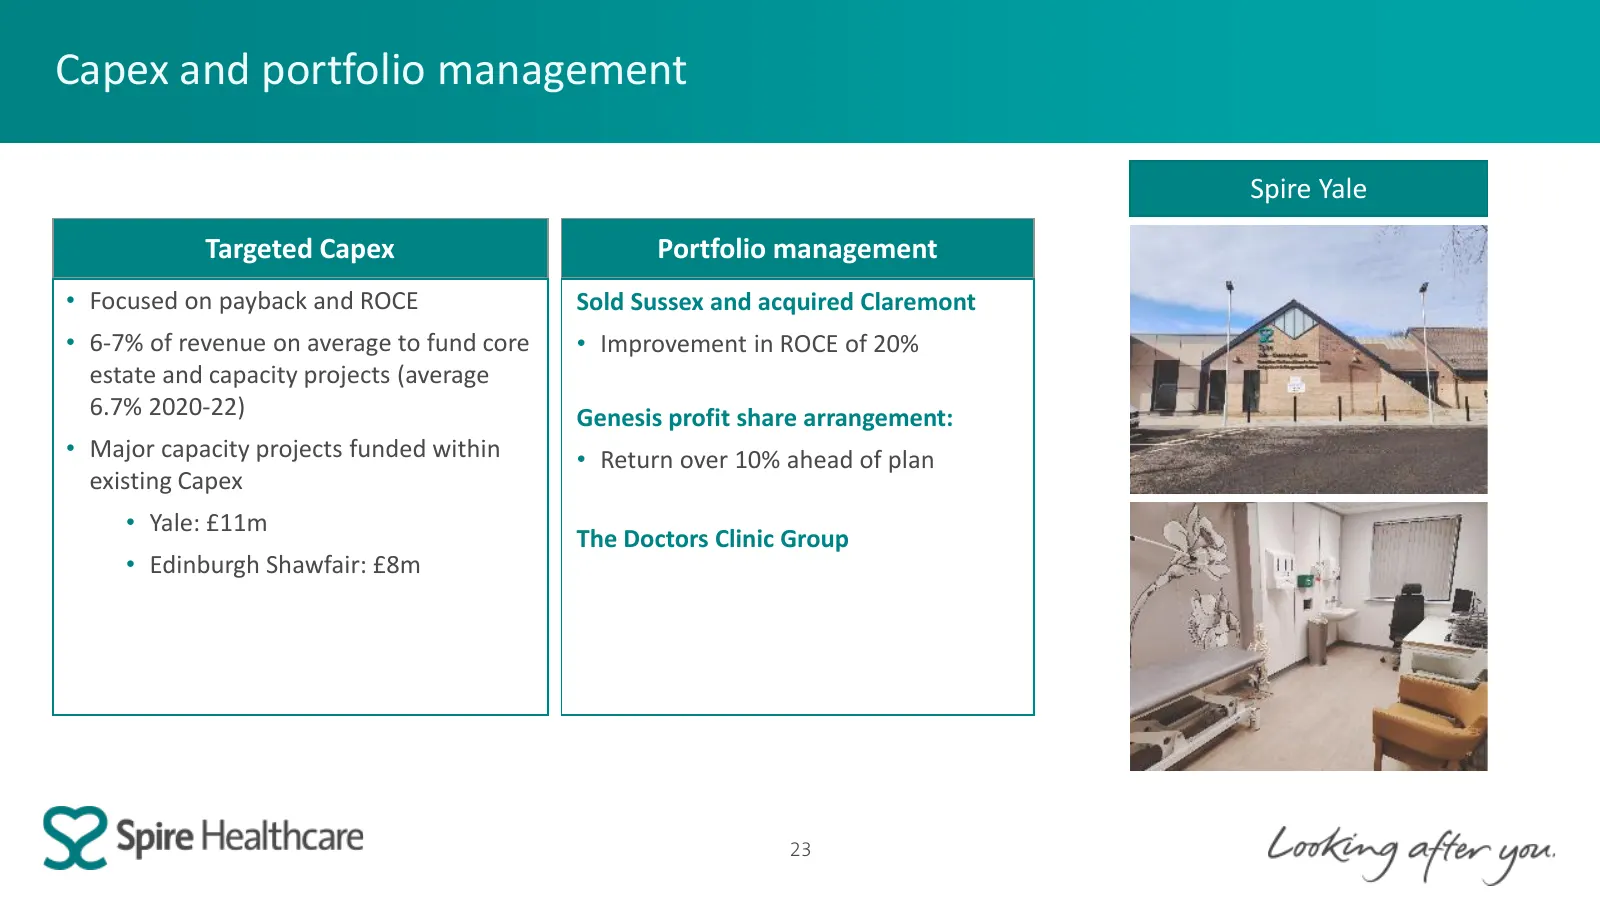
Slide 23: Capex and portfolio management
Capex and portfolio management Spire Yale Targeted Capex Portfolio management • Focused on payback and ROCE Sold Sussex and acquired Claremont • 6-7% of revenue on average to fund core • Improvement in ROCE of 20% estate and capacity projects (average 6.7% 2020-22) Genesis profit share arrangement:

Slide 24: Strategic developments
Strategic developments Justin Ash, Chief Executive Officer
Slide 25: Our purpose: Making a positive difference to people's lives through outstanding personalised care
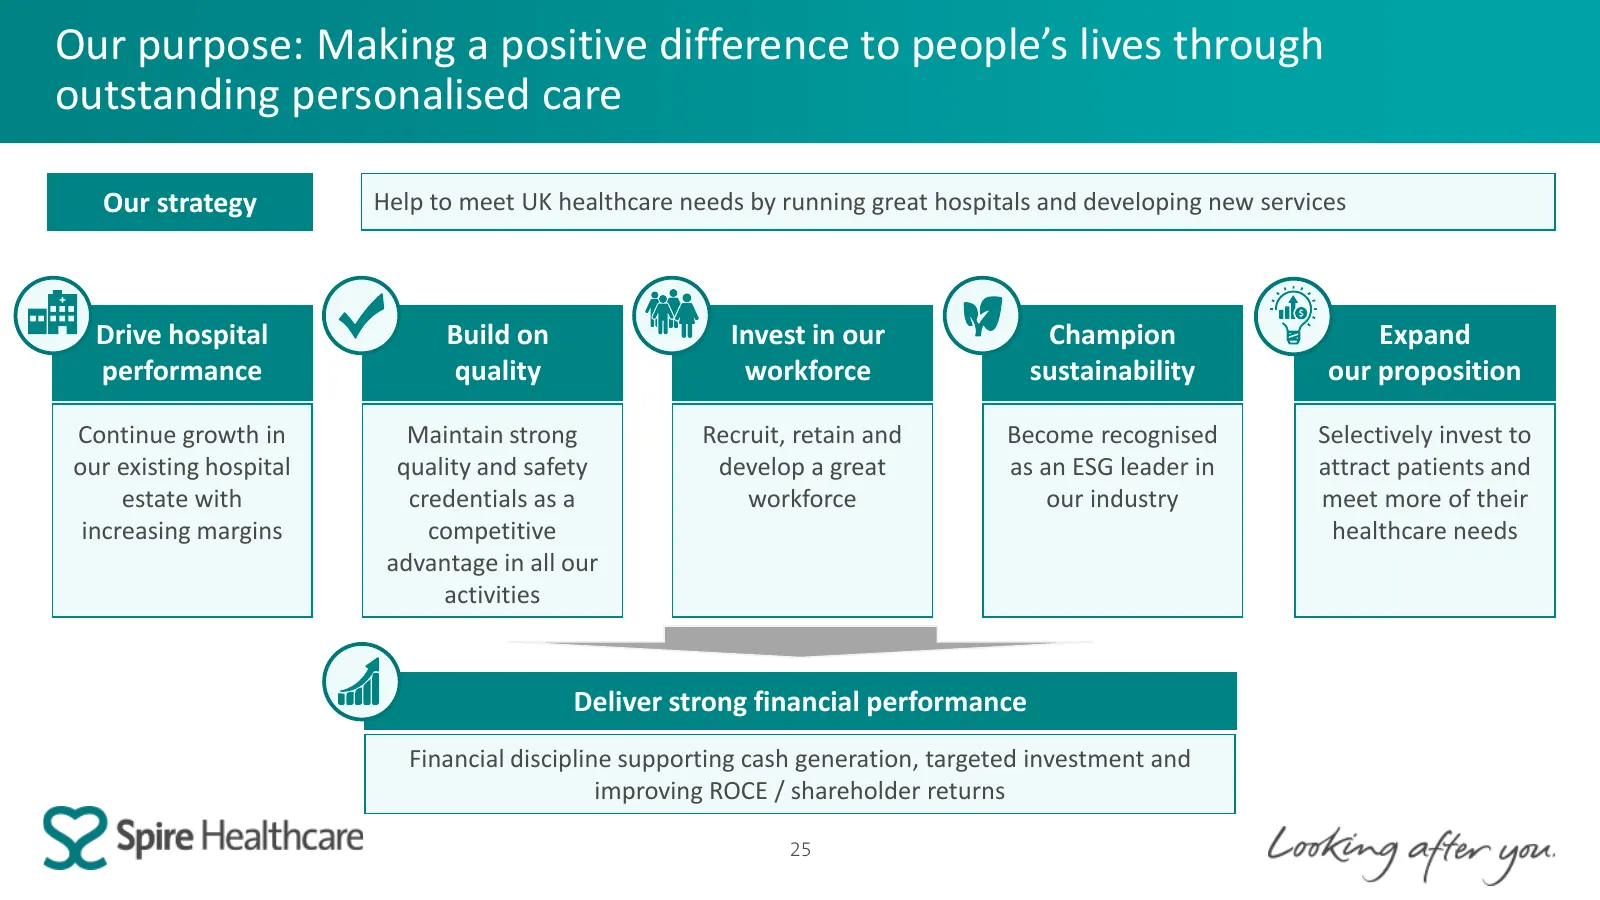
Our purpose: Making a positive difference to people’s lives through outstanding personalised care Our strategy Help to meet UK healthcare needs by running great hospitals and developing new services Drive hospital Build on Invest in our Champion Expand performance quality workforce sustainability ou
Slide 26: Pillar: Drive hospital performance
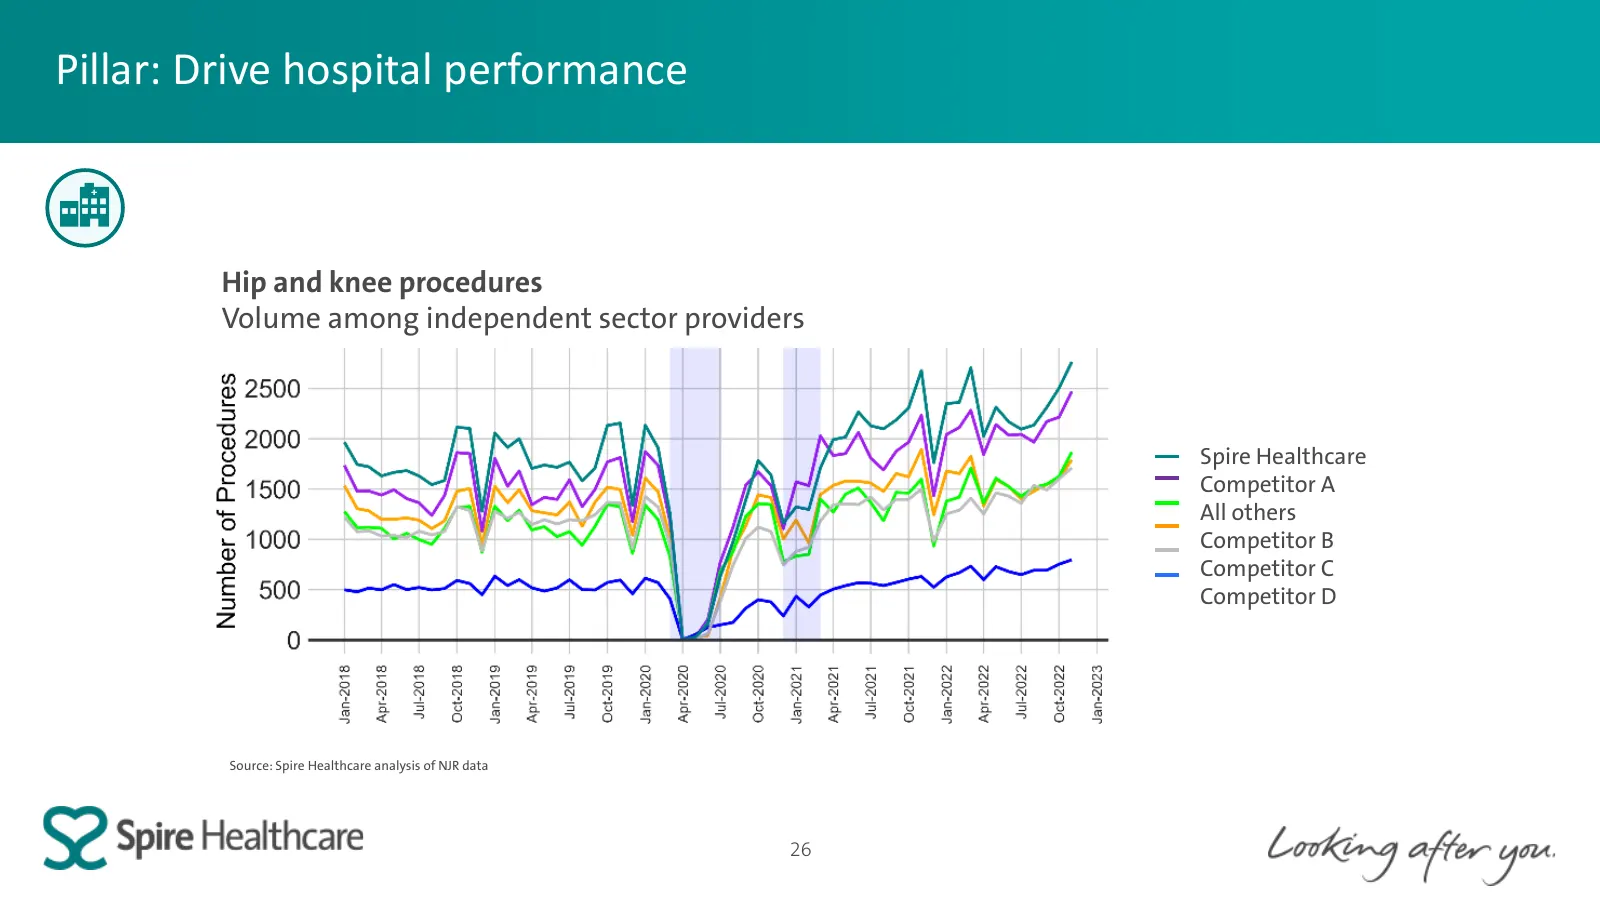
Pillar: Drive hospital performance Hip and knee procedures Volume among independent sector providers Spire Healthcare Competitor A All others Competitor B Competitor C Competitor D Source: Spire Healthcare analysis of NJR data 26
Slide 27: Pillar: Build on quality
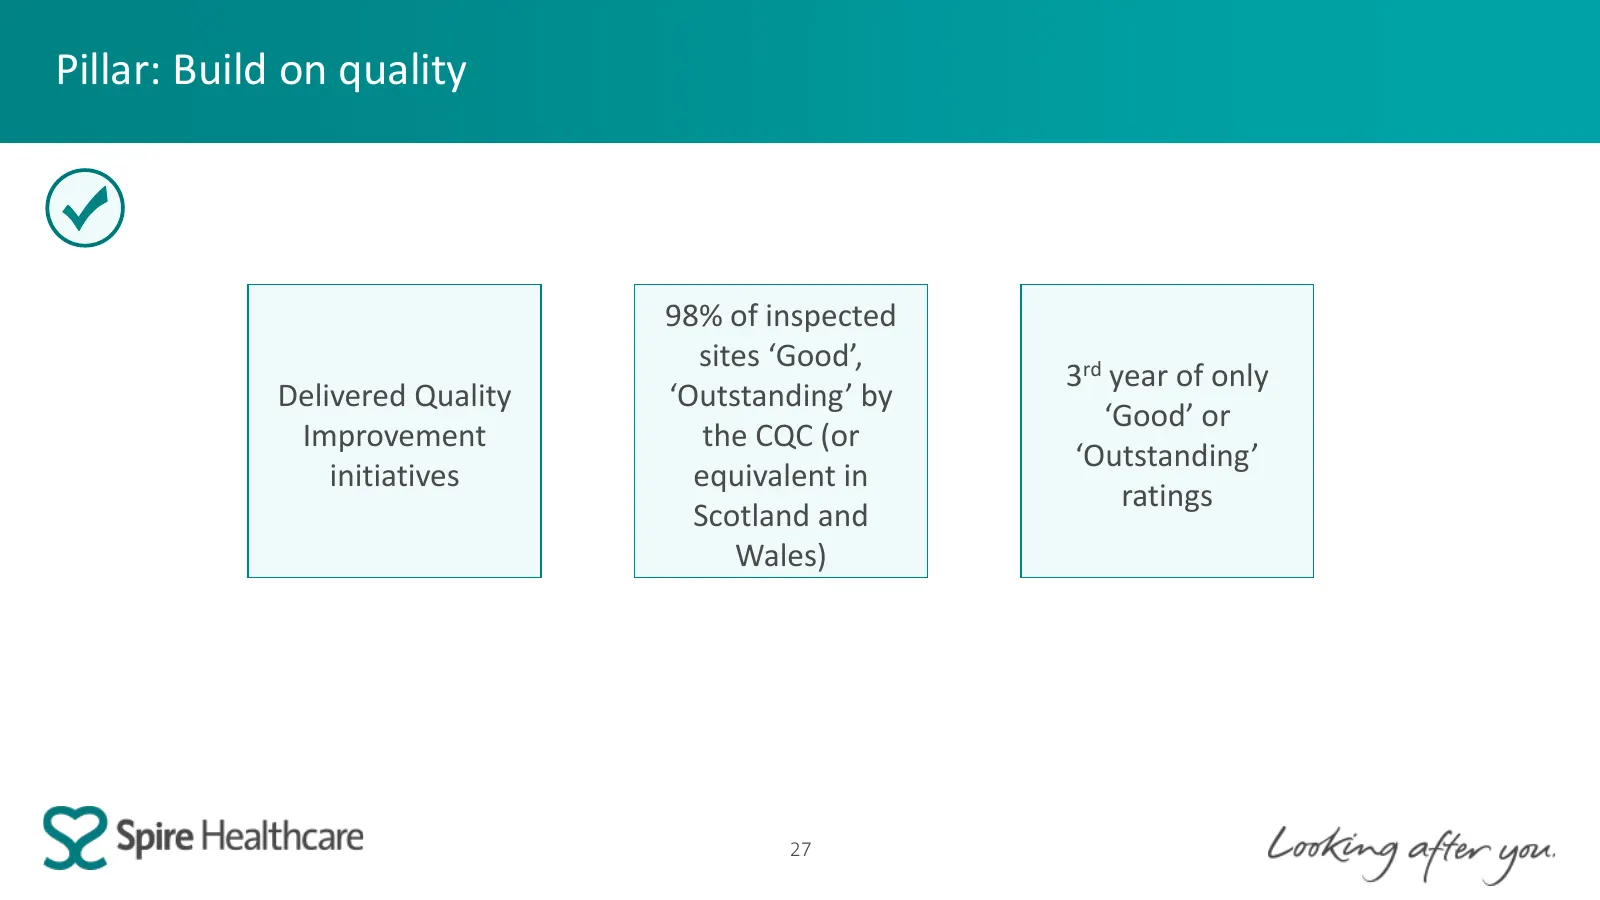
Pillar: Build on quality 98% of inspected sites ‘Good’, 3rd year of only Delivered Quality ‘Outstanding’ by ‘Good’ or Improvement the CQC (or ‘Outstanding’ initiatives equivalent in ratings Scotland and Wales) 27
Slide 28: Pillar: Invest in our workforce
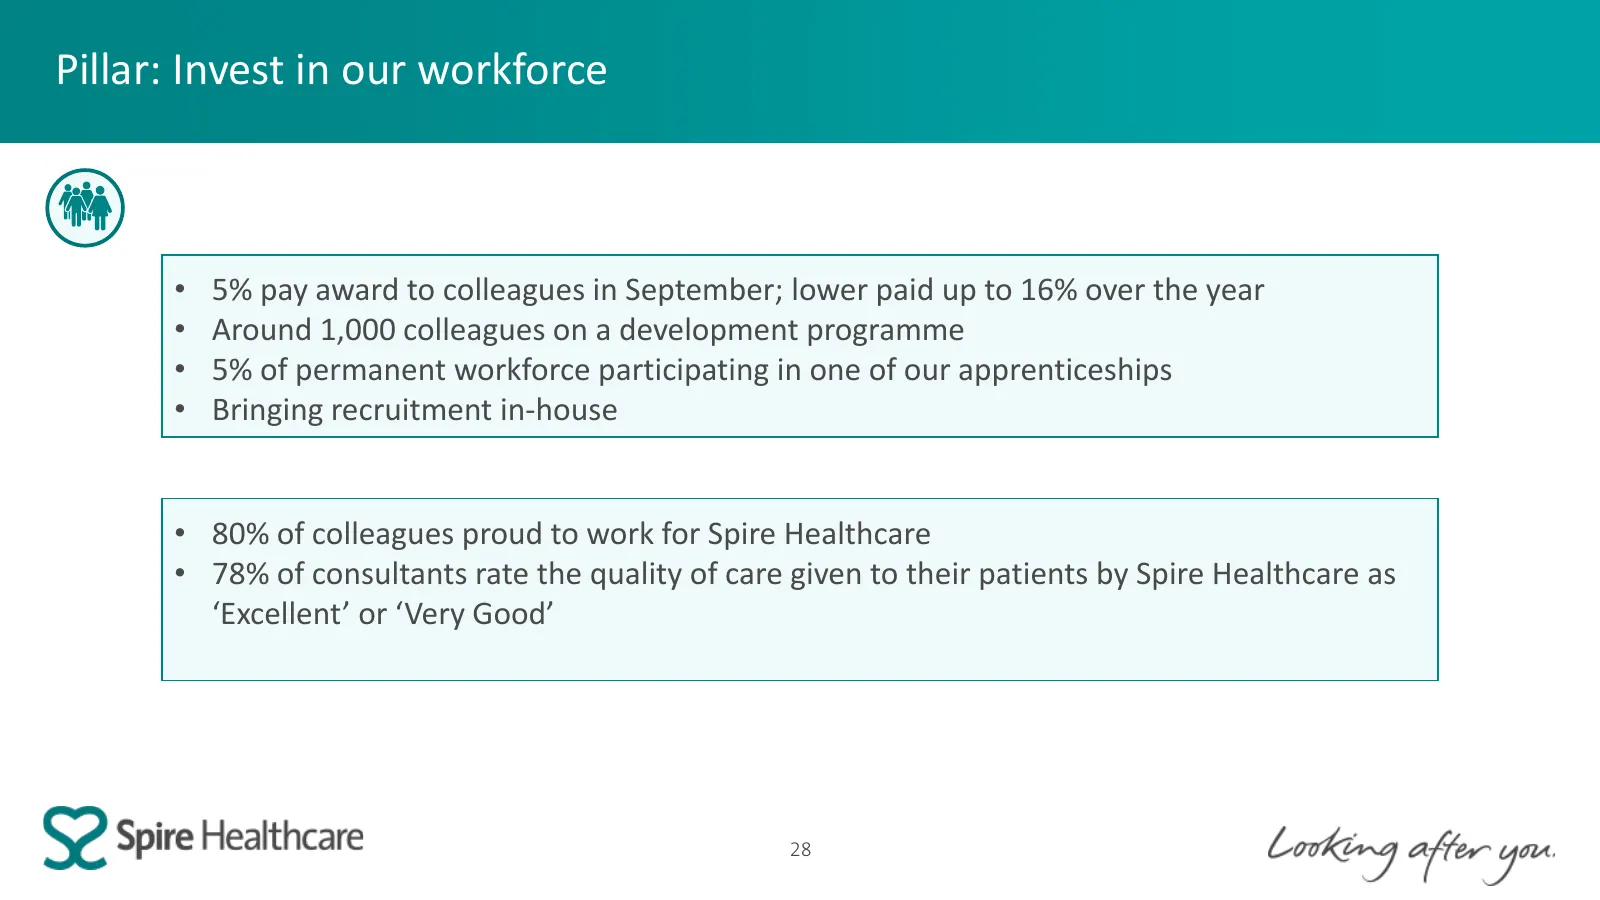
Pillar: Invest in our workforce • 5% pay award to colleagues in September; lower paid up to 16% over the year • Around 1,000 colleagues on a development programme • 5% of permanent workforce participating in one of our apprenticeships • Bringing recruitment in-house • 80% of colleagues proud to work
Slide 29: Pillar: Champion sustainability
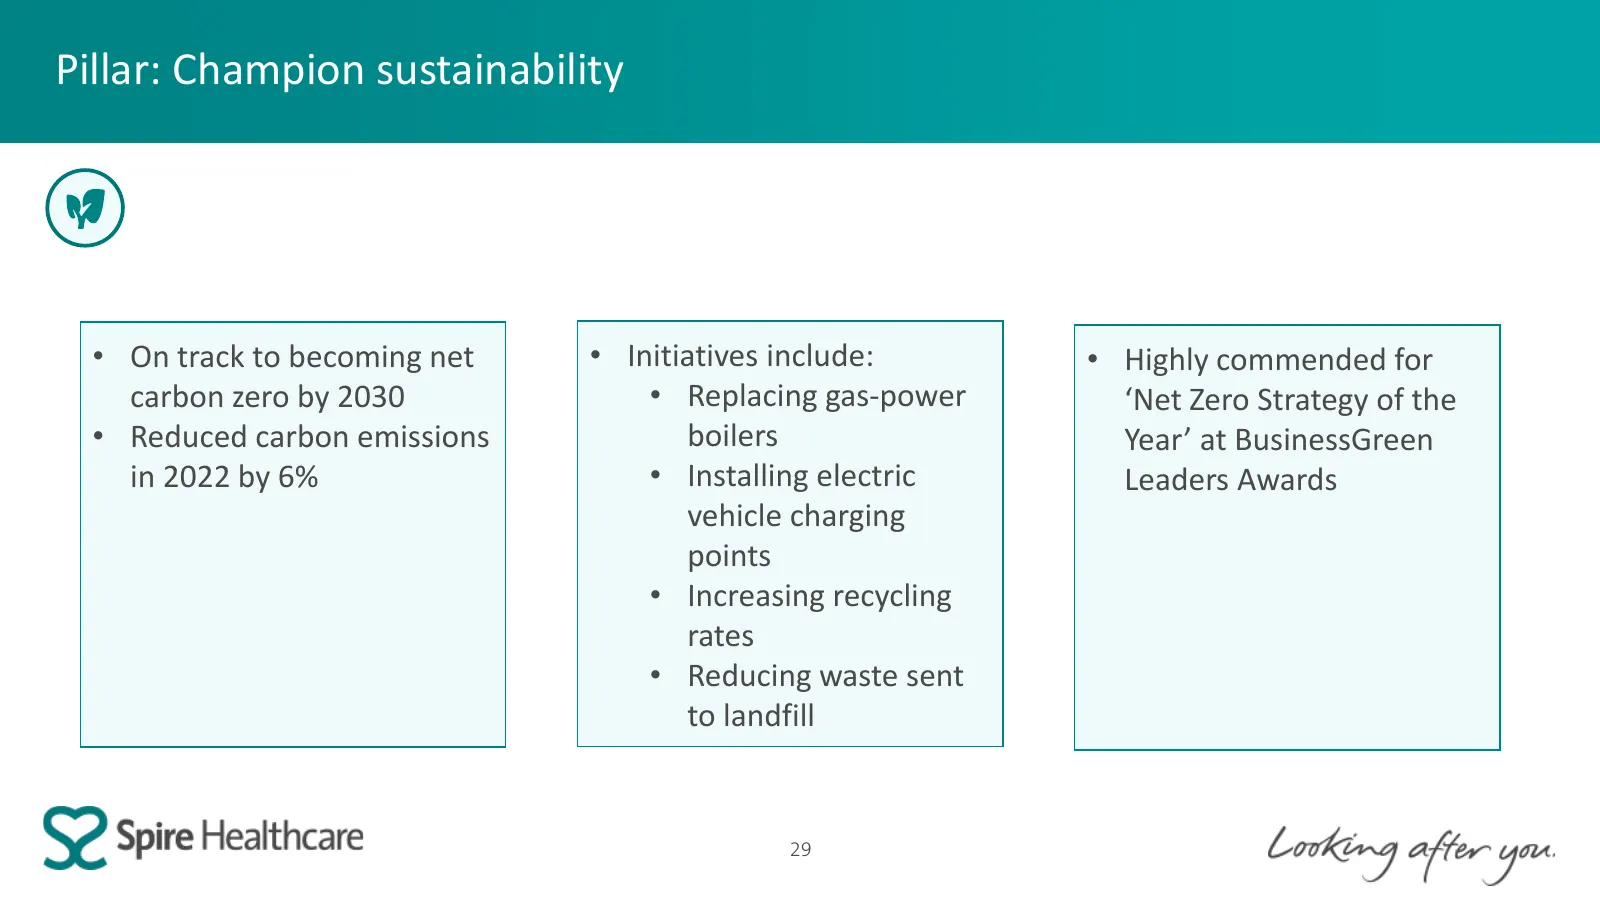
Pillar: Champion sustainability • On track to becoming net • Initiatives include: • Highly commended for carbon zero by 2030 • Replacing gas-power ‘Net Zero Strategy of the • Reduced carbon emissions boilers Year’ at BusinessGreen in 2022 by 6% • Installing electric Leaders Awards vehicle charging p
Slide 30: Pillar: Expand our proposition
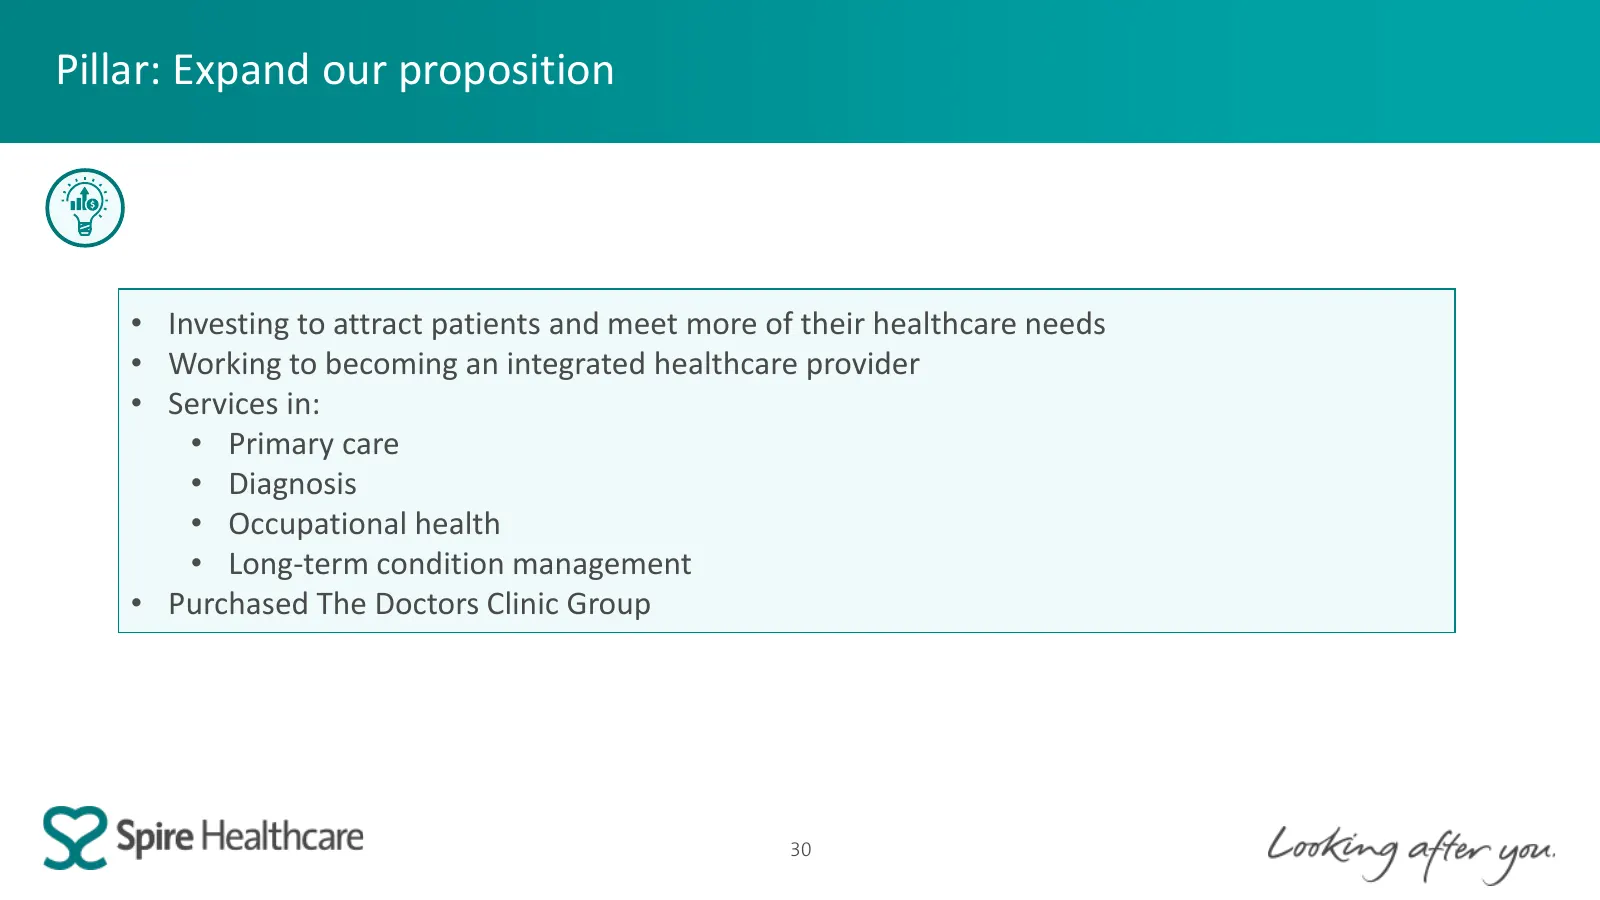
Pillar: Expand our proposition • Investing to attract patients and meet more of their healthcare needs • Working to becoming an integrated healthcare provider • Services in: • Primary care • Diagnosis • Occupational health • Long-term condition management • Purchased The Doctors Clinic Group 30

Slide 31: Expanding our proposition
Expanding our proposition Peter Corfield, Chief Commercial Officer
Slide 32: Our three areas of focus to expand our proposition
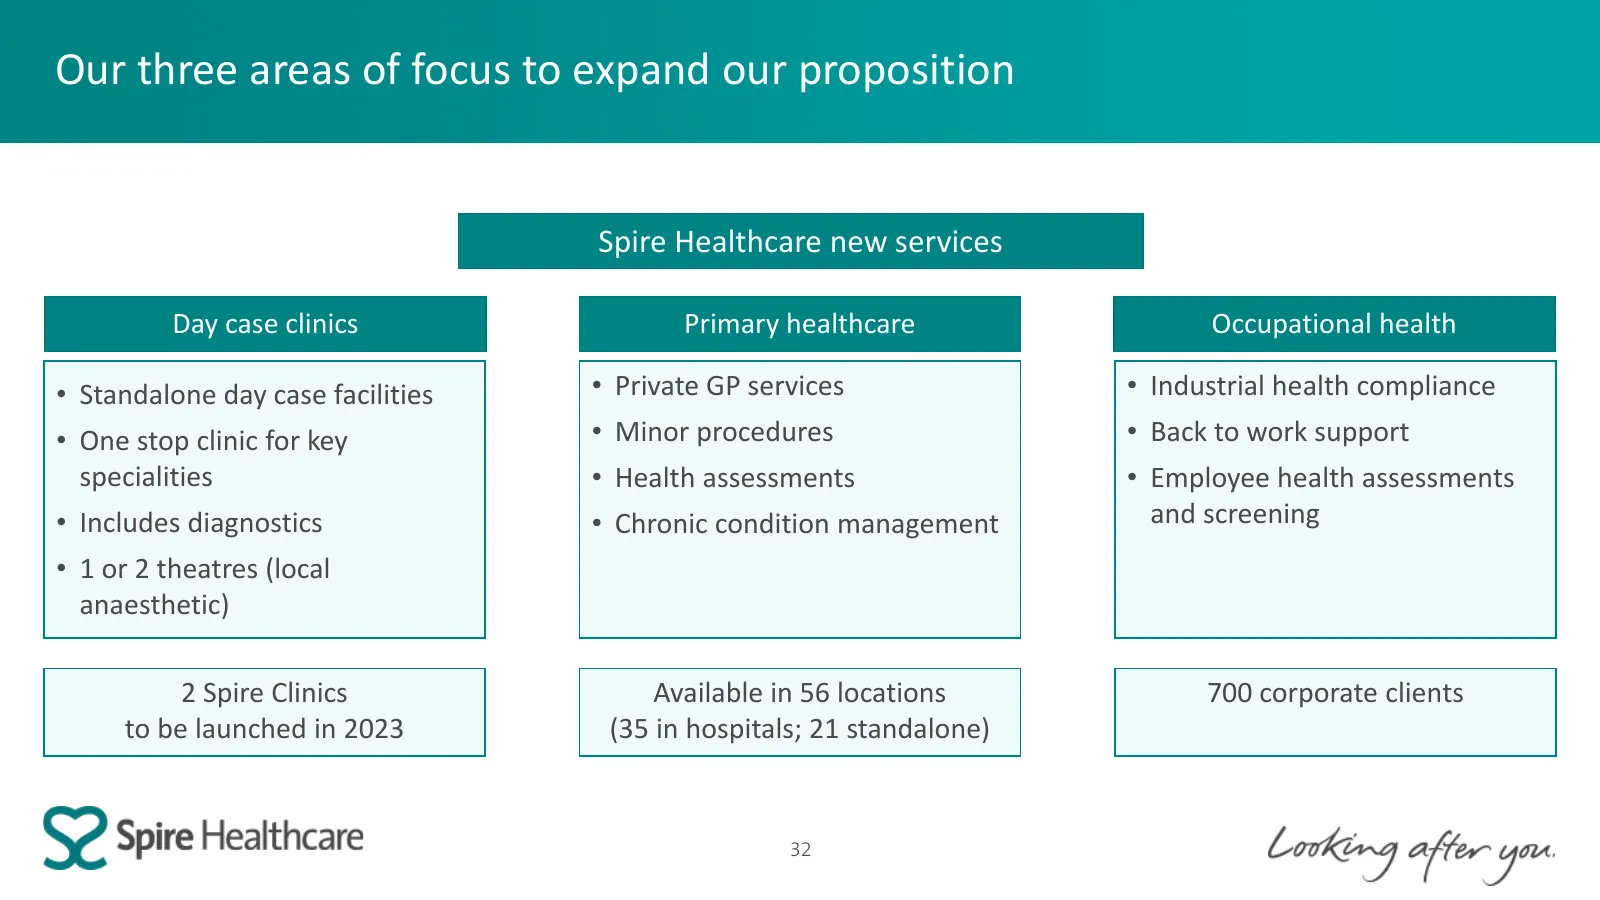
Our three areas of focus to expand our proposition Spire Healthcare new services Day case clinics Primary healthcare Occupational health • Standalone day case facilities • Private GP services • Industrial health compliance • One stop clinic for key • Minor procedures • Back to work support specialit
Slide 33: The Doctors Clinic Group
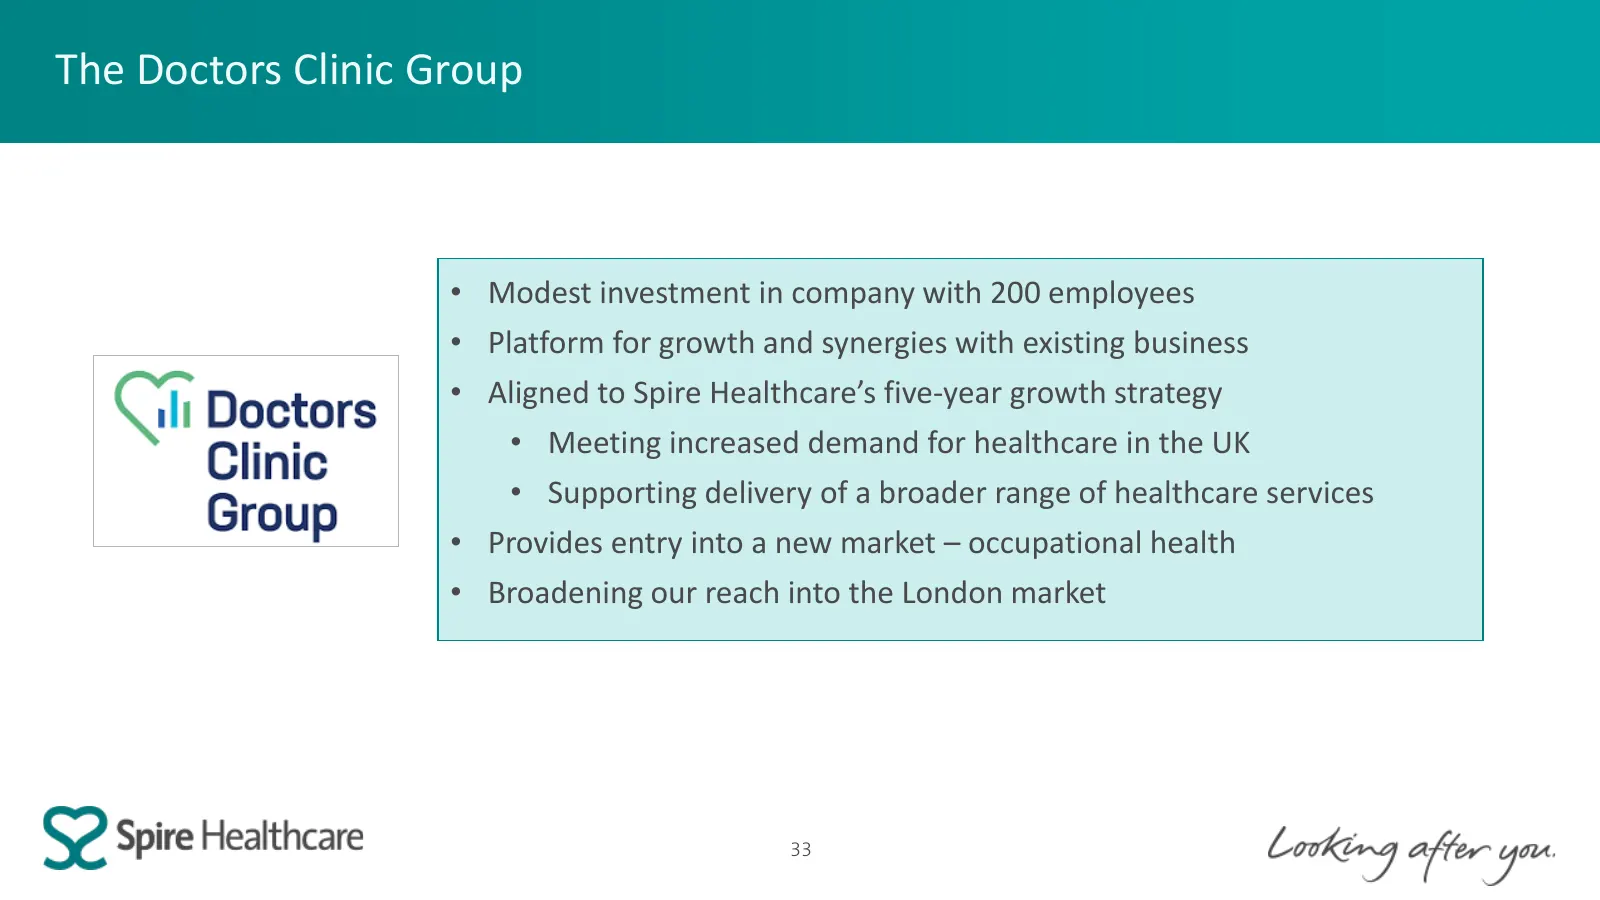
The Doctors Clinic Group • Modest investment in company with 200 employees • Platform for growth and synergies with existing business • Aligned to Spire Healthcare’s five-year growth strategy • Meeting increased demand for healthcare in the UK • Supporting delivery of a broader range of healthcare s
Slide 34: The Doctors Clinic Group cont'd
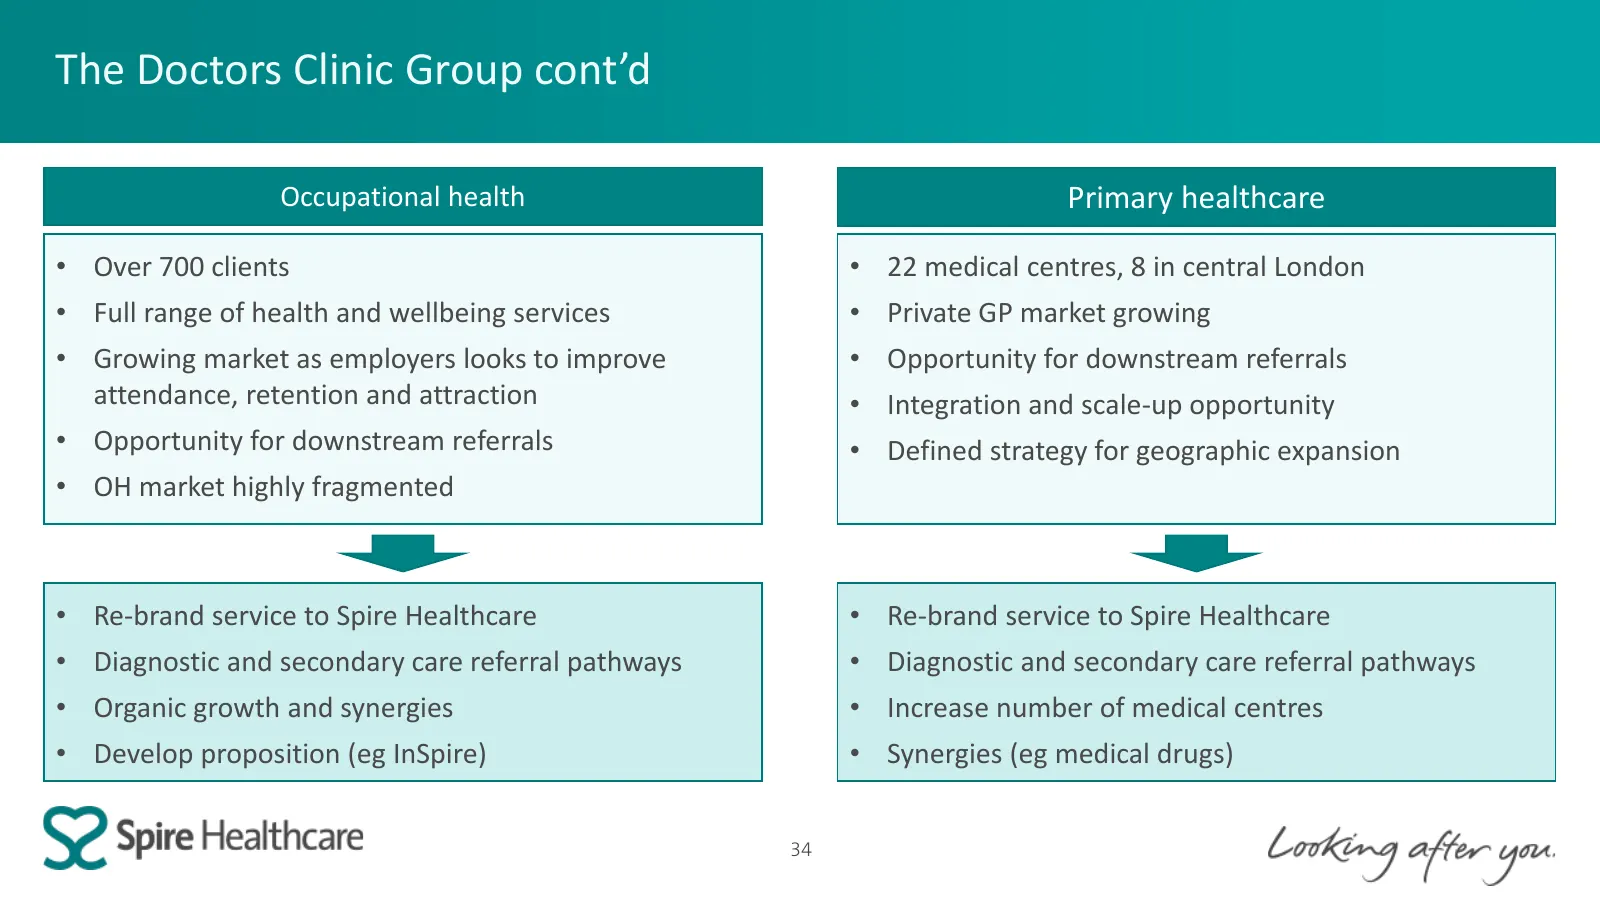
The Doctors Clinic Group cont’d Occupational health Primary healthcare • Over 700 clients • 22 medical centres, 8 in central London • Full range of health and wellbeing services • Private GP market growing • Growing market as employers looks to improve • Opportunity for downstream referrals attendan

Slide 35: Outlook
Outlook Justin Ash, Chief Executive Officer
Slide 36: Outlook for 2023
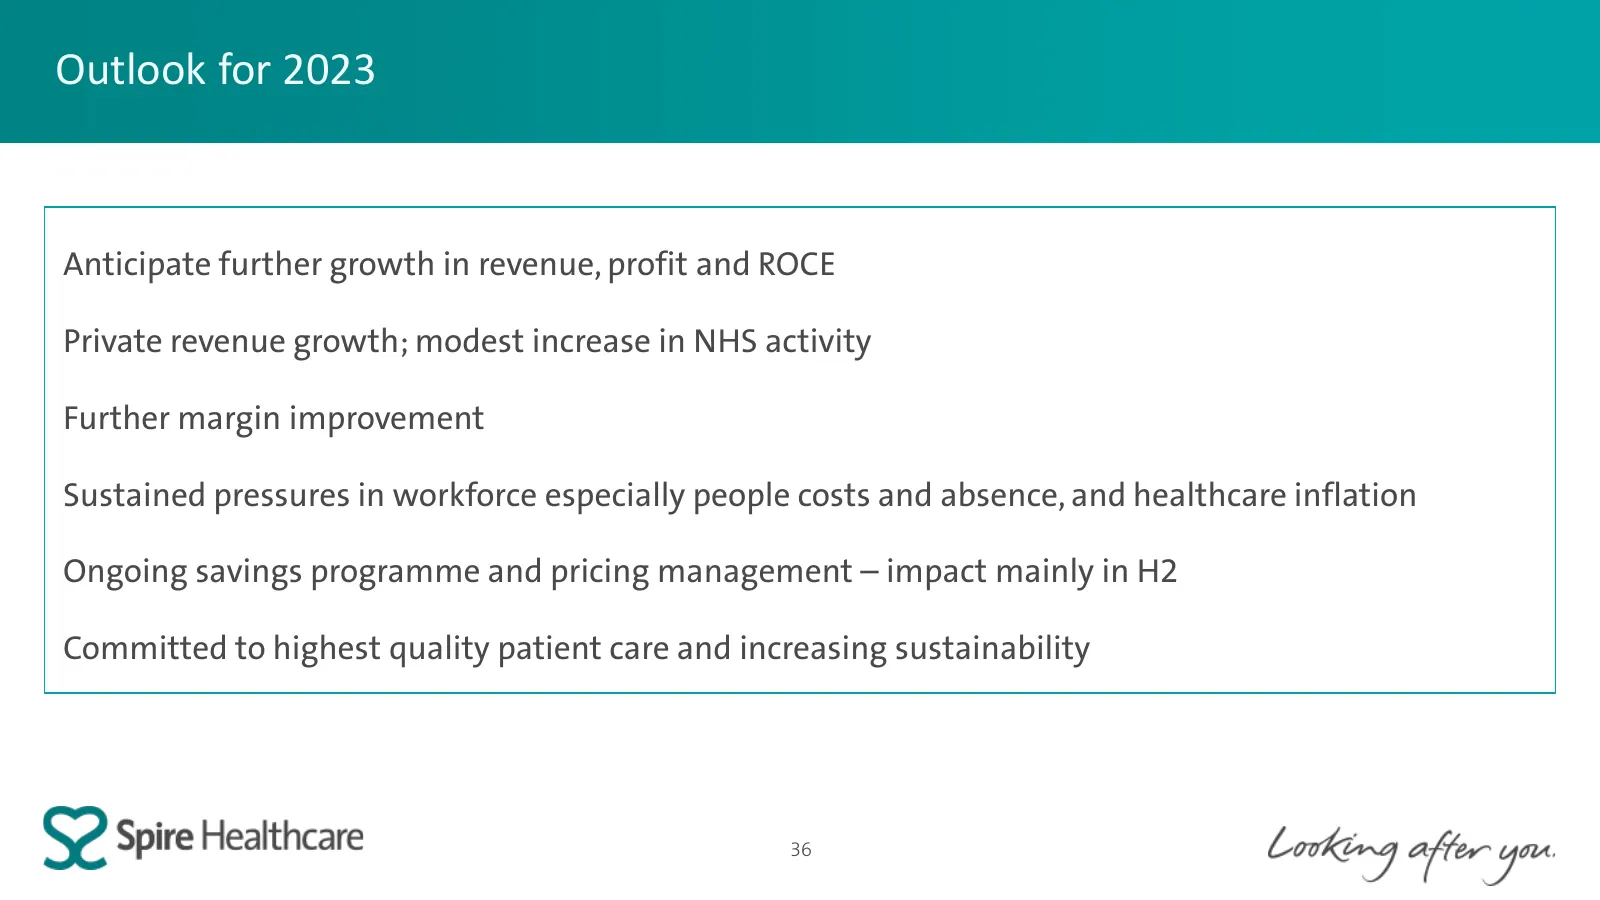
Outlook for 2023 Anticipate further growth in revenue, profit and ROCE Private revenue growth; modest increase in NHS activity Further margin improvement Sustained pressures in workforce especially people costs and absence, and healthcare inflation Ongoing savings programme and pricing management –

Slide 37: FY22 Results Presentation
FY22 Results Presentation 2 March 2023

Slide 38: Appendix
S2 Spire Healthcare Appendix Covking after ya
Slide 39: Technical guidance
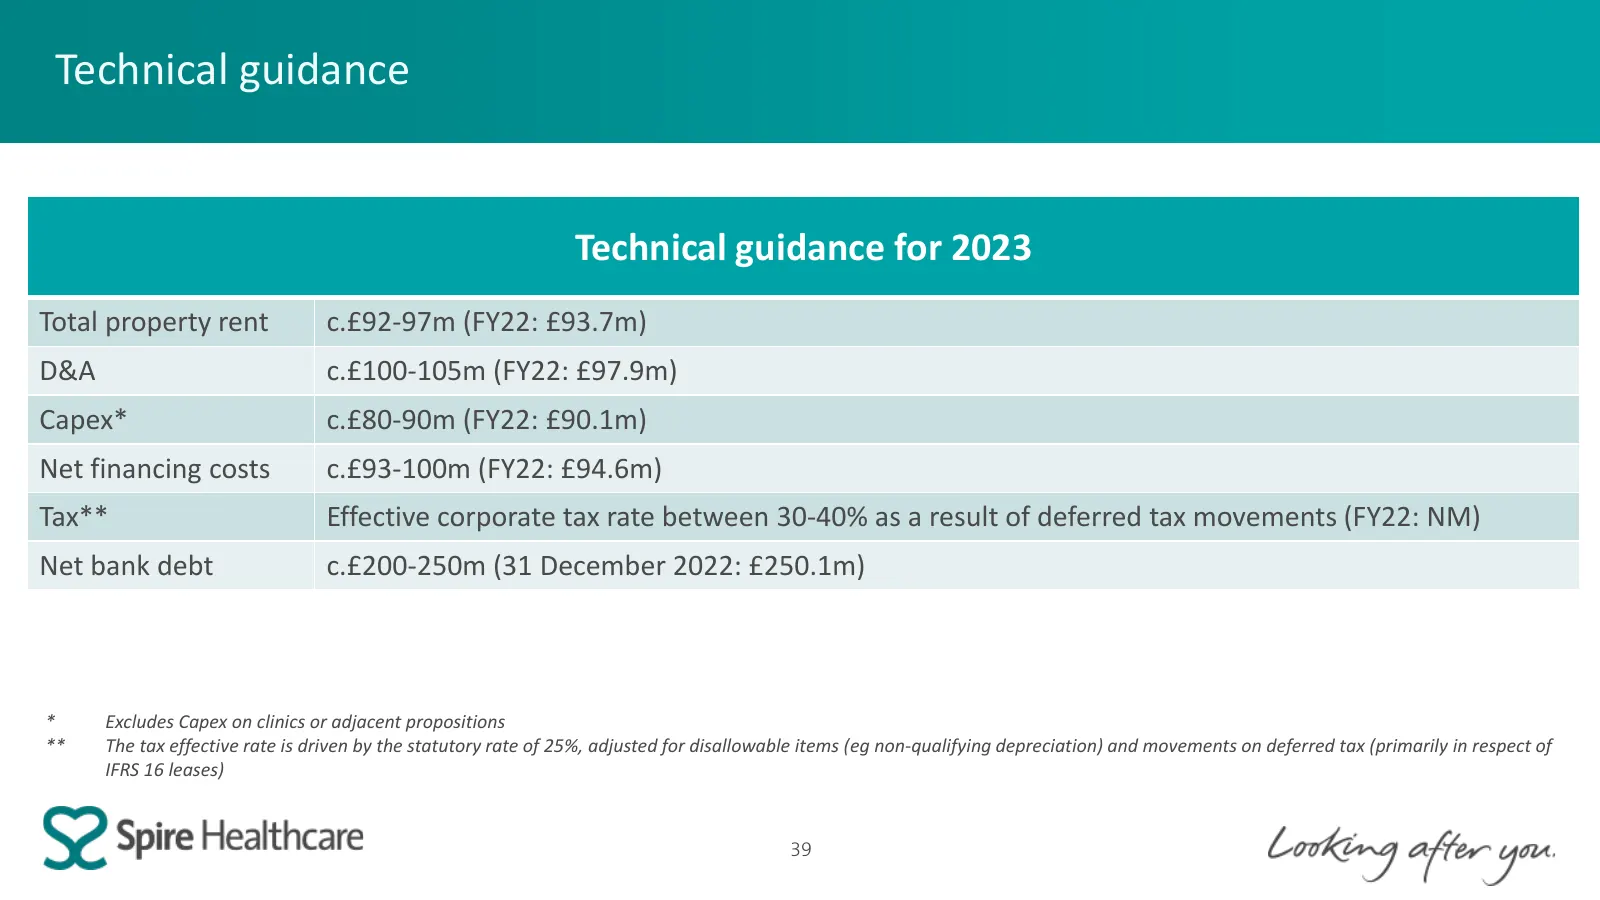
Technical guidance Technical guidance for 2023 Total property rent c.£92-97m (FY22: £93.7m) D&A c.£100-105m (FY22: £97.9m) Capex* c.£80-90m (FY22: £90.1m) Net financing costs c.£93-100m (FY22: £94.6m) Tax** Effective corporate tax rate between 30-40% as a result of deferred tax movements (FY22: NM)
Slide 40: Volume
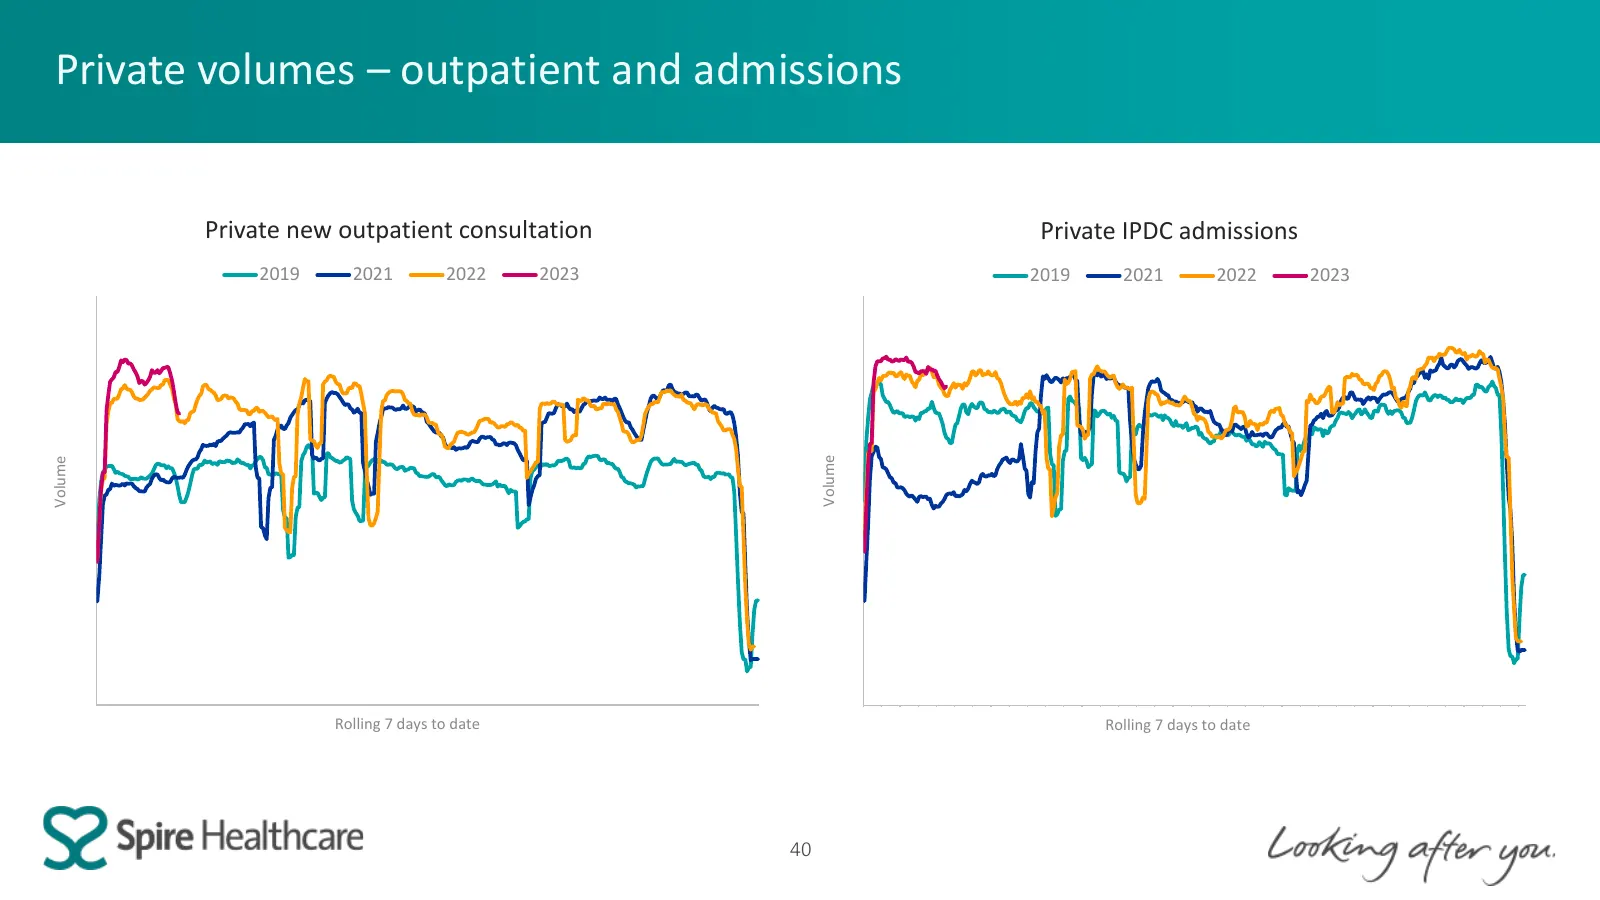
Volume 10000 12000 14000 16000 0 2000 4000 6000 8000 04.01.2021 07.01.2021 10.01.2021 13.01.2021 16.01.2021 19.01.2021 22.01.2021 25.01.2021 28.01.2021 31.01.2021 03.02.2021 06.02.2021 09.02.2021 12.02.2021 15.02.2021 18.02.2021 21.02.2021 24.02.2021 27.02.2021 02.03.2021 05.03.2021 08.03.2021 11.03
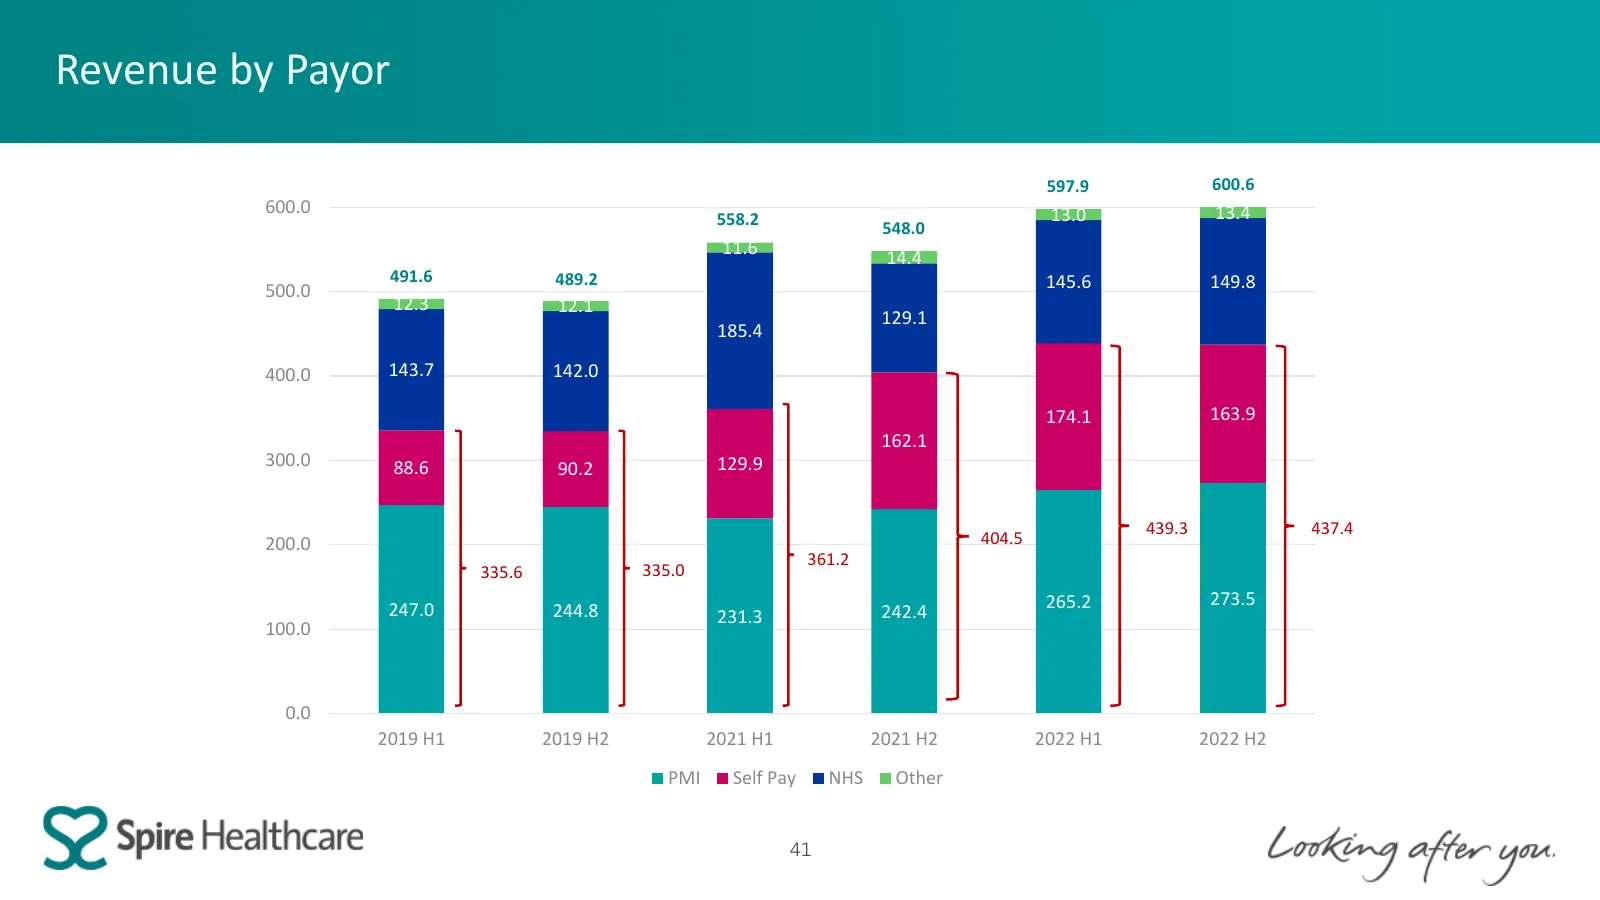
Slide 41: Revenue by Payor
Revenue by Payor 597.9 600.6 600.0 13.0 13.4 558.2 548.0 11.6 14.4 491.6 489.2 145.6 149.8 500.0 12.3 12.1 129.1 185.4 400.0 143.7 142.0 174.1 163.9 162.1 300.0 88.6 90.2 129.9 439.3 437.4 200.0 404.5 361.2 335.6 335.0 265.2 273.5 247.0 244.8 231.3 242.4 100.0 0.0 2019 H1 2019 H2 2021 H1 2021 H2 202
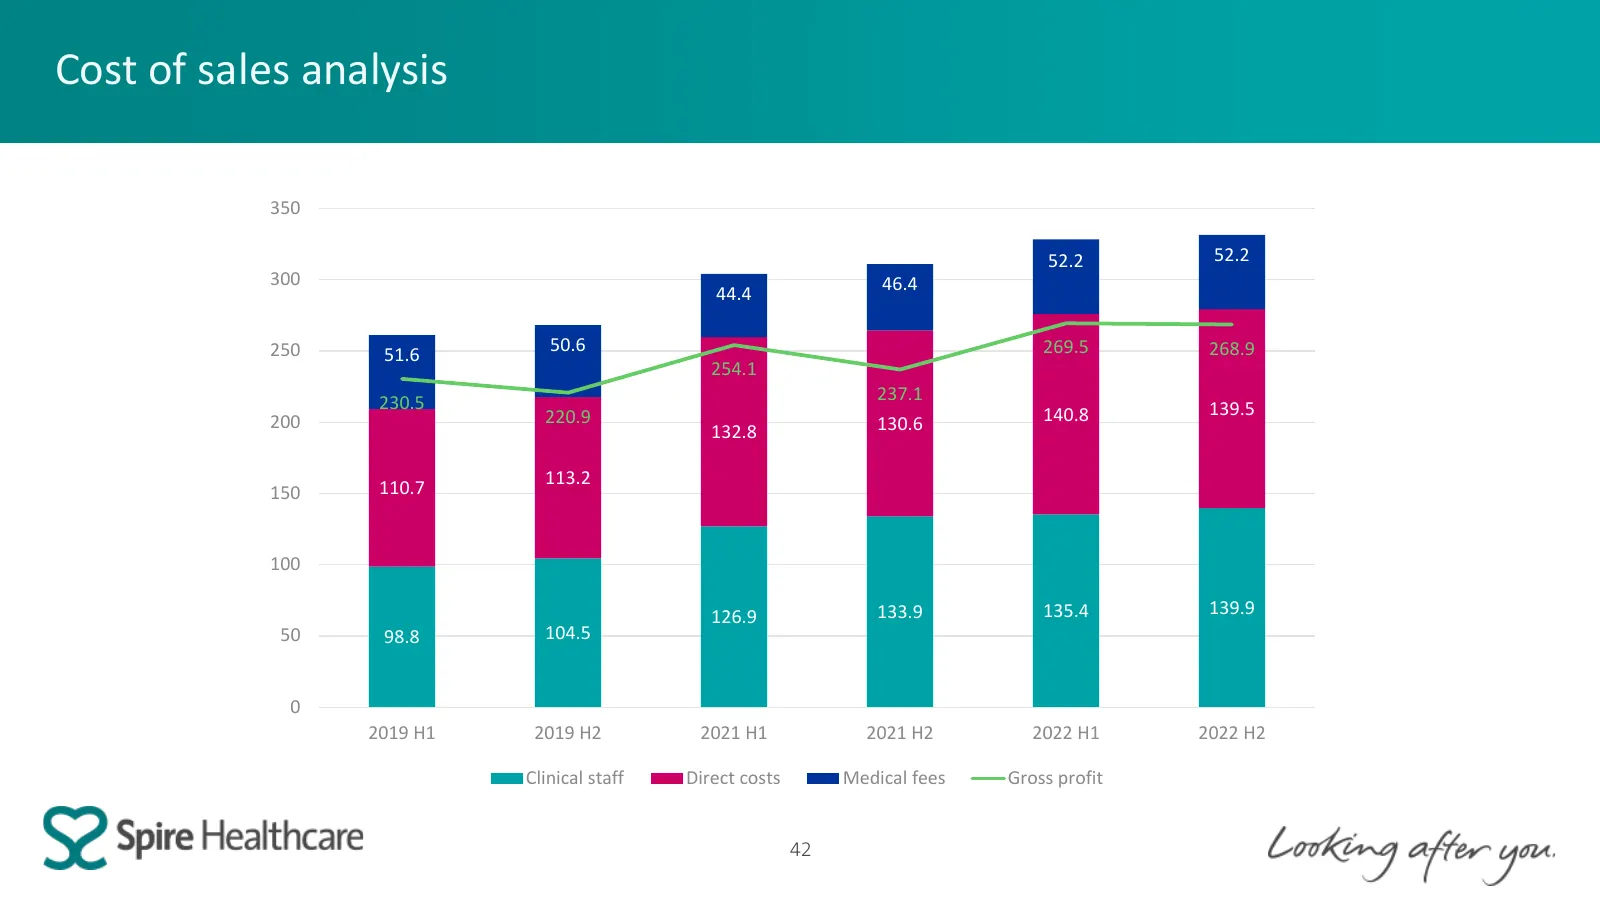
Slide 42: Cost of sales analysis
Cost of sales analysis 350 52.2 52.2 300 46.4 44.4 250 50.6 269.5 268.9 51.6 254.1 230.5 237.1 220.9 140.8 139.5 200 130.6 132.8 110.7 113.2 150 100 126.9 133.9 135.4 139.9 50 98.8 104.5 0 2019 H1 2019 H2 2021 H1 2021 H2 2022 H1 2022 H2 Clinical staff Direct costs Medical fees Gross profit 42
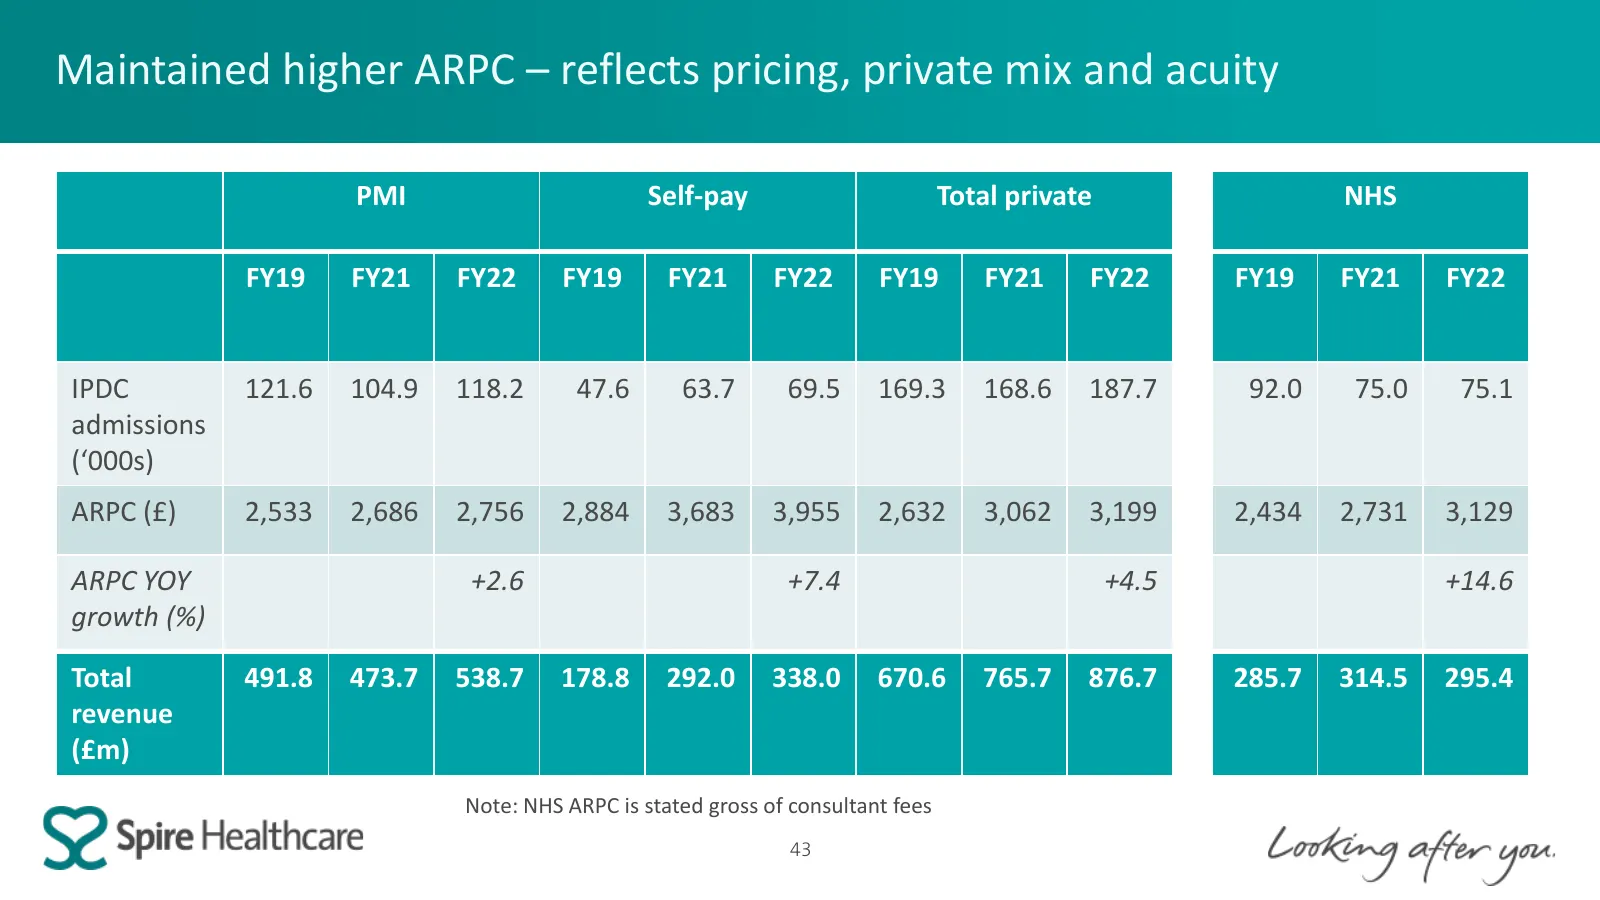
Slide 43: Maintained higher ARPC – reflects pricing, private mix and acuity
Maintained higher ARPC – reflects pricing, private mix and acuity PMI Self-pay Total private NHS FY19 FY21 FY22 FY19 FY21 FY22 FY19 FY21 FY22 FY19 FY21 FY22 IPDC 121.6 104.9 118.2 47.6 63.7 69.5 169.3 168.6 187.7 92.0 75.0 75.1 admissions (‘000s) ARPC (£) 2,533 2,686 2,756 2,884 3,683 3,955 2,632 3,
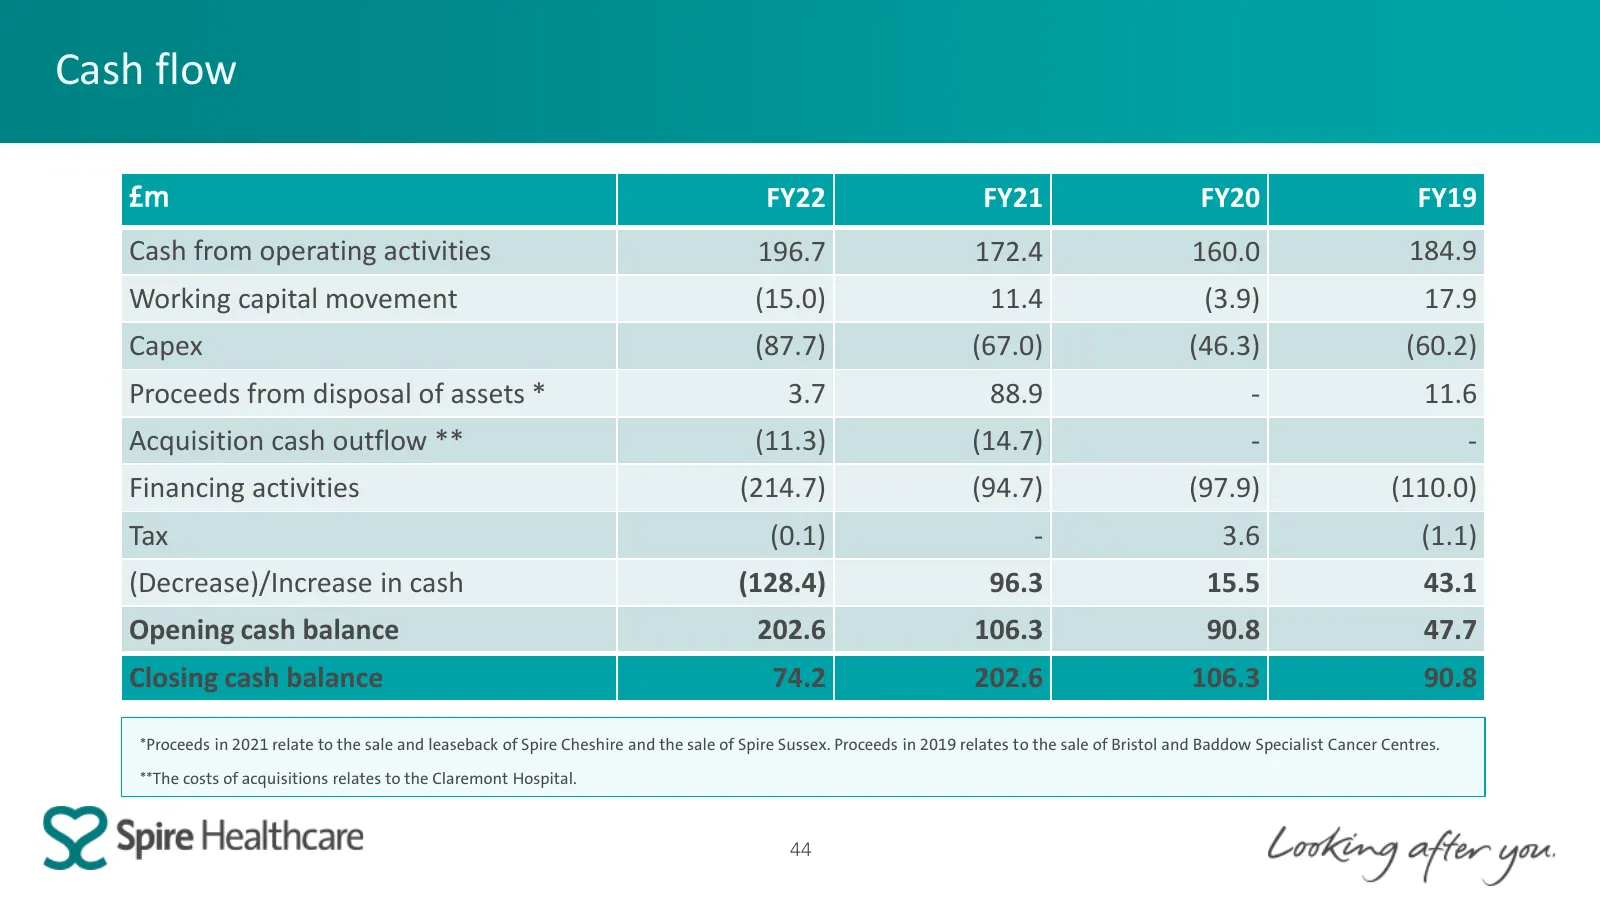
Slide 44: Cash flow
Cash flow £m FY22 FY21 FY20 FY19 Cash from operating activities 196.7 172.4 160.0 184.9 Working capital movement (15.0) 11.4 (3.9) 17.9 Capex (87.7) (67.0) (46.3) (60.2) Proceeds from disposal of assets * 3.7 88.9 - 11.6 Acquisition cash outflow ** (11.3) (14.7) - - Financing activities (214.7) (94.
Slide 45: Cash
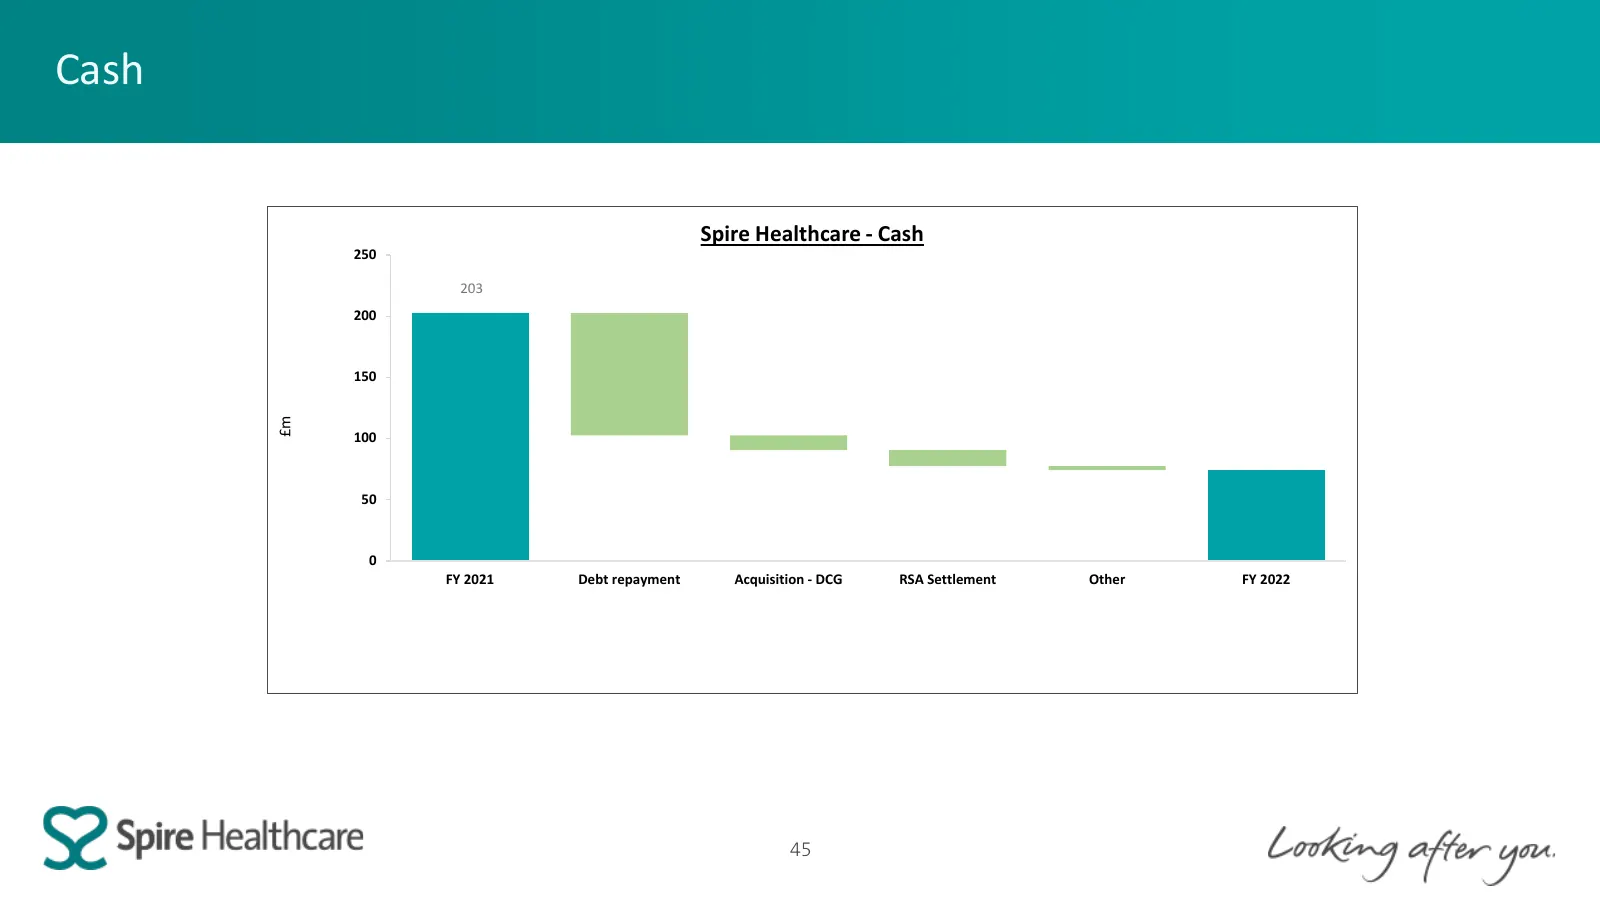
Cash Spire Healthcare - Cash 250 203 200 150 £m 100 50 0 FY 2021 Debt repayment Acquisition - DCG RSA Settlement Other FY 2022 45
Slide 46: Cash and borrowings
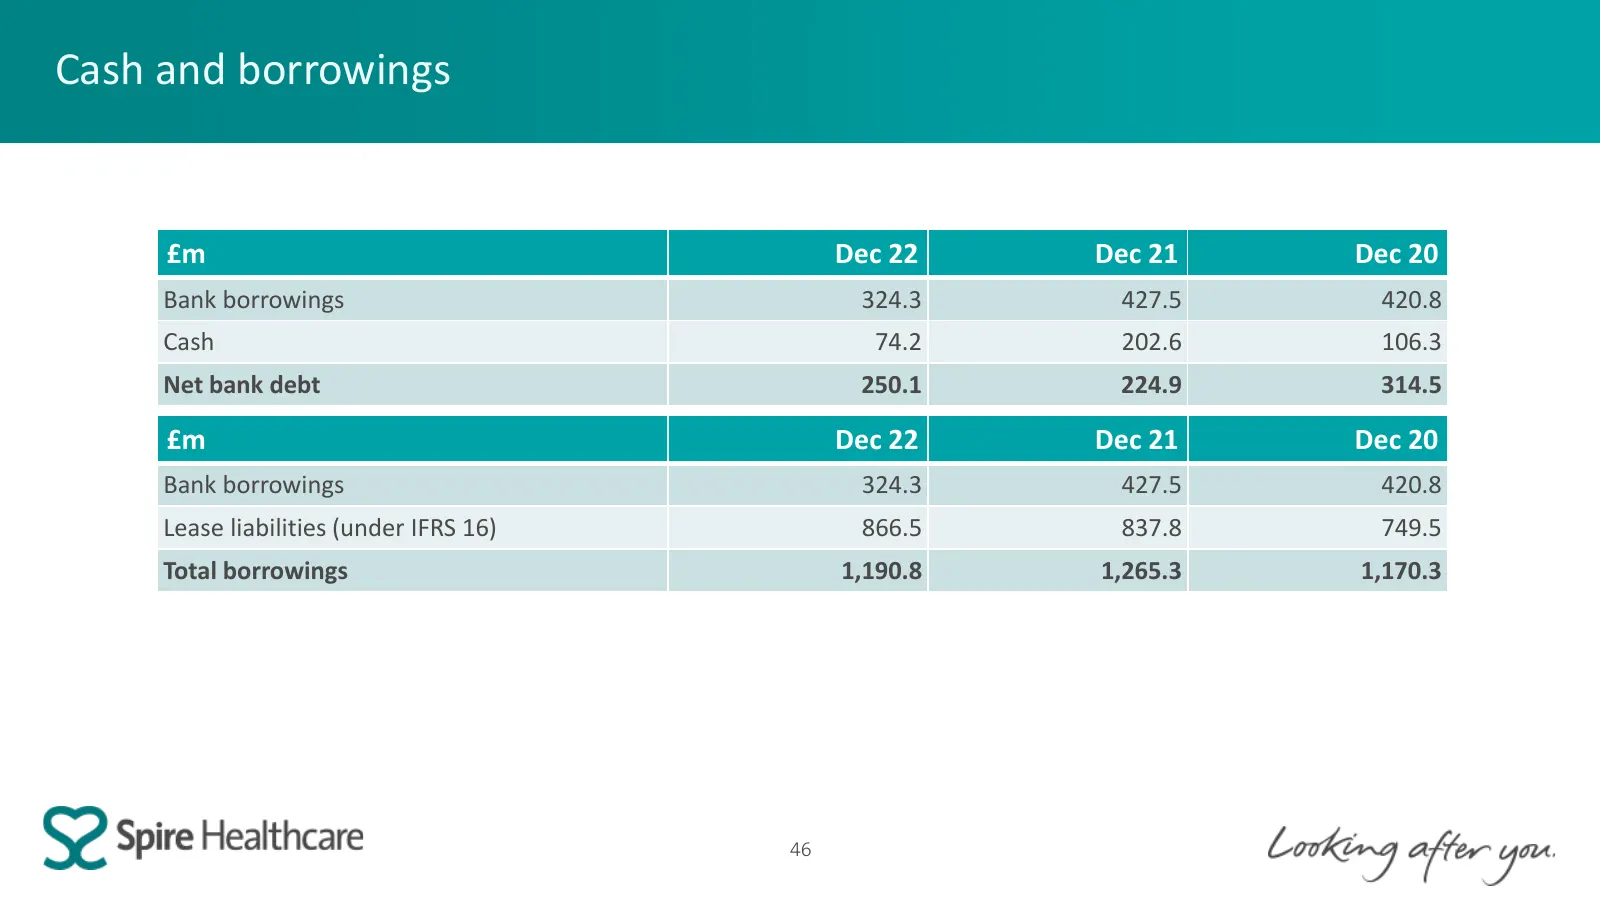
Cash and borrowings £m Dec 22 Dec 21 Dec 20 Bank borrowings 324.3 427.5 420.8 Cash 74.2 202.6 106.3 Net bank debt 250.1 224.9 314.5 £m Dec 22 Dec 21 Dec 20 Bank borrowings 324.3 427.5 420.8 Lease liabilities (under IFRS 16) 866.5 837.8 749.5 Total borrowings 1,190.8 1,265.3 1,170.3 46
Slide 47: Net bank debt and Total debt under IFRS16
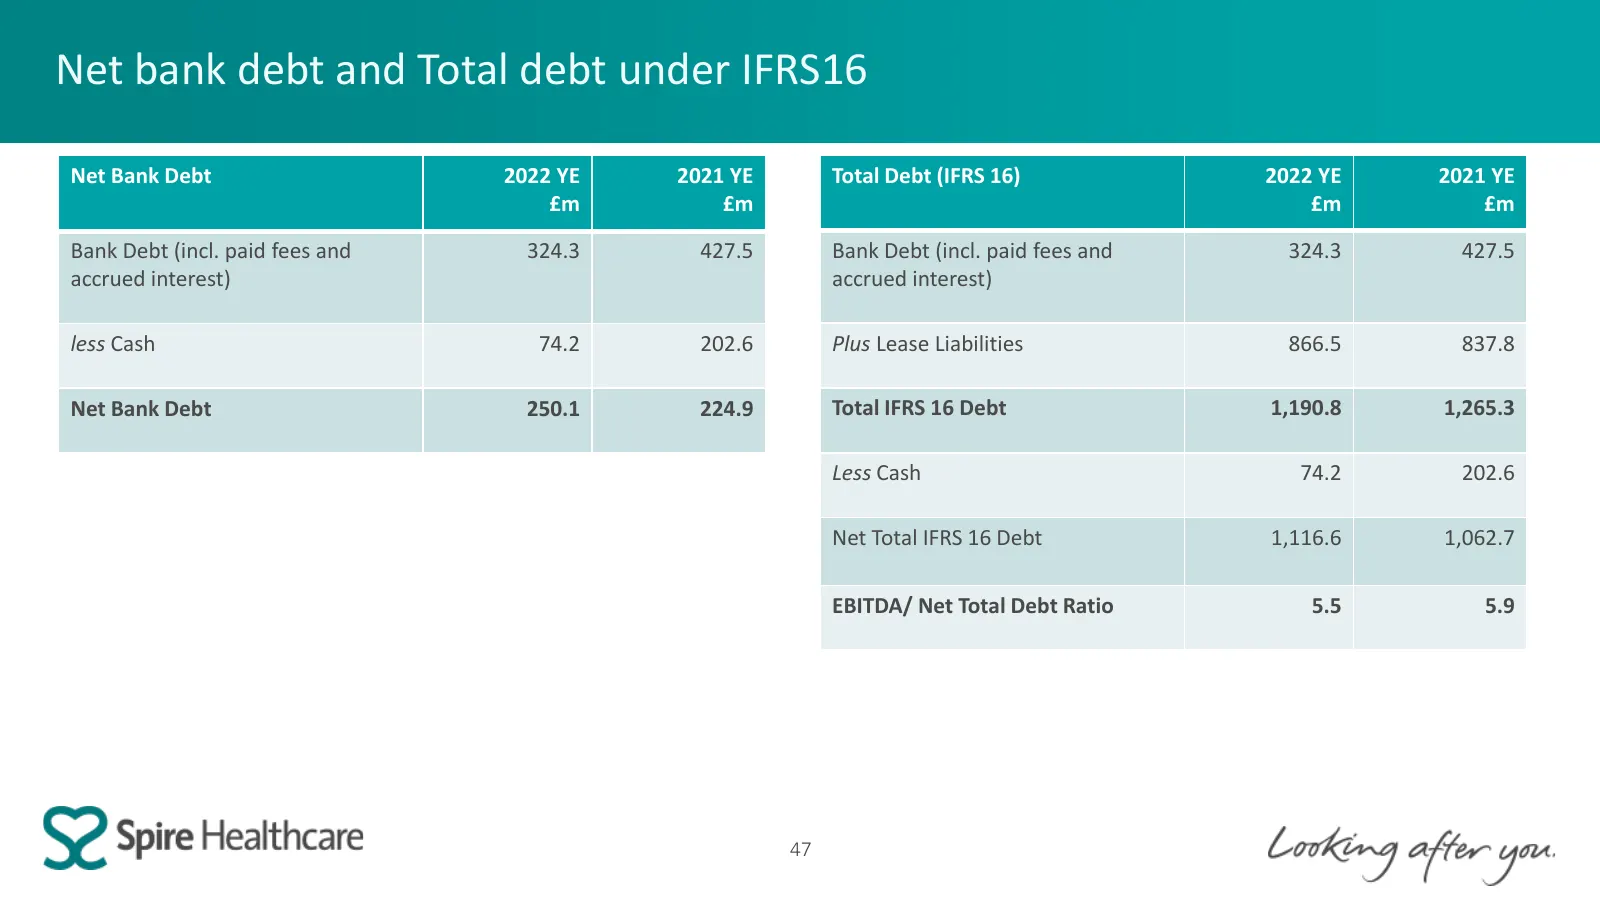
Net bank debt and Total debt under IFRS16 Net Bank Debt 2022 YE 2021 YE Total Debt (IFRS 16) 2022 YE 2021 YE £m £m £m £m Bank Debt (incl. paid fees and 324.3 427.5 Bank Debt (incl. paid fees and 324.3 427.5 accrued interest) accrued interest) less Cash 74.2 202.6 Plus Lease Liabilities 866.5 837.8 N
Slide 48: Continued exposure to COVID impact – last 12 months
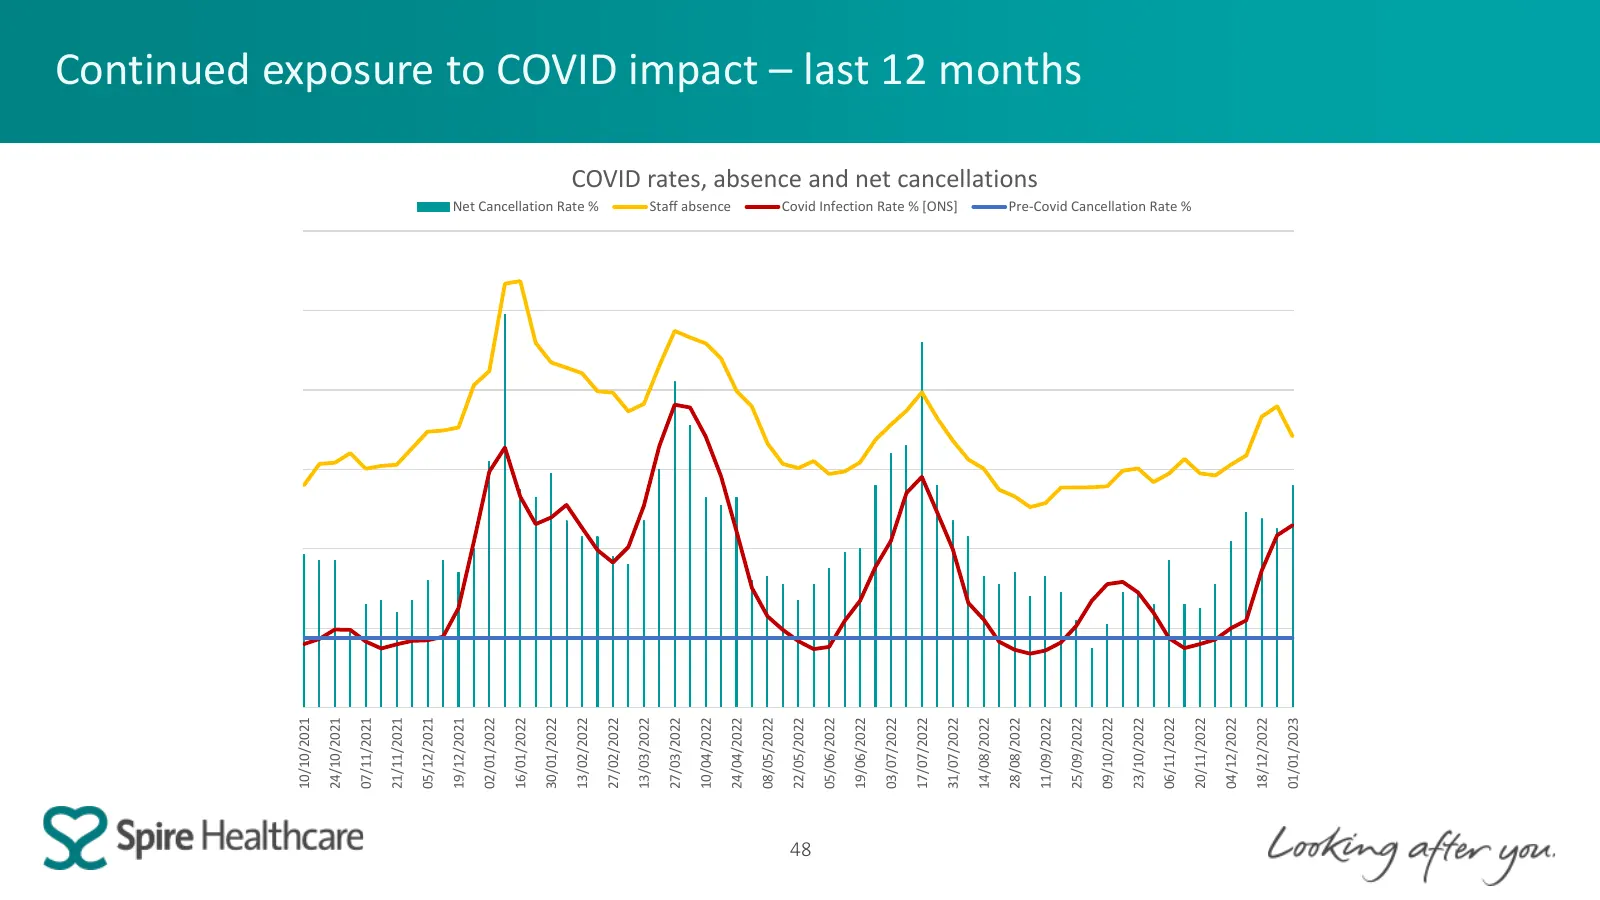
0 100 300 400 500 600 200 10/10/2021 24/10/2021 07/11/2021 21/11/2021 05/12/2021 19/12/2021 02/01/2022 16/01/2022 30/01/2022 13/02/2022 Net Cancellation Rate % 27/02/2022 13/03/2022 27/03/2022 10/04/2022 Staff absence 24/04/2022 08/05/2022 22/05/2022 48 05/06/2022 19/06/2022 03/07/2022 17/07/2022 Co
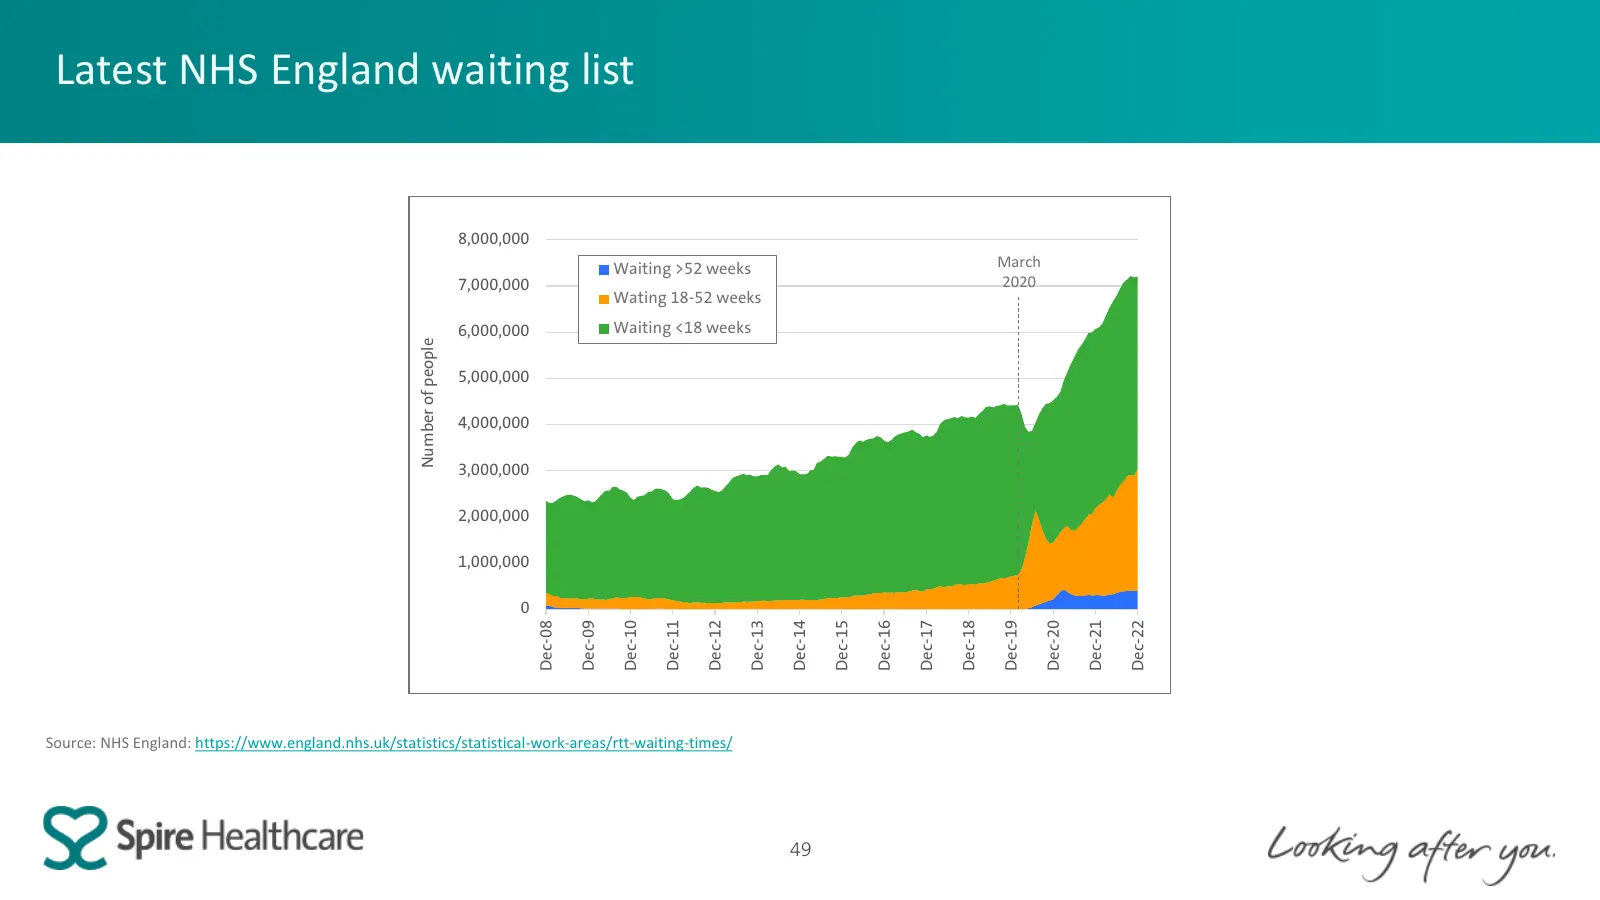
Slide 49: Latest NHS England waiting list
Latest NHS England waiting list 8,000,000 Waiting >52 weeks March 7,000,000 2020 Wating 18-52 weeks 6,000,000 Waiting <18 weeks Number of people 5,000,000 4,000,000 3,000,000 2,000,000 1,000,000 0 Dec-14 Dec-21 Dec-08 Dec-09 Dec-10 Dec-11 Dec-12 Dec-13 Dec-15 Dec-16 Dec-17 Dec-18 Dec-19 Dec-20 Dec-2
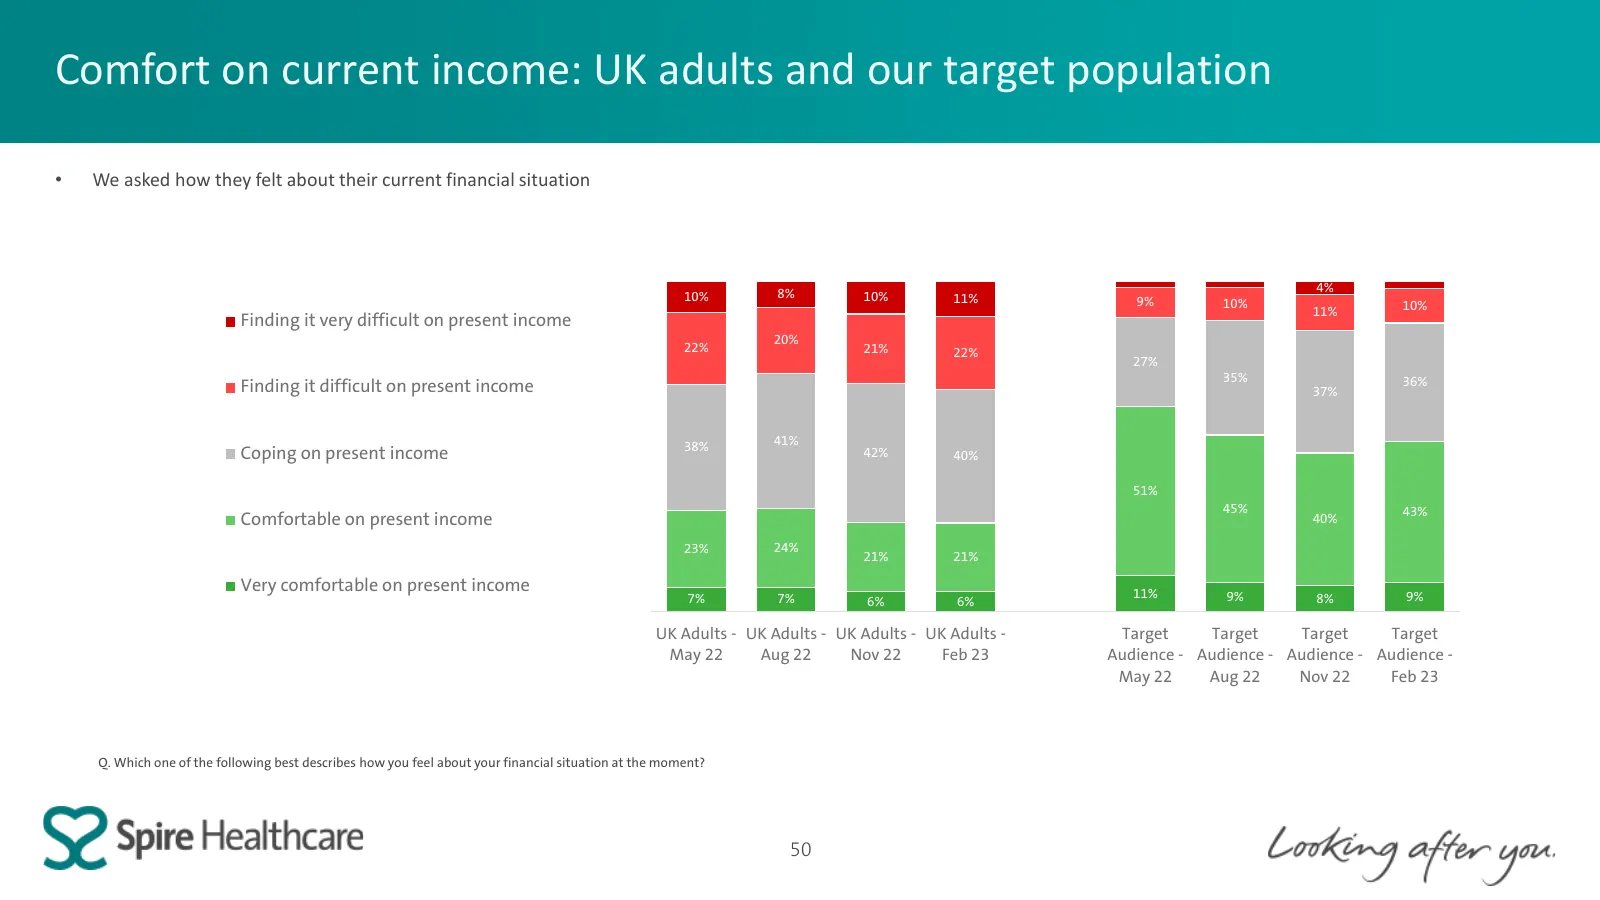
Slide 50: Comfort on current income: UK adults and our target population
Comfort on current income: UK adults and our target population • We asked how they felt about their current financial situation 8% 4% 10% 10% 11% 9% 10% 10% 11% Finding it very difficult on present income 20% 22% 21% 22% 27% 35% 36% Finding it difficult on present income 37% 38% 41% Coping on presen
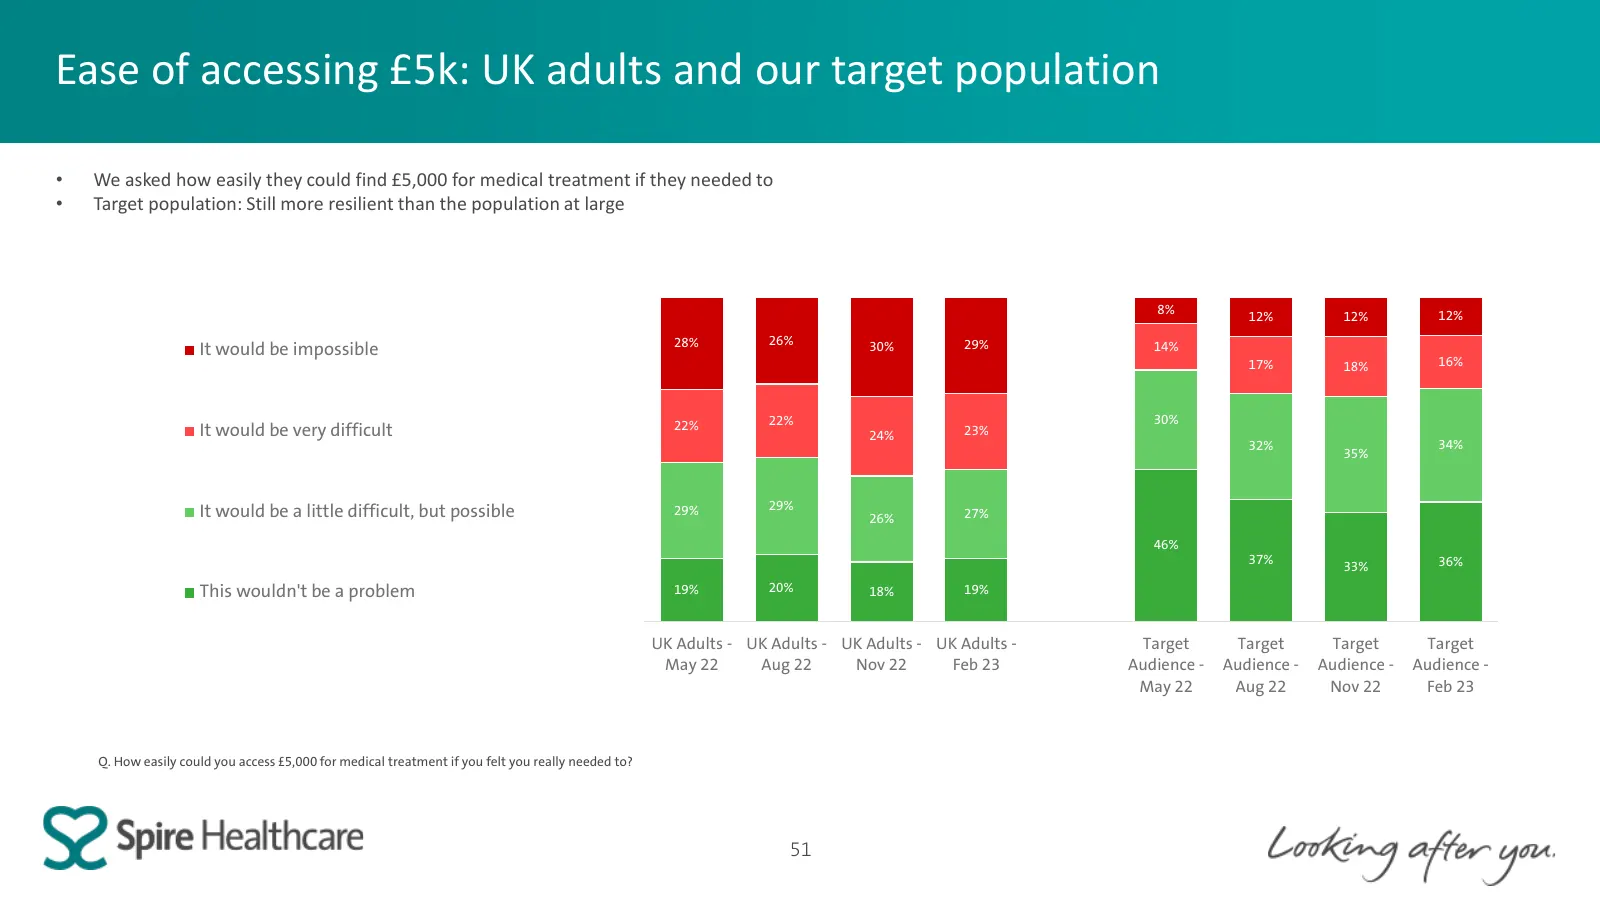
Slide 51: Ease of accessing £5k: UK adults and our target population
Ease of accessing £5k: UK adults and our target population • We asked how easily they could find £5,000 for medical treatment if they needed to • Target population: Still more resilient than the population at large 8% 12% 12% 12% 28% 26% 29% It would be impossible 30% 14% 17% 18% 16% 22% 22% 30% It
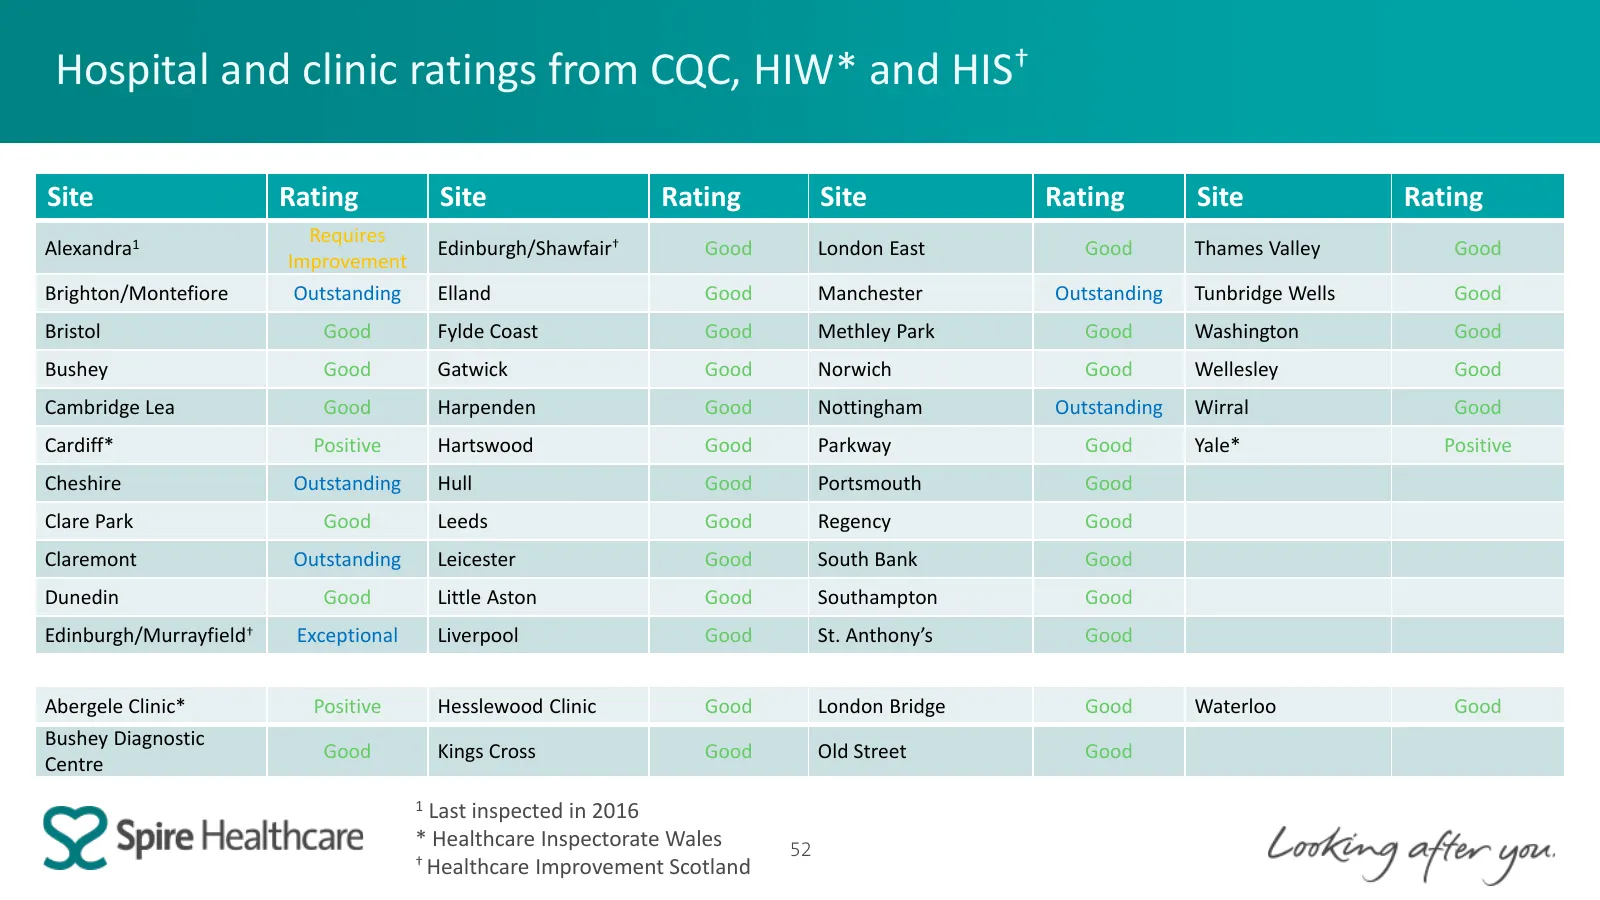
Slide 52: Hospital and clinic ratings from CQC, HIW and HIS
Hospital and clinic ratings from CQC, HIW* and HIS† Site Rating Site Rating Site Rating Site Rating Requires Alexandra1 Edinburgh/Shawfair† Good London East Good Thames Valley Good Improvement Brighton/Montefiore Outstanding Elland Good Manchester Outstanding Tunbridge Wells Good Bristol Good Fylde
Source: Internet Archive copy of investors.spirehealthcare.com
More decks from Spire Healthcare Group PLC
 FY2025 Earnings Presentation37 slides · Mar 5, 2026
 H1 2025 Earnings Presentation39 slides · Jul 31, 2025
 Investor Presentation (June 2025)34 slides · June 2025
 FY2024 Earnings Presentation36 slides · Mar 6, 2025
 dbAccess UK & Ireland Conference 202512 slides · Jan 21, 2025
 H1 2024 Earnings Presentation42 slides · Sep 12, 2024