American National Bankshares Inc
American National Bankshares — Investor Presentation (August 2011)
31 slides from American National Bankshares's investor presentation, Aug 3, 2011

Slide 1: Exceeding Your Expectations
Exceeding Your Expectations Since 1909 NASDAQ Global Select: AMNB
Slide 2: Forward-Looking Statements
Forward-Looking Statements Certain statements in this presentation may constitute “forward-looking statements” within the meaning of the Private Securities Litigation Reform Act of 1995. Forward-looking statements are statements that include projections, predictions, expectations or beliefs about fu
Slide 3: The American National Trilogy
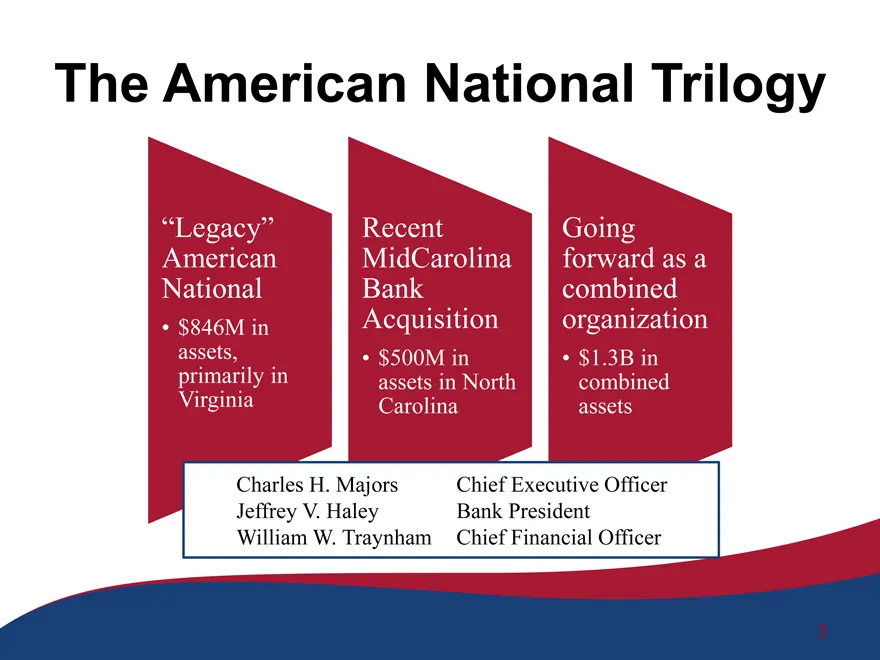
The American National Trilogy “Legacy” American National •$846M in assets, primarily in Virginia Recent MidCarolina Bank Acquisition •$500M in assets in North Carolina Going forward as a combined organization •$1.3B in combined assets Charles H. Majors Chief Executive Officer Jeffrey V. Haley Bank P
Slide 4: American National Profile
American National Profile American National Bankshares Inc. American National Bank & Trust Co. Retail, Mortgage, and Commercial Banking Services Trust and Investment Services Virginia Title Center (partial owner) Bankers Insurance (partial owner)
Slide 5: Vision
Vision We will enhance the value of our shareholders’ investment by being our communities’ preferred provider of relationship-based financial services. Mission We provide quality financial services with exceptional customer service.
Slide 6: Our Focus
Our Focus Superior financial performance Quality customer relationships Culture conducive to doing business Efficient management information systems Commitment to the communities we serve Focus on compliance, credit and risk management
Slide 7: AMNB Heritage
AMNB Heritage Over the past 102 years, American National has become the dominant community bank in our markets Management has an exceptional track record –Maintaining high credit quality and a strong capital base through numerous economic cycles –High historical profitability through operational eff
Slide 8: American National Legacy Markets banking offices
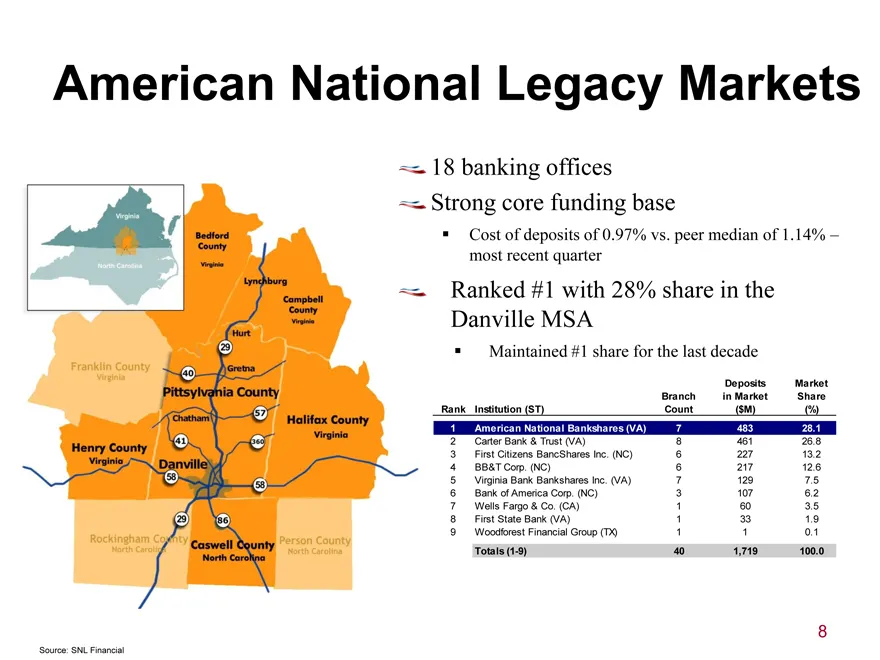
American National Legacy Markets 18 banking offices Strong core funding base Cost of deposits of 0.97% vs. peer median of 1.14% – most recent quarter Ranked #1 with 28% share in the Danville MSA Maintained #1 share for the last decade Rank Institution (ST) Branch Count Deposits in Market ($M) Market
Slide 9: Diverse Revenue Stream
Diverse Revenue Stream Interest Income Non-interest Income Fees Trust and Investment Services Brokerage Secondary Mortgage Title Insurance Bankers’ Insurance
Slide 10: Trust and Investment Services
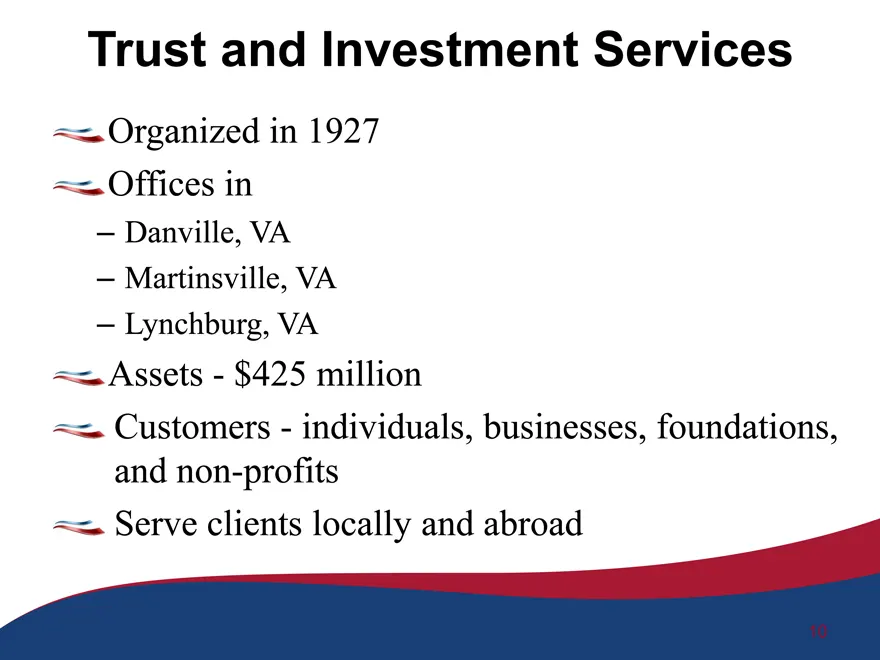
Trust and Investment Services Organized in 1927 Offices in –Danville, VA –Martinsville, VA –Lynchburg, VA Assets—$425 million Customers—individuals, businesses, foundations, and non-profits Serve clients locally and abroad
Slide 11: Trust and Investment Services
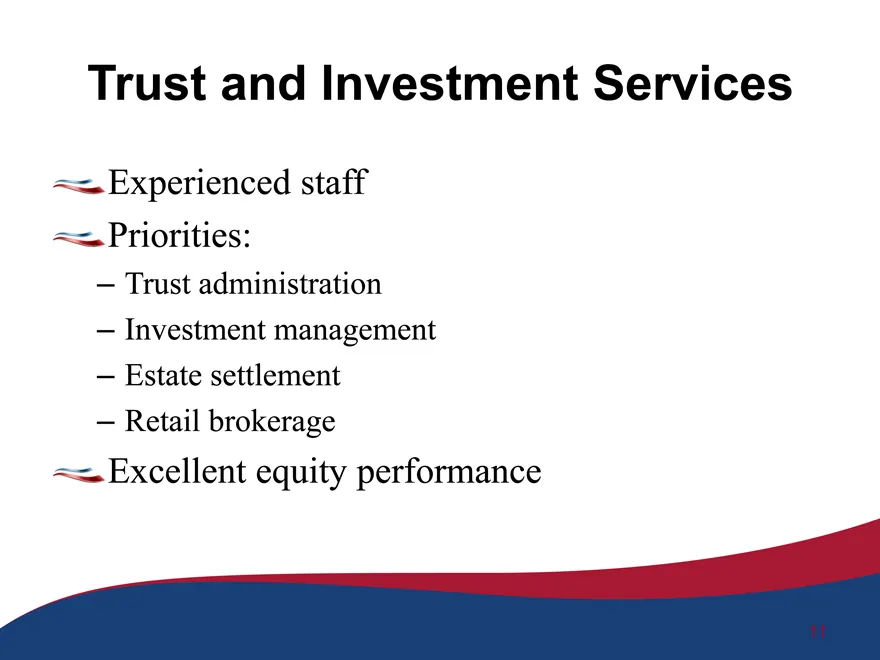
Trust and Investment Services Experienced staff Priorities: –Trust administration –Investment management –Estate settlement –Retail brokerage Excellent equity performance
Slide 12: Asset Quality
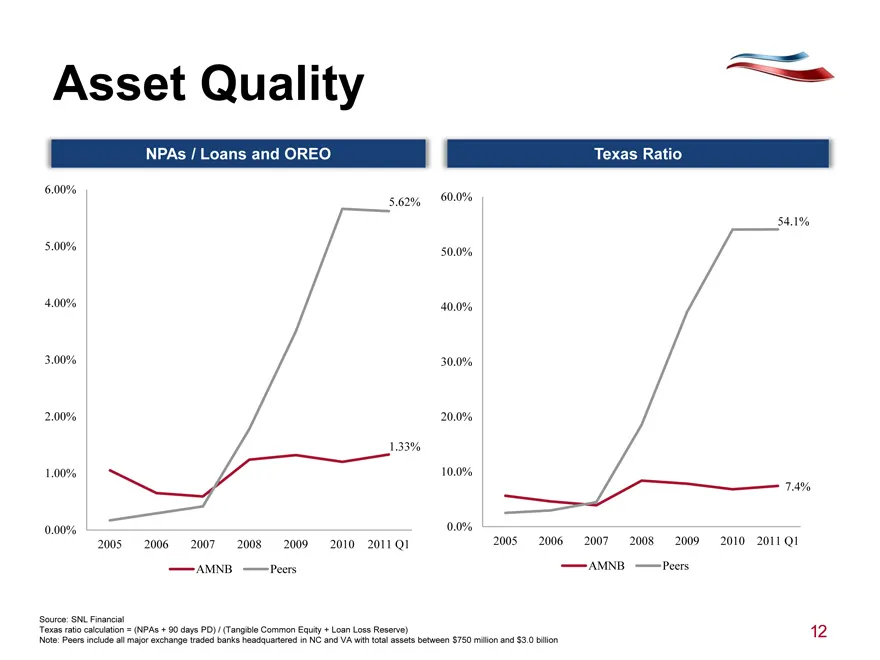
Asset Quality NPAs / Loans and OREO Texas Ratio 6.00% 5.00% 4.00% 3.00% 2.00% 1.00% 0.00% 2006 2007 2008 2009 2010 2011 Q1 AMNB Peers 5.62% 1.33% 60.0% 50.0% 40.0% 30.0% 20.0% 10.0% 0.0% 2005 2006 2007 2008 2009 2010 2011 Q1 AMNB Peers 54.1% 7.4% Source: SNL Financial Texas ratio calculation = (NPAs
Slide 13: Historical Profitability
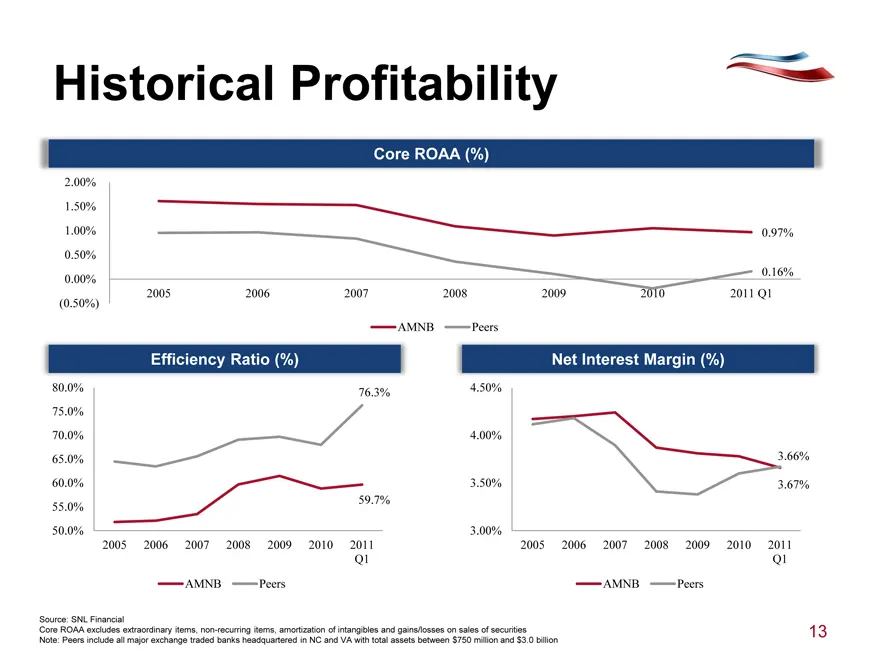
Historical Profitability Core ROAA (%) 2.00% 1.50% 1.00% 0.50% 0.00% (0.50%) 2005 2006 2007 2008 2009 2010 2011 Q1 0.97% 0.16% AMNB Peers Efficiency Ratio (%) 80.0% 75.0% 70.0% 65.0% 60.0% 55.0% 50.0% 2005 2006 2007 2008 2009 2010 2011 76.3% 59.7% AMNB Peers Net Interest Margin (%) 4.50% 4.00% 3.50%
Slide 14: Strong Capital Base
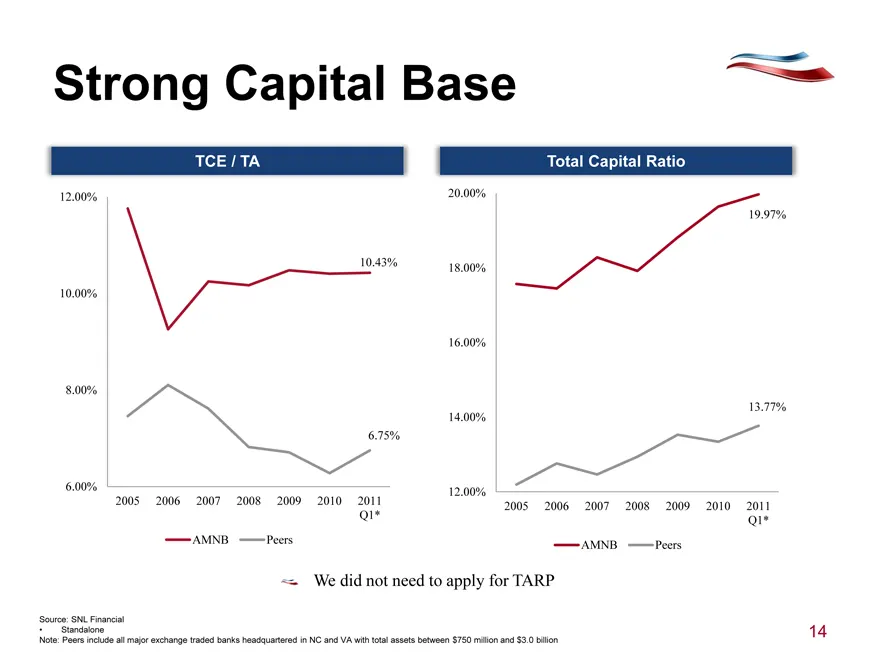
Strong Capital Base TCE / TA 12.00% 10.00% 8.00% 6.00% 10.43% 6.75% 2005 2006 2007 2008 2009 2010 2011 Q1* AMNB Peers Total Capital Ratio 20.00% 18.00% 16.00% 14.00% 12.00% 19.97% 13.77% 2005 2006 2007 2008 2009 2010 2011 Q1* AMNB Peers We did not need to apply for TARP Source: SNL Financial • Stand
Slide 15: Dividends
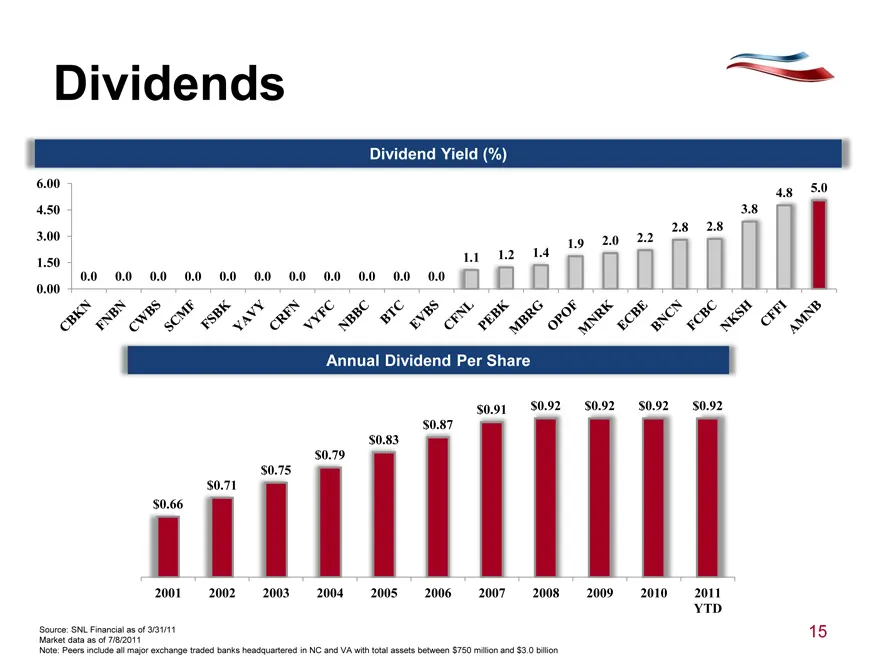
Dividends Dividend Yield (%) 6.00 4.50 3.00 1.50 0.00 0.0 0.0 0.0 0.0 0.0 0.0 0.0 0.0 0.0 0.0 1.1 1.2 1.4 1.9 2.0 2.2 2.8 2.8 3.8 4.8 5.0 CBKN FNBN CWBS SCMF FSBK YAVY CRFN VYFC NBBC BTC EVBS CFNL PEBK MBRG OPOF MNRK ECBE BNCN FCBC BNCN FCBC NKSH CFFI AMNB Annual Dividend Per Share $0.66 $0.71 $0.75
Slide 16: Total Return Performance
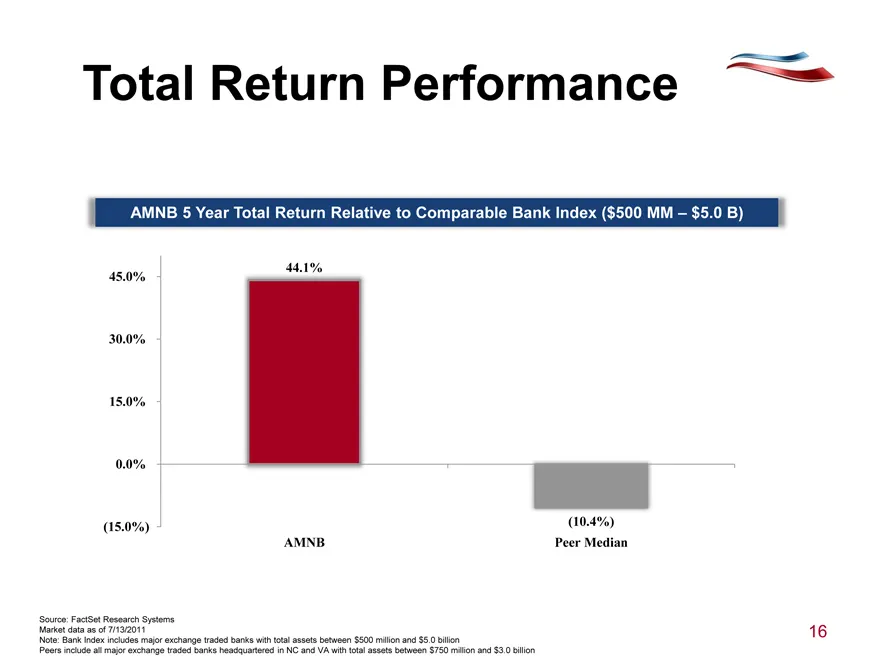
Total Return Performance AMNB 5 Year Total Return Relative to Comparable Bank Index ($500 MM – $5.0 B) 45.0% 30.0% 15.0% 0.0% (15.0%) 44.1% AMNB (10.4%) Peer Median Source: FactSet Research Systems Market data as of 7/13/2011 Note: Bank Index includes major exchange traded banks with total assets be
Slide 17: MidCarolina
MIDCAROLINA ca — Nat
Slide 18: Identified the need for scale and growth in the current environment
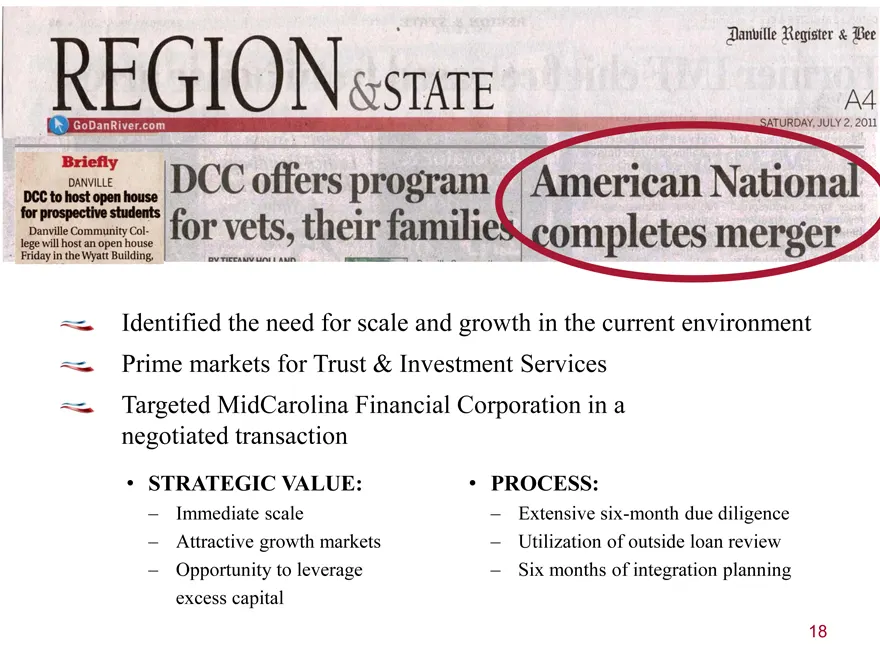
Identified the need for scale and growth in the current environment Prime markets for Trust & Investment Services Targeted MidCarolina Financial Corporation in a negotiated transaction •STRATEGIC VALUE: – Immediate scale – Attractive growth markets – Opportunity to leverage excess capital •PROCESS:
Slide 19: Acquisition of MidCarolina: Completed July 1, 2011
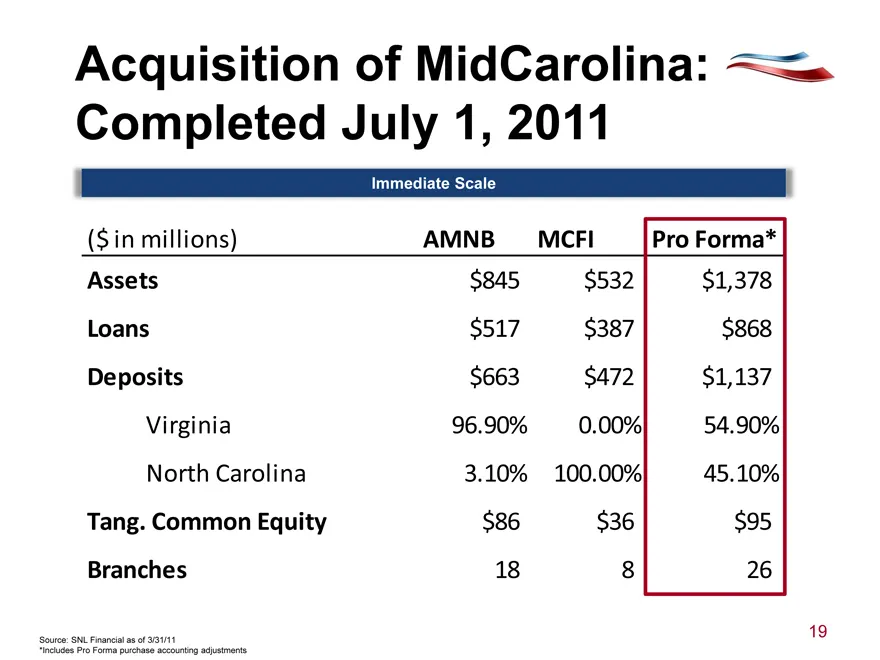
Acquisition of MidCarolina: Completed July 1, 2011 Immediate Scale ($ in millions) AMNB MCFI Pro Forma* Assets $845 $532 $1,378 Loans $517 $387 $868 Deposits $663 $472 $1,137 Virginia 96.90% 0.00% 54.90% North Carolina 3.10% 100.00% 45.10% Tang. Common Equity $86 $36 $95 Branches 18 8 26 Source: SNL
Slide 20: Core Markets of Operation
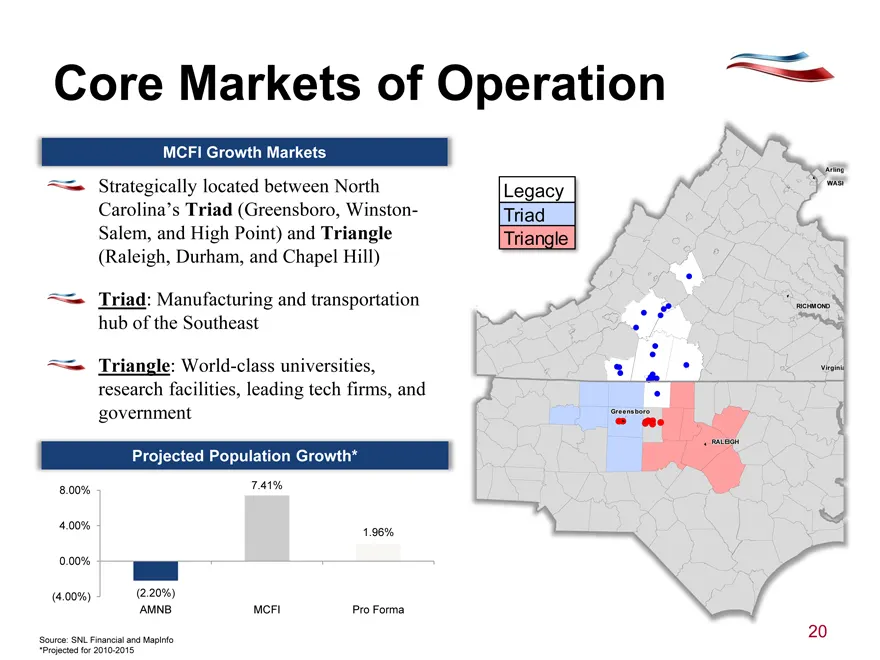
Core Markets of Operation MCFI Growth Markets Strategically located between North Carolina’s Triad (Greensboro, Winston-Salem, and High Point) and Triangle (Raleigh, Durham, and Chapel Hill) Triad: Manufacturing and transportation hub of the Southeast Triangle: World-class universities, research fac
Slide 21: Loan Portfolio
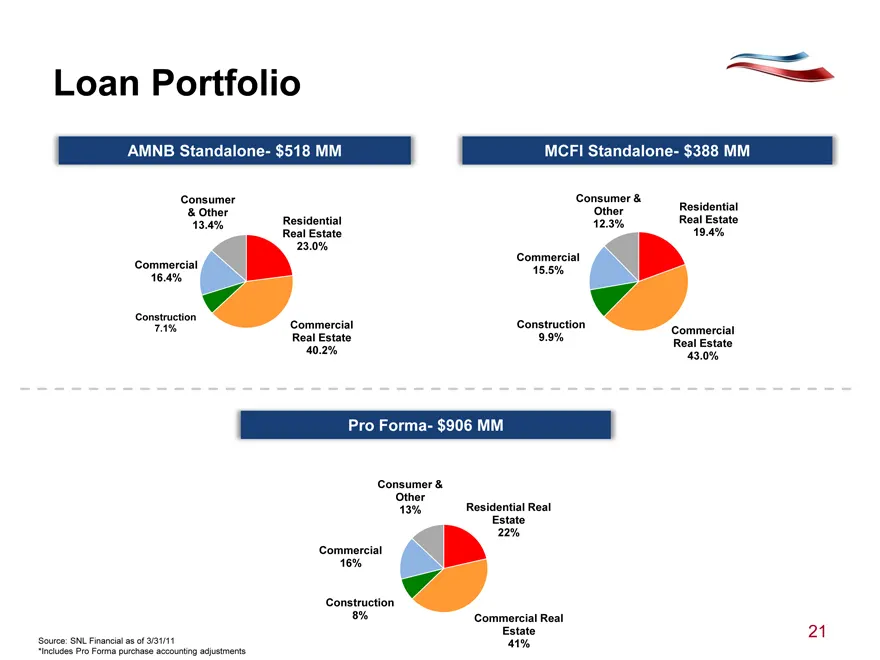
Loan Portfolio AMNB Standalone- $518 MM Consumer & Other 13.4% Residential Real Estate 23.0% Commercial Real Estate 40.2% Construction 7.1% Commercial 16.4% MCFI Standalone- $388 MM Consumer & Other 12.3% Residential Real Estate 19.4% Commercial Real Estate 43.0% Construction 9.9% Commercial 15.5% P
Slide 22: Deposit Portfolio
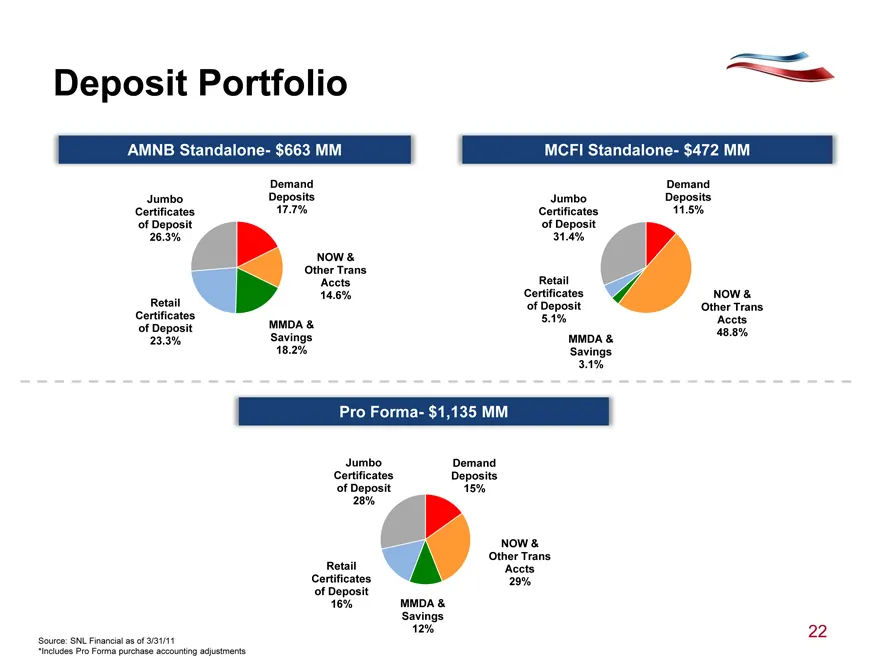
Deposit Portfolio AMNB Standalone- $663 MM Demand Deposits 17.7% NOW & Other Trans Accts 14.6% MMDA & Savings 18.2% Retail Certificates of Deposit 23.3% Jumbo Certificates of Deposit 26.3% MCFI Standalone- $472 MM Demand Deposits 11.5% NOW & Other Trans Accts 48.8% MMDA & Savings 3.1% Retail Certifi
Slide 23: American National
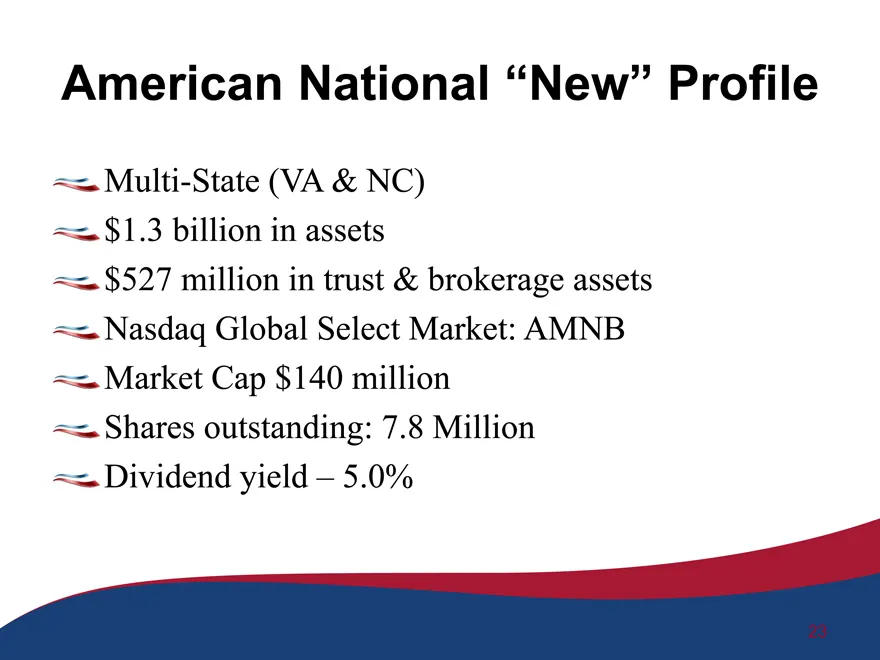
American National Multi-State (VA & NC) $1.3 billion in assets $527 million in trust & brokerage assets Nasdaq Global Select Market: AMNB Market Cap $140 million Shares outstanding: 7.8 Million Dividend yield – 5.0%
Slide 24: Pro Forma Capital Position
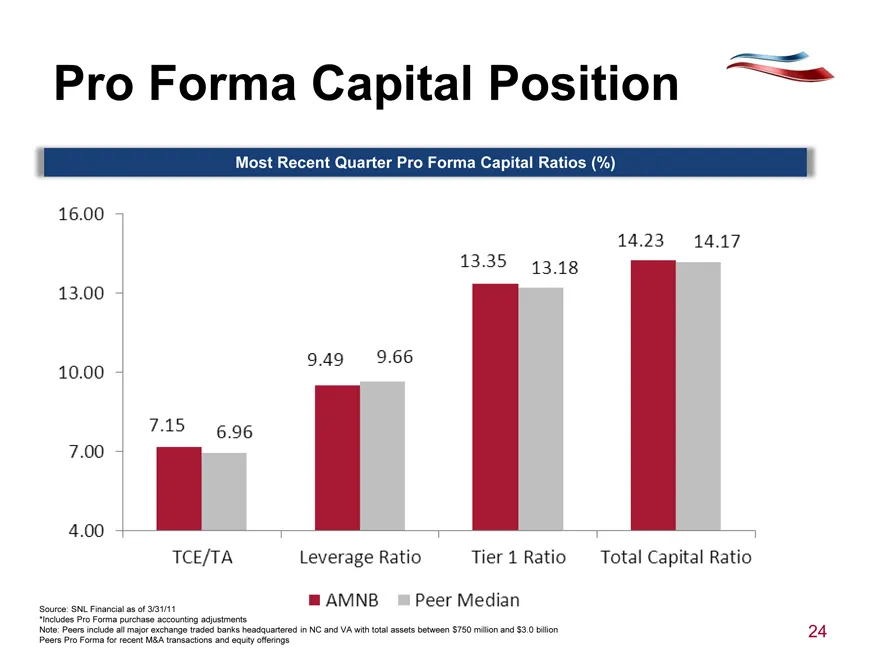
Pro Forma Capital Position Most Recent Quarter Pro Forma Capital Ratios (%) 16.00 13.00 10.00 7.00 4.00 7.15 6.96 9.49 9.66 13.35 13.18 14.23 14.17 TCE/TA Leverage Ratio Tier 1 Ratio Total Capital Ratio AMNB Peer Median Source: SNL Financial as of 3/31/11 *Includes Pro Forma purchase accounting adju
Slide 25: Post-merger Projections
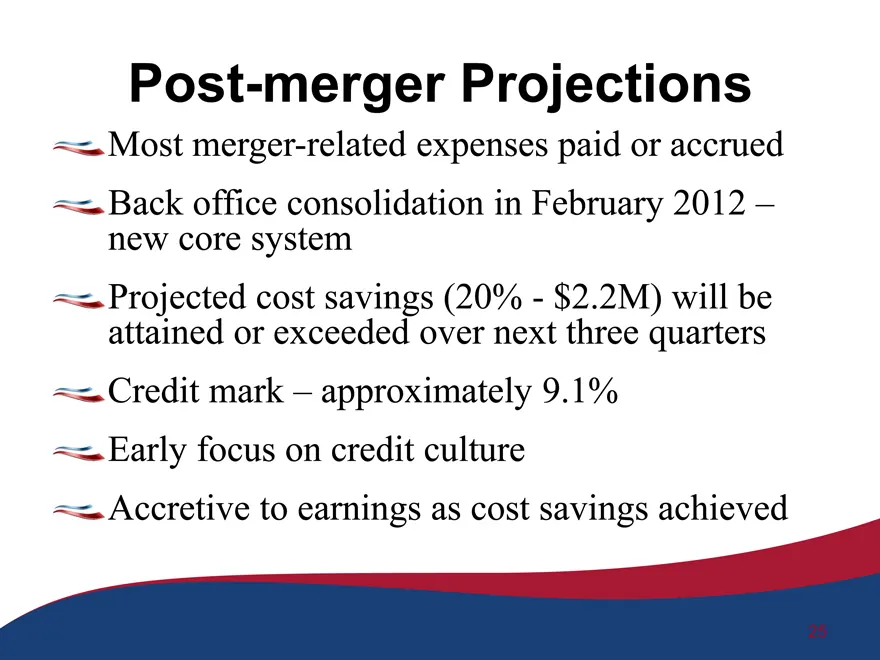
Post-merger Projections Most merger-related expenses paid or accrued Back office consolidation in February 2012 – new core system Projected cost savings (20%—$2.2M) will be attained or exceeded over next three quarters Credit mark – approximately 9.1% Early focus on credit culture Accretive to earni
Slide 26: Future Focus
Future Focus Superior returns to shareholders Strong financial performance Disciplined focus on capital and risk management Commitment to legacy markets while pursuing growth opportunities.
Slide 27: Seasoned Management
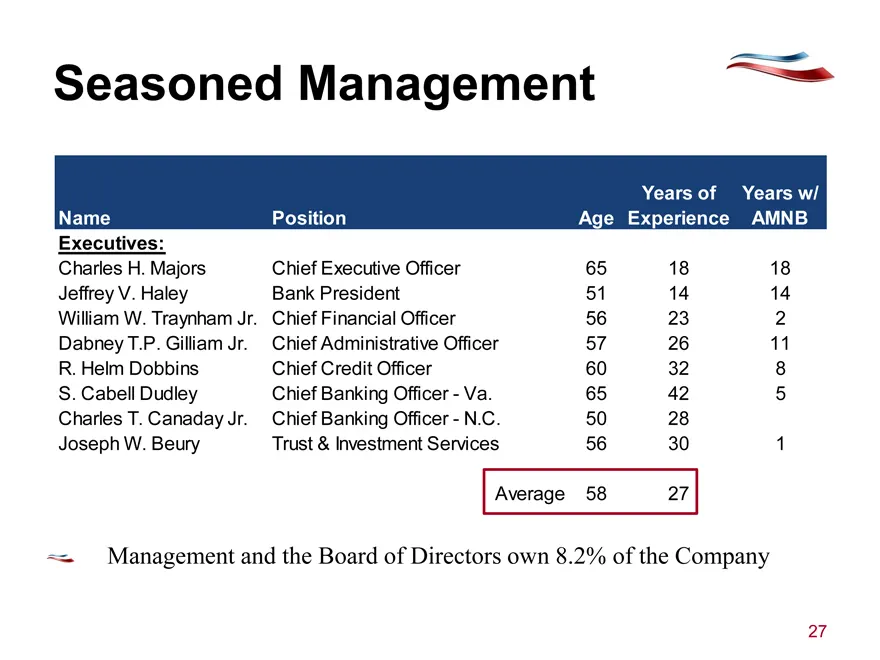
Seasoned Management Name Position Age Years of Experience Years w/AMNB Executives: Charles H. Majors Chief Executive Officer 65 18 18 Jeffrey V. Haley Bank President 51 14 14 William W. Traynham Jr. Chief Financial Officer 56 23 2 Dabney T.P. Gilliam Jr. Chief Administrative Officer 57 26 11 R. Helm
Slide 28: Opportunistic Acquisition Strategy
Opportunistic Acquisition Strategy Focused on growth markets in North Carolina and Virginia Characteristics of targets will be: • $250M-$1B size • EPS accretion • Easy assimilation • Maintenance of • Manageable credit strong capital levels issues • Identifiable synergies • Compatible cultures for sa
Slide 29: North Carolina & Virginia Market Opportunities
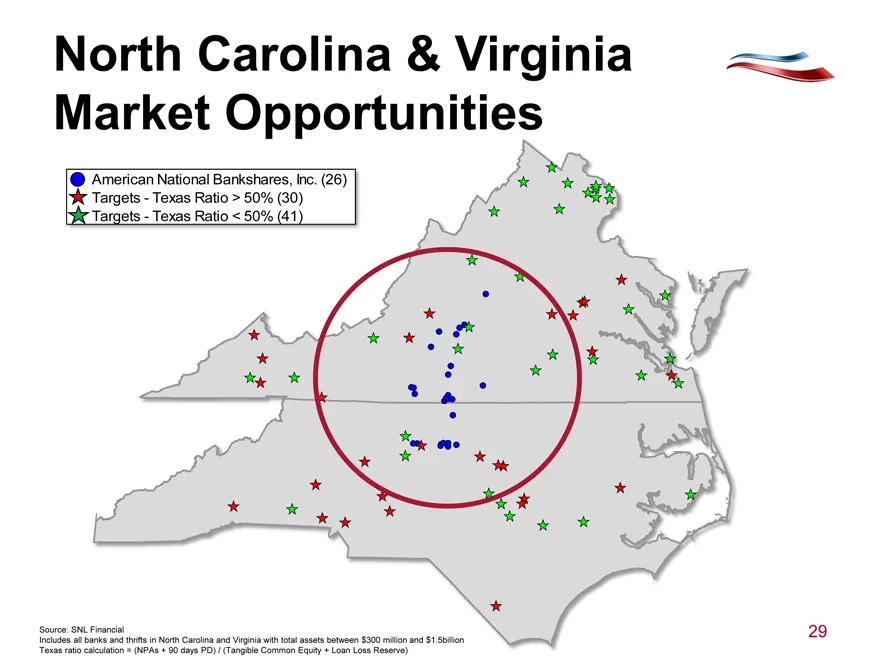
North Carolina & Virginia Market Opportunities American National Bankshares, Inc. (26) Targets—Texas Ratio > 50% (30) Targets—Texas Ratio < 50% (41) Source: SNL Financial Includes all banks and thrifts in North Carolina and Virginia with total assets between $300 million and $1.5billion Texas ratio
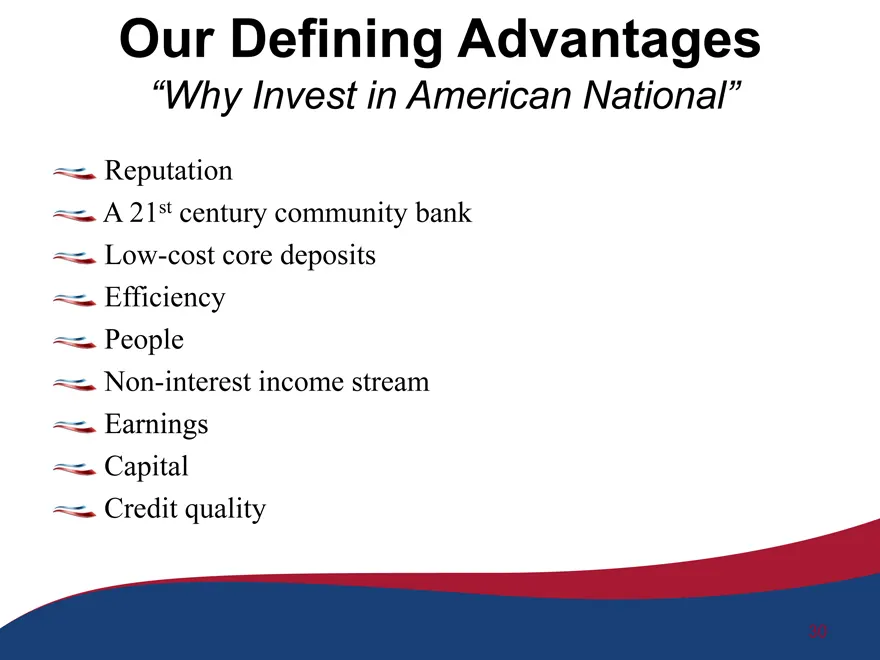
Slide 30: Our Defining Advantages
Our Defining Advantages “Why Invest in American National” Reputation A 21st century community bank Low-cost core deposits Efficiency People Non-interest income stream Earnings Capital Credit quality

Slide 31
Source: SEC EDGAR · 8-K filed Aug 3, 2011
More decks from American National Bankshares Inc
 Investor Presentation (July 2022)32 slides · Jul 27, 2022
 Investor Presentation (June 2022)32 slides · Jun 14, 2022
 Investor Presentation (May 2021)34 slides · May 28, 2021
 Investor Presentation (July 2019)47 slides · Jul 29, 2019
 Investor Presentation (July 2019)47 slides · Jul 8, 2019
 Investor Presentation (March 2019)42 slides · Mar 25, 2019