Symrise AG · XETR:SY1
Symrise — H1 2022 Earnings Presentation
23 slides from Symrise's earnings presentation, Aug 2, 2022
Slide 1: Results for the First half year 2022
Results for the First half year 2022 — Dr. Heinz-Jürgen Bertram (CEO), Olaf Klinger (CFO) 2 August 2022
Slide 2: Agenda
Agenda Overview — 01 01 02 03 03 H1 2022 at a Glance 4 Financials Strategic Initiatives / H1Financials 2022 11 Strategic Initiatives / Outlook 21 H1 2022 11 Outlook 21 2
Slide 3: H1 2022 at a Glance
01 H1 2022 at a Glance 1 2021 at a Glance 33
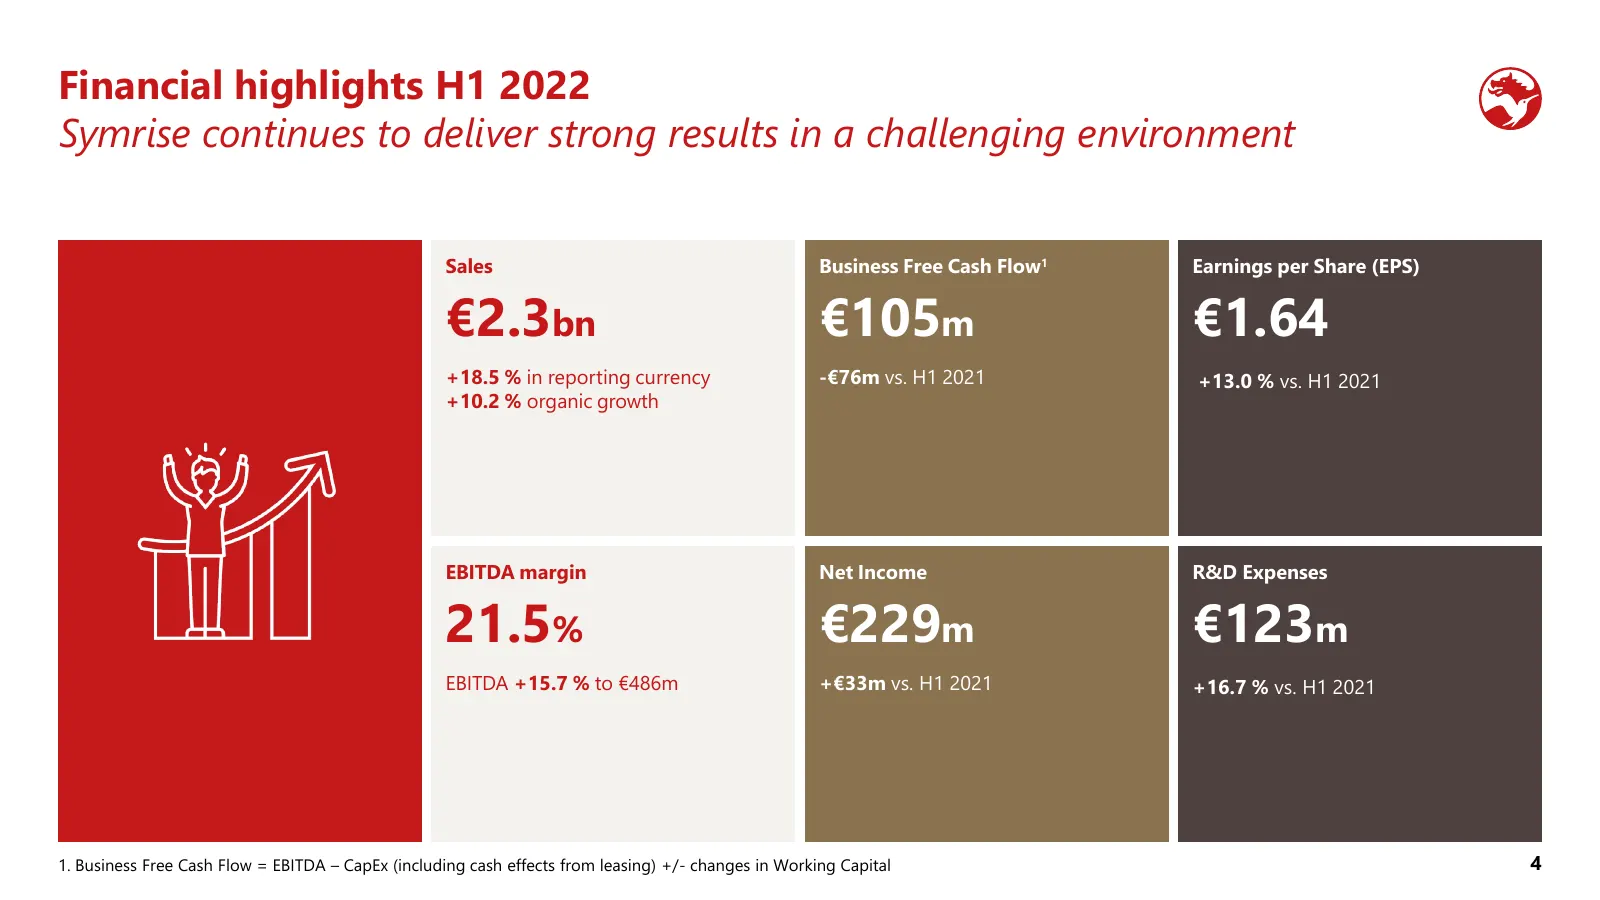
Slide 4: Financial highlights H1 2022
Financial highlights H1 2022 Symrise continues to deliver strong results in a challenging environment — Sales Business Free Cash Flow1 Earnings per Share (EPS) €2.3bn €105m €1.64 +18.5 % in reporting currency -€76m vs. H1 2021 +13.0 % vs. H1 2021 +10.2 % organic growth EBITDA margin Net Income R&D E
Slide 5: Sales H1 2022
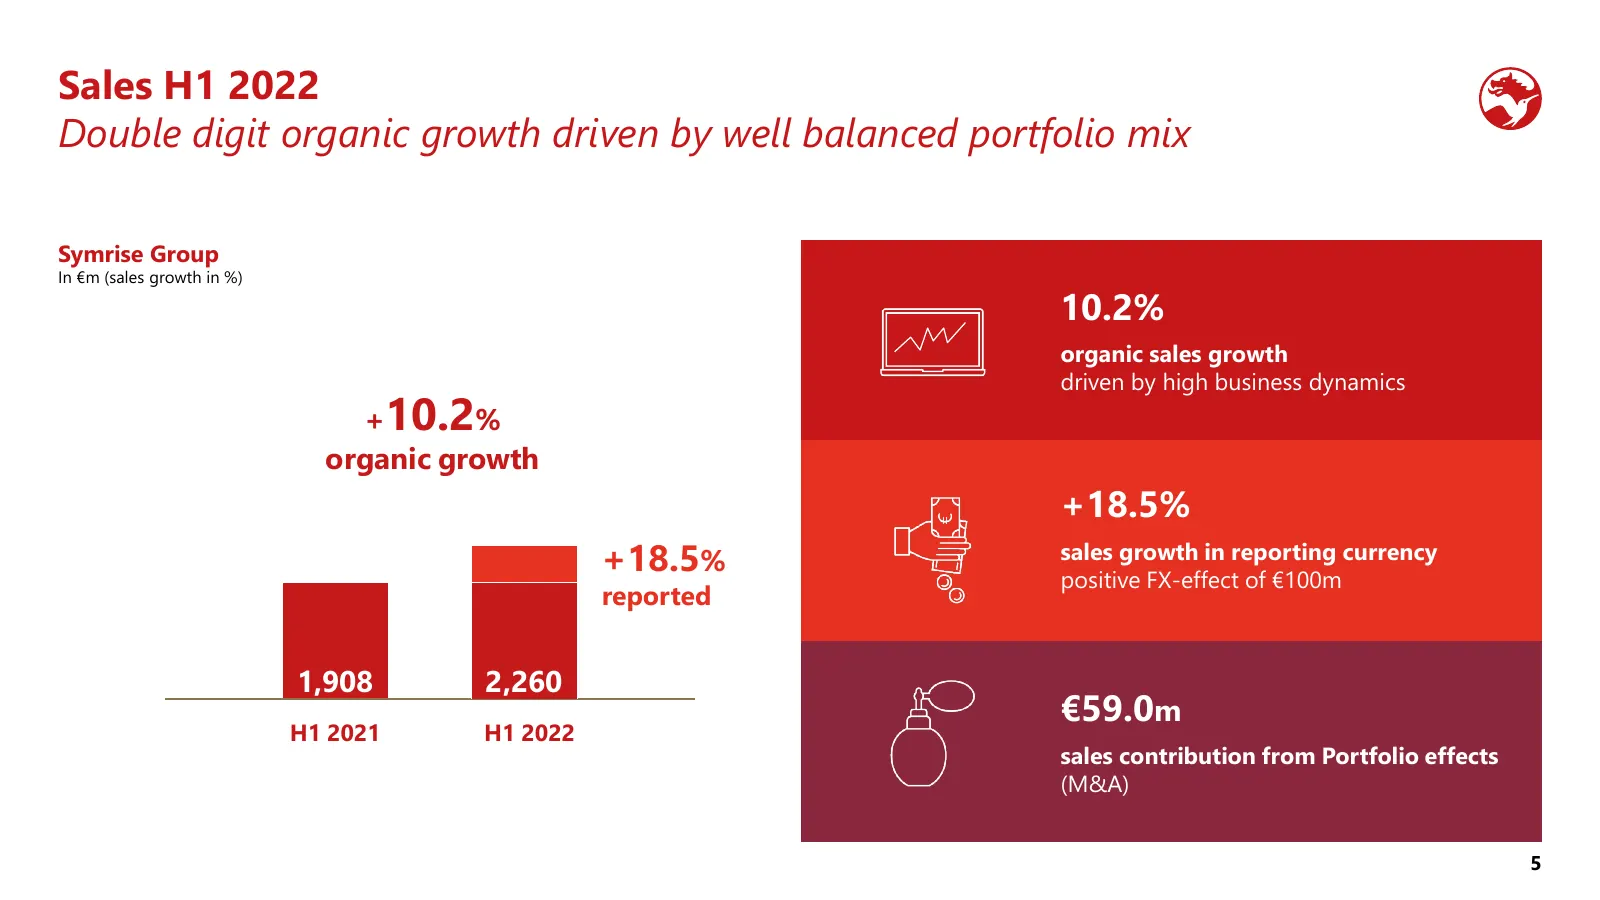
Sales H1 2022 Double digit organic growth driven by well balanced portfolio mix — Symrise Group In €m (sales growth in %) 10.2% organic sales growth driven by high business dynamics +10.2% organic growth +18.5% +18.5% sales growth in reporting currency positive FX-effect of €100m reported 1,908 2,26
Slide 6: Sales by segment H1 2022
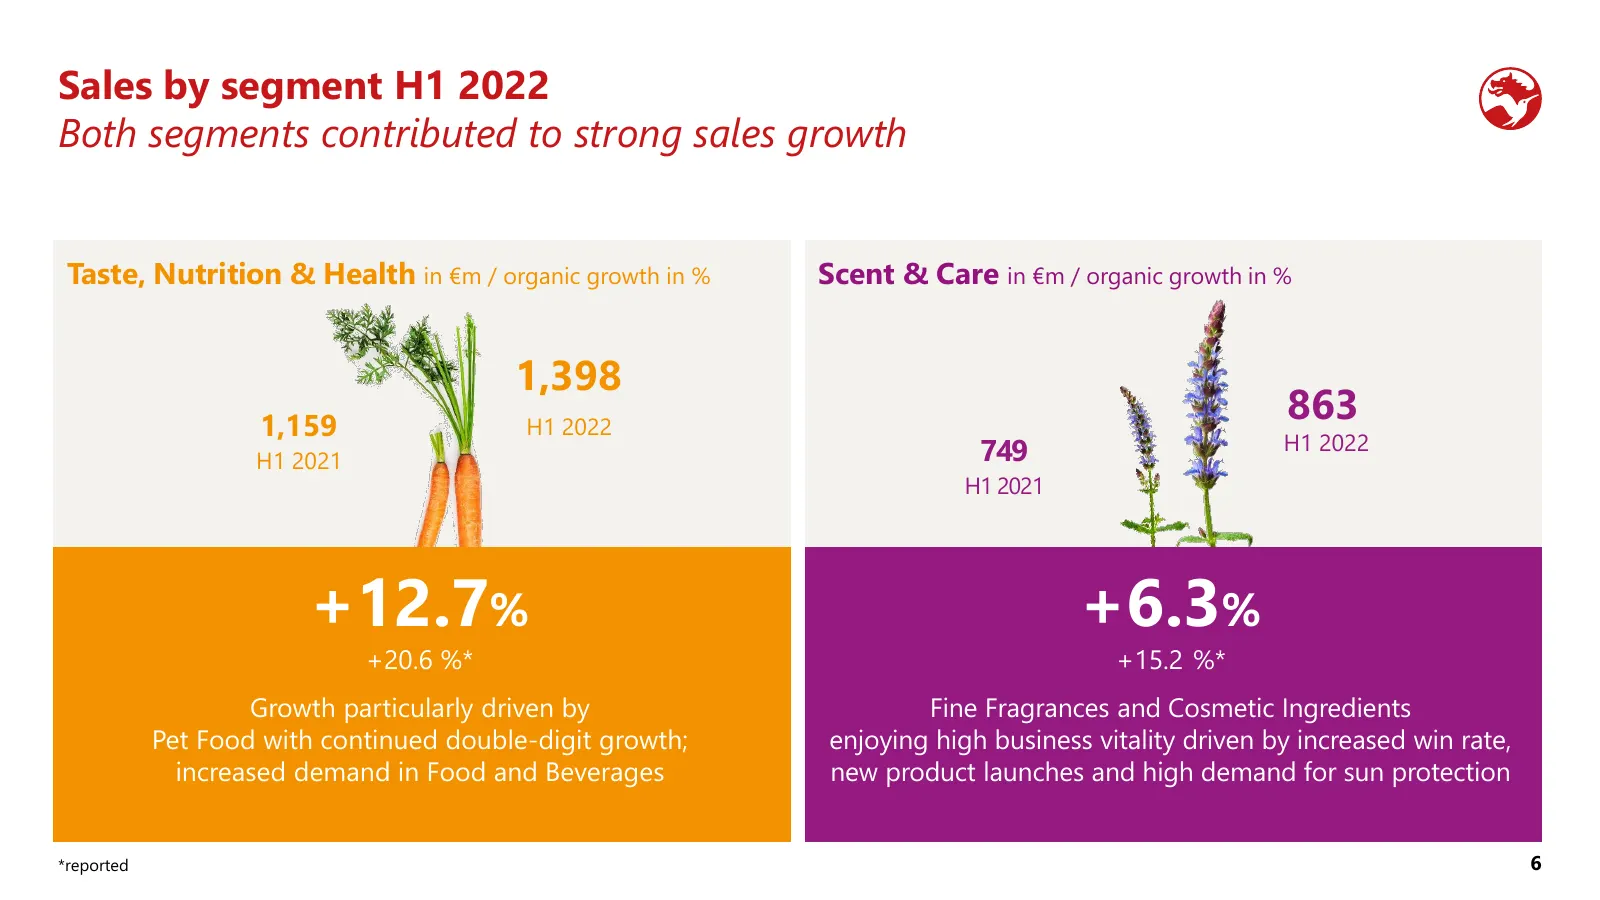
Sales by segment H1 2022 Both segments contributed to strong sales growth — Taste, Nutrition & Health in €m / organic growth in % Scent & Care in €m / organic growth in % 1,398 1,159 H1 2022 863 749 H1 2022 H1 2021 H1 2021 +12.7% +6.3% +20.6 %* +15.2 %* Growth particularly driven by Fine Fragrances
Slide 7: Sales by region in H1 2022
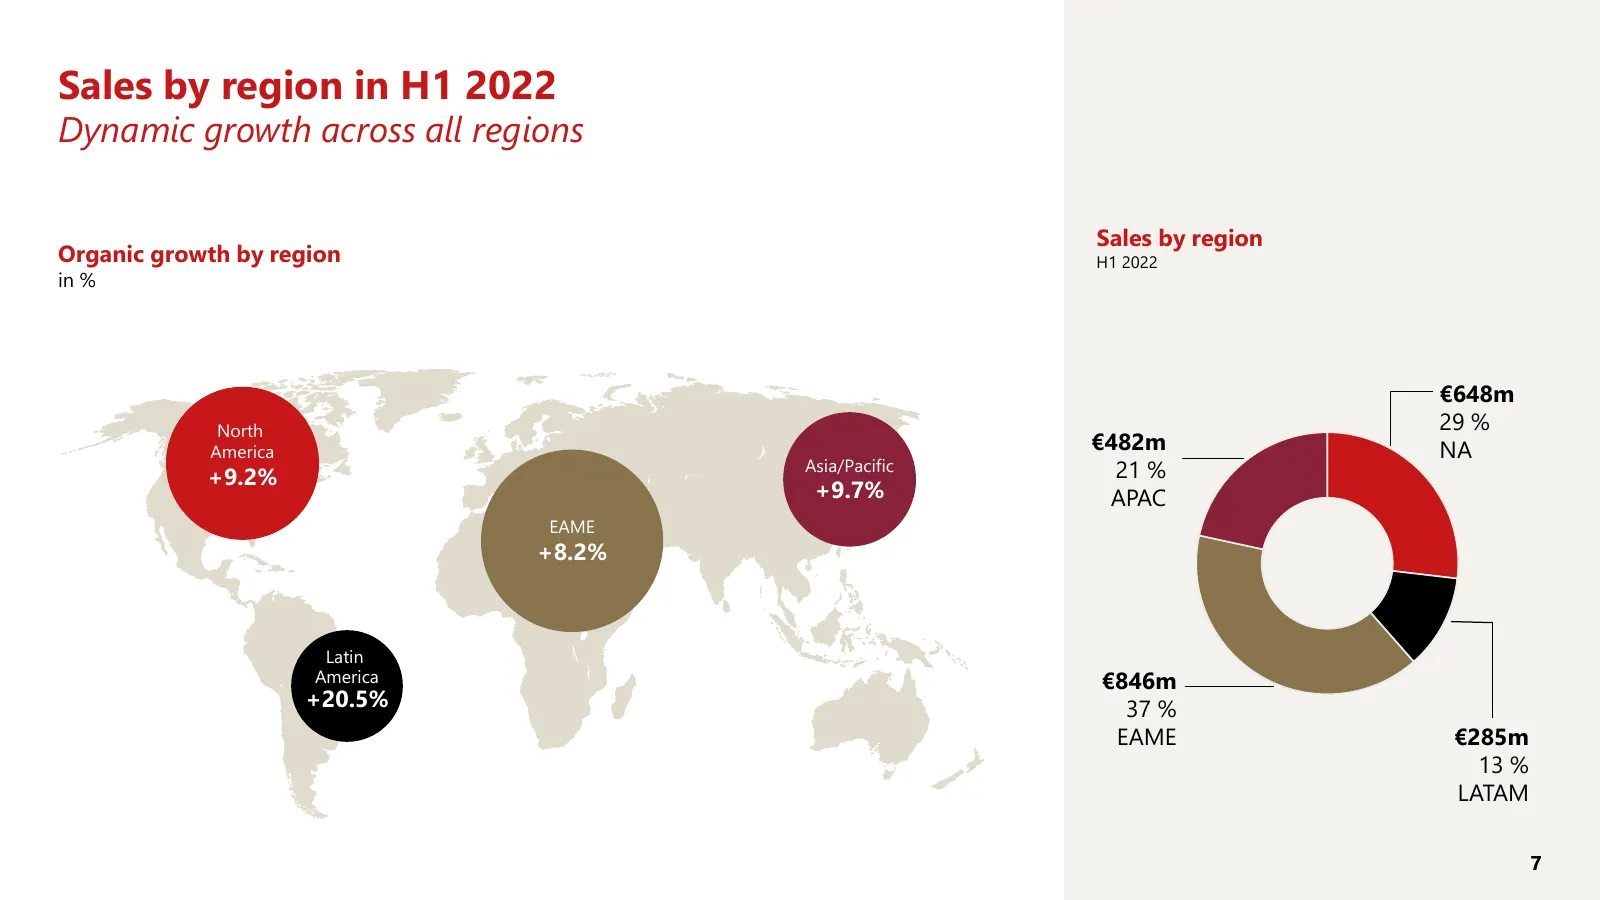
Sales by region in H1 2022 Dynamic growth across all regions — Sales by region Organic growth by region H1 2022 in % €648m North 29 % America €482m NA +9.2% Asia/Pacific 21 % +9.7% APAC EAME +8.2% Latin America €846m +20.5% 37 % EAME €285m 13 % LATAM 7
Slide 8: Financials H1 2022
02 Financials H1 2022 2 Financials 2021 8
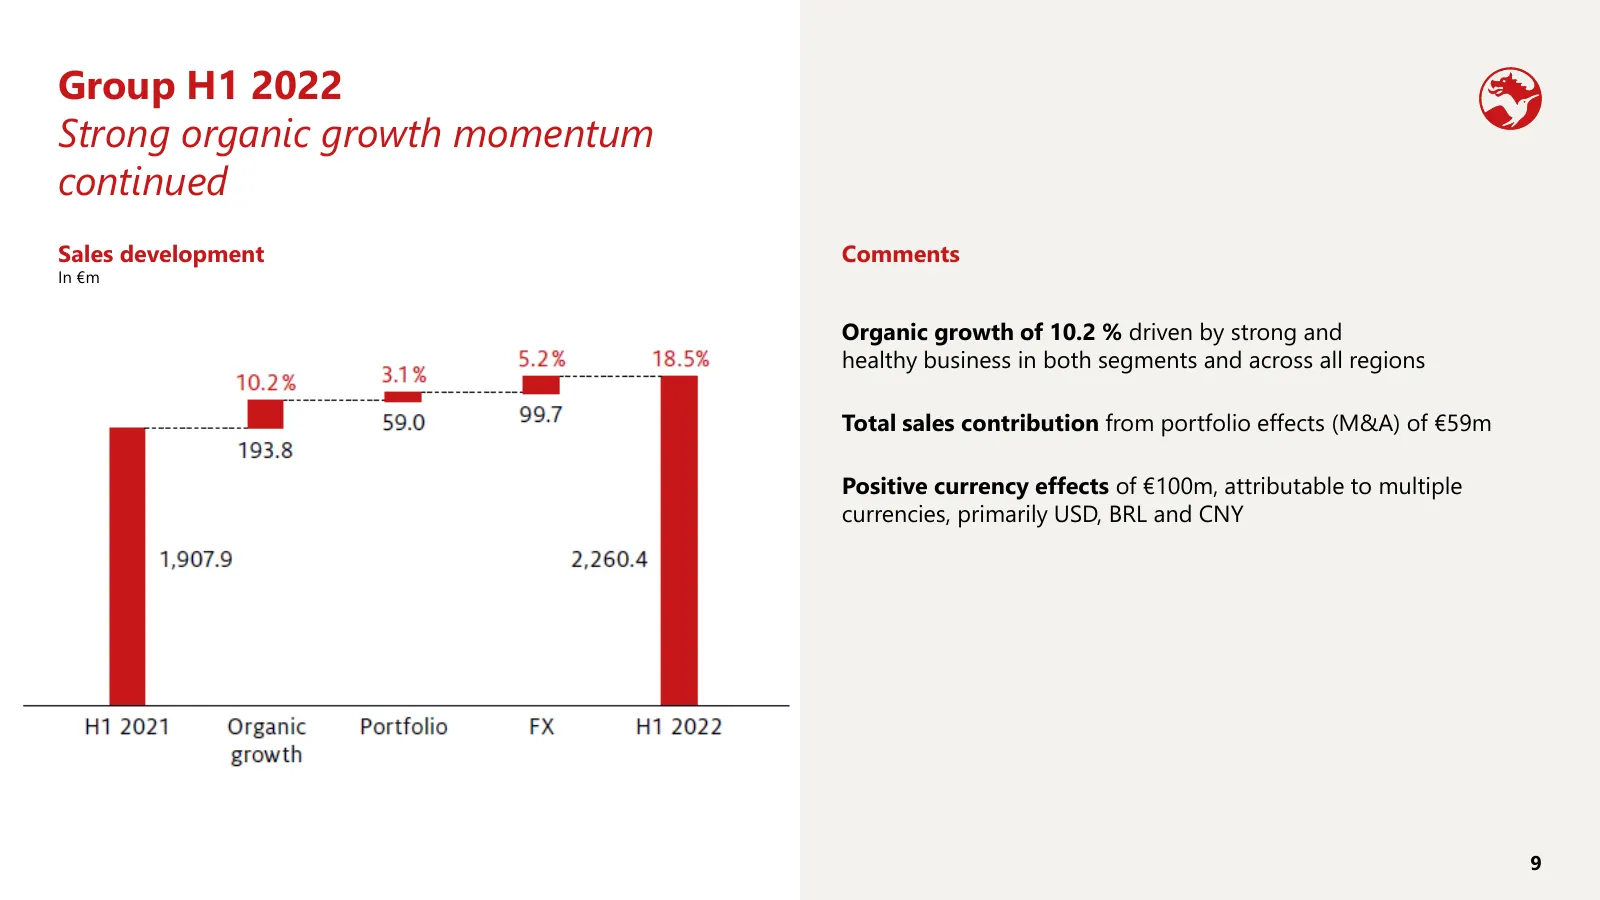
Slide 9: Group H1 2022: Strong organic growth momentum continued
Group H1 2022 Strong organic growth momentum continued — Sales development Comments In €m Organic growth of 10.2 % driven by strong and healthy business in both segments and across all regions Total sales contribution from portfolio effects (M&A) of €59m Positive currency effects of €100m, attributa
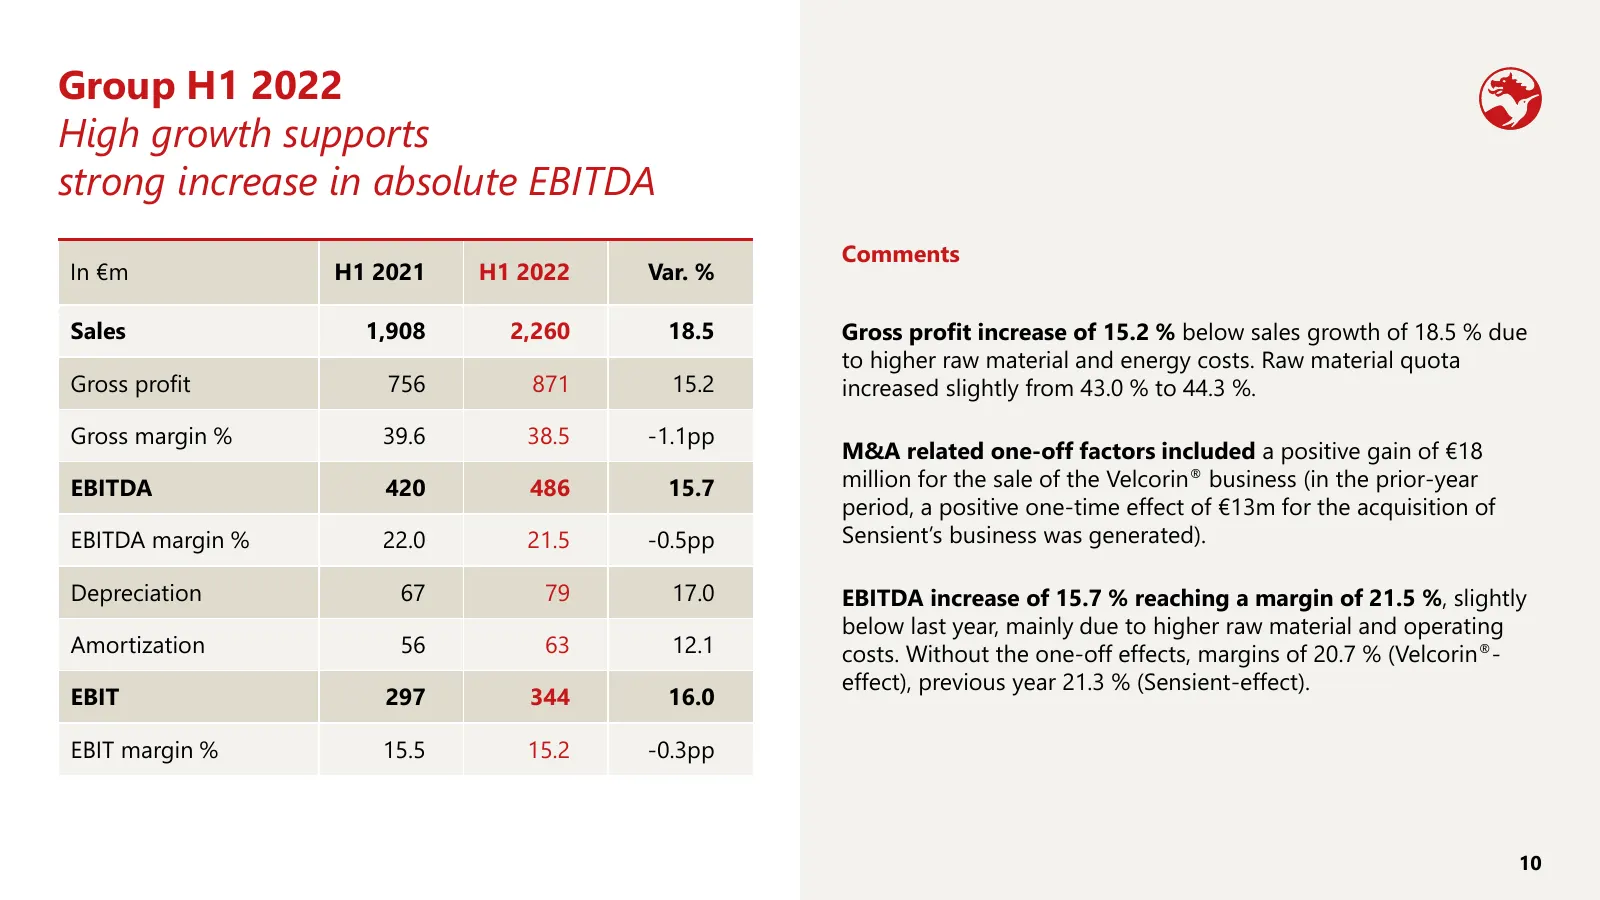
Slide 10: Group H1 2022: High growth supports strong increase in absolute EBITDA
Group H1 2022 High growth supports strong — increase in absolute EBITDA Comments In €m H1 2021 H1 2022 Var. % Sales 1,908 2,260 18.5 Gross profit increase of 15.2 % below sales growth of 18.5 % due to higher raw material and energy costs. Raw material quota Gross profit 756 871 15.2 increased slight
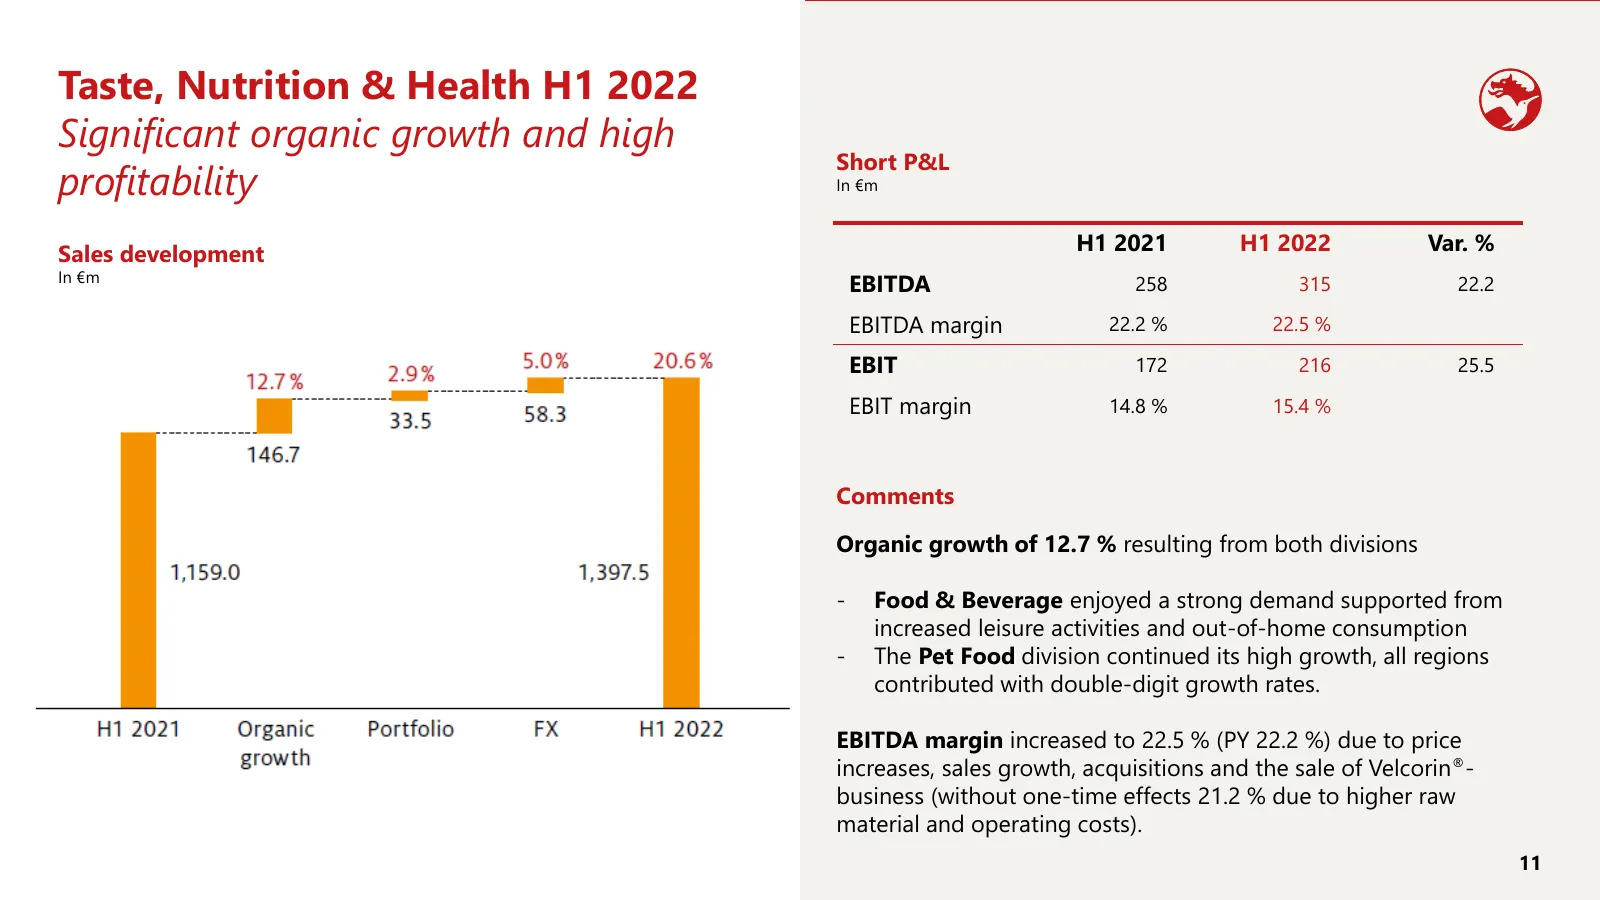
Slide 11: Taste, Nutrition & Health H1 2022
Taste, Nutrition & Health H1 2022 Significant organic growth and high Short P&L profitability — In €m Sales development H1 2021 H1 2022 Var. % In €m EBITDA 258 315 22.2 EBITDA margin 22.2 % 22.5 % EBIT 172 216 25.5 EBIT margin 14.8 % 15.4 % Comments Organic growth of 12.7 % resulting from both divis
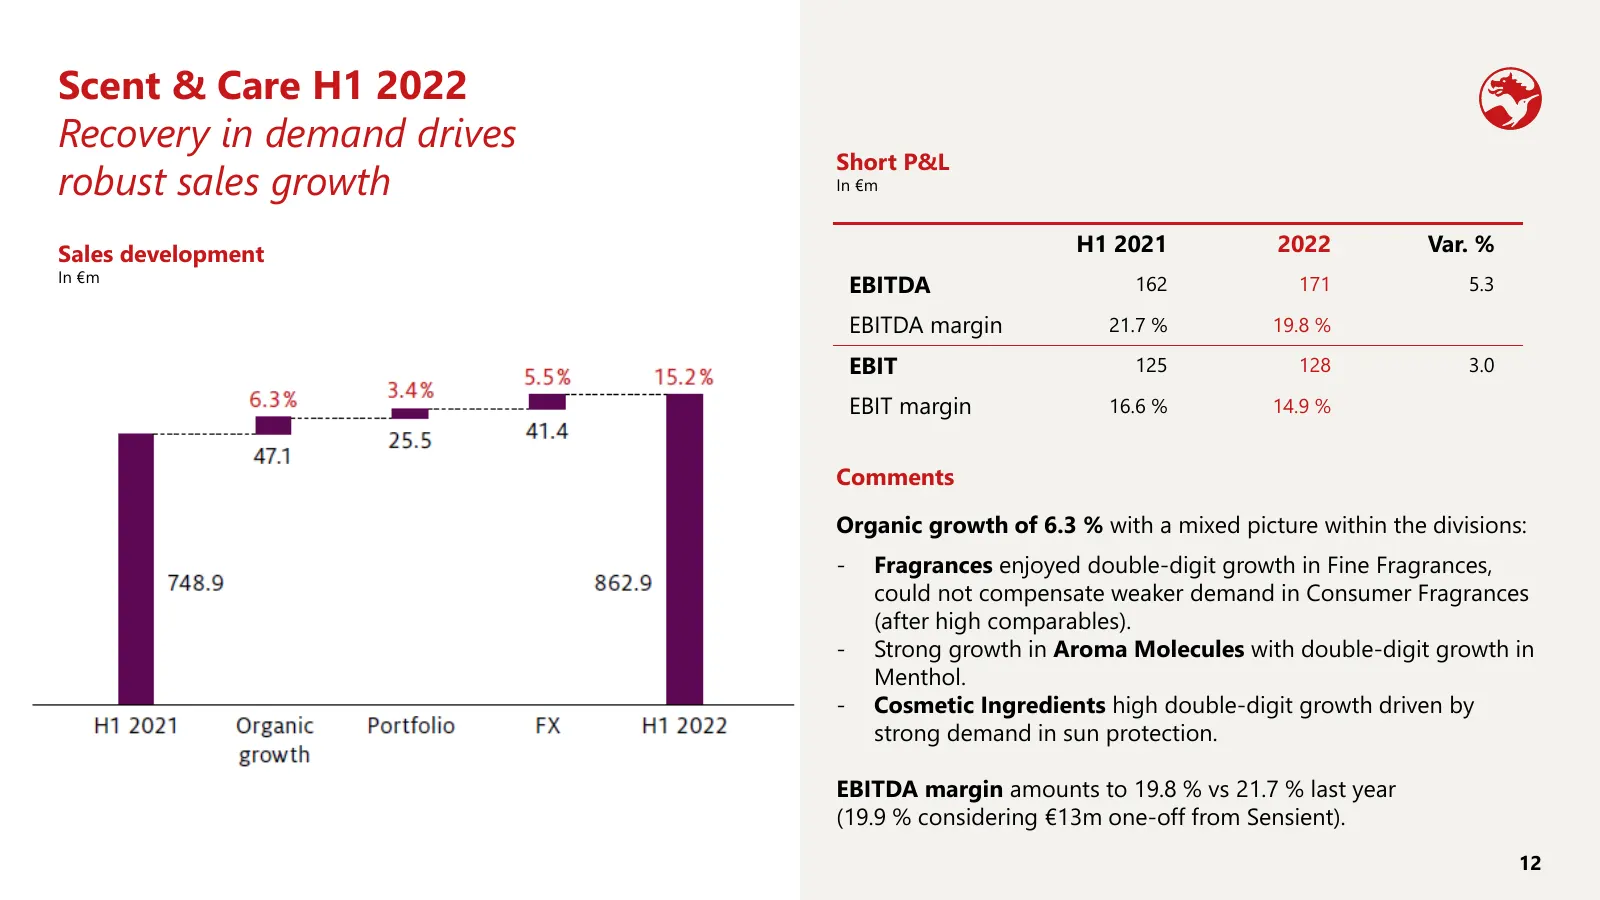
Slide 12: Scent & Care H1 2022
Scent & Care H1 2022 Recovery in demand drives Short P&L robust — sales growth In €m Sales development H1 2021 2022 Var. % In €m EBITDA 162 171 5.3 EBITDA margin 21.7 % 19.8 % EBIT 125 128 3.0 EBIT margin 16.6 % 14.9 % Comments Organic growth of 6.3 % with a mixed picture within the divisions: - Fra
Slide 13: EPS: New all-time high at €1.64
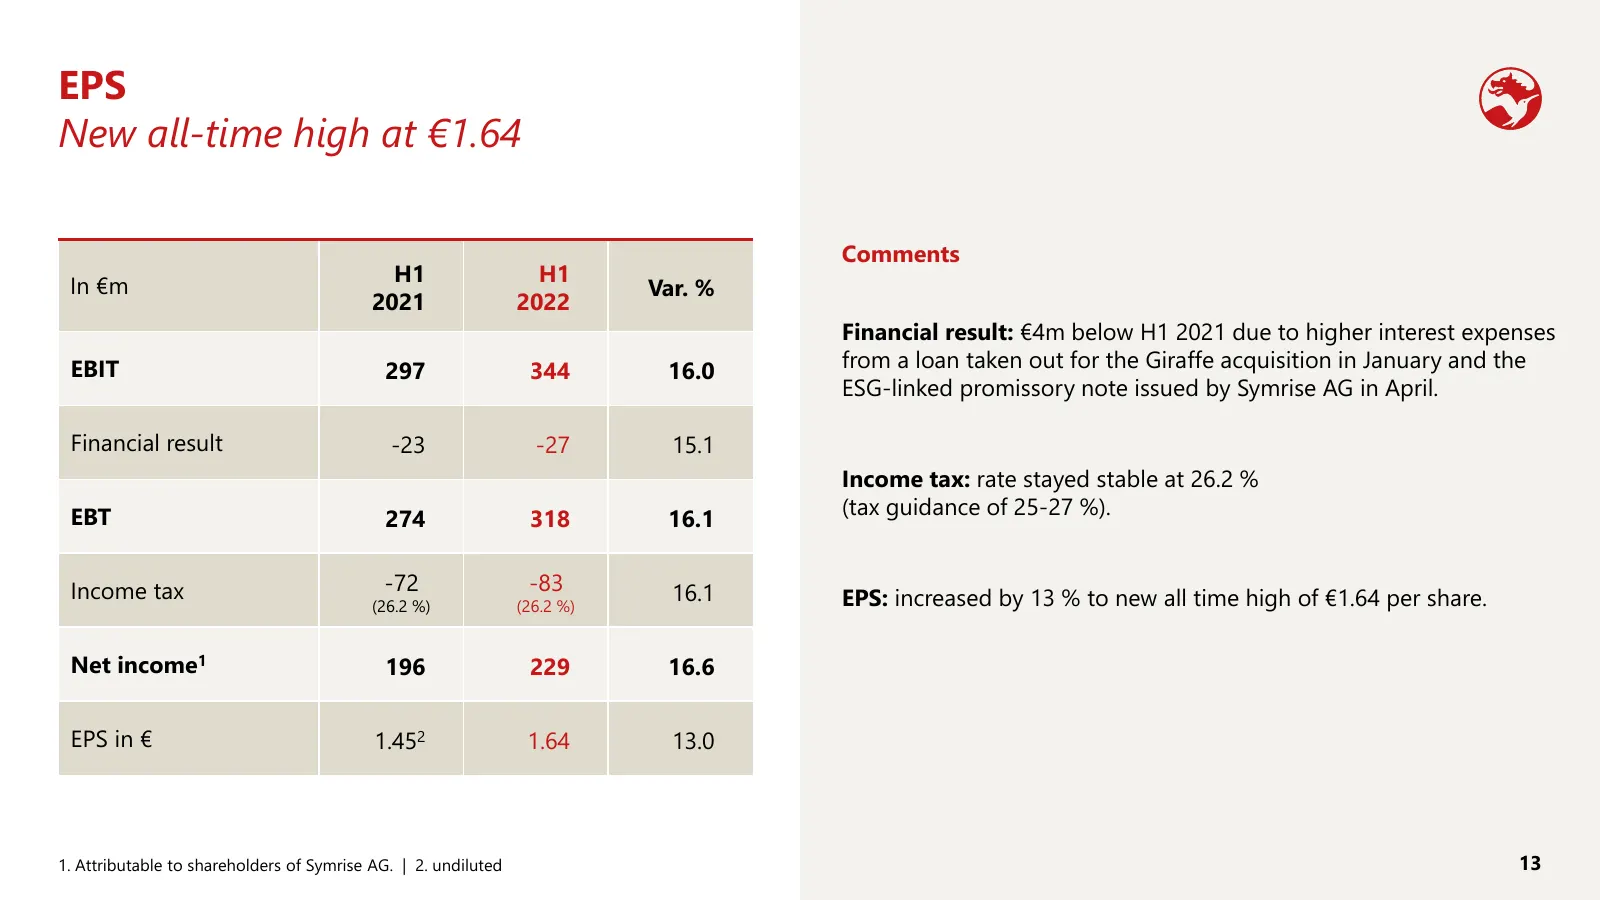
EPS New all-time high at €1.64 — Comments H1 H1 In €m Var. % 2021 2022 Financial result: €4m below H1 2021 due to higher interest expenses EBIT 297 344 16.0 from a loan taken out for the Giraffe acquisition in January and the ESG-linked promissory note issued by Symrise AG in April. Financial result
Slide 14: Business Free Cash Flow (BFCF)
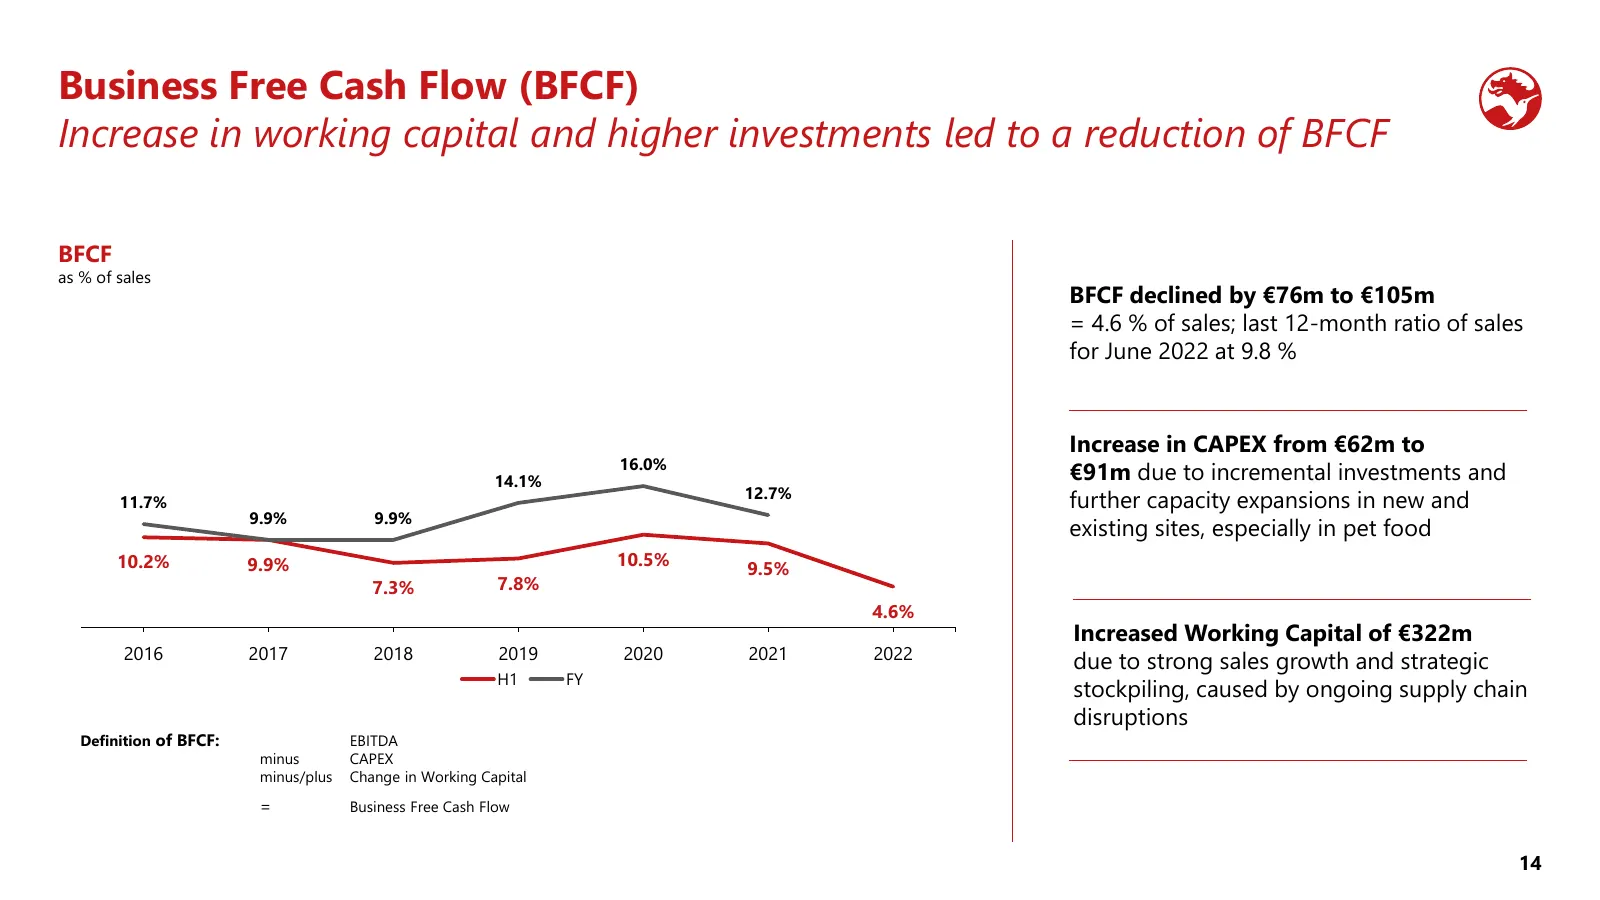
Business Free Cash Flow (BFCF) Increase in working capital and higher investments led to a reduction of BFCF — BFCF as % of sales BFCF declined by €76m to €105m = 4.6 % of sales; last 12-month ratio of sales for June 2022 at 9.8 % Increase in CAPEX from €62m to 16.0% 14.1% €91m due to incremental in
Slide 15: Net debt development
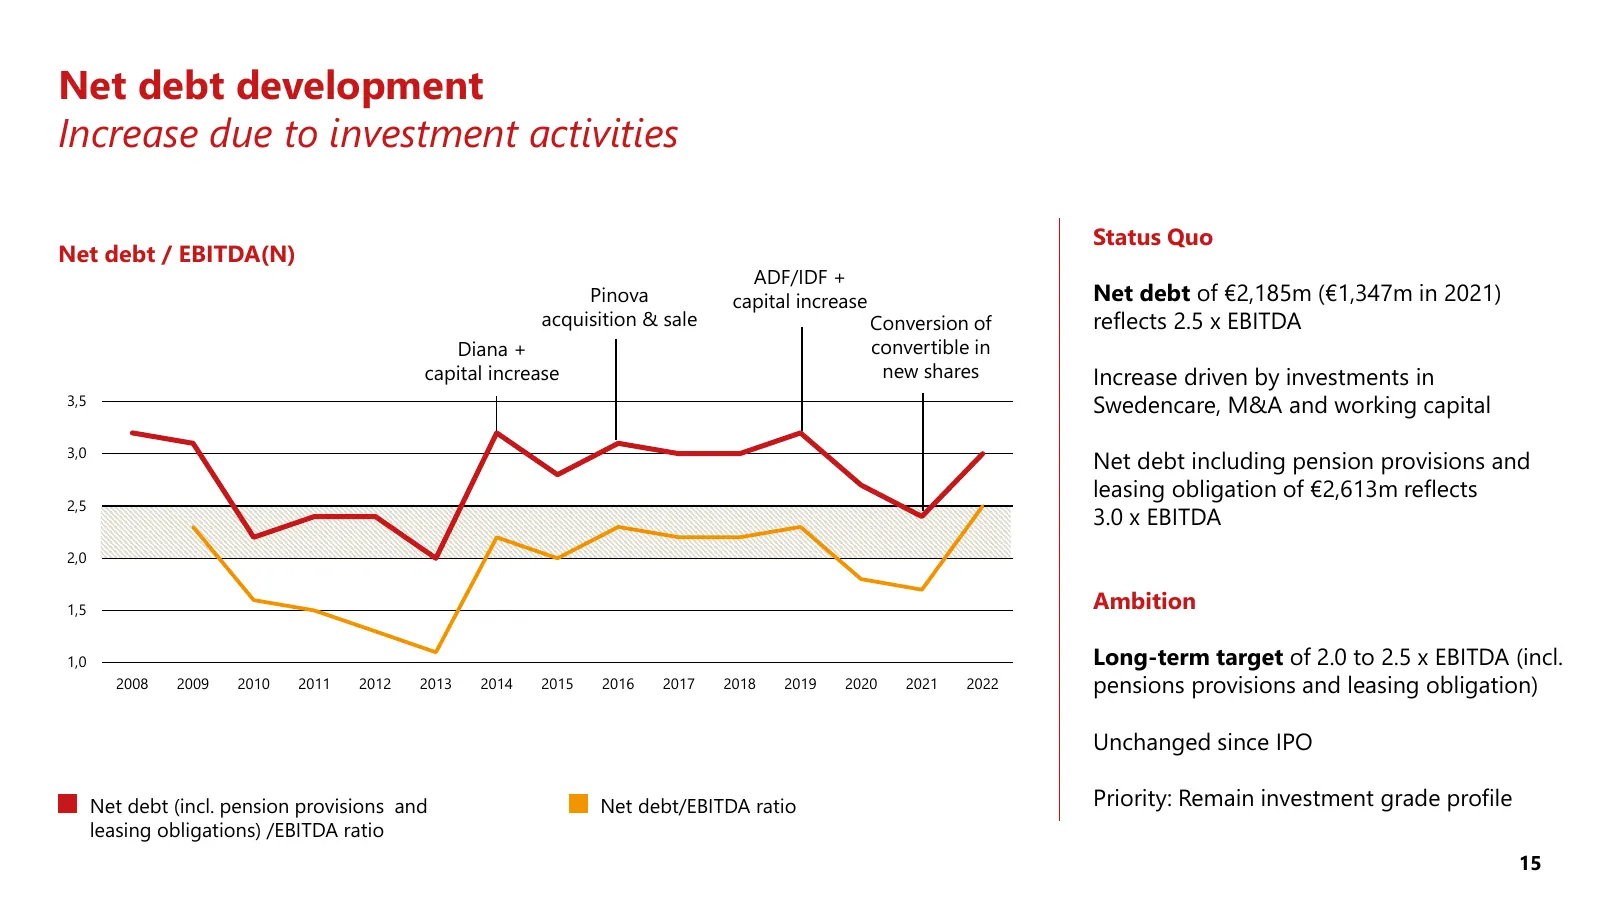
Net debt development Increase due to investment activities — Status Quo Net debt / EBITDA(N) ADF/IDF + Pinova capital increase Net debt of €2,185m (€1,347m in 2021) acquisition & sale Conversion of reflects 2.5 x EBITDA Diana + convertible in capital increase new shares Increase driven by investment
Slide 16: Balance sheet
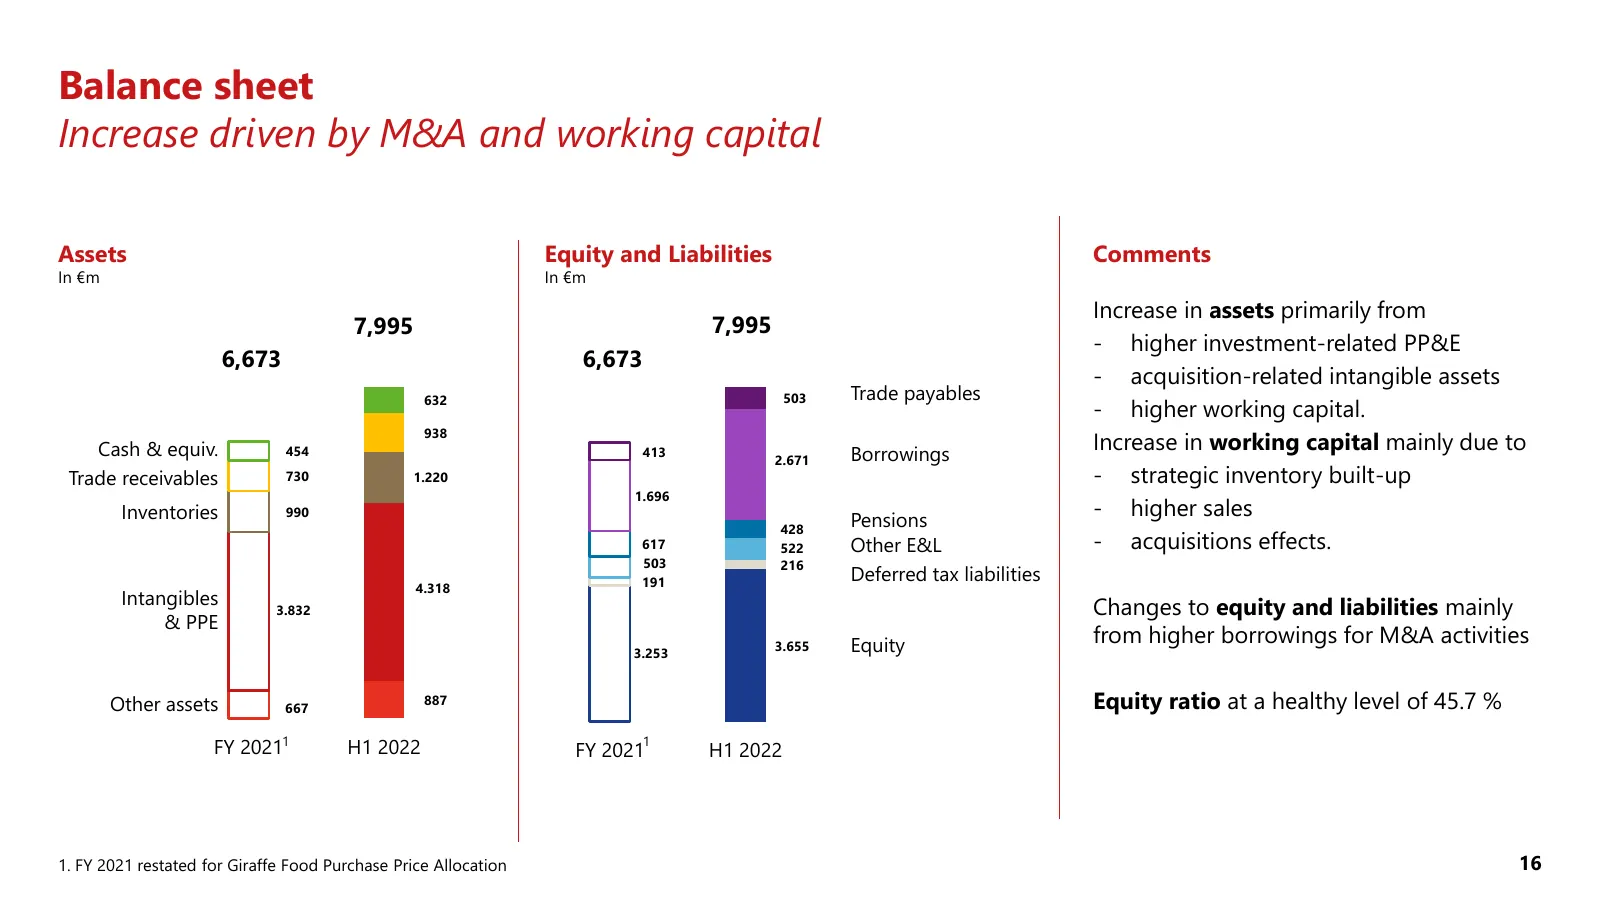
Balance sheet Increase driven by M&A and working capital — Assets Equity and Liabilities Comments In €m In €m Increase in assets primarily from 7,995 7,995 - higher investment-related PP&E 6,673 6,673 - acquisition-related intangible assets 632 503 Trade payables - higher working capital. 938 Cash &
Slide 17: Strategic Initiatives / Outlook
03 Strategic Initiatives / Outlook 3 Strategic initiatives 17 17
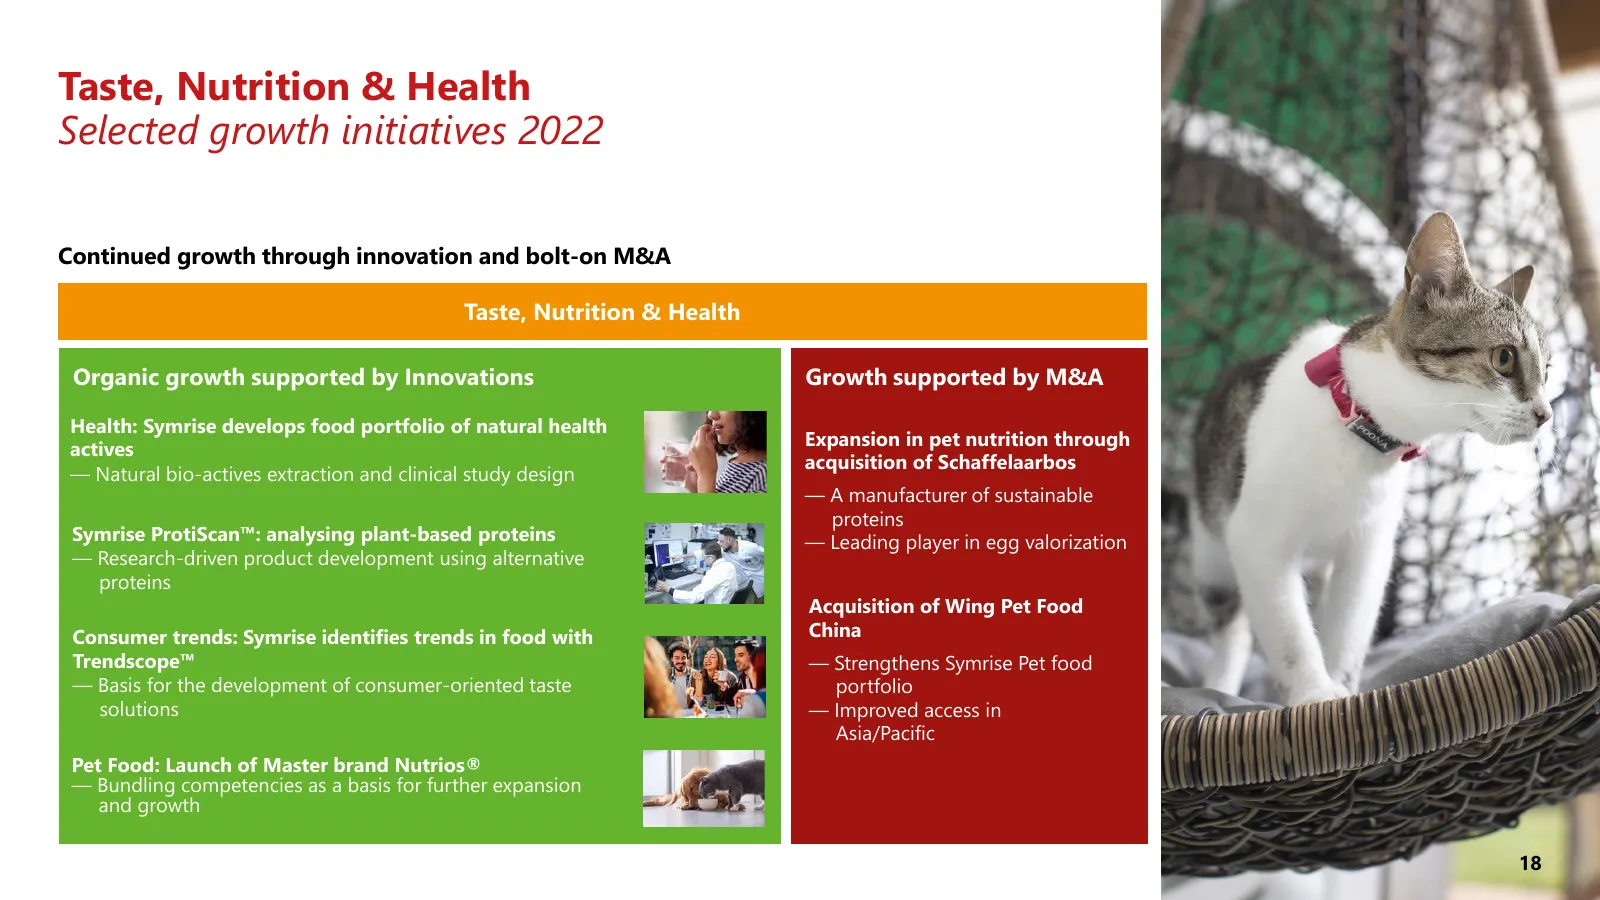
Slide 18: Taste, Nutrition & Health: Selected growth initiatives 2022
Taste, Nutrition & Health Selected growth initiatives 2022 — Continued growth through innovation and bolt-on M&A Taste, Nutrition & Health Organic growth supported by Innovations Growth supported by M&A Health: Symrise develops food portfolio of natural health Expansion in pet nutrition through acti
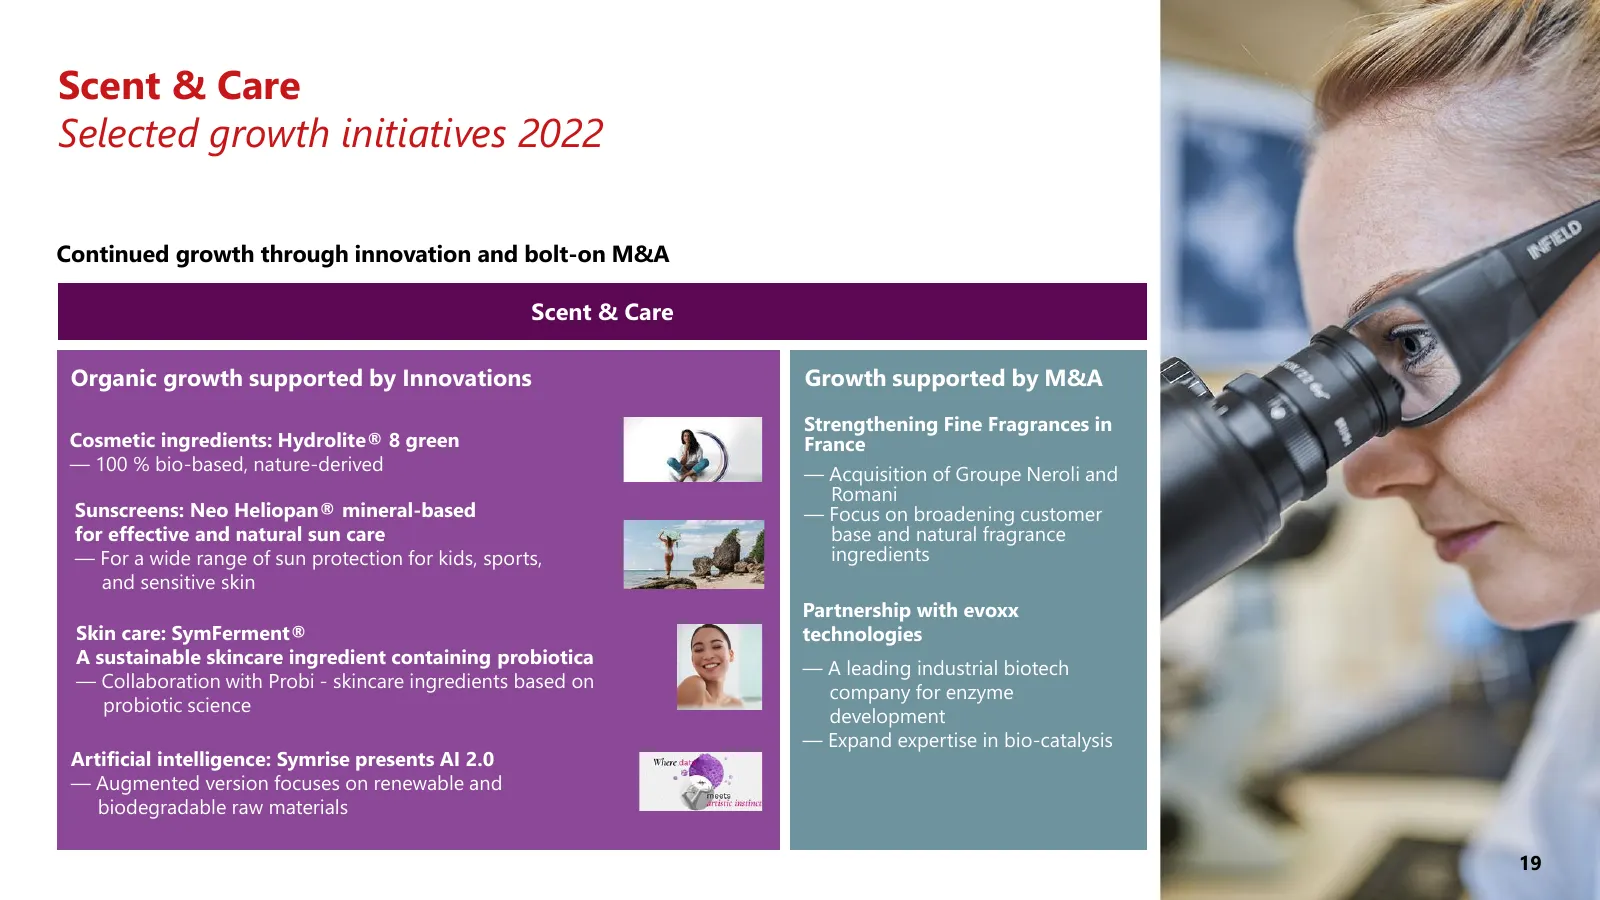
Slide 19: Scent & Care: Selected growth initiatives 2022
Scent & Care Selected growth initiatives 2022 — Continued growth through innovation and bolt-on M&A Scent & Care Organic growth supported by Innovations Growth supported by M&A Strengthening Fine Fragrances in Cosmetic ingredients: Hydrolite® 8 green France — 100 % bio-based, nature-derived — Acquis
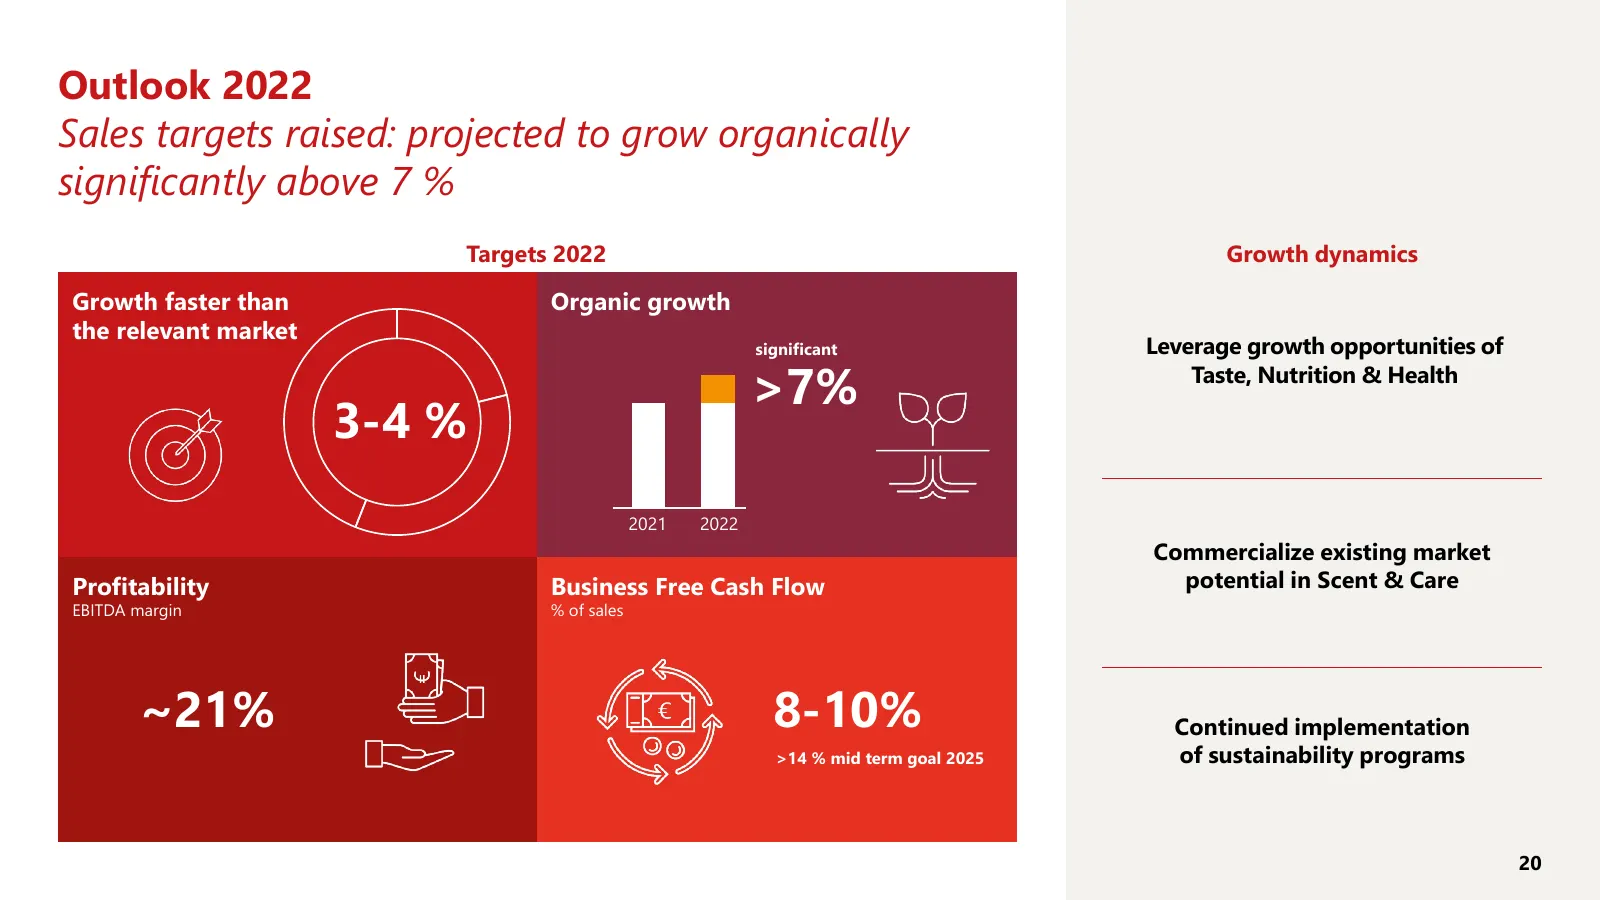
Slide 20: Outlook 2022
Outlook 2022 Sales targets raised: projected to grow organically significantly — above 7 % Targets 2022 Growth dynamics Growth faster than Organic growth the relevant market significant Leverage growth opportunities of >7% Taste, Nutrition & Health 3-4 % 2021 2022 Commercialize existing market Profi
Slide 21: Financial calendar and Contact
Symrise AG — Financial calendar Contact Symrise AG 26 October Mühlenfeldstraße 1 9M 2022 trading statement 37603 Holzminden, Germany Tobias Erfurth Investors Relations tobias.erfurth@symrise.com Bernhard Kott Corporate Communications and Sustainability bernhard.kott@symrise.com This document contain
Slide 22: Corporate strategy: Mid-term targets 2025 remain in place
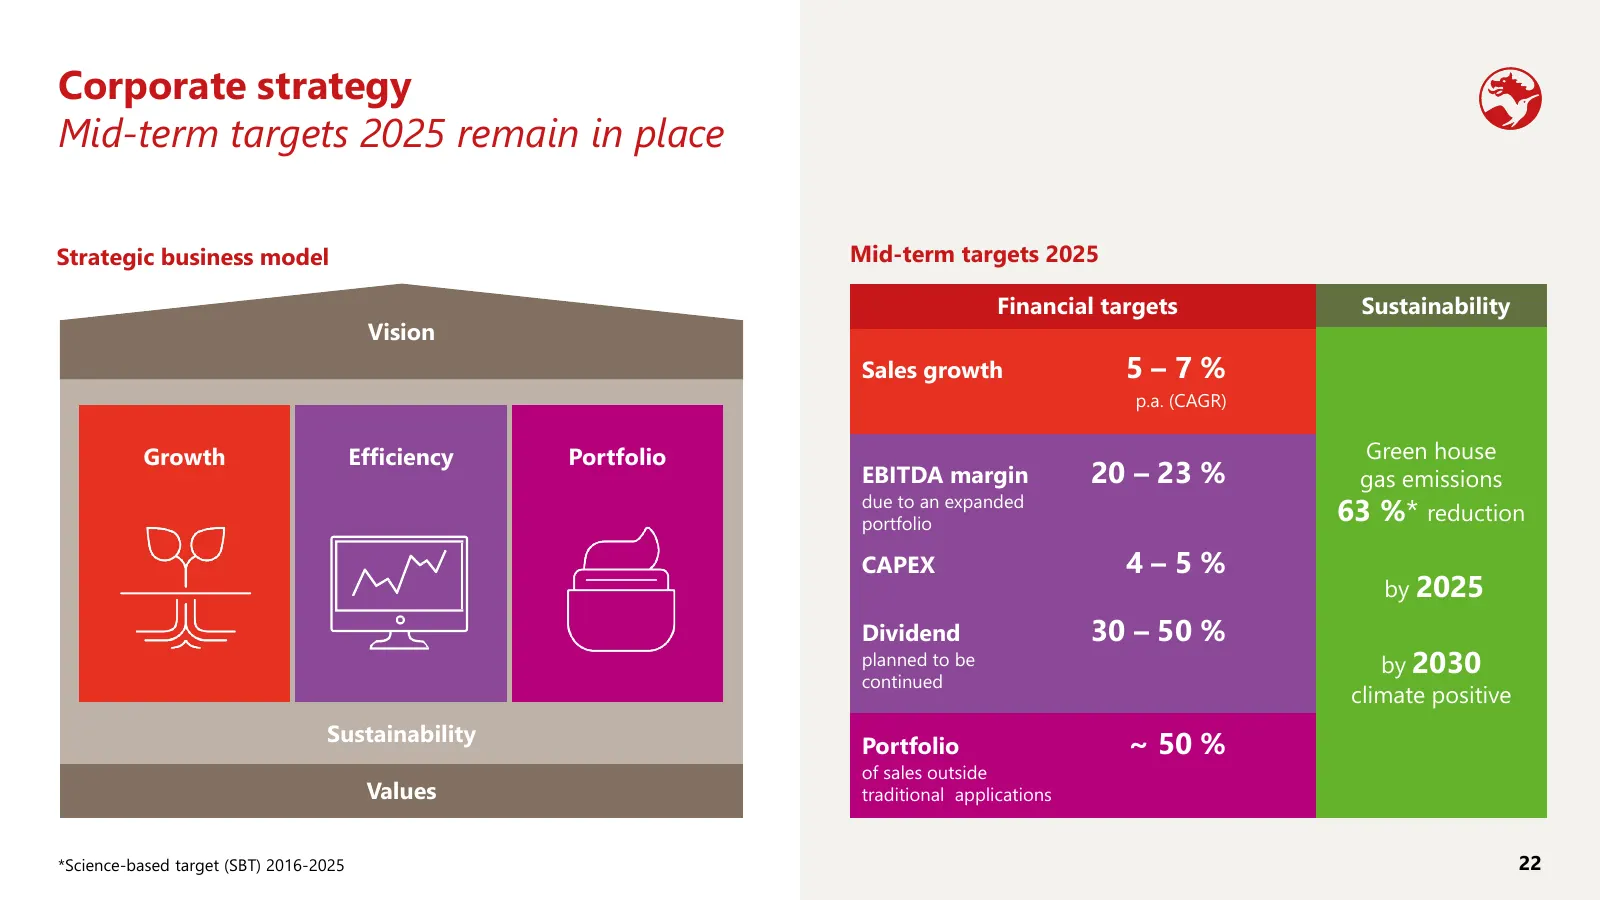
Corporate strategy Mid-term targets 2025 remain in place — Strategic business model Mid-term targets 2025 Financial targets Sustainability Vision Sales growth 5–7% p.a. (CAGR) Growth Efficiency Portfolio Green house EBITDA margin 20 – 23 % gas emissions due to an expanded portfolio 63 %* reduction C
Slide 23: symrise
ry symrise always inspiring more
Source: Internet Archive copy of symrise.com
More decks from Symrise AG
 Q3 2026 Earnings Presentation22 slides · Oct 28, 2026
 Investor Presentation (October 2026)39 slides · October 2026
 H1 2026 Earnings Presentation25 slides · Jul 30, 2026
 Q2 2026 Earnings Presentation29 slides · Jul 30, 2026
 Shareholder Meeting (May 2026)19 slides · May 6, 2026
 Q1 2026 Earnings Presentation19 slides · Apr 29, 2026