Spectra Energy — Investor Day (January 2008)
63 slides from Spectra Energy's investor day presentation, Jan 22, 2008
Slide 1: Outlook and Financial Plan
Outlook and Financial Plan January 17, 2008 Exhibit 99.1
Slide 2: Agenda
Agenda Spectra Energy Financial Plan | January 17, Q&A Fred Fowler – President and CEO, Spectra Energy Corp Investment Consideration Tom O’Connor – Chairman, President and CEO, DCP Midstream DCP Midstream Overview Martha Wyrsch – President and CEO, Spectra Energy Transmission Spectra Energy Transmis
Slide 3: Safe Harbor Statement
Safe Harbor Statement Some of the statements in this document concerning future company performance will be forward-looking within the meanings of the securities laws. Actual results may materially differ from those discussed in these forward-looking statements, and you should refer to the additiona
Slide 4: Fred Fowler, President and CEO
Fred Fowler President and CEO Spectra Energy Corp
Slide 5: Strategically Located Assets
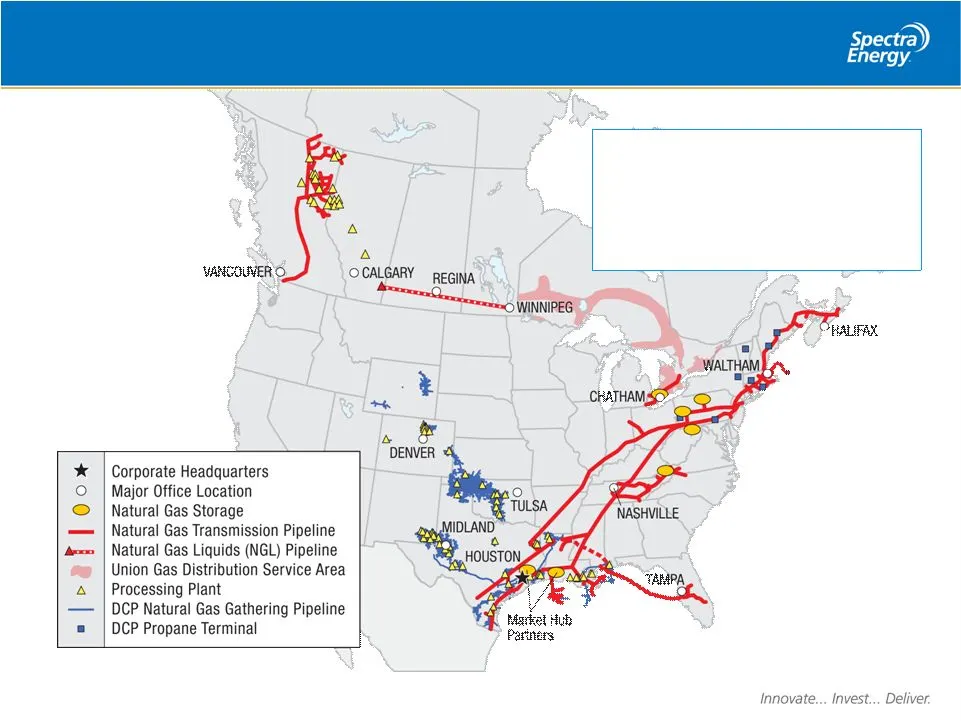
Strategically Located Assets 1.3 million Retail Customers 265 Bcf Storage Capacity 35,000 Miles of Distribution Pipe 58,500 Miles of Gathering & Processing Pipe 17,500 Miles of Transmission Pipe 3.6 Tcf 2007 Natural Gas Throughput
Slide 6: Innovate... Invest... Deliver.
v v v "4 [ Innovate... Invest... Deliver.
Slide 7: 2008 Outlook and Beyond
2008 Outlook and Beyond • $1.56 ongoing, fully diluted EPS employee incentive target for 2008 representing 11% increase over 2007 target • Committed to dividend growth – 2008 dividend increased by $0.04/share to $0.92/share • Continue to execute on our Capital Expansion Plans • at least $1 billion p
Slide 8: Financial Overview
Financial Overview Greg Ebel Chief Financial Officer Spectra Energy Corp
Slide 9: Business Segment Overview
Business Segment Overview Distribution (1) U.S. Transmission (1) Western Canada Transmission & Processing (1) Field Services Distribution (1) NYSE: SE U.S. Transmission (1) Western Canada Transmission & Processing (1) Field Services • Texas Eastern Transmission • Algonquin Gas Transmission • Maritim
Slide 10: Prudent Financial Management
Prudent Financial Management • Minimum return threshold that balances risk/reward • Seek most tax efficient and lowest cost of capital • Maintain strong and flexible balance sheet • Sustainable and growing dividend Disciplined financial management and balance sheet flexibility provides competitive a
Slide 11: 2008 Ongoing Earnings Expectations
2008 Ongoing Earnings Expectations • Expect 7-9% CAGR in Spectra Energy Transmission ongoing segment EBIT for 2007 through 2010, using 2007 as base • Other financial metrics: • Interest Expense = $670 MM • Effective Tax Rate = ~33% • No New Equity Issuances • Fully Diluted Shares Outstanding = 639 M
Slide 12: 2008 Projected Cash Flow Summary
2008 Projected Cash Flow Summary $ (1,870) Capital and Investment Expenditures - Expansion (includes SEP $395) (550) - Maintenance $ (1,455) $ (1,455) Net Sources / (Uses) Net Sources / (Uses) $ (3,060) $ (3,060) TOTAL Uses: TOTAL Uses: (580) Dividends (60) Other sources / (uses), net Primary Uses:
Slide 13: Access to Immediately Available Funds
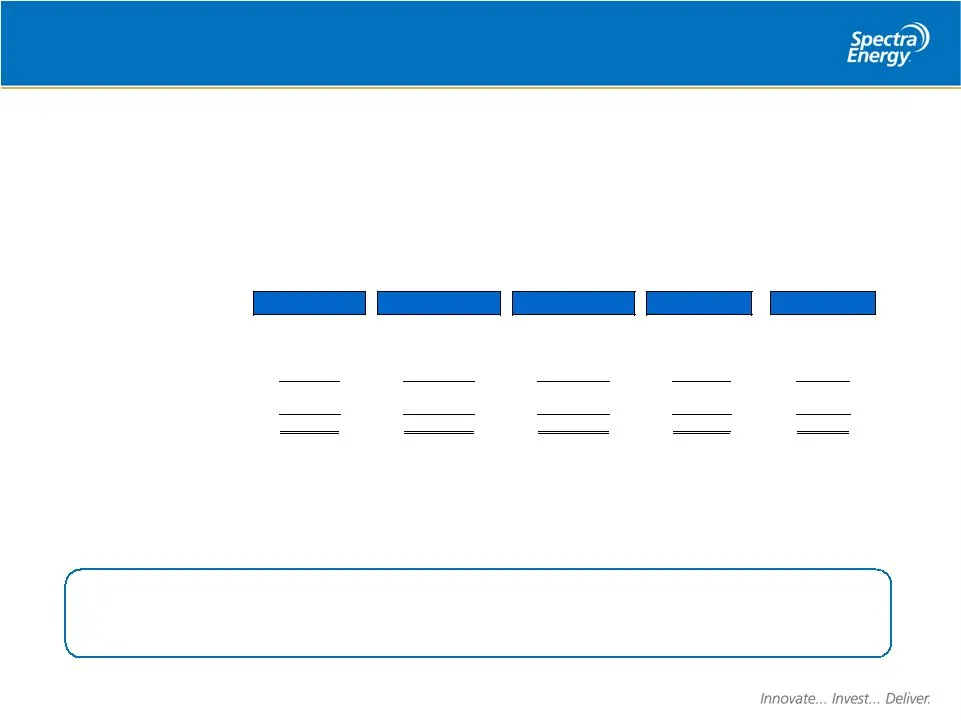
Access to Immediately Available Funds SEP Spectra Capital Westcoast Union Gas Total SE • We have four separate liquidity positions In 2007, added $700 MM to Spectra Energy facilities and entered into $500 MM facility at SEP. Liquidity more than adequate for our operations and capital expansion progr
Slide 14: Strong Investment Grade Balance Sheet
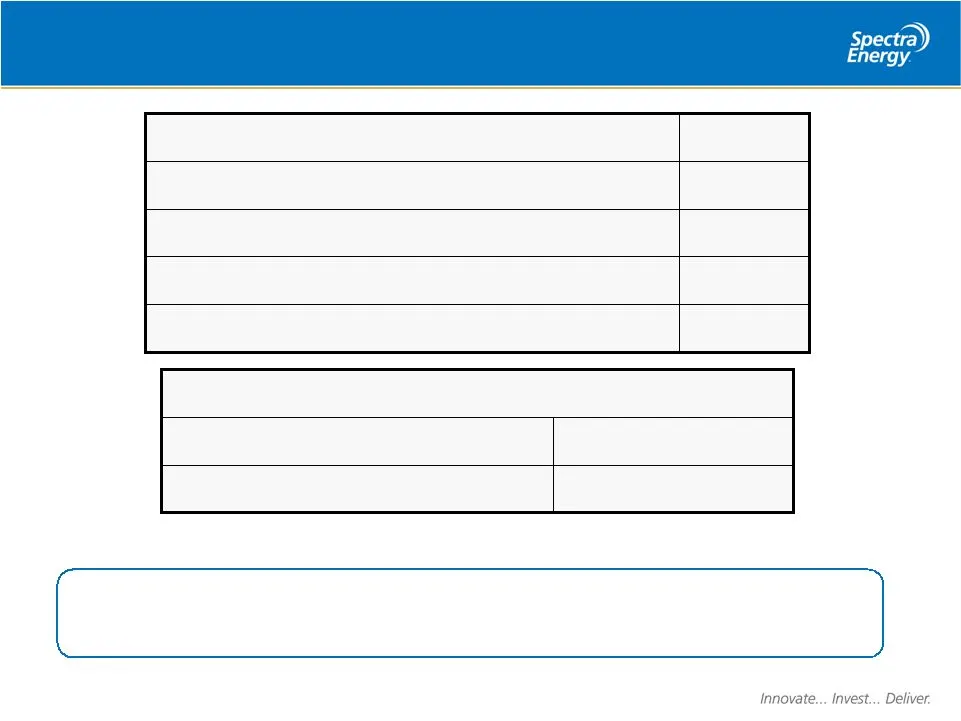
Strong Investment Grade Balance Sheet $ 11.4 Estimated 12/31/08 Debt Balance (billion) 58.0% Estimated Debt/Total Capitalization 14.4% Estimated FFO / Total Debt 3.2x Estimated FFO / Interest 2008-2010 capital expenditures financed with debt with substantially no effect on debt/total capitalization
Slide 15: Commodity Exposure Overview
Commodity Exposure Overview DCP Midstream* Empress Canadian Dollar Hedging • DCP Midstream’s primary exposure is to NGL prices (for which we assume a 60% price relationship to oil); changes in contract mix have resulted in some exposure to natural gas • Estimated average price of crude oil for 2008
Slide 16: Spectra Energy Transmission Overview
Spectra Energy Transmission Overview Martha Wyrsch President and CEO Spectra Energy Transmission
Slide 17: Innovate... Invest... Deliver.
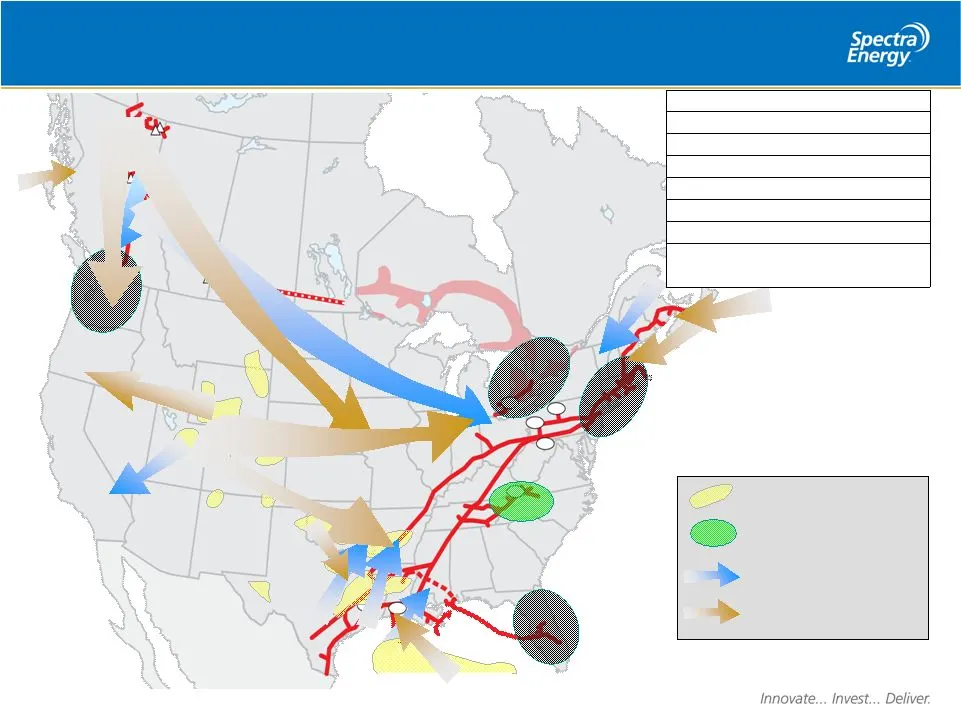
oS &> > > Innovate... Invest... Deliver.
Slide 18: Well-Positioned for Growth Expansion Opportunities
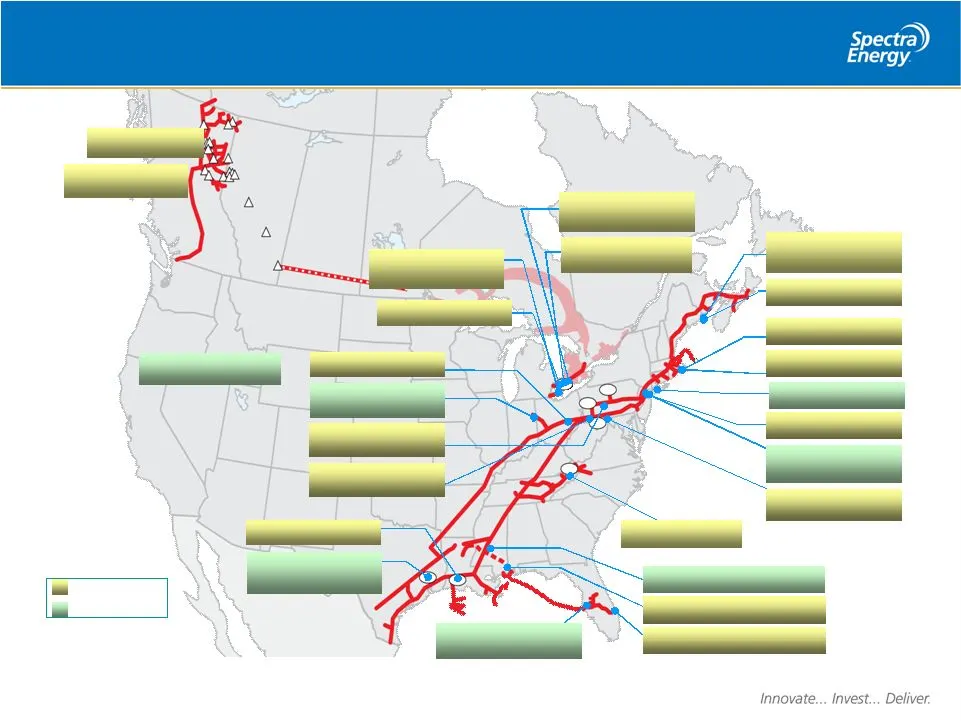
Well-Positioned for Growth Expansion Opportunities M&NE Phase IV (Canaport ™ ) Dawn Storage Deliverability South Peace Pipeline Islander East TIME III TIME II (Phase II) Gulfstream III & IV Copiah Storage SE Supply Header M&NE Phase V Dawn Area Storage Moss Bluff Expansion Egan Expansion Pine River
Slide 19: 2007 Projects In-Service
2007 Projects In-Service 2007 Projects In-Service • Major Projects In-Service in 2007: • Northeast Gateway - $215 million • TIME II (Phase I) - $125 million • Dawn-Trafalgar – Phase II - $130 million • Moss Bluff & Egan Storage - $60 million • Western Canadian Gathering & Processing - $40 million •
Slide 20: Organic Growth Projects 2008-2010 (Execution)
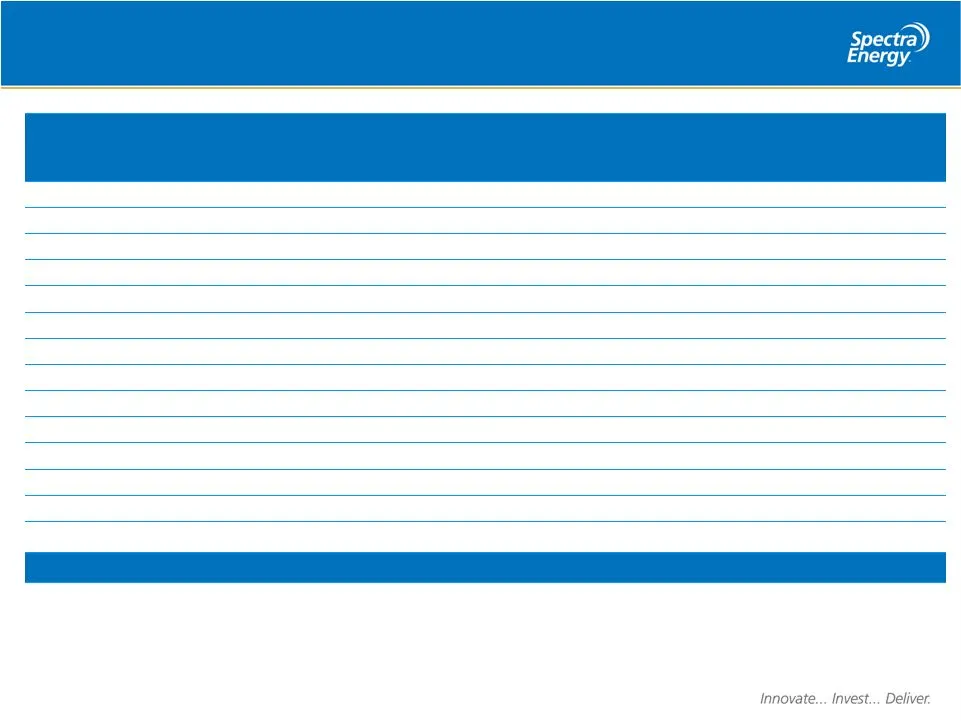
Significant Growth Projects Organic Growth Projects 2008-2010 (Execution) 1H09 Execution UST ( 1/2 SEP) Gulfstream Phase IV UST UST Dist WC UST (SEP) WC Dist UST ( 1/2 SEP) UST ( 1/2 SEP) UST Dist UST UST Segment Segment 1H09 / 2H09 Execution Dawn Area Storage 2H08 Execution Dawn-Trafalgar Pipeline
Slide 21: Organic Growth Projects 2008-2010 (Development)
Significant Growth Projects Organic Growth Projects 2008-2010 (Development) UST UST UST Segment Segment 2H10 N/A ¹ Development M&NE Phase V 2H09 N/A ¹ Development Northern Bridge In-Service In-Service Est. CapEx Est. CapEx ($MM) ($MM) Status Status Expansion Project Expansion Project $ .9 B $ 2.7 B
Slide 22: Greenfield Projects 2008-2010
Significant Growth Projects Greenfield Projects 2008-2010 UST UST Dist Segment Segment 1H09 Execution Steckman Ridge Storage 1H08 Execution Tribute Storage In-Service In-Service Est. CapEx Est. CapEx ($MM) ($MM) Status Status Expansion Project Expansion Project $ 0.7 B $ 0.7 B Total Greenfield Proje
Slide 23: Major Opportunities post-2010
Significant Growth Projects Major Opportunities post-2010 N/A ¹ Development UST Bronco Pipeline / West N/A ¹ Development UST ( 1/2 SEP) Moss Bluff Storage Expansion N/A ¹ Development UST NY City Extension (formerly Rockaway Beach) N/A ¹ Development UST Islander East N/A ¹ Development UST Copiah Stor
Slide 24: 2008 Projects In-Service
2008 Projects In-Service • Major Projects expected to be in-service in 2008: • Southeast Supply Header - $500 million • Ramapo - $245 million • M&NE Phase IV - $320 million • Dawn Storage Deliverability/Tribute- $145 million • Time II (Phase II) - $90 million • Gulfstream Phase III - $65 million • D
Slide 25: Spectra Energy Partners
Spectra Energy Partners • Primary objective to grow cash distributions per unit • 2008 provides avenues for distribution growth • Organic Projects • ETNG Glade Spring project expected in-service 2H08 • Gulfstream Phase III expected in-service July 2008 • Egan Storage project expected in-service Augu
Slide 26: 2008 SET Business Plan Summary
2008 SET Business Plan Summary • Continued solid EBIT from all business units • 2008 Focus Areas • Successful execution on CapEx projects • Cost management • Superior customer service • Continued focus on safety • Seek MLP opportunities to help accelerate growth Expect 7-9% CAGR in ongoing EBIT from
Slide 27: DCP Midstream Overview
DCP Midstream Overview Tom O’Connor Chairman, President and CEO DCP Midstream
Slide 28: DCP Midstream Organizational Structure
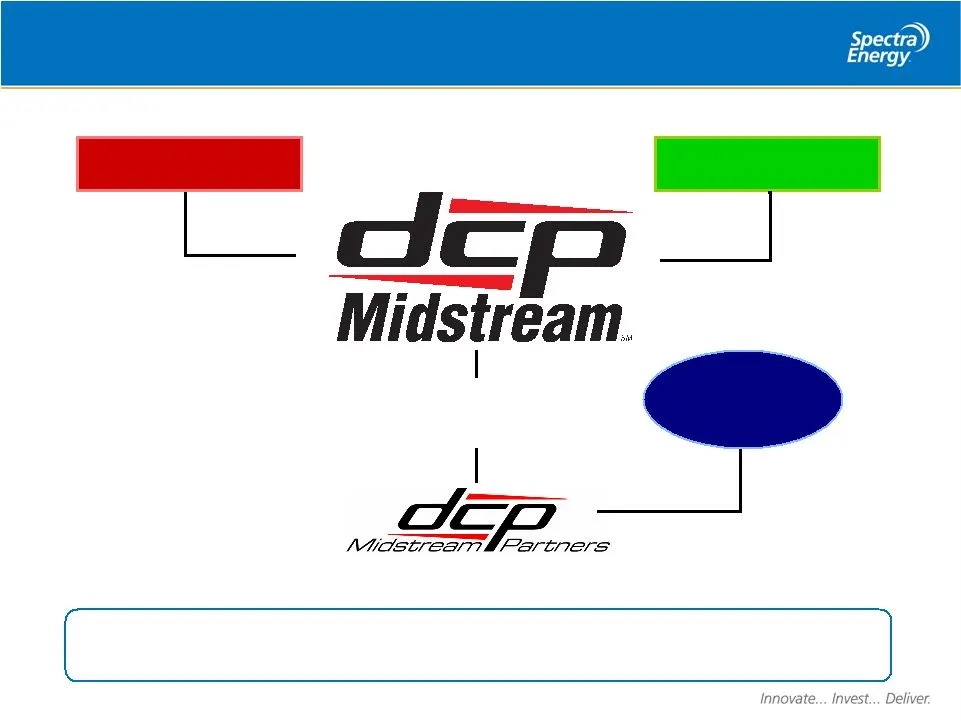
DCP Midstream Organizational Structure ConocoPhillips ConocoPhillips Public Unitholders Spectra Energy Spectra Energy 64.6% Common LP Interest 33.9% LP Interest 1.5% GP Interest NYSE: DPM 50% 50% ConocoPhillips Public Unitholders Spectra Energy DCP Midstream enjoys strong sponsor support and is a si
Slide 29: DCP Midstream Strategic Assets with Scale and Scope
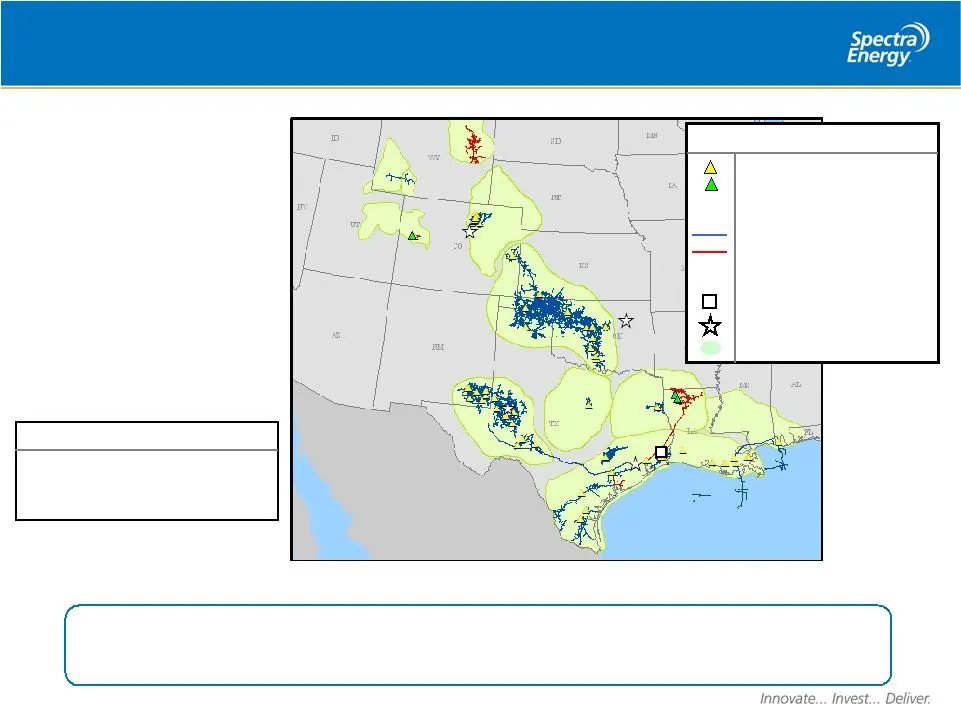
DCP Midstream Strategic Assets with Scale and Scope DENVER TULSA MIDLAND HOUSTON DCP has the scale to be efficient and geographic diversity to compete for growth (1) Includes DCP Midstream Partners Volumes 2007 Volumes Total Throughput 6.8 Bcf/d Gathered & Processed 5.5 Bcf/d Natural Gas Liquids 360
Slide 30: DCP Midstream 2007 Achievements
DCP Midstream 2007 Achievements • Expect to achieve EBIT target of $1.2B, EBITDA of $1.5B • Dividends to parents, including tax distributions, were $1.4B • Completed the $635MM Momentum acquisition in conjunction with Partners • Midstream buys $470MM Barnett Shale assets and Partners buys $165MM Roc
Slide 31: DCP Midstream Business Trends
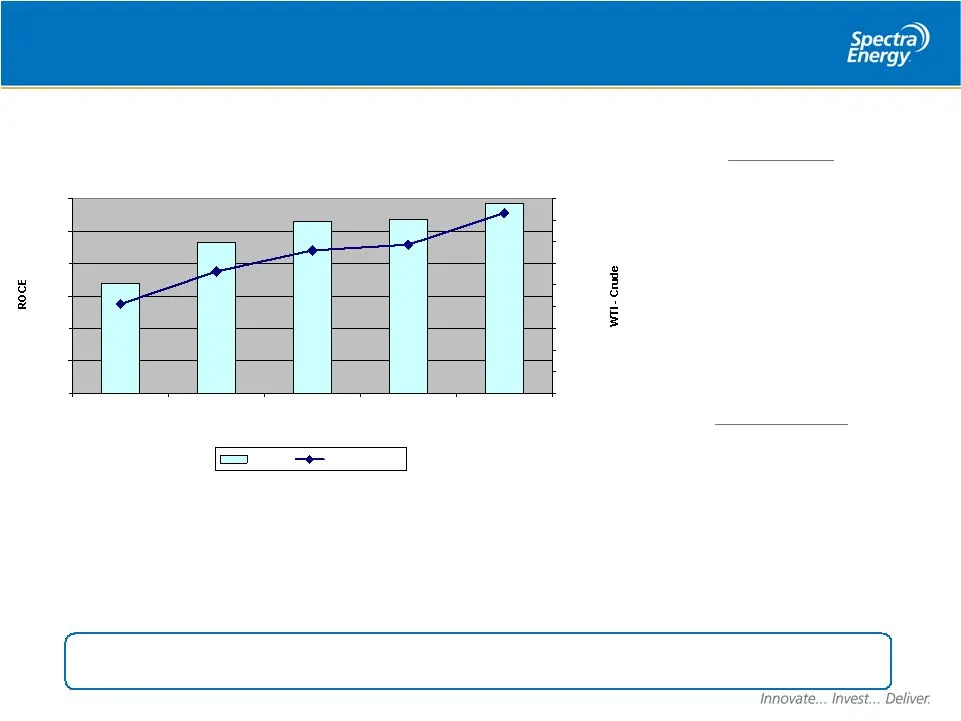
DCP Midstream Business Trends DCP Midstream (100%) ROCE Trend 0% 5% 10% 15% 20% 25% 30% 2005 (1) 2007B 2008 (2) $0.00 $10.00 $20.00 $30.00 $40.00 $50.00 $60.00 $70.00 $80.00 $90.00 ROCE WTI - Crude Positives • Robust Drilling • Favorable Pricing • Improving Efficiency DCP’s exceptional asset positio
Slide 32: DCP Midstream 2008 Initiatives
DCP Midstream 2008 Initiatives • Customer Focused Operations • Plant reliability • Fuel and loss efficiency • Cost Control • Targeted cost reductions • Continued efficiency investment • Selective Growth • Aggressive volume attachment • $220MM Midstream expansion capex (100%) • Leverage DCP Partners
Slide 33: DCP Midstream 2008 Financial Plan Summary
DCP Midstream 2008 Financial Plan Summary DCP Midstream Earnings (100% level) ($MM) (1) EBIT $1,500 EBITDA $1,900 Net Income $1,300 (2) Dividends / Tax Distributions $1,200 (2) DCP Midstream CapEx $460 (3) 12/31/08 Credit Ratios: EBITDA / Interest 10.4x Debt / Capitalization 55% (1) Based on late Oc
Slide 34: DCP Midstream 2008 Margin / Volume By Contract Forecast
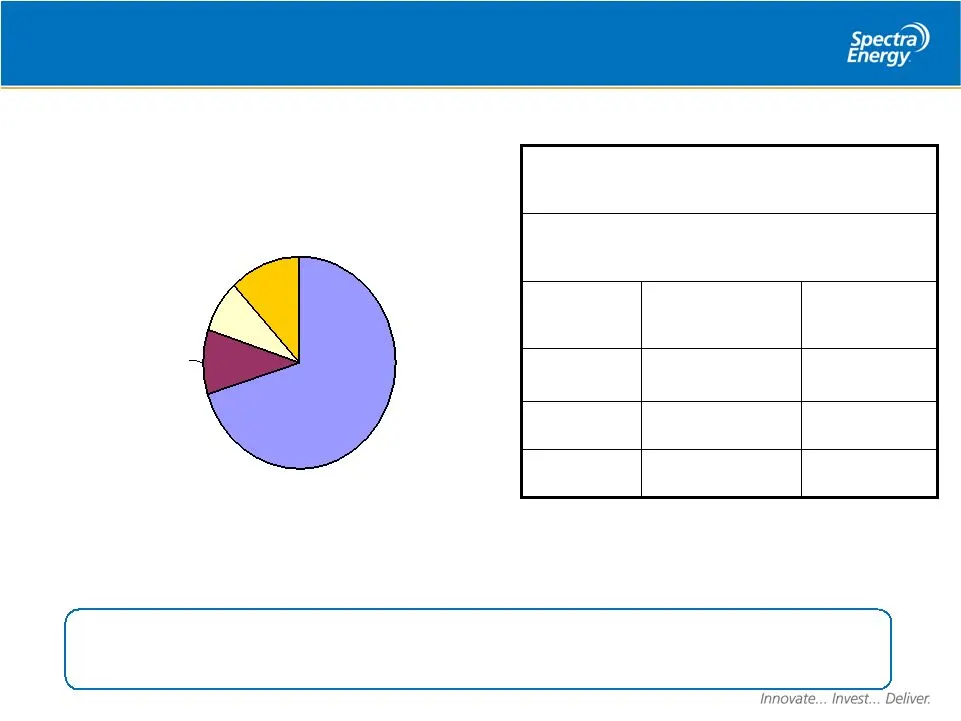
DCP Midstream 2008 Margin / Volume By Contract Forecast POP, 70% Other (2), 12% Fee Gas, 8% KW, 10% Contract Restructuring has increased Percent of Proceeds and reduced Keepwhole volumes Margin $ by Contract Type – 2008 Forecast (1) Total 2008 Margin - $2.7 Billion (1) Includes DCP Midstream Partner
Slide 35: DCP Midstream 2008 Business Plan Summary
DCP Midstream 2008 Business Plan Summary • Record Earnings and Dividends from Operations • EBIT of $1.5B (100%) • EBITDA of $1.9B (100%) • Equity earnings of $650MM to Spectra Energy • 2008 Focus Areas • Reliable and efficient service • Cost discipline • Volume growth and asset expansion • Partners
Slide 36: Investment Considerations
Investment Considerations Fred Fowler President and CEO Spectra Energy Corp
Slide 37: Key Investment Highlights
Key Investment Highlights Premier Natural Gas Infrastructure Company Attractive industry dynamics Positioned in fastest growing markets Diverse supply base Management depth and experience Strong investment grade balance sheet and stable cash flows Financial flexibility Solid, steady growth and attra
Slide 38: Spectra Energy. Innovate... Invest... Deliver.
Spectra )) Energy. Innovate... Invest... Deliver.
Slide 39: Spectra Energy. Innovate... Invest... Deliver.
Spectra )) Energy. Innovate... Invest... Deliver.
Slide 40: U.S. Transmission
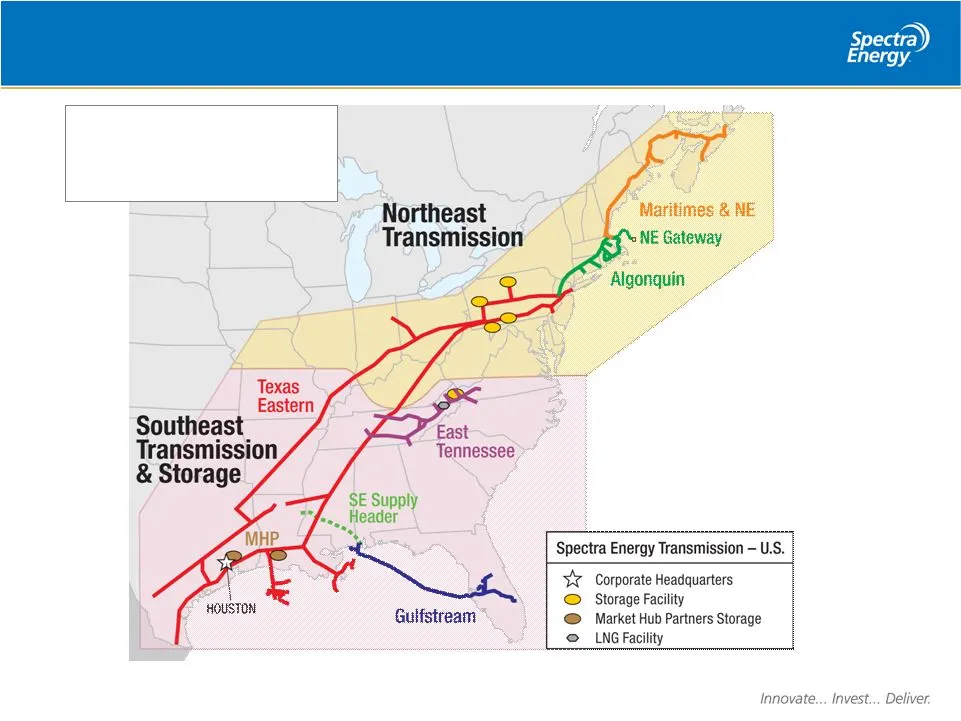
U.S. Transmission 2007 Natural Gas Throughput 2.2 Tcf Transmission Pipe 12,800 mi Total System Compression 1.9MM HP Total Storage Capacity ~ 115 Bcf
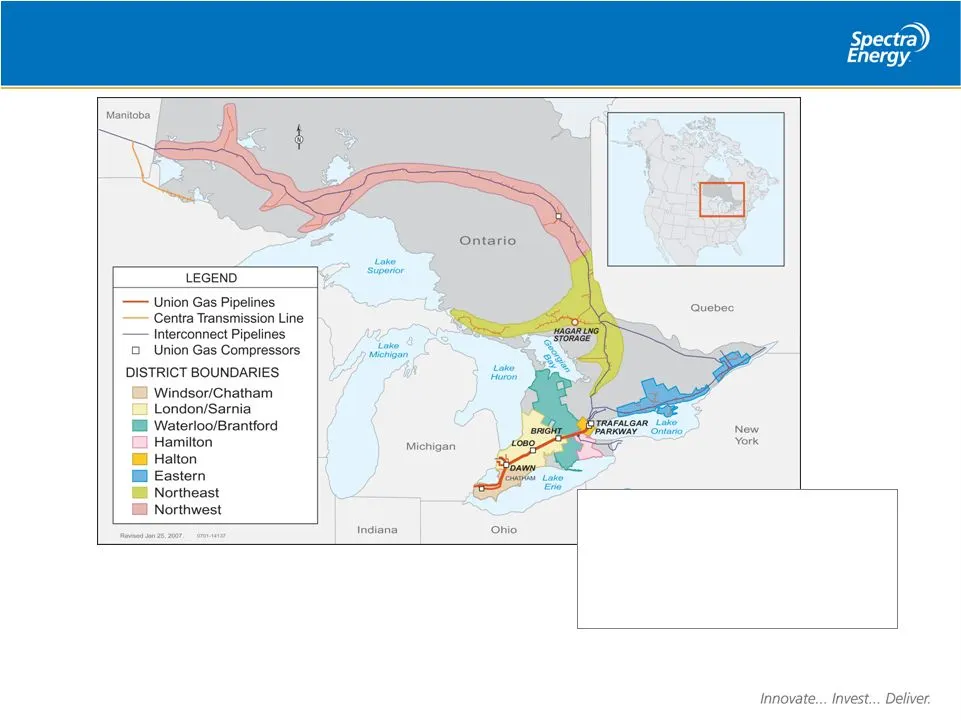
Slide 41: Distribution
Distribution Total Retail Customers 1.3 million Annual Net Increase in Customers 25,000 – 30,000 Distribution Pipeline 35,000 miles Storage Capacity 150 Bcf Transmission Capacity 5.0 Bcf/d Transmission Pipe 3,000 miles
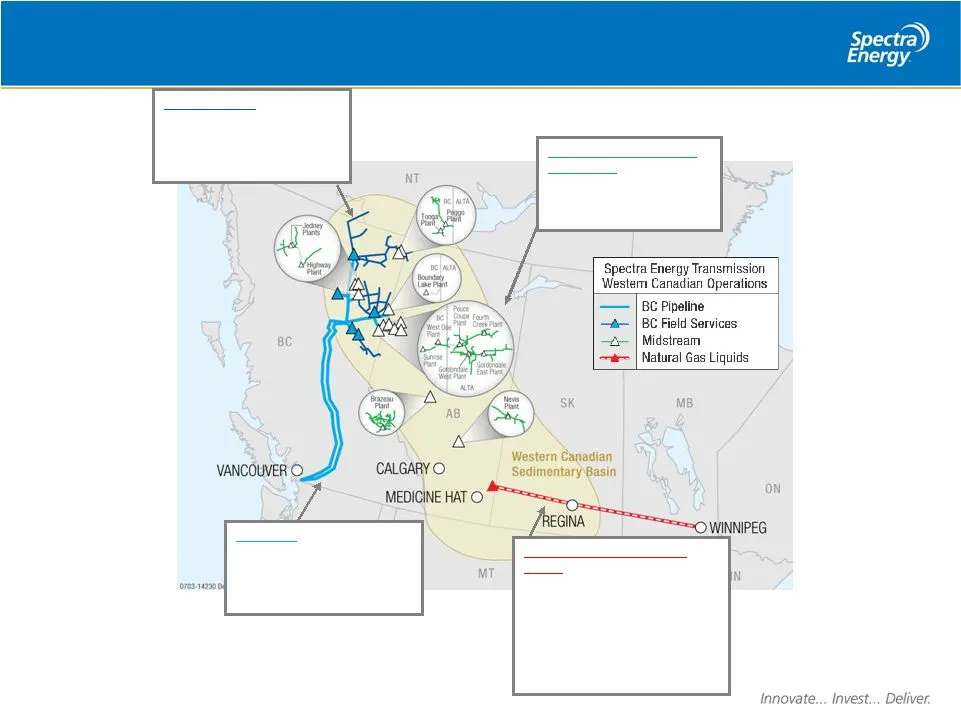
Slide 42: Western Canada Gas Transmission & Processing
Western Canada Gas Transmission & Processing BC Field Services Miles of Raw Gas Gathering: 1,600 Processing Capability: 2.1 Bcf/d Major Markets: BC, PNW, Alberta, US Midwest Midstream – Spectra Energy Income Fund Miles of Raw Gas Gathering: 1,000 Processing Capacity: 0.9 Bcf/d Natural Gas Liquids –
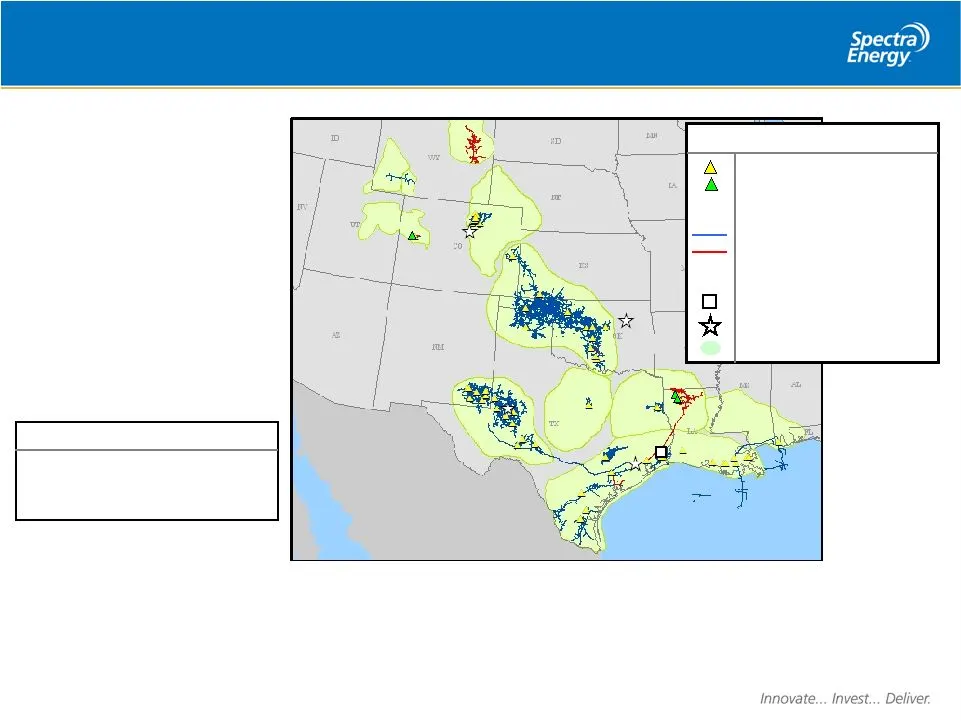
Slide 43: Field Services
Field Services DENVER TULSA MIDLAND HOUSTON (1) Includes DCP Midstream Partners Volumes 2007 Volumes Total Throughput 6.8 Bcf/d Gathered & Processed 5.5 Bcf/d Natural Gas Liquids 360 MBpd (1) DCP Midstream Stats DCP Midstream DCP Midstream Plant DCP Midstream Partners Plant 53 Plants, 10 Fractionato
Slide 44: Appendix 2: 2008 Supplemental Financial Data
Appendix 2: 2008 Supplemental Financial Data
Slide 45: 2008 Key Assumptions
2008 Key Assumptions • Commodity strips based on late October forward prices: • Crude Oil: $83 / Bbl (WTI) • NGL/Crude price relationship: 60% • Natural Gas: $8.00 / MMBtu (NYMEX) • Empress Frac Spread: ~ $7.25 / MMBtu • Canadian Dollar/US Dollar: Parity • 2008 Expensed Project Development costs of
Slide 46: Current Debt Maturity Profile
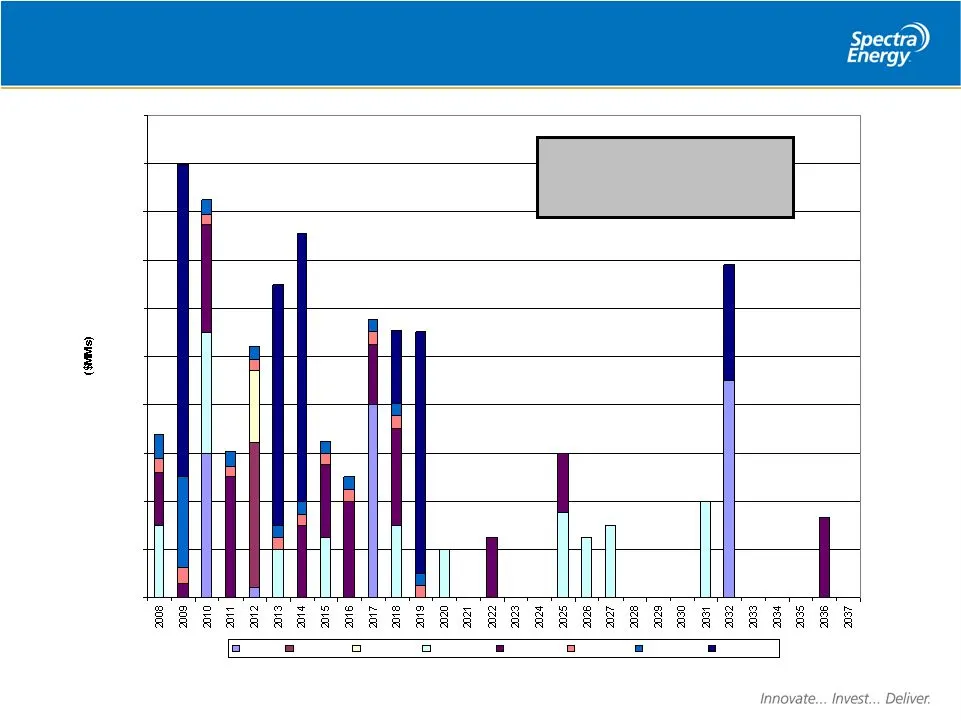
Current Debt Maturity Profile $0 $100 $200 $300 $400 $500 $600 $700 $800 $900 $1,000 TETLP Algonquin East Tenn Westcoast Union Gas M&N - US M&N - Can SE Capital As of 12/31/07 * Excludes bank debt at SEP Total maturities for any one year are less than 10% of outstanding debt
Slide 47: 2007 Crude Oil
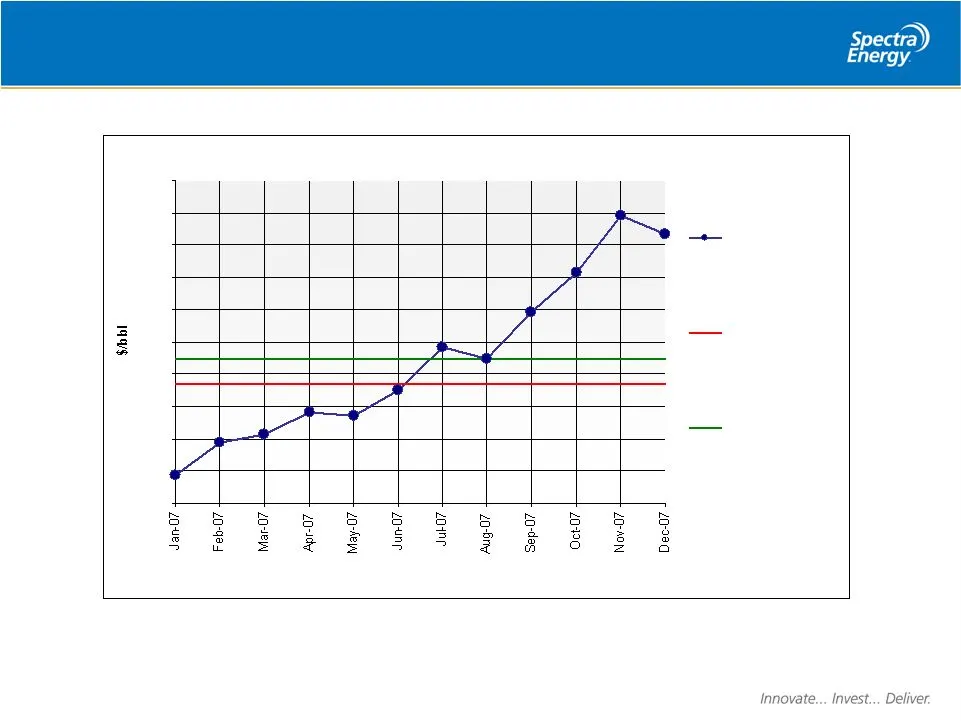
2007 Crude Oil $50 $55 $60 $65 $70 $75 $80 $85 $90 $95 $100 Settled Prices 2007 SE 2007 Annual Avg Forecast Assumption as of 9/15/06 ($68.5) 2007 Annual Avg of Settled Prices as of 12/31/07 ($72.3) Pricing information compiled from NYMEX WTI
Slide 48: 2007 Canadian Dollar
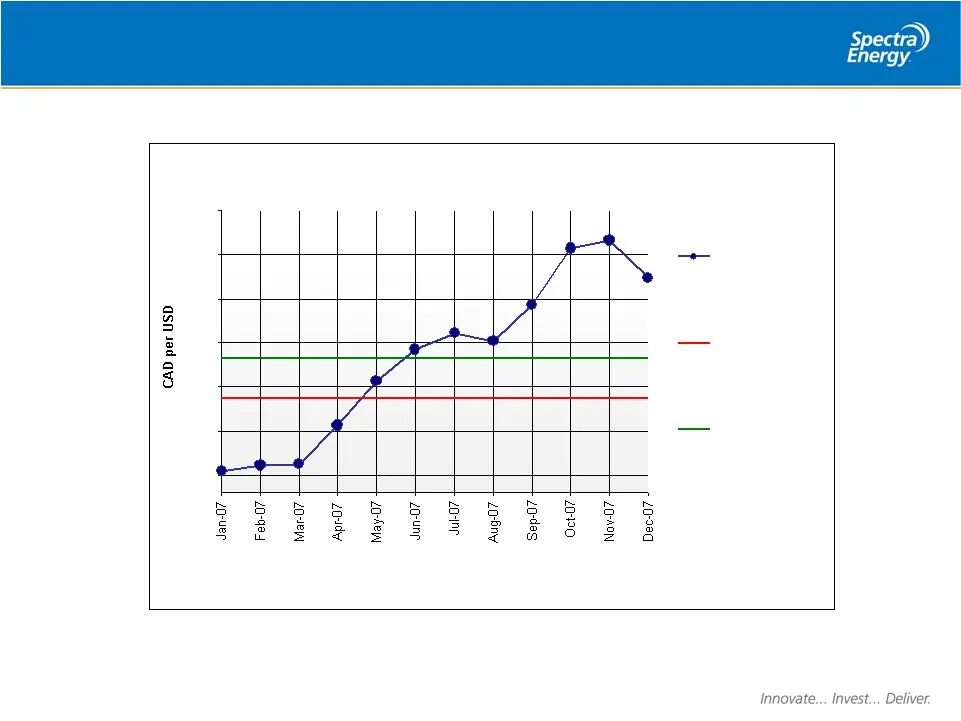
2007 Canadian Dollar 0.94 0.98 1.02 1.06 1.10 1.14 1.18 Settled Prices 2007 SE 2007 Annual Avg Forecast Assumption as of 9/15/06 (1.11) 2007 Annual Avg of Settled Prices as of 12/31/07 (1.07) Pricing information compiled from Bloomberg.
Slide 49: Spectra Energy. Innovate... Invest... Deliver.
Spectra )) Energy. Innovate... Invest... Deliver.
Slide 50: M&N Phase IV Expansion
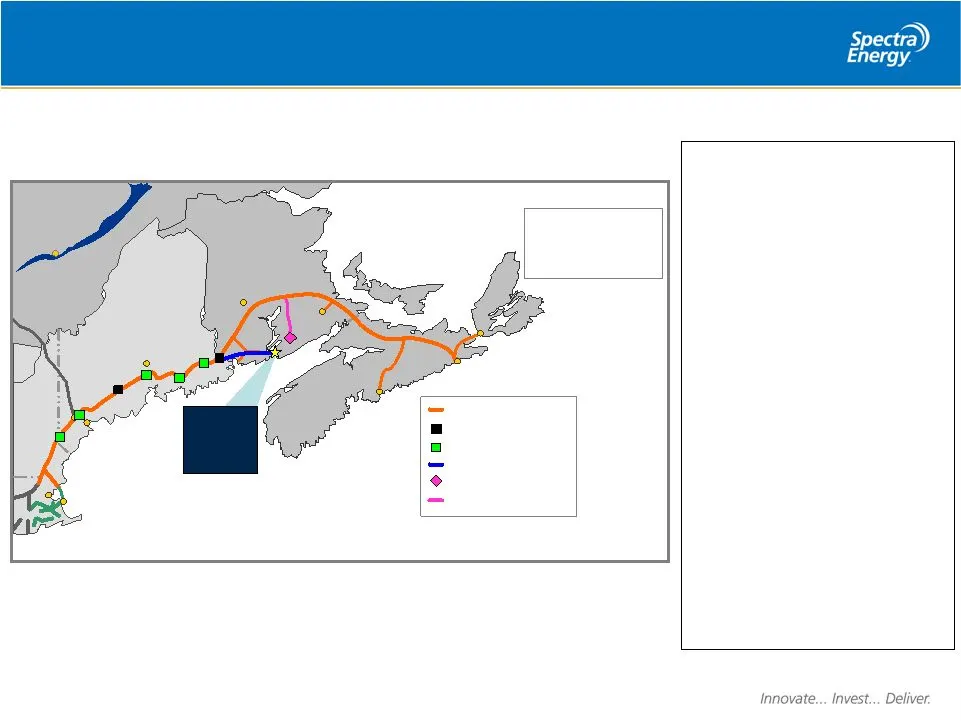
Well-Positioned for Growth M&N Phase IV Expansion Repsol- Irving Canaport ™ LNG Repsol- Irving Canaport ™ LNG Well-Positioned for Growth M&N Phase IV Expansion MNP Phase IV Expansion - 5 New Compressor Stations - 2 Station Upgrades - 2 Miles 30-inch Loop Maritimes & Northeast Pipeline Existing Compr
Slide 51: Ramapo
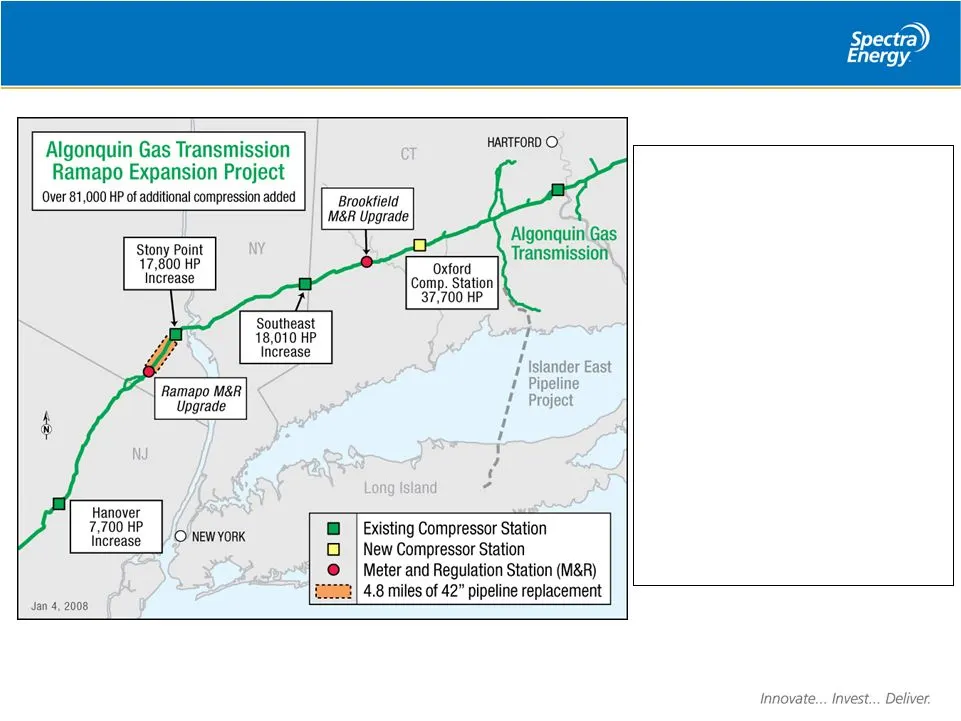
Well-Positioned for Growth Ramapo • Almost 5 miles of 42” pipeline replacement downstream of Ramapo, NY • New compressor station at Oxford, CT (37,700 HP) • HP upgrades/additions at Southeast, Stony Point, and Hanover compressor stations (43,510 HP) • New meter installations connecting Algonquin to
Slide 52: Major Dawn Storage Projects
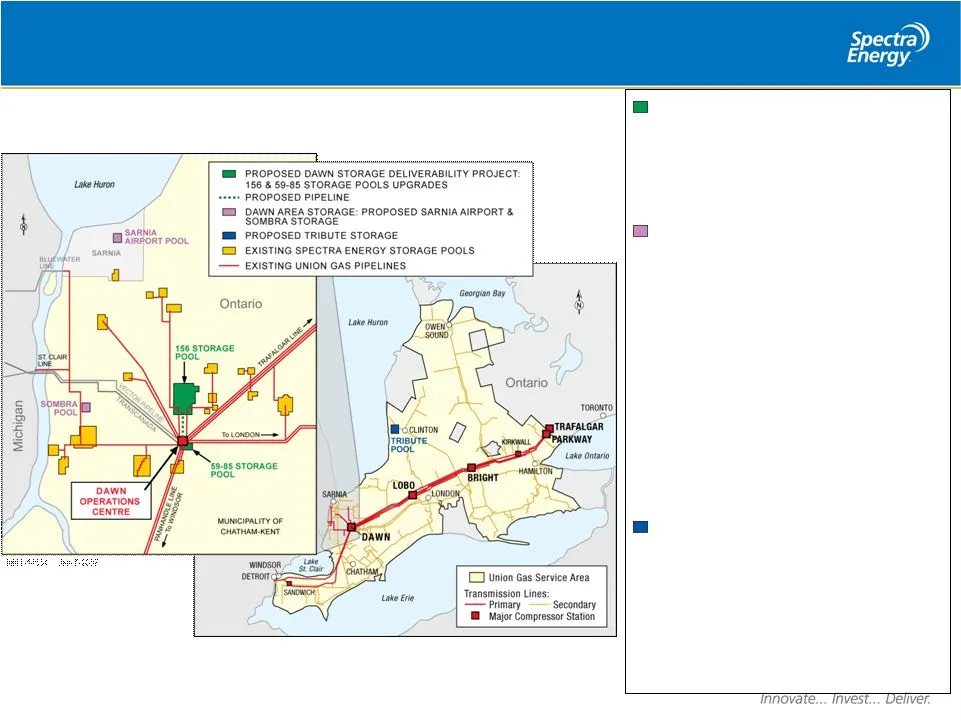
Well-Positioned for Growth Major Dawn Storage Projects Well-Positioned for Growth Major Dawn Storage Projects Dawn Storage Deliverability: • New compressor at Dawn Plant, 11 new wells, about 1 mile of pipeline • Est. capital expenditures: $110 million • In-service 2H08 Dawn Area Storage: • Sarnia Ai
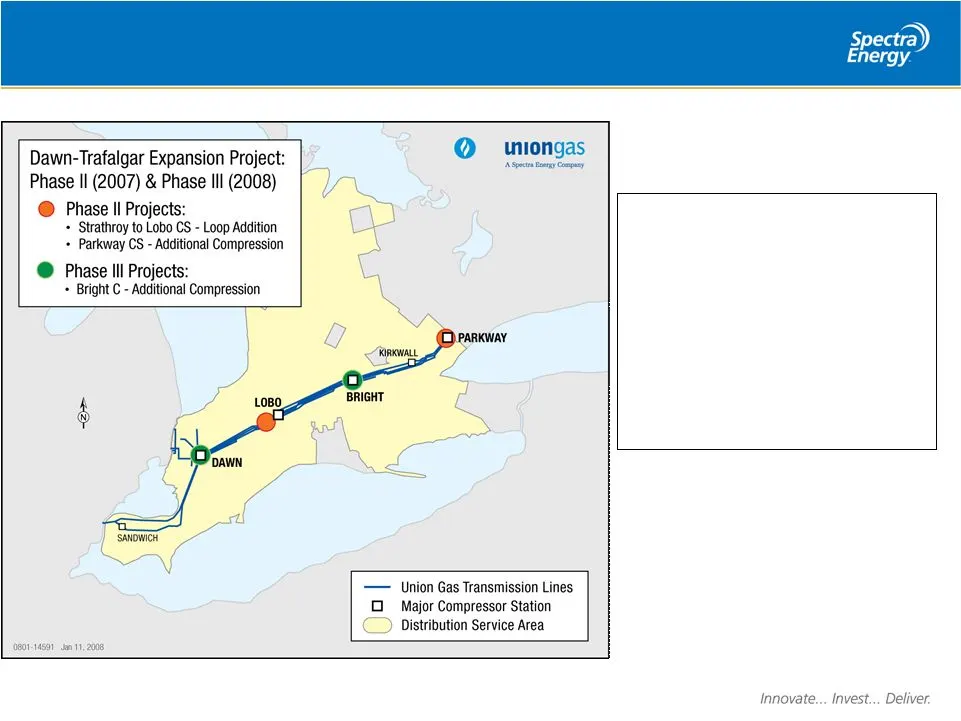
Slide 53: Dawn-Trafalgar Phase III
Well-Positioned for Growth Dawn-Trafalgar Phase III Well-Positioned for Growth Dawn-Trafalgar Phase III • All commercial contracts have been executed • All major materials on order for Phase III • In-service dates: Phase II – completed in 2H07; Phase III - 2H08 • Est. capital expenditures: Phase III
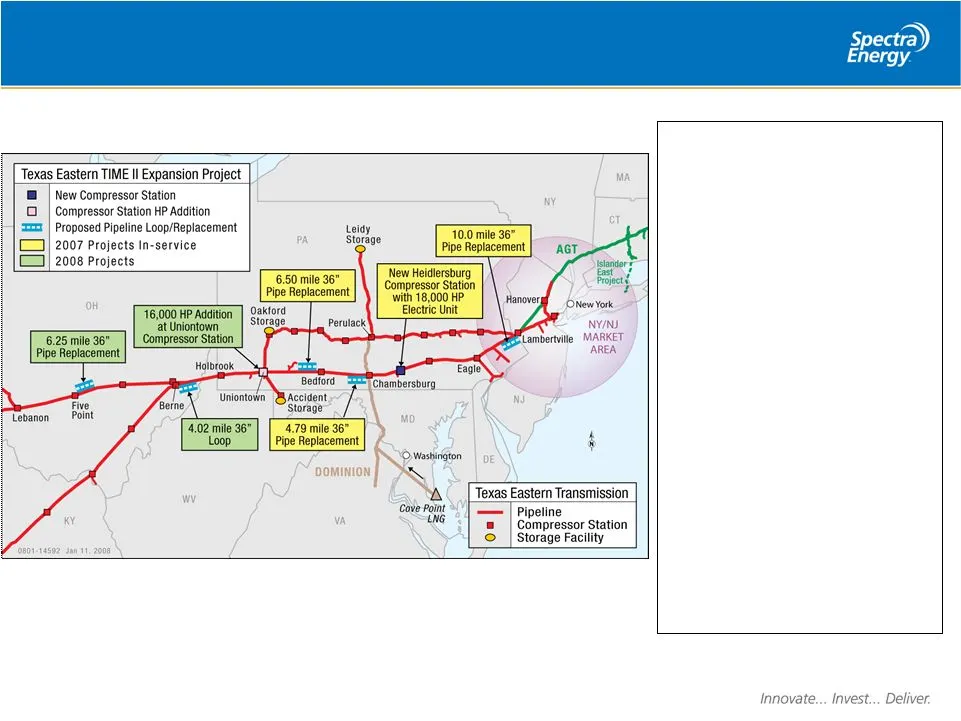
Slide 54: Time II
Well-Positioned for Growth Time II Well-Positioned for Growth Time II • Phase II of project to provide 150 Mmcf/d of new transportation service from Lebanon, OH to New Jersey commencing 2008. • Total project facilities include 4 miles of new pipeline looping, 28 miles of replacement pipeline install
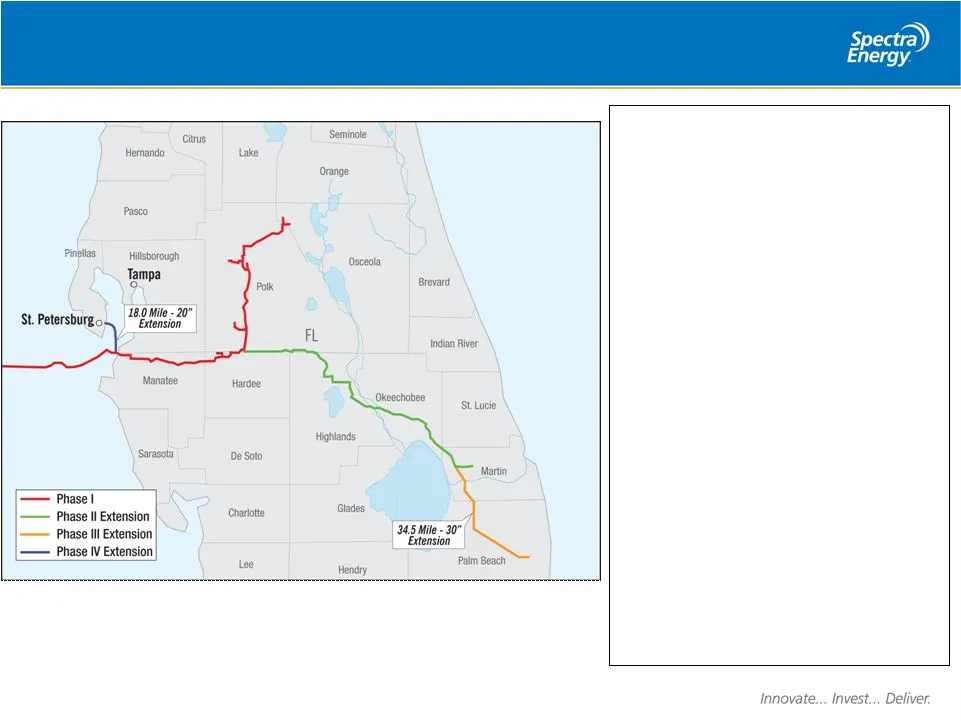
Slide 55: Gulfstream Phase III & IV
Well-Positioned for Growth Gulfstream Phase III & IV Well-Positioned for Growth Gulfstream Phase III & IV • Gulfstream Phase III: • 34.5 miles of 30” pipeline in Martin & Palm Beach counties, FL • 345 Mmcf/day firm capacity • Construction to begin 1Q, 2008 • Customer: Florida Power & Light • Est. ca
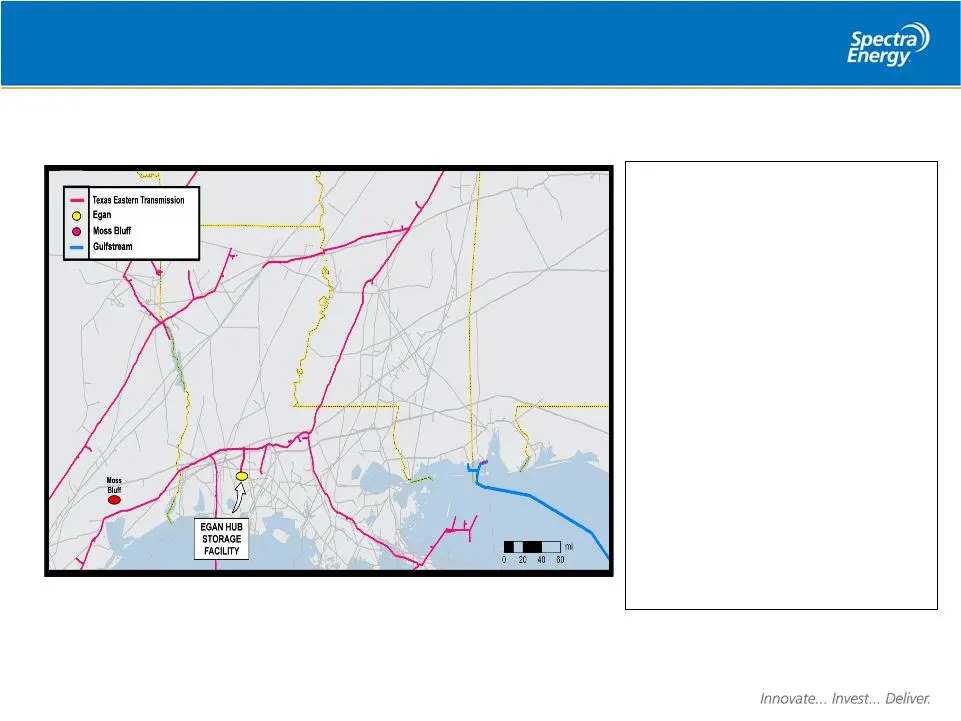
Slide 56: Egan Storage Expansion
Well-Positioned for Growth Egan Storage Expansion • Egan Hub is strategically located along the Gulf Coast and interconnects with 7 major pipelines including Texas Eastern • Cavern #4 Project: • Currently under construction • Total est. capital expenditures $60 million • Full 8 Bcf of capacity in-se
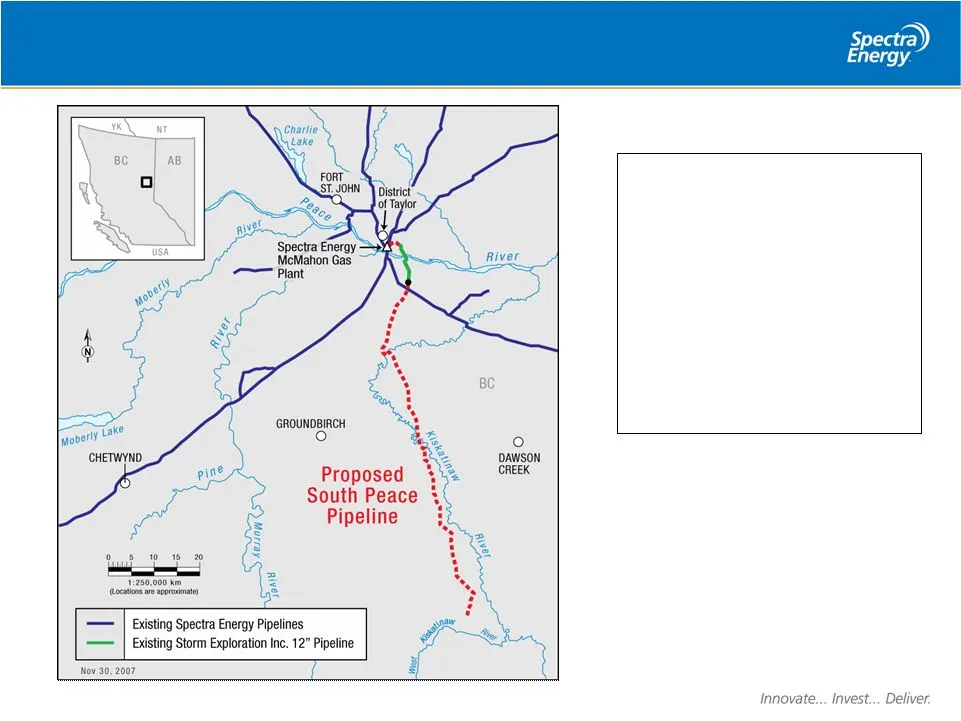
Slide 57: South Peace Pipeline
Well-Positioned for Growth South Peace Pipeline Well-Positioned for Growth South Peace Pipeline • Proposed pipeline in northeast B.C. to connect Fort St. John resource area to McMahon processing plant • Over 50 miles of 20” pipeline with approximately 220 Mmcf/day capacity • Est. capital expenditure
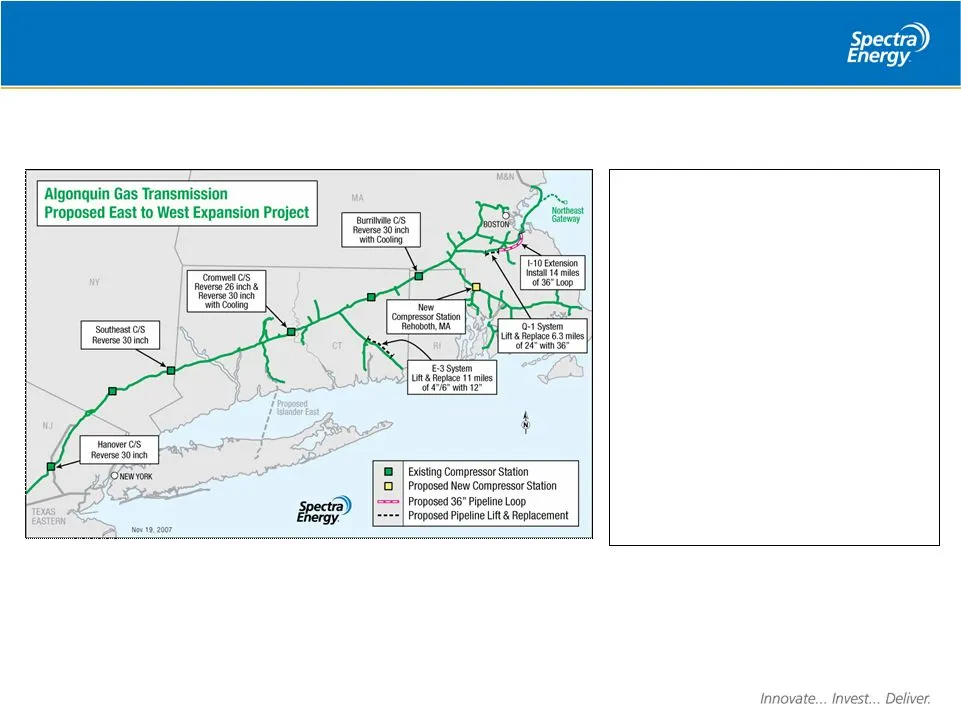
Slide 58: AGT East to West
Well-Positioned for Growth AGT East to West Well-Positioned for Growth AGT East to West • .75 Bcf/day capacity expansion on AGT to facilitate east to west flows of new LNG supplies into NE market • 14 miles of pipeline looping, 17 miles of replacement pipeline, 1 new compressor station, reverse flow
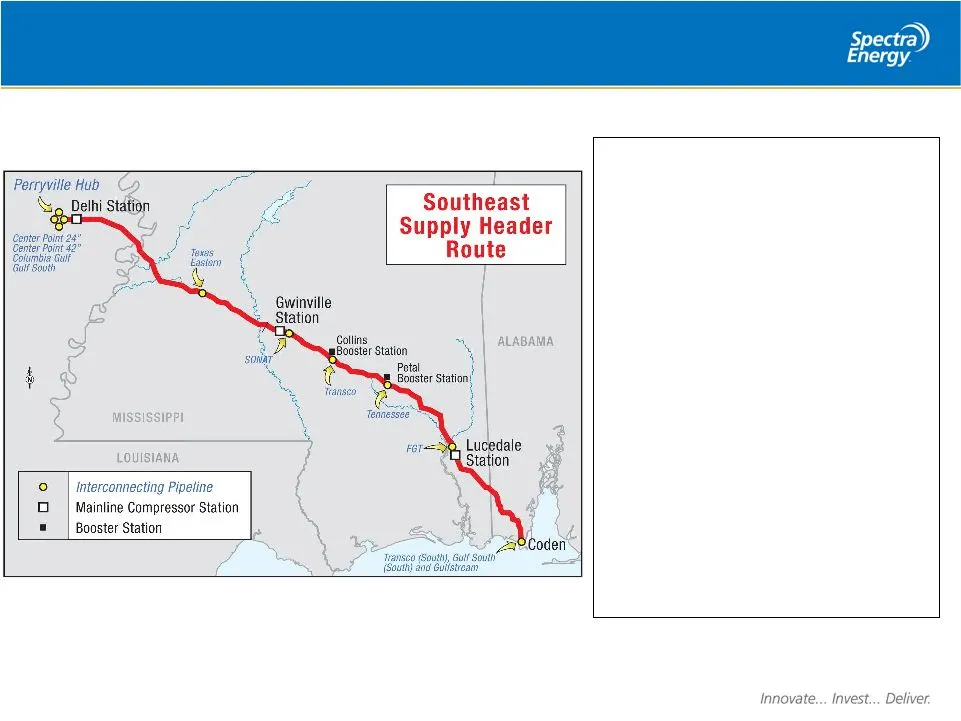
Slide 59: Southeast Supply Header
Well-Positioned for Growth Southeast Supply Header Well-Positioned for Growth Southeast Supply Header • 270 miles of pipe from Perryville Hub in NE La. to Mobile, Al. • 1.0 Bcf/d capacity • 50/50 partnership with CenterPoint Energy • Provides access to growing onshore shale gas basins as an alternat
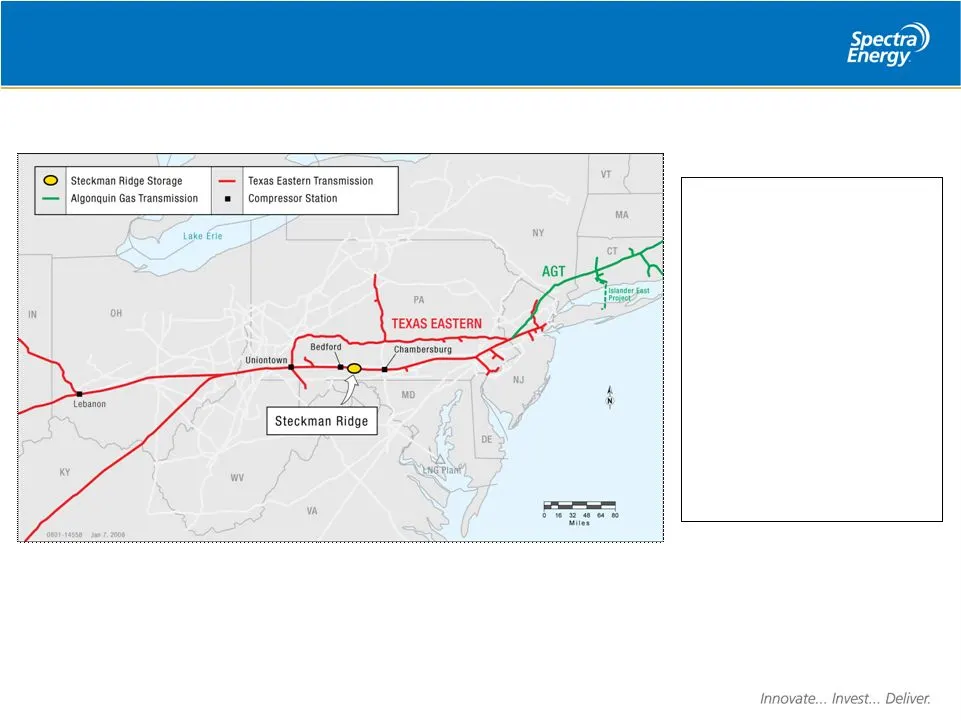
Slide 60: Steckman Ridge Storage
Well-Positioned for Growth Steckman Ridge Storage Well-Positioned for Growth Steckman Ridge Storage • Strategically located storage capacity along Texas Eastern system in Bedford County, PA • Proposed 12 Bcf of storage, 1 compressor station, 7 miles of 16” pipe and 4 miles of lateral pipe • 50/50 pa
Slide 61: Changes between EOY 2007 and 2008 forecast
Significant Growth Projects Changes between EOY 2007 and 2008 forecast Cost Increase Dawn Storage Deliverability Changed Scope AGT East to West -- -- New Development Project M&NE Phase V Refine Scope Gulfstream Phase IV Cost Increase Southeast Supply Header In-Service Complete Moss Bluff Storage In-
Slide 62: Changes between EOY 2007 and 2008 forecast
Significant Growth Projects Changes between EOY 2007 and 2008 forecast -- -- New Development Project Bronco Pipeline/West -- -- Move In-Svc Date to Post-2010 Moss Bluff Storage Expansion -- -- Move In-Svc Date to Post-2010 Lebanon Connector -- -- Move In-Svc Date to Post-2010 Copiah Storage -- -- Ne
Slide 63: Non-GAAP Reconciliation for SEC Regulation G
Spectra Energy Corp Non-GAAP Reconciliation for SEC Regulation G 2008 Outlook and Financial Plan January 17, 2008 Employee Incentive Targets The materials for Spectra Energy’s 2008 Outlook and Financial Plan January 17, 2008 presentation include a discussion of the 2007 and 2008 ongoing fully dilute
Source: SEC EDGAR · 8-K filed Jan 22, 2008
More decks from Spectra Energy Corp
 Q3 2016 Earnings Presentation23 slides · Nov 3, 2016
 RBC Capital Markets' 2016 Corporate Infrastructure & Pipeline Debt Conference15 slides · Sep 21, 2016
 Merger or Acquisition (September 2016)12 slides · Sep 6, 2016
 Merger or Acquisition (September 2016)32 slides · Sep 6, 2016
 IPO Roadshow (December 2006)35 slides · December 2006