Seche Environnement SA · EURONEXT:SCHP
Seche Environnement SA — Q1 2018 Earnings Presentation
11 slides from Seche Environnement SA's earnings presentation, Apr 24, 2018

Slide 1: Revenue at March 31, 2018
Revenue at March 31, 2018 Conference call April 24, 2017
Slide 2: Highlights of the period
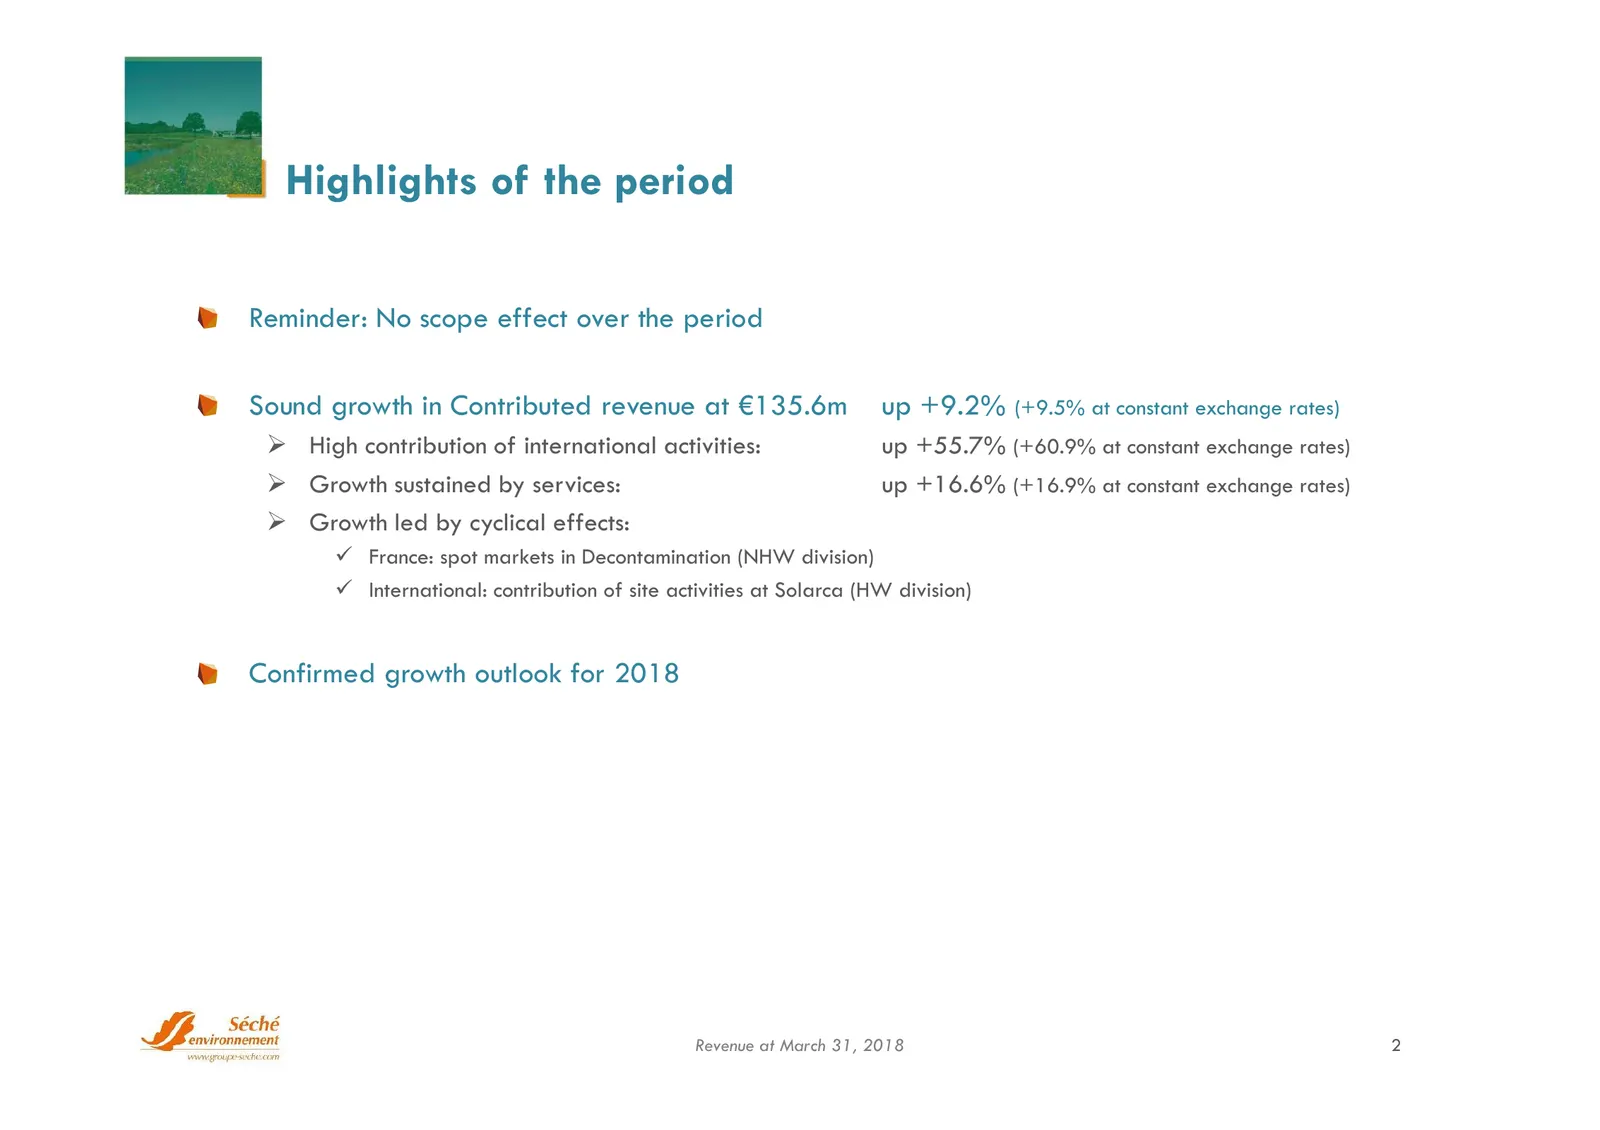
Highlights of the period Reminder: No scope effect over the period Sound growth in Contributed revenue at €135.6m up +9.2% (+9.5% at constant exchange rates) High contribution of international activities: up +55.7% (+60.9% at constant exchange rates) Growth sustained by services: up +16.6% (+16.
Slide 3: Contributed revenue up +9.2%
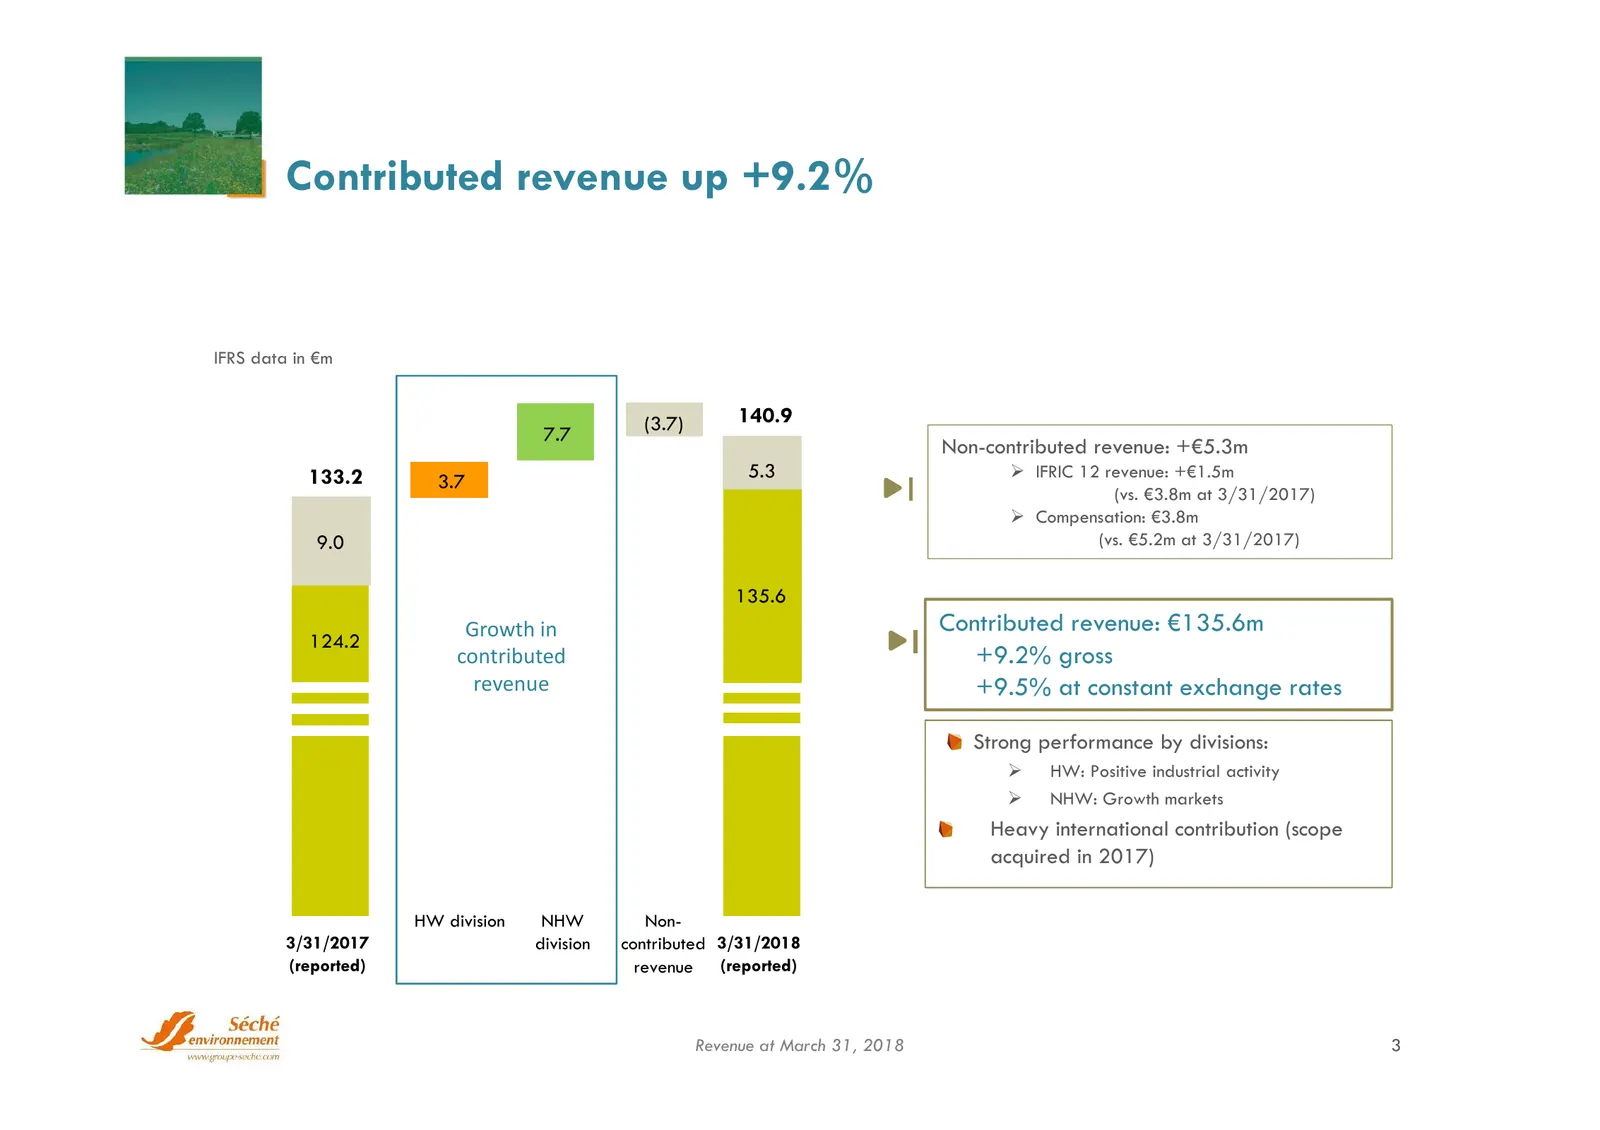
Contributed revenue up +9.2% IFRS data in €m (3.7) 140.9 7.7 Non-contributed revenue: +€5.3m 133.2 3.7 5.3 IFRIC 12 revenue: +€1.5m (vs. €3.8m at 3/31/2017) Compensation: €3.8m 9.0 (vs. €5.2m at 3/31/2017) 135.6 Growth in Contributed revenue: €135.6m 124.2 contributed +9.2% gross revenue +9.5% a
Slide 4: Good start to the year
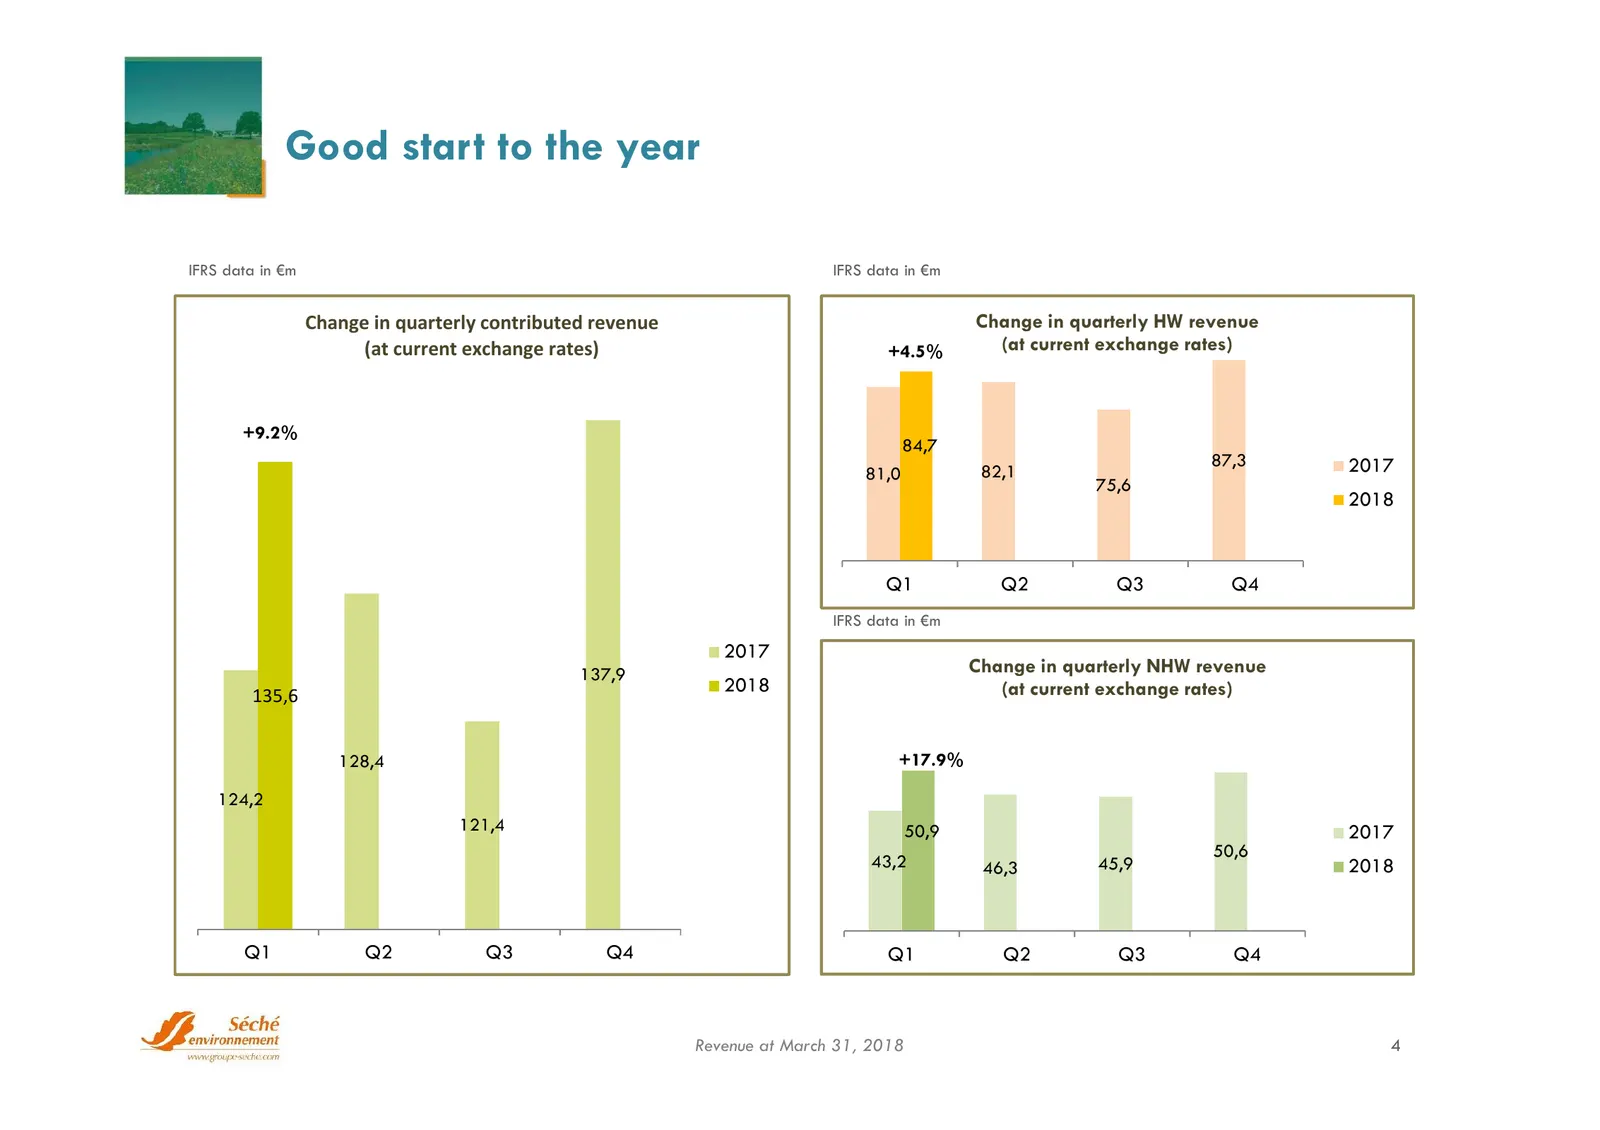
Good start to the year IFRS data in €m IFRS data in €m Change in quarterly contributed revenue Change in quarterly HW revenue (at current exchange rates) +4.5% (at current exchange rates) +9.2% 84,7 87,3 2017 81,0 82,1 75,6 2018 Q1 Q2 Q3 Q4 IFRS data in €m 2017 137,9 Change in quarterly NHW revenue
Slide 5: Dynamic international activity
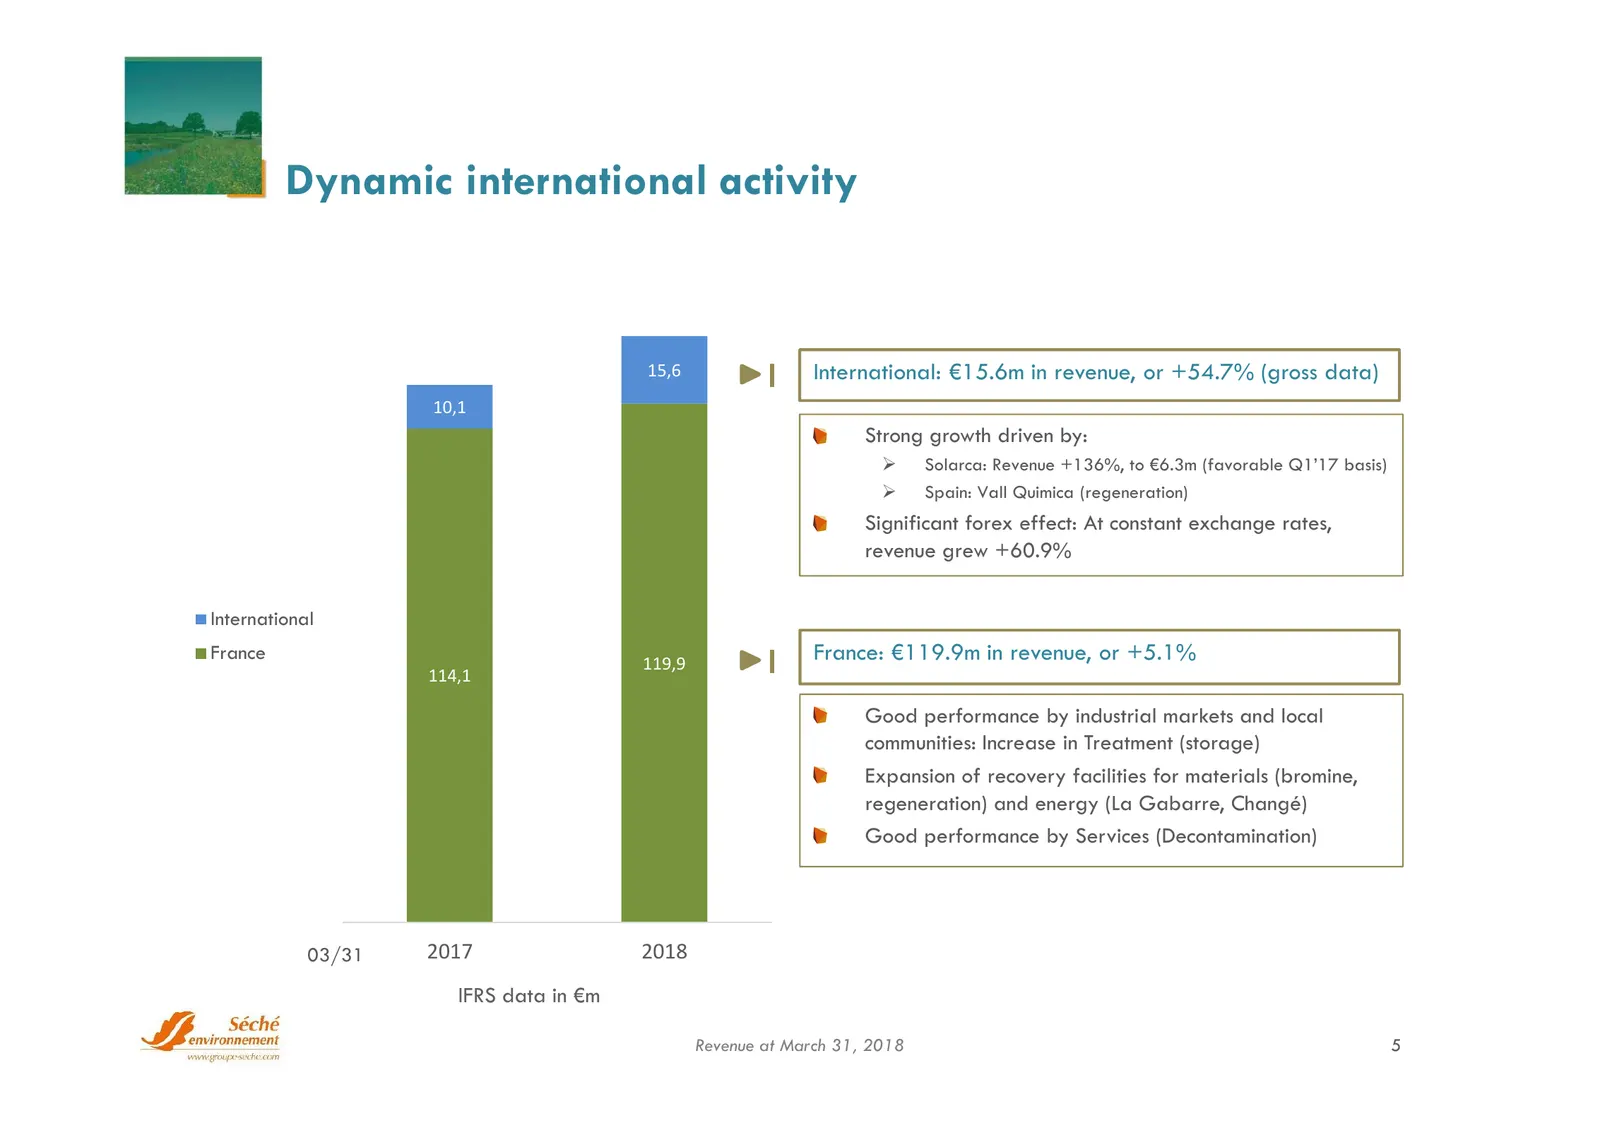
Dynamic international activity 15,6 International: €15.6m in revenue, or +54.7% (gross data) 10,1 Strong growth driven by: Solarca: Revenue +136%, to €6.3m (favorable Q1’17 basis) Spain: Vall Quimica (regeneration) Significant forex effect: At constant exchange rates, revenue grew +60.9% Interna
Slide 6: International revenue at 12% of contributed revenue (vs. 9% at 3/31/2017)
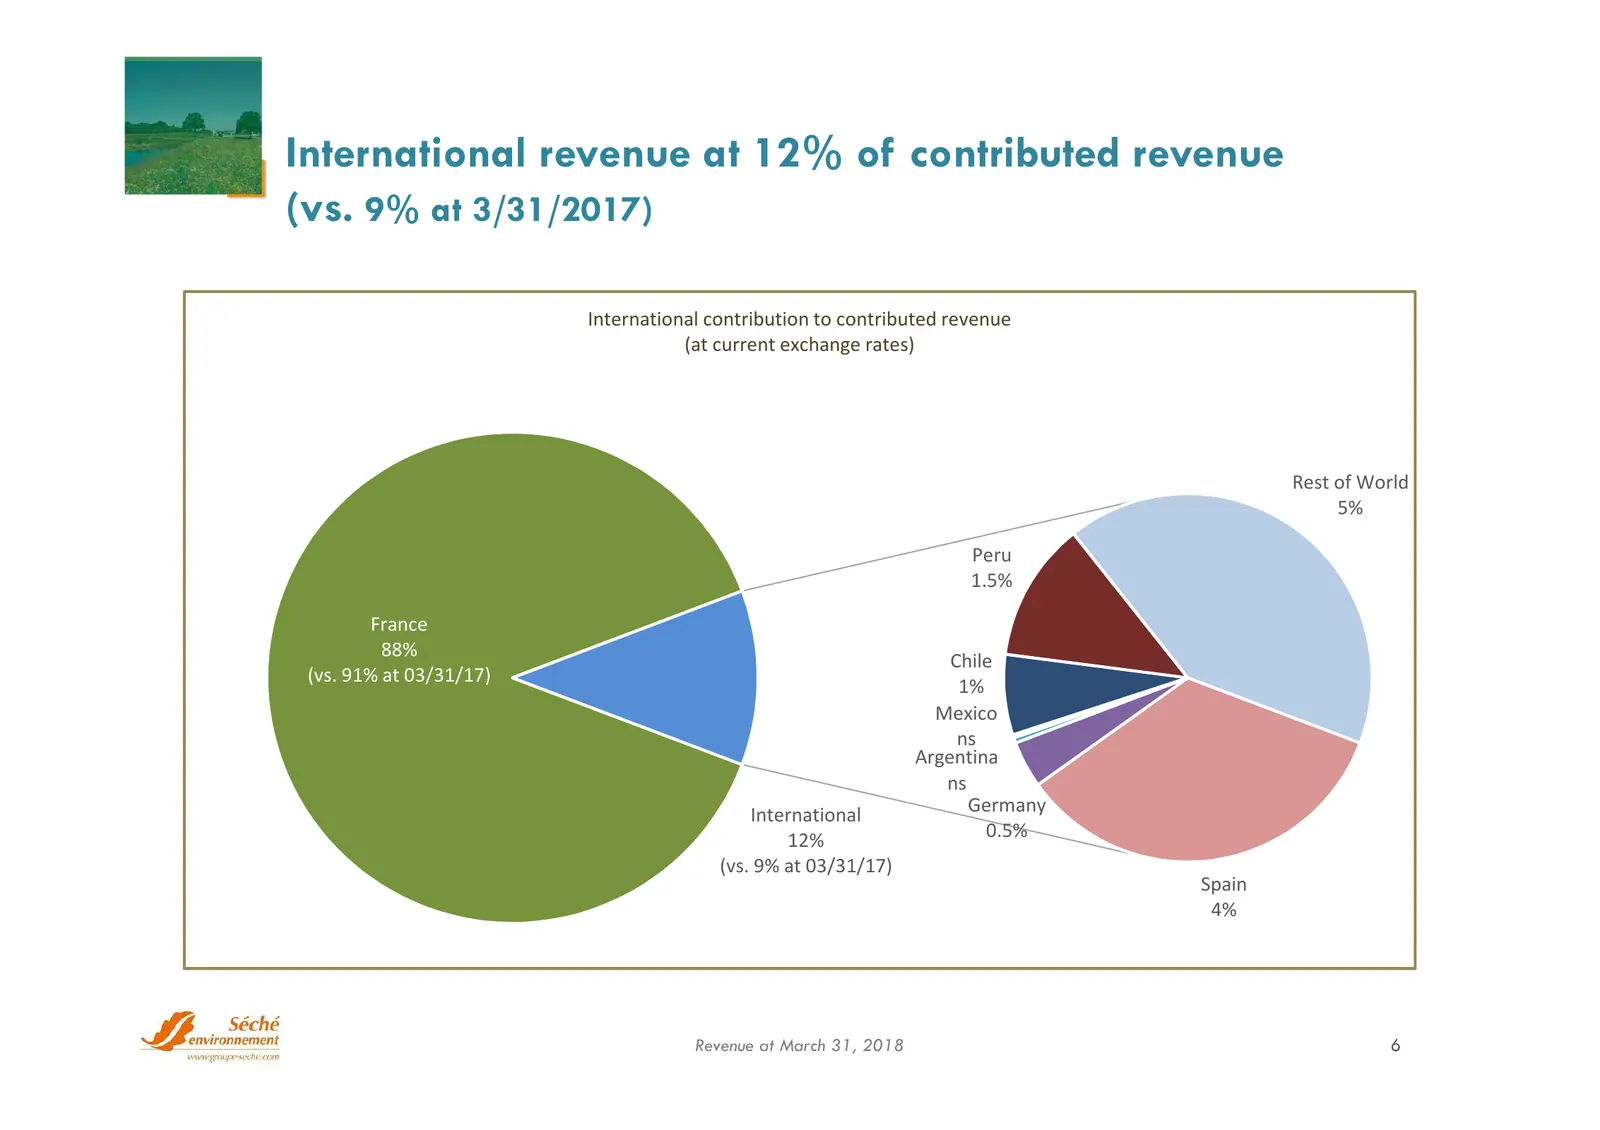
International revenue at 12% of contributed revenue (vs. 9% at 3/31/2017) International contribution to contributed revenue (at current exchange rates) Rest of World 5% Peru 1.5% France 88% Chile (vs. 91% at 03/31/17) 1% Mexico ns Argentina ns International Germany 12% 0.5% (vs. 9% at 03/31/17) Spai
Slide 7: Change in contributed revenue by division
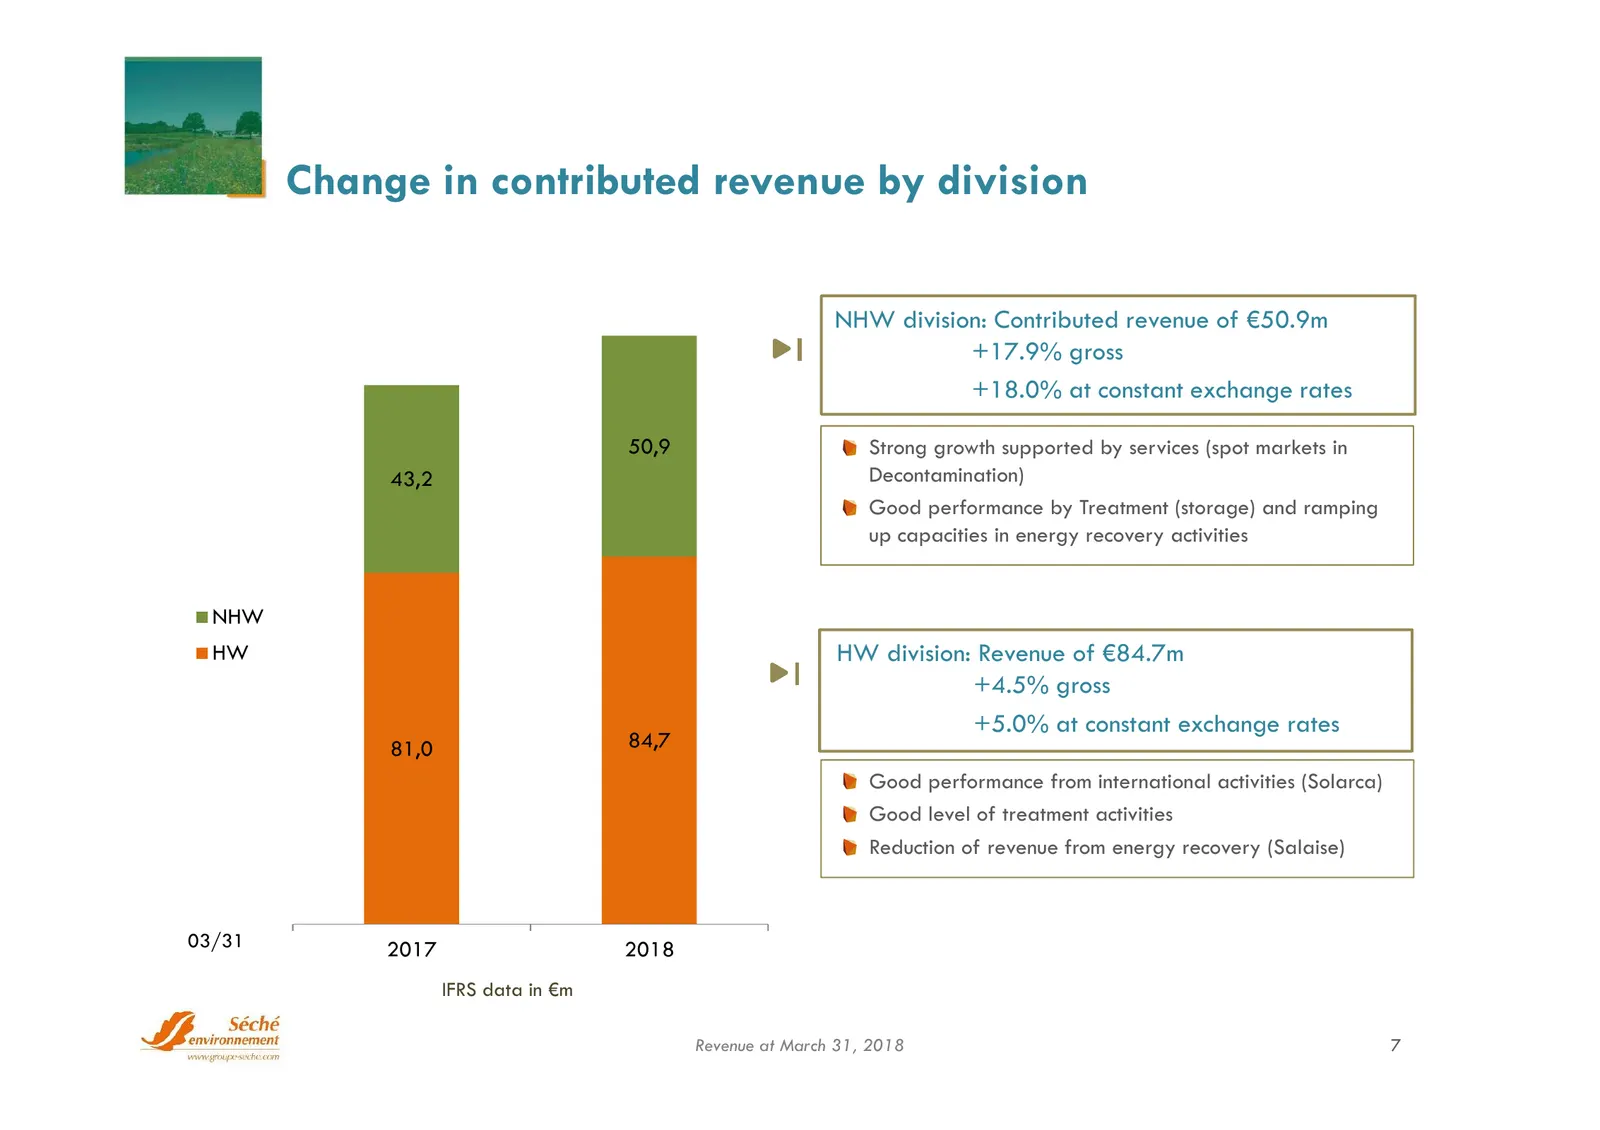
Change in contributed revenue by division NHW division: Contributed revenue of €50.9m +17.9% gross +18.0% at constant exchange rates 50,9 Strong growth supported by services (spot markets in 43,2 Decontamination) Good performance by Treatment (storage) and ramping up capacities in energy recovery ac
Slide 8: Most activities are contributing to growth
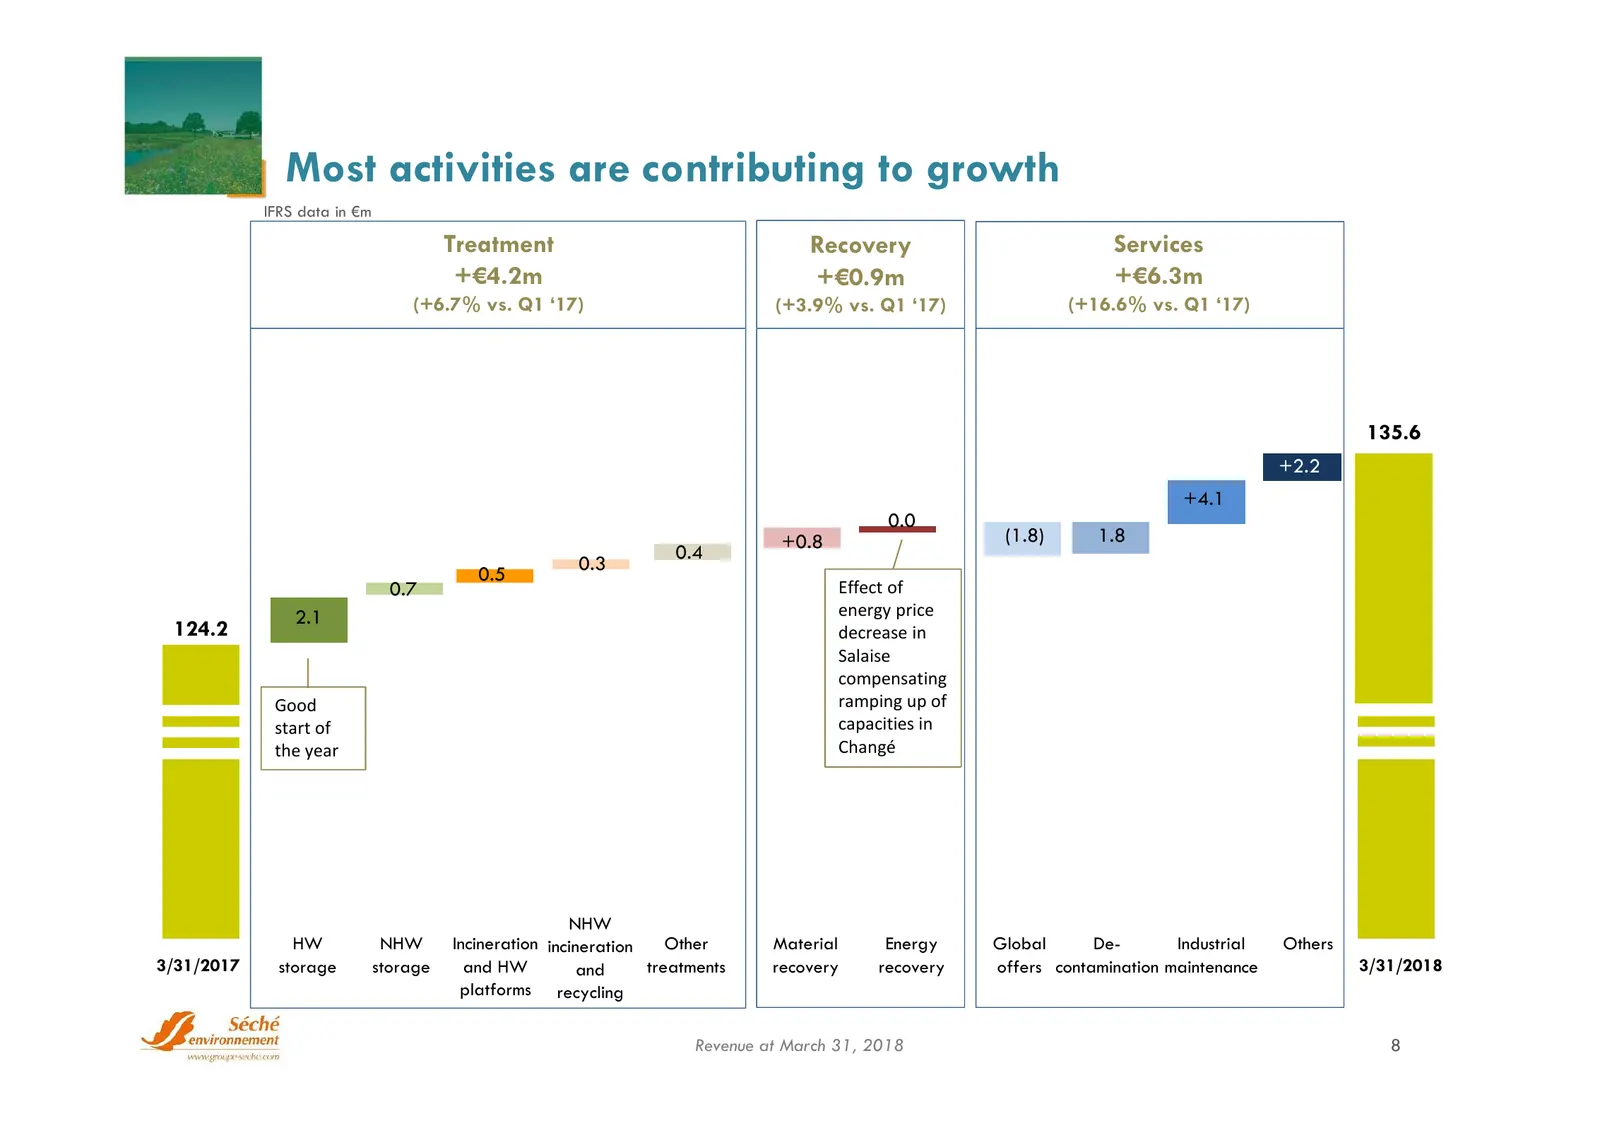
Most activities are contributing to growth IFRS data in €m Treatment Recovery Services +€4.2m +€0.9m +€6.3m (+6.7% vs. Q1 ‘17) (+3.9% vs. Q1 ‘17) (+16.6% vs. Q1 ‘17) +2.2 135.6 +2.2 +4.1 0.0 +0.8 (1.8) 1.8 0.4 0.3 0.5 0.7 Effect of 2.1 energy price 124.2 decrease in Salaise compensating Good ramping
Slide 9: Strong growth in Services
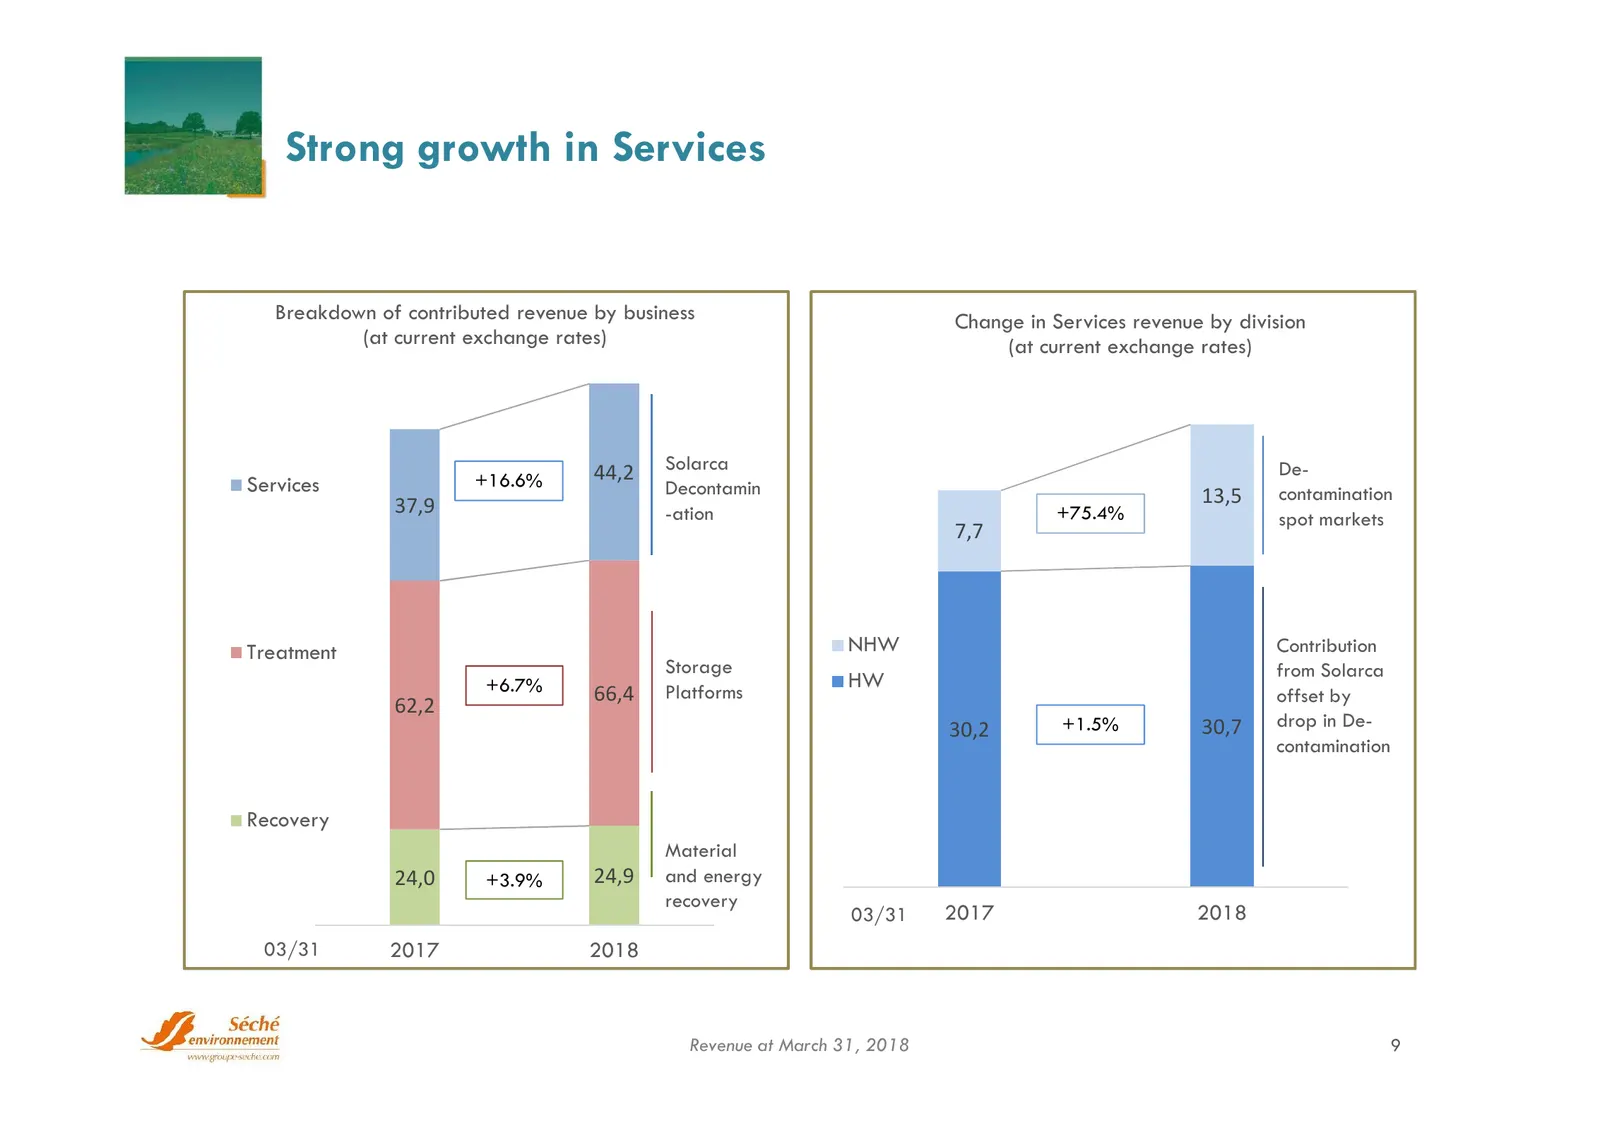
Strong growth in Services Breakdown of contributed revenue by business Change in Services revenue by division (at current exchange rates) (at current exchange rates) 44,2 Solarca De- Services +16.6% Decontamin 13,5 contamination 37,9 -ation +75.4% spot markets 7,7 Treatment NHW Contribution Storage
Slide 10: Business outlook confirmed
Business outlook confirmed France: Good market performance Treatment: Solidity of industrial and government contracts Recovery: Continued expansion of materials and energy recovery facilities Services: spot markets (Decontamination) International: Continued growth Historical scope: Strong re
Slide 11: Q&A
Q&A Manuel Andersen Head of Investor Relations m.andersen@groupe-seche.com NOTE: THIS DOCUMENT MAY CONTAIN INFORMATION OF A PROVISIONAL NATURE. THIS INFORMATION REPRESENTS EITHER TRENDS OR TARGETS AT THE DATE OF THIS DOCUMENT'S CREATION AND MAY NOT BE CONSIDERED AS RESULTS FORECASTS OR AS ANY OTHER
Source: Internet Archive copy of groupe-seche.com
More decks from Seche Environnement SA
 Groupe Séché Environnement — Q3 2026 Earnings Presentation13 slides · Oct 27, 2026
 H1 2026 Earnings Presentation34 slides · Sep 9, 2026
 H1 2026 Earnings Presentation34 slides · Sep 9, 2026
 Q1 2026 Earnings Presentation10 slides · Apr 23, 2026
 FY2025 Earnings Presentation43 slides · Mar 10, 2026
 Q3 2025 Earnings Presentation13 slides · Oct 28, 2025